


Bahasa
Halaman
Hukum


HAL Id: tel-01661604https://tel.archives-ouvertes.fr/tel-01661604
Submitted on 12 Dec 2017
HAL is a multi-disciplinary open accessarchive for the deposit and dissemination of sci-entific research documents, whether they are pub-lished or not. The documents may come fromteaching and research institutions in France orabroad, or from public or private research centers.
L’archive ouverte pluridisciplinaire HAL, estdestinée au dépôt et à la diffusion de documentsscientifiques de niveau recherche, publiés ou non,émanant des établissements d’enseignement et derecherche français ou étrangers, des laboratoirespublics ou privés.
Experiments with Ultracold Fermi Gases : quantumDegeneracy of Potassium-40 and All-solid-state Laser
Sources for LithiumNorman Kretzschmar
To cite this version:Norman Kretzschmar. Experiments with Ultracold Fermi Gases : quantum Degeneracy of Potassium-40 and All-solid-state Laser Sources for Lithium. Physics [physics]. Ecole normale supérieure - ENSPARIS, 2015. English. NNT : 2015ENSU0012. tel-01661604

Departement de physique Laboratoire Kastler Brossel
Ecole Normale Superieure
THÉSE de DOCTORAT de l’ÉCOLE NORMALE SUPÉRIEURE
Specialite : Physique Quantique
presentee par
Norman KRETZSCHMAR
pour obtenir le grade de Docteur de l’Ecole Normale Superieure
Experiments with Ultracold Fermi Gases: Quantum Degeneracyof Potassium-40 and All-solid-state Laser Sources for Lithium
Soutenue le 26 Juin 2015
devant le jury compose de :
Robin Kaiser . . . . . . . . . . . . . . . . . . . . . . . . . Rapporteur
Kai Bongs . . . . . . . . . . . . . . . . . . . . . . . . . . . . Rapporteur
Denis Boiron . . . . . . . . . . . . . . . . . . . . . . . . . Examinateur
Jerome Tignon . . . . . . . . . . . . . . . . . . . . . . . Examinateur
Christophe Salomon . . . . . . . . . . . . . . . . . Directeur de these
Frederic Chevy . . . . . . . . . . . . . . . . . . . . . . . Membre invite


A mon epouse, Nadja.


Contents
1. Introduction 1
1.1. Ultracold quantum gases . . . . . . . . . . . . . . . . . . . . . . . . . . . . . . 1
1.2. Quantum degenerate Fermi gases . . . . . . . . . . . . . . . . . . . . . . . . . 3
1.3. Fermi-Fermi mixtures . . . . . . . . . . . . . . . . . . . . . . . . . . . . . . . 4
1.4. Thesis outline . . . . . . . . . . . . . . . . . . . . . . . . . . . . . . . . . . . . 5
I. 6Li-40K Experiment 9
2. Experimental setup 11
2.1. General design approach . . . . . . . . . . . . . . . . . . . . . . . . . . . . . . 11
2.2. Vacuum chamber . . . . . . . . . . . . . . . . . . . . . . . . . . . . . . . . . . 12
2.3. Laser systems . . . . . . . . . . . . . . . . . . . . . . . . . . . . . . . . . . . . 13
2.3.1. D2 laser system . . . . . . . . . . . . . . . . . . . . . . . . . . . . . . . 15
2.3.2. D1 laser system . . . . . . . . . . . . . . . . . . . . . . . . . . . . . . . 16
2.4. 6Li Zeeman slower . . . . . . . . . . . . . . . . . . . . . . . . . . . . . . . . . 18
2.5. 40K 2D-MOT . . . . . . . . . . . . . . . . . . . . . . . . . . . . . . . . . . . . 19
2.5.1. Principle of a 2D-MOT . . . . . . . . . . . . . . . . . . . . . . . . . . 19
2.5.2. Experimental setup . . . . . . . . . . . . . . . . . . . . . . . . . . . . 20
2.5.3. Characterization of the 2D-MOT upgrade . . . . . . . . . . . . . . . . 21
2.6. 6Li-40K dual-species MOT . . . . . . . . . . . . . . . . . . . . . . . . . . . . . 24
2.6.1. Experimental setup . . . . . . . . . . . . . . . . . . . . . . . . . . . . 24
2.7. CMOT and gray molasses cooling . . . . . . . . . . . . . . . . . . . . . . . . . 26
2.7.1. Compressed MOT . . . . . . . . . . . . . . . . . . . . . . . . . . . . . 26
2.7.2. Implementation of the D1 molasses . . . . . . . . . . . . . . . . . . . . 26
2.8. Magnetic trapping . . . . . . . . . . . . . . . . . . . . . . . . . . . . . . . . . 27
2.9. Magnetic transport . . . . . . . . . . . . . . . . . . . . . . . . . . . . . . . . . 28
2.10. Optically plugged magnetic quadrupole trap . . . . . . . . . . . . . . . . . . . 28
2.10.1. Coils . . . . . . . . . . . . . . . . . . . . . . . . . . . . . . . . . . . . . 28
2.10.2. Optical plug . . . . . . . . . . . . . . . . . . . . . . . . . . . . . . . . 29
2.11. RF evaporative cooling . . . . . . . . . . . . . . . . . . . . . . . . . . . . . . . 30
2.12. RF system . . . . . . . . . . . . . . . . . . . . . . . . . . . . . . . . . . . . . . 30
i

Contents
2.13. Optical dipole trap . . . . . . . . . . . . . . . . . . . . . . . . . . . . . . . . . 31
2.13.1. Power stabilization . . . . . . . . . . . . . . . . . . . . . . . . . . . . . 32
2.13.2. ODT2 . . . . . . . . . . . . . . . . . . . . . . . . . . . . . . . . . . . . 33
2.14. Optical setup of Science cell . . . . . . . . . . . . . . . . . . . . . . . . . . . . 33
2.15. Computer control system . . . . . . . . . . . . . . . . . . . . . . . . . . . . . 35
2.16. Imaging and data acquisition . . . . . . . . . . . . . . . . . . . . . . . . . . . 36
2.16.1. Absorption imaging . . . . . . . . . . . . . . . . . . . . . . . . . . . . 36
2.16.2. Auxiliary fluorescence monitoring . . . . . . . . . . . . . . . . . . . . . 39
2.17. Conclusion . . . . . . . . . . . . . . . . . . . . . . . . . . . . . . . . . . . . . 39
3. Sub-Doppler laser cooling of alkalines on the D1-transition 41
Appendix 3.A Publications . . . . . . . . . . . . . . . . . . . . . . . . . . . . . . 45
4. Evaporative cooling to quantum degeneracy in magnetic and optical traps 65
4.1. Introduction . . . . . . . . . . . . . . . . . . . . . . . . . . . . . . . . . . . . . 65
4.2. Principle of evaporative cooling . . . . . . . . . . . . . . . . . . . . . . . . . . 65
4.3. Experimental approach and results . . . . . . . . . . . . . . . . . . . . . . . . 66
4.3.1. RF evaporation . . . . . . . . . . . . . . . . . . . . . . . . . . . . . . . 66
4.3.2. Optical dipole trap . . . . . . . . . . . . . . . . . . . . . . . . . . . . . 67
II. Multi-watt level 671-nm laser source 73
Introduction 75
5. Fundamental laser source at 1342 nm 77
5.1. Nd:YVO4 as laser gain medium . . . . . . . . . . . . . . . . . . . . . . . . . . 80
5.1.1. Crystal structure . . . . . . . . . . . . . . . . . . . . . . . . . . . . . . 80
5.1.2. Emission . . . . . . . . . . . . . . . . . . . . . . . . . . . . . . . . . . 81
5.1.3. Absorption . . . . . . . . . . . . . . . . . . . . . . . . . . . . . . . . . 83
5.2. Laser cavity design: Theory and realization . . . . . . . . . . . . . . . . . . . 86
5.2.1. Hermite-Gaussian beam modes and resonators . . . . . . . . . . . . . 87
5.2.2. Thermal effects and power scaling . . . . . . . . . . . . . . . . . . . . 90
5.2.3. Characteristic curve and output power . . . . . . . . . . . . . . . . . . 95
5.2.4. Laser cavity design . . . . . . . . . . . . . . . . . . . . . . . . . . . . . 96
5.3. Single-mode operation and frequency tuning . . . . . . . . . . . . . . . . . . . 101
5.3.1. Unidirectional operation via Faraday rotator . . . . . . . . . . . . . . 102
5.3.2. Frequency-selective filtering via Etalons . . . . . . . . . . . . . . . . . 103
5.3.3. Etalon parameters . . . . . . . . . . . . . . . . . . . . . . . . . . . . . 104
5.3.4. Etalon temperature tuning . . . . . . . . . . . . . . . . . . . . . . . . 106
5.4. Characterization of performance . . . . . . . . . . . . . . . . . . . . . . . . . 106
5.4.1. Output power . . . . . . . . . . . . . . . . . . . . . . . . . . . . . . . . 106
5.4.2. Output spectrum . . . . . . . . . . . . . . . . . . . . . . . . . . . . . . 109
ii

Contents
5.4.3. Spatial mode . . . . . . . . . . . . . . . . . . . . . . . . . . . . . . . . 110
5.5. Conclusion . . . . . . . . . . . . . . . . . . . . . . . . . . . . . . . . . . . . . 114
6. Second harmonic generation 115
6.1. Theory of second-harmonic generation . . . . . . . . . . . . . . . . . . . . . . 116
6.1.1. Nonlinear conversion . . . . . . . . . . . . . . . . . . . . . . . . . . . . 116
6.1.2. Quasi-phase matching . . . . . . . . . . . . . . . . . . . . . . . . . . . 117
6.1.3. Physical properties of the selected nonlinear media . . . . . . . . . . . 119
6.2. Enhancement cavity . . . . . . . . . . . . . . . . . . . . . . . . . . . . . . . . 120
6.2.1. Mode matching and intra-cavity loss . . . . . . . . . . . . . . . . . . . 123
6.2.2. Impedance matching . . . . . . . . . . . . . . . . . . . . . . . . . . . . 124
6.2.3. Locking scheme . . . . . . . . . . . . . . . . . . . . . . . . . . . . . . . 126
6.2.4. Cavity characterization and SH output power . . . . . . . . . . . . . . 127
6.3. Intracavity frequency-doubling . . . . . . . . . . . . . . . . . . . . . . . . . . 129
6.3.1. The fundamental laser . . . . . . . . . . . . . . . . . . . . . . . . . . . 129
6.3.2. Efficient intracavity second-harmonic generation . . . . . . . . . . . . 133
6.3.3. Tuning behavior and nonlinear-Kerr-lens mode locking . . . . . . . . . 135
6.3.4. Conclusion . . . . . . . . . . . . . . . . . . . . . . . . . . . . . . . . . 138
6.4. Waveguide . . . . . . . . . . . . . . . . . . . . . . . . . . . . . . . . . . . . . . 139
6.4.1. Setup and characterization . . . . . . . . . . . . . . . . . . . . . . . . 139
6.4.2. Theoretical model . . . . . . . . . . . . . . . . . . . . . . . . . . . . . 143
6.5. Conclusion . . . . . . . . . . . . . . . . . . . . . . . . . . . . . . . . . . . . . 145
Appendix 6.A Publications . . . . . . . . . . . . . . . . . . . . . . . . . . . . . . 147
General conclusion and outlook 161
A. Publications 165
Bibliography 167
iii


Abstract
This thesis presents novel techniques for the experimental study of ultracold quantum gases
of fermionic lithium and potassium atoms.
In the first part of this thesis, we describe the design and characterization of the new compo-
nents of our experimental apparatus capable of trapping and cooling simultaneously 6Li and40K atoms to ultracold temperatures. We report on a novel sub-Doppler cooling mechanism,
operating on the D1 line transition of alkali atoms, for laser cooling of lithium and potassium.
The measured phase space densities after this molasses phase are on the order of 10−4 for
both 6Li and 40K. We present the forced evaporative cooling of 40K atoms, starting in an
optically plugged magnetic quadrupole trap and continuing in an optical dipole trap. In this
context, we report on the production of a quantum degenerate Fermi gas of 1.5 × 10⁵ atoms40K in a crossed dipole trap with T/TF = 0.17, paving the way for the study of strongly
interacting superfluids of 40K.
In the second part of this thesis, we present a narrow-linewidth, all-solid-state laser source,
emitting 5.2W in the vicinity of the lithium D-line transitions at 671 nm. The source is
based on a diode-end-pumped unidirectional ring laser operating on the 1342 nm transition
of Nd:YVO4, capable of producing 6.5W of single-mode light delivered in a diffraction-limited
beam. We report on three different approaches for second-haromonic generation of its output
beam, namely by employing an enhancement cavity containing a ppKTP crystal, intracavity
frequency doubling and a ppZnO:LN waveguide structure.


Résumé
Cette these presente de nouvelles techniques pour l’etude experimentale des gaz quantique
ultrafroids d’atomes fermioniques de lithium et de potassium.
Dans la premiere partie de cette these, nous decrivons la conception et la caracterisation des
nouveaux composants de notre dispositif experimental capable de pieger et refroidir simul-
tanement des atomes de 6Li et de 40K a des temperatures ultrabasses. Nous rendons compte
d’une nouvelle technique de refroidissement sub-Doppler, reposant sur la transition de la raie
D1 des atomes alcalins, pour refroidir des atomes de lithium et de potassium par laser. Apres
cette etape de melasse, nous avons mesure une densite dans l’espace des phases de l’ordre de
10−4 a la fois pour le 6Li et le 40K. Nous presentons le refroidissement par evaporation forcee
d’atomes de 40K qui commence dans un piege magnetique quadripolaire plugge et continue
dans un piege optique dipolaire. Dans ce contexte, nous rendons compte de la production
d’un gaz quantique de Fermi degenere de 1.5 × 10⁵ atomes de 40K dans un piege dipolaire
croise avec T/TF = 0.17, ce qui ouvre la voie a l’etude des superfluides de 40K en interaction
forte.
Dans la deuxieme partie de cette these, nous presentons une source laser a etat solide, de
faible largeur spectrale et capable d’emettre 5.2W de puissance autour de 671 nm, dans la
gamme des longueurs d’onde des transitions de la raie D du lithium. La source repose sur un
laser en anneau pompe par diode, emettant sur la transition a 1342 nm de Nd:YVO4, capable
de produire 6.5W de lumiere dans un faisceau monomode limite par la diffraction. Nous
rendons compte de trois differentes approches pour la generation de seconde harmonique du
faisceau de sortie, a savoir en utilisant une cavite amplificatrice comprenant un cristal ppKTP,
par doublage de frequence intracavite et par un structure de guide d’onde de ppZnO:LN.

Acknowledgments
The work presented in this thesis would not have been possible without the support of many
people. In the following I would like to express my thanks to all of those who were involved
in the realization of this project.
In the beginning, I would like to thank Robin Kaiser, Kai Bongs, Denis Boiron and Jerome
Tignon, for having accepted to assist in my thesis committee, for their useful remarks about
the present dissertation and the inspiring discussion during my defense.
I am deeply indebted to my thesis supervisor, Christophe Salomon, for having given me the
opportunity to work in his research group and for his support of my thesis project. Through-
out my thesis I have been impressed by his profound knowledge of experimental physics, his
scientific intuition and his talent in leading our team with engaging optimism. The discus-
sions with Christophe about physics were always extraordinarily fruitful and his approach to
science had a major influence on my understanding of physical research. I will always re-
member the moments he spontaneously came by the lab to work with us on the experiment,
each time making the crucial suggestions for overcoming any experimental problem.
Equivalently, I am deeply indebted to my co-supervisor, Frederic Chevy. I very much appre-
ciated his exceptional theoretical understanding, his critical mind and his original teaching of
physics. His constant availability, his founded advice as well as his patience gave us a strong
support in mastering the daily challenges of laboratory work.
In particular, I would like to thank my fellow lab-mates Diogo Fernandes, Franz Sievers,
Daniel Suchet, Mihail Rabinovic and Thomas Reimann for the time we spent together in the
lab. Diogo amazed me with his great enthusiasm in planning and realizing new projects, thus
pushing the experiment always one step further. I was impressed by Franz tenacity as well as
his technical skills and experimental rigor, especially in the context of our joined 6Li cooling
and laser project. I thank Daniel for his support of my teaching activities at the UPMC and
for sharing his extraordinary motivation for presenting modern physics to a broad public.
I also enjoyed to work with Mihail whose patience, critical mind and systematic approach
helped me a lot during the last year of my thesis, and who is sharing with me the interest
in developing electronics. In addition, I thank Daniel, Mihail and Thomas for having taken
over the experiment and for the future I wish them many new technical ideas and scientific

results with our apparatus.
I am grateful that I could take over the laser project of Ulrich Eismann and Andrea Bergschnei-
der, and I thank them both for their support and for sharing their experience with me. In
particular, I admire Ulrich’s exceptional knowledge about laser physics and nonlinear optics. I
also wish to thank my former colleagues Arimin Ridinger, Saptarishi Chaudhuri and Thomas
Salez. Although they have always been very busy, they found the time to give me my first
lessons in operating the Li-K machine and to discuss physics and lab problems. I am grateful
for the fruitful collaboration with Saijun Wu, who suggested cooling on the D1 line transition
of 6Li, thus initiating the gray molasses project and supporting it from a theoretical point
of view. I would like to express my gratitude to Lev Khaykovich who joined our group as a
visiting professor for several months. His extraordinary capability of putting a physical idea
in simple equations was as impressive as his determination to achieve valuable experimental
results. Moreover, I had the pleasure to work with Colin Parker, who joined our group as a
visitor for a couple of months. All of us were astonished by his outstanding intellectual and
experimental skills. His persistent and systematic approach allowed us to solve some of the
long-standing technical problems of our setup.
I would like to thank the Lithium team, Sylvain Nascimbene, Nir Navon, Igor Ferrier-Barbut,
Benno Rem, Andrew Grier, Marion Delehaye and Sebastien Laurent. They all were of great
help during my thesis and I was impressed by the exceptional technical expertise of all mem-
bers of this research group. Additionally, I thank my colleagues from the other cold atoms
groups at the LKB: Alexandre, Christof, Claire, Daniel, David, Dominik, Fabrice, Felix,
Florian, Francesco, Hadrien, Jakob, Jean, Jerome, Katharina, Kenneth, Konstantin, Laura,
Lauriane, Leander, Matthias, Ramon, Remi, Sanjukta, Sebastian, Sebastien, Shao, Sylvain,
Tilman, Tim and Vincent. In particular, I appreciated their kind support, for example con-
cerning our frequent request of laboratory material, and I thank them for creating such a
stimulating research atmosphere inside our institute.
It is a pleasure to express my gratitude to the LKB administrative services, namely to
Christophe Bernard, Thierry Tardieu, Dominique Giafferi, Audrey Gohlke and Monique Gra-
non. I am particularly indebted to the electronics technicians and engineers, namely Toufik
El Atmani, Lionel Perenes and Bernard Tregon, for their indispensable work. Furthermore I
thank the informatics service and the workshop staff, namely Saysavanh Sourasing, Thierry
Bastien and Jean-Michel Isac.
Apart from my colleagues, I would like to thank my family and friends, in particular my
parents who have always provided me with invaluable support and encouragement.
Finally, I wish to thank my wonderful wife, Nadja, for her unconditional support and for the
happiness she brings in my life. I dedicate this thesis to her.


1 Introduction
1.1. Ultracold quantum gases
The experimental and theoretical investigation of ultracold quantum gases has become one of
the most active research fields in contemporary quantum physics, an evolution that has still
been accelerated since the first observation of Bose-Einstein condensation (BEC) in 1995 [1,2].
The motivation to study dilute atomic gases at very low temperatures, typically on the order
of 100 nK, is given by the possibility to observe quantum phenomena in this regime. At ul-
tracold temperatures, the description of atoms as distinguishable, point-like particles looses
its validity, as a consequence of the emerging fundamental wave nature of the particles. In
particular, when the de Broglie wavelength of atoms reaches a size comparable to the inter-
particle distance inside the atomic ensemble, atoms have to be treated as indistinguishable
objects whose physical behavior is governed by the rules of quantum statistics.
There are two distinct classes of particles corresponding to their intrinsic angular moment,
the spin. On the one hand, bosons have a spin that is an integer multiple of ~ and are subject
to Bose–Einstein statistics urging them to occupy the same lowest energy quantum state. At
ultracold temperatures this results in a phase-transition to a Bose-Einstein condensate [1–5],
in which all atoms occupy the motional ground state of the system and can be described
by a single macroscopic wave function. One consequence of the coherence of atoms in a
BEC is superfluidity, the frictionless motion of particles that can be directly observed by
the creation of vortices [6, 7]. On the other hand, fermions have a half-integer spin and are
governed by Fermi-Dirac statistics. In particular, they underlie the Pauli exclusion principle
which forbids two identical fermions to occupy the same motional and internal quantum
state. At zero temperature they behave therefore fundamentally different from bosons, filling
up the lowest-lying motional quantum states of the confining potential to the Fermi energy,
and forming thus the so-called Fermi sea. The transition from the classical to the quantum
degenerate Fermi gas occurs gradually and is, in contrast to bosons, not accompanied by a
phase transition. The onset of quantum degeneracy in a trapped gas of fermionic atoms was
first observed in 1999 [8].
Bose-Einstein condensation does not rely on interaction effects, since it is a purely statistical
phenomenon [3, 4]. As mentioned above, the first BEC was experimentally realized with
weakly-interacting alkali atoms in 1995 [1,5,9]. A review of experiments on BEC can be found
in [10–13]. These experiments include, besides the mentioned creation of vortices [6, 7], the
observation of macroscopic matter wave interference [14], the realization of two-dimensional

1 Introduction
gases [15–18], the creation of dark and bright solitons [19–22], and the observation of the
superfluid-to-Mott insulator transition in an optical lattice [23].
In the low-energy regime, also the physics of atomic collisions are modified by the wave
nature of particles and quantum statistics [24]. In particular, Feshbach resonances [25, 26]
allow to tune the collision cross section of a quantum gas and were first observed for bosonic
atoms [27]. These resonances occur when two scattering atoms in the open channel resonantly
couple to a molecular bound state belonging to a different molecular potential. Tuning the
energy spacing between the open and closed channels allows to control their coupling and, as
a result, the elastic scattering cross section. Typically, this tuning is achieved by addressing
molecular potentials with different magnetic moments, such that their energy spacing can be
modified by simply varying the magnetic field [28].
In consequence, Feshbach resonances offer the possibility to enter the regime of strong interac-
tions, which is defined as n|a|3 & 1, where n is the atomic density and a the scattering length,
characterizing the two-body interaction and the scattering cross section at low temperatures.
The regime of strong interactions is an extremely active research field, since the investigation
of strongly interacting quantum matter is at the basis of a better understanding of a large
spectrum of systems like high-temperature superconductors, quark-gluon plasmas, neutron
stars or white dwarfs. As the theoretical models are too complex to be solved numerically,
or even analytically, experimental model systems with highly controllable parameters are re-
quired, serving ultimately as analogue simulators [29–32]. Moreover, the obtained knowledge
might in future lead to new technological developments.
Ultracold Fermi gases are an ideal model system to investigate quantum many body phe-
nomena, also in the strongly interacting regime, since they feature a remarkable degree of
control over many system parameters. This can be illustrated by the example of an exper-
iment with a two components mixture. The different components could be represented by
two different atomic species or two distinct internal states of a single atomic species. The
various controllable parameters of the two component system, range from the species and
states of the components, the populations of the components, the temperature, the sign and
strength of the interatomic interaction, the species-specific confinement over the mass ratio,
to the species-specific dimensionality of the system.
An advantage of ultracold atom experiments is that most of these parameters can be varied
between two subsequent experimental cycles. As the cycling time for an ultracold atom
experiment usually ranges from some seconds to some tens of seconds, it becomes possible
to examine the thermodynamic equation of state of a system and to investigate full phase
diagrams.
Another convenience of ultracold atom experiments is the large spectrum of available tools
to probe the state of the gas, ranging from time of flight (TOF) measurements [33], where the
initial momentum distribution of the gas is obtained after it has been released from the trap
and expanded freely, over Bragg spectroscopy [34], radio-frequency (RF) spectroscopy [35],
Ramsey interference [36], quantum noise correlations [37–40], to single side imaging in optical
lattices [41–43]. Most often absorption and fluorescence imaging of the atoms is performed,
2

1.2 Quantum degenerate Fermi gases
yielding the essential information about each component, namely the overall atom number
and the sample’s distribution functions in real- and momentum space. Most of the data points
presented in the first part of this thesis are obtained by a series of runs, each run consisting
in parameter setting, experimental sequence, gas probing and absorption image analysis.
1.2. Quantum degenerate Fermi gases
Quantum degeneracy of a Fermi gas is reached as soon as its temperature becomes lower than
the Fermi temperature TF = EF/kB, where EF is the Fermi energy and kB the Boltzmann
constant. The first degenerate Fermi gas of atoms was realized in 1999 with 40K [8], by adapt-
ing the cooling methods developed to reach BEC with bosonic atoms to a two-component
fermionic system. At ultracold temperatures, it was possible to observe significant deviations
of the Fermi gas from the classical behaviour, thus substantiating the Fermi-Dirac distribu-
tion of the fermions over the low-lying trap states. Fermionic quantum degeneracy has, as
of this writing, also been reached for 6Li [44,45], metastable 3He∗ [46], the alkaline earth ele-
ment 87Sr [47,48], the rare earth elements 173Yb [49], 161Dy [50] and recently 167Er [51]. Early
experiments cooled the atoms to temperatures of about T = 0.2−0.3 T/TF. Current state-of-
the-art experiments reach even temperatures below one tenth the Fermi temperature [52,53].
Reaching quantum degeneracy requires in general an evaporative process as last cooling
stage. The evaporative cooling techniques rely fundamentally on the fast rethermalization
of the gas by elastic collisions. The cooling of Fermi gases is challenging in this context,
since in the ultracold temperature limit gases can only collide via s-wave collisions, whereas
the Pauli exclusion principle forbids these collisions for indistinguishable fermions. A gas
of single-state fermionic particles thus becomes collisionless at low temperatures. Therefore,
the gas has either to be cooled sympathetically or prepared in two different internal states.
Furthermore, the collision rate of fermions decreases in the degenerate regime due to Pauli
blocking, meaning that it becomes less likely that scattering into empty low-lying momentum
states can occur [8, 54]. Moreover, inelastic collisions can additionally reduce the cooling
efficiency and create hole excitations located deep inside the Fermi sea [55,56].
Several experimental approaches have been applied in order to attain the quantum degenerate
regime. The single-species evaporation scheme using two different internal states has been
employed for 40K [8], 6Li [57, 58] and 173Yb [49]. Sympathetic cooling with bosonic isotopes
has been applied for 6Li-7Li [44, 45], 6Li-23Na [52], 6Li-87Rb [59], 6Li-40K-87Rb [60], 6Li-40K-41K [61], 3He∗-4He∗ [46] and 40K-87Rb [62–66]. Also for the Fermi-Fermi mixture 6Li-40K
several approaches have been validated. In Amsterdam, a 40K spin-mixture was evaporated
in a magnetic trap, sympathetically cooling 6Li [67]. The Innsbruck group prepared 6Li in two
spin states, evaporatively cooled it in an optical trap, while sympathetically cooling 40K [68].
Historically, the first experiments investigated nearly ideal, non-interacting, one-component
Fermi gases and their related thermodynamics [8, 44, 69]. Interacting Fermi gases could be
realized by tuning the interactions between atoms belonging to different internal states by
means of Feshbach resonances. The first investigations on strongly interacting Fermi gases
3

1 Introduction
dealt with the characterization of Feshbach resonances in fermionic systems, for instance
for 40K [70–72] and 6Li [73–75]. Contrary to bosonic atoms, fermions are surprisingly stable
in the vicinity of a Feshbach resonance, which is due to the fact that the Pauli exclusion
principle prohibits three-body relaxation [76] thus increasing the lifetime of the fermion dimers
considerably. It was therefore possible to observe Bose-Einstein condensates of weakly bound
Feshbach molecules [77–79]. Shortly afterwards also the Bardeen-Cooper-Schriefer (BCS)-
regime could be probed and the corresponding superfluid was realized [80–82], proving that
in the case of weakly attractive interactions the pairing mechanism is based on Cooper pairing
and not on formation of molecules. Moreover, the crossover from the BEC- to the BCS-regime
could be investigated [82–84], this crossover smoothly connecting the two limiting cases of
superfluid states across the strongly interacting regime.
The superfluid character of strongly interacting Fermi gases was demonstrated by the creation
of vortices [85], the phase separation between paired and unpaired fermions in fermionic
mixtures with population imbalance [86,87], the determination of the speed of sound [88] and
the critical velocities [89] related to a fermionic superfluid. Moreover, a Mott insulator state
was realized with fermions [90,91] and the equation of state of a strongly interacting Fermi gas
could be measured directly [53, 92, 93]. Interestingly, the transition to a superfluid of paired
fermions occurs at a relatively high critical temperature for a strongly interacting Fermi gas,
namely at TC ≃ 0.17 TF [94,95]. In this context, future experiments with strongly interacting
Fermi gases might play an important role for the understanding of high-TC superconductivity
and give new insights into the underlying physics [96].
The preceding list is only a selection of examples and far from exhaustive, but illustrates the
research activity in the field of quantum degenerate Fermi gases.
1.3. Fermi-Fermi mixtures
The investigation of mixtures of different fermionic species promises interesting prospects for
the future, since these systems offer a large number of controllable parameters, such as the
dimensionality of the system and the mass-imbalance of its components.
Systems in mixed dimensions, where the particles of one species evolve in three dimensions
whereas the second species evolves in two, one or zero dimensions [97], can be created by the
application of species-selective potentials [98, 99]. The two-body interaction being altered by
the mixed dimensionality, this can result in confinement induced resonances [100–104]. Few-
body effects, for instance the Efimov-effect in mixed dimensions [105] or p-wave resonances
between interspecies dimers and single atoms [106] that are tuned by the lattice depth, can
be investigated. The particularly appealing case of 3D-0D confinement is equivalent to the
Anderson impurity model and allows the study of Kondo correlated states [107–109]. in
addition, Anderson localization can be observed in such a dilute gas of trapped impurity
scatterers [110–112]. Moreover, new many-body quantum phases are predicted for the case
in which one freely evolving species mediates interactions between a second atomic species
confined in different layers, which might lead to interlayer superfluidity [113].
4

1.4 Thesis outline
Furthermore, the mass imbalance of the two fermionic species results in unmatched Fermi
surfaces, which means that symmetric BCS pairing is not possible any more. Different pairing
mechanisms leading to new quantum phases are predicted for this case [114]. Examples of
these exotic phases are the Fulde-Ferrell-Larkin-Ovchinnikov (FFLO) state [115–117] and the
breached pair state [118,119]. The formation of long-lived trimers [106] and a crystalline phase
transition [120] are also in the scope of new phenomena that might arise. Another important
motivation for the use of different fermionic species is certainly the possibility to form bosonic
polar molecules providing long-range, anisotropic dipole-dipole interaction [121, 122], which
may lead to qualitatively new quantum regimes.
The 6Li-40K mixture is an evident candidate for realizing these studies, since lithium and
potassium are widely used and experimentally well mastered atoms possessing the only stable,
fermionic isotopes among the alkali metals. Both elements have been used in a large spectrum
of applications ranging from Bose-Einstein condensation and atom interferometry to fermionic
pairing. They possess fermionic and bosonic isotopes which can be conveniently trapped and
cooled with laser light delivered by affordable laser sources. Furthermore, the bosonic and
fermionic isotopes can also be mixed in order to study Bose-Fermi mixtures, for example in
optical lattices [123,124] or in order to study the dynamics of two interacting superfluids [125].
As of this writing, all research groups intending to study Fermi-Fermi mixtures with different
atomic species have employed the 6Li-40K mixture [61,67,68,126,127]. To date, three groups
in Munich, Innsbruck and at MIT have reported on double quantum degeneracy of this
mixture [60, 61, 68]. Characterizations of the interspecies Feshbach resonances have been
performed [128–132] and weakly bound Feshbach molecules could be observed [68, 133]. In
particular, the Innsbruck group investigated the hydrodynamic expansion of 6Li and 40K
in the strong interaction regime [134], measured the excitation spectrum of 40K impurities
interacting with a Fermi sea of 6Li[135] and observed a strong attraction between atoms
and dimers in the mass-imbalanced two-component fermionic gas [136]. By now, the unitary
regime has only been reached for the single species 6Li [137] and 40K [138]. However, it might
be possible to attain this regime also for the 6Li-40K-mixture, by using the 1.5Gauss-wide
Feshbach resonance at B0 ∼ 115 G [130].
1.4. Thesis outline
This thesis reports on novel techniques for the experimental investigation of ultracold fermionic
quantum gas mixtures of lithium and potassium, the further design, construction and charac-
terization of our 6Li- 40K experimental setup and the development of powerful laser sources
for laser cooling of lithium.
At the beginning of my thesis, a partially functional experiment including an operational
dual-species MOT had already been constructed. It could produce large atomic gas samples
of 6Li and 40K, with atom numbers on the order of 109 for both species, and temperatures
of several hundreds of microkelvins. Furthermore, we were able to perform the first magnetic
transport sequences in order to transfer the atomic samples to a high vacuum region. During
5

1 Introduction
my thesis work, all subsequent stages for achieving quantum degeneracy had to be developed,
technically implemented and characterized. This comprised the D1 cooling technique, the
development of appropriate laser sources for this cooling scheme, the optimization of the
magnetic transport, the revision of the vacuum assembly and the complete setup for forced
evaporative cooling in a plugged optical quadrupole magnetic trap as well as in different
optical dipole trap configurations.
This manuscript is divided into two parts. In Part I, we present first the experimental setup
(Chapter 2), then introduce the simultaneous D1 sub-Doppler laser cooling of 6Li and 40K
(Chapter 3) and conclude with a description of the evaporative cooling of 40K to quantum
degeneracy (Chapter 4). In Part II, we present an all solid-state laser source emitting up
to 5.2W output power of 671-nm single-mode light frequency-locked to the Lithium D-line
transitions. We detail the design of the fundamental infrared laser source at 1342 nm (Chap-
ter 5) and report on three different technical approaches for second-harmonic generation via
an enhancement cavity, intracavity doubling, and a nonlinear waveguide module (Chapter 6).
Chapter 2 – Experimental setup
In this chapter we present the central components of the experimental apparatus, while con-
centrating on the new subsystems that were implemented in the setup. This includes the laser
systems and optical arrangements for the D1 sub-Doppler cooling, the improved 2D-MOT for40K, a revision of the vacuum assembly, comprising new coated parts for the transport region
and the ultra-high vacuum chamber, new magnetic trap coils, the components required to
perform forced evaporative cooling in an optically plugged magnetic quadrupole trap and in
a single-beam, and subsequently crossed, optical dipole trap as well as the implementation
of an experimental control.
Chapter 3 – Sub-Doppler laser cooling of alkalines on the D1-transition
This chapter reports on a central scientific result during my thesis work, namely a novel
optical molasses scheme for simultaneous sub-Doppler laser cooling of fermionic 6Li and 40K
implemented on the D1 line transition. This cooling strategy is in principle suitable for all
alkali atoms, relies on gray optical molasses and yields phase-space densities on the order
of 10−4 for both 6Li and 40K. First of all, we will motivate the necessity of implementing
a sub-Doppler cooling stage in our setup and introduce the main performance numbers of
the D1 molasses scheme. Subsequently, we will present the published articles concerning our
experimental and theoretical findings [139, 140] for 40K and 6Li in single species and dual-
species operation.
Chapter 4 – Evaporative cooling to quantum degeneracy in magnetic
and optical traps
In this chapter we present our current forced evaporative cooling approach. After briefly
summarizing the main ideas behind evaporative cooling, we will describe the evaporative
6

1.4 Thesis outline
cooling sequence employed for 40K in a plugged magnetic quadrupole trap, the transfer into
an optical dipole trap and the optical evaporation to quantum degeneracy inside a crossed
dipole trap. As of this writing, we achieved a degenerate spin mixture of 40K in the spin-
states∣∣F = 9/2, mF = −9/2
⟩and
∣∣F = 9/2, mF = −7/2⟩, counting ∼ 1.5×10⁵ atoms in each
of both states, with a temperature of 64 nK and T/TF ≃ 0.17.
Chapter 5 – Fundamental laser source at 1342 nm
This chapter describes in detail the design of the fundamental near-infrared laser emitting up
to 6.5W at 1342 nm. We present the thermo-optical properties of the gain medium and the
available pumping schemes, and show that considering these parameters is essential for the
power scaling of the laser system. The laser is based on a diode end-pumped neodymium-
doped yttrium orthovanadate (Nd:YVO4) gain medium pumped at a wavelength of 888 nm,
thus reducing detrimental thermal effects. The bow-tie cavity is formed by four mirrors
providing a stable, Gaussian cavity eigenmode. One convex mirror is used to pass the pumping
light to the laser crystal and to compensate for the thermal lens that is induced in the laser
crystal during operation. Unidirectionality of the traveling-wave ring resonator is achieved
by introducing a Faraday rotator and a λ/2 wave plate. Single-longitudinal-mode operation
and wavelength tuning are provided using two intra-cavity etalons.
Chapter 6 – Second harmonic generation
This chapter will present three different frequency-doubling approaches that we realized for
second-harmonic generation of the available laser radiation at 1342 nm in order to obtain light
at the lithium D-line transition wavelengths next to 671 nm. The first approach consists in
employing a resonant enhancement cavity containing a periodically-poled potassium titanyl
phosphate (ppKTP) crystal as the nonlinear medium. This technique yielded our record
output power of 5.2W at 671 nm. Furthermore, we used this all-solid-state laser source for
our measurements on the D1 sub-Doppler laser cooling of 6Li. As second doubling method,
we investigated intracavity-frequency doubling and achieved output powers of up to 2.1W.
The third approach uses a wavelength conversion module including a nonlinear waveguide
structure. This device generates up to 2.4W of second-harmonic light and is technically the
simplest solution to be implemented.
7


Part I.
6Li-40K Experiment
9


2 Experimental setup
In this chapter we will present the different technical parts of the experimental apperatus
associated with the Fermix experiment, while concentrating on the further developments and
technical upgrades of the experimental setup that has already been described at an earlier
stage in [127, 141, 142]. The main objective of this experiment is to produce mixtures of
ultracold fermions containing two different atomic species, namely 6Li and 40K, that are si-
multaneously cooled down to degeneracy. Important performance goals for the experimental
design are in this context the production of large atom numbers and achieving short experi-
mental cycling times for high experiment repetition rates. Dual-species experiments have in
general a higher level of complexity than the simple combination of two single-species setups.
Subtle strategies need to be realized in order to meet the prerequisites of implementing cer-
tain techniques for both atomic species and to circumvent the constraints imposed by the
dual-species operation. With our chosen approach we finally obtained large atom numbers
for both species while reducing the complexity of the experimental setup to a minimum.
2.1. General design approach
Quantum degeneracy is reached as soon as the thermal deBroglie wavelength of the atomic
wavepackages is on the same order of magnitude as the inter-particle distances. An equivalent
criterion states that the phase space density (PSD) has to reach the order of unity. This means
that the atoms need to be cooled down as low as possible while remaining confined in a trap
that should be as tight as possible. In order to meet these goals we follow the common
pathway to quantum degeneracy, which consists in a first laser cooling stage followed by a
further stage of forced evaporative cooling.
The laser cooling stage is provided by two techniques, a magneto-optical trap (MOT), see
Section 2.6, and a gray optical molasses, presented in Chapter 3. The MOT is simultaneously
loaded with both atomic species via two distinct and continuous beams of pre-slowed atoms.
This loading method is advantageous for several reasons. Firstly, in contrast to loading from a
background vapor, the MOT can be operated in an ultra-high vacuum (UHV) environment,
see Section 2.2. Secondly, the atomic beam flux and consequently the MOT loading rate
are larger than for pulsed loading schemes using alkali getter dispensers [143] or employing
ultraviolet light-induced absorption [144, 145]. Finally, we are able to utilize distinct sources
for both species employing even different pre-cooling techniques, namely a Zeeman slower for6Li, presented in Section 2.4, and a 2D-MOT for 40K, see Section 2.5. Subsequent to the MOT

2 Experimental setup
loading phase, a three dimensional gray optical molasses is performed cooling the atoms of
both species down to sub-Doppler temperatures.
The cloud is then magnetically transported to an ultra-high vacuum glass cell, see Section 2.9
and [146]. The improved vacuum quality leads to a longer lifetime of the trapped atoms
and therefore a higher efficiency of the evaporative cooling process can be achieved. During
a first phase, evaporative cooling induced by driving radio-frequency (RF) transitions in an
optically plugged magnetic quadrupole trap is performed. The use of a magnetic quadrupole
trap has the advantage of offering large optical access in comparison to other magnetic traps
designs. It combines a large trapping volume with tight linear confinement and thus offers
the conditions for fast evaporation dynamics. The RF evaporation is performed with 40K
being prepared in three different spin states, whereas 6Li in its single spin state is cooled
sympathetically.
Subsequently, the pre-cooled, dense atomic cloud is loaded into an optical dipole trap, where
we continue to increase the phase space density of the atoms by means of optical evaporation
and varying trap geometries, as presented in Chapter 4.
2.2. Vacuum chamber
Figure 2.1 shows a 3D-CAD scheme of our vacuum assembly. The design of our vacuum
chamber was optimized in order to provide ultra-high vacuum and a large optical access to
the region, the so-called science cell, in which the experiments with quantum degenerate
atoms ultimately take place. The vacuum assembly includes two branches for the atom
sources, namely the 6Li Zeeman slower and the 40K 2D-MOT, the octagonal MOT-chamber
containing the 6Li-40K dual-species MOT, a magnetic transport arm with a 90 elbow, and
the science cell, where the measurements on ultracold quantum gases are performed.
The MOT-chamber can be separated from the transport and atom source branches by the
integrated all-metal vacuum valves, thus permitting independent bake-out procedures and
technical interventions. Differential pumping tubes between the vapor regions of the atom
sources and the MOT-chamber were installed in order to improve the vacuum quality inside
the MOT-chamber considerably. A further differential pumping stage in the first arm of
the transport contains a tube with inner diameter of 1 cm, allowing to increase the vacuum
quality in the transport and science cell by another order of magnitude. To pump the MOT-
chamber we use a 40 l/s ion pump and an active getter tape (SAES, St 707 strips) that
both were installed opposite the Zeeman slower branch. The 2D-MOT and Zeeman slower
branches are pumped by one and three 20 l/s ion pumps, respectively. We installed a new
vacuum assembly for the transport arm consisting of CF16 vacuum parts replacing completely
the setup described in [141]. In particular, the transport tubes and the science cell are now
pumped by a 40 l/s ion pump, that is situated at the elbow of both magnetic transport arms,
as well as by a 20 l/s ion pump and active getter tape next to the science cell. Furthermore,
the tubes of the second transport arm are coated with a Titanium-Zirconium-Vanadium alloy,
which is thermally activated and serves as a non-evaporable getter with high pumping speed.
12

2.3 Laser systems
The new vacuum assembly improved the vacuum quality, such that the 1/e-lifetime of 40K
in the science cell increased from ∼25 s, measured for the old setup, to more than 100 s, and
solved thus one of the main drawbacks of the former experimental apparatus.
56 cm
6Li Zeeman
slower
40K 2D-MOT
Dual-species
MOT
Magnetic
transport
Science Cell
Figure 2.1: 3D-CAD model of the vacuum assembly. A Zeeman slower for 6Li and a 2D-MOT for40K serve as atom sources for the dual-species MOT contained in the octagonal MOT-chamber. Amagnetic transport transfers the cloud to the glass science cell featuring improved vacuum quality andlarge mechanical and optical access.
The glass science cell was designed to meet the requirements necessary for preparing and
investigating samples of ultracold atoms. It was fabricated by Hellma and consists of Vycor,
which is a synthetic fused silica. The inner dimensions of the cell are 23 × 23 × 10 mm3 and
the glass walls have a diameter of 4mm. A glass-metal junction connects the glass cell to the
magnetic transport vacuum tube. The small size of the cell provides large mechanical and
optical access, allowing the magnetic quadrupole coils or a future high-resolution objective
to be placed close to the atoms. This permits an increased magnetic trap confinement and
hence a better evaporative cooling efficiency. Furthermore, high-resolution imaging relying
on an objective with large numerical aperture, becomes possible.
2.3. Laser systems
The laser systems that we realized provide light for manipulating and probing 6Li and 40K
atoms. The laser light is applied to slow atoms down and to trap them, but also their internal
degrees of freedom like the spin state can be manipulated. In this context, usually the D2 line
13

2 Experimental setup
MHz
F’= 1/ 2 (2.8)
F’= 3/ 2 (1.1)
F’= 5/ 2 (-1.7)
F= 3/ 2 (76.1)
F= 1/ 2 (-152.1)
F’= 3/ 2 (8.7)
F’= 1/ 2 (-17.4)
26.1MHz
228.2MHz
155.3MHz
1285.8MHz
MHz
F’= 1/ 2 (2.8)
F’= 3/ 2 (1.1)F’= 3/ 2 (0.7)
F’= 5/ 2 (-1.7)
F= 3/ 2 (76.1)
F= 1/ 2 (-152.1)
F’= 3/ 2 (-38.0)
Imagin
g
D2C
ross
ove
r
F’= 5/ 2(-446)
Cooling
Repumping
MO
T
Zee
man
Figure 2.2: (left) Level diagram for the D2 and D1 lines of 6Li including the hyperfine structure. TheD-lines of lithium lie in the visible red spectral region. Note the small hyperfine splitting of the 22P3/2
manifold of 6Li. (right) D2 laser transition scheme for 6Li. Solid arrows indicate the frequencies appliedfor the MOT operation. Dashed arrows illustrate the detunings from the corresponding transitions.The diode laser is locked to the saturated absorption crossover signal 22S1/2 (
∣∣F = 1/2⟩
,∣∣F = 3/2
⟩) →
22P3/2 of 6Li.
F’= 7/ 2 (86.3)
F’= 9/ 2 (-69.0)
MHz
F’= 5/ 2 (54.5)
F’= 7/ 2 (30.6)
F’= 9/ 2 (-2.3)
F= 7/ 2 (714.3)
F= 9/ 2 (-571.5)
F’= 11/ 2 (-45.7)
155.3MHz
1285.8MHz
MHz
F’= 5/ 2 (54.5)
F’= 7/ 2 (30.6)
F’= 3/ 2 (-78.2)
F’= 9/ 2 (-2.3)
F= 7/ 2 (714.3)
F= 9/ 2 (-571.5)
F’= 3/ 2 (0)
Imagin
g
D2C
ross
ove
r39K
F’= 11/ 2 (-45.7)
Cooling
Repumping
MO
T
2D
-MO
T
Figure 2.3: (left) Level diagram for the D2 and D1 lines of 40K including the hyperfine structure.The D-lines of potassium lie in the visible near-infrared spectral region. Note the inverted hyperfinestructure. (right) D2 laser transition scheme for 40K. Solid arrows indicate the frequencies applied forthe MOT operation. Dashed arrows illustrate the detunings from the corresponding transitions. Thediode laser is locked to the saturated absorption crossover signal 42S1/2 (|F = 1〉 , |F = 2〉) → 42P3/2
of 39K.
14

2.3 Laser systems
of each alkaline species is addressed. In our experiment we also exploit the D1 line transition,
namely for sub-Doppler cooling, see Chapter 3, and for spin polarization of 6Li, see Section 2.8.
Figure 2.2 (left) and Figure 2.3 (left) show the level diagrams corresponding to both D-line
transitions of 6Li and 40K, respectively. Since the transition wavelengths of both species
differ by ∼ 100 nm, distinct laser systems and optical setups are required. Additionally,
several beams with different frequency shifts and intensities are required, corresponding to
the different applications for each atomic species.
2.3.1. D2 laser system
Figure 2.2 (right) and Figure 2.3 (right) illustrate the used laser frequency shifts and their
application close to the D2 lines of 6Li and 40K, respectively. The D2 laser systems for
Figure 2.4: Laser systems for addressing the D2 line tranistions of 6Li and 40K. The frequencies andamplitudes for the different beams are controlled by AOMs in single pass (sp) or double pass (dp)configuration. The EOMs modulate the phase of the spectroscopy beam for frequency stabilizationof the diode lasers. Single-mode polarization maintaining fibers (FI) clean the beams spatially. Theindicated AOM frequencies correspond to the beam frequencies required for the MOT operation, seeFigures 2.2 and 2.3.
6Li and 40K are designed in an analogous manner. Figure 2.4 presents a simplified scheme
of the realized laser systems. We constructed them on individual optical tables for each
atomic species. Low power diode lasers (DL), namely a DL Pro laser from Toptica for6Li and a home made diode laser described in [141] for 40K, serve as master light sources.
15

2 Experimental setup
The laser frequencies are stabilized by means of saturated absorption spectroscopy and lock
circuits acting on the tilt angle of the diode gratings. The master laser beams are amplified
by tapered amplifier (TA) chips (Toptica TA-0675-0500-1 and Eagleyard EYP-TPA-0765-
01500-3006-CMT03-0000) which are installed in home made mounts [141]. Subsequently,
they are coupled into single-mode polarization maintaining optical fibers for the purpose of
mode cleaning. The fiber output powers are split up by a combination of λ/2 waveplates
and polarizing beam splitters into the different laser beams required for the experiment.
Acousto-optical modulators (AOMs) are employed to shift the frequencies and to control
the intensities of these beams. The cooling and repumping beams are superimposed and
injected into the TAs with orthogonal polarization. As a result the TAs deliver linearly
polarized bichromatic output beams, containing both the cooling and repumping frequencies.
However, the injection of a TA with two different frequencies creates sidebands due to non-
linearities [147]. Fortunately, the power losses are in our case negligible, being on the order of
∼ 5% for 6Li and ∼ 0.2% for 40K. Furthermore, these sidebands do not address undesirable
transitions. Yet there is one exception concerning one of the sidebands of the bichromatic
Zeeman slower beam. Since this sideband would be near-resonant with the 6Li atoms trapped
in the MOT, we solely amplify the Zeeman cooling beam and combine it with the repumping
beam only after the Zeeman TA. All generated laser beams are finally injected into single-
mode polarization maintaining fibers leading to the main experimental table.
2.3.2. D1 laser system
Figure 2.5 presents the level schemes corresponding to the D1 line transitions of 6Li and 40K,
together with the molasses beams driving these transitions. The AOMs of the D2 systems
cannot be employed for shifting to the D1 wavelengths, since they operate only in the range
of hundreds of MHz, see Figure 2.4. However, the frequencies of the D1 and D2 lines for6Li and 40K, are separated by ∼ 10 GHz and ∼ 11 THz, respectively, see Figure 2.2 and 2.3.
Therefore two additional laser systems were required for the implementation of the D1 sub-
Doppler cooling scheme in our experimental setup.
The D1 laser systems for 6Li and 40K are presented in Figure 2.6. For both setups the
frequency-lock point can be shifted by tuning the double-pass AOM in the path of the satu-
rated absorption spectroscopy.
For the 40K D1 system, the repumping frequency is generated by an electro-optic modulator
(EOM). In general, a EOM creates two sidebands separated from the original carrier fre-
quency by the modulation frequency of the EOM. In our case the sideband with the lower
frequency constitutes the repumping component. The power loss due to the unused second
sideband can be neglected, since only low modulation amplitudes are required for the D1
cooling scheme operating with relatively low repumping power. Furthermore, this second
sideband does not address the atoms by exciting unwanted transitions.
The source for the 6Li D1 molasses light was, at least for for the experimental studies presented
in Chapter 3, a home-made all solid-state laser (SSL), whose design and characterization are
16

2.3 Laser systems
MHz
F=3/2 (76.1)
F=1/2 (-152.1)
F’=3/2 (-38.0)
Mola
sses
F’=3/2 (8.7)
F’=1/2 (-17.4)
Cooling
Repumping
D1Cro
ssove
r
F’=3/2 (0)
D1Cro
ssove
r 39K
MHz
F=7/2 (714.3)
F=9/2 (-571.5)
F’=3/2 (0)
F’=7/2 (86.3)
F’=9/2 (-69.0)
Cooling
Repumping
Mola
sses
F’=3/2 (-47.1)
Figure 2.5: Level schemes corresponding to the D1 line transitions of 6Li and 40K, as presentedin [148]. Solid and dashed arrows illustrate the frequencies and detunings required for the sub-Dopplercooling, respectively. The lasers are frequency locked to the saturated absorption crossover signals22S1/2 (
∣∣F = 1/2⟩
,∣∣F = 3/2
⟩) → 22P1/2 of 6Li and 42S1/2 (|F = 1〉 , |F = 2〉) → 42P1/2
∣∣F ′ = 2⟩of
39K. The D1 sub-Doppler cooling is presented in Chapter 3.
6Li
40KDL
TA
AOM
–256 MH z dp
EOM Spectroscopy
+22 0 MH z sp
EOM
1285.8 MH z
AOMD
1Molasses
SSL AOM
+ 100 MH z dp
EOM Spectroscopy
+10 0 MH z sp+114. 1 MH z dp
AOMD
1Molasses
AOMRepumper
Cooling
Cooling Cooling+Repumper
DL
TA
Ref. D2
EOM
228.2 MHz
AOMD
1Molasses
–109.7 MHz sp
AOM
+100 MHz sp
Optical
Pumping
Figure 2.6: Laser systems of the D1 molasses cooling schemes for 6Li and 40K. The frequenciesand amplitudes of the various beams are controlled by AOMs in single pass (sp) or double pass (dp)configuration. EOMs creates the repumping frequency in the 40K setup and in the diode laser (DL) 6Lisetup. The EOMs in the spectroscopy phase modulate a sample of the beam for the frequency-lock ofthe lasers. Single mode polarization maintaining fibers transmit the beams to the main experimentaltable. The indicated AOM frequencies correspond to the beam frequencies required for the molassescooling, see Figure 2.5.
17

2 Experimental setup
presented in Part II. Its high power output of 5.2W allowed us to employ a flexible setup for
the characterization of the D1 molasses. In particular, we could scan the power and frequency
of the repumping component independently from the cooling component.
To operate the 6Li molasses on a daily basis, it is however sufficient to use a 500mW master
oscillator power amplifier (MOPA) setup based on semiconductor laser sources. It consists of
a master diode and a tapered amplifier (TA). As for 40K, the repumping frequency component
is generated with an EOM. Reasonable atom transfer efficiencies from the compressed MOT
(CMOT) to the D1 molasses are achieved with the available power of PMOPA,fiber ∼ 150mW
after the optical fiber, as long as an appropriately small beam diameter of the molasses beams
is chosen for reaching the required intensities, see Chapter 3.
2.4. 6Li Zeeman slower
The atom source of the 6Li-MOT is a Zeeman slower [149, 150]. It includes an oven, pro-
ducing a thermal beam of 6Li atoms, an assembly of magnetic field coils and a laser beam
counter-propagating the atomic beam. The counter-propagating laser beam need to be kept
close to the atomic resonance along the entire length of the slower in order to provide a con-
tinuous deceleration. The changing Doppler shift of the decelerating atoms has therefore to
be compensated by a corresponding Zeeman shift, which is induced by the spatially varying
magnetic field of the coil assembly. A sign-changing field Zeeman slower was implemented
MOTposition
calculation
measurement–200
0
200
400
600
Magnetic
field(G
)
0 20 40 60 80
Position (cm)
Figure 2.7: Coil assembly of the 6Li Zeeman slower (top) and generated axial magnetic field profile(bottom), as presented in [141] and illustrated in [148]. The thermal atom beam produced by the6Li-oven enters the coil assembly at position 0, and a fraction of the atoms is decelerated and finallycaptured in the 6Li-MOT, which is located at position 71.4 cm. A compensation coil, called anti-Zeeman coil, is located on the opposite side of the MOT chamber (at position 84.1 cm) ensuring thatthe magnetic field at the position of the MOT is cancelled. The whole coil assembly extends over55 cm.
because of certain advantages in comparison to a positive-field Zeeman slower. In particular,
the applied laser beam is non-resonant with the 6Li-MOT atoms, the magnetic field maxi-
mum is reduced, and it needs less coil windings close to the MOT, improving thus the optical
18

2.5 40K 2D-MOT
access. However, a small amount of repumping light is then needed due to the region with
changing magnetic field sign.
At this point we only review the most crucial parameters and performance values of our6Li Zeeman slower. A detailed characterization was presented in [141]. Figure 2.7 illustrates
the coil assembly and the generated axial magnetic field profile of the Zeeman slower. The6Li-MOT is situated 71.4 cm away from the entry point of the slower. The compensation
coil placed at 84.1 cm is supposed to cancel the magnetic field at the MOT position. The
optimal parameters of the Zeeman slower are summarized in Table 2.1. With the oven heated
to ∼ 500C, we obtain a 6Li-MOT capture rate of ∼ 1.2 × 10⁹atoms/s.
6Li Zeeman slower
Pfiber [mW] 50∆ωslow [Γ] -75∆ωrep [Γ] -75Irep/Islow 1/8Bmax [G] 570
Table 2.1. – Optimal values for the 6Li Zeeman slower parameters. ∆ωslow and ∆ωrep
correspond to the detunings of the slowing and repumping beams, respectively. The naturallinewidth of 6Li is Γ/(2π) = 5.87 MHz. An oven temperature of ∼ 500 C leads to a 6Li-MOTcapture rate of ∼ 1.2 × 10⁹ atoms/s.
2.5. 40K 2D-MOT
A two-dimensional magneto-optical trap (2D-MOT) serves as atom source for our 40K 3D-
MOT. A 2D-MOT is a high flux cold atom source, that was realized for rubidium [151–
153], potassium [154], cesium [155] and lithium [156]. Even though the atom fluxes generated
by Zeeman slowers are generally higher, they are also sources of magnetic fields and hot
atom jets in the MOT region. In comparison, 2D-MOTs have a more compact design and
can be operated at lower temperatures, being thus more economic with regard to sample
consumption. This is an important point for fermionic potassium, since the 4% enriched 40K
samples that we use are quite expensive. In addition, the 2D-MOT separates the 40K isotope
from the more abundant 39K, since only the 40K atoms are cooled and form the atomic beam,
thus reducing the thermal background considerably.
2.5.1. Principle of a 2D-MOT
A 2D-MOT captures atoms from a background vapor, confines and cools them in the transver-
sal directions, and out-couples a pre-cooled atomic beam in the axial direction passing through
a differential pumping tube. At the same time this tube serves as a velocity filter, resulting
in a transversally and longitudinally cold atomic beam arriving in the 3D-MOT chamber.
Additional axial molasses cooling significantly increases the output flux of a 2D-MOT [151],
since the atoms are hold in the transverse cooling region for a longer time. In our old setup we
19

2 Experimental setup
employed two independent, counter propagating, axial molasses beams, labelled axial+ and
axial- in Figure 2.8, injected by means of a 45-angled mirror inside the vacuum chamber. For
the upgraded setup we added an independent pushing beam, out-coupling the atomic beam
more efficiently through the small hole in the center of the 45-angled mirror.
2.5.2. Experimental setup
The central part of the 2D-MOT vacuum assembly consists of a glass cell with dimensions
110 × 55 × 55 mm3 illustrated in Figure 2.8. A polished stainless steel 45-angled mirror is
attached to the differential pumping tube inside the vacuum chamber. It has a reflectivity of
50% and is chemically inert to potassium exposure. The distance between the centers of the
2D- and 3D-MOT is 55 cm and the pressure ratio between the corresponding vacuum regions
is ∼ 103.
Pushing
Axial+
Transversal
Differential
pumping tube
Mirror hole
110mm
Axial-
Figure 2.8: Scheme of the 40K 2D-MOT and illustration of the light beams. The elliptic beamstransversally cool the atoms. The alignment of the axial molasses beam pair is provided by a 45-angled mirror placed inside the vacuum chamber. The pushing beam axially out-couples an atomicbeam through the mirror hole. The optimal beam parameters are given in Table 2.2.
The potassium sample, which is enriched to 4% of 40K, is situated at a cold point next to
the glass-metal junction of the glass cell, see page 21. The cold point is created by a water
cooled plastic tube that was winded around this point, see Figure 2.9. The temperature of
the cold point is regulated by a water chiller and can be varied in order to set an appropriate
potassium pressure in the glass cell. Usually we work at a cold point water temperature of
∼ 40C, corresponding to a total potassium pressure of ∼ 2 × 10⁻⁷mbar and a partial 40K
pressure of ∼ 1 × 10⁻⁸mbar.
The bichromatic laser beam used for the 2D-MOT has a total power of Pfiber = 350 mW at
the fiber output. The frequency of the cooling component is red-detuned by ∼ 3.5Γ from the
20

2.5 40K 2D-MOT
∣∣F = 9/2⟩
→∣∣F ′ = 11/2
⟩transition whereas the frequency of the repumper component is red-
detuned by ∼ 2.5Γ from the∣∣F = 7/2
⟩→∣∣F ′ = 9/2
⟩transition, see Figure 2.3. This beam is
split up into five beams, two transverse and three axial 2D-MOT beams, see Figure 2.8. The
beams are circularly polarized and expanded by spherical and/or cylindrical telescopes. The
transverse beams are expanded to an elliptical shape with 1/e2-diameters of 27.5mm and
55mm. They are retro-reflected by right-angled prisms, such preserving their polarization
helicity. The axial cooling beams have a round shape with a 1/e2-diameter of 27.5mm,
whereas the 1/e2-diameter of the pushing beam is 3.8mm. 87% of the fiber output power
is utilized for the transverse cooling beams, 11% for the axial cooling beams and 2% for the
pushing beam. A racetrack coil geometry is employed to create a two dimensional quadrupole
magnetic field with cylindrical symmetry around the horizontal 2D-MOT axis where the
magnetic field is zero. The optimum for the magnetic field gradients was found to be ∂xB =
∂yB = 11 G/cm. A summary of the optimal values for the essential 2D-MOT parameters
is given in Table 2.2. Using these parameters yields a 40K-MOT loading rate of ∼ 3 ×10⁸ atoms/s.
40K 2D-MOT
Pfiber [mW] 350∆ωcool [Γ] -3.5∆ωrep [Γ] -2.5Irep/Icool 0.5Itrans+/Itrans− 2.4Ppush [mW] 8.6∂xB, ∂yB [G/cm] 11K vapor Pressure [mbar] 2.3 × 10⁻⁷
Table 2.2. – Optimal values for the parameters of the 40K 2D-MOT, resulting in a 40K MOTloading rate of 3 × 10⁸ atoms/s. The definitions of the symbols are given in the text. Thenatural linewidth of 40K is Γ/(2π) = 6.04 MHz.
2.5.3. Characterization of the 2D-MOT upgrade
The performance of the 2D-MOT can be characterised by measuring the loading rate of the40K-MOT as a function of the 2D-MOT parameters that are at our disposal. The impact
of several parameters, as for example the light intensity ratios, frequency detunings and the
vapor pressure in the 2D-MOT cell, have already been studied in [141]. In the following we
concentrate on the improvements that have been made on the 2D-MOT setup, namely the
new approach to control the pressure in the 2D-MOT glass cell and the implementation of
an additional pushing beam whose intensity can be controlled independently.
Cold point
Figure 2.9 illustrates the vacuum assembly of the 2D-MOT. In the old setup the potassium
sample was situated in a CF16 bellow 20 cm away from the glass cell. In this bellow a small
21

2 Experimental setup
ampoule with the isotopically enriched potassium sample had been broken under vacuum.
Overheating of this source region caused the potassium sample to migrate to other regions
of the vacuum assembly and depleted the old source completely. In order keep the ability to
control the potassium vapor pressure, a cold point was created near the glass cell to serve
as a new accumulation region for the sample. A water cooled plastic tube is encompassing
the glass tube of the 2D-MOT cell, see Figure 2.8. A chiller regulates the water temperature
which allows to control the cold point temperature. In the current setup the old source region
is heated to ∼ 120C, the glass cell to ∼ 80C and all other parts, except for the cold point,
to at least 100C. During operation of the 2D-MOT we set the cold point water temperature
to 40C. Otherwise, it is cooled down to 12C in order to re-accumulate potassium crystals.
Cold point(new source)
110mm
Sample bellow(old source)
Figure 2.9: The 40K 2D-MOT vacuum assembly. The cold point serves as new potassium source,since the bellow originally containing the sample became depleted. The old source region is heatedto ∼ 120C, the glass cell to ∼ 80C and all intermediate parts to at least 100C to establish atemperature gradient. The cold point water temperature can be regulated by means of a chiller inorder to control the 2D-MOT pressure, see Figure 2.10.
The actual vapor pressure of potassium can be determined by a measurement of the resonance
absorption profile of a low intensity probe beam that is passed through the 2D-MOT cell over a
path length of 10.5 cm, see Appendix A of [141] for a detailed description. Figure 2.10 present
the dependence of the 3D-MOT loading rate and the 2D-MOT pressure on the cold point
water temperature. A cold point water temperature of 40C results in to a total potassium
pressure of ∼ 2 × 10⁻⁷mbar, corresponding to a partial pressure of ∼ 1 × 10⁻⁸ mbar for 40K.
Additional pushing beam
In order to increase the flux of the 2D-MOT an independent pushing beam was added whose
1/e2-diameter of 3.8mm approximately fits the size of the mirror hole, see Figure 2.8. This
additional beam offers a further parameter for optimization of the atomic beam out-coupling
22

2.5 40K 2D-MOT
20 25 30 35 400
0.5
1
1.5
2
2.5
x 108
Cold point water temperature [°C]
3D
−MO
T lo
ad
ing
ra
te [
ato
ms/s
]
20 25 30 35 400
0.5
1
1.5
2
2.5
x 10−7
2D
−MO
T K
−pre
ssu
re [
mb
ar]
Figure 2.10: 40K 3D-MOT loading rate (red circles) and total potassium 2D-MOT pressure (bluesquares) as a functions of the cold point water temperature. The pressure is deduced from theabsorption of a weak probe beam which is resonant with the D2 transition of 39K and passes throughthe 2D-MOT cell.
and the related axial 2D-MOT molasses. As a consequence, the power of the axial molasses
beams could be reduced from 90mW to 40mW, thus allowing for higher transversal beam
powers. In comparison to the old setup, meaning the optimized 2D-MOT setup without
independent pushing beam, we were able to increase the flux of the 2D-MOT measured via
the 3D-MOT loading rate by a factor of two. The best performance was achieved using
a circularly polarized pushing beam and a longitudinal molasses in σ+–σ− configuration,
whereas the old setup employed a lin⊥lin configuration. Figure 2.11 presents the dependence
of the 3D-MOT loading rate on the pushing beam power. For this measurement, the powers
of the other 2D-MOT beams were kept constant. The maximal loading rate was found to be
∼ 3 × 10⁸ atoms/s for Ppush = 9 mW.
23

2 Experimental setup
0 2 4 6 8 10 12 14 16
0
0.5
1
1.5
2
2.5
3
x 108
2D−MOT pushing beam power [mW]
3D
−MO
T loadin
g r
ate
[ato
ms/s
]
Figure 2.11: 3D-MOT loading rate as a function of the 2D-MOT pushing beam power. The maximalloading rate of ∼ 3 × 10⁸ atoms/s was found for Ppush = 9 mW.
2.6. 6Li-40K dual-species MOT
This section deals with the technical implementation and performance of the 6Li-40K dual-
species MOT. A magneto-optical trap relies on the combination of a magnetic quadrupole
field with three orthogonal pairs of counter-propagating red-detuned laser beams leading
to cooling and magneto-optical confinement of atoms around the magnetic field zero [150].
For both 6Li and 40K, bichromatic MOT beams with a cooling and repumping frequency
component are needed. The repumping component is in general required for all alkali atoms
and ensures that the atoms are kept in the nearly cycling cooling transition. In particular6Li atoms very likely leave the cooling transition due to the very narrow hyperfine structure
of the excited-state. Thus the relatively large repumping component even contributes to the
cooling of 6Li. For a dual-species MOT it is crucial to minimize light-induced interspecies
collisions, since they lead to atom losses. We were able to limit these losses to less than 10%,
by employing low magnetic field gradients and relatively low repumping light intensities for
both atomic species, as detailed in [127].
2.6.1. Experimental setup
The 6Li-40K dual-species MOT requires a bichromatic laser beams for each species. Both
beams are transferred onto the main experimental table via optical fibers. The optical setup,
superimposing and expanding the MOT beams, is presented in Section 2.7.2 and Figure 2.12.
We note that the MOT beams have a 1/e2-diameter of 22mm.
24

2.6 6Li-40K dual-species MOT
The fiber output power of the bichromatic beam forming the 6Li-MOT is Pfiber,Li = 110mW.
The cooling frequency is red-detuned by ∼ 5Γ from the 22S1/2
∣∣F = 3/2⟩
→ 22P3/2
∣∣F ′ = 5/2⟩
transition whereas the repumping frequency is red-detuned by ∼ 3Γ from the 22S1/2
∣∣F = 1/2⟩
→22P3/2
∣∣F ′ = 3/2⟩transition, see Figure 2.2. The power ratio of the cooling/repumping com-
ponents is ∼ 5.
The fiber output power of the 40K-MOT beam is Pfiber,K = 220 mW. In this case, the
cooling frequency is red-detuned by ∼ 3Γ from the 42S1/2
∣∣F = 9/2⟩
→ 42P3/2
∣∣F ′ = 11/2⟩
transition and the repumping frequency is detuned by ∼ 5Γ from the 42S1/2
∣∣F = 7/2⟩
→42P3/2
∣∣F ′ = 9/2⟩transition, see 2.3. The power ratio of the cooling/repumping components
is with ∼ 20 significantly larger than for 6Li.
The MOT magnetic field is a quadrupole field generated by a pair of water cooled coils in
anti-Helmholtz configuration. The coils have a distance of ∼6.5 cm to the trap center and
generate an magnetic field gradient of 0.94 G/cm A along the symmetry axis. Accordingly, the
transverse magnetic field gradient is smaller by a factor 2. The dual-species MOT is operated
at ∂zB = 8G/cm, this value optimizing the achievable atom numbers of the 40K-MOT.
In Table 2.3 we summarize the optimal parameter settings for the 6Li-40K dual-species MOT.
Dual-species operation of the MOT yields ∼ 2 × 10⁹ 6Li atoms at ∼ 1mK and ∼ 3 × 10⁹
40K atoms at ∼ 240µK corresponding to a phase space density on the order of 10−7 for both
atomic species.
40K-MOT 6Li-MOT
Γ/(2π) [MHz] 6.04 5.87Isat [mW/cm2] 1.75 2.54Pfiber [mW] 220 110∆ωcool [Γ] -3 -5∆ωrep [Γ] -5 -3Icool per beam [Isat] 12 4Icool/Irep 20 5∂zB [G/cm] 8 8Nsingle [×109] 3.5 2.1Ndual [×109] 3.2 2n0 [×1010cm−3] 7 2.6T [µK] 240 1000φ [×10−7] 2 3
Table 2.3. – Optimal parameter settings for and properties of the 6Li-40K dual-species MOT.T designates the temperature of the atomic ensemble and n0 the peak atomic density in thecenter of the trap. φ = n0λ3
B corresponds to the peak phase-space density, with the thermalde Broglie wavelength defined as λB =
√2π~/mkBT . Here, the given value does not take
into account the occupation of different internal states.
25

2 Experimental setup
2.7. CMOT and gray molasses cooling
The phase-space density of the 6Li-40K mixture is increased after the MOT-phase by applying
a compressed MOT phase (CMOT) succeeded by an optical molasses phase. First, the CMOT
phase compresses the atomic samples and enhances therefore their densities, then the D1
molasses phase cools them further down to deep sub-Doppler temperatures. In the following
we describe the implementation of the 6Li-40K dual-species molasses beams in the setup of
the main experimental table. The comprehensive characterization of this cooling technique
is presented in Chapter 3.
2.7.1. Compressed MOT
In order to increase the density of the atomic clouds trapped in the MOT we apply a so-
called compressed MOT phase. For this purpose, the magnetic field gradient is linearly
ramped from 8G/cm to 45G/cm within 5ms. Simultaneously the MOT beam intensities
are reduced, while the frequencies of both the cooling and repumping components are tuned
closer to resonance. For 6Li this leads to a density increase from 2.6 × 10¹⁰ at./cm3 to
1.8 × 10¹¹ at./cm3 and the temperature decreases from 1mK to 800 µK. For 40K the density
increases from 7 × 10¹⁰ at./cm3 to 3.7 × 10¹¹ at./cm3, while the temperature also increases
from 240 µK to 2mK.
2.7.2. Implementation of the D1 molasses
The D1 molasses beams were implemented in the main experimental setup by superimposing
the molasses beams with the 3D-MOT beams. The total power of the bichromatic fiber
output is Pfiber,Li = 150mW for the 6Li molasses and Pfiber,K = 200mW for the 40K molasses.
In Figure 2.12 we illustrate how the two molasses beams for 6Li and 40K, which are emitted
from the optical fiber outputs labeled D1,Li and D1,K, are nearly superimposed with the
3D-MOT light via the D-shaped mirrors MD.
The lithium and potassium beams are subsequently combined at a dichroic mirror Mdichroic.
This beam, that finally includes all MOT- and molasses frequency components, is expanded
by a 1:10 lens telescope and distributed by means of polarization optics to the three pairs of
σ+–σ− counter-propagating beams of the 3D-MOT and the D1 molasses. The 1/e2-diameter
of the 3D-MOT beams is ∼ 22mm after expansion for both 6Li and 40K. The 1/e2-diameters
of the molasses beams are ∼ 17.1 mm and ∼ 17.8 mm for 6Li and 40K, respectively.
The two beams in the horizontal plane are retro-reflected, whereas the vertical axis is driven
by two independent beams. Two λ/2 plates, one of order four for lithium (λ/2∗
Li), and an-
other one of order four for potassium (λ/2∗
K), allow to set the 6Li and 40K 3D-MOT power
distribution independently. This is due to the fact that each of these wave plates can, to a
very good approximation, turn the polarization axis for one wavelength without affecting the
polarization axis of the other one since 4.5 × 671 ≈ 4 × 767 and 4.5 × 767 ≈ 5 × 671. Finally,
the 3D-MOT beams are circularly polarized using first order λ/4 waveplates specified for the
26

2.8 Magnetic trapping
wavelength 40K 767 nm. However, these waveplates perform also sufficiently well for the 6Li
wavelength 671 nm.
BS BSBS
Figure 2.12: Optical scheme for the 3D-MOT and D1-molasses beams, as presented in [148]. A D-shaped mirror (MD) nearly superposes the 3D-MOT light and the D1 molasses light for both atomicspecies. Subsequently, the lithium- and potassium light is combined at dichroic mirror (Mdichroic). Theresulting beam is finally expanded and distributed to three perpendicular axes forming the 3D-MOT.
2.8. Magnetic trapping
After capturing and cooling the atomic samples by the MOT and the D1 molasses, their phase
space density needs to be further increased by means of evaporative cooling, see Chapter 4. In
this context, a transfer of the atoms into a conservative trap is required. Evaporative cooling
is commonly performed in magnetic traps and optical dipole traps (ODTs) which act both
as non-dissipative traps. ODTs have usually only a poor transfer efficiency of loading atoms
directly from a MOT due to their limited trapping volume. As first stage of the evaporation
process we therefore decided to perform RF-driven evaporation inside a magnetic trap before
ultimately loading the atoms into an ODT, see Chapter 4.
In the following sections we summarize the consecutive steps of magnetic trapping in our
experimental sequence and characterize the technical tools, used during these stages.
Loading of the magnetic quadrupole trap
After cooling the atomic samples optically during the D1 molasses phase, the atoms are
loaded into a magnetic quadrupole trap. First, the atoms need to be prepared in magnetically
trappable spin states in order to ensure an efficient transfer. Therefore optical pumping is
applied, meaning that in the presence of a small bias field, a short spin polarization light
27

2 Experimental setup
pulse is applied along the magnetic field axis. Subsequently, the magnetic trap is ramped up,
the magnetic field being generated by the same coil pair as for the 3D-MOT. Due to technical
restrictions, at least ∼3ms are required to ramp up the magnetic field gradient from zero to
45G/cm. The gradient is then linearly ramped from 45G/cm to its final value of 145G/cm
within 500ms.
2.9. Magnetic transport
The vacuum lifetime of the atomic samples prepared in the 3D-MOT chamber, as well as
the optical access have to be increased for an efficient evaporation process and subsequent
experiments. This is achieved by transferring the trapped atoms to the UHV science cell. We
apply a magnetic transport technique [146] with a 90 elbow, featuring an additional optical
access on the transport axis.
The magnetic transport consists of 14 coil pairs which are partly overlapping and one pushing
coil. By continuously varying the currents over time, the magnetic trap center is moved over
the total distance of 64 cm from the MOT chamber to the science cell.
2.10. Optically plugged magnetic quadrupole trap
After arrival in the science cell, the atomic samples undergo an evaporative cooling step
driven by RF transitions in an optically plugged magnetic quadrupole trap. The optical plug
repels the atoms from the trap center, where the magnetic field cancels, avoiding thus atom
losses due to Majorana spin-flips. The quadrupole trap provides a steep, linear confinement,
yielding high elastic collision rates, and allows therefore for efficient evaporation dynamics.
2.10.1. Coils
The magnetic quadrupole trap of the science cell is generated by a custom made coil pair
manufactured by Oswald. It includes two pairs of coils, called the inner and the outer coil,
see Figure 2.13. Both coil pairs are operated in anti-Helmholtz configuration during the
magnetic transport sequence. As soon as the atoms have arrived in the center of the glass
cell the current of the outer coil pair is slowly ramped to zero and only the inner coil pair
generates the magnetic trapping potential. The entire coil consists of hollow 4mm thick
copper wire with squared cross section impregnated in epoxy. The circular hole with 2.5mm
diameter inside the wire permits permanent water cooling.
Each of the inner coils is composed of 4 layers with 12 turns per layer. The inner coil
diameter is 40mm and the outer diameter is 72mm. Both coils are placed on the vertical
axis of the science cell with a distance of 35mm, generating an axial magnetic field gradient
of 2.5G/cmA.
The outer coils consist of 4 layers with 4 turns and have inner and outer coil diameter of 73mm
and 90mm, respectively. In anti-Helmholtz configuration they generate an axial magnetic
field gradient of 0.24G/cmA. Operation in Helmholtz configuration provides a magnetic bias
28

2.10 Optically plugged magnetic quadrupole trap
Inner coil
Outer coil
Water connection
Current connection
R20mm
R89.7mm
R72.5mm
R71.6
mm
Figure 2.13: Technical drawing of the quadrupole coils which also serve as Feshbach coils (from [148]).They consist of two concentric coil pairs, an inner one and an outer one, both made of hollow copperwire impregnated in epoxy. The inner coils generate in particular the magnetic field for the opticallyplugged magnetic trap. They are placed at a distance of 17.5mm from the trap center and create anaxial magnetic field gradient of 2.51G/cmA.
field of 2.2G/A at the center of the science cell with a curvature of -0.027G/cm2 in the axial
direction.
The coils are placed inside a stable mount consisting of a fiber-reinforced plastic material. It is
attached to the transport coil assembly and provides high mechanical stability and electrical
isolation, thus avoiding Eddy currents.
Fast switching of the coil currents is ensured by the implementation of insulated-gate bipolar
transistors (IGBTs) which are connected in series with the coils. Varistors in parallel to their
source/drain junction protect them from induction currents. The high current circuits are
galvanically isolated from the IGBT computer control channels by digital opto-couplers.
2.10.2. Optical plug
Since atoms in a magnetic quadrupole trap need to be prevented from undergoing Majorana
spin-flips, we implemented a far blue-detuned laser beam repelling the atoms from the trap
center, where the magnetic field cancels. This suppression of Majorana losses is crucial for
an efficient evaporative cooling, especially at low temperature. Historically, the first Bose-
Einstein condensate was realized with Sodium in such an optically plugged magnetic trap [2].
The laser source of the plug beam is a commercial intracavity-doubled Nd:YVO4 single mode
laser (Verdi V12, Coherent) emitting up to 12W at a wavelength of 532 nm, which is far
blue detuned from the D-line transitions of both 6Li and 40K. A 110MHz high-power AOM
(MCQ110-A2 VIS, AA optoelectronic) is used to switch the plug beam. This AOM is driven
by the signal of a voltage-controlled oscillator (VCO) which is amplified (ZHL-5W-1) to 5W.
The plug beam applied to the atoms has eventually a power of 7W and is focused on the
magnetic trap center, along one of the weak axes (y-direction) of the magnetic trap, see
29

2 Experimental setup
Figure 2.15. Its focal waist is ∼ 20 µm, yielding a potential barrier with a height of ∼ 700µK
for both 6Li and 40K.
The position of the plug beam focus can be regulated via a motor controlled mirror mount
(AG-M100N, Agilis) and a four-quadrant photodiode (2901, Newport), that monitors the
position of the leaking light from a dichroic mirror, see Figure 2.15. A realignment algorithm
was implemented on our control computer and allows for automatic centering of the beam on
the four-quadrant photodiode. The computerized realignment ensures a stable positioning of
the beam focus and compensates for pointing drifts caused by temperature fluctuations.
2.11. RF evaporative cooling
Compared to bosons, the evaporative cooling of fermions is much more problematic, since s-
wave collisions between identical fermions are forbidden and thermalization can thus not take
place. Due to the angular momentum barrier, p-wave collisions are furthermore suppressed
in the limit of low temperatures, typically below T ∼ 6 mK for 6Li and T ∼ 50 µK for40K [10, 157]. At low temperatures, only two different species or two different internal states
can therefore provide high elastic collision rates and are able to thermalize.
Collisions between 6Li and 40K have several drawbacks concerning their thermalization effi-
ciency. Firstly, their mass difference increases the thermalization time by a factor of two [67]
and secondly, their collision cross section is rather modest. Collisions occur in the triplet
channel and have a s-wave scattering length of a = 64.41 a0 [129], resulting in a collision cross
section of σLiK = 1.5 × 10⁻¹⁰m2.
Exclusively the stretched state of 6Li is stable inside a magnetic trap, since spin relaxation
takes place between different trappable spin states [158]. In the case of 40K, however, spin
relaxation is suppressed because of the inverted hyperfine structure [8]. The s-wave scattering
length between the magnetically trappable spin states |F, mF〉 =∣∣9/2, 9/2
⟩and
∣∣9/2, 7/2⟩of
40K is a ∼ 170 a0 [159]. The resulting collision cross section σKK = 1 × 10⁻⁹m2 is thus an
order of magnitude larger than σLiK.
In consequence, we apply the approach presented in [67] for the evaporation of a 6Li-40K
mixture inside a magnetic trap. It consists in evaporating a spin mixture of 40K, while
sympathetically cooling a small cloud of 6Li [158].
In the following we present the technical tools, applied in our experiment in order to perform
RF evaporation in the plugged magnetic quadrupole trap.
2.12. RF system
In the context of RF evaporation of the 40K spin mixture, we need to drive the hyperfine tran-
sitions∣∣9/2, 9/2
⟩→∣∣7/2, 7/2
⟩,∣∣9/2, 7/2
⟩→∣∣7/2, 7/2
⟩and
∣∣9/2, 5/2⟩
→∣∣7/2, 7/2
⟩to transfer
the atoms in dependence on their energy to untrapped states. In a magnetic quadrupole trap,
which has a linear trap potential, the frequency of the RF knife has to increases for addressing
decreasing energy cut values for 40K. The RF evaporation is usually performed at a magnetic
30

2.13 Optical dipole trap
field gradient of B′
z = 280G/cm. For the 40K RF evaporation, we require therefore frequen-
cies ranging from ∼ 1.1GHz, which results in a effective trap depth of some millikelvin, to
1.285GHz, corresponding the hyperfine splitting of the 40K ground states at zero field, see
Figure 2.3.
The radio frequency signal for the RF evaporative cooling of 40K is generated by a digi-
tal signal synthesizer (N5161A MXG ATE, Agilent), that is automatically configurated by
our experimental control, see Section 2.15. Its RF signal output passes a fast switch device
(ZASW-2-50DR+, Minicircuits) and a 30W high-power amplifier (ZHL-30W-252+, Minicir-
cuits). The output of the amplifier is protected by a circulator (RADC-800-2000M-S23-10-
100WR-b, Raditek) that connects the amplifier to the antenna via its input and transmission
port. The corresponding reflection port of the circulator leads to a high power -40 dB atten-
uator (BW-40N100W+, Minicircuits) and a 50Ω termination (KARN-50+, Minicircuits).
In general, an antenna converts signals in the form of varying currents to electromagnetic
radiation. The reflected, as well as the radiated RF power of the antenna strongly depends
on the frequency of the signal to be emitted and the impedance ratio of the antenna and the
feed line. Therefore, the impedance of the 40K RF antenna should be approximately matched
for the frequency range from 1.1 GHz to 1.285 GHz. We installed a λ/2 single-loop antenna
with a diameter of ∼2 cm, that was chosen as half the wavelength of the RF output. The
antenna is made of a Litz wire, being composed of multiple strands insulated electrically from
each other. This reduces the losses caused by two effects that occur for current signals in the
microwave range. First, the skin effect forces the electric current to flow mainly within a small
outer layer of the conductor whose diameter is called the skin depth. Second, the proximity
effect imposes constrains to the regions of current flow in conductors that are closely spaced.
To match the impedance of the antenna for the targeted frequency range, we apply the stub
technique similarly to [160]. In our case, a BNC cable with a loose end, integrated into the
RF circuit via a T-connector, servers as a stub. The length of the BNC cable was adjusted, in
order to optimize the impedance match of the antenna for the targeted frequency range. As
a result, our impedance matched antenna features a low reflectivity in the entire frequency
range from 1.1 GHz to 1.285 GHz.
2.13. Optical dipole trap
In our experimental sequence, the RF evaporative cooling inside an optically plugged magnetic
quadrupole trap was chosen as pre-cooling stage that allows for an efficient transfer of the
atoms into the optical dipole trap (ODT). Besides its strong confinement, an ODT has the
advantage, that the magnetic field becomes a free parameter that can be tuned in order to
increase the collision cross section of the gas in the vicinity of Feshbach resonances [27]. An
ODT relies on the fact that when an atom interacts with a light field that is red(blue) detuned
with respect to an atomic transition, the induced negative(positive) light shift of the atomic
ground state varies spatially with the light intensity [161]. A gradient of the light intensity
therefore induces a dipole force. In the case of a red-detuned light beam the atoms are thus
31

2 Experimental setup
attracted to the region of highest intensity. As a consequence, atoms can be trapped at the
focus of an optical dipole beam.
Our first ODT beam that is applied for loading the atoms from the magnetic quadrupole trap
is a 11W laser beam at a wavelength of 1064 nm which is focused to a beam waist of 42µm.
The light source of the optical dipole beam is a high power, single-mode laser (Mephisto
MOPA 25W, Coherent) with an output power of 25W at a wavelength of 1064 nm. A
80MHz AOM (MCQ80-A2.5-L1064, AA Opto-Electronic) serves as control element of the
beam power in the -1st diffraction order, that is used for the first ODT (ODT1). The
non-diffracted, zero order beam is recycled for a second ODT beam (ODT2), which will be
discussed in Subsection 2.13.2. The AOM, which is specified for high power applications,
includes a quartz crystal with an active aperture of 2.5 × 2.5 mm, supporting a power density
of up to 500MW/cm2. In order to increase the pointing stability and to improve the beam
quality, the ODT1 beam is transferred to the optical table placed around the science cell
via a high-power fiber. This single-mode, polarization-maintaining, photonic crystal fiber
(LMA-PM-10, NKT Photonics) has a length of two meters and is terminated with two high-
power connectors at the fiber input (60FC-SMA-T-4-A11-03, Schafter+Kirchoff) and output
(60FC-SMA-0-M30-37, Schafter+Kirchoff). The fiber coupling efficiency drops to ∼ 60% at
higher powers, and we eventually obtain up to 11W at the fiber output. On the optical
table, see Figure 2.15, a fused silica lens with a focal length of f=200mm (BFPL-200-UV,
Melles-Griot) focuses the beam onto the atomic sample in the science cell.
2.13.1. Power stabilization
The beam power of the ODT is stabilized by the regulator circuit illustrated in Figure 2.14.
The laser beam power is controlled via the power of the 80MHz RF signal applied to the
AOM. The RF signal is generated by a voltage controlled oscillator (VCO) followed by a
voltage variable attenuator (ZX73-2500-S+, Mini-Circuits), a switch (ZAS-1, Mini-Circuits)
and a 20W high-power amplifier (ZHL-20W-13+, Mini-Circuits). The laser power of the
ODT is regulated and stabilized by means of a feedback loop. The beam power is detected
with a photodiode (SM05PD4A, Thorlabs) via a reflection from the glass cell, this signal
being used to regulate the RF power applied to the AOM. For this purpose, the signal of the
photodiode is treated by a logarithmic converter (AD8304, Analog Devices), which outputs a
voltage proportional to the logarithm of the photodiode current. This voltage is transmitted
to the input of a PID controller (SIM960, SRS). The PID controller compares this input
signal to the setpoint that is specified by our settings in the experimental control software.
The PID then outputs a corresponding control voltage to the VVA, modifying the RF signal
strength and thus the AOM efficiency and ODT power. Due to the logarithmic converter we
are able to regulate the laser power over a range of three orders of magnitude.
32

2.14 Optical setup of Science cell
ODT
PD
VCO AMP AOM
Setpoint
Laser
PID
PC
Logarithmic
Converter
SwitchVVA
TTL
VVCO
Figure 2.14: Feedback loop for regulating and stabilizing the power of the ODT beam, as illustratedin [148]. The AOM is driven by a RF circuit composed of a voltage controlled oscillator (VCO), avoltage variable attenuator (VVA), a switch and an amplifier (AMP). The power of a reflection of theODT beam is detected with a photo diode (PD). The photo diode current is converted into a voltageon a logarithmic scale. A PID controller compares this voltage to a setpoint, that is imposed by oursettings in the experimental control software, and outputs a control signal to the VVA, modifyingthe AOM efficiency. Due to the logarithmic converter we are able to regulate the power of the ODTover a range of three orders of magnitude. The switch, which is controlled by a TTL signal from theexperimental control, allows to turn the ODT rapidly on or off.
2.13.2. ODT2
For the second stage of the optical evaporation phase, we transfer the atoms into a crossed
ODT. In this context a second ODT beam (ODT2) had to be implemented. For this purpose,
we recycle the zero order beam of the AOM controlling the power of ODT1. Since the
beam power of ODT1 is considerably decreased during the first optical evaporation stage in
the single beam trap, a large fraction of the infra-red power becomes available in the zero
order beam of the AOM. This beam is recycled and passes through another 80MHz AOM
whose +1st order-beam is utilized for ODT2. The circuit for beam power regulation and
stabilization is analogous to the one for ODT1, see Figure 2.14. The components that were
employed for this circuit are exactly the same, except for the RF amplifier for which a 2W
model (ZHL-1-2W, Mini-Circuits) was used to drive the AOM of ODT2. Having one AOM
per beam at our disposal, both dipole traps can be regulated independently.
2.14. Optical setup of Science cell
In this section we present the optical setup implemented around the science cell. It is mounted
on an U-shaped optical table elevated to the height of the lower transport plate, see Fig-
ure 2.15.
The two thick red paths, whose starting points are designated ODT1 and ODT2 corresponding
to our 1064 nm laser source setup, indicate the beampaths of the crossed dipole trap. Since
both beams originate from the same laser source we have to take precautions in order to avoid
33

2 Experimental setup
CCDCCD PlugBeam
ODT1
λo 2
D1ODT2
Y8ImgX8Img
Y8Img
X8Img
Lattice
y
x
z
λo 2
λo 2
λo 2D2
D4
4Q8D3
4Q8D5
M1
M2
M3
M4
M5
M6
M7
M10
M11
M12
M13
M14
f= 200
f= 200f= 200
f= 200
f= 200
f= 100
f= 100
f= 100
f= 300
f= 60
Mdichb1 Mdichb2
Mdichb5
Mdichb3
Mdichb4
BB
Science6cell
U8Table
MDb8
MDb9
PBS1
PBS2
PBS3DMSP1000 DMSP1000
DMSP1000
Piezo
Piezo
Piezo
Figure 2.15: Scheme of the optical setup surrounding the science cell. The optics are mounted ona U-shaped table elevated to the height of the lower transport plate. The optical setup includes thecrossed optical dipole trap beams ODT1 and ODT2 (red) at 1064 nm, the optical plug for the magneticquadrupole trap (green) at 532 nm, the bichromatic imaging in x- and y-direction (dotted blue) at671 nm and 767 nm, as well as the beam path of the future optical lattice (dark blue). All beamspassing through the glass cell possess an angle of incidence which is non zero in order to avoid directback reflections and corresponding interference effects. Further details can be found in the text.
34

2.15 Computer control system
interference effects and modulation of the crossed trap potential. First of all, the polarisation
axis of ODT2 is turned orthogonal to the polarization of ODT1 by a λ/2 plate. Secondly,
both beams are shifted in frequency, since for ODT1 we utilize the -1st diffraction order of
the first AOM, and the +1st diffraction order of the second AOM is used for ODT2, yielding
a frequency difference of 160MHz. For the purpose of power regulation, see Figure 2.14,
reflections or leaking light of both trapping beams are detected on photodiodes (D1 and D2)
whose current output is converted logarithmically. An additional third photodiode (D4) in
linear operation is employed to monitor ODT1. The off-resonant blue-detuned plug beam is
superimposed with the ODT2 beam via the dichroic mirror Mdich,3 (DMLP567, Thorlabs).
The position of the plug beam focus is monitored by means of a four-quadrant photodiode
(4Q-D5) connected to the control computer and is regulated by a piezo-driven mirror (M4).
This feedback loop is required as the plug beam focus has to precisely cover the magnetic
field zero of the magnetic quadrupole trap. In future, the same technique will be employed in
order to regulate the position of the lattice laser which we plan to superimpose with ODT1
via Mdich,5 (BSR-15-1025, CVI Melles Griot). For this purpose, a back reflection on the glass
cell will be utilized. It is important to note that all beams have a non zero angle of incidence
on the glass cell in order to avoid interference effects by back reflections. These beam angles
are not illustrated in Figure 2.15 for reasons of clarity.
The two bichromatic imaging beams (X-Img, Y-Img), applied for absorption imaging of 6Li
and 40K, are depicted in blue dotted lines, whereas the imaging beam in the vertical z-
direction is not shown. We note that the magnetic trap center is shifted in y-direction with
respect to the science cell center in order to improve the optical access in y-direction. In
this direction, the trap center has a distance of 6.5mm from the glass windows. Due to this
reason, also the laser beam foci are displaced with respect to the cell center. Since the height
of the glass cell amounts to only 18mm, the z-direction has the best optical access. Therefore,
we intend to install a future high resolution objective on this axis.
2.15. Computer control system
We implemented three personal computers for controlling the experiment and acquiring the
resulting data. The first PC controls the experiment by means of an installed control software
and connected National Instruments cards. The second PC receives the raw image data from
the CCD cameras and calculates the normalized absorption profile, see Figure 2.16. The
measured sample properties, like for example the width of the distribution or the integrated
atom number, are extracted and automatically saved to an output file. The third PC accesses
these data files and is exploited for data analysis.
As software driving our experimental control electronics we implemented a modified version
of Cicero Word Generator 1, an open source control software suite particularly programmed
for atomic physics experiments. It offers the possibility to create time sequences via a user
1 http://akeshet.github.io/Cicero-Word-Generator/
35

2 Experimental setup
inteface and runs them on National Instruments cards which provide the corresponding analog
and digital outputs.
Cicero Word Generator consists of two main applications, Cicero and Atticus [162], thus
splitting the task of designing and running output sequences by a client-server architecture.
Cicero is the graphical user interface for editing sequences, whereas Atticus translates these
sequences to output buffers and sends them to the output hardware. Cicero features also list
runs, meaning that parameters can be changed from run to run, while scanning over a set
of values. We extended and customized the source code in order to integrate the control of
special hardware components (like cameras, RF synthesizers, etc.), to add the ability to drive
magnetic transport sequences and to improve the usability of the control software.
The relevant time step durations range from seconds to microseconds during one experimental
sequence. For example, the MOT loading step lasts several seconds, during which none of
the digital or analog channel values is modified, whereas the duration of an imaging pulse
is only ∼ 100 µs. To avoid long redundant buffers which would be generated for a constant
time clock, we synchronize the output cards with a programmable variable clock generator
(XEM 3001, Opal Kelly). This FPGA-card generates the clock pulses only when an output
channel needs to change, while the output cards use this variable timebase as their sample
clock. This reduces the size and generation time of the buffers considerably, and improves
the achievable time resolution to 0.2µs.
For our experiment we employ currently six analog output cards (NI PXI-6713, National
Instruments) and three digital output cards (NI PXI-6533 and NI PXI-6536, National In-
struments). Each of the analog cards has 8 BNC outputs delivering 0 to 10 Volts and up to
250mA. The digital cards have 24 outputs, outputting either 0V or 5V (only 3.3V for NI
PXI-6536). Most of the digital outputs are opto-coupled in order to galvanically isolate the
control electronics from the high current sources in the experiment. Isolation is an important
requirement since fast switching of magnetic coils that are driven by high currents induces
high voltage peaks which can damage the output cards easily.
2.16. Imaging and data acquisition
Several probing techniques were implemented in our experimental system which allow to
perform measurements on the properties of the atomic samples that are prepared by our
experimental sequences. In the following we present the absorption imaging technique, the
fluorescence monitoring and the data acquisition.
2.16.1. Absorption imaging
The atomic density distribution can be probed by measuring the transmission profile Iabs(x, y)
of a near-resonant laser beam that is passing through the atomic sample. This imaging beam
features low intensity and is only shined in during a short duration of 100 µs, resulting in a
relative transmission that remains intensity independent under these conditions. The trans-
mission profile Iabs(x, y) is recorded with a charge-coupled device (CCD) camera featuring a
36

2.16 Imaging and data acquisition
Iabs(x, y) Iref(x, y) Ibg(x, y) T (x, y)
(a) (b) (c) (d)
14.5mm
Figure 2.16: Sample data for absorption imaging, from [148]. The normalized transmission profileT (x, y) is calculated by relating three camera pictures: (a) a picture of the near-resonant probe beamafter absorption by the atomic sample, (b) a picture of the same probe beam in absence of atomsand (c) a background picture without probe beam. The normalized transmission image (d) is thencalculated by Equation (2.1). The image shows a 40K cloud after cooling by the D1 molasses phase,see Chapter 3, and a time of flight of 13ms. The sample is probed with an imaging beam that isdetuned by 1Γ. According to the resulting image, it consists of ∼ 1.3 × 10⁹ 40K atoms featuring atemperature of 11µK.
fast double shutter mode. It needs to be normalized in order to accommodate for the inten-
sity profile of the imaging beam and for ambient stray light reaching the camera. Therefore
two more pictures need to be recorded. First, a reference picture of the unabsorbed imaging
beam giving the intensity profile Iref(x, y). This picture can be taken by either waiting for
the atoms to fall off the field of view or by detuning the imaging beam. Second, a back-
ground picture in the absence of the imaging beam, yielding the background signal Ibg(x, y).
Figure 2.16 shows the three recorded pictures and the calculated, normalized transmission
profile
T (x, y) =Iabs(x, y) − Ibg(x, y)
Iref(x, y) − Ibg(x, y). (2.1)
The transmission profile is directly related to the atomic density distribution n(x, y, z) of the
probed sample by
T (x, y) = exp(−OD(x, y)
)= exp
(−σ
∫n(x, y, z)dz
), (2.2)
where OD(x, y) is the optical density of the atomic sample for the specific imaging beam
and σ is the absorption cross section of the atoms. For low beam intensity (I ≪ Isat), the
absorption cross section is approximately given by
σ = C2 3λ2
2π
1
1 + (2∆ωimg/Γ)2, (2.3)
where C is the Clebsch Gordan coefficient depending on the image beam polarization and
the populations of the magnetic sublevels. λ and ∆ωimg are the wavelength of the atomic
transition and the detuning of the imaging beam from resonance, respectively. In general we
do not spin-polarize the atoms before imaging them in the 3D-MOT chamber. In consequence,
37

2 Experimental setup
C can be expressed as the mean of the squared Clebsch-Gordan coefficients for all possible
transitions. Since we image on the transition∣∣F = 3/2
⟩→∣∣F ′ = 5/2
⟩of 6Li and
∣∣F = 9/2⟩
→∣∣F ′ = 11/2
⟩of 40K, the means of the squared Clebsch-Gordan coefficients are given by C2
Li =
0.5 and C2K = 0.4.
Optical setup
The two beams dedicated for imaging 6Li and 40K in the MOT chamber are superimposed
via a dichroic mirror and subsequently expanded to a 1/e2-diameter of 27.5mm. The bichro-
matic beam is then circularly polarized by a λ/4 plate, thus driving the 22S1/2
∣∣F = 3/2⟩
→22P3/2
∣∣F ′ = 5/2⟩cycling transitions of 6Li and the 42S1/2
∣∣F = 9/2⟩
→ 42P3/2
∣∣F ′ = 11/2⟩
cycling transition of 40K, see Figure 2.2 and 2.3.
The CCD image sensor of our camera (Pixelfly qe (double shutter version), PCO imaging)
contains 1392 × 1024 pixels with a pixel size of 6.45 × 6.45 µm2. The atoms are imaged on
the CCD sensor via a 2-inch lens with a focal length of 6 cm. This lens is placed at a distance
of 21 cm from the MOT center and provides thus a numerical aperture of NA = 0.12. The
magnification of the MOT-imaging system is 1/2.28 ≃ 0.4.
Time-of-flight temperature measurement
In a time-of-flight (TOF) measurement the atoms are released from the trap and expand
freely during a duration tTOF before they are imaged. Under the assumption of a classical
Maxwell-Boltzmann momentum distribution and a collisionless expansion, the 1/e radius of
the atomic cloud evolves as
σi(tTOF) =
√
σ2i (tTOF = 0) +
kBT
mt2TOF , (2.4)
where i ∈ x, y, z indicates the coordinate axes and T is the cloud temperature. The
temperature is determined by taking absorption images for different time-of-flight durations
tTOF and fitting Equation (2.4) to the measured cloud radii.
Data acquisition
The raw images recorded by the CCD camera are processed and saved by a program written
in Python whose initial version was described in detail in [163]. Besides displaying the nor-
malized transmission profile and the density distribution of each camera shot, it integrates
several fit functions. Another program written in Octave is used to automatically calculate
the interesting parameters, like total atom number, cloud size and central optical density.
It analyses all incoming images and saves the results to an output file that is subsequently
accessed by other applications for further data analysis.
38

2.17 Conclusion
2.16.2. Auxiliary fluorescence monitoring
We continuously monitor the emitted MOT fluorescence light for both species with two large
area photo diodes in order to estimate the corresponding atom numbers. The fluorescence
is proportional to the atom number but depends in general also on the number of excited
atoms which is related to the effective MOT beam intensities, detunings and component
ratios. However, the fluorescence signal delivers good estimates, when calibrated to the more
accurate atom number counting by absorption imaging, see Subsection 2.16.1. Moreover, we
monitor the MOT fluorescence also with a video camera that is connected to a TV-screen
to obtain a live image of the atomic sample in the MOT showing its position, size and
shape. Both auxiliary detection systems are convenient tools for optimizing the MOT-beam
alignment and other system parameters as well as for technical error debugging.
2.17. Conclusion
In this chapter we presented the technical components of our experimental setup. We de-
scribed and specified the vacuum system, the optical systems, the atomic sources, optical
and magnetic traps, the magnetic transport, the optical setup around the science cell, the
computer control system and the imaging devices.
39


3 Sub-Doppler laser cooling of alkalines on the
D1-transition
In the previous chapter we stated that the measured phase-space density (PSD), after trapping
and cooling of 6Li and 40K atoms in a double magneto-optical trap, is of the order of 10−7.
Further cooling stages are therefore required in order to achieve the quantum regime with a
PSD ≃ 1. Our intended procedure was to perform evaporative cooling in a plugged magnetic
quadrupole trap after magnetically transporting the atoms to the science cell. However, our
first experimental attempts proved that the initial temperature of the atomic sample was
too high, and thus its density too low, in order to achieve a sufficiently large elastic collision
rate for rendering the evaporation process efficient. Therefore, we sought for implementing
an intermediate cooling step, like for instance sub-Doppler cooling, that could enhance the
initial collision rate. Due to the lack of ordinary sub-Doppler cooling schemes for 6Li and 40K,
we were in search of alternatives and discovered eventually a novel mechanism based on a
gray molasses scheme [164,165]. We showed that by adopting this cooling technique the PSD
was increased by almost three orders of magnitude compared to the MOT, which provided
significantly better conditions for performing efficient evaporative cooling of 6Li and 40K.
Consequently, this chapter presents our new, three-dimensional optical molasses scheme for
simultaneous sub-Doppler cooling of fermionic 6Li and 40K [139, 140]. This cooling scheme
operates on the D1 line, relies on gray optical molasses cooling and applies in principle to all
alkali atoms. It is a simple and robust technique, resulting in a phase space density on the
order of 10−4 for both atomic species, if it is combined with a preceding CMOT phase for
enhancing the atomic density, see Subsection 2.7.1. In particular, we will show that the two
molasses do not affect each other. This cooling scheme therefore allows for efficient direct
loading of magnetic and optical dipole traps. Especially experiments working with alkali
atoms which feature a narrow hyperfine structure of the P3/2 excited level, hindering efficient
sub-Doppler cooling on the D2 line, can profit from the D1 molasses technique, as the large
gain in temperature offers a promising route for fast evaporation to quantum degeneracy.
Besides this introductory summary, this chapter includes the printed paper manuscripts of
the following articles, which present our experimental and theoretical investigations in detail:

3 Sub-Doppler laser cooling of alkalines on the D1-transition
Sub-Doppler laser cooling of fermionic 40K atoms in three-dimensional gray
optical molasses, see page 47 for print version
D. R. Fernandes, F. Sievers, N. Kretzschmar, S. Wu, C. Salomon and F. Chevy
EPL (Europhysics Letters) 100, 63001 (2012)
Simultaneous sub-Doppler laser cooling of fermionic 6Li and 40K on the D1 line:
Theory and experiment, see page 53 for print version
F. Sievers, N. Kretzschmar, D. R. Fernandes, D. Suchet, M. Rabinovic, S. Wu, C. V. Parker,
L. Khaykovich, C. Salomon and F. Chevy
Phys. Rev. A 91, 023426 (2015)
In these publications we detail in particular our investigation of the dependence of both the
final temperature of the atomic cloud and the photon scattering rate on the Raman-detuning,
thus revealing the importance of the Raman-resonance condition.
For zero Raman-detuning, long lived coherences between hyperfine states are established, gen-
erating a new class of dark states. This Λ-enhancement leads to additional cooling forces and
reduced photon scattering, yielding an improved cooling efficiency and a lower temperature
limit. We compare the experimental data to numerical results of a semiclassical MonteCarlo
wavefunction simulation. This simulation accounts for all relevant Zeeman sublevels and the
three dimensional σ+–σ− counter-propagating beam configuration. As a result, we can state
a good qualitative agreement between the experimental outcomes and the simulation.
In addition to the published cooling procedures for 6Li and 40K, we used the D1 molasses
scheme to cool bosonic 41K. We cooled all 5 × 10⁹ 41K atoms from a CMOT to a final
temperature of 40 µK leading to a phase-space density of 0.4 × 10⁻⁴. We note, that the final
temperature could probably be lower for 41K, since at the time when this measurement was
performed, the ambient magnetic bias fields were not perfectly compensated.
To date, several other research groups implemented our D1 cooling scheme to improve the
performance of their experiments working with 6Li [166], 7Li [167] 1 and 39K [168–170]. In
addition, this scheme might allow for the implementation of single-atom resolved imaging of
fermions in a pinning lattice, as was shown by the group of Stefan Kuhr in Glasgow working
with 40K ([171] and private communication).
In dual-species operation, the presence of the other species reduces the number of atoms in
the MOT by 4 % for 6Li and by 10 % for 40K. During the CMOT and the D1 molasses phase,
however, no detrimental mutual influence is observed. Neither the relative atom numbers
nor the temperatures are altered in dual-species operation when compared to single-species
operation. This might be explained by the short duration of the CMOT and the molasses
phase, which both last only some milliseconds.
Table 3.1 outlines the resulting performance parameters for the consecutive sequence steps in
dual species-operation. The D1 molasses phase largely reduces the temperature of both the
1 The D1 molasses scheme is also applied for 7Li by Ketterle at MIT, Cambridge, United States (privatecommunication).
42

6Li and the 40K sample, while the compressed cloud-size resulting from the CMOT phase is
preserved. A phase-space density of almost 10−4 is thus obtained for both species permitting
efficient, direct loading of an optical dipole trap [169].
T N n φ
(µK) (×109) (×1010 cm−3) (×10−5)
Potassium (40K)
MOT 240 3.2 7 0.02
CMOT 2000 3.2 37 0.06
Molasses 11 3.2 30 10.7
Lithium (6Li)
MOT 1000 2.0 2.6 0.03
CMOT 800 2.0 18 0.29
Molasses 48 1.2 7.6 8.2
Table 3.1. – Main performance parameters of 6Li and 40K for the consecutive sequencesteps in dual species operation. The listed parameters are the optimum temperature T , theatom number N , the density n and the phase-space density φ. We note that the indicatedphase-space density does not account for the different magnetic sublevels and is calculatedas φ = nλ3
B, with the thermal de Broglie wavelength λB.
43


Appendix 3.A Publications
Sub-Doppler laser cooling of fermionic 40K atoms in three-dimensional gray
optical molasses, see page 47 for print version
D. R. Fernandes, F. Sievers 1, N. Kretzschmar, S. Wu, C. Salomon and F. Chevy
EPL (Europhysics Letters) 100, 63001 (2012)
Simultaneous sub-Doppler laser cooling of fermionic 6Li and 40K on the D1 line:
Theory and experiment, see page 53 for print version
F. Sievers, N. Kretzschmar, D. R. Fernandes, D. Suchet, M. Rabinovic, S. Wu, C. V. Parker,
L. Khaykovich, C. Salomon and F. Chevy
Phys. Rev. A 91, 023426 (2015)
45


December 2012
EPL, 100 (2012) 63001 www.epljournal.org
doi: 10.1209/0295-5075/100/63001
Sub-Doppler laser cooling of fermionic 40K atoms
in three-dimensional gray optical molasses
D. Rio Fernandes1(a),(b), F. Sievers1(a),(c), N. Kretzschmar1, S. Wu2, C. Salomon1 and F. Chevy1
1 Laboratoire Kastler-Brossel, Ecole Normale Superieure, CNRS and UPMC - 24 rue Lhomond
75005 Paris, France, EU2 Department of Physics, College of Science, Swansea University - Swansea, SA2 8PP UK, EU
received 4 October 2012; accepted in final form 23 November 2012published online 20 December 2012
PACS 37.10.De – Atom cooling methodsPACS 37.10.Gh – Atom traps and guidesPACS 67.85.-d – Ultracold gases, trapped gases
Abstract – We demonstrate sub-Doppler cooling of 40K on the D1 atomic transition. Using agray-molasses scheme, we efficiently cool a compressed cloud of 6.5× 10⁸ atoms from ∼ 4mK to20µK in 8ms. After transfer to a quadrupole magnetic trap, we measure a phase space density of∼ 10−5. This technique offers a promising route for fast evaporation of fermionic 40K.
editor’s choice Copyright c© EPLA, 2012
Introduction. – Cooling of fermionic atomic specieshas played a fundamental role in the study of stronglycorrelated Fermi gases, notably through the experimen-tal exploration of the BCS-BEC crossover, the observa-tion of the Clogston-Chandrasekhar limit to superfluidity,the observation of the Mott-insulator transition in opti-cal lattices, and the study of low-dimensional systems (seefor instance [1,2] for a review). When the temperature isfurther decreased, new exotic phases are predicted (p-wavesuperfluids for spin imbalanced gases, antiferromagneticorder . . . [1,3,4]) and, as a consequence, intense experi-mental effort is currently under way to push the tempera-ture limit achieved in ultracold fermionic samples in orderto enter these novel regimes.Most experiments on quantum degenerate gases begin
with a laser cooling phase that is followed by evaporativecooling in a non-dissipative trap. Achieving quantumdegeneracy depends critically on the collision rate at theend of the laser cooling phase and sub-Doppler cooling [5]is often a key ingredient for initiating efficient evaporation.In the case of fermionic lithium-6 and potassium-40, thenarrow hyperfine structure of the P3/2 excited level doesnot allow for efficient Sisyphus sub-Doppler cooling to thered of a F → F ′ = F +1 atomic transition [6,7].Experiments for producing quantum degenerate gases
of 40K typically start with ∼ 108 atoms laser-cooled
(a)These authors contributed equally to this work.(b)E-mail: [email protected](c)E-mail: [email protected]
to the Doppler limit (145µK) [8]. More refined laser-cooling schemes have produced 40K temperaturesof ∼ 15µK, but with only reduced atom numbers(∼ 107) [7,9,10]. This relatively poor efficiency is due to thecombination of the fairly narrow and inverted hyperfinelevel structure of the P3/2 excited state which results inthe washing out of the capture velocity of the molasseswhen the laser detuning is increased [11]. To overcomethese limitations, two groups recently realized Magneto-Optical Traps (MOT) in the near-UV and blue regions ofthe spectrum to cool 6Li [12] and 40K [13], respectively.The associated transitions, being narrower than theirD2 counterparts, lead to a smaller Doppler temperatureand were used to improve the final phase space densitytypically by one order of magnitude.In this letter, we report efficient sub-Doppler cooling of
40K atoms using gray molasses on the D1 atomic transitionat 770 nm. Thanks to the much reduced fluorescencerate compared to standard bright sub-Doppler molasses,we could produce cold and dense atomic samples. Thetemperature of a tightly compressed cloud of 6.5× 10⁸atoms was decreased from ∼ 4mK to 20µK in 8mswithout significant change of the density in the process.After transfer to a quadrupole magnetic trap, we achieveda phase space density of ∼ 2× 10⁻⁵.
Gray molasses. – Sub-Doppler cooling using graymolasses was proposed in ref. [14] and realized in the mid1990s on the D2 atomic transition of cesium and rubidium,allowing one to cool atomic samples close to 6 times the
63001-p1

D. Rio Fernandes et al.
Fig. 1: Gray-molasses scheme. On a F → F ′ = F or F → F ′ =F − 1 optical transition with positive detuning, the groundstate splits into a dark and a bright manifold with positiveenergy, shown as |ψD〉 and |ψB〉, respectively. In the presenceof a polarization gradient, the bright-state energy is spatiallymodulated. Like in Sisyphus cooling, energy is lost when anatom in |ψB〉 climbs a potential hill before being pumped backinto the dark state |ψD〉. Motional coupling between |ψD〉 and|ψB〉 occurs preferentially at the potential minima.
single-photon recoil energy [15–17]. For an atomic groundstate with angular momentum F , gray molasses operateon the F → F ′ = F (F → F ′ = F − 1) optical transition.For any polarization of the local electromagnetic field,the ground-state manifold possesses one (two) dark stateswhich are not optically coupled to the excited state bythe incident light [14,18]. When the laser is detuned tothe blue side of the resonance, the ground-state manifoldsplits into dark states which are not affected by light andbright states which are light-shifted to positive energy byan amount which depends on the actual polarization andintensity of the laser field (see fig. 1).When the atom is in a bright state, it climbs up the hill
of the optical potential before being pumped back to thedark state near the top of the hill. The kinetic energy ofthe atom is thus reduced by an amount of the order of theheight of the optical potential barrier. The cooling cycleis completed near the potential minima by a combinationof motional coupling and optical excitation to off-resonanthyperfine states.We implement 3D gray-molasses cooling in 40K on the
D1 transition (see fig. 2). In alkali atoms, the P1/2 excitedlevel manifold has only two hyperfine states, which arebetter resolved than their P3/2 counterparts. These factsallow for less off-resonant excitation and a good controlof the cooling mechanism. A first laser beam (coolingbeam) is tuned to the |2S1/2, F = 9/2〉→ |2P1/2, F ′ = 7/2〉transition with a detuning δ > 0. A second laser beam
Fig. 2: Level scheme for the D1 transition of40K and transitions
used for gray-molasses cooling. The laser detuning from thecooling/repumping transitions is δ and the detuning from theoff-resonant excited hyperfine state F ′ = 9/2 is δ2 (see text).
(repumping beam) is tuned to the |2S1/2, F = 7/2〉→|2P1/2, F ′ = 7/2〉 transition with the same detuning δ.As mentioned above, two mechanisms can lead to the
departure from the dark state. The first one is the motionalcoupling Vmot due to the spatial variations of the darkstate internal wave function induced by polarization andintensity gradients. The second one is the dipolar couplingVoff via off-resonant excited hyperfine states. A roughestimate shows that Vmot ≃ kv, where v is the velocityof the atom and k the wave vector of the cooling light,while Voff ≃ Γ (Γ/δ2) I/Isat, where Γ−1 is the lifetime ofthe excited state, I the light intensity, Isat the saturationintensity and δ2 the detuning to off-resonant excitedstate. Comparing the two couplings, we see that themotional coupling is significant in the high velocity regimev Γ/k (Γ/δ2) I/Isat. In our case, the off-resonant levelF ′ = 9/2 (see fig. 2) is detuned by δ2 = 155.3MHz+ δfrom the cooling transition |2S1/2, F = 9/2〉→ |2P1/2, F ′ =7/2〉. For I ≃ Isat, motional coupling dominates for T 50µK, meaning that both processes are expected to bepresent in our experiments. In general, the transition ratebetween |ψD〉 and |ψB〉 induced by motional coupling Vmotand the off-resonant coupling Voff are both maximal whenthe distance between the dark and bright manifolds issmallest, which favors transitions near the bottom of thewells of the optical lattice.In 40K, the simplified discussion presented so far must
be generalized to the case involving many hyperfine states(10+8). However, the essential picture remains valid.
63001-p2

Sub-Doppler laser cooling of fermionic 40K atoms
Indeed, by numerically solving the optical Bloch equationsfor the 40K system in the presence of the cooling andrepumping laser fields, we obtain the light shifts ǫ and thetotal optical pumping rates γ of all the dressed states foran atom at rest (see fig. 3). This is done for the particularcase of a one-dimensional optical lattice in the lin⊥linconfiguration and with a low repumping intensity (1/8 ofthe cooling beam intensity, typical for our experiments).In fig. 3a) we see 8 bright states, 2 weakly coupled statesand 8 dark states combining both hyperfine manifolds.In fig. 3b) we plot the optical pumping rates of thecorresponding dressed states. We find that the opticalpumping rate is low for the weakly coupled states andit practically vanishes for the dark states. In fig. 3c)the optical pumping rates display a good correlationwith the light shift magnitude, which favors efficient sub-Doppler cooling. Note also the long-lived dark states. Thiscorrelation shows that the gray-molasses picture remainsvalid for this more complex level scheme.We now turn to the question of the capture velocity of
the gray-molasses scheme. Let Γ′ be the optical pumpingrate from bright to dark states. The atom is pumpedefficiently towards dark states if it stays a time τ Γ
′−1
near the top of the hill. If the atom moves at a velocityv in the lattice, then τ ≃ 1/kv and the optical pumpingto dark states is efficient when kv Γ′. vc ≃ Γ′/k thusdefines the capture velocity of the gray molasses. For abeam with detuning δ to the main cooling transition,Γ′ ∝ I/δ2 and thus vc increases with laser intensity. Onthe other hand, the cooling efficiency is reduced when theatom cannot climb the potential hill anymore, which leadsto an equilibrium temperature that scales as kBT ∝ I/δ,when T ≫ TRecoil = 2k2/2mkB [5,19].
Experimental results. – Our setup is based onthe apparatus presented in [20]. In the experimentspresented here, 6.5× 10⁸ 40K atoms are loaded froma two-dimensional magneto-optical trap (2D-MOT)into a three-dimensional magneto-optical trap (MOT)operating on the D2 line. The initial temperature of thecloud is 200µK, not far from the Doppler temperatureTD = Γ/2kB = 145µK, with Γ/2π≈ 6.035 MHz. In theMOT, the cooling and repumping laser intensities areIcool = 13Isat and Irepump = Icool/20 per beam, withIsat = 1.75 mW/cm
2. After the loading phase, we rampthe magnetic field gradient from 9G · cm−1 to 60G · cm−1in 5ms without changing the laser detunings in order tocompress the cloud. This process yields a cloud with highdensity, but with a much higher temperature of ∼ 4mK.At this point the magnetic field is switched off in ≃ 100µsand the D1 molasses beams are switched on for a time τm.The D1 cooling and repumping beams are detuned by
the same amount δ in the range of 2Γ–5Γ as shown in fig. 2.The repumping beam is detuned from the main coolingbeam by 1285.8MHz using an electro-optical modulator.Its intensity is typically 1/8 of the cooling beam intensity.After propagation through an optical fiber, the total D1
0.0 0.1 0.2 0.3 0.4 0.50
1
2
3
4
5
6
z
MH
z
a
5 23 2
1 2
1 2
3 2
5 2
7 2
9 2
5 23 2
1 2
1 2
3 2
5 2
7 2
9 2
0.0 0.1 0.2 0.3 0.4 0.5
0.0
0.5
1.0
1.5
2.0
2.5
3.0
3.5
z
s1
b
0 1 2 3 4 5
0.0
0.5
1.0
1.5
2.0
2.5
3.0
MHz
s1
c
Fig. 3: (Color online) Semi-classical calculation of the effectof dual frequency counterpropagating laser beams in a 1Dlin⊥lin configuration on a 40K atom at rest. a) Light shiftsǫ vs. position; b) optical pumping rates γ; c) optical pumpingrates vs. light shifts. The laser intensities are Icool = 20Isat andIrepump = Icool/8 per beam, with δ=+3Γ. The different linescorrespond to the 18 dressed states of the 2S1/2 ground state.At z = λ/8 the local polarization is σ+ and here each curvecorresponds to a pure mF state. At this position the light shiftincreases with −mF . The |
2S1/2, F = 7/2〉 manifold interactsonly weakly with light since the repumping beam is kept at lowintensity. Consequently, the light shifts and optical pumpingrates are small.
optical power is 240mW and the beam is magnified toa waist of 1.1 cm. We then split the beam into twovertical beams and two retro-reflected horizontal beams ina three-dimensional σ+/σ− configuration. The maximumD1 cooling intensity per beam attained in our experimentsis 25mW/cm
2or I = 14Isat.
We first measure the atom number and temperatureof the D1 molasses as a function of the cooling beam
63001-p3
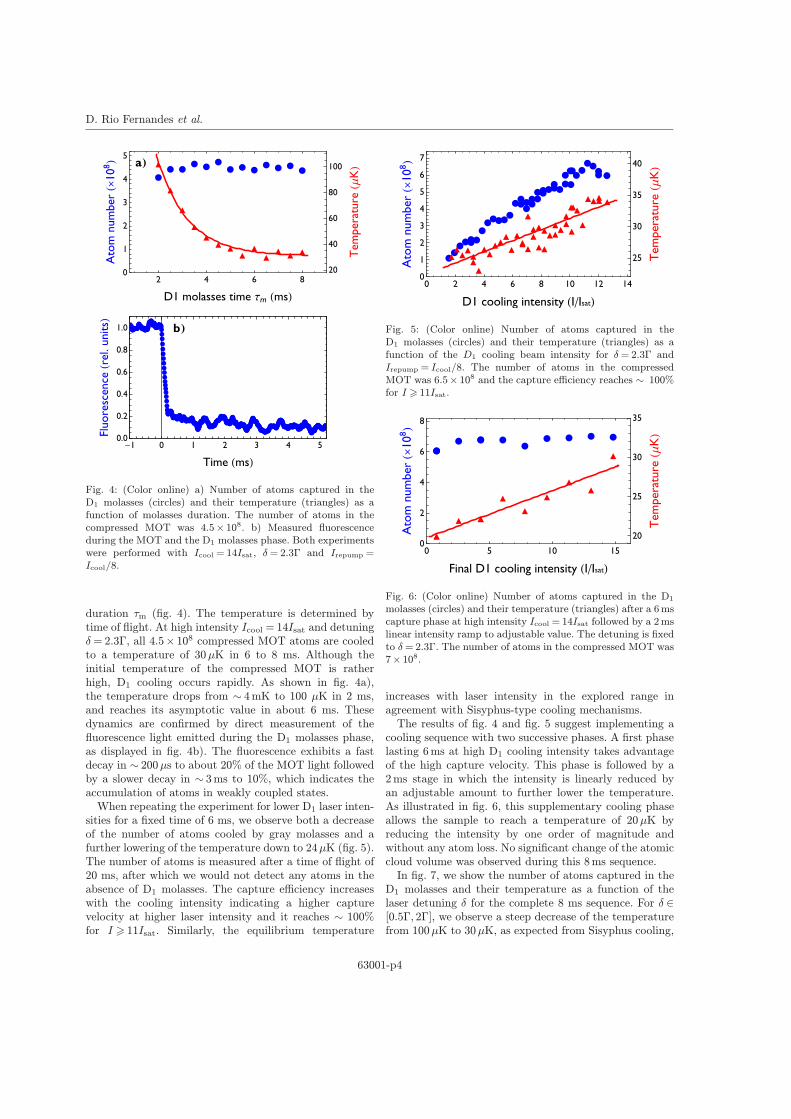
D. Rio Fernandes et al.
2 4 6 80
1
2
3
4
5
D1 molasses time m ms
Ato
mnum
ber
10
8
20
40
60
80
100
Tem
pera
ture
K
a
1 0 1 2 3 4 50.0
0.2
0.4
0.6
0.8
1.0
Time ms
Flu
ore
scence
rel.
units
b
Fig. 4: (Color online) a) Number of atoms captured in theD1 molasses (circles) and their temperature (triangles) as afunction of molasses duration. The number of atoms in thecompressed MOT was 4.5× 10⁸. b) Measured fluorescenceduring the MOT and the D1 molasses phase. Both experimentswere performed with Icool = 14Isat, δ= 2.3Γ and Irepump =Icool/8.
duration τm (fig. 4). The temperature is determined bytime of flight. At high intensity Icool = 14Isat and detuningδ= 2.3Γ, all 4.5× 10⁸ compressed MOT atoms are cooledto a temperature of 30µK in 6 to 8 ms. Although theinitial temperature of the compressed MOT is ratherhigh, D1 cooling occurs rapidly. As shown in fig. 4a),the temperature drops from ∼ 4mK to 100 µK in 2 ms,and reaches its asymptotic value in about 6 ms. Thesedynamics are confirmed by direct measurement of thefluorescence light emitted during the D1 molasses phase,as displayed in fig. 4b). The fluorescence exhibits a fastdecay in ∼ 200µs to about 20% of the MOT light followedby a slower decay in ∼ 3ms to 10%, which indicates theaccumulation of atoms in weakly coupled states.When repeating the experiment for lower D1 laser inten-
sities for a fixed time of 6 ms, we observe both a decreaseof the number of atoms cooled by gray molasses and afurther lowering of the temperature down to 24µK (fig. 5).The number of atoms is measured after a time of flight of20 ms, after which we would not detect any atoms in theabsence of D1 molasses. The capture efficiency increaseswith the cooling intensity indicating a higher capturevelocity at higher laser intensity and it reaches ∼ 100%for I 11Isat. Similarly, the equilibrium temperature
0 2 4 6 8 10 12 140
1
2
3
4
5
6
7
D1 cooling intensity I Isat
Ato
mnum
ber
10
8
25
30
35
40
Tem
pera
ture
K
Fig. 5: (Color online) Number of atoms captured in theD1 molasses (circles) and their temperature (triangles) as afunction of the D1 cooling beam intensity for δ= 2.3Γ andIrepump = Icool/8. The number of atoms in the compressedMOT was 6.5× 10⁸ and the capture efficiency reaches ∼ 100%for I 11Isat.
0 5 10 150
2
4
6
8
Final D1 cooling intensity I Isat
Ato
mnum
ber
10
8
20
25
30
35
Tem
pera
ture
K
Fig. 6: (Color online) Number of atoms captured in the D1molasses (circles) and their temperature (triangles) after a 6mscapture phase at high intensity Icool = 14Isat followed by a 2mslinear intensity ramp to adjustable value. The detuning is fixedto δ= 2.3Γ. The number of atoms in the compressed MOT was7× 108.
increases with laser intensity in the explored range inagreement with Sisyphus-type cooling mechanisms.The results of fig. 4 and fig. 5 suggest implementing a
cooling sequence with two successive phases. A first phaselasting 6ms at high D1 cooling intensity takes advantageof the high capture velocity. This phase is followed by a2ms stage in which the intensity is linearly reduced byan adjustable amount to further lower the temperature.As illustrated in fig. 6, this supplementary cooling phaseallows the sample to reach a temperature of 20µK byreducing the intensity by one order of magnitude andwithout any atom loss. No significant change of the atomiccloud volume was observed during this 8ms sequence.In fig. 7, we show the number of atoms captured in the
D1 molasses and their temperature as a function of thelaser detuning δ for the complete 8 ms sequence. For δ ∈[0.5Γ, 2Γ], we observe a steep decrease of the temperaturefrom 100µK to 30µK, as expected from Sisyphus cooling,
63001-p4

Sub-Doppler laser cooling of fermionic 40K atoms
0 1 2 3 4 50
1
2
3
4
5
6
Detuning
Ato
mnum
ber
10
8
20
40
60
80
100
Tem
pera
ture
K
Fig. 7: (Color online) Number of atoms captured in the D1molasses (circles) and their temperature (triangles) for thedynamic 8 ms cooling sequence as a function of the detuningδ. The number of atoms in the compressed MOT was 6× 10⁸.
followed by a plateau near 30µK for detunings above2Γ. The capture efficiency raises sharply to ∼ 100% atδ∼ 2.3Γ, displays a broad maximum and slowly decreasesabove 4Γ, indicating a decrease of the capture velocity.We have also scanned the intensity and the detuning
of the repumping laser. We observe a very weak depen-dence of the molasses temperature and capture fractionupon repumping intensity. On the other hand, when scan-ning the repumper detuning, we observe that cooling isoptimal within 300 kHz from the exact Raman condi-tion. This points to the existence of long-lived coherencesbetween the two hyperfine manifolds |2S1/2, F = 9/2〉 and|2S1/2, F = 7/2〉, resulting in the formation of new inter-manifold dark states. Finally, optimal parameters for 40Kgray molasses are summarized in table 1.We checked that the minimum temperature of 20µK
is not limited by residual magnetic fields nor by atomicdensity. We found that the residual magnetic field duringthe D1 molasses should be minimized. Indeed, introducinga small tunable bias magnetic field B in the vertical direc-tion, the D1 molasses temperature increased quadraticallyas ∆T ≈ 80B2µK/G2. For this reason, the stray magneticfield was cancelled to less than 100 mG in three direc-tions using compensation coils. We also searched for adensity dependent temperature limitation and observedno significant temperature change when the density wasreduced by a factor of 4 from n0 ∼ 2× 1010cm−3. Model-ing gray-molasses cooling in three dimensions in order tounderstand the temperature limit remains today an openproblem.
Magnetic trapping. – After the D1 molassesphase, the atoms are optically pumped to the|2S1/2, F = 9/2,mF = 9/2〉 stretched state and thentransferred into a quadrupole magnetic trap. The σ+
polarized optical pumping laser beams are pulsed for120µs in the presence of a bias magnetic field. After thisphase, the trap axial magnetic field gradient is raisedfrom 0 to 37G · cm−1 in 3 ms, followed by a compression
Table 1: Optimized parameters for 40K D1 gray molasses. Usingthese parameters, all the 6.5× 10⁸ atoms from a compressedMOT are cooled to 20µK in D1 gray molasses.
Duration (ms) Icool(Isat) δ(Γ)
Capture phase 6 14 +2.3Cooling phase 2 14→1 +2.3
to 76 G·cm−1 in 147 ms and a thermalization stagelasting 350 ms during which the field gradient remainsconstant. At this point we detect 2.5× 10⁸ atoms ata temperature of 80µK. Assuming that all atoms arein the |F = 9/2,mF = 9/2〉 stretched state, the centralphase-space density is PSD= n0λ
3dB ≈ 2× 10⁻⁵. In the
absence of gray-molasses phase, the central phase-spacedensity is about 100 times lower. From the p-wavecross-section σ≈ 2× 10⁻¹¹ cm2 at a temperature of 80µKmeasured in [21], we estimate the trap averaged initialcollision rate to be γcoll = n0σv/8
√2≈ 23 s−1. This rate
is quite favorable for initiating evaporative cooling.
Conclusion. – We have shown that gray molassesoperating on the D1 optical transition is a very simpleand powerful method to increase the phase space densityof laser-cooled 40K alkali gases to ∼ 10−5. This phasespace density leads to excellent starting conditions forevaporative cooling in magnetic or optical dipole traps.For 40K, this is particularly useful as the low temperatureallows direct transfer into an optical trap and magnetictuning to a Feshbach resonance for efficient evaporation.Moreover, our results open the way for sub-Dopplercooling of other atoms with narrow P3/2 excited states,such as 6Li and 7Li. We already have experimentalevidence for sub-Doppler D1 cooling of
6Li and 7Li andthis will be the subject of a future publication.
∗ ∗ ∗
We acknowledge useful discussions with J. V. Porto,J. Dalibard, L. Khaykovich and D. Suchet. Weacknowledge support from Region Ile de France (IFRAF),EU (ERC advanced grant Ferlodim) and Institut Univer-sitaire de France. DRF acknowledges the support ofFundacao para a Ciencia e Tecnologia (FCT-Portugal),through the grant number SFRH/BD/68488/2010.
REFERENCES
[1] Inguscio M., Ketterle W. and Salomon C. (Editors),Ultracold Fermi gases, in Proceedings of the InternationalSchool of Physics “Enrico Fermi”, Course CLXIV (IOSPress, Societa Italiana di Fisica) 2006.
[2] Bloch I., Dalibard J. and Zwerger W., Rev. Mod.Phys., 80 (2008) 885.
63001-p5

D. Rio Fernandes et al.
[3] Bulgac A., Forbes M. M. and Schwenk A., Phys. Rev.Lett., 97 (2006) 020402.
[4] Werner F., Parcollet O., Georges A. and HassanS. R., Phys. Rev. Lett., 95 (2005) 056401.
[5] Dalibard J. and Cohen-Tannoudji C., J. Opt. Soc.Am. B, 6 (1989) 2023.
[6] Lin Z., Shimizu K., Zhan M., Shimizu F. and TakumaH., Jpn. J. Appl. Phys., 30 (1991) L1324.
[7] Modugno G., Benko C., Hannaford P., Roati G.and Inguscio M., Phys. Rev. A, 60 (1999) R3373.
[8] DeMarco B. and Jin D. S., Science, 285 (1999) 1703.[9] Taglieber M., Voigt A.-C., Aoki T., Hansch T. W.and Dieckmann K., Phys. Rev. Lett., 100 (2008)010401.
[10] Gokhroo V., Rajalakshmi G., Easwaran R. K. andUnnikrishnan C. S., J. Phys. B: At. Mol. Opt. Phys.,44 (2011) 115307.
[11] Landini M., Roy S., Carcagn L., Trypogeorgos D.,Fattori M., Inguscio M. andModugno G., Phys. Rev.A, 84 (2011) 043432.
[12] Duarte P., Hart R., Hitchcock J., Corcovilos T.,Yang T.-L., Reed A. and Hulet R., Phys. Rev. A, 84(2011) 063420.
[13] McKay D., Jervis D., Fine D., Simpson-Porco J.,Edge G. and Thywissen J., Phys. Rev. A, 84 (2011)063420.
[14] Grynberg G. and Courtois J.-Y., Europhys. Lett., 27(1994) 41.
[15] Boiron D., Meacher D. and Verkerk P., Phys. Rev.A, 52 (1995) 3425.
[16] Esslinger T., Sander F., Hemmerich A., Hansch T.W., Ritsch H. and Weidemuller M., Opt. Lett., 21(1996) 991.
[17] Boiron D., Michaud A., Lemonde P., Castin Y.,Salomon C., Weyers S., Szymaniec K., Cognet L.
and Clairon A., Phys. Rev. A, 53 (1996) R3734.[18] Ol’shani M. andMinogin V., Opt. Commun., 89 (1992)
393.[19] Castin Y. and Dalibard J., Europhys. Lett., 14 (1991)
761.[20] Ridinger A., Chaudhuri S., Salez T., Eismann U.
Fernandes D., Magalhaes K., Wilkowski D.,
Salomon C. and Chevy F., Eur. Phys. J. D, 242 (2011)223.
[21] DeMarco B., Bohn J. L., Burke J. P., Holland M.and Jin D. S., Phys. Rev. Lett., 82 (1999) 4208.
63001-p6

PHYSICAL REVIEW A 91, 023426 (2015)
Simultaneous sub-Doppler laser cooling of fermionic 6Li and 40K on the D1 line:
Theory and experiment
Franz Sievers,1,* Norman Kretzschmar,1 Diogo Rio Fernandes,1 Daniel Suchet,1 Michael Rabinovic,1 Saijun Wu,2,†
Colin V. Parker,3 Lev Khaykovich,4 Christophe Salomon,1 and Frederic Chevy1
1Laboratoire Kastler Brossel, Ecole Normale Superieure, CNRS, UPMC, 24 rue Lhomond, 75005 Paris, France2State Key Laboratory of Surface Physics and Department of Physics, Fudan University, 200433 Shanghai, People’s Republic of China
3James Franck Institute, Enrico Fermi Institute and Department of Physics, University of Chicago, Chicago, Illinois 60637, USA4Department of Physics, Bar-Ilan University, Ramat-Gan 52900, Israel
(Received 30 October 2014; revised manuscript received 30 January 2015; published 23 February 2015)
We report on simultaneous sub-Doppler laser cooling of fermionic 6Li and 40K using the D1 optical transitions.
We compare experimental results to a numerical simulation of the cooling process applying a semiclassical Monte
Carlo wave-function method. The simulation takes into account the three-dimensional optical molasses setup and
the dipole interaction between atoms and the bichromatic light field driving the D1 transitions. We discuss the
physical mechanisms at play, identify the important role of coherences between the ground-state hyperfine levels,
and compare D1 and D2 sub-Doppler cooling. In 5 ms, the D1 molasses phase greatly reduces the temperature
for both 6Li and 40K at the same time, with final temperatures of 44 and 11 μK, respectively. For both species
this leads to a phase-space density close to 10−4. These conditions are well suited to direct loading of an optical
or magnetic trap for efficient evaporative cooling to quantum degeneracy.
DOI: 10.1103/PhysRevA.91.023426 PACS number(s): 37.10.De, 32.80.Wr, 67.85.−d
I. INTRODUCTION
The road towards quantum degeneracy in atomic gases
usually starts with a laser cooling and trapping phase. The
resulting initial phase-space density of the atomic ensemble
and the initial collision rate should be as high as possible for
initiating efficient evaporative cooling to quantum degeneracy.
Sub-Doppler cooling has proven to be a powerful technique
to increase the phase-space density of most alkali atoms and
other atoms with multiple-level structure [1–3]. However, in
the case of lithium and potassium, the narrow excited-state
structure of the D2 transition compromises the efficiency
of this cooling scheme [4,5]. Both species possess stable
fermionic and bosonic isotopes, and they play an important role
in recent experimental studies of strongly correlated quantum
gases. Thus, important efforts have been devoted to searching
for alternative laser cooling schemes.
For instance, it has recently been shown that three-
dimensional (3D) Sisyphus cooling for 7Li, some gigahertz red
detuned from the D2 line, can lead to temperatures as low as
100 μK, with up to 45% of the atoms in the cooled fraction [6].
A second option is to operate the magneto-optical trap (MOT)
on a transition with a smaller linewidth to reduce the Doppler
temperature [7–9]. Such transitions exist for 6Li and 40K in
the near-UV and blue regions of the spectrum, respectively,
leading to temperatures of 33 μK for 6Li and 63 μK for 40K.
Yet, special optics and a coherent source at 323 nm for 6Li and
at 405 nm for 40K are needed for this approach. Additionally,
at these wavelengthes the available power is still a limiting
factor.
More recently a simpler sub-Doppler cooling scheme using
blue-detuned molasses operating on the D1 line was proposed
and demonstrated on 40K [10] and has been extended to other
*[email protected]†[email protected]
atomic species such as 7Li [11], 39K [12,13], and 6Li [14].
Using this technique, temperatures as low as 20 μK (40K),
50 μK (7Li), 6 μK (39K), and 40 μK (6Li) were reached.
Even though the main ingredients of the D1 cooling scheme
are now understood at a qualitative level, in particular, the role
of the coherences between hyperfine ground-state levels [11],
a complete picture, taking into account the full level structure
of the atoms, is still missing. In this paper, we present a 3D
semiclassical solution of the optical Bloch equations that takes
into account the full set of relevant energy levels of alkali
atoms and we apply it to the case of 6Li and 40K. The model
fully confirms the experimentally observed cooling behavior
and its robustness with respect to changes in experimental
parameters. The model is validated by a good match between
the simulation and the experimentally measured temperature
and fluorescence rate. We recover the important role of the
Raman detuning between the main cooling laser and the
repumping laser on the achievable temperature. We show here,
for both 6Li and 40K, that the gain in temperature of a factor
of ∼3 at the exact Raman resonance is well reproduced by the
theoretical model and that the amount of coherence between
both hyperfine states shows a pronounced resonance behavior.
Beyond individual studies of the two species, we also show
experimentally that simultaneous cooling of 6Li and 40K does
not lead to any severe trade-off and is technically easy to
implement. We are able to capture more than 1 × 10⁹ atoms of
each species, with a capture efficiency exceeding 60% from a
compressed magneto-optical trap (CMOT), and reach temper-
atures as low as 44 μK for 6Li and 11 μK for 40K within 5 ms.
II. D1 COOLING MECHANISM
In a typical D1 cooling setup (Fig. 1), all the D1 hyperfine
levels are involved in the interaction. The sub-Doppler cooling
effects include a mix of Sisyphus cooling, motion-induced
and off-resonant light coupling from gray to bright levels, and
1050-2947/2015/91(2)/023426(11) 023426-1 ©2015 American Physical Society

FRANZ SIEVERS et al. PHYSICAL REVIEW A 91, 023426 (2015)
F = 3/2 (Fh)
F = 1/2 (Fl)
F = 7/2 (Fh)
F = 9/2 (Fl)
FIG. 1. (Color online) Cooling scheme on the 6Li and 40K D1 lines. The cooling beam (blue) is blue detuned by δcool from the |F =
3/2〉 → |F ′h = 3/2〉 (|F = 9/2〉 → |F ′
h = 7/2〉) transition, where F ′h (F ′
l ) is the upper (lower) excited-state level. The repumping beam (red) is
blue detuned by δrep from the |F = 1/2〉 → |F ′h = 3/2〉 (|F = 7/2〉 → |F ′
h = 7/2〉) transition. Detuning from the Raman condition is denoted
= δrep − δcool.
coherent population trapping of slow atoms in nearly decou-
pled states. In this section we first introduce our semiclassical
laser cooling model. We then present and compare the results
from experimental observations and numerical simulations
and, finally, discuss the physical mechanism of D1 cooling.
A. Semiclassical Monte Carlo simulation
The level diagrams of our bichromatic cooling scheme for
both 6Li and 40K are depicted in Fig. 1. The D1 molasses is
composed of a 3D lattice whose polarization configuration is
the same as that of a six-beam standard MOT, but with two
sidebands to address the |F = 3/2〉 and |F = 1/2〉 hyperfine
ground states of 6Li (respectively, |F = 9/2〉 and |F = 7/2〉
for 40K) in the D1 system at positive detunings.
Here, by convention, we refer to the |F = 3/2〉 → |F ′h〉
and |F = 1/2〉 → |F ′h〉 transitions as cooling and repumping
transitions. It is, however, important to note that neither the
cooling nor the repumping D1 transitions are actually closed.
Our numerical simulation of the cooling process is based
on a semiclassical Monte Carlo wave-function method. The
simulation takes into account the 3D optical molasses setup
and the dipole interaction between the single atoms and the
polarized light driving the transitions of the D1 manifold,
which is spanned by the 4(2I + 1) hyperfine Zeeman sublevels
(I > 0 is the nuclear spin). We treat the external states of the
atom classically and update its position r(t) and velocity v(t)
according to the calculated expectation value of the light force:
f(t) =〈ψ(t)| − ∇Heff(r(t))|ψ(t)〉
〈ψ(t)|ψ(t)〉. (1)
The atomic internal states |ψ(t)〉 evolve in a dressed basis
with respect to the cooling laser (Fig. 1), according to the
Monte Carlo wave-function method [15,16] with the effective
rotating-wave Hamiltonian
Heff = H0 + HF=I−1/2 + HF=I+1/2 − iŴ/2, (2)
where
H0 =∑
m
|F = I − 1/2,m〉〈F = I − 1/2,m|
−∑
F ′m′
|F ′,m′〉(δcool + δhfs,F ′ )〈F ′,m′|. (3)
Here H0 operates over the whole D1 manifold and δcool is
the detuning of the cooling laser with respect to the F =
I + 1/2 → F ′h transition, where F ′
h (Fig. 1) corresponds to the
excited hyperfine level that is higher in energy, e.g., F ′h = 3/2
for 6Li and F ′h = 7/2 for 40K. = δrep − δcool is the two-
photon detuning for the F = I − 1/2 → F = I + 1/2 Raman
transition, δhfs,F ′ the hyperfine splitting of the excited state for
F ′l , and 0 for F ′
h. The 0 of energy is chosen as that of the bare
F = I + 1/2 ground state.
The light-atom coupling Hamiltonian
HF=I±1/2 =
∑
m,σ,F ′,m′
F,σ cF,m,σ,F ′,m′
× |F,m〉〈F ′,m′| + H.c. (4)
describes the cooling (F = I + 1/2) and repumping (F =
I − 1/2) interactions [17]. Here F,σ are the Rabi frequencies
of the repumping and cooling laser beams for F = I − 1/2
F = I + 1/2, respectively. cF,m,σ,F ′m′ represent the Clebsch-
Gordan coefficients associated with the transitions coupled by
σ polarized light. To take into account the radiation damping
we include the spontaneous emission rate Ŵ = ŴPee where Ŵ
is the excited-state linewidth and Pee =∑
F ′,m′ |F′m′〉〈F ′m′|.
This leads to a decay of the internal-state wave-function norm
〈ψ(t)|ψ(t)〉. The speed of this decay probabilistically dictates
the collapse of the internal quantum states in the numerical
simulation, which corresponds to spontaneous emission. We
take into account the polarization of the spontaneous scattering
photon and follow the standard quantum jump procedure to
project the atomic states to ground states, with the norm
023426-2

SIMULTANEOUS SUB-DOPPLER LASER COOLING OF . . . PHYSICAL REVIEW A 91, 023426 (2015)
reset to unity [15]. To effectively account for heating due to
both absorption and spontaneous emission, we assign a recoil
momentum shift to v(t) twice before continuing to evolve
|ψ(t)〉 via Heff(r(t)).
The simulations are performed with parameters matching
the experimental setup by properly introducing the spatially
dependent F,σ (r), the detunings , δcool, and atomic initial
conditions. To reproduce experimental conditions, we fix the
relative phases for all 12 cooling and repumping laser beams
at values randomized for each simulation trial. We record
the evolution of the 3D atomic velocity, the time-stamped
fluorescence events corresponding to quantum jumps, and
internal-state properties such as state population and coher-
ence. The observables are averaged over multiple simulation
trials for comparison with the experiment.
B. Raman-detuning dependence for 6Li
A critical parameter in the D1 molasses scheme is the
Raman detuning (Fig. 1). In the following we investigate the
Raman-detuning dependence of the 6Li molasses temperature
and fluorescence rate both theoretically and experimentally,
for various cooling and repumping laser intensities.
Our 6Li-40K machine is described in [18]. We first load
a lithium MOT using a laser-slowed atomic beam (Zeeman
slower). After a compressed MOT phase the magnetic field and
the D2 light are switched off and the D1 molasses is applied
(a more detailed description of the sequence is presented in
the Appendix). To probe the Raman-detuning dependence
we apply a 100-μs D1 molasses pulse with variable to
an atomic cloud precooled to 100 μK. Figures 2(a) and 2(b)
show the fluorescence rate and the temperature after the pulse
as functions of the Raman detuning for the intensities used in
the simulations. We observe a temperature dip at zero Raman
detuning and a heating and fluorescence peak at positive
whose position and amplitude are correlated with the molasses
intensity.
In the simulations we set the initial velocity of lithium to
0.2 m/s (T ∼ 30 μK). The simulation time is set to 200 μs. In
the first 100 μs we allow the cooling dynamics to equilibrate,
and during the second 100 μs we record the velocity v(t) as
well as the time-stamped quantum jump events to calculate the
equilibrium temperature and fluorescence rate. At each Raman
detuning we average over 25 trajectories. The simulation
results for two intensities, Icool = 2.7 Isat, Irep = 0.13 Isat and
Icool = 9 Isat, Irep = 0.46 Isat, are shown in Figs. 2(c) and 2(d),
respectively (here Isat refers to the saturation intensity of the
D2 line).
The simulated heating and fluorescence peak positions
for low and high intensities (Fig. 2) agree well with the
experimental findings. Also, the shift between the heating
and the fluorescence peak, which increases with the molasses
intensity, is numerically reproduced without any freely ad-
justable parameters.
−1 −0.5 0 0.5 1
0.2
0.3
0.4
Raman-detuning ∆ (units of Γ)
Fluorescen
cerate
(arb.units)
101
102
103
Tem
perature
(µK)
(a)
−1 −0.5 0 0.5 1
3
4
5
Raman-detuning ∆ (units of Γ)
Fluorescen
cerate
(arb.units)
102
103
Tem
perature
(µK)
(b)
−1 −0.5 0 0.5 1
0.1
0.2
0.3
0.4
Raman-detuning ∆ (units of Γ)
Fluorescen
cerate
(1/µs)
101
102
103
Tem
perature
(µK)
(c)
−1 −0.5 0 0.5 1
0.5
1
Raman-detuning ∆ (units of Γ)
Fluorescen
cerate
(1/µs)
102
103
Tem
perature
(µK)
(d)
FIG. 2. (Color online) Fluorescence (squares) and temperature (triangles; logarithmic scale) of the 6Li atomic cloud after a 100-μs pulse
of D1 light with variable Raman detuning . Experiment: (a) low intensity; (b) high intensity. Simulation: (c) low intensity; (d) high intensity.
Experimental and simulation results (a, c) for Icool = 2.7Isat, Irep = 0.13Isat and (b, d) for Icool = 9 Isat, Irep = 0.46 Isat per beam.
023426-3

FRANZ SIEVERS et al. PHYSICAL REVIEW A 91, 023426 (2015)
−1 0 1101
102
103
Raman-detuning ∆ (units of Γ)
Tem
perature
(µK)
(a)
−1 0 1101
102
103
Raman-detuning ∆ (units of Γ)
Tem
perature
(µK)
(b)
FIG. 3. (Color online) Temperature of the 6Li D1 molasses after
a 100-μs pulse with variable Raman detuning for different
cooling and repumping intensities. (a) Experiment; (b) simulation.
Standard intensities [(red) circles]: Icool = 9 Isat, Irep = 0.46 Isat.
Equal cooling/repumping ratio (black squares): Icool = Irep = 9 Isat.
Inverted cooling/repumping ratio [(blue) triangles]: Icool = 0.6 Isat,
Irep = 4.6 Isat.
Despite the nice match between simulations and experi-
ments in Figs. 2 and 3, we observe that the semiclassical
simulations provide temperatures that are systematically lower
by a factor of 2 to 4 than the measured ones, particularly near
the Raman-resonance condition = 0. Here the simulation
predicts a temperature of 20 μK, whereas the lowest measured
temperature is 50 μK. The reason for this is not fully
understood and may come from both theory and experimental
limitations. First, the simulation is semiclassical and neglects
the wave-function extent of the cold atoms. The predicted
temperature of 20 μK corresponds to only six times the
recoil energy ER = 12mv2
recoil = kB × 3.5 μK. Therefore, only
a quantum treatment of the atoms’ external motion can be
expected to give a quantitative equilibrium temperature pre-
diction in the low-intensity limit. In the simulation we observe
that slow atoms are likely trapped within subwavelength
regions, where the light shift is minimal and the atom is nearly
decoupled from light over a long time without quantum jump.
This coherent population trapping effect enhances the cooling
at both large and small , although it is most pronounced at the
Raman resonance ( = 0) since more choices of decoupled
0
100
200
50
150
Tem
perature
(µK)
−0.2 0 0.220
40
60
−6 −4 −2 0 20
0.5
1
1.5
2
Raman-detuning ∆ (units of Γ)
Atom
number
(109)
FIG. 4. (Color online) Experiment: Atom number and equilib-
rium temperature of the 40K D1 molasses as functions of the Raman
detuning . δcool = 3 Ŵ, Icool = 6 Isat, Irep/Icool = 7.6%, tm = 5 ms.
In the constant-temperature regions below −0.1 Ŵ and above 2 Ŵ
gray molasses cooling involves coherences between Zeeman states in
a given hyperfine state but not between hyperfine states. At the exact
Raman condition = 0, long-lived coherences between hyperfine
states are established, as shown in the simulation in Fig. 5. In a
narrow detuning range, the temperature [(red) triangles] drops to
20 μK. Inset: Expanded scale.
states emerge. The semiclassical picture clearly exaggerates
the cooling effect since the wave nature of the atoms’ external
motion is not included in the model. In fact, the wave
function of the slow atoms will sample a larger volume of
the subwavelength traps and will shorten the lifetime of the
dark periods.
On the experimental side the residual magnetic field
cancellation has only been coarsely tuned for the data set
presented in Fig. 2 (as well as in Figs. 3 and 4). With careful
tuning of the magnetic field zeroing we were able to lower the40K temperature to 11 μK (Sec. II C, on 40K) for lower-density
samples. Interestingly, other groups have indeed found on39K lower temperatures (6 μK) than ours under the Raman
condition [12]. Note also that in Fig. 2 for positive Raman
detunings ( ∼ 0.5Ŵ at low intensity and ∼ Ŵ at high
intensity) the “temperature” corresponds to out-of-equilibrium
situations as the atoms are quickly heated away and lost from
the molasses. The notion of temperature should thus be taken
with care in this region, unlike for negative Raman detunings,
where a steady-state temperature is reached.
Another reason for shortening the lifetime of dark periods
of the slow atoms is reabsorption of photons emitted by
other atoms. We have indeed seen a density-dependent excess
temperature, which we measured to be 4.6 μK × 1011 at/cm3
for 40K. A careful simulation of cooling including photon
reabsorption processes is far more complex and is beyond
the scope of this work.
We also study the same Raman-detuning-dependent effects,
but for different cooling/repumping ratios. Typical experi-
mental and simulation results are presented in Fig. 3. Here
again, the simulation parameters are chosen according to the
experimental values. The simulation and experiments match
fairly well. In particular, for the usual configuration with
Icool/Irep > 1 (Icool = 9Isat and Irep = 0.45Isat), we observe a
023426-4

SIMULTANEOUS SUB-DOPPLER LASER COOLING OF . . . PHYSICAL REVIEW A 91, 023426 (2015)
heating peak at > 0. When inverting the roles of the cooling
and repumping light, i.e., Icool/Irep < 1 (Icool = 0.6Isat and
Irep = 4.6Isat), the heating peak appears for < 0 instead.
In all cases, cooling is most efficient at the Raman resonance
( = 0). Finally, for Icool equal to Irep, both as large as 9Isat, we
observe less efficient cooling at = 0, with moderate heating
at blue and red detunings.
C. Raman-detuning dependence for 40K
Typical simulation results for 40K are shown in Fig. 5(a).
Compared to 6Li, simulations for 40K require a significantly
higher computational power due to the larger internal-state
dimensions as well as the larger atomic mass and therefore
slower cooling dynamics. To save computation time, we start
at a velocity of 0.2 m/s (T ∼ 50 μK) and set the simulation
time to 2 ms. We record the velocity v(t) as well as the time-
stamped quantum jump events for t > 1 ms to calculate the
fluorescence rate. For each Raman detuning , 13 trajectories
are simulated.
Experimental results for 40K are presented in Fig. 4, which
shows the temperature and atom number of the D1 molasses
as functions of the Raman detuning . The total molasses
(a)
(b)
−6 −4 −2 0 2
0
0.2
0.4
0.6
Raman-detuning ∆ (units of Γ)
Hyperfinecoherence
−6 −4 −2 0 20
0.2
0.4
Raman-detuning ∆ (units of Γ)
Fluorescence
rate
(1/µ
s)
0
100
200
Tem
perature
(µK)
FIG. 5. (Color online) Simulation: Hyperfine coherence and -
enhanced cooling for the 40K D1 molasses. Simulation time,
2 ms; δcool = 3 Ŵ; Icool = 6Isat; Irep/Icool = 7.6%. (a) Fluorescence
(squares) and temperature (triangles) as functions of the Raman
detuning . (b) Coherence 4 · 〈ρ2F=7/2,F=9/2〉 between the two
hyperfine ground states, F = 7/2 and F = 9/2 (see Sec. II E). The
coherence is peaked under the Raman-resonance condition, with a
width matching the temperature dip.
duration tm = 5 ms. In the last 2 ms a linear intensity ramp
to Icool = 6Isat is performed. Just like 6Li, we observe a
sharp temperature drop under the Raman condition, a heating
resonance at ∼0.7 Ŵ, and constant-temperature regions below
−0.1 Ŵ and above 2 Ŵ. For the constant-temperature regions
the temperature T ∼ 45 μK is low compared to the Doppler
temperature TDoppler,K = 145 μK. Under the Raman condition
the temperature decreases to 23 μK. Under carefully opti-
mized conditions we measured temperatures as low as 11 μK.
As for 6Li, the comparison between Fig. 4 and Fig. 5(a)
again demonstrates the qualitative agreement between sim-
ulations and experimental results and that the heating peak
position is reproduced by the simulation without adjustable
parameters. Interestingly, the inverted hyperfine structure in
the ground and excited states of 40K and the different F →
F ′ = F − 1 transition for the cooling laser and F → F ′ = F
repumping transition does not significantly modify the D1
cooling scheme compared to 6Li.
D. The D1 cooling mechanism
The agreement between simulation and experiment sug-
gests that the semiclassical picture is able to catch the essential
physics behind the D1 molasses cooling. In particular, the
mechanisms behind the cooling dips and heating peaks in
Figs. 2 to 4, previously interpreted using the dressed atom
picture with a simplified three-level model [11], survive in the
full level scheme of the D1 transition.
It is well known that efficient D2 sub-Doppler cooling re-
quires isolated excited hyperfine levels for alkaline atoms [4,5].
In contrast, D1 gray molasses operates well even when all
D1 levels are excited (as in the case of 6Li) and even at zero
excited-state hyperfine splitting as confirmed numerically. The
robustness of D1 molasses is also seen in its insensitivity to
the relative phase between the “cooling” and the “repumping”
lattices, a critical parameter for D2 bichromatic cooling where
no polarization gradient was introduced [19].
In the following we discuss the physics behind the robust-
ness of the D1 sub-Doppler cooling. We then revisit the cooling
dips and heating peaks in Figs. 2 to 4.
We note that all the dipole-allowed D1 transitions (Fig. 1)
are “open”: when addressed with weak off-resonant light, the
probability of inelastic (mF - or F -changing) photon scattering
is comparable to or higher than that of elastic scattering.
When blue detuned from the D1 transitions, an off-resonant
bichromatic lattice can establish a correlation between the
spatially varying light shift (due to virtual elastic scattering)
and decay (due to real inelastic scattering) for the dressed
ground states, since a larger light shift is accompanied by a
stronger light-atom coupling and typically a larger inelastic
scattering cross section.
We verify this idea with the full D1 model for 6Li atoms
subjected to a 1D lattice with orthogonal linear polarizations
(lin ⊥ lin configuration) with typical cooling parameters. The
spatially varying light shifts ǫ of the six dressed ground states
of 6Li are plotted in Fig. 6(a). The decay of the dressed
states, due to inelastic light scattering, is characterized by
the decay rate γ , which is plotted versus ǫ in Fig. 6(d). We
see a correlation between ǫ and γ for ǫ < 1.5 MHz. This
correlation is robustly established for the D1 transitions, as
023426-5

FRANZ SIEVERS et al. PHYSICAL REVIEW A 91, 023426 (2015)
(a)
0 0.2 0.4
0
1
2Energy
(MHz)
(d)
0 1 2
0
0.5
1
1.5
Decay
rate
γ(1/µs)
0 0.5 1 1.5
−8
−6
−4
−2
0 (g)
0 0.2 0.4
0
1
2
3
Energy
(MHz)
(b) (e)
0 1 2 3
0
0.5
1
1.5
Decay
rate
γ(1/µs)
0 0.2 0.4
−1
0
1
2
Position x/Wavelength λ
Energy
(MHz)
(c) (f)
−1 0 1 2
0
0.5
1
1.5
Energy (MHz)
Decay
rate
γ(1/µs)
0 0.5 1 1.5
−6
−4
−2
0
Velocity v (m/s)
(i)
∆ = 0Γ ∆ = 0Γ ∆ = 0Γ
∆ = Γ/2 ∆ = Γ/2 ∆ = Γ/2
∆ = −Γ/4 ∆ = −Γ/4 ∆ = −Γ/4
Acceleration(104m/s
2)
Acceleration(104m/s
2)
Acceleration(104m/s
2)
(h)
0 0.5 1 1.5
4
2
0
−2
−4
FIG. 6. (Color online) Cooling mechanism around the Raman condition in a simplified model. Optical Bloch equation simulation for 6Li
subjected to a 1D bichromatic lattice with linear orthogonal polarizations near D1 resonance. The cooling lattice and repumping lattice are
displaced by π (λ/4). Icool = 15Isat, Irep = 0.75Isat, δcool = 4 Ŵ. (a–c) Dressed states as functions of the position, in units of the D1 optical
wavelength. The two dressed F = 1/2 levels (light blue and orange) are nearly flat in all the graphs due to the small Irep. (d–f) Decay rate of
dressed states as a function of their energy shifts. Here the two dressed F = 1/2 levels span a very small energy range and have a low decay
rate. (g–i) Velocity-dependent optical force for an atom dragged at velocity v. (a, d, g) = 0; (b, e, h) = Ŵ/2; (c, f, i) = −Ŵ/4. Note the
negative sign of the force in (g) and (i), implying cooling, and the anticooling force for velocities near 0.5 m/s in (h).
verified numerically in the more complicated 3D lattices and
for other atomic species. The correlation even persists for
a fictitious atom with vanishing D1 hyperfine splitting and
reduced mF -changing light scattering [20].
Such a correlation between the spatially dependent light
shift ǫ and decay rate γ has two consequences: First, atoms
with kv < γ tend to accumulate in dressed states with low
light shifts, which facilitates cooling through motion-induced
coupling to higher energy dressed states [21]. This coupling is
nonadiabatic as in the famous σ+–σ− 1D velocity selective
coherent population trapping subrecoil cooling mechanism
(VSCPT), where the spatial gradient of the atomic wave
function induces a coupling to a bright state. Second, for a
slowly moving atom that adiabatically follows a particular
dressed state, the atom tends to leave the dressed state
when the light shift is high, leading to Sisyphus cooling.
In addition, at locations where ǫ,γ ∼ 0, slow atoms can be
confined near the local dark states such as those in Fig. 6(a)
near x = 0, λ/8, λ/4, 3λ/8 [22]. The resulting optical cooling
force is plotted in Fig. 6(g) and is negative (cooling effect)
over a broad range. We emphasize that this simplified 1D
analysis remains valid in the more complex 3D beam geometry
and is not restricted to 6Li atoms. The D1 laser cooling
mechanism applies to all alkalis, even those amenable to
efficient D2 sub-Doppler cooling such as cesium and rubidium.
As D1 laser cooling involves dark states, it is less affected by
density-dependent photon multiple scattering and heating than
D2 sub-Doppler cooling. Therefore it would be interesting
to quantify the gain in phase-space density by applying D1
sub-Doppler cooling for these atoms.
In comparison, sub-Doppler cooling on the D2 lines is
significantly different. While the F = I ± 1/2 → F ′ = I ±
1/2 transitions are as “open” as in D1, the F = I + 1/2 →
F ′ = I + 3/2 and F = I − 1/2 → F ′ = I − 3/2 transitions
have both “closed” and open transitions. Here the closed
transitions are characterized by a greater-than-unity elastic-to-
inelastic scattering ratio. If the F = I + 1/2 → F ′ = I + 3/2
transitions can be isolated, then by taking advantage of the
nearly closed mF − mF ′ transitions, a correlation between
the light shift and the decay rate can be established with
(instead) a red-detuned lattice, as in standard sub-Doppler
cooling [1–3]. However, in the case of small hyperfine
splitting the open hyperfine transitions are as well addressed
at red detuning, leading to short-lived potential minima and
023426-6

SIMULTANEOUS SUB-DOPPLER LASER COOLING OF . . . PHYSICAL REVIEW A 91, 023426 (2015)
degraded correlations, contributing to the inefficiency of the
sub-Doppler cooling [23].
E. Physical picture of the Raman-detuning effect
We now extend the three-level picture in Ref. [11] to
understand the details of the experiment. The cooling dips
observed both experimentally and numerically under the
Raman-resonance condition are also fairly easy to understand
in the full model: At = 0 the resonant Raman-coupling splits
the F = I ± 1/2 hyperfine ground states into a bright and a
dark manifold. The dark manifold is weakly coupled to the
molasses. More precisely, the coupling strength of the Raman
dark manifold is even weaker than those due to individual
cooling-repumping couplings. Therefore the emergence of
the Raman dark manifold enhances all sub-Doppler cooling
effects.
Since the dark manifold is a coherent superposition of
the two hyperfine states F1 = I − 1/2 and F2 = I + 1/2,
we expect that laser-cooled atoms mostly occupy the dark
manifold and therefore display a hyperfine coherence ρF1,F2
with significant amplitude. To test this picture, we record
the time-dependent off-diagonal density matrix quantity 4 ·
〈ρ2F1,F2
(t)〉 for all the quantum trajectories of the numerical
simulations. The factor 4 ensures the normalization to one for
the maximally coherent situation. To compute the two-photon
detuning -dependent quantity 4 · 〈ρ2F1,F2
〉, we average over
both the equilibrium time and many quantum trajectories at
fixed . Typical results for 40K are given in Fig. 5, with
the cooling parameters corresponding to Fig. 4. We see
that the coherence 4 · 〈ρ2F1=7/2,F2=9/2〉 is peaked under the
Raman-resonance condition and becomes significant, with a
width matching the temperature dip.
As in Figs. 2 to 4 and [11] we now explain the heating peaks
with the full D1 model. We first focus on the case of Icool ≫ Irep
so that at large || the dressed F = I − 1/2 hyperfine level
is relatively long-lived and populated. As shown in Figs. 6(b)
and 6(c), the Raman detuning determines the energy level
of the dressed F = I − 1/2 hyperfine level, and it is clear
that when < 0, the motion-induced coupling to the dressed
F = I + 1/2 level should still contribute to cooling [as in
Figs. 6(c), 6(f), and 6(i)] [21], apart from Sisyphus cooling. On
the contrary, for > max[ǫF=I+1/2], e.g., a Raman detuning
beyond the maximum light shift of the dressed F = I + 1/2
manifold [as in Figs. 6(b), 6(e), and 6(h)], motion-induced
coupling to the lower energy dressed F = I + 1/2 manifold
would lead to heating. In addition, the Sisyphus effect at the
F = I + 1/2 manifold also contributes to heating, since atoms
coupled from F = I − 1/2 are more likely to start at the
antitrap positions. The corresponding heating peak is located
at ∼ max[ǫF=I+1/2] > 0.
When Icool ≪ Irep, the heating peak is shifted to ∼
− max[ǫF=I−1/2] < 0, as in Fig. 3. This is straightforward
to understand, as the roles of the two hyperfine ground states
are now inverted with respect to the previous case. Finally,
for Icool ∼ Irep, the two hyperfine ground states have similar
lifetimes and therefore similar steady-state populations. As
the heating effects are balanced by cooling effects, the
corresponding heating peaks in Fig. 3 (black squares) at
TABLE I. Parameters of the simultaneous 6Li and 40K D1 cooling
phase.
Parameter Potassium Lithium
P (mW) 230 300
δcool (Ŵ) 2.3 4
δrep (Ŵ) 2.3 4
Icool per beam (Isat) 14 14
Icool/Irep 8 20
D-line property 40K 6Li
Ŵ/(2π ) (MHz) 6.04 5.87
Isat (mW/cm2) 1.75 2.54
∼ max[ǫF=I+1/2], ∼ − max[ǫF=I−1/2] are substantially
suppressed.
III. SIMULTANEOUS 6Li AND 40K D1 COOLING
Finally, we discuss the simultaneous operation of the6Li and 40K D1 molasses. We found that this simultaneous
operation is required for subsequent efficient thermalization
between both species in a quadrupole magnetic trap. The tim-
ing sequence and parameters are the same as for single-species
operation. Experimental details are given in the Appendix and
in [10]. The D1 molasses phase is composed of a 3-ms capture
phase and a 2-ms cooling phase. Table I summarizes the
optimal parameters of the dual-species molasses. The presence
of the other species reduces the atom numbers in the MOTs
by 4% for 6Li and by 10% for 40K. However, we observe no
mutual influence during the CMOT and the D1 molasses phase.
The temperatures and relative atom numbers in dual-species
operation do not differ from those in single-species operation.
There are several reasons for this. First, the D1 resonances
and lasers are ∼100 nm apart in wavelength. Second, the
CMOT and molasses phases are short in duration (5 ms) and
the light-induced interspecies collision losses or heating are
minimized as atoms are accumulated in dark states. Table II
summarizes the performance of the different experimental
TABLE II. Performance of the different experimental phases
for 6Li and 40K, in dual-species operation. We list the optimum
temperature T , the atom number N , the density n, and the phase-space
density φ.
T N n φa
(μK) (109) (1010 cm−3) (10−5)
Lithium
MOT 1000 2 2.6 0.03
CMOT 800 2 18 0.29
Molasses 48 1.2 7.6 8.2
Potassium
MOT 240 3.2 7 0.02
CMOT 2000 3.2 37 0.06
Molasses 11 3.2 30 10.7
aThe given phase-density does not take into account the different
internal states and is calculated as φ = nλ3B, where λB is the thermal
de Broglie wavelength.
023426-7

FRANZ SIEVERS et al. PHYSICAL REVIEW A 91, 023426 (2015)
phases in dual-species operation. For both 6Li and 40K the
D1 molasses phase largely reduces the temperature, while the
cloud size after the CMOT phase is conserved. For both species
this leads to a phase-space density close to 10−4.
IV. CONCLUSION
In this study we have investigated the properties of D1 laser
cooling both experimentally and with numerical simulations.
The simulations take into account all relevant Zeeman and
hyperfine levels as well as the 3D bichromatic lattice geometry.
Simulations and experimental results match fairly well for
both lithium and potassium. Various sub-Doppler cooling
effects [10] are recovered in the full model. We have out-
lined the importance of coherences between the ground-state
hyperfine levels [11] and interpreted the cooling mechanisms
as resulting from a combination of VSCPT-like nonadiabatic
transitions between dark and coupled states and Sisyphus-type
cooling. The discrepancy (factor of 2 to 4) between the
temperature predicted by the semiclassical model and the
experimentally observed ones calls for further investigations
and the development of a full quantum treatment of the
external atomic motion using a Monte Carlo wave-function
approach [15,29].
We have discussed the physics behind the robustness of
the D1 cooling scheme, in particular, its insensitivity to the
excited-state hyperfine splitting and to the relative phase
between the cooling and the repumping lattices, which is in
sharp contrast to its D2 counterpart [4,5,19]. We first suggest
and numerically verify that, due to the predominance of the
“open transitions” at D1, the bichromatically dressed ground
states exhibit a robust correlation between light shift and decay.
We clarify that such a correlation leads to the accumulation
of an atomic population in the lowest energy dressed states at
Raman resonance for both nonadiabatic and Sisyphus cooling.
The picture also helps to explain the enhanced cooling at
Raman resonance, as well as the reduced cooling or even
heating at large Raman detunings. Because of the smaller
absorption cross section for atoms cooled in weakly coupled
states, D1 gray molasses should also be less affected by the
density-dependent heating than its D2 counterpart [24].
Experimentally, using commercial semiconductor laser
sources delivering ∼200 mW of CW power, we achieve
efficient, simultaneous cooling of 6Li and 40K, resulting in
a phase-space density close to 10−4 for both species. This D1
cooling scheme enables efficient direct loading of a dipole
or magnetic trap because of the large gain in temperature.
As recently shown in [12] and [14], these conditions are
well suited to direct loading of an optical dipole trap and
to the performance of all-optical evaporation to quantum
degeneracy. In our own experiments, we load a magnetic
trap, transport the atoms to a separate science cell, and
perform evaporative cooling of 40K in two Zeeman states
with a combined magnetic-optical trap scheme introduced
in [25]. Deep quantum degeneracy (T/TF = 0.14) in the
dipole trap has been achieved and will be the subject of a
future publication.
Finally, we have also used the D1 gray molasses scheme
to cool the bosonic 41K isotope. All of 5 × 10⁹ 41K atoms
from a CMOT were cooled to a final temperature of 20 μK,
leading to a phase-space density of 1.1 × 10⁻⁴. This confirms
the generality of this D1 sub-Doppler cooling method.
ACKNOWLEDGMENTS
We acknowledge useful discussions with A. T. Grier, I.
Ferrier-Barbut, B. S. Rem, M. Delehaye, S. Laurent, and
J. V. Porto and support from Region Ile de France (DIM
Nano-K and IFRAF), the European Union (ERC grants
Ferlodim and Thermodynamix), Institut de France (Louis D.
Award), and Institut Universitaire de France. D.R.F. acknowl-
edges the support of Fundacao para a Ciencia e Tecnologia
(FCT-Portugal) through Grant No. SFRH/BD/68488/2010.
S.W. acknowledges the support of the Physics Department
at Swansea University, where part of this research was carried
out.
APPENDIX: EXPERIMENTAL DETAILS
In this section we describe the experimental details, as well
as the results of additional measurements on the D1 molasses
scheme, in particular, the single-species operation of 6Li. Our
experimental setup has been described previously [18]. A
Zeeman slower for 6Li and a 2D+ MOT for 40K load the 3D
dual-species MOT in the MOT chamber. The D2 laser systems
for 6Li and 40K comprise master oscillator power amplifiers
(MOPAs) to produce light at 671 and 767 nm, respectively.
Beamsplitters and acousto-optic modulators generate the
cooling and repumping beams, which are combined before
injecting tapered amplifiers for the Zeeman slower and 3D
MOT for 6Li and, accordingly, the 2D+ MOT and 3D MOT
for 40K.
The D1 laser system for 40K operates at 770 nm and
is composed of a MOPA and an electro-optic modulator to
produce the repumping frequency. The total power used for
the 40K cooling is 240 mW, with an intensity per molasses
beam of 14Isat.
The source for the 6Li D1 light at 671 nm used in this
work is a homemade solid-state laser, the next generation
of [26] and [27], with up to 5 W output power. Acousto-optic
modulators allow us to independently tune the frequencies
and powers of the cooling and repumping beams, before
recombination and injection into an optical fiber. We typically
use 300 mW total power for the 6Li D1 cooling. The waist
of the 6Li D1 beam after the telescope (Fig. 7) is 8.6 mm.
We have also used a commercial 671-nm tapered amplifier
system (MOPA) with 130 mW available power impinging on
the atoms and obtained similar performances for the capture
efficiency and sub-Doppler temperatures.
Our optical scheme superimposes the D1 and D2 light
for both 6Li and 40K and produces the molasses and 3D
MOT beams (Fig. 7). D-shaped mirrors (MD) superimpose
the D1 cooling light and the 3D MOT light of each species
before a dichroic mirror (Mdichroic) combines the lithium and
potassium light. The beam containing all eight frequencies
is expanded and distributed to the three pairs of σ+-σ−
counter-propagating beams of the 3D MOT and the D1
molasses. The two horizontal axes are retroreflected, and the
vertical axis consists of two independent beams. The λ/2
plates of order 4 for lithium (λ/2∗Li) and potassium (λ/2∗
K)
023426-8

SIMULTANEOUS SUB-DOPPLER LASER COOLING OF . . . PHYSICAL REVIEW A 91, 023426 (2015)
FIG. 7. (Color online) Optical scheme of the D1 molasses. The
3D MOT light and the D1 cooling light are superposed using a
D-shaped mirror (MD). Afterwards a dichroic mirror (Mdichroic)
combines the lithium and potassium light, which is subsequently
expanded and distributed to the three perpendicular axes of the 3D
MOT.
allow for independent control of the 6Li and 40K MOT power
distribution.
The experiment starts with the loading of the dual-species
MOT. In 10 s we typically load 8 × 10⁸ 6Li atoms with an
initial temperature of 1 mK and 3 × 10⁹ 40K atoms at 200 μK.
Then a CMOT phase [28] increases the density of the atom
cloud. The magnetic gradient is linearly ramped from 9 to
60 G/cm in 5 ms. Meanwhile the frequencies of the cooling
and the repumping beams are tuned closer to resonance and
their intensities are linearly decreased. The CMOT phase
results in an increase in the peak density by a factor of 7
(5.3) and a temperature of 800 μK (2 mK) for 6Li (40K). At
the end of the CMOT phase the current of the MOT coils is
switched off within ∼100 μs. We start the D1 molasses phase
for 6Li with a delay of 200 μs in order to wait for transient
magnetic fields to decay. We found that this delay is not needed
for 40K.
1. 6Li D1 molasses
Here we study the cooling dynamics of 6Li alone. We set
the peak intensity of the molasses to 14.6Isat per beam, set the
cooling/repumping ratio to Icool/Irep = 20, and fix the global
detuning to δ = δcool = δrep = 4 Ŵ. Here Isat = 2.54 mW/cm2
is the saturation intensity of the D2 cycling transition, and Ŵ =
2π × 5.87 MHz the D1 line natural linewidth for 6Li. Figure 8
shows the atom number and temperature of the D1 molasses
as functions of the molasses duration tm. The temperature is
determined through time-of-flight measurements. We capture
60% of the 8 × 10⁸ CMOT atoms. Within 3 ms the atoms are
cooled from 800 μK to the asymptotic temperature of 120 μK
with a 1/e cooling time constant τcool = 0.6 ms. The direct
0 2 4 60
2
4
Molasses duration tm (ms)
Atom
number
100
200
300
Tem
perature
(µK)
×108
FIG. 8. (Color online) Number of atoms captured in the 6Li D1
molasses (circles) and their temperature (triangles) as functions of the
molasses duration, with a 1/e cooling time constant τcool = 0.6 ms.
The number of atoms in the compressed MOT is 8 × 10⁸.
measurement of the fluorescence shows a very fast decay at
the beginning (τfast < 1 μs), followed by a further decrease by
another factor of 2 within 2 ms. This indicates that the atoms
are accumulated in dark states during the cooling process. We
find the 1/e lifetime of the D1 molasses atom number for these
parameters to be τD1 = 90 ms.
The molasses atom number and temperature as functions
of the global detuning δ are shown in Fig. 9. We observe a
decrease in the temperature from 188 to 100 μK for δcool =
2 . . . 7. The capture efficiency increases sharply until 4 Ŵ and
stays constant until 7 Ŵ.
We now study the influence of the D1 light intensity.
When increasing the cooling intensity, while keeping the
molasses time fixed to 3 ms, we observe an increase in both
the capture efficiency and the temperature (Fig. 10). To take
advantage of the intensity-dependent temperature, we use two
successive phases in the cooling sequence. During the first
2 4 60
2
4
Detuning δ (units of Γ)
Atom
number
100
150
200Tem
perature
(µK)
×108
FIG. 9. (Color online) Number of atoms captured in the 6Li D1
molasses (circles) and their temperature (triangles) after a 3-ms
capture phase at a high intensity, Icool = 14.6Isat, as functions of
the global detuning δ = δcool = δrep. The number of atoms in the
compressed MOT is 8 × 10⁸.
023426-9

FRANZ SIEVERS et al. PHYSICAL REVIEW A 91, 023426 (2015)
6 8 10 12 140
1
2
3
4
D1 cooling intensity (units of Isat)
Atom
number
60
80
100
120
140
Tem
perature
(µK)
×108
FIG. 10. (Color online) Number of atoms captured in the 6Li D1
molasses (circles) and their temperature (triangles) as functions of
the D1 cooling beam intensity for δcool = 4 Ŵ and Irep = Icool/20.
The number of atoms in the compressed MOT is 8 × 10⁸. The atom
number (temperature) increases linearly with a slope of 4 × 10⁷
atoms/Isat (6.5 μK/Isat).
3 ms we capture the atoms at a high intensity, yielding the
highest capture efficiency. Then the intensity is linearly ramped
within 2 ms to an adjustable final intensity to further lower
the temperature. Figure 11 shows that the intensity ramp
reduces the final temperature from 115 to 44 μK without a
significant atom loss, for a final intensity Icool,final = 2.5Isat.
For lower intensities we observe heating and atom loss. The
cooling/repumping intensity ratio influences the atom number
and the temperature. We find an optimal temperature for
Icool/Irep = 20. For a lower ratio the temperature increases
0 5 10 150
2
4
Final D1 cooling intensity (units of Isat)
Atom
number
40
60
80
100
120
Tem
perature
(µK)
×108
FIG. 11. (Color online) Number of atoms captured in the 6Li D1
molasses (circles) and their temperature (triangles) after a 3-ms
capture phase at a high intensity, Icool = 14.6Isat, followed by a
2-ms linear intensity ramp to an adjustable value. The temperature
increases linearly for a higher intensity, with a slope of ∼6 μK/Isat.
The detuning is fixed to δcool = 4 Ŵ. The number of atoms in the
compressed MOT is 8 × 10⁸.
slightly and the atom number starts to drop at around
Icool/Irep = 7. For Icool/Irep > 33 the cooling mechanism
becomes inefficient, leading to atom loss and heating.
Measuring the atom cloud size at the end of the CMOT and
molasses phases, we see no significant change, proving that
diffusion during the molasses phase is small. In terms of the
phase-space density the atom loss is largely overcompensated
by the 14 times reduction in temperature.
[1] J. Dalibard and C. Cohen-Tannoudji, J. Opt. Soc. Am. B 6, 2023
(1989).
[2] P. D. Lett, W. D. Phillips, S. L. Rolston, C. E. Tanner, R. N.
Watts, and C. I. Westbrook, J. Opt. Soc. Am. B 6, 2084 (1989).
[3] D. S. Weiss, E. Riis, Y. Shevy, P. J. Ungar, and S. Chu, J. Opt.
Soc. Am. B 6, 2072 (1989).
[4] A. Bambini and A. Agresti, Phys. Rev. A 56, 3040 (1997).
[5] X. Xu, T. H. Loftus, J. W. Dunn, C. H. Greene, J. L. Hall,
A. Gallagher, and J. Ye, Phys. Rev. Lett. 90, 193002 (2003).
[6] P. Hamilton, G. Kim, T. Joshi, B. Mukherjee, D. Tiarks, and
H. Muller, Phys. Rev. A 89, 023409 (2014).
[7] P. M. Duarte, R. A. Hart, J. M. Hitchcock, T. A. Corcovilos,
T.-L. Yang, A. Reed, and R. G. Hulet, Phys. Rev. A 84, 061406
(2011).
[8] D. C. McKay, D. Jervis, D. J. Fine, J. W. Simpson-Porco, G. J.
A. Edge, and J. H. Thywissen, Phys. Rev. A 84, 063420 (2011).
[9] J. Sebastian, C. Gross, K. Li, H. C. J. Gan, W. Li, and
K. Dieckmann, Phys. Rev. A 90, 033417 (2014).
[10] D. R. Fernandes, F. Sievers, N. Kretzschmar, S. Wu, C. Salomon,
and F. Chevy, EPL (Europhys. Lett.) 100, 63001 (2012).
[11] A. T. Grier, I. Ferrier-Barbut, B. S. Rem, M. Delehaye, L.
Khaykovich, F. Chevy, and C. Salomon, Phys. Rev. A 87, 063411
(2013).
[12] G. Salomon, L. Fouche, P. Wang, A. Aspect, P. Bouyer, and
T. Bourdel, EPL (Europhys. Lett.) 104, 63002 (2013).
[13] D. Nath, R. K. Easwaran, G. Rajalakshmi, and C. S.
Unnikrishnan, Phys. Rev. A 88, 053407 (2013).
[14] A. Burchianti, G. Valtolina, J. A. Seman, E. Pace, M. De Pas,
M. Inguscio, M. Zaccanti, and G. Roati, Phys. Rev. A 90, 043408
(2014).
[15] J. Dalibard, Y. Castin, and K. Mølmer, Phys. Rev. Lett. 68, 580
(1992).
[16] H. Carmichael, An Open Systems Approach to Quantum Optics,
Lecture Notes in Physics Monographs, Vol. 18 (Springer-Verlag,
Berlin, 1993).
[17] By assuming the ground-state hyperfine splitting to be large
enough, the F = I + 1/2 (F = I − 1/2) is dark to the repump-
ing (cooling) laser and the associated couplings are ignored in
the Hamiltonian. This approximation allows us to write down
the Hamiltonian in the time-independent form.
[18] A. Ridinger, S. Chaudhuri, T. Salez, U. Eismann, D. R.
Fernandes, K. Magalhaes, D. Wilkowski, C. Salomon, and
F. Chevy, Eur. Phys. J. D 65, 223 (2011).
[19] R. Gupta, C. Xie, S. Padua, H. Batelaan, and H. Metcalf, Phys.
Rev. Lett. 71, 3087 (1993).
[20] W. Happer, Rev. Modern Phys. 44, 169 (1972).
023426-10

SIMULTANEOUS SUB-DOPPLER LASER COOLING OF . . . PHYSICAL REVIEW A 91, 023426 (2015)
[21] C. Cohen-Tannoudji, Atomic Motion in Laser Light, edited by
J. Dalibard, J. Raimond, and J. Zinn Justin (Les Houches,
Session LIII, 1990), pp. 1–164.
[22] Exact locations of the dark states depend on the relative phase
between the cooling and the repumping lattices.
[23] For D2 transitions the complication is also dependent. A
complete comparison of D1 and D2 cooling will be the subject
of a future publication.
[24] M. Drewsen, P. Laurent, A. Nadir, G. Santarelli, A. Clairon,
Y. Castin, D. Grison, and C. Salomon, Appl. Phys. B 59, 283
(1994).
[25] Y.-J. Lin, A. R. Perry, R. L. Compton, I. B.Spielman, and J. V.
Porto, Phys. Rev. A 79, 063631 (2009).
[26] U. Eismann, F. Gerbier, C. Canalias, A. Zukauskas, G. Trenec,
J. Vigue, F. Chevy, and C. Salomon, Appl. Phys. B 106, 25
(2011).
[27] U. Eismann, A. Bergschneider, F. Sievers, N. Kretzschmar,
C. Salomon, and F. Chevy, Opt. Express 21, 9091 (2013).
[28] M.-O. Mewes, G. Ferrari, F. Schreck, A. Sinatra, and
C. Salomon, Phys. Rev. A 61, 011403 (1999).
[29] Y. Castin and K. Mølmer, Phys. Rev. Lett. 74, 3772,
(1995).
023426-11


4 Evaporative cooling to quantum degeneracy
in magnetic and optical traps
4.1. Introduction
After magnetically transporting the atom samples to the science cell, another stage of cooling
has to be applied in order to reach the quantum degenerate regime. We employ a technique
called forced evaporative cooling, which relies on the selective removal of atoms with high
kinetic energy. In order to achieve a maximal phase space density, while maintaining a
large final atom number, our approach is to first evaporatively cool the atoms in a plugged
magnetic quadrupole trap by driving energy selective RF transitions. Subsequent to this
intermediate stage, we transfer the atoms into an optical dipole trap, where we continue
the optical evaporation by lowering the trap potential gradually until the atomic ensemble
reaches the quantum degenerate regime.
4.2. Principle of evaporative cooling
The basic principle of forced evaporative cooling is to remove constantly the high-energy tail
of a thermally distributed atomic ensemble, while the ensemble rethermalizes due to elastic
collisions [172–175]. In consequence, the reduction of the mean energy per particle results in a
lower temperature of the remaining atomic ensemble. Progressive application of this process
with gradually decreasing removal energy further decreases the temperature. Even if there is
in principle no fundamental lowest temperature limit, the decreasing atom number as well as
heating and loss mechanisms are limiting the achievable phase space density. We stress the
fact that evaporative cooling requires high atomic densities to be efficient, in contrast to laser
cooling where density effects like multiphoton scattering play a detrimental role regarding
the lowest temperature limit.
One possible definition of the evaporation efficiency is given by the relation
T ∝ Nα , (4.1)
where T is the sample temperature, N is the total atom number and α is the corresponding
efficiency parameter depending on a large set of other parameters, like for instance the elastic
collision rate, the evaporation trajectory, the efficiency of energy removal, as well as losses due
to background collisions and other loss mechanisms. A large elastic collision rate is crucial

4 Evaporative cooling to quantum degeneracy in magnetic and optical traps
for fast rethermalization dynamics. The elastic collision rate
γ = nσvT (4.2)
depends on the density of atoms n, the elastic collision cross-section σ and the mean relative
speed of particles vT . For a classical gas, the mean relative speed is given by
vT =
√16kBT
πm, (4.3)
where m is the mass of a particles and kB is the Boltzmann constant. Since the size of the
trapped cloud decreases with T , an efficient evaporation in a trap with constant confinement
(like it is the case for magnetic traps) can increase the density and thus the collision rate
during the evaporation process. This holds if the increase in density is faster than the decrease
of vT . If the efficiency parameter α is sufficiently large this can lead to runaway evaporation
in the case of bosonic gases as well as for fermionic gases in the classical regime. However,
as soon as a Fermi gas attains the degenerate regime, the collisional properties of the gas
become subject to Fermi-Dirac statistics. Pauli blocking and Fermi pressure then lead to a
reduced collision rate, eventually cancelling at zero temperature.
4.3. Experimental approach and results
For our experiment we have decided to follow the approach of evaporatively cooling a spin
mixture of 40K, while 6Li is sympathetically cooled. As of this writing, our group is still
optimizing the evaporative cooling stage. We are already able to sympathetically cool lithium
with potassium in the optically plugged magnetic quadrupole trap and to load ∼ 3 × 10⁵
atoms of each atomic species at a temperature of ∼ 35µK into the optical dipole trap.
Before continuing to optimize the dual-species evaporation in the near future, we first have
characterized the single-species evaporation of 40K.
In the following, we present our results concerning the single species evaporation of 40K to
quantum degeneracy.
4.3.1. RF evaporation
Since in a magnetic trap the potential energy of the atoms is proportional to the magnetic
field strength, atoms with a higher total energy can probe larger magnetic fields. A RF
field, at a given frequency, couples trapped low-field-seeking states (gFmF > 0) to untrapped
high-field-seeking states (gF′mF′ < 0) at a specific magnetic field. The resonance frequencies
vary with the magnetic field due to the Zeeman shift of the magnetic sublevels. This allows
to specifically remove highly energetic atoms from the trap by setting the RF frequency such
that only these atoms reach sufficiently large magnetic fields to become resonant with the RF
radiation. The effective trap depth is changed with the RF frequency, thus enabling forced
evaporation.
66

4.3 Experimental approach and results
For 40K we drive the magnetic field dependent transitions∣∣F = 9/2, mF = 9/2
⟩→∣∣7/2, 7/2
⟩,
∣∣9/2, 7/2⟩
→∣∣7/2, 7/2
⟩and
∣∣9/2, 5/2⟩
→∣∣7/2, 7/2
⟩with a single microwave frequency to
remove highly energetic atoms [157].
The quadrupole trap in the science cell consists of a coil pair with inner and outer coils, see
the description in Subsection 2.10.1. As soon as the 40K atoms have arrived in the science
cell, the current in the outer coils is slowly ramped to zero. The power supply, driving the
inner coils, is at this stage operated in current control mode in order to keep the current of
the inner coils constantly at 100A during the RF evaporation. This yields a magnetic field
gradient of B′
z = 280 G/cm on the strong vertical axis. We typically start the evaporation
process with 8 × 10⁸ 40K atoms at 650 µK, and sweep the RF field linearly from 1150MHz
to 1260MHz in 5 s, regularly producing an atomic sample of 6 × 10⁷ potassium atoms at a
temperature of 110 µK for the mentioned trap confinement.
These numbers were obtained without applying a plug beam to the center of the magnetic
trap, as described in Subsection 2.10.2. For the single species evaporation of 40K, the utiliza-
tion of the plug beam is not mandatory, since this yields at best a factor of two in the final
atom number.
4.3.2. Optical dipole trap
The first optical dipole trap beam at 1064 nm (ODT1) is already switched on at the beginning
of the RF evaporation. A 11W beam, oriented horizontally (x-axis), perpendicular to the
transport direction in the second arm, is focused to a waist of w0 = 42 µm and displaced
by z0 = 100 µm below the magnetic trap center. We thus use a combination of a magnetic
quadrupole potential and an optical potential during the RF evaporation, an approach that
was presented in [176] and leads to a reduction of Majorana losses. The cold and dense cloud
at the end of the RF evaporation is loaded into the optical dipole trap by linearly ramping the
magnetic field gradient from 250G/cm down to 5G/cm in 800ms. We note that the ambient
magnetic bias fields are compensated by the outer coils and auxiliary coils placed around the
science chamber in order to prevent the magnetic trap center from displacing during opening
of the trap. We are able to transfer 3 × 10⁷ 40K atoms with a temperature of 55 µK into
the ODT. After loading of the ODT, approximately 60% of these atoms are in the∣∣9/2, 9/2
⟩
state and 40% are in the∣∣9/2, 7/2
⟩state.
Optical evaporation
In the dipole trap forced evaporation is continued by lowering gradually the beam power. The
exact expression of the potential for atoms in the combined magnetic quadrupole and optical
dipole trap is presented in [176]. By neglecting the contribution of the magnetic confinement,
the dipole potential for an atom with an optical transition frequency ω0 can be simplified, to
Udip(r) =3πc2
2ω30
Γ
∆I(r) , (4.4)
67

4 Evaporative cooling to quantum degeneracy in magnetic and optical traps
assuming a detuning |∆| ≪ ω0. Here, Γ is the natural linewidth of the transition, ∆ = ω −ω0
is the detuning of the driving frequency ω from the transition frequency ω0, and I(r) is the
intensity profile of the ODT [161]. Lowering the beam power forces evaporation, because
atoms with an energy higher than the gradually decreasing trap depth can escape. During
the optical evaporation, the inner coil current is set to 2.75 A, such that the magnetic gradient
compensates the gravitational force for atoms in the∣∣9/2, 9/2
⟩state and provides confinement
in the axial direction of the ODT. We exponentially decrease the ODT beam power from 11W
to 170mW in 5.5 s, to obtain ∼ 8 × 10⁶ 40K atoms at a temperature of ∼ 1.5 µK.
Landau-Zener sweep
For future experiments, we intend to benefit from the possibility to tune the interaction
strength by means of a Feshbach resonance. Therefore we have to prepare the atoms in the
appropriate Zeeman states, before further continuing the evaporative cooling process. In the
case of the resonance at B = 202.1G the relevant states are∣∣mF = −9/2
⟩and
∣∣mF = −7/2⟩
of the F = 9/2 manifold [177, 178]. Since at this point of the cooling sequence almost all of
the atoms are in the positive states∣∣mF = +9/2
⟩and
∣∣mF = +7/2⟩, a spin-preparation step
needs to be performed. This is realized by inducing consecutive adiabatic passages between
the subsequent Zeeman states by means of a RF field. The adiabatic passage, also called
Landau-Zener sweep, is a well known technique in atomic physics for transferring atoms from
one state to another by slowly sweeping the frequency of an electromagnetic signal over the
resonance frequency coupling both states [10,94].
We chose to perform the Landau-Zener sweep for a magnetic field of B = 19.2G. In this
regime, the transitions between the Zeeman states are situated around 6MHz and are not
degenerate, since the difference in frequency of two adjacent Zeeman transitions is 62 kHz.
Since the estimated Rabi frequency is on the order of ΩR ∼ 10 kHz we can actually choose
the target Zeeman state by tuning the final frequency of the sweep. In our experimental
sequence we perform a linear RF sweep from 6.5MHz to 5.5MHz in 10ms.
Crossed dipole trap
In order to increase the elastic scattering rate, we add an additional optical confinement in
the axial direction (x-direction). For this purpose we shine in a second laser beam at 1064 nm,
propagation along the transport direction (y-axis). Its focus crosses ODT1 perpendicularly,
thus creating a crossed dipole trap. This second dipole trap beam (ODT2) is linearly ramped
up from zero to 4.8W in 1.5 s, and has a waist of 330 µm. A wait step of 200ms lets the atoms
gather in the dimple potential created by ODT2. Subsequently, we ramp the magnetic bias
slowly below the Feshbach resonance at 202.1G and sweep as fast as possible to the high-
field imaging value of 243.5G. Alternatively, for performing a Stern-Gerlach experiment,
we ramp the bias down to a value of a few Gauss. We note that a small bias field in z-
direction needs always to be applied during the complete evaporation. This ensures that the
atomic spins remain quantified along the same axis and do not change their spin state. The
68

4.3 Experimental approach and results
0
0.8
0.4
ypositio
nm
m
0
0.8
0.4
ypositio
nm
m
0 1 42 3
0
0.8
0.4
z position mm
ypositio
nm
m
Figure 4.1: Landau-Zener sweep performed at constant magnetic field 19.2G, as presented in [179].The RF field is swept from 6.5MHz to 5.5MHz in 10ms. The images are absorption pictures taken inthe direction of the optical dipole trap after a Stern-Gerlach experiment. (Top) Initial state. (Middle)After one RF sweep. (Bottom) 10 back-and-forth frequency sweeps in 10ms. All of the 10 states inthe F = 9/2 manifold became populated.
evaporation is continued by exponentially ramping the ODT1 power from 170mW to 57mW
in 8 s. Depending on the aimed final temperature we add another evaporation step of 6 s with
a variable, slightly reduced final power value of ODT1.
The trap frequencies at the end of a typical evaporation ramp (PODT,1 ≃ 40 mW and
PODT,2 = 4.8 W ), are measured to be ωx = 2π×25 Hz, ωy = 2π×154 Hz and ωz = 2π×160 Hz.
We use two different techniques in order to measure the number of atoms in the different spin
states and the corresponding temperatures, namely the Stern-Gerlach experiment and high-
field imaging.
Stern-Gerlach experiment
We can perform a Stern-Gerlach experiment to spatially separate the spin states [180, 181].
For this purpose, we apply a magnetic field gradient of ∼25G/cm in z-direction and switch
off the crossed optical dipole trap, thus letting the atomic sample expand under the influence
of magnetic and gravitational forces. The magnetic field gradient exerts a force on the
atoms, hence accelerating them. Since the force experienced by the atoms depends on their
magnetic moment and therefore on their spin state, this leads to a spatial separation of the
different spin states, under the condition that the width of the atomic spin samples due to
thermal expansion is smaller than the accumulated separation. In practice, the gradient is
switched off after 15ms, when the spatial separation of the spin states is sufficiently large.
69

4 Evaporative cooling to quantum degeneracy in magnetic and optical traps
An additional wait step of 10ms ensures that the magnetic field due to eddy currents reached
zero. Subsequently, we perform absorption imaging.
High-field imaging
When an external magnetic field is applied, the energy of the atomic states is shifted due
to the Zeeman effect. Consequently, also the imaging transitions will shift in frequency.
We can benefit from the fact that these frequency shifts depend on the internal spin state
of the atoms in order to image our samples spin-selectively. Details on the calculation of
the imaging frequency shifts can be found in the thesis of Diogo Fernandes [179]. In our
experiment, we installed an additional AOM in order to shift the imaging beam frequency
for 40K to suitable values. This setup is flexible enough to image the three states of interest
(∣∣9/2, mF = −9/2, −7/2, −5/2
⟩) in the desired field range of B = 150 − 250G with σ− or π
polarization.
Final result: Degenerate Fermi gas
Figure 4.2(a) illustrates an image section of an high-field absorption image, showing 40K atoms
in the∣∣mF = −9/2
⟩state after a time-of-flight of 20ms. A polylog fit [160] is applied to the
integrated 1D cloud profile, taking into account the measured trap frequencies. 1 It yields an
atom number of ∼ 1.5 × 10⁵, a temperature of 64 nK and T/TF ∼ 0.17, see Figure 4.2(b). In
the∣∣mF = −7/2
⟩state we have about the same number of atoms at the same temperature.
This result is a main achievement of this thesis. It prove that we are able to produce a deeply
degenerate spin-mixture of 40K atoms with relatively large atom numbers in the∣∣mF = −9/2
⟩
and the∣∣mF = −7/2
⟩states. In order to investigate a degenerate gas in the strongly inter-
acting regime we have simply to decrease the magnetic field to the Feshbach resonance at
B = 202.1G. For a unitary Fermi gas, the transition to a superfluid of paired fermions should
then occur below 0.17T/TF [94, 95].
1 We use the following fit model for the integrated 1D profile of the atomic density:
n1D(x) = −AFLi5/2
(−ZFexp
((x−xF)2
2s2
F
))+ BF + mFx, with AF and sF being related by the trap pa-
rameters and the time of flight. T/TF can be directly inferred from the fugacity ZF.
70

4.3 Experimental approach and results
(a) Absorption imaging
200 400 600 800
Position Μm
300
400
500
600
700
800
900
ODΣ
(b) Thomas-Fermi fit
Figure 4.2: (a) High-field absorption image of a degenerate Fermi gas of 40K atoms in the∣∣9/2, −9/2
⟩
state at T/TF ∼ 0.17 after a time-of-flight of 20ms. (b) Density distribution integrated along y-direction. The observed profile (circles) is well described by fitting a polylogarithmic function tothe data (red, solid line). A classical Gaussian distribution, fitted to the wings of the cloud (gray,dashed line), features a significant deviation from the data. The absorption image is averaged overfour individual picture shots.
71


Part II.
Multi-watt level 671-nm laser
source
73


Introduction
Lithium is one of the most popular elements for research on quantum gases. For producing a
degenerate quantum gas of lithium, the implementation of different laser cooling schemes is
required, which can only be realized by generating near-resonant single-frequency light with
powers typically in the watt range. In this context, all-solid-state lasers must be seen as
advantageous light sources whose design offers a broad range of benefits, such as large output
power, high reliability, low maintenance effort and high intrinsic stability.
In this part we will present an all-solid-state laser emitting multi-watt single-frequency radia-
tion near 671 nm. The fundamental infrared laser is based on a diode-end-pumped ring-cavity
design employing neodymium-doped yttrium orthovanadate (Nd:YVO4) as the gain medium,
since it features a laser transition at the wavelength of 1342 nm. Second harmonic generation
(SHG) of the fundamental wavelength is realized using three different approaches, namely
frequency-doubling via an enhancement cavity, intracavity doubling, and wavelength conver-
sion in a nonlinear waveguide. The designs of related laser sources that have been published
recently [182,183], as well as a previous version of our laser system [184], reached only output
powers of a few hundreds of milliwatts. The main limitations for power-scaling the single-
frequency Nd:YVO4 laser, as well as for the employed doubling devices, to the multi-watt
range are the losses introduced by detrimental thermal lensing in the active medium, and
the break down of the conversion efficiency in the nonlinear medium for high intensities. In
consequence, the most important feature of our novel high-power laser design is an improved
heat management in the Nd:YVO4 crystal and the nonlinear media.
Apart from laser cooling, other applications in the fields of atomic phyics, nonlinear optics
and technology require enhanced single-frequency powers around 671 nm. The small mass
of lithium is advantageous for atom interferometers, as it yields a large spatial splitting of
the atomic wavepackets [185]. By employing laser beams with higher power the signal-to-
noise ratio can be improved and even the spatial splitting can be increased by means of
multi-photon Bragg scattering [186]. In addition, a narrow-linewidth laser source is an option
for optical techniques of lithium isotope separation [187], since the isotope splitting of the
lithium D-line is sufficiently large to allow for selective addressing of the isotopes in hot
vapor. Furthermore, a scheme for the creation and long-distance transmission of entangled
photons has recently been proposed, this technique utilizing the output of a sub-threshold
optical parametric oscillator in the degenerate regime pumped by a single-frequency 671-nm
laser [182]. Finally, Cr:LiSAF laser setups could employ our laser as a pump source featuring
low intensity-noise [188].
75


5 Fundamental laser source at 1342 nm
In the preceding introduction, we have mentioned our new approach for an improved version
of an all all-solid-state 671-nm laser source. In the following sections, we will discuss the
fundamental near-infrared laser source at 1342 nm in more detail.
In Section 5.1 the most important physical properties of the Nd:YVO4 gain medium will
be presented. We will illustrate its crystal structure as well as its absorption and emission
spectra. Furthermore we detail on the thermo-optical properties of the gain medium and the
available pumping schemes, and show that considering these parameters was essential for the
power scaling of the laser system. In Section 5.2 we will indicate the basic theoretical concepts
that we employed for designing the laser cavity. We will include our measurements with
respect to thermal lensing effects and present the final design following these observations.
In Section 5.3 we will discuss our technical approach for achieving unidirectional, single-
longitudinal-mode operation of the laser by means of a Faraday rotator and two intra-cavity
etalons. In Sections 5.4 we will present our measurements of the characteristic parameters of
the fundamental laser source, in particular of the output power, the output spectrum and
the spatial mode quality. Finally, we will summarize this chapter in Section 5.5.
A three-dimensional view of the opto-mechanical parts of our cavity setup is given in Fig-
ure 5.1.

5 Fundamental laser source at 1342 nm
FP
M1
M2
M3
M4
E1
E2
Nd:YVO
4
λ/2
888nm
1342nm
TGG
138.5mm
L1
L2
Figure5.1.–Setu
pof
the1342
nm
lasersou
rcefrom
[140].Twolen
ses,L
1an
dL
2 ,im
agetheou
tputof
thepumpsource,
afiber-co
upled
diode
laserbar
(FP)em
ittingat
888nm,into
theNd:Y
VO
4gain
medium.Therin
greson
atorcon
sistsoffou
rmirrors
M1−
4in
bow
-tieconfigu
ration,
which
areall
high
lyrefl
ectiveat
1342nm
excep
tM
2serv
ingas
partly
transm
ittingou
tputcou
plin
gmirror.
AFarad
ayrotato
r(T
GG)in
combination
with
ahalf-w
aveplate
(λ/2)
enforces
unidirection
alop
eration.Insertion
oftw
oeta
lonsE
1−
2allow
sfor
single-lo
ngitu
dinal-m
ode
behav
ioran
dwavelen
gthtunab
ility.For
atech
nical
draw
ingof
thecav
itysetu
psee
Figu
re5.10.
78

0
1
2
3
4
5
6
7
8
9
10
11
12
13
5
14
17
52
48
300 K population
(%)
Y1 1966Y2 1988
Z5 433
Z1 0
Z2 108
Z4 226
4F5/2
4F3/2
4I15/2
4I13/2
4I11/2
En
erg
y (
10
3 c
m-1
)
4I9/2
80
8 n
m
Z3 173
Y5 2154Y6 2182
Y3 2047Y4 2062
40
24
X1 3910
Energy
(cm-1)
88
8 n
m
12366
X2 3931
91
4 n
m
10
64
nm
13
42
nm
88
0 n
m
R2 11384
R1 11366
Figure 5.2: Energy level scheme of the neodymium ion (Nd3+) in an YVO4 host material, its mainoptical transitions for pumping and lasing, and the partial sublevel populations at room temperature[189]. We operate the laser source on the 4F3/2 →4 I13/2 transition, corresponding to an outputwavelength of 1342 nm. Three pumping schemes to the metastable 4F3/2 level are indicated, wherethe 808 nm transition pumps via the short-living 4F5/2 level. The 888 nm transition shows significantlyless absorption but also a lower contribution to heating per cycle.
79

5 Fundamental laser source at 1342 nm
5.1. Nd:YVO4 as laser gain medium
Neodymium-doped yttrium (ortho-) vanadate (Nd:YVO4) has become one of the gain medi-
ums of choice for lasers delivering average output powers from hundreds of milliwatts to a few
tens of watts, in cw, Q-switched, or mode-locked regime. Being employed in many commercial
medium-power solid-state lasers, it is an inexpensive material available from numerous suppli-
ers. It benefits from many desirable optical and spectroscopic properties. Most importantly
for our purpose, it features a laser transition at 1342 nm with a large emission cross-section.
Unfortunately the YVO4 host material suffers unfavorable thermo-optical and mechanical
characteristics as a major drawback, limiting the accessible output power. Figure 5.2 shows
an energy level scheme and the main optical transitions of the neodymium ion (Nd3+) in
an YVO4 host crystal. We exploit the 4F3/2 →4 I13/2 transition, which corresponds to the
emission line at 1342 nm. In this section, the physical structure and parameters of Nd:YVO4
will be presented, most of all its optical characteristics.
Figure 5.3: Crystal structure of YVO4, which is of the tetragonal zircon type, from [190]. Thetetrahedra represent the VO3−
4 ions, balls are Y3+ ions. The unit cell is marked in bold lines.
5.1.1. Crystal structure
The crystal structure of yttrium orthovanadate (YVO4) is of zircon tetragonal type (space
group D4h) with a = b, see Figure 5.3. It is a (positive) uniaxial crystal grown with the
Czochralski method. As a birefringent material, rods made of it are usually rectangular.
There are two equivalent ordinary a-axes and one extraordinary c-axis, all mutually orthog-
onal. We use a-cut crystals, meaning that the optical surface normal vector is parallel to
one of the a-directions. By rotating the polarization direction of a linearly polarized beam
passing the crystal, we can therefore make use of the optical properties of both the a- and
c-axis.
80

5.1 Nd:YVO4 as laser gain medium
The yttrium atoms can be replaced by impurities or dopants of similar size. The value for a
neodymium doping is commonly given in at.%, meaning that the corresponding percentage
of Yttrium ions is replaced by neodymium ions. Since the trivalent neodymium substitutes
for trivalent yttrium, no charge compensation is required. However the radius of Nd3+ is
approximately 5% larger than that of Y3+, so that high doping values will lead to strained
crystals. Fortunately the high pump absorption coefficients of Nd:YVO4 limit the typical
doping values to 0.1–3 at.% for most applications. In practice the doping is chosen in such a
way that the requirements regarding pump absorption per unit length and heat density are
satisfied, see Section 5.1.3 and Section 5.2.2.
The major shortcoming of YVO4 arises from its relatively poor thermal properties, as the
material exhibits for example a lower thermal conductivity than YAG, see Table 5.1. This
limits the amount of pump light that can be absorbed before excessive thermal lensing and
aberrations occur, ultimately leading to crystal fracture.
In Table 5.1 we list important material parameters of Nd:YVO4.
Property Value Ref.
Typical doping 0.1–3 at.% [191]Atomic Density Nd3+ 1.26 · 1020cm−3 [191]Refractive index @ 1342 nm 1.9587(a), 2.1659(c) [192]Absorption coefficient αabs @ 808 nm 18 cm−1(a),
35 cm−1(c)[193]
Absorption coefficient αabs @ 888 nm 1.7 cm−1(a),1.6 cm−1(c)
[193]
Intrinsic Loss 0.16% cm−1 [194]Peak stimulated emission cross section σem,max 18 × 10−20 cm2 [195]Peak excited-state absorption cross section σESA,max 18 × 10−20 cm2 [195]Stimulated emission cross section σem(2λLi) 15 × 10−20 cm2 [195]Excited-state absorption cross section σESA(2λLi) 3 × 10⁻²⁰ cm2 [195]Upper-state fluorescence lifetime τfl (doping-dependent) 50 − 110 µs [196]Upper-state fluorescence lifetime τfl (for 0.5 at.%) 100 − 110 µs [196]Upper-state radiative lifetime τrad 120 µs [196]Gain bandwidth 1.7 nm = 280 GHz [195]Breakage stress 51-53 MPa [197,198]Thermo-optical coefficient dn/dT (a/c) (2.9/8.5) × 10−6 K−1 [191]Thermal conductivity κ (a/c) (5.10/5.23) W.K−1.m−1 [197]
Table 5.1. – Important material parameters of Nd:YVO4. All values are for typical dopingof 1 at.%, if not stated otherwise.
5.1.2. Emission
The full emission spectrum was measured by [199] and is presented in Figure 5.4. The quantity
presented in the figure is the difference σem − σESA, which is the direct observable of the
standard measurement methods. σem denotes the stimulated-emission cross section and σESA
81

5 Fundamental laser source at 1342 nm
is the so-called excited-state absorption (ESA) cross section for absorption of light by excited
ions.
As can be noticed on this graph, the neodymium ion exhibits two features at around 1µm
and 1.3µm. Moreover the impact of ESA becomes clear by the fact that it causes dips in
the emission spectrum in Figure 5.4 and has detrimental effects on laser emission. Since the
spectral resolution of the data from [199] is only 2.5 nm, our collaboration partners from
Toulouse contacted the group of R. Moncorge CIMAP, Universite de Caen, France and asked
them to perform a more precise measurement of the stimulated-emission cross section around
the feature at 1342 nm. The result with a notably higher spectral resolution of 0.5 nm is
shown in Figure 5.5. The value for the stimulated-emission cross section at twice the vacuum
wavelength of the lithium D-transitions,
2λLiD−Lines = 2 × 671.0 nm = 1342.0 nm , (5.1)
is close to the peak value and can be determined to be
σ = 15 × 10−20 cm2 . (5.2)
Since the emission cross section is always higher for c-polarization in the interesting wave-
length range, we usually chose this axis as the polarization axis of the operating laser.
Figure 5.4: Emission spectrum of Nd:YVO4 measured for the c-axis with a spectral resolution of2.5 nm (from [199]). It exhibits two noticeable features around 1064 nm and at 1342 nm.
The metastable state lifetime τ is another spectroscopic quantity that is important for the
performance of a laser medium. A long lifetime is advantageous, since the gain in the small-
82

5.1 Nd:YVO4 as laser gain medium
!"
#
$%
&&
$'
$
!
$
"
##
##
Figure 5.5: High-resolution emission spectrum around the 1342 nm transition, measured on the c-axis by the group of R. Moncorge [195] and first published in [184]. For the wavelength 2λLiD−Lines
we are interested in, one can deduce an emission cross-section of σem(2λLiD−Lines) = 12 × 10−20 cm2
and an excited-state absorption (ESA) cross-section of σESA(2λLiD−Lines) = 3 × 10⁻²⁰ cm2
.
signal limit is proportional to the product σemτ . It depends, however, strongly on the density
of the dopant atoms, see [196]. For crystals with doping values around 0.5 at. % the upper-
state fluorescence lifetime is τ = 100−110 µs, whereas the radiative lifetime caused exclusively
by radiative decay, is given by τrad = 120 µs.
5.1.3. Absorption
A convenient optical pumping of the gain medium is a requirement for laser action. We
decided for end pumping, where the pump light is injected along the laser beam, meaning
that the pump beam propagates collinear to the cavity mode in the active medium and
provides high power efficiency.
In the next subsections we will first describe the advantages and disadvantages of the common
optical pumping at 808 nm, and subsequently present a novel pump concept employing a
pumping wavelength of 888 nm.
Pumping at 808 nm
Nd:YVO4 is most commonly pumped at its peak absorption wavelength around 808 nm, which
is a consequence of the strong absorption cross section of the 4I9/2 →4 F5/2 transition and
the availability of pump diodes at this wavelength. The absorption spectrum is shown in
Figure 5.6, as published in [193]. It was measured for a Nd-doping of 1 at.% and for both
linear polarizations parallel to the a- and c-axis, covering a wavelength range from 800 nm
to 900 nm. The absorption coefficient scales linearly with doping if the mutual influence of
the neodymium ions is negligible, which holds in the limit of small doping. The absorption
line at 808 nm corresponds to the transition from the 4I9/2 ground state to the 4F5/2 upper
83

5 Fundamental laser source at 1342 nm
pump level. The maximal absorption coefficient of α = 34 cm−1 is achieved for light polarized
parallel to the c-axis. The absorption is reduced by a factor of 2 if the light is polarized parallel
to the a-axis. In the case of pumping at 808 nm the absorption is thus strongly polarization
dependent. Another large absorption line can be found at 880 nm and corresponds to the
transition from the ground state directly to the 4F3/2 laser level. For this wavelength the
absorption of light polarized parallel to the c-axis is a factor 2 lower compared to the transition
at 808 nm and is even more polarization dependent. In addition a weak absorption feature can
be noticed around 888 nm. We will detail this transition in the next subsection. We notice
that all three absorption bands are conveniently addressable by commercially available laser
diode stacks. However, when pumping at 808 nm, the pump diode stacks typically need to
be temperature stabilized in order to tune the emission wavelength to match the relatively
narrow absorption feature at its maximum.
Figure 5.6: Absorption spectrum of Nd:YVO4 (1 at.% doping) for light polarized parallel to the a-and c-axis in the wavelength range from 800 nm to 900 nm (from [193]). The material features severalabsorption bands at 808 nm, 880 nm and 888 nm, the latter being almost polarization-independent.
The advantage of pumping at 808 nm consists in the possibility to achieve high absorption
of the incident pump beam on relatively short distances inside a laser crystal of only some
millimeters length. By focusing the pump beam on small waists, this allows the realization of
efficient laser sources even with low pump powers. Moreover light sources, like semiconductor
laser stacks, at 808 nm are readily available and inexpensive industry products.
However the possibilities of realizing high power lasers at a pumping wavelength of 808 nm
are quite restricted. At higher pump powers, due to the strong absorption on short distances,
strong thermal lensing with aspherical components occurs, that cannot be compensated any
more by a suitable cavity design. The ultimate limit for the pump power is set by the fracture
threshold which is readily reached for strong absorption in a small volume, since a large part
of the absorbed power is deposited as heat load close to the input facet of the crystal. An
additional drawback is the polarization dependence of absorption at 808 nm. If the pump
light is partially polarized, as it is most often the case for fiber-coupled diodes, a modification
84

5.1 Nd:YVO4 as laser gain medium
of the polarization state by for instance mechanical stress on the fiber, will result in a varying
distribution of the heat load along the crystal length, unstable output powers and mode
jumps. A possible solution is to use fully polarized pump light with free-space propagation,
but this has the disadvantage of not allowing for the physical separation of the pump diodes
and the laser resonator.
Pumping at 888 nm
The inset in Figure 5.6 shows an enlarged view of the absorption spectrum of Nd:YVO4 in
the vicinity of 888 nm. In this wavelength range the absorption coefficient is by more than
one order of magnitude smaller than at a wavelength of 808 nm for the same doping value
of 1 at.%. In addition, the absorption is almost the same for both polarization directions.
The quasi-equality is still enhanced by the fact that common pump diodes have a spectral
width that is not negligible. Figure 5.7 depicts the convolution of the absorption spectrum
with a gaussian diode laser spectrum of 3.5 nm width (FWHM) as well as experimental
values for the effective absorption coefficient measured for a real 3.5 nm wide diode as a
function of the center wavelength [193]. It shows that the relatively large width of several
nanometers of such a pump diode results in a broad wavelength range in which the absorption
is practically constant and polarization independent. The 888 nm absorption line being quasi-
polarization-insensitive, it is favorable to use laser diode stacks that are coupled to non-
polarization-maintaining multi-mode optical fibers, since the radiation emitted from these
fibers is typically randomly polarized. Furthermore this facilitates the handling and improves
the robustness of the whole optical setup.
Figure 5.7: Theoretical curve for the convolution of the absorption spectrum with a 3.5 nm wide(FWHM) gaussian diode laser spectrum as well as experimental values for the effective absorptioncoefficient measured for a real 3.5 nm wide diode as a function of the center wavelength (from [193]).
As a consequence of the reduced absorption coefficient at 888 nm it becomes possible to
deposit a considerably higher pump power in the laser crystal. The left side of Figure 5.8
85

5 Fundamental laser source at 1342 nm
illustrates the usual principle of end-pumping of a solid-state laser at 808 nm. The pump beam
is strongly focused onto the entrance facet of the crystal and absorbed over a short distance
due to the high absorption. Therefore only relatively weak pump powers can be applied
without risking the destruction of the crystal by thermal fracture. The right side of the same
figure depicts the principle of pumping at 888 nm. The pump beam is less tightly focused
onto a larger diameter inside the long low-doped crystal. Because of the weak absorption and
the large waist of the pump beam, the power is distributed over a large volume of the crystal,
thus allowing the application of considerably higher powers without any disadvantages due
to the thermal load.
A further advantage of optical pumping at 888 nm is the reduced quantum defect, which
means that a larger relative part of the pump photon energy is converted to laser photon
energy instead of heat, reducing thus detrimental thermal effects, see Section 5.2.2. At a lasing
wavelength of 1342 nm the value of the quantum defect for pumping at 808 nm is ηqd,808 = 0.4,
whereas for a pumping wavelength of 888 nm it is reduced by 15% to ηqd,888 = 0.34.
The presented pumping concept should therefore allow for the application of higher pump
powers and power scaling of solid-state lasers at 1342 nm. In order to confirm the realizability
of a laser cavity that operates in the stability range, it is necessary to have information about
the thermo-optical and thermo-mechanical properties of the laser crystal when it is exposed
to the injected pump beam and under the condition of cavity lasing. Most importantly
we are interested in the focal length of the induced thermal lens, which will be subject of
Section 5.2.2.
Figure 5.8: Tight pump beam focusing in a short crystal that is end-pumped at 808 nm (left) andless tight focusing in a longer crystal that is end-pumped at 888 nm (right), as published in [189]. Thelaser mode is illustrated in gray.
5.2. Laser cavity design: Theory and realization
In this section, we will give a short outline of the theoretical concepts needed for the design
and optimization of the laser cavity. The discussion starts with the properties of Hermite-
Gaussian beams which describe the cavity eigenmodes. The thermal effects occurring in the
gain material are investigated both theoretically and experimentally, and we will indicate
analytic expressions for the output power of a solid-state laser. In the last subsection, the
final technical design of the near-infrared laser cavity is presented.
86

5.2 Laser cavity design: Theory and realization
5.2.1. Hermite-Gaussian beam modes and resonators
Laser beams are in general sufficiently collimated along their propagation axis to be described
by the Helmholtz equation in paraxial approximation [200], see Equation (5.3). They can
therefore be decomposed into Hermite-Gaussian modes which form a complete set of solutions
of the paraxial Helmholtz equation, indicated here for a beam propagating in the z-direction,
(∂2
∂x2+
∂2
∂y2− 2ik
∂
∂z
)E(r, t) = 0 (5.3)
where k = 2π/λ is the wave number for the wavelength λ. Any solution to this equation can
be written as a linear superposition of orthogonal solutions
E(r, t) = E0 n um(x, z) un(y, z) e−i(kz−ωt) , (5.4)
with the field amplitude E0, the normalized polarization vector n and the phase term
e−i(kz−ωt). We will restrict our description to the x-coordinate, since the eigenfunctions
um(x, z) and um(y, z) are identical for both transversal directions. The basis functions are
given by
um(x, z) =
(2
π
) 14
√exp
(i(2m + 1)ϕx(z)
)
2mm!wx(z)Hm
( √2x
wx(z)
)exp
(−i
kx2
2Rx(z)− x2
w2x(z)
). (5.5)
where Hm is the Hermite polynomial of order m, wx(z) is the characteristic radius of the
beam along direction x at position z and Rx(z) is the radius of curvature of the wavefront.
The characteristic radius reads
wx(z) = w0,x
√√√√1 +
(z
zR,x
)2
, (5.6)
where zR,x is the Rayleigh length. The smallest value at z = 0 is called the waist of the beam
w0,x =
√λzR,x
π. (5.7)
The additional phase factor ϕx(z) denotes the so-called Gouy phase shift and is expressed by
ϕx(z) = arctan
(z
zR,x
). (5.8)
which describes the acquired phase shift which differs from that for a plane wave with the
same frequency ω.
87

5 Fundamental laser source at 1342 nm
Ray transfer matrix analysis and cavity resonance condition
The description of the evolution of a beam propagating in z-direction can be simplified by
introducing the complex parameter
qx(z) = z + izR,x , (5.9)
with z being the distance from the beam focus position and the Rayleigh length zR,x. The
evolution of a Hermite-Gaussian beam mode passing through linear optical elements can then
be calculated by applying the ABCD-matrices formalism known from ray transfer matrix
analysis, according to the following transformation:
q′
x = Mx ∗ qx ≡ Axqx + Bx
Cxqx + Dx, (5.10)
The transfer matrices
Mx =
Ax Bx
Cx Dx
(5.11)
are tabulated for standard optical components, see for instance [200,201]. An optical system
consisting of several optical elements is also represented by a matrix Mx, that can be derived
by simple matrix multiplication to the left for successive components.
The eigenmodes of an optical cavity can de determined by first calculating the cavity matrix
Mx independently for the two transverse axes. An eigenmode is defined as an eigenvector of
the cavity matrix, meaning that the eigenmode reproduces itself after one complete resonator
round-trip:
qx ≡ q′
x = Mx ∗ qx , (5.12)
Defining the stability parameter
pstab,x =Ax + Dx
2, (5.13)
one can show that a stable cavity eigenmode only exists if the following stability criterion is
fulfilled:
− 1 < pstab,x < 1 . (5.14)
The operation of an laser resonator also requires that the laser mode reproduces itself after
one resonator round-trip in terms of the acquired phase. This yields a resonance condition
for the total phase ϕtot acquired during one resonator round-trip
ϕtot ≡ 2πp , (5.15)
where p ∈ N is the longitudinal mode index. Apart from the fundamental Gaussian beam
mode, also higher cavity TEMmn eigenmodes, with m, n > 0, may occur. As already men-
88

5.2 Laser cavity design: Theory and realization
tioned, a Hermite-Gaussian beam accumulates the so-called Gouy phase shift ϕm;x that ex-
presses the phase difference with respect to a plane wave of the same frequency during one
round-trip, see [200] and Equation (5.5):
ϕm,x(z) =
(m +
1
2
)ϕx(z)
=
(m +
1
2
)arctan
(z
zR,x
).
(5.16)
The y-direction has to be treated in the same way, resulting in a ϕn,y as in Equation (5.16).
Thus the total phase shift is
ϕmn(z) = ϕm,x(z) + ϕn,y(z) . (5.17)
The total optical length of a cavity is defined as sum over all optical path lengths
Lopt =∑
k
nktk , (5.18)
with the geometrical path lengths ti between optical surfaces and the refractive indices ni of
the corresponding media i. The resonance condition therefore reads
kmnLopt + ϕmn(Lopt) + ϕres ≡ 2πp , (5.19)
with the residual phase term ϕres, due to, for example, optical surfaces with dielectric coatings,
which is assumed to be constant for all eigenmodes. The wavenumber kmn is
kmn =2π
λmn=
2πνmn
c, (5.20)
with the vacuum speed of light c. The resonance condition for the longitudinal mode thus
reads
kmn =1
Lopt
(2πp − ϕmn(Lopt) − ϕres
). (5.21)
This yields the eigenfrequencies
νp = pνFSR + νres . (5.22)
where the free spectral range νFSR is defined as the frequency spacing between neighboring
longitudinal modes of identical transversal mode numbers m, n,
νFSR =c
Lopt. (5.23)
Finally we consider the frequency distance ∆ν∆m∆n between different Hermite-Gaussian
modes at fixed longitudinal mode number p:
89

5 Fundamental laser source at 1342 nm
∆ν∆m∆n =c
2πLoptϕ∆m∆n(Lopt)
=c
2πLopt
(∆mϕx(Lopt) + ∆nϕy(Lopt)
),
(5.24)
where ∆m = m − m′ and ∆n = n − n′ for two transversal modes with indices m, n and
m′, n′, respectively. This result shows that in general, Hermite-Gaussian cavity eigenmodes of
different order are not degenerate in resonance frequency. We can benefit from this property
for coupling exclusively to the TEM00 mode of an enhancement cavity used for frequency
doubling, as we will describe in Section 6.2.
5.2.2. Thermal effects and power scaling
The power scaling of diode-end-pumped solid-state lasers to higher output powers is in general
limited by thermal effects induced in the gain medium at high pump powers. The absorption
of pump photons and the subsequent emission of laser photons lead to local heating inside
the laser crystal due to phononic transitions. In a four-level laser medium, the first phononic
relaxation process that take place after a pump excitation is from the highest excited state to
the metastable intermediate state creating the necessary population inversion. Subsequently
the Nd+3-ion relaxes optically, namely by stimulated or spontaneous emission of a laser
photon, to an intermediate state. From there another phononic de-excitation brings them
finally back to the ground state.
The local heating induced by pump light and laser action in an active medium results in
several thermo-mechanical and optical effects [202]:
— Since the refractive index of most materials is temperature-dependent, it varies locally
according to the temperature profile induced by the pump beam absorption and laser
action. The resulting refractive index profile acts like an optical lens and affects the
eigenmodes and the stability range of the laser resonator [203].
— In particular for end-pumped solid-state lasers a large amount of the heat load is located
close to the input facet causing stress along the optical axis of the pump light and thus
bulging of the crystal facets. Hence, the crystal acts as a thick lens.
— The thermally induced stress also causes spatial variations of the refractive index due
to stress-dependence of the refractive index of most materials. This represents a third
effect that causes thermal lensing. However, this effect is relatively small and can in
general be neglected.
— The preceding causes for thermal lensing can also lead to optical birefringence. This
effect has only importance for optically isotropic media, since for naturally birefringent
materials like Nd:YVO4 it is negligibly small.
— If the stress inside the crystal becomes to large, it might exceed the breakage stress of
the crystal medium, resulting eventually in its fracture. Since most materials possess
90

5.2 Laser cavity design: Theory and realization
a higher resistance under compression than under tension, crystal fracture will usually
originate from the crystal edge on the input facet, where tensile stress is maximal [198].
These thermal lensing effects have in general strong non-spherical contributions leading to
losses for gaussian laser beams arising from thermal diffraction and aberrations. As a conse-
quence, the expression for the total cavity round-trip loss, that will be used in Section 5.2.3,
depends on the absorbed pump power:
αtot (Pabs) = αT + αres (Pabs) . (5.25)
We consider the three-dimensional heat conduction equation, that relates the local temper-
ature T (x, y, z) to the local heat load Q(x, y, z) under steady-state conditions of pumping,
optical extraction, and cooling:
∇2T (r) +Q(r)
κ= 0 , (5.26)
where κ denotes the thermal conductivity. If the pump beam diameter is significantly smaller
than the crystal length, we can apply the thin slice approximation that neglects an axial
heat flow within the crystal along z. Thus only the radial heat flow is taken into account.
In order to simplify the problem, the thermal conductivity is considered isotropic and the
crystal as well as the pump distribution radially symmetric. Instead of considering a square-
section crystal with different thermo-optical properties along the a- and c- axes, we therefore
simplify to the pumping of a cylindrical rod with isotropic properties. The steady-state heat
conduction equation then reduces to a one-dimensional problem in cylindrical coordinates:
1
ρ
∂
∂ρ
(ρ
∂T (ρ, z)
∂ρ
)+
Q(ρ, z)
κ= 0 . (5.27)
The constant heat deposition within the pump spot of a top-hat pump profile of radius ωp is
given by:
Q(ρ, z) =ηh
πω2p(z)
∣∣∣∣∣dPP(z)
dz
∣∣∣∣∣Θ(ω2p(z) − ρ2) . (5.28)
where∣∣∣dPP(z)
dz
∣∣∣ is the differential absorbed pump power, which, in the case of single end-
pumping with isotropic absorption, is given by∣∣∣dPP(z)
dz
∣∣∣ = αPP(0)e−αz . Assuming a fixed
temperature T (ρc, z) = T0 at the crystal edge, Equation (5.27) can be solved analytically to
obtain the temperature difference between a position at a radius ρ from the crystal center
and the cooled crystal edges at the crystal radius ρc :
T (ρ, z) − T0 =ηhPabs
4πκ
αe−αz
1 − e−αlcry×
ln
(ρ2
0w2
p(z)
)+ 1 − ρ2
w2p(z)
, if ρ ≤ wp(z)
ln
(ρ2
0ρ2
), if ρ ≥ wp(z)
(5.29)
Here, ηh denotes the relative amount of the pump photon energy contributing to heating
and differs for lasing and non-lasing conditions. This solution shows that the temperature
91

5 Fundamental laser source at 1342 nm
distribution is parabolic inside the pump spot and logarithmic outside the pump spot towards
the outer surface of the crystal. For a given pump spot size, the maximum temperature is
directly proportional to the absorbed pump power per length and is located in the center of
the crystal. In the case that the side surfaces of the crystal are kept at a constant temperature
along its whole length, the temperature difference between the center and a position at radius
ρ follows a parabola within the pump spot:
∆T (ρ, z) = T (ρ, z) − T (0, z) = −ηhPabs
4πκ
αe−αz
1 − e−αlcry
(ρ2
0
w2p(z)
). (5.30)
Once the temperature distribution inside the crystal has been calculated, the thermo-optic
contribution to the thermal lens can be directly calculated from the change in refractive index
with temperature:
∆n(ρ, z) = n(ρ, z) − n(0, z) =dn
dT∆T (ρ, z) = − dn
dT
ηhPabs
4πκ
αe−αz
1 − e−αlcry
(ρ2
0
w2p(z)
). (5.31)
The refractive index then follows a parabolic evolution from the crystal center,
n(ρ, z) = n(0, z)
(1 − ρ2
b2
), (5.32)
with
1
b2=
dn
dT
ηhPabs
8πn(0, z)κ
αe−αz
1 − e−αlcry
(1
w2p(z)
). (5.33)
If we assume that the focal length is long compared to the crystal length, this results in a
differential gradient-index lens of power dDth at a given position z:
dDth =4n(0, z)dz
b2=
dn
dT
ηhPabs
2πκ
αe−αz
1 − e−αlcry
(1
w2p(z)
)dz . (5.34)
Integration of this expression over the entire crystal length, while assuming that the pump
beam is collimated along the absorption length, yields
Dth =dn
dT
ηhPabs
2πκw2p
, (5.35)
meaning that the thermal lens power is proportional to the absorbed pump power Pabs divided
by the beam cross section πw2p.
One has furthermore to distinguish between the non-lasing and lasing case due to the different
branching ratios ηh [196]. The fractional thermal loading without laser action ηh,NL is given
by
ηh,NL = 1 − ηq(1 − β)λp
λfl(5.36)
92

5.2 Laser cavity design: Theory and realization
where the parameter β, denoting the fraction of energy stored in the upper laser level that
decays non-radiatively, reads
β = 1 − τfl
τrad. (5.37)
ηq is the pump quantum efficiency, λp and λfl are the pump and mean fluorescence wave-
length, respectively. τfl is the fluorescence lifetime and τrad the purely radiative lifetime of the
metastable state in the active gain medium. Under lasing conditions instead of fluorescence,
a higher quantity of energy per pump photon is deposited in heat. The fractional heating
power changes to
ηh,L = 1 − ηq
(λp
λL
)· σem
σem + σESA, (5.38)
where λL is the laser wavelength, σem and σESA are the stimulated emission and the ESA
(excited-state absorbtion) cross-section, respectively. Equation (5.38) states that excited
state absorption not only lowers the available output power, but also detrimentally influences
the thermal effects, since the excited-state decay channels can be supposed fully phononic.
Since the ratio ηL/ηNL equals the ratio between the two resulting dioptric powers, one has to
consider the corresponding dioptric power range when designing a cavity, as will be shown in
the next section.
Another result of the simplified model that we applied is, that the thermal lens is independent
of the crystal length and absorption coefficient. Yet, in practice a shorter crystal with higher
absorption coefficient will induce higher inversion densities and temperatures, leading to
stronger thermal lens aberrations caused by the reduction of the thermal conductivity with
increasing temperature. Therefore a longer crystal with low and homogeneous inversion
density will favour a lower and less aberrated gradient-index thermal lens.
Experimental determination of the thermal lens
Numerous methods to measure and quantify the thermal lens have been developed in the
past. These different approaches measure output beam parameters [204], use degeneration
resonator lengths [205], employ transverse mode beat frequencies [206] or are based on in-
terferometric methods [207]. All these methods require, however, an active laser operation.
Consequently, these approaches are not appropriate for our purpose, since we intend to de-
termine and compare the thermal lens with and without lasing. Thus we applied a method
reported by [203,208] using a probe beam to determine the focal length of the thermal lens.
The setup for measuring the thermal lens by use of a probe beam is presented in Figure 5.9.
The probe beam of a Helium-Neon laser emitting at 633 nm is linearly polarized parallel to
the vertical c-axis of the laser crystal. This ensures that the probe beam measures the effect of
the thermal lens correctly for the laser radiation also polarized along the c-axis. Subsequently,
the polarized probe beam is injected into the laser crystal via two mirrors (M6, M7), while
optimizing the overlap with the 888 nm pump beam. The beam of the Helium-Neon laser
93

5 Fundamental laser source at 1342 nm
Pump fiber
CCD-camera
Nd:YVO4
Beam dump
L1
L2
M1 M2 M3 M4 M5 M6
M7
HeNe laser
/2
PBS
888nm 633nm
1342nm
Figure 5.9: Scheme of the measurement setup for determination of the thermal lens with and withoutlaser operation.
is Gaussian and approximately collimated with a beam waist of 350µm. The beam waist is
therefore sufficiently small for not being affected by diffraction effects due to the pump beam
profile. The power of the Helium-Neon laser amounts only to several milliwatts.
The experiment is performed under the same pumping conditions as during laser operation
with the common cavity setup presented in Section 5.2.4. The pump source is a fiber-coupled
QPC BrightLase Ultra-50 diode stack emitting up to 42.6W at 888 nm (Spectral width
(FWHM): 2.2 nm). The fiber output is imaged by two lenses L1 and L2 to a top-hat profile of
radius wpump = 970µm inside the laser crystal. The laser resonator is formed by mirrors M3
and M4, which are both planar. Due to the short resonator length, transversal multi-mode
operation of the laser occurs. This ensures a homogeneous overlap of the pump beam and
the laser beam in the entire pumped volume of the laser crystal. As a result, the spatial
contribution of the ESA to the crystal heating, occurring only in the presence of 1342 nm
light, is not altered by a an inhomogeneous mode overlap.
The thermal lens is determined by measuring its impact on the propagation of the probe
beam after the Nd:YVO4 crystal. For this purpose, we measure the beam profile at different
distances from the crystal with a CCD camera. Repeating this measurement for all three
possible situation (without pumping, pumping without lasing, and pumping with lasing), we
can deduce the induced thermal lens from the beam parameters and the geometry of our
measurement setup. In this context we approximated the thermal lens as a thin lens situated
at the entrance facet of the laser crystal. Without lasing operation we measured a focal
94

5.2 Laser cavity design: Theory and realization
length of 280mm, whereas for lasing operation at 1342 nm the focal length of the thermal
lens amounts to 170mm.
We decide to compensate for this detrimental thermal lensing effect in the gain medium by
installing a curved pump coupling mirror, with a convex radius of curvature of 500mm, in
front of the crystal. The backside of the mirror is also curved correspondingly, such that
the pump beam passing through this mirror is not altered by any lensing effect (zero lens
mirror). Thus the position and the waist of the pump beam focus remain unchanged. The
major purpose of this curved mirror is the compensation for the thermal lens inside the laser
crystal, as the defocusing effect of its convex curvature counteracts the focusing effect of the
latter.
5.2.3. Characteristic curve and output power
The slope efficiency and the maximum output power are the most crucial parameters of a
laser source and depend strongly on its design. In particular for our design considerations
of an improved version of the IR-laser, the central goal was to reach an output power in the
multi-Watt range.
In general, for diode-end pumped laser emitting at a wavelength λL = c/2πωL, the output
power Pout has a quasi-linear dependence on the absorbed pump power Pabs above a threshold
Pth :
Pout = ηs (Pabs)(Pabs − Pth (Pabs)
), for Pabs > Pth , (5.39)
where the slope efficiency ηs varies with Pabs for higher pump powers and is defined as
ηsl (Pabs) =∂Pout
∂Pabs=
αT
αtot (Pabs)ηqηOI (Pabs) . (5.40)
αT denotes the output coupler transmittance and αtot is the total round-trip loss
αtot (Pabs) = αT + αres (Pabs) , (5.41)
with αres summarizing all residual round-trip losses inside the resonator that can in principle
depend on Pabs due to losses induced by thermal effects. The quantum efficiency ηq, also
often termed quantum yield in literature, describes the energy conversion efficiency between
pump and laser photons and is given as
ηq =ωL
ωpump, (5.42)
where ωpump = c/2πλpump is the pump frequency in radians. The integral
ηOI (Pabs) =
(∫dV ǫL(r)ǫP(r)
)2∫
dV ǫ2L(r)
∫dV ǫ2
P(r)(5.43)
95

5 Fundamental laser source at 1342 nm
evaluates a normalized overlap of the adimensional mode distribution factor ǫL(r) and the
normalized pump distribution ǫP(r) of the laser and pump beams, respectively. We note that
the normalizations are chosen such that∫
dV ǫL(r) = V and∫
dV ǫP(r) = 1. The pump power
absorbed in the gain medium of length lcry can be written as
Pabs = (1 − e−αabslcry)Ppump , (5.44)
where αabs denotes the linear absorption coefficient for the pump radiation and Pp the pump
power incident on the gain medium. Equation (5.39) includes moreover the absorbed pump
power at lasing threshold
Pth (Pabs) =Isat
ηqlcryαtot (Pabs) Veff (Pabs) , (5.45)
the saturation intensity Isat being defined as
Isat =~ωL
σemτrad, (5.46)
containing the emission cross section σem and the excited state lifetime τrad. The values of
both material parameters are well known by spectroscopic measurements, as presented in
Section 5.1.2. Equation (5.45) furthermore includes the effective volume
Veff =
∫dV ǫL(r)∫
dV ǫL(r)ǫP(r). (5.47)
It is apparent from Equations (5.39), (5.40) and (5.45) that the maximum output power is
achieved in the limit of an on-axis Delta-peak-shaped pump distribution. Apart from being
impossible to be realized experimentally, we have seen in section 5.2.2 that in the presence
of a real gain medium this would lead to detrimental thermal effects.
5.2.4. Laser cavity design
In the following subsection we will substantiate the chosen cavity design of our improved laser
version by taking into account the theoretical assertions presented above and considering the
imposed design constraints. Since we had already gained some experience with the first IR-
laser version pumped at 808 nm, that was presented in [184, 209], we considered its design
principals as a starting point for a sufficiently flexible setup that could be adapted to the
modified system parameters due to our thermal lens compensation attempts. In general, the
chosen laser design is supposed to account for several important issues.
A first important point is the optimization of the total optical L cavity length that determines
the free spectral range ∆ν = c/L. On the one hand, the cavity length has to be as short
as possible, since longitudinal single-mode operation becomes easier to achieve by increasing
the spectral mode spacing. On the other hand, we had also to take into account the space
requirements imposed by the insertion of additional intra-cavity elements. As we will point
96

5.2 Laser cavity design: Theory and realization
138
18.5
25
645
642.5
54.5
45.5
53
18.64
70
Figure5.10.–Technical
drawingof
thefinal
cavitygeom
etry,includingallintra-cavityelem
ents.Theringcavityconsistsof
fourmirrors
M1−
4,whereM
1isthezero
lenspumpcouplingmirror,M
2istheflat
outputcouplingmirror,an
dM
3an
dM
4areconcave.Besides
thelaser
crystal,intra-cavityelem
ents
arethehalf-w
aveplate
λ/2,aTGG
crystal
inalargemag
net
ensemble
andtw
oetalon
sE
1−
2.Thepumpspot
radius
wpin
theNd:Y
VO
4crystal
canbevaried
byusingdifferentsets
oftelescop
elenses
f 1an
df 2.
97

5 Fundamental laser source at 1342 nm
out in the following sections, we need to introduce beside the gain medium, a Faraday rotator,
a half-wave plate, and two etalons in order to enforce unidirectional single-mode behavior.
In order to handle the resulting geometric constraints, which are mainly due to the magnet
ensemble of the TGG Faraday rotator with its outer dimensions of 50 × 50 × 65 mm3, the
entire laser cavity was designed using the Dassault CATIA CAD-software. The cavity length
was further reduced by mounting all optic elements with small-size holders. A schematic
3D-view of the laser setup has already been shown shown in Figure 5.1, and additionally a
technical drawing is given in Figure 5.10.
100 150 200 250 300 350 400−2
−1
0
1
2Stability Parameters
f in mm
m
100 150 200 250 300 350 400
400
600
800
1000Waist at laser crystal entrance
f in mm
w in
m
Figure 5.11: The stability diagram (upper panel, see Equation (5.14)) and the mode sizes (lowerpannel) in the laser crystal as a function of the thermal lens focal length fth. The black (red) linesdenote the horizontal (vertical) direction. The vertical line indicates the limit of cavity stability. Theresonator remains stable down to fth,min = 135mm.
We continued to use the bow-tie cavity configuration as it was presented in [184,209] because
it features many advantages. The resonator eigenmode is practically collimated between the
convex zero lens mirror M1 and the plane mirror M2, and we have in this region enough
space at our disposal for the installation of the additional intra-cavity elements, in particular
98
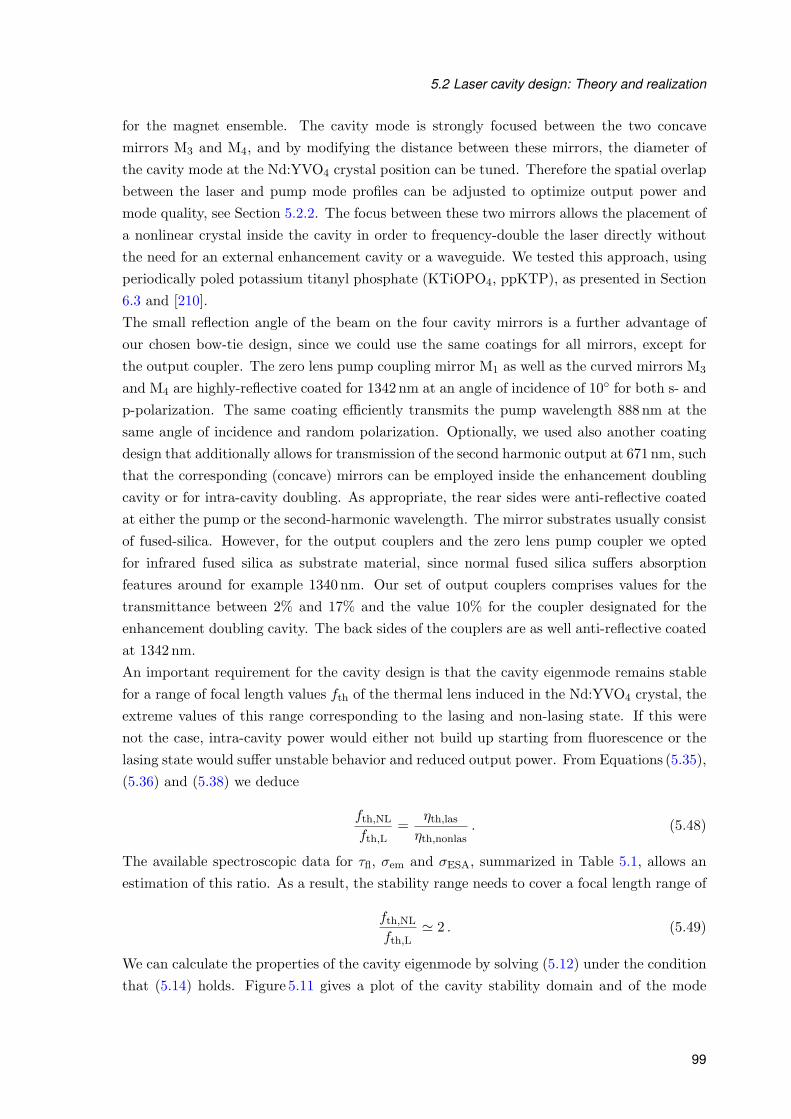
5.2 Laser cavity design: Theory and realization
for the magnet ensemble. The cavity mode is strongly focused between the two concave
mirrors M3 and M4, and by modifying the distance between these mirrors, the diameter of
the cavity mode at the Nd:YVO4 crystal position can be tuned. Therefore the spatial overlap
between the laser and pump mode profiles can be adjusted to optimize output power and
mode quality, see Section 5.2.2. The focus between these two mirrors allows the placement of
a nonlinear crystal inside the cavity in order to frequency-double the laser directly without
the need for an external enhancement cavity or a waveguide. We tested this approach, using
periodically poled potassium titanyl phosphate (KTiOPO4, ppKTP), as presented in Section
6.3 and [210].
The small reflection angle of the beam on the four cavity mirrors is a further advantage of
our chosen bow-tie design, since we could use the same coatings for all mirrors, except for
the output coupler. The zero lens pump coupling mirror M1 as well as the curved mirrors M3
and M4 are highly-reflective coated for 1342 nm at an angle of incidence of 10 for both s- and
p-polarization. The same coating efficiently transmits the pump wavelength 888 nm at the
same angle of incidence and random polarization. Optionally, we used also another coating
design that additionally allows for transmission of the second harmonic output at 671 nm, such
that the corresponding (concave) mirrors can be employed inside the enhancement doubling
cavity or for intra-cavity doubling. As appropriate, the rear sides were anti-reflective coated
at either the pump or the second-harmonic wavelength. The mirror substrates usually consist
of fused-silica. However, for the output couplers and the zero lens pump coupler we opted
for infrared fused silica as substrate material, since normal fused silica suffers absorption
features around for example 1340 nm. Our set of output couplers comprises values for the
transmittance between 2% and 17% and the value 10% for the coupler designated for the
enhancement doubling cavity. The back sides of the couplers are as well anti-reflective coated
at 1342 nm.
An important requirement for the cavity design is that the cavity eigenmode remains stable
for a range of focal length values fth of the thermal lens induced in the Nd:YVO4 crystal, the
extreme values of this range corresponding to the lasing and non-lasing state. If this were
not the case, intra-cavity power would either not build up starting from fluorescence or the
lasing state would suffer unstable behavior and reduced output power. From Equations (5.35),
(5.36) and (5.38) we deduce
fth,NL
fth,L=
ηth,las
ηth,nonlas. (5.48)
The available spectroscopic data for τfl, σem and σESA, summarized in Table 5.1, allows an
estimation of this ratio. As a result, the stability range needs to cover a focal length range of
fth,NL
fth,L≃ 2 . (5.49)
We can calculate the properties of the cavity eigenmode by solving (5.12) under the condition
that (5.14) holds. Figure 5.11 gives a plot of the cavity stability domain and of the mode
99

5 Fundamental laser source at 1342 nm
radius at the position of the laser crystal as a function of the focal length fth of the thermal
lens. It shows that the cavity stability range reaches from infinite focal lengths, corresponding
to no thermal effects, down to fth,min = 135mm. The dependence of the mode radius inside
the Nd:YVO4 crystal on fth is also given, reaching from 480µm to 700µm.
The optimal ratio of cavity mode size and pump beam size for high-power lasers, namely for
Pabs > 10W, is given as [211]
wL
wp≃ 0.8 . (5.50)
The mode overlap can be readily optimized for a given value of the thermal lens fth by tuning
the distance between the two curved mirrors M3 and M4. We realized this in practice by
mounting M4 on a linear translation stage and adjusting its position to optimize the output
power and the spatially single-mode quality at the same time, because a too small mode
size can lead to the excitation of undesirable higher order modes that artificially increase
the output power. The radii-dependence calculated as a function of the mirror distance is
plotted in Figure 5.12 for a focal length of fth = 170mm, as measured in Subsection 5.2.2.
The accessible waists in the crystal cover thus a range from 520µm to ∼ 1000 µm.
We note, that the distances of the optical elements in our setup can only be determined with a
precision on the order of 1mm. The values for the calculated stability parameters and waists
presented in this section depend, however, significantly on these distances. Furthermore,
neither the analytic model nor the performed measurement of the thermal lensing effect
inside the Nd:YVO4 crystal, as presented in Section 5.2.2, can give a precise value of the
thermal focal length under optimized lasing conditions. We thus refer to Section 5.4.3, where
the measured optimized cavity eigenmode is presented permitting another determination of
this parameter.
The pump source is a temperature-stabilized fiber-coupled QPC BrightLase Ultra-50 diode
stack (NA = 0.22, 400µm fiber core diameter), emitting up to 42.6W at 888 nm (Spectral
width (FWHM): 2.2 nm). It is cooled down to 4C to optimize the spectral overlap between
pump emission and the gain medium absorption. The fiber output is imaged by two lenses
(f1 = 75mm, f2 = 175mm) to a top-hat profile of radius wpump = 970µm inside the laser
crystal. The dimensions of the Nd:YVO4 crystal (a-cut, anti-reflection coated for 1342 nm
and 888 nm) were chosen to be 4 × 4 × 25mm3 and the ion doping was accordingly adjusted
to 0.5 at.%. It is wrapped in Indium foil and fixed in a solid water-cooled copper mount to
efficiently remove heat. Care needs to be taken to avoid acoustic perturbations of the mount
due to turbulent water flow, thus only a small continuous flux of tap water was applied to
prevent power and frequency fluctuations of the laser output. The pump coupling mirror
M1 is, as mentioned above, a convex meniscus mirror with a radius of curvature of 500mm
whereas M3 and M4 are concave mirrors with a radius of curvature of 100mm and 150mm,
respectively. The optimal transmittance of the flat output coupler M2 regarding the maximum
output power was found to be 7.5%.
100

5.3 Single-mode operation and frequency tuning
110 120 130 140 150−2
−1
0
1
2Stability Parameters
d in mm
m
110 120 130 140 150400
500
600
700
800
900
1000Waist at laser crystal entrance
d in mm
w in
m
Figure 5.12: (Upper Panel) The stability parameters of the laser cavity as a function of the distancedcu between the curved mirrors M3 and M4. The thermal focal length is fixed to 170mm. (UpperPanel) The mode sizes in the laser crystal wh(v), the black (red) lines denoting the horizontal (vertical)direction, whereas the vertical lines indicate the range of stability.
The laser cavity elements were mounted on a standard optical table. A temporary housing
made of polyvinyl chloride was placed around the cavity in order to keep the setup contin-
uously under a dry-air atmosphere preventing dust and moisture from having detrimental
effects on the long-term performance of the system.
5.3. Single-mode operation and frequency tuning
The fundamental IR laser source is supposed to emit single-frequency light, since it is intended
to be employed in the context of atom cooling and trapping. In this section we will present
the technical methods applied to force unidirectional laser operation in a single longitudinal
mode.
101

5 Fundamental laser source at 1342 nm
5.3.1. Unidirectional operation via Faraday rotator
Running-wave resonators are the preferred choice for realizing a single-longitudinal-mode
laser, since standing-wave cavities suffer from the fact that standing waves in the active
medium cause spatial hole burning. As a consequence, different longitudinal modes address
distinct areas of the gain medium, which partially suppresses mode competition [200].
There exist two approaches for realizing a running-wave laser. A first option is the twisted-
mode linear cavity [212], however it cannot be operated together with a birefringent gain
medium like Nd:YVO4. The alternative approach is to force unidirectional operation of a
ring cavity. For this purpose, several methods were presented in the past [213–215]. We
decided for the insertion of a Faraday rotator and a zero-order half-waveplate inside the
cavity that serve together with the birefringent laser crystal as an optical diode.
A linearly polarized light beam experiences a rotation βrot of its polarization axis when
propagating through a medium exposed to a magnetic field component Bz in the propagation
direction z:
βrot = V∫ lF
0Bz(z) dz . (5.51)
This expression contains a path integral over the magnetic field in the medium of length
lF and the Verdet constant V which is material- and wavelength dependent. This constant
drops significantly for higher wavelengths outside the visible range and the absorption rises
in the near-infrared. Therefore the use of a short crystal in a strong magnetic field is more
appropriate. Furthermore a transversal variation of the beam polarization has to be avoided
by assuring a sufficiently homogeneous field.
In order to meet these requirement Gerard Trenec and coworkers developed an appropriate
magnet assembly that consists of a NdFeB ring magnets ensemble [216]. It is designed for
Faraday crystals with a length of 6mm and 5mm diameter providing a magnetic field of 1.5T.
Accordingly, the measured value for the magnetic field path integral is∫
Bz(z) dz = 9 T.mm.
The bulky housing with outer dimensions of 50 × 50 × 65 mm3 is the most limiting constraint
for building a compact cavity, as presented in 5.2.4.
We chose Terbium gallium garnet (TGG) as Faraday medium, being the standard material
for near-infrared lasers. Our TGG sample was purchased from FEE 1, since their samples
have featured relatively large Verdet constants in the past. The measurement of the single-
pass rotation angle for the TGG sample placed in the Faraday rotator yields β = 8.9(1)
corresponding to a Verdet constant V = 17.3(2) rad.T−1.m−1.
An anti-reflective-coated, zero-order λ/2-wave plate serves as polarization back-rotating de-
vice. We avoided utilizing multi-order wave plates because at high intra-cavity powers in-
stabilities related to thermal effects can occur [217]. Since the Nd:YVO4 crystal provides a
higher gain in the c-direction and is moreover birefringent, it acts as the intra-cavity polar-
1 Forschungsinstitut fur mineralische und metallische Werkstoffe -Edelsteine/Edelmetalle- GmbH
102

5.3 Single-mode operation and frequency tuning
izer. The lasing direction is chosen as indicated in Fig. 5.1, the output beam being spatially
separated from the residual pump light.
5.3.2. Frequency-selective filtering via Etalons
Single longitudinal mode operation can be facilitated by the laser design, as it was presented
before, for instance by using a running-wave resonator. A compact cavity setup further-
more provides the largest possible free spectral range, meaning the largest longitudinal-mode
frequency spacing
νFSR,laser =c
Lopt≃ 320 MHz , (5.52)
where Lopt is the optical path length of a cavity round-trip and c is the vacuum speed of light.
Since the gain peak of Nd:YVO4 is ≃ 280GHz broad, and thus three orders of magnitude
larger than νFSR, additional arrangements have to be made to ensure laser operation in only
a single longitudinal mode. Therefore two etalons are introduced into the cavity in order to
modulate the transmission function of a cavity round-trip.
An etalon is a small frequency-selective Fabry-Perot resonator whose transfer function, in the
limit of plane waves, is given by
TFP =
1 +
2F
πsin
(π
ν − νres
νFSR,etalon
)
2
−1
, (5.53)
where νres is a constant offset frequency that summarizes the phase shifts due to the optical
coatings. The parameter F , the so-called finesse, is defined as
F =π
√R
1 − R, (5.54)
with the power reflectivity R of both surfaces. The resonance condition TFP = 1 is ful-
filled for the corresponding resonance frequencies νp = p νFSR,etalon + νres, p ∈ N, similar to
Equation (5.22).
By inspecting the product Tcav(ν) × σem(ν) we can characterize a condition for single mode
operation. Tcav(ν) is defined as the total transmission function of one cavity round-trip and
is, in good approximation for the amplified frequency range, only determined by the impact
of the etalons. The gain accumulated by a light beam passing through the gain medium is
furthermore proportional to σem(ν). If the product Tcav(ν) × σem(ν) is, for small signals,
larger for one particular cavity mode p than for all other modes, these cavity modes will
be suppressed and prevented from oscillating due to mode competition [200]. Therefore the
laser will operate only in the favored mode with mode index p as soon as sufficient mode
competition is provided by the optical elements inside the ring cavity.
For the choice of appropriate etalons we have, according to Equations (5.53)–(5.54), two
parameters at our disposition. First of all, the free spectral range νFSR,etalon, which determines
103

5 Fundamental laser source at 1342 nm
the frequency spacing of the transmission peaks, is given by the diameter and the refractive
index of the etalon material. Secondly, the finesse F , which defines the modulation amplitude
and the peak width, is determined by the surface reflectivity of the etalon.
Furthermore the impact of losses has to be taken into account. Some losses depend on material
and fabrication quality of the etalon, like for instance residual absorption of the substrate and
coatings, scattering, as well as surface nonparallelity and roughness. They can be minimized
to negligible values by applying appropriate materials and methods in the etalon fabrication
process.
However, there is another loss mechanism called walk-off loss which cannot be avoided be-
cause of its fundamental cause. It is due to the fact that the etalon transmission function
presented in Equation (5.53) is strictly valid only in the limit of plane waves. For a beam
wave propagating through the etalon inside a cavity additional mode losses occur because of
the angle-dependent walk-off. It can be explained by the lateral walk-off of subsequent orders
of the transmitted waves, when the surface normal vector and the direction of propagation
of a Gaussian beam form an angle of incidence. The non-unity overlap integral between the
cavity mode and the transmitted beam leads to insertion loss when installing a tilted etalon
in a resonator [218].
5.3.3. Etalon parameters
We opted for a combination of two etalons inside the cavity in order to realize a tunable
single-frequency laser. Using a first uncoated etalon E1 with a width of 0.5mm and R =
3.3%, distant modes are efficiently suppressed. For suppression of closely-spaced modes from
oscillating, we employed a thicker uncoated etalon E2 with a width of 4mm. The typical
frequency scales are summarized in Table 5.2. The substrate material of both etalons is
infrared fused silica. With this combination of etalons presented here, reliable single-mode
operation and frequency tunability was achieved.
Element Length L Typ. freq. Typ. R Finesse F Q-factor
Gain profile width - 280GHz - - -Laser cavity 93 cm 320MHz 92.5% 40 2.8 × 10⁷
Etalon E1 0.5mm 210GHz 3.3% 0.6 6.4 × 10²
Etalon E2 4mm 26GHz 3.3% 2.1 5.1 × 10³
Table 5.2. – Frequency scales of the setup. The characteristic frequencies are the free spectralranges νFSR and the width (FWHM) of the gain profile taken from [195]. Reflectivities R aregiven for the output coupling mirror of the laser cavity and for the two etalon surfaces. Thefinesses F and Q-factors are calculated from the indicated R-values, not taking into accountfurther losses.
In Figure 5.13 we present a possible realization of a transmission-gain function Tcav(νp) ×σem(νp) calculated by using the data shown in Figure 5.5. The reflectivity of E1 and E2
was set to 15% for this plot in order to improve the visibility of their effects. We note
that the resolution of the spectroscopic data is 0.5 nm or 80GHz, meaning that additional
104

5.3 Single-mode operation and frequency tuning
−100 0 100 200 300 400 5000
5
10
15
20
25
p − 223 THz [GHz]
T c
av(
p)
e
m(
p)
[a.u
.]
Figure 5.13: Possible realization of a transmission-gain function Tcav(νp) × σem(νp) in the non-saturated regime for two etalons as indicated in Table 5.2, except for RE1
= RE2= 15%. The black
vertical line represents half the Li D-line transition frequency. The blue line is the spectroscopy datafor σem(νp) from [195], the red line is σem(νp) modulated by E1 only. The green line is σem(νp)modulated by both etalons, and the black line is the transmission of E1 in a.u. The cavity modesspaced by νFSR = 320MHz are not resolved here.
sub-structures are smoothed out. The actual measurement of the single-frequency output
spectrum of the laser is given in Section 5.4.2 .
The installation of an intra-cavity etalon requires a minimum tilt angle ϑmin with respect to
the cavity mode propagation direction in order to avoid the creation of additional coupled
cavities and a highly unstable behavior of the laser. An estimate of this angle is the cavity-
eigenmode beam divergence, which is at most 2.3mrad in our case. This value corresponds
to the Gaussian beam mode inside the cavity with a minimal waist radius of 375µm, see
Section 5.4.3. Any angular etalon tuning will start from this point with a minimum tilt loss
towards higher tilt angles and losses.
The offset frequency νres and the free spectral range νFSR,etalon in the etalon transmission
function (5.53) include an arbitrary etalon diameter offset, given the fact that the etalon
diameter Letalon can only be fabricated with a precision larger than the laser wavelength.
This means that in the worst case one has to tune the etalons by νFSR,etalon = c/(2nLetalon)
to reach the lithium resonance. In the case of the thinner etalon E1, tilt losses are negligible
over this range. The walk-off losses of E2 are, however, significantly higher and reach several
percent for angular tuning over one free spectral range [209]. Therefore we decided to adjust
this etalon to its minimum angle and to tune its temperature instead, which proposes another
mean for acting on the laser frequency.
The mode-hop-free scan range of the laser was measured to be ≃ 450MHz, slightly higher
than the free spectral range νFSR = 320MHz, see (5.52).
105

5 Fundamental laser source at 1342 nm
We note that single-mode operation is significantly favored when intra-cavity frequency dou-
bling of a laser is applied, as presented in Section 6.3. In this case, mode competition is en-
hanced due to sum-frequency generation, causing higher losses for the low-power modes [219].
5.3.4. Etalon temperature tuning
As mentioned before, angle tilting of E2 should be avoided because of the occurring losses
inherent to this frequency tuning method. Another mean to shift the resonance comb of
an etalon is to tune its temperature, since both its length L and refractive index n are
temperature dependent. The variation in frequency is given by
∂νp(T )
∂T= p
∂νFSR(T )
∂T= −p νFSR
(1
n
∂n
∂T+
1
L
∂L
∂T
), (5.55)
where n is the refractive index and L the geometric diameter of the etalon. For fused silica the
values of the derivatives are ∂n∂T = 12.2 · 10−6K−1, with n = 1.446, and 1
L∂L∂T = 5.5 · 10−7K−1
according to [220,221]. As a consequence, E2 requires a temperature variation ∆T = 13K to
tune over a full spectral range.
Furthermore etalon E2 is temperature-stabilized to avoid frequency and mode-hop drifts
during the warm-up process and the operation of the laser setup. For temperature tuning and
stabilization, E2 is enclosed in a temperature-regulated copper mount stabilized to ≃ 0.1K.
5.4. Characterization of performance
In this sections we will present our measurements on the output power and the output spec-
trum of the IR laser source, as well as the spatial mode properties of the output beam
providing further information about the thermal lens induced in the gain medium.
5.4.1. Output power
The output power of a laser system is naturally one of its most important features. It
determines both the design and the potential applications of a particular laser source. In this
subsection we will present the measurements concerning the output power of our fundamental
laser.
The optimization of the laser output power was performed in several steps, starting with
an empty cavity that was pumped at maximum absorbed pump power. This means that in
the beginning all optical elements that are not necessary for lasing had not been inserted
in the cavity, including the TGG, the half-waveplate and the two etalons. In this way the
spatial overlap between the pump beam and the fundamental cavity mode could be optimized
(cf. Equation (5.50)) without being affected by the additional power-modulations due to the
frequency selectivity of the etalons. Moreover, in the empty cavity it was possible to put a
power meter directly behind the Nd:YVO4 crystal in order to measure the powers incident
106

5.4 Characterization of performance
on the laser crystal, Ptot,as well as the non-absorbed power transmitted through it, Ptrans.
Thus the absorbed pump power, Pabs, could be deduced.
As the effective pump absorption coefficient depends on the spectrum of the pump source,
see Section 5.1, the central pump wavelength needs to be tuned in order to match the peak
at 888 nm in the absorption spectrum of Nd:YVO4. Our pump source being a semiconductor
diode stack, its central emission wavelength can be shifted by changing its temperature. For
this purpose, we use a water chiller with variable set temperature inside a closed cooling
water circuit. The cooling water temperature is in general set to 4C.
0 5 10 15 20 25 30 35 40 45 50 55 60 65 700
5
10
15
20
25
30
35
40
45
Pump diode current Ip [A]
Pow
er
P [W
]
Ptot
Pabs
Ptrans
Figure 5.14: Absorption of the pump light (wpump = 970µm) by the 25mm long Nd:YVO4 crystalwith 0.5 at.% doping. Shown are the total power incident on the laser crystal Ptot, the transmittedpower Ptrans and the absorbed pump power Pabs as a function of the current Ip passing through thepump diode stack at a cooling water temperature set to 4C. Saturation of pump light absorption setsin at Ip = 57A.
Figure 5.14 presents the absorbed pump power Pabs as a function of the current Ip applied to
the pump diode stack. It was measured as the difference of the total pump power incident on
the crystal Ptot and the pump power transmitted through the crystal Ptrans, since reflection
on the Nd:YVO4 crystal facets is negligible due to their AR-coating. The absorbed power
rises quasi-linearly with the incident pump power up to Ip ≃ 57A, where the pump diode
stack emission probably changes its spectral output characteristics. The maximum absorbed
pump power is 31.3W.
All measurements presented in the course of this work were taken at Ip = 57A, if not
otherwise stated, since it represents the highest pump absorption value and no degradation
of the laser parameters was observed even for the maximum power output of the laser source.
The current passed through the diode bar is kept constant at this value for Ip to stabilize the
laser output power.
107

5 Fundamental laser source at 1342 nm
15 20 25 30
2
4
6
Absorbed pump power @ 888 nm (W)
Outputpow
er@
1342
nm
(W)
(a)
15 20 25 30
0
2
4
6
Absorbed pump power @ 888 nm (W)
Outputpow
er@
1342
nm
(W)
(b)
Figure 5.15: (a) Output power of the laser without additional frequency selective elements (dots)as a function of the absorbed pump power. Linear fits were performed in the low power limit (greenline) close to the lasing threshold as well as in the high power regime (red line) for Pabs > 20W.(b) Single-frequency laser output power of the complete Nd:YVO4 laser setup including both etalonsas a function of the absorbed pump power.
108

5.4 Characterization of performance
The cavity power output characteristics in the absence of both etalons are presented in
Figure 5.15(a). We inserted the TGG and the waveplate in the cavity in order to enforce
unidirectionality for this measurement. Thus the output power is leaving the cavity in only
one beam direction via the output coupler M2. The output coupler mirror was chosen out
of the discrete set of available transmission values to be T = 7.5% to optimize the maximum
output power at maximum absorbed pump power in the presence of all additional intra-cavity
elements.
The lasing threshold is found at Pthr = 12.2W and the maximum emitted power Pω,max =
6.7W, whereas the slope efficiency amounts to ηsl,low = 95% in the low power limit next to
the lasing threshold and drops to ηsl,high = 23.9% in the high power regime for absorbed
pump powers Pabs > 20W. The non-linear behavior is in contradiction with (5.39) assuming
constant thermal loss Lth, which means that the thermal loss Lth increases with the absorbed
pump power Pabs. Another possible explanation is that the overlap integrals (5.43) and (5.47)
change accordingly due to the modified cavity parameters in presence of thermal lensing inside
the gain medium, yielding the non-linear behavior observed. Yet the laser output power at
high pump powers is well fit by a straight line, not showing any signs of thermally induced
instabilities.
Figure 5.15(b) shows the output power characteristics of the laser in the presence of all addi-
tional intra-cavity elements. The lasing threshold was in this case found at an absorbed pump
power Pabs = 13.7W. The power rises in this case with a slope efficiency of ηsl,low = 83% in
the low power limit and decreases to ηsl,high = 28.1% in the high power regime. As compared
to the case of lasing operation without additional frequency selective elements inside the cav-
ity, the maximum output power amounts to about Pω,max = 6.55W corresponding to 98% of
the maximal value. The lasing threshold is significantly higher, whereas the slope efficiency
is lower in the low power limit and similar in the high power limit. These are indications of
losses induced by the etalons.
In conclusion, we state that the maximum output power of the IR laser is not limited by
detrimental thermal effects but by the maximal output power of the installed pump diode
stack. Thus by increasing the pump power, we can expect a further enhancement of the
available output power at 1342 nm.
5.4.2. Output spectrum
The emission spectrum of the laser was measured, as shown in Figure 5.16, by changing the
temperature of etalon E2 and optimizing the respective output power. This measurement was
based on a slightly modified fundamental laser cavity employing a 1.0%at.-doped NdYVO4
crystal, as presented in Section 6.3 and [210]. This explains the lower overall power level
compared to Section 5.4.1. Nevertheless its results remain valid for the current version of the
IR laser source.
The spectrum has a total width of about 1 nm and is smooth except for three narrow dips at
1341.85 nm, 1342.1 nm and 1342.7 nm, where the laser operation is unstable and mode-hops
109

5 Fundamental laser source at 1342 nm
1341.7 1341.8 1341.9 1342 1342.1 1342.2 1342.3 1342.4 1342.5 1342.6 1342.70
0.5
1
1.5
2
2.5
Wavelength [nm]
IR O
utp
ut P
ow
er
[W]
2x λ(Li)
AA B C
λ
Figure 5.16: Output power of the laser as a function of the emission wavelength (dots, the lines beingonly guides for the eye). This measurement was based on a slightly modified fundamental laser cavityemploying a 1.0%at.-doped NdYVO4 crystal, as presented in Section 6.3 and [210]. This explains thelower overall power level compared to Section 5.4.1. The values corresponding to twice the lithiumD-line wavelengths are indicated by vertical lines. For easy comparison, all wavelengths are given invacuum values. We note that the wavelength regions marked A,B,C where the output power dropssharply and stable operation of the lasers can not be established coincide with absorption peaks ofwater molecules.
towards stable regions occur. These power dips can be explained by absorption features of
water molecules in the laser cavity, as it can be shown by a water vapor absorption spectrum
obtained from the HITRAN database [210,222]. The wavelength values corresponding to the
lithium D-line resonances after frequency doubling are advantageously situated in between
the two first dips, and the emitted power is close to the emission maximum. Laser operation
on the lithium resonance wavelength, being the essential requirement for its application in
the context of lithium laser cooling, is therefore readily accomplished.
5.4.3. Spatial mode
Our laser setup was designed to deliver a spatially single-mode, Gaussian (TEM00) output
beam. In order to verify the actual beam quality, we performed a measurement of the beam
profile. For this purpose, the laser beam was focused by a lens of f = 200-mm focal length
and images of the beam profile were taken at different distances using a LuCam LU055M
camera which has still a low sensitivity at 1342 nm, even though it is only equipped with a
Silicon CCD sensor. Measuring the beam waist as a function of the position of the camera
along the beam propagation direction, we can extract the beam quality factor M2 by fitting
Gaussian distributions to the obtained camera images and performing a fit to
110

5.4 Characterization of performance
w2(z) = w20 + M4
(λ
πw0
)2
(z − z0)2 , (5.56)
which is a generalization of Equation (5.6). M2 quantifies the degree of variation of the
actual beam from a pure Gaussian (TEM00) beam for which it equals one. As illustrated in
Figure 5.17 for the horizontal direction, we obtain M2x = 0.97(6) (horizontal direction) and
M2y = 0.95(8) (vertical direction) from the fits, both values being indistinguishable from unity
within our experimental resolution. Therefore we state that the output laser beam quality is
excellent, which is an important feature for efficient mode matching and frequency doubling,
as will be presented in chapter 6.
100 150 200 250 3000
0.1
0.2
0.3
0.4
0.5
0.6
Distance to lens [mm]
Be
am
ra
diu
s w
x(z
) [m
m]
Figure 5.17: Beam quality measurement performed on the horizontal direction of the laser outputbeam. The M2 fit yields a value compatible to M2 = 1, or pure Gaussian (TEM00) output.
The laser cavity design presented in Section 5.2 can only give approximate predictions for
the mode sizes wx/y of the emitted beam, which is due to the lack of precise values for the
material parameters and the simplifications made in the theoretical description of thermal
lensing process. However, precise knowledge of the output beam parameters is crucial for the
mode-matching that has to be performed between the laser beam and either the doubling
cavity or the waveguide coupling fiber, as will be described in chapter 6. The beam parameters
of focus position z0 and Rayleigh length zR were therefore measured, while assuming M2 ≡ 1,
as justified before.
The beam profiling is performed by measuring the radii of the output laser beam at different
distances from the output coupler mirror M2. The comparison of the obtained beam param-
eters to the cavity calculations yields another method for measuring the focal length of the
thermal lens present in the laser crystal under lasing conditions.
Figure 5.18 shows the results yielding z0,x/y = −98(12) mm/−118(22)mm and w0 = 374(12) µm/
436(34) µm in the horizontal/vertical direction. Backtracing the beam path through the laser
resonator indicates a thermal focal length of fth = 340 mm, as the resulting cavity eigenmode
can be deduced from the cavity geometry, see Figure 5.19.
111

5 Fundamental laser source at 1342 nm
The obtained value for the thermal lens is therefore by a factor two larger than the value
fth = 170 mm measured in Section 5.2.2. We attribute this to the onset of thermal lensing in
the additional intra-cavity-elements (TGG, waveplate, etalons), which were not included in
the linear cavity setup of Figure 5.9. Furthermore the final ring laser is operating spatially
single-mode, whereas the test cavity in Section 5.2.2 was oscillating in multiple spatial modes,
which tends to increase the ESA contribution to the thermal load.
Comparing the pump mode radius of wP = 465 µm to the laser mode radius wl in the
Nd:YVO4 crystal, we obtain wl/wp = 1.0/1.15 in the horizontal/vertical direction, these
values being significantly greater than the optimal overlap of 0.8 predicted by Equation (5.50).
Together with the diminished thermal effect discussed before, this indicates lower aberrations
even at mode-size-to-pump-size ratios close to 1.
112

5.4 Characterization of performance
350 400 450 500 550 600
0.6
0.65
0.7
0.75
0.8
0.85
Distance to outcoupler mirror M2 [mm]
Beam
dia
mete
r w
[m
m]
Figure 5.18: Measurement of the beam parameters (red/blue: horizontalx/verticaly waist) of thelaser output beam. The fits assume M2 = 1. This measurement is needed to calculate the necessarycoupling optics for mode-matching the enhancement doubling cavity or the waveguide fiber. Theellipticity and astigmatism of the beam can in principle be corrected by cylindrical lenses.
0 100 200 300 400 500 600 700 800 9000
100
200
300
400
500
600
700
800
Be
am
ra
diu
s w
[m
]
Position z [mm]
Figure 5.19: The eigenmode of the laser resonator. The horizontal (black) and the vertical (red)widths of the laser beam mode are shown as a function of the position inside the cavity. The verticallines indicate the position of optical surfaces related to intra-cavity elements. z = 0 corresponds tothe position of the convex pump coupler (M1), and the sense of propagation is directed towards theoutput coupler (M2), which is located at 297mm.
113

5 Fundamental laser source at 1342 nm
5.5. Conclusion
In this chapter we have presented the improved design of a single-mode, diode end-pumped,
all-solid-state laser source emitting up to 6.5W at 1342 nm. It can be readily applied as a
fundamental source for second harmonic generation (SHG), the frequency doubled light being
usable to address the lithium D-line transitions next to 671 nm. We have justified our choice of
pumping the gain medium at a wavelength of 888 nm as a possibility to reduce the detrimental
thermal effects inside the Nd:YVO4 laser crystal. Thereafter, we have given an overview of
the theoretical concepts required to design a solid-state laser cavity, and presented eventually
the geometry and technical realization of our ring cavity. We then discussed the measures
applied to enforce unidirectional and longitudinally single-mode operation. Subsequently, we
have characterized the performance of our laser in terms of output power, emission spectrum
and spatial mode quality. The laser source is tunable from 1341.7 nm to 1342.7 nm and
reaches a maximum single-frequency output power of 6.5W. We have determined its M2
beam-quality factor to be approximately 1.0 and measured the output beam parameters.
Hence, we have finally been able to efficiently mode-match the powerful Gaussian infrared
beam to the doubling enhancement cavity and the SHG waveguide, which will be presented
in the next chapter.
114

6 Second harmonic generation
The output radiation at 1342 nm emitted by the IR laser source presented in the preceding
chapter has to be frequency-doubled in order to obtain light at the lithium D-line transition
wavelengths next to 671 nm. The applied frequency doubling technique needs to be efficient
and at the same time technically simple in order to realize a multi-Watt level second harmonic
output that is available for experiments on a daily basis. In this context we have tested
three approaches for second-harmonic generation (SHG), namely doubling via a resonant
enhancement cavity, intracavity doubling and wavelength conversion by means of a waveguide
module.
This chapter will present the different frequency-doubling setups that we have realized. In
Section 6.1, we will first give a brief overview of the theoretical concepts explaining second-
harmonic generation using periodically-poled nonlinear media. Furthermore we will con-
sider the physical properties of the nonlinear media chosen for our applications, namely of
periodically-poled potassium titanyl phosphate (ppKTP) and lithium niobate (ppLN). Sub-
sequently, we will present in Section 6.2 the design of the resonant enhancement cavity and
illustrate the results of the nonlinear conversion measurements. In an analogous manner we
will detail on the setup and results of the intracavity doubled laser in Section 6.3. The subject
of Section 6.4 will be the performance and the theoretical description of our third approach
for SHG, a wavelength conversion module employing a waveguide structure. Finally we will
summarize the chapter in Section 6.5.

6 Second harmonic generation
6.1. Theory of second-harmonic generation
In this section, we will consider the theoretical aspects related to the nonlinear interaction
of Gaussian beams propagating in free space or guided inside a waveguide structure. The
advantageous technique of quasi-phase matching will be described and compared to the alter-
native method of birefringent phase matching. Finally, we will discuss the physical properties
of periodically-poled potassium titanyl phosphate (ppKTP) and lithium niobate (ppLN) and
motivate the selection of ppKTP as the nonlinear medium in the resonant doubling cavity.
6.1.1. Nonlinear conversion
An electro-magnetic wave passing through a medium, causes a polarization P inside this
medium induced by the electric field E. The polarization vector P =∑
i Pi ei, represented in
the orthonormal set ei, can be decomposed as
Pi = ε0
∑
j
χ(1)ij Ej +
∑
jk
χ(2)ijkEjEk +
∑
jkl
χ(3)ijklEjEkEl + . . .
(6.1)
where ε0 is the vacuum permittivity and the susceptibility tensors χ(k) of rank k + 1 are
material-dependent and responsible for the optical processes of k-th order. Since we are in
the following interested in second-harmonic generation, we will focus on quadratic processes
only and neglect all higher-order terms, which is a good approximation for the light inten-
sities occurring in the setups presented in the course of this chapter. Several symmetries
impose restrictions on the form of the second order susceptibility χ(2) and reduce the number
of independent parameters. For example, χ(2) is only non-zero for crystals without inversion
symmetry and due to the Kleinmann symmetry χ(2) can in common cases be represented as
a 3 × 6 matrix containing only 10 independent elements djk [223]. In the context of the the-
oretical description of second-harmonic generation the nonlinear polarization is represented
by two terms [224]
PNLω (r) = 4ε0deffE2ω(r)E∗
ω(r) (6.2)
PNL2ω (r) = 2ε0deffE
2ω(r) , (6.3)
where deff is the effective nonlinear coefficient of the material for a specific polarization
and the indices ω and 2ω refer to the frequency of the fundamental and second harmonic
wave, respectively. The evolution of both waves can be obtained by solving the coupled wave
equations
(∇2 + k2)Eω,j(r) = −4ε0µ0ω2djkE2ω,k(r)E∗
ω,j(r) (6.4)
(∇2 + k2)E2ω,k(r) = −2ε0µ0(2ω)2djkE2ω,j(r) , (6.5)
116

6.1 Theory of second-harmonic generation
which can be solved analytically in the paraxial limit. In the case of weak conversion, or in
other words, if the pump is not depleted, the result is in general a second harmonic output
power P2ω obeying a quadratic dependence on the fundamental or pump beam power Pω,
P2ω = ηSHGP 2ω , (6.6)
where ηSHG is the conversion efficiency. For the particular case of second harmonic interaction
of a focused Gaussian beam, the following expression for ηSHG was derived in [223,225,226]:
ηSHG =2ω3d2
effL
πε0c4nωn2ωh(α, β) , (6.7)
with nω and n2ω being the corresponding refractive indices of the material, L the length of the
nonlinear material and c the vacuum speed of light. The function h(α, β) can be expressed
as
h(α, β) =1
4α
∣∣∣∣∣
∫ α
−α
eiβτ
1 + iτdτ
∣∣∣∣∣
2
, (6.8)
where the focusing parameter α = L/2zR depends on the Gaussian beam Rayleigh length zR
which can be shown to be equal for both waves, resulting in a waist by a factor√
2 smaller for
the second harmonic beam compared to the fundamental beam waist. The phase-matching
parameter
β = β(T ) =4πzR
λ
(nω(T ) − n2ω(T )
), (6.9)
with λ being the fundamental vacuum wavelength, depends on the temperature and also on
the polarizations in the case of a birefringent medium. The derived formulas assume absence
of losses and a non-depleted fundamental wave. The integral in Equation (6.8) can be solved
analytically for the two limits α → 0 (strong focusing) and α → ∞ (plane wave), whereas
in general it has to be calculated numerically. The global maximum of h(α, β) is found at
hmax(2.84, 0.57) = 1.068, the optimal value for β being non-zero which would be unexpected
for plane waves. This is due to the fact that we consider here Gaussian beams which feature
a wave front curvature and a Gouy phase shift. Entering values for the usual parameters of
nonlinear media into these formulas yields doubling efficiencies ηSHG on the order of %/W,
meaning that for the available continuous laser power of several Watts, single pass doubling
cannot be considered as an efficient option. Therefore we need to employ either resonant
enhancement inside a cavity or a longer interaction length inside a waveguiding structure.
6.1.2. Quasi-phase matching
An efficient conversion process requires the phase-matching parameter β to be close to zero,
such that fundamental and second-harmonic wave remain always in phase. Since all optical
materials feature dispersion, this condition is in general not fulfilled. Nevertheless it exist
several techniques of phase-matching using angular- and temperature tuning in birefringent
117

6 Second harmonic generation
crystals in order to realize β ≃ 0, as illustrated for example in [223]. Using different polariza-
tion axes results, however, only in relatively small conversion efficiencies, as the off-diagonal
values of djk are in general small compared to the diagonal elements djj . Quasi phase-
matching, which was proposed by Armstrong et al. [224] and realized by [227], is a technique
that allows to circumvent these restrictions and avoids furthermore the necessity of cumber-
some angle tuning. This method is based on the idea to invert the direction of the optical
crystal axis as soon as the phase shift between the polarization driven by the fundamental
wave and the second harmonic wave becomes destructive for the latter. The polarization then
oscillates with an additional phase shift of π and in consequence contributes constructively
to the second harmonic wave. The poling period Λ is therefore chosen to be the length of the
region over which the phase shift acts constructively. Hence, quasi phase-matching allows for
access to the considerably larger diagonal elements djj of the nonlinear tensor thus offering a
higher single-pass efficiency ηSHG while keeping the phase matching condition β close to opti-
mum. A widely used approach, which originated from Yamada et al. [228], is the application
of a static electric field to invert the orientation of the ferroelectric domains, and consequently
of the crystalline c-axis, in bulk ferroelectric materials. Quasi-phase matching is especially
favorable in the context of cavity enhancement since an excellent beam quality is achievable
without suffering from beam walk-off effects [223, 229]. The equations (6.6)–(6.9) hold also
for quasi-phase matched samples with poling period Λ, but the following replacements have
to be performed for the phase matching parameter
β → β − 2πzR/Λ (6.10)
and the effective conversion coefficient
deff → dQ = 2deff/π . (6.11)
From Equations (6.7) and (6.11) we therefore obtain an efficiency improvement of the second-
harmonic generation process of
ηSHG,QPM
ηSHG,BPM≈(
2
π
djj,max
djk,max
nj,ω
nk,ω
)2
, (6.12)
where the index extensions of ηSHG indicate quasi phase-matching (QPM) and birefringent
phase-matching (BPM). Using the data from [230], this yields in the case of potassium titanyl
phosphate (KTP),
ηQPM
ηBPM≈(
2
π
d33
d32
)2
≈ 6 , (6.13)
indicating a significantly enhanced single-pass doubling efficiency for QPM in comparison to
BPM.
118

6.1 Theory of second-harmonic generation
6.1.3. Physical properties of the selected nonlinear media
In this subsection, we will discuss the physical properties of the selected nonlinear media
for our frequency-doubling applications: periodically-poled potassium titanyl phosphate (pp-
KTP) used in the resonant enhancement cavity and for intracavity doubling, and periodically-
poled lithium niobate (ppLN) as the substrate of the doubling waveguide.
As we have shown in Section 6.1.2, periodically poled (pp) materials are advantageous for
gaining an enhanced nonlinear conversion efficiency. We are interested in a crystalline ma-
terial with a high value for one of the diagonal elements djj of the nonlinear susceptibility
tensor, resulting in an efficient conversion process, see Equation (6.7). The material should
not be inversion-symmetric, since for crystals possessing this symmetry property, the E2-term
in Equation (6.1) vanishes (as χ(2) = 0), meaning that no second-order conversion would take
place. Another material prerequisite, necessary for the quasi phase-matching method treated
theoretically in Section 6.1.2, is ferroelectricity, which is the property of a material to fea-
ture a spontaneous electric polarization, which can be permanently oriented by temporarily
applying an external electric field. These requirements limited our choice to non-inversion-
symmetric ferroelectric crystalline materials. The properties of both used materials (KTP =
potassium triphosphate, LN = lithium niobate) are given in Table 6.1.
Material KTP LN
Nonlinear optical coefficient d33[pm.V−1] 16.9 [230] 20.6 [231]Refractive index nz(λ1 = 1342 nm) 1.82 [232,233] 2.14 [234]Refractive index nz(λ2 = 671 nm) 1.86 [232,233] 2.19 [234]Material efficiency parameter ηmat,33[pm2.V−2] 84.4 90.5Linear absorption coefficient αabs[%.cm−1] < 0.2 [235]transp. window [µm] 0.365-4.3 [236] 0.305-5.5 [236]Damage treshold Idam[MW.cm−2] > 37 [237] 0.001-2 [238]Thermal conductivity κ[10−2W.cm−1.K−1] (2.0,3.0,3.3) [239] 4.4 [240]/4.6 [241]
Table 6.1. – Comparison of material parameters for the ferroelectric nonlinear media KTP(potassium triphosphate) and LN (lithium niobate). The material efficiency parameterηmat,33 ≃ d2
33/nz(λ1)nz(λ2) appears in Equation (6.7) governing the doubling efficiency. Thevalues for the thermal conductivity κ of KTP from [239] are for the three different axes ofthe KTP crystal.
All commonly used nonlinear crystals are in general transparent over the entire visible range.
The transparency range usually extends in the infrared regions, the actual band edge depend-
ing on the material. Linear absorption coefficients are therefore small in our region of interest.
A detrimental higher-order absorption effect is the so-called green-induced infra-red absorp-
tion (GRIIRA). This effect is due to the enhanced absorption of the fundamental wavelength
in the presence of second-harmonic radiation. It is particular deleterious when employing
resonant enhancement cavities, thus limiting the application of lithium niobate [242].
Photorefractivity is a further deleterious effect occurring especially in lithium niobate. Due to
a field-induced release of charge carriers in the material the refractive index changes rapidly.
119

6 Second harmonic generation
As a consequence the optical length of the cavity is shifted abruptly, leading to severe in-
stabilities when trying to keep an enhancement cavity resonant with a pump laser via a
frequency-lock.
Additionally, optical media can be irreversibly damaged when they are exposed to high in-
tensities. Depending on the crystal composition (congruent or stoichiometric, doping with
MgO, ZnO or Fe), the damage threshold intensity Idam can be dangerously low for lithium
niobate, whereas for potassium titanyl phosphate it is much higher. Together with GRIIRA
and photorefractivity, this low threshold further restricts the capability of lithium niobate to
handle high intensities.
KTP, on the other hand, displays a detrimental effect called gray-tracking. This effect takes
its name from the appearence of visible gray tracks in the crystal. This reversible increase of
absorption limits frequency-doubling of Nd:YAG lasers at 1064 nm. Since the photon energies
involved in our case are a lot lower, we have reason to believe that this effect will not occur
for doubling of 1342 nm light.
The material-dependent conversion-efficiency parameter ηmat,33 is highest for LN, but the
material suffers from its higher refractive index in comparison to KTP.
In the context of second-harmonic generation inside an enhancement cavity, we considered
ppKTP being a good compromise between conversion efficiency and high-power-handling
capability. Our crystal sample was manufactured by the group of Carlota Canalias at the
Institute of Laser Physics of the Royal Institute of Technology (Kungliga Tekniska Hogskolan,
KTH). In particular, they performed the electric field poling of our a KTP sample at room
temperature [243].
6.2. Enhancement cavity
In Section 6.1 we stated that the single-pass doubling efficiency of a nonlinear medium like
ppKTP is to be expected only in the %/W range. One possible solution for achieving a high
conversion efficiency is to use a resonant enhancement cavity with the ppKTP crystal placed
inside, such that a strong fundamental wave can build up, rendering the conversion more
efficient.
The opto-mechanical setup of the doubling cavity is shown in Figure 6.1 and was inspired
by the designs presented in [184, 244]. Similar to the laser, a folded-ring cavity consisting of
four mirrors is employed. The fundamental light is coupled inside the cavity via the plane
mirror M′
1 for which a discrete set of reflectivity values Rc were tested in order to optimize
the impedance matching, see Subsection 6.2.2. Finally the reflectivity Rc = 90% was selected
for this mirror giving the highest SHG output power for the applied fundamental pump
power. All other mirrors are highly reflective at 1342 nm and M′
4 is additionally transmitting
at 671 nm. M′
3 and M′
4 are concave with a radius of curvature of Rcc,M3 = 150mm and
Rcc,M4 = 100mm, respectively. M′
2 (M′
3) is glued on a fast (slow) piezo-electric transducer,
allowing to act on the cavity length in the 50 nm (8µm) range. A set of spherical lenses,
L′
1 and L′
2, between the laser output and the cavity provides the necessary mode match-
120

6.2 Enhancement cavity
ing. For temperature stabilization, the crystal is wrapped in indium foil and mounted in a
temperature-controlled copper block. The second harmonic light is leaving the cavity through
M′
4 and is collimated by a lens of focal length f ′
3 = 200mm, yielding a Gaussian 1/e2 beam
diameter of 2.4 mm.
The length of the crystal used in this work is 18 mm, featuring an optical aperture of 1×6 mm2.
The poling period was chosen to be Λ = 17.61 µm, since the phase matching condition
β(T ) = 0, see Equation 6.9, is in consequence expected at T = 23.5C. This temperature is
deduced according to the temperature-dependent Sellmeier equations from [232, 233]. Both
crystal facets are AR coated for 1342 nm and 671 nm.
M′
1
M′
2
M′
3
M′
4
L′
1
L′
2
L′
3
ppKTP
1342 nm
671 nm
98mm
Figure 6.1: Scheme of the doubling cavity setup comprising the four mirrors M′
1−4 and the ppKTPnonlinear crystal. The light is mainly coupled to the fundamental Gaussian eigenmode (TEM00) bymeans of mode-matching via the lenses L′
1,2. L′
3 serves as collimation lens for the second harmonicoutput. The fundamental laser and second harmonic beam are depicted in blue and red, respectively.The distance between M′
3 and M′
4 is 156mm. The piezoelectric transducers attached to M′
2 and M′
3,applied for modifying the cavity length, are coloured in dark red.
The dependence of several cavity parameters on the mirror distance d between the two curved
mirrors M′
3 and M′
4 is presented in Figure 6.2. The distance d = 156mm that was finally
chosen fulfils several requirements: the cavity operates on a position close to the center of the
stability range and the waist of w0 ≃ 79 µm in the crystal is large enough to avoid detrimental
high-intensity effects. The higher-order transverse cavity eigenmodes and the TEM00 mode
differ significantly in their resonance frequencies, meaning that frequency degeneracy of modes
is not occurring. For this particular distance, the beam provides a circular profile in the
crystal and accounts thus for a circular SH output. The focusing is considerably weaker than
optimal with regard to single-pass efficiency, leading to a clearly reduced h(α = 0.338, β =
0.978) = 0.326. This value corresponds to a fraction h/hmax = 30.5% of the optimum value
and yields a theoretical single pass efficiency ηSHG = 0.49 %/W, assuming the literature
121

6 Second harmonic generation
140 160 180−2
−1
0
1
2
d [mm]
psta
b
140 160 1800
20
40
60
80
d [mm]
w(d
) [
m]
140 160 1800
0.2
0.4
0.6
0.8
1
d [mm]
/
FS
R
140 160 180
0.4
0.6
0.8
1
d [mm]
hopt(d
)
Figure 6.2: Several parameters of the doubling cavity as a function of the distance d between thetwo curved mirrors M′
3 and M′
4. Black (red) lines indicate the horizontal (vertical) direction in thesetup.
(Upper left) The stability parameters pstab of the cavity, which is stable between dcu = 137.6mm anddcu = 188.2mm.
(Upper right)The relative mode spacing ∆ν/νFSR, defined as relative frequency difference betweenthe TEM00 mode and the modes TEM10 (horizontal) and TEM01 (vertical).
(Lower left) The waist sizes in the doubling crystal (continuous lines). We also indicate the waist radiiin the coupling arm (dashed lines) between M′
1 and M′
2, these values being divided by a factor of tenfor the representation.
(Lower right)The optimized Boyd-Kleinman function hopt(α(d)), see Equation (6.8).
We chose the point d = 156mm where both waists in the crystal equal, resulting in a round shapedsecond harmonic beam. The relative mode spacing is larger than 0.3.
122

6.2 Enhancement cavity
value of d33 = 16.9 pm/V for the nonlinear optical coefficient [230]. Our choice represents a
compromise between a high single-pass doubling efficiency and detrimental intensity-related
effects such as two-photon and second-harmonic-induced absorption [245] and possible gray-
tracking [246].
It is crucial to keep the doubling cavity under a dry-air atmosphere in an appropriately tight
housing to prevent quality deterioration of the optical surfaces due to dust and moisture, and
to shield the setup from thermal and acoustic perturbations.
6.2.1. Mode matching and intra-cavity loss
The length of the doubling cavity can be changed by applying a voltage to the piezoelectric
transducers mounted below the cavity mirrors M′
2 and M′
3, see Figure 6.1. In the absence of
nonlinear losses the intra-cavity power P (δL) reads
P (δL) =∑
mn
Pmn
1 + F sin2 (ϕmn + ωδL/c), (6.14)
where δL is the induced length variation and Pmn are the contributions from the different
TEMmn modes. F is a parameter related to the cavity Finesse and thus to linear losses, see
Equation (5.53). As mentioned before, by adjusting the cavity geometry the constant round-
trip phases ϕmn can be chosen such as to not be degenerate. This ensures a good TEM00
mode quality of the second-harmonic output, since the simultaneous presence of higher-order
modes is suppressed.
The mode-matching efficiency can be defined as
η00 =P00∑Pmn
. (6.15)
This efficiency could be optimized by means of an cavity scan measurement that was per-
formed for low intra-cavity powers of less than ≈ 1 W. Furthermore, the crystal temperature
was far detuned from the optimum phase matching value, so that losses of the fundamental
wave due to nonlinear conversion can be neglected. As already indicated in Figure 6.1, we
are able to act on the cavity length in the 50µm range, by driving the slow piezo-electric
transducer (PZT) that is glued below M′
3. We measured an intra-cavity power signal leaking
through M′
2, while varying the cavity length by δL. The measured signal is proportional to
P (δL) and allows to determine the mode-matching efficiency.
Adjusting two telescopes that consist of spherical lenses, the mode-matching efficiency could
be optimized to η00 = 95%. One of these two telescopes is illustrated in Figure 6.1. We note
that the measured signal scan also provide information about the linear cavity round-trip loss
α that can be deduced from the fit parameter F . Inserting the crystal in the cavity increases
this loss by αcr ≃ 1%, as reported by [209]. This can be explained by residual absorption and
scattering in the ppKTP crystal, as well as imperfections of its AR coatings.
123

6 Second harmonic generation
6.2.2. Impedance matching
The conversion efficiency of an enhancement cavity is optimal if impedance matching is
achieved, or in other words, if the input mirror transmission equals all other resonator losses
including the nonlinear conversion process. In practice this is realized by optimizing the
transmission of the input coupler in presence of nonlinear conversion and passive round-trip
loss in order to maximize the second-harmonic output for a given fundamental input power.
Taking into account the nonlinear conversion process, the fundamental-mode intra-cavity
power Pω = P00 at cavity resonance of the TEM00 mode is a solution of
Pω =(1 − Rc − α1)η00Pin(
1 −√
Rc(1 − αtot)(1 − ηSHGPω))2 , (6.16)
where Pin is the fundamental pump power incident on the coupling mirror M′
1, α1 is the
transmission loss of M′
1 and αtot is the total passive round-trip loss of the cavity excluding
the coupler transmission and nonlinear conversion. The single-pass doubling efficiency ηSHG
is calculated according to Equation (6.7) with d33 according to [230] and h(α) as given by the
cavity design, see Figure 6.2. The solution can be calculated analytically using a computer
algebra system, for example Mathematica, resulting in an expression of a length of several
pages. Hence, it is not explicitly presented in this work. The second-harmonic output power
is then simply calculated according to Equation (6.6), and we can define the actual cavity
doubling efficiency as
ηcav =P2ω
Pin=
ηSHGP 2ω
Pin, (6.17)
The computational results are plotted in Figure 6.3. Assuming αtot = αcr = 1% and α1 = 0,
the solution of Equation (6.16) yields a optimal SH power output of 5.34 W at the maximum
available pump power of Pin = 5.91 W. This conversion is achieved for an optimal coupling
mirror reflectivity of Rc,opt = 83%, yielding a total conversion efficiency of ηcav = 90.3%. For
the chosen Rc = 90% coupler we expect satisfying results over a large power range up to
the maximum available pump power, where a conversion efficiency of ηcav = 84% should be
achieved.
124

6.2 Enhancement cavity
0.0 0.2 0.4 0.6 0.8 1.00
1
2
3
4
5
0 1 2 3 4 5 6
0.84
0.86
0.88
0.90
0.92
0.94
0.96
0.98
0 1 2 3 4 5 60
1
2
3
4
5
0.94
0.9
0.83
Ropt
0 1 2 3 4 5 6
0.6
0.7
0.8
0.9
R
P(2ω
) [W
]P
(2ω
) [W
]
op
tim
al R
P(ω,in) P(ω,in)
P(ω,in)
(1-L)ηCPin η cav
Figure 6.3: Calculations for the cavity conversion efficiency assuming reasonable parameter settings.
(Upper left) The SH power output at maximum available fundamental input power Pin = 5.91W asa function of the coupling mirror (M′
1) reflectivity Rc.
(Upper right) The optimal input coupler reflectivity Rc,opt as a function of the fundamental inputpower.
(Lower left) The SH output power as a function of the fundamental input power for different values ofthe coupler reflectivity. Shown are the three experimentally available couplers, the curve for Rc,opt asbefore and, as a reference, the power of the fundamental light coupled to the TEM00 mode 1−α1η00Pin.
(Lower right) Cavity doubling efficiencies for the same coupler reflectivity values as before. TheRc = 90% coupler allows for satisfying conversion for a large range of fundamental input powers upto the maximal value Pin = 5.91W, also keeping a good conversion efficiency for lower powers. Forstill higher fundamental input powers, a lower-reflectivity input coupler should be chosen.
125

6 Second harmonic generation
6.2.3. Locking scheme
1342 nm
Laser cavity
Ethalons
TGG
λ/2Nd:YVO
4
Doubling cavity
671 nmppKTP
Zero-lens
EOM1
AOM
EOM2Li saturated
absorption
spectroscopy
Lock-in
detection,
PI control 2
Lock-in
detection,
PI control 1
νoff
ν1
ν2
PD1
PD2
to experiment
Figure 6.4: Scheme of the lock system, as illustrated in [148]. Light paths and electronic signalsare represented by straight- and dashed lines, respectively. First, the doubling cavity is resonantlylocked to the free-running Nd:YVO4 laser using the control circuit components indexed with subscript1. A small amount of second harmonic light serves as signal for the lithium spectroscopy setup. Ina second step the reference signal from the spectroscopy serves to lock the doubled Nd:YVO4 laseroutput frequency to one of the Lithium resonance frequencies, using control circuit 2. A double passAOM with driving frequency νoff allows to control the frequency offset between the atomic resonanceand the laser output frequency.
The lock system provides frequency-stabilization of the laser system on the lithium D-lines.
Figure 6.4 shows the locking scheme including two feedback loops for the doubling- and the
laser cavity. First, the length of the doubling cavity is stabilized such that the cavity remains
resonant with the Nd:YVO4 laser frequency. The generated second harmonic light allows
to perform saturated absorption spectroscopy on lithium vapor. Subsequently, the doubled
Nd:YVO4 output frequency is locked to the desired lithium transition by controlling the
length of the infrared laser cavity.
The lengths of both cavities are varied by piezo-electric transducers (PZTs) that are mounted
below two mirrors per cavity. One of the PZTs features slow actuation and a large range,
whereas the other one allows fast actuation but has a limited range.
The doubling cavity is locked resonantly to the laser output by a phase modulation tech-
nique. EOM1 phase-modulates the infrared pump light at ν1 = 0.8 MHz. Consequently,
the frequency-doubled light is also phase modulated. A leak of frequency-doubled light is
detected by a photodiode, before the signal is demodulated with a home-made lock-in ampli-
fier circuit. It yields an error signal which is fed into a proportional-integral (PI) controller
circuit, acting on the two actuator PZTs in different frequency ranges.
The laser cavity is frequency-locked with respect to an atomic transition by means of saturated-
absorption frequency modulation spectroscopy [247] of lithium vapor in an oven cell with
frequency-doubled light. A double-pass setup with a 200MHz AOM allows to frequency-shift
the spectroscopy light which finally results in a tunable offset of the laser frequency. The
126

6.2 Enhancement cavity
probe beam of the saturated absorption is phase-modulated at ν2 = 1.2 MHz by EOM2, be-
fore it passes through the spectroscopy cell. An amplified photodiode (Newport, ref. 1801)
detects the probe light which is demodulated to the error signal with a lock-in amplifier. A
two-way PI acts accordingly on the two actuator PZTs.
6.2.4. Cavity characterization and SH output power
In this section we will present the results of our measurements characterizing the conversion
process in the resonant cavity. We will then discuss measures allowing to scale to even higher
powers.
Figure 6.5 presents the results of measuring the second harmonic output power P2ω as a
function of the intra-cavity fundamental power Pω and the input power incident on Pin,
the cavity being locked to the laser. For this measurement, we used the Rc = 90% input
coupler. The obtained data allows for a complete characterisation of the cavity. As it could be
expected from Equation (6.6), the conversion shows quadratic behavior even for the highest
power levels, see Figure 6.5(a). The maximal SH output power P2ω = 5.15W is reached for a
measured intra-cavity fundamental power of Pω = 48.48W, corresponding to a fundamental
input power of Pin = 5.91W. This yields a cavity doubling efficiency of ηconv = 87%.
A fit to Equation (6.17) is performed including the solution of Equation (6.16), with ηSHG and
αtot being the fit parameters, see Figure 6.5(b). This fit to the cavity conversion efficiency
as a function of the fundamental input power describes the data quite well. The passive
intra-cavity losses of αtot = 1% fitted with this method confirm those assumed in Subsec-
tion 6.2.2, where the theoretical results were calculated supposing αtot = 1%, see Figure 6.3.
Furthermore, the fit yields a single-pass efficiency of ηSHG = 0.16%/W, considerably lower
than the theoretical prediction ηSHG ≈ 0.49%/W. The direct measurement, inferred from the
fit in Figure 6.5(a) gives only a slightly higher values of ηSHG = 0.22%/W. These low values
of ηSHG could be explained by imperfections of the domain poling, most probably deviations
from perfect periodicity. We thus derive an effective nonlinear coefficient of deff = 9.6 pm/V
for our ppKTP crystal, significantly lower than the literature value of 16.9 pm/V [230].
The maximum measured doubling efficiency of ηconv = 87% is compatible with the theoretical
prediction of ηconv = 84% calculated in Subsection 6.2.2. The fact that the measured value is
slightly higher than the theory value is a further indication that the intra-cavity loss is most
probably not larger than 1.0%.
We could not observe any intensity-related instabilities and the second-harmonic output
power follows a variation of the intra-cavity fundamental power without observable hysteresis.
Moreover, no long-term degradation was observed, indicating the absence of gray-tracking,
even for the highest reachable fundamental pump powers in our setup. We thus state that
under the condition of a small passive intra-cavity loss, the lower-than-optimal focusing rep-
resents an advantageous choice for the doubling cavity design. Further power-scaling of the
doubling enhancement cavity is therefore achievable by enlarging the radius of the Gaussian
mode passing through the doubling crystal, even if one would lose in single-pass efficiency
127

6 Second harmonic generation
(a)
0 10 20 30 40 50
0
1
2
3
4
5
Intra-cavity power Pω (W)
SH
pow
erP2ω(W
)
(b)
0 1 2 3 4 5 6
0
0.2
0.4
0.6
0.8
Pump power Pin @ 1342 nm (W)
Con
versioneffi
ciency
η=
P2ω/P
in
Figure 6.5: Measurement of the cavity doubling efficiency, where blue points are measured data andred lines are fits.
(a) The second harmonic output power as a function of the fundamental intra-cavity power. Asexpected from Equation (6.6), a quadratic function can be fitted to the conversion.
(b) The cavity conversion efficiency as a function of the fundamental input power. The fit is performedaccording to Equation (6.17) including the solution of Equation (6.16), with ηSHG and αtot being thefit parameters.
128

6.3 Intracavity frequency-doubling
ηSHG. The resulting compatibility with higher intra-cavity powers should permit even higher
second-harmonic output powers at increased fundamental input power values above 6W.
Power-scaling of the doubling enhancement cavity might also be realized by employing an
alternative nonlinear medium. Insertion of a periodically-poled stoichiometric lithium tanta-
late (ppSLT) crystal of the same length as the ppKTP crystal in use would probably lead to
higher power tolerance. Second-harmonic or fundamental-power-induced detrimental effects
seem to play a minor role for this material. Furthermore, the value of its nonlinear optical
coefficient d33 is comparable to the one of ppKTP [248]. Calculations show that the current
cavity setup could be kept in the case of a crystal replacement, since the cavity eigenmode
would only be slightly modified.
6.3. Intracavity frequency-doubling
This section is based on the following manuscript:
2.1-watts intracavity-frequency-doubled all-solid-state light source at 671 nm for
laser cooling of lithium
U. Eismann, A. Bergschneider, F. Sievers, N. Kretzschmar, C. Salomon, and F. Chevy
Opt. Express 21, 9091 (2013)
In this section, we present the second laser generation based on intracavity second-harmonic
generation [210]. In this setup, the nonlinear ppKTP-crystal is directly inserted in the infrared
laser cavity (see Fig. 6.6). We develop a simple theory for the efficient implementation of
intracavity second harmonic generation. Its application to our system allows us to obtain
nonlinear conversion efficiencies of up to 88%. Single-mode operation and tuning is established
by adding an etalon to the resonator. The second-harmonic wavelength can be tuned over
0.5 nm. The laser can be mode-hop-free scanned over more than 6GHz, corresponding to
around ten times the laser cavity free spectral range. The output frequency can be locked
with respect to the lithium D-line transitions for atomic physics applications. Furthermore, we
observe parametric Kerr-lens mode-locking when detuning the phase-matching temperature
sufficiently far from the optimum value.
This section is organized as follows: In Section 6.3.1 we present the optimization of the
fundamental laser design. 1 In Section 6.3.2, we implement intracavity second harmonic
generation. In Section 6.3.3, we report on the course and continuous fine tuning behavior
and nonlinear-Kerr-lens mode locking, and we conclude in Section 6.3.4.
6.3.1. The fundamental laser
A first step towards a stable high-power frequency doubled laser source is the availability of
an efficient laser system at the fundamental wavelength. To minimize detrimental thermal
effects in the gain medium, the following pathway has been chosen: A pump wavelength of
1 The optimization of the fundamental laser is done without the ppKTP crystal in the cavity
129

6 Second harmonic generation
888 nm in contrast to the former 808 nm [184] leads to a lower quantum defect per absorption-
emission cycle [193], and thus to lower heating for a given pump rate. In addition, a larger
value for the laser crystal length has been chosen in order to spread the heat input over
a bigger volume. Therefore, heat transport from the central region to the crystal mount
is facilitated. The ND:YVO4 peak temperature is lower, and thermal issues are less of a
concern.
FP
M1
M2
M3
M4
E
Nd:YVO4
λ/2888 nm
1342 nm
TGG
65mm
L1
L2
ppKTP
671 nm
Figure 6.6: Scheme of the second laser generation. The pump source, a fiber-coupled diode laserbar (FP), is imaged into the gain medium by a pair of lenses L1 and L2. The Nd:YVO4 gain medium isplaced in a four-mirror bow-tie ring resonator consisting of mirrors M1−4, which are highly reflectingat 1342 nm. Unidirectional operation is forced employing a terbium gallium garnet (TGG)-basedFaraday rotator in combination with a half-wave plate (λ/2). The use of an etalon (E) allows forstable single-longitudinal-mode operation. The nonlinear crystal (ppKTP) is inserted at the tightfocus between the curved mirrors M3 and M4. The second harmonic output beam (red) is transmittedthrough M3. For the measurements presented in Section 6.3.1, the ppKTP was removed and thedistance M3-M4 adjusted accordingly, and the high-reflectivity mirror M2 was replaced by a partlytransmitting output coupling mirror. The fundamental laser beam (dark blue) is then coupled outthrough M2.
A schematic overview of the laser setup is given in Fig. 6.6. The output of an 888-nm fiber-
coupled diode laser bar (NA = 0.22, 400µm fiber core diameter) is imaged by two lenses L1
and L22 into the 1.0%at.-doped ND:YVO4 crystal. The crystal is a-cut, 4 × 4 × 25 mm3 and
anti-reflection coated on both sides for 1342 nm and 888 nm. It is wrapped in indium foil
and mounted in a water-cooled copper block. The mirrors M1−4 constitute a bow-tie cavity.
M1, M3 and M4 are highly reflective at 1342 nm, and M1 is transmitting at 888 nm. M3 and
M4 are concave mirrors with a radius of curvature of 100 mm. M2 is the output coupler for
which mirrors with different values of transmission are available. The cavity dimensions are
M1M2 ∼ 300 mm, M2M3 ∼M1M4 ∼ 210 mm and M3M4 ∼ 97 mm. To force unidirectional
operation we use a Faraday rotator consisting of a terbium-gallium-garnet rod-shaped crystal
(TGG) of 6 mm length embedded in a strong permanent magnet [216] in combination with a
true-zero-order half-wave plate. An uncoated infrared fused silica etalon of 500 µm thickness
serves as a wavelength selective element.
2 f1 = 75mm, f2 = 200mm
130

6.3 Intracavity frequency-doubling
For maximum power output, it is crucial to optimize the overlap of the pump beam and the
cavity mode [211, 249]. For simplicity, we perform this operation on the empty laser cavity,
consisting of M1−4 and the ND:YVO4 only. We use the maximum value of the absorbed pump
power Pabs,max = 32.5 W, and a T = 5%-transmission output coupler (M2). By changing the
magnification of the pump imaging setup consisting of L1 and L2, the top-hat shaped pump
spot diameter was altered between 1080µm and 1400µm (see Fig. 6.7). The size of the cavity
mode in the laser crystal can be changed using the curved mirror distance M3M4, and was
optimized for each data point. The maximum output power is obtained at a pump diameter
of around 1300µm, where it is kept for the remainder of this section.
(a)
1100 1200 1300 1400
2.4
2.6
2.8
3
3.2
Pump spot size (µm)
Outputpow
erPω(W
) (b)
0 2 4 6 8 10
0
1
2
3
Output coupler transmission T (%)
Figure 6.7: (a) Optimization of the output power by changing the pump spot diameter, performedon the laser cavity presented in Fig. 6.6 with all the intracavity elements removed, except for theND:YVO4. For a T = 5% output coupler (M2), the mode overlap was optimized for each pump spotdiameter by slight adjustments of the curved-mirror distance M3-M4. Lines are guides to the eye only.(b) Rigrod analysis. The infrared output power Pω is measured as a function of the output couplertransmission T and fitted with the Rigrod model (Eq. (6.18)) for bidirectional (purple triangles, dashedline) and unidirectional (blue circles, solid line) operation at Pabs,max = 32.5 W and optimized modeoverlap. In both cases the optimum transmission is found at T ∼ 5%. The parasitic roundtrip lossdetermined from the fits yield 10(4)% for the bidirectional and L = 16(6)% for the unidirectional case.
For both the bidirectional (empty cavity only containing ND:YVO4) and the unidirectional
(additional TGG and half-wave plate) operation we measured the maximum output power as
a function of the output coupler transmission, see Fig. 6.7b. In both cases a T = 5% mirror
delivers the maximum fundamental output power Pω. By equating the single-pass gain with
the total round-trip loss Ltot = L + Lout = L + T for both the bi- and unidirectional cases,
where L is the sum of the parasitic round-trip losses, we find
Pω = PsatT[
G0
T + L − 1
](6.18)
similarly to [250]. Here Psat is the saturation power, G0 the small-signal gain and L the sum
of the parasitic round-trip losses. Although this analysis essentially relies on plane waves, it
can be mapped to the more realistic case of top-hat pump beams and gaussian laser cavity
eigenmodes, as present in diode-pumped solid-state lasers, see [184] and references therein.
131

6 Second harmonic generation
A least-squares fit to Eq. (6.18) yields L = 10(4)% for the parasitic loss in the bidirectional
case. In [184] we found the loss in an empty four-mirror bow-tie cavity of mirrors from the
same batch to be smaller than 1%. We attribute the remaining 9(4)% mainly to aberrations
caused by the thermal lens in the ND:YVO4.
In the unidirectional case, the fitting procedure yields L = 16(6)%. Compared to the bidirec-
tional case, the difference of LFaraday = 6(7)% can be attributed to the insertion of the TGG
crystal and the waveplate. Indeed, thermal depolarization and the accompanying loss is a
well-known effect in TGG. It imposes stringent limits on power scaling of unidirectional ring
lasers and Faraday isolators [251]. We observe a dependence of the optimum half-wave plate
angle on the circulating intracavity power, which is strong evidence of this effect. From the
fit, we furthermore obtain the values Psat = 170(50)W and G0 = 0.27(5) for unidirectional
operation, which are important for the optimization of intracavity doubling, see Section 6.3.2.
For the now-optimized unidirectional infrared setup, we measure the output power as a
function of the absorbed pump power Pabs (see Fig. 6.8). As the optimization is performed
at the maximum absorbed pump power Pabs,max ∼ 32.5W, the laser emission only starts at
Pabs ∼ 28W. After reaching threshold, the output power is unstable and displays a hysteresis
feature between Pabs = 29W and 30W. After crossing the hysteresis region, the laser emission
is stable and only weakly depends on Pabs. This behavior is typical for high-power solid-state
laser designs and has been reported in [203]. As discussed before, thermal depolarization
in the TGG is significant and can lead to a change of the lasing direction and occasional
bistable behavior when increasing the pump power. Thus, the angle of the half-wave plate
had to be adjusted for every data point presented here. We keep the pump power constant
at Pabs,max ∼ 32.5W in the remainder of the section.
28 29 30 31 32 33
0
0.5
1
1.5
2
2.5
Absorbed pump power Pabs (W)
Outputpow
erPω(W
)
Figure 6.8: Infrared unidirectional output power Pω as a function of the absorbed pump power Pabs.The setup is optimized for the maximal absorbed pump power Pabs,max = 32.5W. The oscillationthreshold is found at Pabs ∼ 28 W. The data shows hysteresis between Pabs = 29 W and 30W, asindicated by the arrows for increasing or decreasing pump power. This behavior is typical for high-power designs. After a sudden rise the output power increases only slowly until it eventually reachesthe maximum of 2.5 W at Pabs,max. Lines are guides to the eye only.
132

6.3 Intracavity frequency-doubling
6.3.2. Efficient intracavity second-harmonic generation
Efficient frequency doubling of infrared lasers can be established using periodically-poled
nonlinear crystals in an external cavity. Using this method at a fundamental wavelength of
1342 nm, a doubling efficiency of P2ω/Pω = 86% has been obtained in our first-generation
setup [184], and serves as a benchmark. However, a more direct approach followed here is
intra-cavity second harmonic generation (ICSHG), which requires only one cavity and thus
represents an important simplification.
For the analysis of the output power of ICSHG lasers, the output coupling loss Lout = Tdiscussed in Section 6.3.1 needs to be replaced by ηP , where η is the single-pass doubling
efficiency, and P the circulating intracavity power. Similar to the one found in [252,253], the
solution for the SH output power in the unidirectional case reads
P2ω =PsatG0
ξ
[√(ξ − ζ)2 + ξ − (ξ + ζ)
]2
, (6.19)
where ξ = ηPsat(4G0)−1 and ζ = L(4G0)−1 are the dimensionless output coupling and loss
parameters. As pointed out in [252, 253], it is interesting to note that the value for the
optimum output coupling Lout,opt =√
G0L − L is the same for both linear and non-linear
output coupling mechanisms, and delivers the same amount of output power. However, the
round-trip parasitic loss L will contain an additional contribution from the insertion of the
nonlinear medium. Hence, P2ω/Pω < 1 for any realistic system, but efficiencies close to
one can be obtained in practice [254]. Using the fit values from Section 6.3.1, we maximize
Eq. (6.19) by choosing an optimum single-pass doubling efficiency ηopt = 0.10(5)%.W−1.
To evaluate η, we refer to the Boyd-Kleinman theory for focused gaussian beams [226],
η(T ) =2ω3d2
ijL
πε0c4nω,i(T )n2ω,j(T )× h[α, β(T )] , (6.20)
where ε0 is the vacuum permittivity, c the speed of light in vacuum, dij is the i, j-th element
of the material’s nonlinear tensor, nω,i(T ) the material’s refractive index along the i axis at
angular frequency ω and temperature T , and L the nonlinear material’s length. dij needs to
be replaced by deff = 2diiπ−1 for periodically poled (pp) materials. The function
h[α, α0, β(T )] =1
4α
∣∣∣∣∣∣∣
α−α0∫
−α−α0
eiβ(T )τ
1 + iτdτ
∣∣∣∣∣∣∣
2
, (6.21)
is the dimensionless Boyd-Kleinman function [226]. α = L (2zR)−1 and α0 = z0 (2zR)−1
are the focusing and offset parameters, respectively. zR is the Rayleigh length, and z0 is
the offset of the beam focus with respect to the nonlinear medium’s center. The phase-
matching parameter reads β(T ) = 4πzRλ−1 ×
nω,i(T ) − n2ω,j(T ) − λ[2Λ(T )]−1, where λ is
the vacuum wavelength. The Λ(T ) term only occurs for periodically poled materials, where
Λ(T ) is the poling period, and the temperature dependence results from thermal expansion.
133

6 Second harmonic generation
In the intracavity-doubling setup, we replace the output coupling mirror M2 by a high-
reflectivity mirror, cf. Fig. 6.6. The nonlinear, periodically-poled potassium titanyl phosphate
crystal (ppKTP) is inserted between the concave mirrors M3 and M4. To account for the
ppKTP refractive index, the distance M3M4 is increased to ∼106mm. The nonlinear crystal
has outer dimensions of 1 × 6 × 18 mm3 and is antireflection coated at 1342 nm and 671 nm.
Its poling period Λ = 17.61µm is chosen for phase matching at 23.5C according to the
temperature-dependent Sellmeier equations from [232,233]. However, in a previous study we
found the phase-matching temperature at 33.2C [184]. This deviation can be explained by
uncertainties on the reported Sellmeier equations, and the manufacturing tolerance on the
ppKTP poling period. The nonlinear coefficient d33 = 14.5pm.V−1 found for the crystal in our
preliminary study is 14% lower than the highest literature value reported so far [230], probably
due to poling imperfections [184]. Using this crystal for nonlinear output coupling, we can
easily obtain a single-pass efficiency η > ηopt, such that design considerations are relaxed, and
we are able to tune to ηopt by changing the phase-matching temperature. For temperature
stabilization, the crystal is wrapped in indium foil and mounted in a temperature-controlled
copper block. The frequency-doubled light is transmitted through mirror M3.
15 20 25 30 35 40 45 50 550
0.5
1
1.5
2
ppKTP temperature T (C)
Outputpow
erP2ω(W
)
0.01
0.1
1
BK
functionh[α,β
(T)]
MLML
Figure 6.9: Output power as a function of the phase-matching temperature (purple circles, linesare a guide to the eye only). The data shows a double-peak structure of 1.9W / 2.1W of outputpower slightly off of the optimum phase-matching temperature of 33.2C (central vertical line). Asimple theoretical model presented in the text (dash-dotted dark blue line) describes the data wellin the central high-conversion region, using the known temperature dependence of the single-passdoubling efficiency, which is proportional to the dimensionless Boyd-Kleinman function h(T ) [dashedlight blue line, Eq. (6.21)]. The dashed vertical line indicates the perfect phase-matching temperatureof Tpm = 33.2C, where β(Tpm) ≃ 0, and the nonlinear output coupling is too high to reach maximumoutput power. The vertical lines with arrows indicate the temperature regions where self-mode lockingoccurs, cf. Section 6.3.3.
In Fig. 6.9 we present the measurement of the second-harmonic output power as a function
of the phase-matching temperature of the ppKTP crystal. We find a maximum of 2.1W of
output power at Tpm = 36C, and a second maximum of 1.9W at Tpm = 31C. As expected
from Eq. (6.19), at the perfect phase matching temperature the output power only amounts to
1.6W because η > ηopt. The FWHM of the temperature-tuning curve is 22K. As compared to
134

6.3 Intracavity frequency-doubling
the maximum infrared power presented in the former section, we obtain a maximum doubling
efficiency of 88%. The excellent mode quality of the second-harmonic light is confirmed by a
single-mode fiber coupling efficiency larger than 80%.
To gain deeper insight in our data, we employ the ICSHG theory (Eqs. (6.19) to (6.21)). We
include the additional parasitic intracavity loss caused by the presence of the etalon and the
nonlinear crystal, which amounts to Ladd = 0.6(1)%. Thus, the theory predicts a maximum
SH output power of 2.1W, as is found experimentally. The value of Ladd is compatible to the
sum of the ppKTP insertion loss measured independently [184] and the calculated walk-off
loss for the etalon [209]. From an ABCD-matrix formalism we obtain the cavity eigenmode,
yielding zR = 11.5 mm and z0 = 3 mm. At perfect phase matching, we obtain h = 0.40,
yielding a SH output power of 1.6W, which is in excellent agreement with our findings. This
gives us further confidence in our previously measured value of d33 [184]. The temperature-
dependent KTP refractive indices and the thermal expansion coefficient of the poling period
were presented in [232, 233]. We adjust β by an additive constant in order to account for
the measured phase matching condition β(T = 33.2C) = 0, as justified before. The theory
(solid purple line in Fig. 6.9) describes the data well in the central high conversion region,
and yields the characteristic double-peak structure.
Outside of the central region, the circulating intracavity power rises significantly and the
power-dependent thermal depolarization loss would need to be accounted for in our simple
model. As compared to the theory, the data displays less evidence of dips. This can be
explained by a thermal smearing effect due to residual absorption in the ppKTP at large
powers, yielding a spatial dependence of the phase-matching parameter β(T ). Outside of the
region indicated by the solid vertical lines, the laser is in mode-locked (pulsed) operation,
and we do not expect our model to be applicable.
6.3.3. Tuning behavior and nonlinear-Kerr-lens mode locking
For course tuning and single-longitudinal-mode (SLM) operation, the laser was equipped with
an uncoated etalon of 0.5mm length, yielding a free spectral range of 210GHz. We note that
this single, weakly-selective etalon is sufficient for this purpose due to the self suppression of
axial mode hopping in intracavity-frequency-doubled lasers [255,256].
The tuning range of the frequency-doubled laser is characterized and compared to the infrared
laser in Fig. 6.10. Apart from having the same shape and features, it is striking to note that
the output power of the frequency-doubled laser amounts to almost the same value as the non-
doubled laser over the entire emission spectrum. As discussed in Section 6.3.2, the nonlinear
output coupling is close to the optimum level over the entire emission wavelength range. The
gain line center, where the output power is maximal, is found at around 671.1 nm, resulting in
2.2W of fundamental and 2.1W of second-harmonic output. At the lithium-D line wavelength
the output power amounts to ∼1.8W. Close to the gain line center, this result compares
favorably to the value obtained in [183], where the authors used an etalon for tuning which
potentially produces significantly higher tilt loss [209, 218]. Comparing the emitted power of
135

6 Second harmonic generation
A
1341.6 1341.8 1342 1342.2 1342.4 1342.6 1342.8
0
0.5
1
1.5
2
2.5
Fundamental wavelength λω (nm)
Pow
ersP2ωandPω(W
)
670.8 670.9 671 671.1 671.2 671.3 671.4
SH wavelength λ2ω (nm)
B C
λLi
5
5
0
0.
1
1.
2
Abs.
coeffi
cient×105(cm
−1)
Figure 6.10: (Lines are guides for the eye only) Single-frequency output spectra of the infraredlaser presented in Section 6.3.1 (dark blue circles), the intracavity-frequency-doubled laser (purplesquares) and the infrared source presented in [184] (light blue triangles). For easy comparison, allwavelengths are given in vacuum values. The vertical lines denote the positions of the lithium-D lineresonances. The gray line shows a water vapor absorption spectrum for typical parameters (23 C, 60%rel. humidity). The wavelength regions marked A,B,C where stable, powerful operation of the laserscan not be established coincide with absorption peaks of water molecules. The level of output powerof the infrared laser and the frequency-doubled laser are closely spaced, proving that the nonlinearcrystal introduces weak additional passive losses in the laser cavity, whereas the degree of nonlinearoutput coupling is at its optimum value.
the doubled and non-doubled lasers across the emission spectra, we typically obtain more
than 80% of the power at 671 nm, demonstrating a very efficient frequency doubling process.
For the absolute maximum values, we obtain P2ω/Pω = 88%. It is even possible to obtain
emission further away from resonance, where the non-ICSHG lasers cease to oscillate. Our
first-generation source presented in [184] displays an output spectrum that is significantly
more plateau-like (light blue triangles in Fig. 6.10), which we attribute to the presence of a
second, more selective etalon in the cavity. At the expense of a higher insertion loss baseline,
ripples in the emission spectrum have significantly less influence on the tuning behavior of this
setup. The identical gaps in all of the emission spectra presented here (A,B,C in Fig. 6.10)
can be explained by absorption from water vapor, as we compare the laser spectra to a water
vapor absorption spectrum obtained from the HITRAN database [222]. The water absorption
peaks coincide with the features A,B and C.
Intracavity-frequency-doubled lasers tend to mode-locked operation when the doubling crystal
is mismatched from the optimum phase matching condition [257, 258]. This effect, resulting
from an intensity-dependent phase shift of the fundamental beam passing the non-matched
crystal, is commonly termed nonlinear-Kerr-lens- or χ(2):χ(2) mode locking. Although it has
been observed in the 1064-nm-Nd:YVO4-ppKTP system before [259], we report, to the best
of our knowledge, the first observation at 1342 nm. We observe the effect when detuning from
the optimum phase-matching temperature to below Tlow =29C and above Thigh =45C. A
scanning Fabry-Perot spectrum analyzer shows no discernible single- or few-mode background
once the threshold to mode-locked operation is crossed. We use a fast detector and a spectrum
136

6.3 Intracavity frequency-doubling
analyzer to measure the beat frequency between neighboring modes. This simple method to
determine the laser cavity free spectral range yields a value of 345(1)MHz.
It is remarkable that the mode locking arises when tuning the phase-matching temperature
to colder-than-optimal values. In analogy to standard Kerr-lens mode locking, the χ(2):χ(2)
process requires an additional intracavity element which modifies the round-trip gain or loss
as a function of the power-dependent cavity mode size. This can be realized by the gain
medium, cf. Fig. 6.6. As we presented in Section 6.3.1, the pump-to-cavity mode overlap has
been carefully optimized in the cw regime. However, an ABCD-matrix-based cavity mode
calculation reveals that the beam waist in the Nd:YVO4 only changes monotonously when
crossing over from negative to positive focal powers in the ppKTP. Thus, the induced change
in gain or loss should be less favorable whenever the lensing departs from the optimized value.
We note that Zondy et al. [254] argue that pulsed operation should occur whenever there
exists a power-dependent gain-loss mechanism, whichever is the sign of the focal power in the
ppKTP. Furthermore, we also note that in our simple analysis, we do not take into account
different Kerr-like and thermal lenses that may occur in the intra-cavity elements other than
the laser and nonlinear crystals. Using the temperature-dependent Sellmeier equations of
[232,233], we get dephasing parameters of β(Tlow) = 8.8(1) and β(Thigh) = −18.5(1), resulting
in a single-pass efficiency η(T ) reduced to less than 5% of the maximum value.
(a) 228MHz
0
0.5
1
Frequency Scan
Relativetran
smission
(b) 804MHz
228MHz
7Li–D2
6Li–D2
& 7Li–D1
6Li–D1
Frequency Scan
Error
sign
al(a.u.)
FWHM ≈ 3GHz
Figure 6.11: Doppler-free saturated absorption spectroscopy of the lithium D-lines. (a) Samplescan over the entire 6Li D1 Doppler-broadened absorption peak. The inset shows the sub-Dopplerfeatures. Similar spectra are obtained for all lithium D lines. (b) Error signals of all lithium D linetransitions, generated by phase modulation spectroscopy. These signals provide an excellent referencefor frequency-locking of the laser.
The laser can be tuned continuously using a piezoelectric transducer (PZT), upon which
mirror M2 is glued. This allows mode-hope free scans of the 671-nm output frequency over
more than 6GHz. For the resonated fundamental light this amounts to about ten times the
laser cavity free spectral range, a typical behavior of ICSHG lasers with self-suppressed mode
hopping [255,256]. We perform Doppler-free saturated absorption spectroscopy on a lithium
vapor cell described previously in [184], see Fig. 6.11. In Fig. 6.11a we show a sample scan
over the full Doppler-broadened 6Li D1 line. The ground-state hyperfine structure is clearly
resolved. We phase-modulate the probe beam at 20MHz using an electro-optic modulator,
and use a commercial lock-in amplifier to generate a dispersive error signal as presented in
137
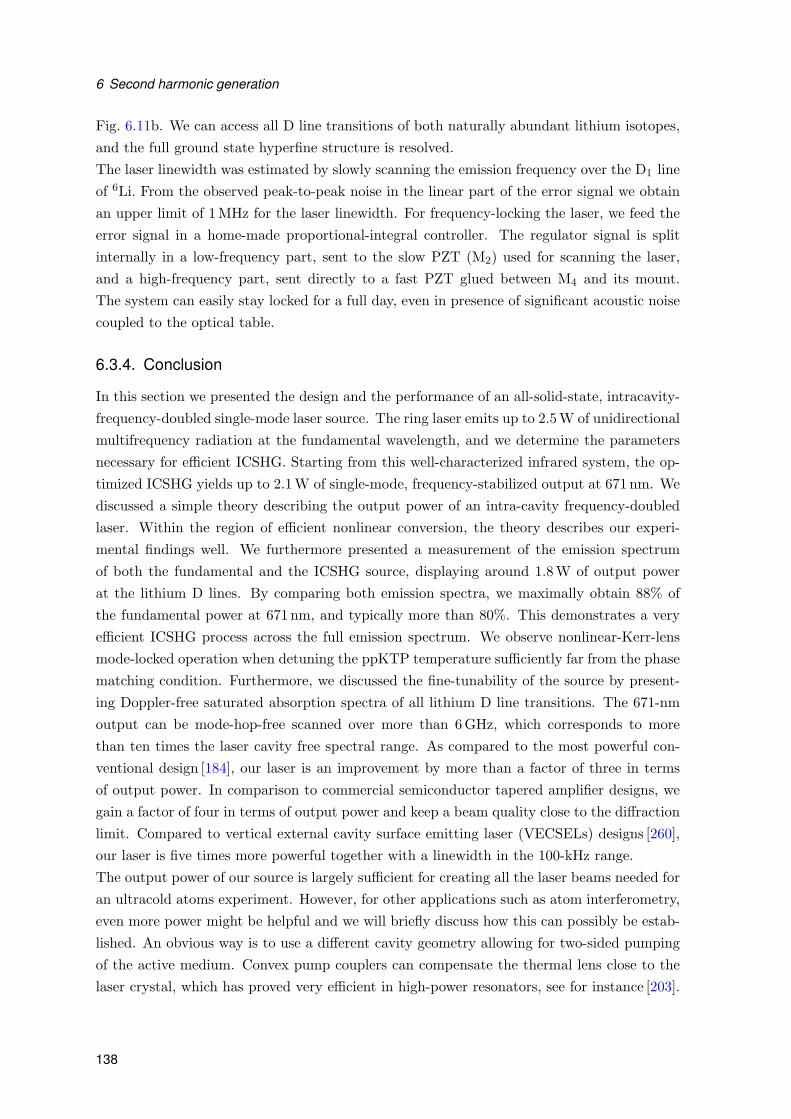
6 Second harmonic generation
Fig. 6.11b. We can access all D line transitions of both naturally abundant lithium isotopes,
and the full ground state hyperfine structure is resolved.
The laser linewidth was estimated by slowly scanning the emission frequency over the D1 line
of 6Li. From the observed peak-to-peak noise in the linear part of the error signal we obtain
an upper limit of 1MHz for the laser linewidth. For frequency-locking the laser, we feed the
error signal in a home-made proportional-integral controller. The regulator signal is split
internally in a low-frequency part, sent to the slow PZT (M2) used for scanning the laser,
and a high-frequency part, sent directly to a fast PZT glued between M4 and its mount.
The system can easily stay locked for a full day, even in presence of significant acoustic noise
coupled to the optical table.
6.3.4. Conclusion
In this section we presented the design and the performance of an all-solid-state, intracavity-
frequency-doubled single-mode laser source. The ring laser emits up to 2.5W of unidirectional
multifrequency radiation at the fundamental wavelength, and we determine the parameters
necessary for efficient ICSHG. Starting from this well-characterized infrared system, the op-
timized ICSHG yields up to 2.1W of single-mode, frequency-stabilized output at 671 nm. We
discussed a simple theory describing the output power of an intra-cavity frequency-doubled
laser. Within the region of efficient nonlinear conversion, the theory describes our experi-
mental findings well. We furthermore presented a measurement of the emission spectrum
of both the fundamental and the ICSHG source, displaying around 1.8W of output power
at the lithium D lines. By comparing both emission spectra, we maximally obtain 88% of
the fundamental power at 671 nm, and typically more than 80%. This demonstrates a very
efficient ICSHG process across the full emission spectrum. We observe nonlinear-Kerr-lens
mode-locked operation when detuning the ppKTP temperature sufficiently far from the phase
matching condition. Furthermore, we discussed the fine-tunability of the source by present-
ing Doppler-free saturated absorption spectra of all lithium D line transitions. The 671-nm
output can be mode-hop-free scanned over more than 6GHz, which corresponds to more
than ten times the laser cavity free spectral range. As compared to the most powerful con-
ventional design [184], our laser is an improvement by more than a factor of three in terms
of output power. In comparison to commercial semiconductor tapered amplifier designs, we
gain a factor of four in terms of output power and keep a beam quality close to the diffraction
limit. Compared to vertical external cavity surface emitting laser (VECSELs) designs [260],
our laser is five times more powerful together with a linewidth in the 100-kHz range.
The output power of our source is largely sufficient for creating all the laser beams needed for
an ultracold atoms experiment. However, for other applications such as atom interferometry,
even more power might be helpful and we will briefly discuss how this can possibly be estab-
lished. An obvious way is to use a different cavity geometry allowing for two-sided pumping
of the active medium. Convex pump couplers can compensate the thermal lens close to the
laser crystal, which has proved very efficient in high-power resonators, see for instance [203].
138

6.4 Waveguide
A large part of the output power limitations stems from the additional intracavity elements,
such as the Faraday rotator. Thus, injection locking of an amplifier consisting of an empty
high-power resonator such as presented in [203] could deliver tens of watts of single-frequency
fundamental light. At these elevated power levels, efficient single-pass frequency doubling of
1342-nm radiation has been demonstrated [261], the implementation of which considerably
relaxes the complexity of multi-cavity designs.
When we started to use the laser for our experiment, we noticed that switching off the laser
and turning it on again resulted in a reduced and arbitrary output power. Sometimes the laser
would not even start lasing. The re-optimization was often time-consuming and inconvenient
for a day-to-day use. We suspect that we operated the laser in a semi-stable regime, probably
caused by a too large doping of the laser crystal. The instabilities could be also linked to the
self suppression of mode hopping.
6.4. Waveguide
The necessity of frequency doubling increases the complexity of laser systems, for instance
they often require additional enhancements cavities that need to be locked to resonance.
Therefore, it is of great practical interest to technically simplify the frequency doubling pro-
cess. In contrast to free-propagation schemes, guiding of optical fields has the intrinsic advan-
tage of small mode field diameters along the guiding structure. Such, high-intensity fields can
propagate over long distances in a medium without being limited by diffraction. This allows
to increase the effects of interaction between light fields, external fields and fields provided
by the medium by a large amount. Therefore, a number of waveguide-based devices has been
developed and commercialized, reaching from fiber (Raman) lasers and waveguide EOMs to
waveguide-based nonlinear-optics modules, most popular in the form of waveguide frequency
doublers.
In this section, we present a SHG approach that yields 2.4W frequency-doubled light using
a custom-made ridge-waveguide PPLN wavelength conversion module. While being largely
sufficient for running an atom cooling experiment, the light source features a strongly reduced
complexity of the locking scheme.
6.4.1. Setup and characterization
The nonlinear device applied for second harmonic generation (SHG) in this experiment is a
wavelength conversion module from NTT Electronics (WH-0671-000-A-B-C) that is described
in detail in [262,263]. It contains a periodically poled ZnO-doped LiNbO3 (ppZnO:LN) ridge
waveguide with a nearly quadratic cross section of 14.8×14.2µm2 and a length of L = 10 mm.
The chosen poling period of 13.2µm provides quasi-phase-matching (QPM) for SHG at a
fundamental wavelength of 1342 nm and at a waveguide temperature of approximately 49C.
It is temperature-stabilized using a built-in NTC thermistor and a thermoelectric cooling
element together with a home-made regulator circuit. The entire module is mounted on a
139

6 Second harmonic generation
passive heat sink and enclosed in a metal housing. The temperature of the waveguide crystal
can therefore be stabilized to within 0.1C.
1342 nmLaser cavity
Ethalons
TGG
λ/2Nd:YVO
4
Wavelength Conversion Module671 nm
Pump diode888 nm Zero-lens
Waveguide
Lens1
Fiber
Filter
Lens2
Lens3
Figure 6.12: Schematic view of the frequency doubling setup. Shown are the IR laser cavity andthe wavelength conversion module. The pump diode output is focused in the Nd:YVO4 laser crystalinside the laser cavity, which also contains a Faraday rotator and a λ/2-waveplate for unidirectionaloscillation and two etalons for frequency selection. The wavelength conversion module includes appZnO:LN nonlinear waveguide for second-harmonic generation.
The experimental setup for frequency doubling is schematically presented in Figure 6.12. The
waveguide module is fiber-pigtailed on the input side and includes collimating and focussing
lenses ensuring efficient coupling between the fiber and the waveguide. The output light
is collimated by a lens and passes through an AR-coated window (Edmund Optics P/N
47837) before exiting the waveguide module. We separate both second-harmonic and residual
fundamental radiation using a dichroic beamsplitter set featuring a total transmission of
98.0% and 93.1% for the SH and IR light, respectively.
The coupling efficiency of the fundamental light to the fiber and through the ppZnO:LN
crystal waveguide is measured by comparing the IR light power behind and in front of the
module without SHG. For this purpose, the crystal mount temperature is set to 20C which
is sufficiently far detuned from the QPM temperature for the SHG process. Alternatively,
the transmission at the extraordinary polarization can be directly determined by measuring
the transmission at the ordinary polarization since both equal for our particular waveguide
design. Taking into account the optical losses for the fundamental wavelength at the optical
elements on the output of the waveguide module, the coupling efficiency could be determined
to 78%. This value remains constant over the full available input power range.
Subsequently, the phase-matching curve of the waveguide was investigated by tuning the
crystal mount temperature and monitoring the variation in SH power. Two tuning curves for
different IR pump powers are presented in Figure 6.13. For a relatively low pump power of
1.07W, the curve matches the theoretical sinc2 distribution very well and the maximum SH
140

6.4 Waveguide
30 40 50 60 70 800
50
100
150
200
Waveguide temperature (C)
SH
pow
erP2ω(m
W)
Pω = 1.07W
Simulation
Pω = 4.44W
Simulation
0
0.5
1
1.5
2
2.5
SH
pow
erP2ω(W
)
Figure 6.13: SH power as a function of the waveguide mount temperature Tmount at the fundamentalIR pump power Pω = 1.07W and Pω = 4.44W coupled to the waveguide. Shown are the measureddata points and the simulation results of our fitted model (dashed lines).
power of 200mW is reached at a crystal mount temperature of 48.9C. The measured curve
is symmetric and has an acceptance width (FWHM) of ∆T = 5.4C. At elevated fundamen-
tal power levels, light absorption effects heat the waveguide and modify the phase-matching
curve. This results in a shift of the conversion peak down to 46.4C for the maximum pump
power of 4.44W and the corresponding SH power of 2.4W. The shape of the main peak
becomes slightly nonsymmetric and its height is lowered with respect to the side-peaks. The
acceptance width is in this case only marginally reduced to ∆T = 4.8C. Since the shape
for low conversion efficiency, and especially the zero-efficiency positions do not change, we
attribute the observed thermal effects mainly to absorption of either the second-harmonic
light, or to second-harmonic induced fundamental absorption.We note that even at the high-
est power levels present in the course of this section, thermal effects did not cause power
instabilities or other types of output power limitations in our setup.
Figure 6.14 presents the adjusted crystal mount temperature maximizing the SH output power
for a series of different IR pump power values. As we have already stated, the maximum SH
power in the limit of low IR pump powers is reached for 48.9C. While increasing IR pump
power, the crystal mount temperature has to be gradually reduced and reaches its minimum
value of 46.4C at the maximum pump power of 4.44W.
The SH output power characteristics of the waveguide were measured as a function of the
coupled fundamental pump power, as shown in Figure 6.15. At high pump powers, the
crystal mount temperature had to be adjusted at each IR pump power value in order to
maximize the conversion, as discussed above. For small pump powers up to 400mW, the
experimental results are well fit by a parabola with a conversion efficiency of 18.4%/W.
For elevated fundamental power, pump depletion effects set in and the data points can be
very well fit by the coupled waves theory presented in [264]. Fitting the well known lossless
solution ηwg = tanh2[(η0PωL2)1/2
]to our experimental data yields the normalized efficiency
141

6 Second harmonic generation
0 1 2 3 446
47
48
49
Pump power Pin @ 1342 nm (W)
WaveguideQPM
temperature
(C)
Experimental dataSimulation
Figure 6.14: Optimal crystal mount temperature Tmount,opt during SHG process in dependence ofthe fundamental IR pump power Pω coupled to the waveguide. The crystal mount temperature isadjusted for every pump power value in order to maximize the corresponding SH power.
(a)
0 1 2 3 4
0
1
2
3
Pump power Pω @ 1342 nm (W)
SH
pow
erP2ω(W
)
Experimental data
P2ω = Pω tanh2(√η0Pω · L)
P2ω = ηP 2ω
0 0.2 0.4
0
1
2
3·10−2
(b)
0 1 2 3 4
0
0.2
0.4
0.6
0.8
Pump power Pω @ 1342 nm (W)
Conversioneffi
cien
cyη w
g=
P2ω/P
ω
Experimental data
ηwg = tanh2(√η0Pω · L)
ηwg = ηPω
0 0.2 0.4
0
2
4
6
8·10−2
Figure 6.15: SH power output (a) and conversion efficiency (b) versus fundamental IR pump powercoupled to the waveguide. The crystal mount temperature is adjusted for every pump power value aspresented in Figure 6.14.
η0 = 19.9%/Wcm2. This underscores the very uncritical behavior of the SHG process we
observe at these high powers, requiring only a small readjustment of the phase matching
temperature.
A caustic measurement of the SH beam quality parameter yields a value of M2 ≤ 1.1 at the
output of the ridge waveguide.
142

6.4 Waveguide
6.4.2. Theoretical model
We applied a simplified version of the theoretical model presented in [265] in order to simulate
the SHG process and to describe quantitatively the influence of optical absorption on the
phase-matching curve. In the following, the subscript index j denotes either the IR light for
j = 1 or the SH light for j = 2.
We define the scalar value of the electric field amplitude according to [266] as
Aj =(2Pj/Seffnjǫ0c0
)1/2, (6.22)
where nj is the refractive index, c0 is the vacuum light velocity and ǫ0 is the permittivity of
free space. Seff denotes the effective overlap area of the electric field distributions Ej(y, z) of
the fundamental TM modes of the waveguide [267]:
Seff =
(sdxdy|E1(y, z)|2
)2 (sdxdy|E2(y, z)|2
)
∣∣∣s
dxdyE1(y, z)2E2(y, z)∗
∣∣∣2 , (6.23)
which is calculated with an open source mode solver software [268]. The scalar value of the
electric field amplitude Aj is calculated by solving a system of coupled wave-equations that
was derived in [224] and applied for waveguide simulation in [265]:
dA0
dx= ∆kQP M −
(2σ1A2 − σ2
A21
A2
)cos(A0) (6.24)
dA1
dx= −σ1A1A2 sin(A0) − 1
2
(α1 + δGRIIRAA4
2
)A1 (6.25)
dA2
dx= σ2A2
1 sin(A0) − 1
2
(α2 + δ2Ph.A
22
)A2 (6.26)
with A0 = 2φ1 −φ2 +∆kQPM, σ1 = ω1deff/c0n1, σ2 = ω1deff/c0n2, where deff = 2/π ·d33 is the
effective nonlinear coefficient, ωj is the wave frequency with ω2 = 2ω1, φj is the electric field
phase, αj is the linear absorption coefficient, δGRIIRA = αGRIIRA(n2ǫ0c0/2)2 and αGRIIRA is
the green induced infrared absorption coefficient [242, 269], δ2Ph. = β2Ph.n2ǫ0c0/2 and β2Ph.
is the two-photon absorption coefficient for the second-harmonic light [270]. Please note that
we assume the linear losses in the ridge waveguide to equal the linear optical absorption.
The phase mismatch parameter is defined as
∆kQPM(T ) = 2β1(T ) − β2(T ) +2π
Λ(T )(6.27)
with Λ(T ) the poling period, βj(T ) = Nj(T )ωj/c0 the waveguide fundamental mode propa-
gation constant and Nj(T ) the effective refractive index calculated with the effective index
approximation [271]. This calculation uses the temperature dependent Sellmeier equations
from [272] for the extraordinary refractive index nj of 5% MgO-doped congruent PPLN. All
of these parameters depend on the temperature T which may vary along the propagation
143

6 Second harmonic generation
axis x due to heat generation resulting from optical absorption. Please note that we do not
account for any inhomogeneity of the ridge waveguide height zR, which is justified by the
observation of a temperature dependent phase matching curve that matches the theoretical
sinc2 distribution very well at low intensities, see Figure 6.13.
The effect of the optical absorption on the temperature distribution along the waveguide
axis x is estimated by supposing a one-dimensional, steady-state heat diffusion model [273],
represented by a corresponding differential equation for the crystal temperature of the form
− k∂2
∂z2T (z) = q(z) (6.28)
with boundary conditions corresponding to our waveguide design
T (z = 0) = Tmount (6.29)
∂
∂zT(z = zH) = 0 (6.30)
where k = 5W/Km is the heat conductivity of the lithium tantalate substrate [274], z is the
vertical coordinate parallel to the crystal optical axis and zH = 46.2 µm is the height of the
entire waveguide structure.
The heat source density is defined as a boxcar function restricted to the ridge waveguide
interval zR = 14.2µm
q(z) =
qR for zH − zR < z < zH
0 otherwise.(6.31)
Applying the Green’s function ansatz [275], the differential equation (6.28) can be solved for
every x position along the propagation axis and the temperature in the center of the ridge
waveguide
T
(x, zH +
zR
2
)=
qR(x)
k
[zHzR − 5
8z2
R
]+ Tmount (6.32)
is assumed to be approximately the temperature T (x) of the entire ridge waveguide. This
result is applied in the system of coupled equations (6.24)-(6.27). The heat source density
depends on the IR and SH intensities and is defined by [270]
qR(x) =(α1 + αGRIIRAI2
2
)I1 + (α2 + β2Ph.I2) I2 , (6.33)
where Ij =(njc0ǫ0/2
)A2
j is the light intensity.
In order to reproduce our experimental data concerning the shift of the optimal waveguide
mount temperature with increasing fundamental IR pump power, as well as the conversion
efficiency of the waveguide, we have to adapt the material dependent optical coefficients of our
model. In particular, the values of the nonlinear optical coefficient d33 and the poling period
Λ need to be set to 12.8 pm/V and 13.48µm, respectively. The linear optical absorption
144

6.5 Conclusion
coefficients α1 and α2, that are assumed to equal for simplification, are found to have a
relatively low value of 0.09 l/m, compared to the literature value of 0.2 1/m for 1064 nm
[276] and 1.0 1/m for 532 nm [277]. Additionally the two-photon absorption coefficient β2Ph.
of 4.5 × 10⁻¹¹ m/W has to be applied, corresponding well to the literature value of 5 ×10⁻¹¹ m/W for 532 nm [270, 276]. In our case the intensity dependent GRIIRA coefficient
αGRIIRA [269] does not need to be taken into account in order to reproduce the experimental
results. We attribute this to the fact that the intensities inside our waveguide remain well
below 1 MW/cm2 even for the highest applied IR pump powers. The results of our simulation,
assuming these parameter settings, are presented in Figure 6.13 and Figure 6.14 together with
the experimental data points.
6.5. Conclusion
This chapter described the design and the characterization of three different approaches per-
forming efficient frequency doubling of the 1342 nm output beam delivered by the Nd:YVO4
ring laser presented in Chapter 5. Each of them represents thus a feasible option for creating
powerful 671 nm radiation.
After presenting the theoretical concepts necessary to understand second-harmonic genera-
tion using periodically-poled nonlinear media, we have described the technical design and
the results of the conversion efficiency measurements on a resonant enhancement cavity con-
taining a ppKTP crystal. We have measured a maximum conversion efficiency of 87%, and
a maximum of 5.2W of 671-nm output power. In a similar way we have reported on the
setup and results of the intracavity doubled laser, yielding up to 2.1W of second-harmonic
output power. Finally we have detailed the performance and the theoretical description of
our third approach for SHG, a wavelength conversion module employing a nonlinear waveg-
uide structure of ppZnO:LN, delivering up to 2.4W of frequency-double light at 671 nm. In
this context, we could also infer information about the absorption processes occurring in the
nonlinear medium.
145


6.5 Conclusion
Appendix 6.A Publications
Multiwatt-level second harmonic generation in ppZnO:LN ridge waveguide
N. Kretzschmar, F. Sievers, U. Eismann, F. Chevy and C. Salomon
To be published, see page 149 for a preliminary draft.
147


Multiwatt-level second harmonic
generation in ppZnO:LN ridge
waveguide
Norman Kretzschmar1, Franz Sievers1 Ulrich Eismann2,
Frederic Chevy1 and Christophe Salomon1
1Laboratoire Kastler Brossel, ENS, UPMC, CNRS UMR 8552
24 rue Lhomond, 75231 Paris, France2LNE-SYRTE, Observatoire de Paris, CNRS, UPMC,
61 avenue de l’Observatoire, 75014 Paris, France
OCIS codes: (000.0000) General.
References and links
1. U. Eismann, F. Gerbier, C. Canalias, A. Zukauskas, G. Trenec, J. Vigue, F. Chevy, and C. Salomon, “An all-solid-
state laser source at 671 nm for cold-atom experiments with lithium”, Appl. Phys. B 106, 25–36 (2012). 2, 4, 9,
10
2. U. Eismann and A. Bergschneider and F. Sievers and N. Kretzschmar and C. Salomon and F. Chevy, “2.1-watts
intracavity-frequency-doubled all-solid-state light source at 671 nm for laser cooling of lithium,”, Opt. Express
21, 9091–9102 (2013). 2, 4
3. Nishida private comm. 2
4. L. McDonagh, R. Wallenstein, R. Knappe, and A. Nebel, “High-efficiency 60 W TEM00 Nd:YVO4 oscillator
pumped at 888 nm”, Opt. Lett. 31, 3297–3299 (2006). 4
5. D.S. Sumida, D.A. Rockwell, M.S. Mangir, “Energy storage and heating measurements in flashlamp-pumped
Cr:Nd:GSGG and Nd:YAG”, IEEE J. Quantum Electron. 24, 985 (1988) 4
6. F. Lenhardt, M. Nittmann, T. Bauer, J. Bartschke, J.A. Lhuillier, “High-power 888-nm-pumped Nd:YVO4 1342-
nm oscillator operating in the TEM00 mode”, Appl. Phys. B 96, 803 (2009). 4
7. G. Trenec, W. Volondat, O. Cugat, and J. Vigue, “Permanent magnets for faraday rotators inspired by the design
of the magic sphere,” Appl. Opt. 50, 4788–4797 (2011). 4
8. F. Lenhardt, A. Nebel, R. Knappe, M. Nittmann, J. Bartschke, and J. A. L’huillier, “Efficient single-pass sec-
ond harmonic generation of a continuous wave Nd:YVO4- laser at 1342 nm using MgO:ppLN”, CLEO 2010,
CThEE5.
9. U. Eismann, “A novel all-solid-state laser source for lithium atoms and three-body recombination in the unitary
Bose gas”, Ph.D. thesis, Universite Pierre et Marie Curie – Paris VI, http://tel.archives-ouvertes.fr/tel-00702865/
(2012).
10. Y. Nishida, H. Miyazawa, M. Asobe, O. Tadanaga, H. Suzuki, “Direct-bonded QPM-LN ridge waveguide with
high damage resistance at room temperature”, Electron. Lett. 39(7), 609-610 (2003). 4
11. T. Nishikawa, A. Ozawa, Y. Nishida, M. Asobe, F. Hong, T. W. Hnsch, “Efficient 494 mW sum-frequency gener-
ation of sodium resonance radiation at 589 nm by using a periodically poled Zn:LiNbO3 ridge waveguide”, Opt.
Express 17, 17792–17800 (2009). 4
12. K. Parameswaran, J. Kurz, R. Roussev, M. Fejer, “Observation of 99% pump depletion in single-pass second-
harmonic generation in a periodically poled lithium niobate waveguide”, Opt. Lett. 27, 43–45 (2002). 6
13. D. Jedrzejczyk, R. Guther, K. Paschke, G. Erbert, G. Trankle, “Diode laser frequency doubling in a ppMgO:LN
ridge waveguide: influence of structural imperfection, optical absorption and heat generation”, Appl. Phys. B
109, 33-42 (2012). 7, 8
14. S. Helmfrid, G. Arvidsson, “Influence of randomly varying domain lengths and nonuniform effective index on
second-harmonic generation in quasi-phase-matching waveguides”, J.Opt. Soc.Am.B 8(4), 797-804 (1991). 7
15. F. Laurell, G. Arvidsson, “Frequency doubling in Ti:MgO:LiNbO3 channel waveguides”, J.Opt. Soc.Am.B 5(2),
292-299 (1988) 8
16. A. B. Fallahkhair, K. S. Li, T. E. Murphy, “Vector Finite Difference Modesolver for Anisotropic Dielectric
Waveguides”, J. Lightwave Technol. 26(11), 1423–1431, (2008). 8
17. J. A. Armstrong, N. Bloembergen, J. Ducuing, P. S. Pershan, “Interactions between Light Waves in a Nonlinear
Dielectric”, Phys. Rev. 127(6), 1918–1939 (1962) 8

18. R. G. Batchko, G. D. Miller, A. Alexandrovski, M. M. Fejer, R. L. Byer, “Limitations of high-power visible
wavelength periodically poled lithium niobate devices due to green-induced infrared absorption and thermal
lensing”, CLEO: Lasers and Electro-Optics, Technical Digest., 75–76 (1998) 8, 9
19. Y. Furukawa, K. Kitamura, A. Alexandrovski, R. K. Route, M. M. Fejer, G. Foulon, “Green-induced infrared
absorption in MgO doped LiNbO3”, Appl. Phys. Lett. 78(14), 1970-1972 (2001) 8
20. O. A. Louchev, N. E. Yu, S. Kurimura, K. Kitamura, “Thermal inhibition of high-power second-harmonic gener-
ation in periodically poled LiNbO3 and LiTaO 3 crystals”, Appl. Phys. Lett. 87(13), 131101 (2005). 8, 9
21. K. Okamoto, “Fundamentals of Optical Waveguides”, Academic Press, San Diego (2000) 8
22. O. Gayer, Z. Sacks, E. Galun, A. Arie, “Temperature and wavelength dependent refractive index equations for
MgO-doped congruent and stoichiometric LiNbO3”, Appl. Phys. B 91, 343–348 (2008). 8
23. J. R. Cannon, “The One-Dimensional Heat Equation”, Cambridge University Press, Cambridge (1984) 8
24. D. Nikogosyan, “Nonlinear Optical Crystals: A Complete Survey”, Springer-Verlag, New York (2005) 8
25. K. D. Cole, J. V. Beck, A. Haji-Sheikh, B. Litkouhi, “Heat Conduction Using Green’s Functions”, 2nd edition,
CRC Press (2010) 9
26. V. G. Dmitriev, G .G. Gurzadjan, D. N. Nikogosjan, “Handbook of nonlinear crystals”, 2nd edition, Springer,
Berlin (1997) 9
27. J. R. Schwesyg, M. C. C. Kajiyama, M. Falk, D. H. Jundt, K. Buse, M. M. Fejer, “Light absorption in undoped
congruent and magnesium-doped lithium niobate crystals in the visible wavelength range”, Appl. Phys. B 100,
109-115 (2010) 9
28. E. Mimoun, L. De Sarlo, J. Zondy, J. Dalibard, F. Gerbier, “Sum-frequency generation of 589 nmlight with
near-unit efficiency”, Opt. Express 16, 18684–18691 (2008). 9
29. V. Mikhailov, O. Shaunin, I. Shcherbakov, V. Maslov, “Nonlinear absorption in KTP crystals”, Quant. Electr.,
27(4), 356-359 (1997). 9
30. B. Boulanger, I. Rousseau, J. P. Feve, M. Maglione, B. Menaert, G. Marnier, “Optical Studies of Laser-Induced
Gray-Tracking in KTP”, IEEE J. Quant. Electr., 35(3), 281–286 (1999). 10
1. Introduction
For atom cooling applications, simple, yet high-power, single-frequency cw laser sources are
required. For addressing the lithium D-line atomic transitions near 671 nm, the choice of laser
sources is limited. One reason is the relatively weak performance of semiconductor lasers at
shorter wavelengths in the red part of the visible spectrum. Dye lasers, on the other hand,
are expensive and difficult to handle. They also display a significant amount of fast frequency
noise, requiring advanced frequency locking procedures. An alternative approach followed in
our group is frequency doubling of infrared solid-state lasers, which offer high output power and
intrinsic stability [1, 2]. However, the necessity of frequency doubling increases the complexity
of such setups. Therefore, it is of great practical interest to technically simplify the frequency
doubling process.
In contrast to free-propagation schemes, guiding of optical fields has the intrinsic advantage
of small mode field diameters along the guiding structure. Such, high-intensity fields can prop-
agate for long distances in a medium without being limited by diffraction. This allows one to
increase the effects of interactions between light fields, external fields and fields provided by
the medium by a large amount. Therefore, a number of waveguide-based devices have been
developed and commercialized, reaching from fiber (Raman) lasers and waveguide EOMs to
waveguide-based nonlinear-optics modules, most popular in the form of waveguide frequency
doublers. Excellent properties have been demonstrated with the latter, ranging from very high
nonlinear conversion efficiencies even at intermediate powers to frequency and phase stability
down to state-of-the-art metrology levels. Maximum output powers of 1.6 W at 532 nm have
been reported in [3].
In this article, we present a frequency-doubled laser system operating in the vicinity of the
lithium D-line resonances. Starting from a record-level single-frequency output power of 6.5 W
at 1342 nm, we obtain 2.3 W frequency-doubled light using a custom-made ridge-waveguide
PPLN frequency doubling module. While being largely sufficient for running an atom cooling
experiment, the light source features a strongly reduced complexity of the locking scheme. This
compares favourably to a two-cavity setup similar to the one presented in [1], where the 671 nm

output power is increased to 5.2 W.
2. Fundamental laser setup and characteristics
FP
M1
M2
M3
M4
E1
E2
Nd:YVO4
λ/2
888 nm1342 nm
TGG
138.5mm
L1
L2
Fig. 1. (Color online) Setup of the 1342 nm laser source. Two lenses, L1 and L2, image
the output of the pump source, a fiber-coupled diode laser bar (FP), into the Nd:YVO4 gain
medium. The ring resonator consist of four mirrors M1−4 in bow-tie configuration, which
are all highly reflective at 1342 nm except M2 serving as partly transmitting output coupling
mirror. A Faraday rotator (TGG) in combination with a half-wave plate (λ/2) enforces
unidirectional operation. Insertion of two etalons E1−2 allows for single-longitudinal-mode
behavior and wavelength tunability.
15 20 25 30
0
2
4
6
Absorbed pump power @ 888 nm (W)
Outputpow
er@
1342
nm
(W)
Fig. 2. (Color online) Single-frequency laser output power of the laser (dots) as a function
of the absorbed pump power. The setup is optimized for the maximal absorbed pump power
Pabs,max = 31.3W resulting in a maximum output power of Pout = 6.56W. The oscillation
threshold is found at Pabs = 13.9W. A linear fit (red line) for Pabs > 20 W yields a slope
efficiency of ηsl = 28.1% in the high-power regime.

The fundamental light source we use throughout this article is a modified version of the laser
presented in [1]. The following improvements have been implemented in order to minimize and
compensate for thermal effects inside the laser gain medium:
Firstly, as in [2], we use pump light at 888 nm instead of 808 nm. This lowers the quantum
defect per lasing cycle of the active ions by 15%, thus reducing the heat load deposited in
the laser crystal [4]. Moreover the lower absorption coefficient at 888 nm allows to spread the
thermal load over a longer crystal and a larger pump volume, therefore reducing the heat density
and minimizing stress and thermal lensing in the gain medium.
Secondly, the flat pump coupling mirror was replaced by a convex meniscus mirror supposed
to compensate for the thermal lens of the Nd:YVO4 crystal. Its radius of curvature of rc =500 mm was chosen in accordance with the measured focal length of f = 170 mm of the thermal
lens under lasing conditions [5, 6].
Figure 1 shows the experimental setup of the optimized oscillator operating at 1342 nm.
The 888 nm output of the temperature-stabilized fiber-coupled QPC BrightLase Ultra-50 diode
stack (NA = 0.22, 400µm fiber core diameter), emitting up to 42.6 W at 888 nm (Spectral
width (FWHM): 2.2 nm), is focused by two lenses ( f1 = 75mm, f2 = 175mm) to a top-hat
profile of radius wpump = 970µm inside the laser crystal. The dimensions of the actively cooled
Nd:YVO4 crystal (a-cut, anti-reflection coated for 1342nm and 888nm) were chosen to be
4× 4× 25 mm3 and the ion doping was accordingly adjusted to 0.5 at. %. The cavity consists
of three curved mirrors (M1, M3 and M4) and one flat mirror (M2), forming a bow-tie cavity.
The pump coupling mirror M1 is, as mentioned above, a convex meniscus mirror with a radius
of curvature of rc = 500 whereas M3 and M4 are concave mirrors with a radius of curvature of
100mm and 150mm, respectively. M1, M3 and M4 are highly reflective coated for 1342nm, and
M1 is furthermore transmitting at 888 nm. The optimal transmittance of the output coupler M2
regarding the maximum output power was found to be 7.5%. Unidirectional operation of the
ring laser is enforced by a Faraday rotator consisting of a cylindrical terbium-gallium-garnet
crystal (TGG) of 6mm length placed in a strong permanent magnet [7] in combination with
a true-zero-order half-wave plate. Two uncoated infrared fused etalons of 500µm and 4mm
thickness are used in order to assure single frequency behavior and tunability of the wavelength.
Figure 2 shows the output power of the laser as a function of the absorbed pump power
for an increasing pump power. The lasing threshold was found at an absorbed pump power
Pabs = 13.9W and the power rises linearly above Pabs = 20W with a slope efficiency of
ηsl = dPout/dPabs = 28.1%. A maximum output power of Pout = 6.56W was reached for an
absorbed pump power of Pabs,max = 31.3W, which is the maximum the pump can deliver. This
resulted in an optical-to-optical conversion efficiency of 16.3%. As can be seen in Figure 2,
the fundamental output power is not limited by thermal roll-off. Therefore, with more available
pump power, we expect to see a further significant increase in single-mode fundamental power.
The beam quality parameter of the IR output beam is determined through a caustic measure-
ment and results in a value of M2 ≤ 1.2.
3. Waveguide second-harmonic generation
The nonlinear device applied for second harmonic generation (SHG) in this experiment is a
wavelength conversion module from NTT Electronics (WH-0671-000-A-B-C) that is described
in detail in [10, 11]. It contains a periodically poled ZnO-doped LiNbO3 (ppZnO:LN) ridge
waveguide with a nearly quadratic cross section of 14.8×14.2µm2 and a length of L = 10mm.
The chosen poling period of 13.2µm provides quasi-phase-matching (QPM) for SHG at a fun-
damental wavelength of 1342 nm and at a waveguide temperature of approximately 49C. It is
temperature-stabilized using a built-in NTC thermistor and a thermoelectric cooling element
together with a commercial regulator circuit. The entire module is mounted on a passive heat

sink and enclosed in a metal housing. The temperature of the waveguide crystal can therefore
be stabilized to within 0.1C.
1342 nmLaser cavity
Ethalons
TGG
λ/2Nd:YVO
4
Wavelength Conversion Module671 nm
Pump diode888 nm Zero-lens
Waveguide
Lens1
Fiber
Filter
Lens2
Lens3
Fig. 3. (Color online) Schematic view of the frequency doubling setup. Shown are the IR
laser cavity and the wavelength conversion module. The pump diode output is focused in
the Nd:YVO4 laser crystal inside the laser cavity, which also contains a Faraday rotator
and a λ /2-waveplate for unidirectional oscillation and two etalons for frequency selection.
The wavelength conversion module includes a ppZnO:LN nonlinear waveguide for second-
harmonic generation.
The experimental setup for frequency doubling is schematically presented in Figure 3. The
waveguide module is fiber-pigtailed on the input side and includes collimating and focussing
lenses ensuring efficient coupling between the fiber and the waveguide. The output light is colli-
mated by a lens and passes through an AR-coated window (Edmund Optics P/N 47837) before
exiting the waveguide module. We separate both second-harmonic and residual fundamental
radiation using a dichroic beamsplitter set featuring a total transmission of 98.0% and 93.1%
for the SH and IR light, respectively.
The coupling efficiency of the fundamental light to the fiber and through the ppZnO:LN
crystal waveguide is measured by comparing the IR light power behind and in front of the
module without SHG. For this purpose, the crystal mount temperature is set to 20C which
is sufficiently far detuned from the QPM temperature for the SHG process. Alternatively, the
transmission at the extraordinary polarization can be directly determined by measuring the
transmission at the ordinary polarization since both equal for our particular waveguide design.
Taking into account the optical losses for the fundamental wavelength at the optical elements
on the output of the waveguide module, the coupling efficiency could be determined to 78%.
This value remains constant over the full available input power range.
Subsequently, the phase-matching curve of the waveguide was investigated by tuning the
crystal mount temperature and monitoring the variation in SH power. Two tuning curves for
different IR pump powers are presented in Figure 4. For a relatively low pump power of 1.07 W,
the curve matches the theoretical sinc2 distribution very well and the maximum SH power of
200 mW is reached at a crystal mount temperature of 48.9C. The measured curve is symmetric
and has an acceptance width (FWHM) of ∆T = 5.4C. At elevated fundamental power levels,
light absorption effects heat the waveguide and modify the phase-matching curve. This results
in a shift of the conversion peak down to 46.4C for the maximum pump power of 4.44 W and

30 40 50 60 70 800
50
100
150
200
Waveguide temperature (C)
SH
pow
erP2ω(m
W)
Pω = 1.07W
Simulation
Pω = 4.44W
Simulation
0
0.5
1
1.5
2
2.5
SH
pow
erP2ω(W
)
Fig. 4. (Color online) SH power as a function of the waveguide mount temperature Tmount at
the fundamental IR pump power Pω = 1.07W and Pω = 4.44W coupled to the waveguide.
Shown are the measured data points and the simulation results of our fitted model (dashed
lines).
the corresponding SH power of 2.4 W. The shape of the main peak becomes slightly nonsym-
metric and its height is lowered with respect to the side-peaks. The acceptance width is in this
case only marginally reduced to ∆T = 4.8C. Since the shape for low conversion efficiency,
and especially the zero-efficiency positions do not change, we attribute the observed thermal
effects mainly to absorption of either the second-harmonic light, or to second-harmonic induced
fundamental absorption.We note that even at the highest power levels present in the course of
this article, thermal effects did not cause power instabilities or other types of output power
limitations in our setup.
Figure 5 presents the adjusted crystal mount temperature maximizing the SH output power
for a series of different IR pump power values. As we have already stated, the maximum SH
power in the limit of low IR pump powers is reached for 48.9C. While increasing IR pump
power, the crystal mount temperature has to be gradually reduced and reaches its minimum
value of 46.4C at the maximum pump power of 4.44 W.
The SH output power characteristics of the waveguide were measured as a function of the
coupled fundamental pump power, as shown in Figure 6. At high pump powers, the crys-
tal mount temperature had to be adjusted at each IR pump power value in order to max-
imize the conversion, as discussed above. For small pump powers up to 400 mW, the ex-
perimental results are well fit by a parabola with a conversion efficiency of 18.4 %/W. For
elevated fundamental power, pump depletion effects set in and the data points can be very
well fit by the coupled waves theory presented in [12]. Fitting the well known lossless so-
lution ηwg = tanh2[
(η0Pω L2)1/2]
to our experimental data yields the normalized efficiency
η0 = 19.9 %/Wcm2. This underscores the very uncritical behavior of the SHG process we ob-
serve at these high powers, requiring only a small readjustment of the phase matching tempera-
ture.
A caustic measurement of the SH beam quality parameter yields a value of M2 ≤ 1.1 at the
output of the ridge waveguide.

4. Theoretical model
We applied a simplified version of the theoretical model presented in [13] in order to simulate
the SHG process and to describe quantitatively the influence of optical absorption on the phase-
matching curve. In the following, the subscript index j denotes either the IR light for j = 1 or
the SH light for j = 2.
We define the scalar value of the electric field amplitude according to [14] as A j =
(2Pj/Seffn jε0c0)1/2
, where n j is the refractive index, c0 is the vacuum light velocity and ε0
0 1 2 3 4
46
47
48
49
Pump power Pin @ 1342 nm (W)
WaveguideQPM
temperature
(C)
Experimental dataSimulation
Fig. 5. (Color online) Optimal crystal mount temperature Tmount,opt during SHG process in
dependence of the fundamental IR pump power Pω coupled to the waveguide. The crys-
tal mount temperature is adjusted for every pump power value in order to maximize the
corresponding SH power.
(a)
0 1 2 3 4
0
1
2
3
Pump power Pω @ 1342 nm (W)
SH
pow
erP2ω(W
)
Experimental data
P2ω = Pω tanh2(√η0Pω · L)
P2ω = ηP 2ω
0 0.2 0.4
0
1
2
3·10−2
(b)
0 1 2 3 4
0
0.2
0.4
0.6
0.8
Pump power Pω @ 1342 nm (W)
Con
versioneffi
ciency
η wg=
P2ω/P
ω
Experimental data
ηwg = tanh2(√η0Pω · L)
ηwg = ηPω
0 0.2 0.4
0
2
4
6
8·10−2
Fig. 6. SH power output (a) and conversion efficiency (b) versus fundamental IR pump
power coupled to the waveguide. The crystal mount temperature is adjusted for every pump
power value as presented in Figure 5.

is the permittivity of free space. Seff denotes the effective overlap area of the electric field dis-
tributions E j(y,z) of the fundamental TM modes of the waveguide [15]:
Seff =
(∫∫
dxdy|E1(y,z)|2)2 (∫∫
dxdy|E2(y,z)|2)
|∫∫
dxdyE1(y,z)2E2(y,z)∗|2
, (1)
which is calculated with an open source mode solver software [16]. The scalar value of the
electric field amplitude A j is calculated by solving a system of coupled wave-equations that
was derived in [17] and applied for waveguide simulation in [13]:
dA0
dx= ∆kQPM −
(
2σ1A2 −σ2A2
1
A2
)
cos(A0) (2)
dA1
dx= −σ1A1A2 sin(A0)−
1
2
(
α1 +δGRIIRAA42
)
A1 (3)
dA2
dx= σ2A2
1 sin(A0)−1
2
(
α2 +δ2Ph.A22
)
A2 (4)
with A0 = 2φ1 − φ2 +∆kQPM, σ1 = ω1deff/c0n1, σ2 = ω1deff/c0n2, where deff = 2/π · d33 is
the effective nonlinear coefficient, ω j is the wave frequency with ω2 = 2ω1, φ j is the electric
field phase, α j is the linear absorption coefficient, δGRIIRA = αGRIIRA(n2ε0c0/2)2 and αGRIIRA
is the green induced infrared absorption coefficient [18, 19], δ2Ph. = β2Ph.n2ε0c0/2 and β2Ph. is
the two-photon absorption coefficient for the second-harmonic light [20]. Please note that we
assume the linear losses in the ridge waveguide to equal the linear optical absorption.
The phase mismatch parameter is defined as
∆kQPM(T ) = 2β1(T )−β2(T )+2π
Λ(T )(5)
with Λ(T ) the poling period, β j(T ) = N j(T )ω j/c0 the waveguide fundamental mode prop-
agation constant and N j(T ) the effective refractive index calculated with the effective index
approximation [21]. This calculation uses the temperature dependent Sellmeier equations from
[22] for the extraordinary refractive index n j of 5% MgO-doped congruent PPLN. All of these
parameters depend on the temperature T which may vary along the propagation axis x due to
heat generation resulting from optical absorption. Please note that we do not account for any
inhomogeneity of the ridge waveguide height zR, which is justified by the observation of a tem-
perature dependent phase matching curve that matches the theoretical sinc2 distribution very
well at low intensities, see Figure 4.
The effect of the optical absorption on the temperature distribution along the waveguide
axis x is estimated by supposing a one-dimensional, steady-state heat diffusion model [23],
represented by a corresponding differential equation for the crystal temperature of the form
− k∂ 2
∂ z2T (z) = q(z) (6)
with boundary conditions corresponding to our waveguide design
T (z = 0) = Tmount (7)
∂
∂ zT(z = zH) = 0 (8)
where k = 5W/Km is the heat conductivity of the lithium tantalate substrate [24], z is the
vertical coordinate parallel to the crystal optical axis and zH = 46.2 µm is the height of the
entire waveguide structure.

The heat source density is defined as a boxcar function restricted to the ridge waveguide
interval zR = 14.2µm
q(z) =
qR for zH − zR < z < zH
0 otherwise.(9)
Applying the Green’s function ansatz [25], the differential equation (6) can be solved for ev-
ery x position along the propagation axis and the temperature in the center of the ridge waveg-
uide
T(
x,zH +zR
2
)
=qR(x)
k
[
zHzR −5
8z2
R
]
+Tmount (10)
is assumed to be approximately the temperature T (x) of the entire ridge waveguide. This
result is applied in the system of coupled equations (2)-(5). The heat source density depends on
the IR and SH intensities and is defined by [20]
qR(x) =(
α1 +αGRIIRAI22
)
I1 +(α2 +β2Ph.I2) I2 , (11)
where I j = (n jc0ε0/2)A2j is the light intensity.
In order to reproduce our experimental data concerning the shift of the optimal waveguide
mount temperature with increasing fundamental IR pump power, as well as the conversion ef-
ficiency of the waveguide, we have to adapt the material dependent optical coefficients of our
model. In particular, the values of the nonlinear optical coefficient d33 and the poling period Λneed to be set to 12.8 pm/V and 13.48 µm, respectively. The linear optical absorption coeffi-
cients α1 and α2, that are assumed to equal for simplification, are found to have a relatively low
value of 0.09 l/m, compared to the literature value of 0.2 1/m for 1064 nm [26] and 1.0 1/m for
532 nm [27]. Additionally the two-photon absorption coefficient β2Ph. of 4.5×10⁻¹¹ m/W has
to be applied, corresponding well to the literature value of 5×10⁻¹¹ m/W for 532 nm [20, 26].
In our case the intensity dependent GRIIRA coefficient αGRIIRA [18] does not need to be taken
into account in order to reproduce the experimental results. We attribute this to the fact that the
intensities inside our waveguide remain well below 1MW/cm2 even for the highest applied IR
pump powers. The results of our simulation, assuming these parameter settings, are presented
in Figure 4 and Figure 5 together with the experimental data points.
5. Comparison to SHG in an enhancement cavity
An alternative method for efficient frequency doubling of infrared lasers is to use periodically-
poled nonlinear crystals in an external enhancement cavity. Even though this approach is tech-
nically more complex than waveguide doubling, due to the requirement of a second cavity, we
intended to compare its performance to the results of the waveguide conversion module.
The doubling cavity setup has a similar design as the ones presented in [1, 28] and is il-
lustrated in Figure 7. As for the laser, a four-mirror folded ring-cavity is employed. The fun-
damental light is coupled through the plane mirror M′1 with reflectivity Rc = 90% optimizing
the cavity impedance matching. All other mirrors are highly reflective at 1342nm and M′4 is
transmitting at 671nm. M′2 (M′
3) is attached to a fast (slow) piezoelectric transducers, allowing
to act on the cavity length in the 50nm (8µm) range. M′3 and M′
4 are concave with a radius
of curvature rc = 150mm and rc = 100mm, respectively. Their distance M′3–M′
4 is 156mm.
The nonlinear crystal is placed in the corresponding focus with waist w0 ≃ 79 µm. The rela-
tively large waist inside the crystal was chosen in order to reduce intensity-related detrimental
effects such as two-photon and second-harmonic-induced absorption [29] and gray-tracking

M′
1
M′
2
M′
3
M′
4
L′
1
L′
2
L′
3
ppKTP
1342 nm
671 nm
98mm
Fig. 7. (Color online) Scheme of the doubling cavity setup comprising the four mirrors
M′1−4 and the ppKTP nonlinear crystal. The light is coupled to the Gaussian cavity eigen-
mode using lenses L′1,2, whereas L′
3 collimates the SH output. The crystal mount is depicted
sectioned to improve visibility and the IR (SH) beam is illustrated in blue (red). The dis-
tance M′3–M′
4 is 156mm.
(a)
0 10 20 30 40 50
0
1
2
3
4
5
Intra-cavity power Pω (W)
SH
pow
erP2ω(W
)
(b)
0 1 2 3 4 5 6
0.2
0.4
0.6
0.8
Pump power Pin @ 1342 nm (W)
Con
versioneffi
cien
cyη=
P2ω/P
in
Fig. 8. Measurement of the cavity doubling efficiency, where points are measured data and
lines are fits. (a) The second harmonic output power as a function of the fundamental intra-
cavity power. As expected a quadratic function can be fitted to the conversion. (b) The
cavity conversion efficiency as a function of the fundamental input power.
[30]. Mode matching between the laser output and the cavity is accomplished using a set of
spherical lenses, yielding a mode coupling efficiency of 95%. The frequency doubled light is
transmitted through M′4 and collimated to a 1/e2 beam radius of 1.2mm.
After frequency-locking the cavity to the laser, as described in [1], the SH power P2ω was
measured as a function of the intra-cavity IR power Pω , see Figure 8(a). As expected, the
conversion shows quadratic behavior and fitting yields a single-pass conversion efficiency of

ηsp = 0.22%/W. The SH output power follows a variation of the intra-cavity fundamental
power without observable hysteresis. Moreover, no long-term degradation was observed, indi-
cating the absence of gray-tracking, even for the highest reachable fundamental pump powers
in our setup. The maximal SH output power P2ω = 5.15W is reached for a IR pump power of
Pin = 5.91W, corresponding to a doubling efficiency of ηconv = 87%, as can be seen in Fig-
ure 8(b).


General conclusion and outlook
This thesis presented the development of an experimental apparatus, designed to create
degenerate Fermi-Fermi gas mixtures of lithium and potassium. As of this writing, it is
already capable to produce a deeply degenerate Fermi gas of 40K with relatively large atom
numbers.
At the beginning of my thesis, the Fermix-machine had already been realized to some extent.
The dual-species MOT was operational and produced large atomic samples with several 109
atoms of both 6Li and 40K at the same time. Moreover, the first magnetic transport sequences
were successfully tested. Nevertheless the progress of the experiment was impeded at the
time of my arrival, which was mainly due to two problems. First of all, the moderate vacuum
quality in the science cell prevented the evaporation dynamics from being efficient enough
to reach quantum degeneracy. Secondly, the transport efficiency in terms of atom numbers
was still below 50% and the temperatures of the atomic samples in the science cell were too
high for initiating an efficient evaporation. A further drawback was the rudimentary control
software of the experiment which was not appropriate for operating complex sequences and
did not feature automatic parameter list runs.
We started to solve these issues by first replacing the old control software by the Cicero Word
Generator software package. This control software particularly designed for atomic physics
experiment offers the possibility to handle complicated sequences easily, to scan parameter
settings automatically during long list runs and to control the experiment remotely. Being
an accurately programmed open source project, the program could easily be adapted to
our particular requirements, for example by implementing the control over the magnetic
transport power supplies or the RF synthesizers. Experimental data acquisition thus became
more efficient and flexible.
Subsequently, we replaced all parts of the vacuum assembly in the transport region by a
redesigned setup. Additional ion pumps were installed close to the science cell and the inner
walls of the new vacuum parts were coated with an active getter material provided by the
CERN. This enhanced the vacuum lifetime in the science-cell from less than 25 s to over 100 s.
In order to reach such a long lifetime we had also to take precautions against stray-light from
the laser tables.
In order to increase the transport efficiency we were in need for a reduced initial transport
temperature. Therefore, we implemented a D1 sub-Doppler cooling scheme for 40K that was
theoretically proposed by Saijun Wu. The D1 molasses phase cools the 40K atoms in few
milliseconds to deep sub-Doppler temperatures, while preserving the large atom numbers of

6 Second harmonic generation
the MOT. Together with the preceding CMOT phase, which enhances the atomic density by
a factor of five, this technique yields a gain in phase space density of about three orders of
magnitude.
As a result, the initial and final transport temperatures were reduced considerably and the
transport efficiency raised from 50% to 80% for 40K. First, we intended to cool the hot 6Li
atoms by letting them thermalize with the cold 40K cloud. However, the large temperature
difference between the 40K and 6Li samples after the D1 molasses phase led to a disadvanta-
geous situation. Due to the small spatial overlap of the two clouds in the magnetic trap both
species did not thermalize on reasonable time scales. Therefore, we decided to implement the
D1 molasses cooling scheme also for 6Li.
For the purpose of additional laser cooling of lithium, we developed a novel all-solid state
laser source emitting up to 5.2W of output power close to the lithium D-line transitions at
671 nm. One key ingredient of our new high-power design is an improved heat management in
the Nd:YVO4 gain medium by using the 888 nm pumping transition instead of the common
wavelength of 808 nm. Furthermore we tested three different approaches to perform second-
harmonic generation, all of them reaching considerably high power outputs: 5.2W with
an enhancement cavity containing a ppKTP crystal, 2.1W via intracavity doubling, and
2.4W with a nonlinear waveguide structure, this SHG method being particularly simple to
implement. For all three techniques, the laser source has furthermore a transversal mode
quality factor of M2 ∼ 1, operates longitudinally single-mode and has a narrow linewidth
smaller than 200 kHz. Hence, it can serve as a master high-power laser source for cold atoms
experiments involving lithium isotopes. Also other applications are imaginable, for example in
atom interferometry, for lithium isotope separation, or as pump for Cr:LiSAF lasers featuring
low intensity noise.
The simultaneous sub-Doppler cooling for 40K and 6Li proved to yield phase space densities
of ∼ 10−4 for both 40K and 6Li. As a result, the atomic samples in the optically plugged
magnetic quadrupole trap were sufficiently dense to provide high elastic collision rates and
allowed for efficient evaporative cooling to quantum degeneracy.
Our new sub-Doppler cooling scheme is applicable to all alkali atoms. To date, several other
research groups have implemented our D1 cooling scheme to improve the performance of their
experiments working with 6Li [166], 7Li [167] 3 and 39K [168–170]. In addition, this scheme
might allow for the implementation of single-atom resolved imaging of fermions in a pinning
lattice, as was shown by the group of Stefan Kuhr in Glasgow working with 40K ([171] and
private communication). In the case of 6Li, this would enable quantum simulation of lattice
fermions in a regime with rapid matter wave dynamics, which is inaccessible by heavy atoms.
In a next step, we constructed and characterized all technical components, necessary for evap-
orative cooling to quantum degeneracy in the science cell. The forced evaporation is first per-
formed in an optically plugged magnetic quadrupole trap, continues in a single beam optical
dipole trap and finishes in a crossed dipole trap. At the moment, we can create a degener-
3 The D1 molasses scheme is also applied for 7Li by Ketterle at MIT, Cambridge, United States (privatecommunication)
162

6.5 Conclusion
ate spin mixture of 40K in the spin-states∣∣F = 9/2, mF = −9/2
⟩and
∣∣F = 9/2, mF = −7/2⟩,
with atom numbers of ∼ 1.5 × 10⁵ in each state, a temperature of 64 nK, and T/TF ∼ 0.17.
The next challenge for our team will be the optimization of the dual-species evaporation
to a quantum degenerate 6Li-40K mixture. Once this major goal achieved, we can study
many-body systems in mixed dimensions, meaning that lithium and potassium evolve in
different dimensions. For example we could investigate new quantum phases like interlayer
superfluidity [113], with 6Li mediating effective interactions between 40K atoms in different
layers. In the same context, calculations were performed by our group member Daniel Suchet
regarding the transmission of a mechanical perturbation throughout the 2D layers of 40K
mediated by the excitation and absorption of phonons in a superfluid of 6Li. Furthermore,
we could make an attempt to observe the Efimov-effect in mixed dimensions [105], confinement
induced resonances [100–104] or p-wave resonances between 6Li-40K dimers and 40K atoms
tunable by the lattice depth [106].
163


A Publications
The work presented in this thesis has been published in the following peer-reviewed journal
articles:
— Sub-Doppler laser cooling of fermionic 40K atoms in three-dimensional gray
optical molasses
D. R. Fernandes 1, F. Sievers 1, N. Kretzschmar, S. Wu, C. Salomon and F. Chevy
EPL (Europhysics Letters) 100, 63001 (2012)
See page 47 for print version.
— 2.1-watts intracavity-frequency-doubled all-solid-state light source at 671 nm
for laser cooling of lithium
U. Eismann, A. Bergschneider, F. Sievers, N. Kretzschmar, C. Salomon and F. Chevy
Opt. Express 21, 9091 (2013)
See page 129 for manuscript version.
— Simultaneous sub-Doppler laser cooling of fermionic 6Li and 40K on the D1
line: Theory and experiment
F. Sievers, N. Kretzschmar, D. R. Fernandes, D. Suchet, M. Rabinovic, S. Wu, C. V.
Parker, L. Khaykovich, C. Salomon and F. Chevy
Phys. Rev. A 91, 023426 (2015)
See page 53 for print version.
— Multiwatt-level second harmonic generation in ppZnO:LN ridge waveguide
N. Kretzschmar, F. Sievers, U. Eismann, F. Chevy and C. Salomon
To be published, see page 149 for a preliminary draft.
1 These authors contributed equally to this work.


Bibliography
[1] M. H. Anderson, J. R. Ensher, M. R. Matthews, C. E. Wieman, and E. A. Cornell,
Observation of bose-einstein condensation in a dilute atomic vapor., Science (New York,
N.Y.) 269, 198 (1995). 1
[2] K. Davis, M. Mewes, M. Andrews, N. van Druten, D. Durfee, D. Kurn, and W. Ketterle,
Bose-Einstein Condensation in a Gas of Sodium Atoms, Physical Review Letters 75,
3969 (1995). 1, 29
[3] A. Einstein, Quantentheorie des einatomigen idealen Gases, Kgl. Preuss. Akad. Wiss
(1924). 1
[4] Bose, Plancks Gesetz und Lichtquantenhypothese, Zeitschrift fur Physik 26, 178 (1924).
1
[5] C. Bradley, C. Sackett, J. Tollett, and R. Hulet, Evidence of Bose-Einstein Condensa-
tion in an Atomic Gas with Attractive Interactions, Physical Review Letters 75, 1687
(1995). 1
[6] K. Madison, F. Chevy, W. Wohlleben, and J. Dalibard, Vortex formation in a stirred
Bose-Einstein condensate, Physical Review Letters 84, 806 (2000). 1
[7] J. R. Abo-Shaeer, C. Raman, J. M. Vogels, and W. Ketterle, Observation of vortex
lattices in Bose-Einstein condensates., Science (New York, N.Y.) 292, 476 (2001). 1
[8] B. DeMarco, Onset of Fermi Degeneracy in a Trapped Atomic Gas, Science 285, 1703
(1999). 1, 3, 30
[9] K. Davis, M.-O. Mewes, M. Joffe, M. Andrews, and W. Ketterle, Evaporative Cooling
of Sodium Atoms, Physical Review Letters 75, 2909 (1995). 1
[10] W. Ketterle, D. S. Durfee, and D. M. Stamper-Kurn, Making, probing and understand-
ing Bose-Einstein condensates, eprint arXiv:cond-mat/9904034 90 (1999). 1, 30, 68
[11] A. Leggett, Bose-Einstein condensation in the alkali gases: Some fundamental concepts,
Reviews of Modern Physics 73, 307 (2001). 1
[12] L. Pitaevskii and S. Stringari, Bose-Einstein Condensation, Oxford University Press
(2003). 1
[13] C. J. Pethick and H. Smith, Bose–Einstein Condensation in Dilute Gases, Cambridge
University Press, 2nd editio edn. (2008). 1
[14] M. R. Andrews, Observation of Interference Between Two Bose Condensates, Science
275, 637 (1997). 1
167

Bibliography
[15] A. Matsubara, T. Arai, S. Hotta, J. S. Korhonen, T. Mizusaki, and A. Hirai, Quest
for Kosterlitz–Thouless Transition in Two-Dimensional Atomic Hydrogen, Cambridge
University Press, Cambridge (1995). 2
[16] I. F. Silvera, The quest for Bose-Einstein condensation in atomic hydrogen, Journal of
Low Temperature Physics 101, 49 (1995). 2
[17] A. P. Mosk, M. W. Reynolds, T. W. Hijmans, and J. T. M. Walraven, Optical Observa-
tion of Atomic Hydrogen on the Surface of Liquid Helium, Journal of Low Temperature
Physics 113, 217 (1998). 2
[18] A. Safonov, S. Vasilyev, I. Yasnikov, I. Lukashevich, and S. Jaakkola, Observation of
Quasicondensate in Two-Dimensional Atomic Hydrogen, Physical Review Letters 81,
4545 (1998). 2
[19] J. Denschlag, Generating Solitons by Phase Engineering of a Bose-Einstein Condensate,
Science 287, 97 (2000). 2
[20] S. Burger, K. Bongs, S. Dettmer, W. Ertmer, and K. Sengstock, Dark Solitons in
Bose-Einstein Condensates, Physical Review Letters 83, 5198 (1999). 2
[21] L. Khaykovich, F. Schreck, G. Ferrari, T. Bourdel, J. Cubizolles, L. D. Carr, Y. Castin,
and C. Salomon, Formation of a matter-wave bright soliton., Science (New York, N.Y.)
296, 1290 (2002). 2
[22] K. E. Strecker, G. B. Partridge, A. G. Truscott, and R. G. Hulet, Formation and
propagation of matter-wave soliton trains., Nature 417, 150 (2002). 2
[23] M. Greiner, O. Mandel, T. Esslinger, T. W. Hansch, and I. Bloch, Quantum phase
transition from a superfluid to a Mott insulator in a gas of ultracold atoms., Nature
415, 39 (2002). 2
[24] J. Weiner and P. S. Julienne, Experiments and theory in cold and ultracold collisions,
Reviews of Modern Physics 71, 1 (1999). 2
[25] H. Feshbach, Unified theory of nuclear reactions, Annals of Physics 5, 357 (1958). 2
[26] U. Fano, Effects of Configuration Interaction on Intensities and Phase Shifts, Physical
Review 124, 1866 (1961). 2
[27] S. Inouye, M. R. Andrews, J. Stenger, H.-J. Miesner, D. M. Stamper-Kurn, and W. Ket-
terle, Observation of Feshbach resonances in a Bose-Einstein condensate, Nature 392,
151 (1998). 2, 31
[28] E. Tiesinga, B. J. Verhaar, and H. T. C. Stoof, Threshold and resonance phenomena
in ultracold ground-state collisions, Physical Review A 47, 4114 (1993). 2
[29] I. Bloch, J. Dalibard, and W. Zwerger, Many-body physics with ultracold gases, Rev.
Mod. Phys. 80, 885 (2008). 2
[30] S. Giorgini and S. Stringari, Theory of ultracold atomic Fermi gases, Reviews of Modern
Physics 80, 1215 (2008). 2
168

Bibliography
[31] L. Radzihovsky and D. E. Sheehy, Imbalanced Feshbach-resonant Fermi gases, Reports
on Progress in Physics 73, 076501 (2010). 2
[32] F. Chevy and C. Mora, Ultra-cold polarized Fermi gases, Reports on Progress in Physics
73, 112401 (2010). 2
[33] P. D. Lett, R. N. Watts, C. I. Westbrook, W. D. Phillips, P. L. Gould, and H. J. Metcalf,
Observation of Atoms Laser Cooled below the Doppler Limit , Phys. Rev. Lett. 61, 169
(1988). 2
[34] J. Stenger, S. Inouye, A. Chikkatur, D. Stamper-Kurn, D. Pritchard, and W. Ketterle,
Bragg Spectroscopy of a Bose-Einstein Condensate, Physical Review Letters 82, 4569
(1999). 2
[35] S. Gupta, Z. Hadzibabic, M. W. Zwierlein, C. A. Stan, K. Dieckmann, C. H. Schunck,
E. G. M. Van Kempen, B. J. Verhaar, and W. Ketterle, Radio-frequency spectroscopy
of ultracold fermions., Science (New York, N.Y.) 300, 1723 (2003). 2
[36] Y. Shin, M. Saba, T. Pasquini, W. Ketterle, D. Pritchard, and A. Leanhardt, Atom
Interferometry with Bose-Einstein Condensates in a Double-Well Potential , Physical
Review Letters 92, 050405 (2004). 2
[37] M. Yasuda and F. Shimizu, Observation of Two-Atom Correlation of an Ultracold Neon
Atomic Beam, Physical Review Letters 77, 3090 (1996). 2
[38] E. Burt, R. Ghrist, C. Myatt, M. Holland, E. Cornell, and C. Wieman, Coherence,
Correlations, and Collisions: What One Learns about Bose-Einstein Condensates from
Their Decay , Physical Review Letters 79, 337 (1997). 2
[39] B. Tolra, K. O’Hara, J. Huckans, W. Phillips, S. Rolston, and J. Porto, Observation of
Reduced Three-Body Recombination in a Correlated 1D Degenerate Bose Gas, Physical
Review Letters 92, 190401 (2004). 2
[40] S. Folling, F. Gerbier, A. Widera, O. Mandel, T. Gericke, and I. Bloch, Spatial quantum
noise interferometry in expanding ultracold atom clouds., Nature 434, 481 (2005). 2
[41] W. S. Bakr, J. I. Gillen, A. Peng, S. Folling, and M. Greiner, A quantum gas microscope
for detecting single atoms in a Hubbard-regime optical lattice., Nature 462, 74 (2009).
2
[42] W. S. Bakr, A. Peng, M. E. Tai, R. Ma, J. Simon, J. I. Gillen, S. Folling, L. Pollet,
and M. Greiner, Probing the superfluid-to-Mott insulator transition at the single-atom
level., Science 329, 547 (2010). 2
[43] J. F. Sherson, C. Weitenberg, M. Endres, M. Cheneau, I. Bloch, and S. Kuhr, Single-
atom-resolved fluorescence imaging of an atomic Mott insulator., Nature 467, 68 (2010).
2
[44] A. G. Truscott, K. E. Strecker, W. I. McAlexander, G. B. Partridge, and R. G. Hulet,
Observation of Fermi pressure in a gas of trapped atoms., Science (New York, N.Y.)
291, 2570 (2001). 3
169

Bibliography
[45] F. Schreck, L. Khaykovich, K. L. Corwin, G. Ferrari, T. Bourdel, J. Cubizolles, and
C. Salomon, Quasipure Bose-Einstein Condensate Immersed in a Fermi Sea, Physical
Review Letters 87, 080403 (2001). 3
[46] J. McNamara, T. Jeltes, A. Tychkov, W. Hogervorst, and W. Vassen, Degenerate Bose-
Fermi Mixture of Metastable Atoms, Physical Review Letters 97, 080404 (2006). 3
[47] B. J. DeSalvo, M. Yan, P. G. Mickelson, Y. N. Martinez de Escobar, and T. C. Killian,
Degenerate Fermi Gas of 87Sr , Physical Review Letters 105, 030402 (2010). 3
[48] M. K. Tey, S. Stellmer, R. Grimm, and F. Schreck, Double-degenerate Bose-Fermi
mixture of strontium, Physical Review A 82, 011608 (2010). 3
[49] T. Fukuhara, Y. Takasu, M. Kumakura, and Y. Takahashi, Degenerate Fermi Gases of
Ytterbium, Physical Review Letters 98, 030401 (2007). 3
[50] M. Lu, N. Q. Burdick, and B. L. Lev, Quantum Degenerate Dipolar Fermi Gas, Physical
Review Letters 108, 215301 (2012). 3
[51] K. Aikawa, A. Frisch, M. Mark, S. Baier, R. Grimm, and F. Ferlaino, Reaching Fermi
Degeneracy via Universal Dipolar Scattering , Physical Review Letters 112, 010404
(2014). 3
[52] Z. Hadzibabic, S. Gupta, C. Stan, C. Schunck, M. Zwierlein, K. Dieckmann, and
W. Ketterle, Fiftyfold Improvement in the Number of Quantum Degenerate Fermionic
Atoms, Physical Review Letters 91, 160401 (2003). 3
[53] S. Nascimbene, N. Navon, K. J. Jiang, F. Chevy, and C. Salomon, Exploring the ther-
modynamics of a universal Fermi gas., Nature 463, 1057 (2010). 3, 4
[54] M. Inguscio, W. Ketterle, and C. Salomon (eds.), Proceedings of the International School
of Physics Enrico Fermi on Ultracold Fermi gases, Course CLXIV, Varenna,, Societa
Italiana di Fisica (2006). 3
[55] E. Timmermans, Degenerate Fermion Gas Heating by Hole Creation, Physical Review
Letters 87, 240403 (2001). 3
[56] L. Carr, T. Bourdel, and Y. Castin, Limits of sympathetic cooling of fermions by zero-
temperature bosons due to particle losses, Physical Review A 69, 033603 (2004). 3
[57] S. Granade, M. Gehm, K. O’Hara, and J. Thomas, All-Optical Production of a Degen-
erate Fermi Gas, Physical Review Letters 88, 120405 (2002). 3
[58] S. Jochim, M. Bartenstein, A. Altmeyer, G. Hendl, C. Chin, J. H. Denschlag, and
R. Grimm, Pure Gas of Optically Trapped Molecules Created from Fermionic Atoms,
Physical Review Letters 91, 240402 (2003). 3
[59] C. Silber, S. Gunther, C. Marzok, B. Deh, P. Courteille, and C. Zimmermann,
Quantum-Degenerate Mixture of Fermionic Lithium and Bosonic Rubidium Gases,
Physical Review Letters 95, 170408 (2005). 3
[60] M. Taglieber, A.-C. Voigt, T. Aoki, T. Hansch, and K. Dieckmann, Quantum Degen-
erate Two-Species Fermi-Fermi Mixture Coexisting with a Bose-Einstein Condensate,
Physical Review Letters 100, 010401 (2008). 3, 5
170

Bibliography
[61] C.-H. Wu, I. Santiago, J. W. Park, P. Ahmadi, and M.W. Zwierlein, Strongly interacting
isotopic Bose-Fermi mixture immersed in a Fermi sea, Physical Review A 84, 011601
(2011). 3, 5
[62] G. Roati, F. Riboli, G. Modugno, and M. Inguscio, Fermi-Bose Quantum Degener-
ate 40K-87Rb Mixture with Attractive Interaction, Physical Review Letters 89, 150403
(2002). 3
[63] S. Inouye, J. Goldwin, M. Olsen, C. Ticknor, J. Bohn, and D. Jin, Observation of
Heteronuclear Feshbach Resonances in a Mixture of Bosons and Fermions, Physical
Review Letters 93, 183201 (2004). 3
[64] M. Kohl, H. Moritz, T. Stoferle, K. Gunter, and T. Esslinger, Fermionic Atoms in a
Three Dimensional Optical Lattice: Observing Fermi Surfaces, Dynamics, and Interac-
tions, Physical Review Letters 94, 080403 (2005). 3
[65] T. Rom, T. Best, D. van Oosten, U. Schneider, S. Folling, B. Paredes, and I. Bloch,
Free fermion antibunching in a degenerate atomic Fermi gas released from an optical
lattice., Nature 444, 733 (2006). 3
[66] C. Ospelkaus, S. Ospelkaus, L. Humbert, P. Ernst, K. Sengstock, and K. Bongs, Ul-
tracold Heteronuclear Molecules in a 3D Optical Lattice, Physical Review Letters 97,
120402 (2006). 3
[67] T. Tiecke, Feshbach resonances in ultracold mixtures of the fermionic quantum gases6Li and 40K , Ph.D. thesis, Universiteit van Amsterdam (2009). 3, 5, 30
[68] F. M. Spiegelhalder, A. Trenkwalder, D. Naik, G. Kerner, E. Wille, G. Hendl,
F. Schreck, and R. Grimm, All-optical production of a degenerate mixture of 6Li and40K and creation of heteronuclear molecules, Physical Review A 81, 043637 (2010). 3,
5
[69] B. DeMarco, S. Papp, and D. Jin, Pauli Blocking of Collisions in a Quantum Degenerate
Atomic Fermi Gas, Physical Review Letters 86, 5409 (2001). 3
[70] T. Loftus, C. Regal, C. Ticknor, J. Bohn, and D. Jin, Resonant Control of Elastic
Collisions in an Optically Trapped Fermi Gas of Atoms, Physical Review Letters 88,
173201 (2002). 4
[71] C. A. Regal and D. S. Jin, Measurement of Positive and Negative Scattering Lengths
in a Fermi Gas of Atoms, Physical Review Letters 90, 230404 (2003). 4
[72] C. A. Regal, C. Ticknor, J. L. Bohn, and D. S. Jin, Tuning p-Wave Interactions in an
Ultracold Fermi Gas of Atoms, Physical Review Letters 90, 053201 (2003). 4
[73] K. Dieckmann, C. A. Stan, S. Gupta, Z. Hadzibabic, C. H. Schunck, and W. Ketterle,
Decay of an Ultracold Fermionic Lithium Gas near a Feshbach Resonance, Physical
Review Letters 89, 203201 (2002). 4
[74] K. M. O’Hara, S. L. Hemmer, S. R. Granade, M. E. Gehm, and J. E. Thomas, Measure-
ment of the zero crossing in a Feshbach resonance of fermionic 6Li , Physical Review A
66, 041401 (2002). 4
171

Bibliography
[75] S. Jochim, M. Bartenstein, G. Hendl, J. Denschlag, R. Grimm, A. Mosk, and M. Wei-
demuller, Magnetic Field Control of Elastic Scattering in a Cold Gas of Fermionic
Lithium Atoms, Physical Review Letters 89, 273202 (2002). 4
[76] D. S. Petrov, C. Salomon, and G. V. Shlyapnikov, Weakly Bound Dimers of Fermionic
Atoms, Physical Review Letters 93, 090404 (2004). 4
[77] M. Zwierlein, C. Stan, C. Schunck, S. Raupach, S. Gupta, Z. Hadzibabic, and W. Ket-
terle, Observation of Bose-Einstein Condensation of Molecules, Physical Review Letters
91, 250401 (2003). 4
[78] S. Jochim, M. Bartenstein, A. Altmeyer, G. Hendl, S. Riedl, C. Chin, J. Hecker Den-
schlag, and R. Grimm, Bose-Einstein condensation of molecules., Science (New York,
N.Y.) 302, 2101 (2003). 4
[79] M. Greiner, C. A. Regal, and D. S. Jin, Emergence of a molecular Bose-Einstein con-
densate from a Fermi gas., Nature 426, 537 (2003). 4
[80] M. Zwierlein, C. Stan, C. Schunck, S. Raupach, A. Kerman, and W. Ketterle, Con-
densation of Pairs of Fermionic Atoms near a Feshbach Resonance, Physical Review
Letters 92, 120403 (2004). 4
[81] C. A. Regal, M. Greiner, and D. S. Jin, Observation of Resonance Condensation of
Fermionic Atom Pairs, Physical Review Letters 92, 040403 (2004). 4
[82] M. Bartenstein, A. Altmeyer, S. Riedl, S. Jochim, C. Chin, J. Denschlag, and R. Grimm,
Crossover from a Molecular Bose-Einstein Condensate to a Degenerate Fermi Gas,
Physical Review Letters 92, 120401 (2004). 4
[83] J. Bardeen, L. N. Cooper, and J. R. Schrieffer, Theory of Superconductivity , Physical
Review 108, 1175 (1957). 4
[84] T. Bourdel, L. Khaykovich, J. Cubizolles, J. Zhang, F. Chevy, M. Teichmann, L. Tar-
ruell, S. Kokkelmans, and C. Salomon, Experimental Study of the BEC-BCS Crossover
Region in Lithium 6 , Physical Review Letters 93, 050401 (2004). 4
[85] M. W. Zwierlein, J. R. Abo-Shaeer, A. Schirotzek, C. H. Schunck, and W. Ketterle,
Vortices and superfluidity in a strongly interacting Fermi gas., Nature 435, 1047 (2005).
4
[86] M. W. Zwierlein, A. Schirotzek, C. H. Schunck, and W. Ketterle, Fermionic super-
fluidity with imbalanced spin populations., Science (New York, N.Y.) 311, 492 (2006).
4
[87] G. B. Partridge, W. Li, R. I. Kamar, Y.-A. Liao, and R. G. Hulet, Pairing and phase
separation in a polarized Fermi gas., Science (New York, N.Y.) 311, 503 (2006). 4
[88] J. Joseph, B. Clancy, L. Luo, J. Kinast, A. Turlapov, and J. Thomas, Measurement of
Sound Velocity in a Fermi Gas near a Feshbach Resonance, Physical Review Letters
98, 170401 (2007). 4
172

Bibliography
[89] D. Miller, J. Chin, C. Stan, Y. Liu, W. Setiawan, C. Sanner, and W. Ketterle, Critical
Velocity for Superfluid Flow across the BEC-BCS Crossover , Physical Review Letters
99, 070402 (2007). 4
[90] U. Schneider, L. Hackermuller, S. Will, T. Best, I. Bloch, T. A. Costi, R. W. Helmes,
D. Rasch, and A. Rosch, Metallic and insulating phases of repulsively interacting
fermions in a 3D optical lattice., Science (New York, N.Y.) 322, 1520 (2008). 4
[91] R. Jordens, N. Strohmaier, K. Gunter, H. Moritz, and T. Esslinger, A Mott insulator
of fermionic atoms in an optical lattice., Nature 455, 204 (2008). 4
[92] N. Navon, S. Nascimbene, F. Chevy, and C. Salomon, The equation of state of a low-
temperature Fermi gas with tunable interactions., Science (New York, N.Y.) 328, 729
(2010). 4
[93] M. Horikoshi, S. Nakajima, M. Ueda, and T. Mukaiyama, Measurement of universal
thermodynamic functions for a unitary Fermi gas., Science (New York, N.Y.) 327, 442
(2010). 4
[94] W. Ketterle and M. Zwierlein, Making, probing and understanding ultracold Fermi
gases, Proc. of the Int. School of Phys. Enrico Fermi CLXIV, 247 (2008). 4, 68, 70
[95] M. J. H. Ku, A. T. Sommer, L. W. Cheuk, and M. W. Zwierlein, Revealing the superfluid
lambda transition in the universal thermodynamics of a unitary Fermi gas., Science 335,
563 (2012). 4, 70
[96] Q. Chen, J. Stajic, S. Tan, and K. Levin, BCS–BEC crossover: From high temperature
superconductors to ultracold superfluids, Physics Reports 412, 1 (2005). 4
[97] Y. Nishida and S. Tan, Universal Fermi Gases in Mixed Dimensions, Phys. Rev. Lett.
101, 170401 (2008). 4
[98] R. Onofrio and C. Presilla, Ultracold Atomic Fermi–Bose Mixtures in Bichromatic Op-
tical Dipole Traps: A Novel Route to Study Fermion Superfluidity , Journal of Statistical
Physics 115, 57 (2004). 4
[99] A. D. Lercher, T. Takekoshi, M. Debatin, B. Schuster, R. Rameshan, F. Ferlaino,
R. Grimm, and H. C. Nagerl, Production of a dual-species Bose-Einstein condensate of
Rb and Cs atoms, The European Physical Journal D 65, 3 (2011). 4
[100] M. Olshanii, Atomic Scattering in the Presence of an External Confinement and a Gas
of Impenetrable Bosons, Physical Review Letters 81, 938 (1998). 4, 163
[101] T. Bergeman, M. Moore, and M. Olshanii, Atom-Atom Scattering under Cylindrical
Harmonic Confinement: Numerical and Analytic Studies of the Confinement Induced
Resonance, Physical Review Letters 91, 163201 (2003). 4, 163
[102] H. Moritz, T. Stoferle, K. Gunter, M. Kohl, and T. Esslinger, Confinement Induced
Molecules in a 1D Fermi Gas, Physical Review Letters 94, 210401 (2005). 4, 163
[103] E. Haller, M. J. Mark, R. Hart, J. G. Danzl, L. Reichsollner, V. Melezhik, P. Schmelcher,
and H.-C. Nagerl, Confinement-Induced Resonances in Low-Dimensional Quantum Sys-
tems, Physical Review Letters 104, 153203 (2010). 4, 163
173

Bibliography
[104] G. Lamporesi, J. Catani, G. Barontini, Y. Nishida, M. Inguscio, and F. Minardi, Scat-
tering in Mixed Dimensions with Ultracold Gases, Physical Review Letters 104, 153202
(2010). 4, 163
[105] Y. Nishida and S. Tan, Confinement-induced Efimov resonances in Fermi-Fermi mix-
tures, Physical Review A 79, 060701 (2009). 4, 163
[106] J. Levinsen, T. Tiecke, J. Walraven, and D. Petrov, Atom-Dimer Scattering and Long-
Lived Trimers in Fermionic Mixtures, Physical Review Letters 103, 153202 (2009). 4,
5, 163
[107] P. Anderson, Localized Magnetic States in Metals, Physical Review 124, 41 (1961). 4
[108] J. Kondo, Resistance Minimum in Dilute Magnetic Alloys, Progress of Theoretical
Physics 32, 37 (1964). 4
[109] J. Bauer, C. Salomon, and E. Demler, Realizing a Kondo-Correlated State with Ultracold
Atoms, Physical Review Letters 111, 215304 (2013). 4
[110] U. Gavish and Y. Castin, Matter-Wave Localization in Disordered Cold Atom Lattices,
Phys. Rev. Lett. 95, 20401 (2005). 4
[111] G. Roati, C. D’Errico, L. Fallani, M. Fattori, C. Fort, M. Zaccanti, G. Modugno,
M. Modugno, and M. Inguscio, Anderson localization of a non-interacting Bose-Einstein
condensate., Nature 453, 895 (2008). 4
[112] J. Billy, V. Josse, Z. Zuo, A. Bernard, B. Hambrecht, P. Lugan, D. Clement, L. Sanchez-
Palencia, P. Bouyer, and A. Aspect, Direct observation of Anderson localization of
matter waves in a controlled disorder., Nature 453, 891 (2008). 4
[113] Y. Nishida, Phases of a bilayer Fermi gas, Physical Review A 82, 011605 (2010). 4,
163
[114] M. Iskin and C. de Melo, Superfluid and Insulating Phases of Fermion Mixtures in
Optical Lattices, Physical Review Letters 99, 080403 (2007). 5
[115] P. Fulde and R. A. Ferrell, Superconductivity in a Strong Spin-Exchange Field , Phys.
Rev. 135, A550 (1964). 5
[116] A. I. Larkin and Y. N. Ovchinnikov, Inhomogeneous state of superconductors, Sov.
Phys. JETP 20 (1965). 5
[117] M. Dalmonte, K. Dieckmann, T. Roscilde, C. Hartl, A. E. Feiguin, U. Schollwock, and
F. Heidrich-Meisner, Dimer, trimer, and Fulde-Ferrell-Larkin-Ovchinnikov liquids in
mass- and spin-imbalanced trapped binary mixtures in one dimension, Physical Review
A 85, 063608 (2012). 5
[118] W. V. Liu and F. Wilczek, Interior Gap Superfluidity , Physical Review Letters 90,
047002 (2003). 5
[119] M. M. Forbes, E. Gubankova, W. V. Liu, and F. Wilczek, Stability Criteria for
Breached-Pair Superfluidity , Phys. Rev. Lett. 94, 17001 (2005). 5
174

Bibliography
[120] D. S. Petrov, G. E. Astrakharchik, D. J. Papoular, C. Salomon, and G. V. Shlyapnikov,
Crystalline Phase of Strongly Interacting Fermi Mixtures, Phys. Rev. Lett. 99, 130407
(2007). 5
[121] J. Deiglmayr, A. Grochola, M. Repp, K. Mortlbauer, C. Gluck, J. Lange, O. Dulieu,
R. Wester, and M. Weidemuller, Formation of Ultracold Polar Molecules in the Rovi-
brational Ground State, Phys. Rev. Lett. 101, 133004 (2008). 5
[122] K.-K. Ni, S. Ospelkaus, M. H. G. de Miranda, A. Pe’er, B. Neyenhuis, J. J. Zirbel,
S. Kotochigova, P. S. Julienne, D. S. Jin, and J. Ye, A High Phase-Space-Density Gas
of Polar Molecules, Science 322, 231 (2008). 5
[123] L. Pollet, M. Troyer, K. Van Houcke, and S. Rombouts, Phase Diagram of Bose-Fermi
Mixtures in One-Dimensional Optical Lattices, Physical Review Letters 96, 190402
(2006). 5
[124] A. Zujev, A. Baldwin, R. Scalettar, V. Rousseau, P. Denteneer, and M. Rigol, Superfluid
and Mott-insulator phases of one-dimensional Bose-Fermi mixtures, Physical Review
A 78, 033619 (2008). 5
[125] I. Ferrier-Barbut, M. Delehaye, S. Laurent, A. T. Grier, M. Pierce, B. S. Rem, F. Chevy,
and C. Salomon, A mixture of Bose and Fermi superfluids, Science 345, 1035 (2014).
5
[126] M. Taglieber, A.-C. Voigt, F. Henkel, S. Fray, T. Hansch, and K. Dieckmann, Simulta-
neous magneto-optical trapping of three atomic species, Physical Review A 73, 011402
(2006). 5
[127] A. Ridinger, S. Chaudhuri, T. Salez, U. Eismann, D. R. Fernandes, K. Magalhaes,
D. Wilkowski, C. Salomon, and F. Chevy, Large atom number dual-species magneto-
optical trap for fermionic 6Li and 40K atoms, The European Physical Journal D 65,
223 (2011). 5, 11, 24
[128] E. Wille, F. Spiegelhalder, G. Kerner, D. Naik, A. Trenkwalder, G. Hendl, F. Schreck,
R. Grimm, T. Tiecke, J. Walraven, S. Kokkelmans, E. Tiesinga, and P. Julienne, Ex-
ploring an Ultracold Fermi-Fermi Mixture: Interspecies Feshbach Resonances and Scat-
tering Properties of 6Li and 40K , Physical Review Letters 100, 053201 (2008). 5
[129] E. Tiemann, H. Knockel, P. Kowalczyk, W. Jastrzebski, A. Pashov, H. Salami, and
A. Ross, Coupled system a Σ3+ and X Σ1+ of KLi: Feshbach resonances and correc-
tions to the Born-Oppenheimer approximation, Physical Review A 79, 042716 (2009).
5, 30
[130] T. G. Tiecke, M. R. Goosen, J. T. M. Walraven, and S. J. J. M. F. Kokkelmans,
Asymptotic-bound-state model for Feshbach resonances, Physical Review A 82, 042712
(2010). 5
[131] T. G. Tiecke, M. R. Goosen, A. Ludewig, S. D. Gensemer, S. Kraft, S. J. J. M. F.
Kokkelmans, and J. T. M. Walraven, Broad Feshbach resonance in the 6Li-40K mixture,
Physical Review Letters 104, 053202 (2010). 5
175

Bibliography
[132] D. Naik, A. Trenkwalder, C. Kohstall, F. M. Spiegelhalder, M. Zaccanti, G. Hendl,
F. Schreck, R. Grimm, T. M. Hanna, and P. S. Julienne, Feshbach resonances in the 6Li-40K Fermi-Fermi mixture: elastic versus inelastic interactions, The European Physical
Journal D 65, 55 (2011). 5
[133] A.-C. Voigt, M. Taglieber, L. Costa, T. Aoki, W. Wieser, T. W. Hansch, and K. Dieck-
mann, Ultracold Heteronuclear Fermi-Fermi Molecules, Physical Review Letters 102,
020405 (2009). 5
[134] A. Trenkwalder, C. Kohstall, M. Zaccanti, D. Naik, A. I. Sidorov, F. Schreck, and
R. Grimm, Hydrodynamic Expansion of a Strongly Interacting Fermi-Fermi Mixture,
Physical Review Letters 106, 115304 (2011). 5
[135] C. Kohstall, M. Zaccanti, M. Jag, A. Trenkwalder, P. Massignan, G. M. Bruun,
F. Schreck, and R. Grimm, Metastability and coherence of repulsive polarons in a
strongly interacting Fermi mixture., Nature 485, 615 (2012). 5
[136] M. Jag, M. Zaccanti, M. Cetina, R. S. Lous, F. Schreck, R. Grimm, D. S. Petrov, and
J. Levinsen, Observation of a Strong Atom-Dimer Attraction in a Mass-Imbalanced
Fermi-Fermi Mixture, Physical Review Letters 112, 075302 (2014). 5
[137] K. M. O’Hara, S. L. Hemmer, M. E. Gehm, S. R. Granade, and J. E. Thomas, Ob-
servation of a strongly interacting degenerate Fermi gas of atoms., Science (New York,
N.Y.) 298, 2179 (2002). 5
[138] J. T. Stewart, J. P. Gaebler, C. A. Regal, and D. S. Jin, Potential energy of a 40K
Fermi gas in the BCS-BEC crossover , Physical Review Letters 97, 220406 (2006). 5
[139] D. R. Fernandes, F. Sievers, N. Kretzschmar, S. Wu, C. Salomon, and F. Chevy, Sub-
Doppler laser cooling of fermionic 40K atoms in three-dimensional gray optical molasses,
EPL (Europhysics Letters) 100, 63001 (2012). 6, 41
[140] F. Sievers, N. Kretzschmar, D. R. Fernandes, D. Suchet, M. Rabinovic, S. Wu, C. V.
Parker, L. Khaykovich, C. Salomon, and F. Chevy, Simultaneous sub-Doppler laser
cooling of fermionic 6Li and 40K on the D1 line: Theory and experiment , Phys. Rev.
A 91, 023426 (2015). 6, 41, 78
[141] A. Ridinger, Towards quantum degenerate Fermi mixtures : Photoassociation of weakly
bound 6Li-40K molecules, Ph.D. thesis, Universite Pierre et Marie Curie - Paris VI
(2011). 11, 12, 15, 16, 18, 19, 21, 22
[142] T. Salez, Towards quantum degenerate atomic Fermi mixtures, Ph.D. thesis, Universite
Pierre et Marie Curie - Paris VI (2011). 11
[143] K. L. Moore, T. P. Purdy, K. W. Murch, S. Leslie, S. Gupta, and D. M. Stamper-Kurn,
Collimated, single-pass atom source from a pulsed alkali metal dispenser for laser-cooling
experiments, Review of Scientific Instruments 76, 023106 (2005). 11
[144] A. Gozzini, F. Mango, J. H. Xu, G. Alzetta, F. Maccarrone, and R. A. Bernheim,
Light-induced ejection of alkali atoms in polysiloxane coated cells, Il Nuovo Cimento D
15, 709 (1993). 11
176

Bibliography
[145] C. Klempt, T. van Zoest, T. Henninger, O. Topic, E. Rasel, W. Ertmer, and J. Arlt,
Ultraviolet light-induced atom desorption for large rubidium and potassium magneto-
optical traps, Physical Review A 73, 013410 (2006). 11
[146] M. Greiner, I. Bloch, T. W. Hansch, and T. Esslinger, Magnetic transport of trapped
cold atoms over a large distance, Phys. Rev. A 63, 31401 (2001). 12, 28
[147] G. Ferrari, M.-O. Mewes, F. Schreck, and C. Salomon, High-power multiple-frequency
narrow-linewidth laser source based on a semiconductor tapered amplifier , Optics Let-
ters 24, 151 (1999). 16
[148] F. Sievers, Ultracold Fermi mixtures and simultaneous sub-Doppler laser cooling of
fermionic 6Li and 40K , Ph.d. thesis, Universite Pierre et Marie Curie - Paris VI (2014).
17, 18, 27, 29, 33, 37, 126
[149] W. Phillips and H. Metcalf, Laser Deceleration of an Atomic Beam, Physical Review
Letters 48, 596 (1982). 18
[150] H. J. Metcalf and P. van der Straten, Laser cooling and trapping of atoms, Journal of
the Optical Society of America B 20, 887 (2003). 18, 24
[151] K. Dieckmann, R. Spreeuw, M. Weidemuller, and J. Walraven, Two-dimensional
magneto-optical trap as a source of slow atoms, Physical Review A 58, 3891 (1998). 19
[152] J. Schoser, A. Batar, R. Low, V. Schweikhard, A. Grabowski, Y. Ovchinnikov, and
T. Pfau, Intense source of cold Rb atoms from a pure two-dimensional magneto-optical
trap, Physical Review A 66, 023410 (2002). 19
[153] S. Chaudhuri, S. Roy, and C. Unnikrishnan, Realization of an intense cold Rb atomic
beam based on a two-dimensional magneto-optical trap: Experiments and comparison
with simulations, Physical Review A 74, 023406 (2006). 19
[154] J. Catani, P. Maioli, L. De Sarlo, F. Minardi, and M. Inguscio, Intense slow beams of
bosonic potassium isotopes, Physical Review A 73, 033415 (2006). 19
[155] N. Castagna, J. Guena, M. D. Plimmer, and P. Thomann, A novel simplified two-
dimensional magneto-optical trap as an intense source of slow cesium atoms, The Eu-
ropean Physical Journal Applied Physics 34, 21 (2006). 19
[156] T. Tiecke, S. Gensemer, A. Ludewig, and J. Walraven, High-flux two-dimensional
magneto-optical-trap source for cold lithium atoms, Physical Review A 80, 013409
(2009). 19
[157] B. DeMarco, J. Bohn, J. Burke, M. Holland, and D. Jin, Measurement of p-Wave
Threshold Law Using Evaporatively Cooled Fermionic Atoms, Physical Review Letters
82, 4208 (1999). 30, 67
[158] F. Schreck, Mixtures of ultracold gases: Fermi sea and Bose-Einstein condensate of
Lithium isotopes, Ph.D. thesis, Universite Pierre et Marie Curie - Paris VI (2002). 30
[159] S. Falke, H. Knockel, J. Friebe, M. Riedmann, E. Tiemann, and C. Lisdat, Potassium
ground-state scattering parameters and Born-Oppenheimer potentials from molecular
spectroscopy , Physical Review A 78, 012503 (2008). 30
177

Bibliography
[160] B. DeMarco, Quantum behavior of an atomic Fermi gas, Ph.D. thesis, University of
Colorado (2001). 31, 70
[161] R. Grimm, M. Weidemuller, and Y. B. Ovchinnikov, Optical dipole traps for neutral
atoms 39 (1999). 31, 68
[162] A. Keshet, Cicero Word Generator Technical and User Manual (2008). 36
[163] M. Teichmann, Ultracold 6Li Atoms in the BEC-BCS Crossover: Experiments and the
Construction of a New Apparatus, Ph.D. thesis, Universite Pierre et Marie Curie - Paris
VI (2007). 38
[164] D. Boiron, A. Michaud, P. Lemonde, Y. Castin, C. Salomon, S. Weyers, K. Szymaniec,
L. Cognet, and A. Clairon, Laser cooling of cesium atoms in gray optical molasses down
to 1.1 µK , Physical Review A 53, R3734 (1996). 41
[165] G. Grynberg and J.-Y. Courtois, Proposal for a Magneto-Optical Lattice for Trapping
Atoms in Nearly-Dark States, EPL (Europhysics Letters) 27, 41 (1994). 41
[166] A. Burchianti, G. Valtolina, J. A. Seman, E. Pace, M. De Pas, M. Inguscio, M. Zaccanti,
and G. Roati, Efficient all-optical production of large 6Li quantum gases using D1 gray-
molasses cooling , Phys. Rev. A 90, 043408 (2014). 42, 162
[167] A. T. Grier, I. Ferrier-Barbut, B. S. Rem, M. Delehaye, L. Khaykovich, F. Chevy, and
C. Salomon, Λ-enhanced sub-Doppler cooling of lithium atoms in D1 gray molasses,
Physical Review A 87, 063411 (2013). 42, 162
[168] D. Nath, R. K. Easwaran, G. Rajalakshmi, and C. S. Unnikrishnan, Quantum-
interference-enhanced deep sub-Doppler cooling of 39K atoms in gray molasses, Physical
Review A 88, 053407 (2013). 42, 162
[169] G. Salomon, L. Fouche, P. Wang, A. Aspect, P. Bouyer, and T. Bourdel, Gray-molasses
cooling of 39K to a high phase-space density , EPL (Europhysics Letters) 104, 63002
(2013). 42, 43, 162
[170] G. Salomon, L. Fouche, S. Lepoutre, A. Aspect, and T. Bourdel, All-optical cooling of39K to Bose-Einstein condensation, Phys. Rev. A 90, 033405 (2014). 42, 162
[171] E. Haller, J. Hudson, A. Kelly, D. A. Cotta, B. Peaudecerf, G. D. Bruce, and S. Kuhr,
Single-atom imaging of fermions in a quantum-gas microscope, ArXiv e-prints (2015).
42, 162
[172] J. Walraven and T. Hijmans, Atomic hydrogen in magnetostatic traps, Physica B: Con-
densed Matter 197, 417 (1994). 65
[173] W. Ketterle and N. J. V. Druten, Evaporative Cooling of Trapped Atoms, Advances in
Atomic, Molecular and Optical Physics 37, 181 (1996). 65
[174] H. Hess, Evaporative cooling of magnetically trapped and compressed spin-polarized hy-
drogen, Physical Review B 34, 3476 (1986). 65
[175] O. Luiten, M. Reynolds, and J. Walraven, Kinetic theory of the evaporative cooling of
a trapped gas, Physical Review A 53, 381 (1996). 65
178

Bibliography
[176] Y.-J. Lin, A. Perry, R. Compton, I. Spielman, and J. Porto, Rapid production of 87Rb
Bose-Einstein condensates in a combined magnetic and optical potential , Physical Re-
view A 79, 063631 (2009). 67
[177] A. Ludewig, Feshbach Resonances in 40K., Ph.D. thesis, University of Amsterdam
(2012). 68
[178] C. A. Regal, M. Greiner, and D. S. Jin, Lifetime of Molecule-Atom Mixtures near a
Feshbach Resonance in 40K, Phys. Rev. Lett. 92, 083201 (2004). 68
[179] D. Rio Fernandes, Trapping and cooling of fermionic alkali atoms to quantum degen-
eracy. Sub-Doppler cooling of Potassium-40 and Lithium-6 in gray molasses, Theses,
Universite Pierre et Marie Curie (2014). 69, 70
[180] W. Gerlach and O. Stern, Das magnetische Moment des Silberatoms, Zeitschrift fur
Physik 9, 353 (1922). 69
[181] E. A. Hinds and I. G. Hughes, Magnetic atom optics: mirrors, guides, traps, and chips
for atoms, Journal of Physics D: Applied Physics 32, R119 (1999). 69
[182] F. Y. Hou, L. Yu, X. J. Jia, Y. H. Zheng, C. D. Xie, and K. C. Peng, Experimental gen-
eration of optical non-classical states of light with 1.34 µm wavelength, The European
Physical Journal D 62, 433 (2011). 75
[183] F. A. Camargo, T. Zanon-Willette, T. Badr, N. U. Wetter, and J.-J. Zondy, Tunable
Single-Frequency Nd:YVO4 BiB3O6 Ring Laser at 671 nm, Quantum Electronics, IEEE
Journal of 46, 804 (2010). 75, 135
[184] U. Eismann, F. Gerbier, C. Canalias, A. Zukauskas, G. Trenec, J. Vigue, F. Chevy, and
C. Salomon, An all-solid-state laser source at 671 nm for cold-atom experiments with
lithium, Applied Physics B 106, 25 (2011). 75, 83, 96, 98, 120, 130, 131, 132, 133, 134,
135, 136, 137, 138
[185] A. Miffre, M. Jacquey, M. Buchner, G. Trenec, and J. Vigue, Atom interferometry
measurement of the electric polarizability of lithium, The European Physical Journal D
- Atomic, Molecular, Optical and Plasma Physics 38, 353 (2006). 75
[186] H. Muller, S.-w. Chiow, Q. Long, S. Herrmann, and S. Chu, Atom Interferometry with
up to 24-Photon-Momentum-Transfer Beam Splitters, Phys. Rev. Lett. 100, 180405
(2008). 75
[187] I. E. Olivares, A. E. Duarte, E. A. Saravia, and F. J. Duarte, Lithium Isotope Separation
With Tunable Diode Lasers, Appl. Opt. 41, 2973 (2002). 75
[188] S. A. Payne, L. K. Smith, R. J. Beach, B. H. T. Chai, J. H. Tassano, L. D. DeLoach,
W. L. Kway, R. W. Solarz, and W. F. Krupke, Properties of Cr:LiSrAIF6 crystals for
laser operation, Appl. Opt. 33, 5526 (1994). 75
[189] L. Mcdonagh, 888 nm pumping of Nd:YVO4 for high-power TEM00 lasers, Ph.D. thesis,
Technische Universitat Kaiserslautern (2008). 79, 86
[190] H. Rast, H. Caspers, and S. Miller, Infrared Spectral Emittance and Optical Properties
of Yttrium Vanadate, Physical Review 169, 705 (1968). 80
179

Bibliography
[191] CASTECH, INC., Manufacturer’s website (2015). 81
[192] M. Bass, C. DeCusatis, J. Enoch, V. Lakshminarayanan, G. Li, C. MacDonald, V. Ma-
hajan, and E. Van Stryland, Handbook of Optics, Third Edition Volume IV: Opti-
cal Properties of Materials, Nonlinear Optics, Quantum Optics, Handbook of Optics,
McGraw-Hill Education (2009). 81
[193] L. McDonagh, R. Wallenstein, R. Knappe, and A. Nebel, High-efficiency 60 W TEM00
Nd:YVO4 oscillator pumped at 888 nm, Opt. Lett. 31, 3297 (2006). 81, 83, 84, 85, 130
[194] A. W. Tucker, M. Birnbaum, C. L. Fincher, and J. W. Erler, Stimulated-emission cross
section at 1064 and 1342 nm in Nd:YVO4 (1977). 81
[195] J. Doualan, P. Camy, and R. Moncorge, Measurement of the stimulated emission cross
section minus excited state absorption cross-section of Nd:YVO4 crystal (2008), private
communication. 81, 83, 104, 105
[196] M. Okida, M. Itoh, T. Yatagai, H. Ogilvy, J. Piper, and T. Omatsu, Heat generation
in Nd doped vanadate crystals with 1.34 mum laser action., Optics express 13, 4909
(2005). 81, 83, 92
[197] X. Peng, A. Asundi, Y. Chen, and Z. Xiong, Study of the mechanical properties of
Nd:YVO4 crystal by use of laser interferometry and finite-element analysis., Applied
optics 40, 1396 (2001). 81
[198] Y. F. Chen, Design Criteria for Concentration Optimization in Scaling Diode End-
Pumped Lasers to High Powers: Influence of Thermal Fracture, IEEE Journal of Quan-
tum Electronics 35, 234 (1999). 81, 91
[199] L. Fornasiero, S. Kuck, T. Jensen, G. Huber, and B. H. T. Chai, Excited state absorption
and stimulated emission of Nd3+ in crystals. Part 2: YVO4, GdVO4, and Sr5(PO4)3F ,
Applied Physics B-Lasers and Optics 67, 549 (1998). 81, 82
[200] A. E. Siegman, Lasers, University Science Books, Mill Valley, California (1986). 87, 88,
89, 102, 103
[201] B. E. A. Saleh and M. C. Teich, Fundamentals of photonics, Wiley, New York, NY
(1991). 88
[202] S. Chenais, F. Druon, S. Forget, F. Balembois, and P. Georges, On thermal effects in
solid-state lasers: The case of ytterbium-doped materials, Progress in Quantum Elec-
tronics 30, 89 (2006). 90
[203] F. Lenhardt, M. Nittmann, T. Bauer, J. Bartschke, and J. A. L’huillier, High-power
888-nm-pumped Nd:YVO4 1342-nm oscillator operating in the TEM00 mode, Applied
Physics B 96, 803 (2009). 90, 93, 132, 138, 139
[204] B. Neuenschwander, R. Weber, and H. Weber, Determination of the thermal lens in
solid-state lasers with stable cavities, IEEE Journal of Quantum Electronics 31 (1995).
93
[205] B. Ozygus and Q. Zhang, Thermal lens determination of end-pumped solid-state lasers
using primary degeneration modes, Applied Physics Letters 71, 2590 (1997). 93
180

Bibliography
[206] B. Ozygus and J. Erhard, Thermal lens determination of end-pumped solid-state lasers
with transverse beat frequencies, Applied Physics Letters 67, 1361 (1995). 93
[207] J. L. Blows, J. M. Dawes, and T. Omatsu, Thermal lensing measurements in line-focus
end-pumped neodymium yttrium aluminium garnet using holographic lateral shearing
interferometry , Journal of Applied Physics 83, 2901 (1998). 93
[208] D. Sumida, D. Rockwell, and M. Mangir, Energy storage and heating measurements in
flashlamp-pumped Cr:Nd:GSGG and Nd:YAG , Quantum Electronics, IEEE Journal of
24, 985 (1988). 93
[209] U. Eismann, A novel all-solid-state laser source for lithium atoms and three-body re-
combination in the unitary Bose gas, Ph.D. thesis, Universite Pierre et Marie Curie -
Paris VI (2012). 96, 98, 105, 123, 135
[210] U. Eismann, A. Bergschneider, F. Sievers, N. Kretzschmar, C. Salomon, and F. Chevy,
2.1-watts intracavity-frequency-doubled all-solid-state light source at 671 nm for laser
cooling of lithium, Opt. Express 21, 9091 (2013). 99, 109, 110, 129
[211] Y. Chen, T. Huang, C. Kao, C. Wang, and S. Wang, Optimization in scaling fiber-
coupled laser-diode end-pumped lasers to higher power: influence of thermal effect ,
IEEE Journal of Quantum Electronics 33, 1424 (1997). 100, 131
[212] V. Evtuhov and A. E. Siegman, A ”Twisted-Mode” Technique for Obtaining Axially
Uniform Energy Density in a Laser Cavity , Appl. Opt. 4, 142 (1965). 102
[213] F. Biraben, Efficacite des systemes unidirectionnels utilisables dans les lasers en an-
neau, Optics Communications 29, 353 (1979). 102
[214] D. Hutchings, F. Tooley, and D. Russell, Unidirectional operation of a ring laser using
an absorbing Fabry-Perot filter , Optics letters 12, 322 (1987). 102
[215] S. Dinev, I. Koprinkov, K. Stamenov, and K. Stankov, A narrowband unidirectional
pulsed ring dye laser , Optics Communications 35, 403 (1980). 102
[216] G. Trenec, W. Volondat, O. Cugat, and J. Vigue, Permanent magnets for Faraday
rotators inspired by the design of the magic sphere, Appl. Opt. 50, 4788 (2011). 102,
130
[217] R. Sarrouf, T. Badr, and J. J. Zondy, Intracavity second-harmonic generation of diode-
pumped continuous-wave, single-frequency 1.3µm Nd:YLiF4 lasers, Journal of Optics
A: Pure and Applied Optics 10, 104011 (2008). 102
[218] W. Leeb, Losses introduced by tilting intracavity etalons, Applied physics 6, 267 (1975).
104, 135
[219] Y. Chen, T. Huang, C. Wang, L. Lee, and S. Wang, Theoretical and experimental studies
of single-mode operation in diode pumped Nd: YVO4/KTP green laser: influence of
KTP length, Optics communications 152, 319 (1998). 106
[220] T. Toyoda and M. Yabe, The temperature dependence of the refractive indices of fused
silica and crystal quartz (2000). 106
181

Bibliography
[221] W. Haynes, CRC handbook of chemistry and physics, CRC Press. (2010). 106
[222] L. S. Rothman, I. E. Gordon, A. Barbe, D. Benner, P. F. Bernath, M. Birk, V. Boudon,
L. R. Brown, A. Campargue, J.-P. Champion, K. Chance, L. H. Coudert, V. Dana,
V. M. Devi, S. Fally, J.-M. Flaud, R. R. Gamache, A. Goldman, D. Jacquemart,
I. Kleiner, N. Lacome, W. J. Lafferty, J.-Y. Mandin, S. T. Massie, S. N. Mikhailenko,
C. E. Miller, N. Moazzen-Ahmadi, O. V. Naumenko, A. V. Nikitin, J. Orphal, V. I.
Perevalov, A. Perrin, A. Predoi-Cross, C. P. Rinsland, M. Rotger, M. Simeckova,
M. A. H. Smith, K. Sung, S. A. Tashkun, J. Tennyson, R. A. Toth, A. C. Vandaele,
and J. V. Auwera, The HITRAN 2008 molecular spectroscopic database, Journal of
Quantitative Spectroscopy and Radiative Transfer 110, 533 (2009). 110, 136
[223] R. W. Boyd, Nonlinear optics, Academic Press, 3rd editio edn. (2008). 116, 117, 118
[224] J. A. Armstrong, N. Bloembergen, J. Ducuing, and P. S. Pershan, Interactions between
Light Waves in a Nonlinear Dielectric, Phys. Rev. 127, 1918 (1962). 116, 118, 143
[225] D. A. Kleinman, A. Ashkin, and G. D. Boyd, Second-Harmonic Generation of Light by
Focused Laser Beams, Phys. Rev. 145, 338 (1966). 117
[226] G. D. Boyd and D. A. Kleinman, Parametric Interaction of Focused Gaussian Light
Beams, Journal of Applied Physics 39, 3597 (1968). 117, 133
[227] P. A. Franken and J. F. Ward, Optical harmonics and nonlinear phenomena, Reviews
of Modern Physics 35, 23 (1963). 118
[228] M. Yamada, N. Nada, M. Saitoh, and K. Watanabe, First-order quasi-phase matched
LiNbO3 waveguide periodically poled by applying an external field for efficient blue
second-harmonic generation, Applied Physics Letters 62, 435 (1993). 118
[229] L. E. Myers, R. C. Eckardt, M. M. Fejer, R. L. Byer, W. R. Bosenberg, and J. W. Pierce,
Quasi-phase-matched optical parametric oscillators in bulk periodically poled LiNbO3 ,
J. Opt. Soc. Am. B 12, 2102 (1995). 118
[230] M. Peltz, U. Bader, A. Borsutzky, R. Wallenstein, J. Hellstrom, H. Karlsson, V. Pa-
siskevicius, and F. Laurell, Optical parametric oscillators for high pulse energy and
high average power operation based on large aperture periodically poled KTP and RTA,
Applied Physics B 73, 663 (2001). 118, 119, 123, 124, 127, 134
[231] R. Schiek and T. Pertsch, Absolute measurement of the quadratic nonlinear susceptibility
of lithium niobate in waveguides, Opt. Mater. Express 2, 126 (2012). 119
[232] S. Emanueli and A. Arie, Temperature-Dependent Dispersion Equations for KTiOPO4
and KTiOAsO4, Appl. Opt. 42, 6661 (2003). 119, 121, 134, 135, 137
[233] K. Fradkin, A. Arie, A. Skliar, and G. Rosenman, Tunable midinfrared source by differ-
ence frequency generation in bulk periodically poled KTiOPO4, Applied Physics Letters
74, 914 (1999). 119, 121, 134, 135, 137
[234] D. H. Jundt, Temperature-dependent Sellmeier equation for the index of refraction, ne,
in congruent lithium niobate, Opt. Lett. 22, 1553 (1997). 119
182

Bibliography
[235] G. Hansson, H. Karlsson, S. Wang, and F. Laurell, Transmission Measurements in KTP
and Isomorphic Compounds, Appl. Opt. 39, 5058 (2000). 119
[236] J. Hirohashi, Characterization of domain switching and optical damage properties in
ferroelectrics, Ph.D. thesis, Department of Applied Physics, Royal Institute of Technol-
ogy, Stockholm, Sweden (2006). 119
[237] A. Arie, G. Rosenman, A. Korenfeld, A. Skliar, M. Oron, M. Katz, and D. Eger,
Efficient resonant frequency doubling of a cw Nd:YAG laser in bulk periodically poled
KTiOPO4 , Opt. Lett. 23, 28 (1998). 119
[238] Photonik-Zentrum Kaiserslautern (PZKL), Periodisch gepolte Materialien, Ph.D. thesis
(2010). 119
[239] J. D. Bierlein and H. Vanherzeele, Potassium titanyl phosphate: properties and new
applications, J. Opt. Soc. Am. B 6, 622 (1989). 119
[240] S. Manivannan, S. Dhanuskodi, S. Tiwari, and J. Philip, Laser induced surface damage,
thermal transport and microhardness studies on certain organic and semiorganic non-
linear optical crystals, Applied Physics B 90, 489 (2008), 10.1007/s00340-007-2911-4.
119
[241] S. V. Tovstonog, S. Kurimura, and K. Kitamura, High power continuous-wave green
light generation by quasiphase matching in Mg stoichiometric lithium tantalate, Applied
Physics Letters 90, 051115 (2007). 119
[242] Y. Furukawa, K. Kitamura, A. Alexandrovski, R. K. Route, M. M. Fejer, and G. Foulon,
Green-induced infrared absorption in MgO doped LiNbO3, Applied Physics Letters 78,
1970 (2001). 119, 143
[243] C. Canalias, S. Wang, V. Pasiskevicius, and F. Laurell, Nucleation and growth of pe-
riodic domains during electric field poling in flux-grown KTiOPO[sub 4] observed by
atomic force microscopy , Applied Physics Letters 88, 032905 (2006). 120
[244] E. Mimoun, L. D. Sarlo, J.-J. Zondy, J. Dalibard, and F. Gerbier, Sum-frequency gen-
eration of 589 nm light with near-unit efficiency , Opt. Express 16, 18684 (2008). 120
[245] V. A. Maslov, V. A. Mikhailov, O. P. Shaunin, and I. A. Shcherbakov, Nonlinear
absorption in KTP crystals, Quantum Electronics 27, 356 (1997). 123
[246] B. Boulanger, I. Rousseau, J. P. Feve, M. Maglione, B. Menaert, and G. Marnier, Optical
studies of laser-induced gray-tracking in KTP , IEEE Journal of Quantum Electronics
35, 281 (1999). 123
[247] G. C. Bjorklund, Frequency-modulation spectroscopy: a new method for measuring weak
absorptions and dispersions, Optics Letters 5, 15 (1980). 126
[248] I. Dolev, A. Ganany-Padowicz, O. Gayer, A. Arie, J. Mangin, and G. Gadret, Linear
and nonlinear optical properties of MgO:LiTaO3 , Applied Physics B 96, 423 (2009).
129
[249] P. Laporta and M. Brussard, Design criteria for mode size optimization in diode-pumped
solid-state lasers, IEEE Journal of Quantum Electronics 27, 2319 (1991). 131
183

Bibliography
[250] W. W. Rigrod, Gain Saturation and Output Power of Optical Masers, Journal of Ap-
plied Physics 34, 2602 (1963). 131
[251] E. Khazanov, N. Andreev, A. Mal’shakov, O. Palashov, A. Poteomkin, A. Sergeev,
A. Shaykin, V. Zelenogorsky, I. Ivanov, R. Amin, G. Mueller, D. Tanner, and D. Re-
itze, Compensation of thermally induced modal distortions in Faraday isolators, IEEE
Journal of Quantum Electronics 40, 1500 (2004). 132
[252] R. Polloni and O. Svelto, Optimum coupling for intracavity second harmonic generation,
IEEE Journal of Quantum Electronics 4, 528 (1968). 133
[253] R. Smith, Theory of intracavity optical second-harmonic generation, IEEE Journal of
Quantum Electronics 6, 215 (1970). 133
[254] J.-J. Zondy, F. A. Camargo, T. Zanon, V. Petrov, and N. U. Wetter, Observation of
strong cascaded Kerr-lens dynamics in an optimally-coupled cw intracavity frequency-
doubled Nd:YLF ring laser , Opt. Express 18, 4796 (2010). 133, 137
[255] K. I. Martin, W. A. Clarkson, and D. C. Hanna, Self-suppression of axial mode hopping
by intracavity second-harmonic generation, Opt. Lett. 22, 375 (1997). 135, 137
[256] S. Helmfrid and K. Tatsuno, Stable single-mode operation of intracavity-doubled diode-
pumped Nd:YVO4 lasers: theoretical study , J. Opt. Soc. Am. B 11, 436 (1994). 135,
137
[257] R. DeSalvo, H. Vanherzeele, D. J. Hagan, M. Sheik-Bahae, G. Stegeman, and E. W. V.
Stryland, Self-focusing and self-defocusing by cascaded second-order effects in KTP ,
Opt. Lett. 17, 28 (1992). 136
[258] S. Holmgren, V. Pasiskevicius, and F. Laurell, Generation of 2.8 ps pulses by mode-
locking a Nd:GdVO4 laser with defocusing cascaded Kerr lensing in periodically poled
KTP , Opt. Express 13, 5270 (2005). 136
[259] C. Schafer, C. Fries, C. Theobald, and J. A. L’huillier, Parametric Kerr lens mode-
locked, 888 nm pumped Nd:YVO4 laser , Opt. Lett. 36, 2674 (2011). 136
[260] J. E. Hastie, S. Calvez, M. D. Dawson, T. Leinonen, A. Laakso, J. Lyytikainen, and
M. Pessa, High power CW red VECSEL with linearly polarized TEM00 output beam,
Opt. Express 13, 77 (2005). 138
[261] F. Lenhardt, A. Nebel, R. Knappe, M. Nittmann, J. Bartschke, and J. A. L’huillier,
Efficient Single-Pass Second Harmonic Generation of a Continuous Wave Nd:YVO4-
Laser at 1342 nm Using MgO:PPLN , in Conference on Lasers and Electro-Optics 2010,
CThEE5, Optical Society of America (2010). 139
[262] Y. Nishida, H. Miyazawa, M. Asobe, O. Tadanaga, and H. Suzuki, Direct-bonded QPM-
LN ridge waveguide with high damage resistance at room temperature, Electronics Let-
ters 39, 609 (2003). 139
[263] T. Nishikawa, A. Ozawa, Y. Nishida, M. Asobe, F.-L. Hong, and T. W. Hansch, Efficient
494 mW sum-frequency generation of sodium resonance radiation at 589 nm by using
a periodically poled Zn:LiNbO3 ridge waveguide, Opt. Express 17, 17792 (2009). 139
184

Bibliography
[264] K. R. Parameswaran, J. R. Kurz, R. V. Roussev, and M. M. Fejer, Observation of
99% pump depletion in single-pass second-harmonic generation in a periodically poled
lithium niobate waveguide, Opt. Lett. 27, 43 (2002). 141
[265] D. Jedrzejczyk, R. Guther, K. Paschke, G. Erbert, and G. Trankle, Diode laser frequency
doubling in a ppMgO:LN ridge waveguide: influence of structural imperfection, optical
absorption and heat generation, Applied Physics B 109, 33 (2012). 143
[266] S. Helmfrid and G. Arvidsson, Influence of randomly varying domain lengths and
nonuniform effective index on second-harmonic generation in quasi-phase-matching
waveguides, J. Opt. Soc. Am. B 8, 797 (1991). 143
[267] F. Laurell and G. Arvidsson, Frequency doubling in Ti:MgO:LiNbO3 channel waveg-
uides, J. Opt. Soc. Am. B 5, 292 (1988). 143
[268] A. B. Fallahkhair, K. S. Li, and T. E. Murphy, Vector Finite Difference Modesolver for
Anisotropic Dielectric Waveguides, J. Lightw. Technol. 26, 1423 (2008). 143
[269] R. G. Batchko, G. D. Miller, A. Alexandrovski, M. M. Fejer, and R. L. Byer, Limitations
of high-power visible wavelength periodically poled lithium niobate devices due to green-
induced infrared absorption and thermal lensing , in Conference on Lasers and Electro-
Optics, CTuD6, Optical Society of America (1998). 143, 145
[270] O. A. Louchev, N. E. Yu, S. Kurimura, and K. Kitamura, Thermal inhibition of high-
power second-harmonic generation in periodically poled LiNbO3 and LiTaO3 crystals,
Applied Physics Letters 87, 131101 (2005). 143, 144, 145
[271] K. Okamoto, Fundamentals of Optical Waveguides, Electronics & Electrical, Elsevier
(2000). 143
[272] O. Gayer, Z. Sacks, E. Galun, and A. Arie, Temperature and wavelength dependent re-
fractive index equations for MgO-doped congruent and stoichiometric LiNbO3 , Applied
Physics B 91, 343 (2008). 143
[273] J. Cannon, The One-Dimensional Heat Equation, Cambridge University Press (1984).
144
[274] D. Nikogosyan, Nonlinear Optical Crystals: A Complete Survey, Springer (2005). 144
[275] K. Cole, J. Beck, A. Haji-Sheikh, and B. Litkouh, Heat Conduction Using Green’s
Functions, 2nd edition, CRC Press (2010). 144
[276] V. Dmitriev, G. Gurzadyan, , and D. Nikogosyan, Handbook of nonlinear optical crys-
tals, Springer series in optical sciences, Springer (1997). 145
[277] J. Schwesyg, M. Kajiyama, M. Falk, D. Jundt, K. Buse, and M. Fejer, Light absorp-
tion in undoped congruent and magnesium-doped lithium niobate crystals in the visible
wavelength range, Applied Physics B 100, 109 (2010). 145
185
Top Related
Copyright © 2022 FDOKUMEN

