


Bahasa
Halaman
Hukum

Dynamic Article LinksC<Journal ofMaterials Chemistry
Cite this: J. Mater. Chem., 2011, 21, 17673
www.rsc.org/materials PAPER
Dow
nloa
ded
by U
nive
rsita
t Rov
ira
I V
irgi
li on
11
Dec
embe
r 20
12Pu
blis
hed
on 0
5 O
ctob
er 2
011
on h
ttp://
pubs
.rsc
.org
| do
i:10.
1039
/C1J
M13
125G
View Article Online / Journal Homepage / Table of Contents for this issue
QD-‘‘Onion’’-Multicode silica nanospheres with remarkable stability as pHsensors†
Iv�an Castell�o Serrano,a Qiang Maab and Emilio Palomares*ac
Received 6th July 2011, Accepted 8th September 2011
DOI: 10.1039/c1jm13125g
We present a flexible reverse microemulsion method using hydrophobic QDs for multiplexed encoded
nanobeads encapsulating layers of different coloured quantum dots, called QD-‘‘Onion’’-Multicode
bead (QOM). This novel system has monodisperse, photostable, and excellent luminescence properties
that are stable at different pH values. The protection that the silica layers confer to the QDs allows them
to be used as a ratiometric pH sensor by measuring the ratio of PL intensity of QDs from the different
layers.
Introduction
Micro- and nanometre-sized particles with embedded spectro-
scopic signatures are of considerable interest in analytical
chemistry and bioengineering due to their potential applications
in multiplexed bioassays, biotechnology and bioimaging.1–4
Advances by several groups in the last decade have led to a burst
of activities regarding so-called optical ‘‘bar coding’’ based on the
use of nanostructures, semiconductor quantum dots (QDs)
among them.5–9 QDs represent a particularly interesting class of
probes well-suited for advanced fluorescence imaging applica-
tions, such as multiplexed quantitative analysis of cellular
phenotypes, real-time monitoring of intracellular processes, and
in vivo molecular imaging.10–17 Compared to conventional fluo-
rophores, QDs exhibit many interesting characteristics, including
size-tunable and spectrally narrow light emission along with
different light absorption throughout a wide spectrum, improved
brightness with outstanding resistance to photobleaching and
degradation, and extremely large Stokes shift.13 Therefore, QDs
greatly expand the capabilities of fluorescence imaging. The
multiplexing capability of QDs is completed by efficient light
absorption over a broad spectral range, as essentially any photon
in the UV-visible range with energy exceeding the band gap can
be absorbed without damaging the nanoparticle. Unlike organic
fluorophores, the molar extinction coefficient of QDs gradually
increases toward shorter wavelength, allowing multicolor QDs to
be simultaneously excited by a single high-energy light source,
eliminating the need for multiple excitation sources. This coupled
aInstitute of Chemical Research of Catalonia (ICIQ), Avda. Pa€ısosCatalans, 16, Tarragona, E-43007, Spain. Fax: +34 977920223; Tel:+34977929241bChemistry College, Jinlin University, 130012, ChinacICREA, Avda. Llu�ıs Companys, 23, Barcelona, E-08010, Spain. E-mail:[email protected]
† Electronic supplementary information (ESI) available. See DOI:10.1039/c1jm13125g
This journal is ª The Royal Society of Chemistry 2011
with the narrow emission makes them extremely attractive. In
principle, multiple colors and intensities can be used to encode
thousands of biomolecules and small-molecule compounds.5
Recent work has used silica beads, in which are embedded the
QDs, to improve the QD fluorescence for the coding signal. Silica
is one of the most popular inert materials for surface coating,
which has several advantages compared to other materials.
Firstly, silica is non-toxic and can be easily modified with func-
tionalized groups that can form covalent bonds with biomole-
cules. Secondly, degradation can be avoided due to the resistance
of silica to both aqueous (except extremely high pH solutions)
and non-aqueous solvents.18 Finally, silica nanoparticles are
easily separated by centrifugation during preparation, function-
alization, and other treatment processes due to their high
density.19 Many attempts have been reported in the scientific
literature to achieve multiplexed color encoded silica nano-
spheres.20–22 Nevertheless, because of the use of hydrophilic QDs
in these methods, lower emission quantum yield and poorer
stability are usually observed. Moreover, these methods do not
generally satisfy the requirements of multi-color encoded spheres
and only single color spheres are obtained. Several authors have
incorporated the QDs onto the surface of micro- or nanospheres,
however the quantity of QDs that can be incorporated is
limited.23,24
Herein we employ a reverse microemulsion method for the
encapsulation of hydrophobic QDs bringing together the best
properties reported for multiplexed encoded materials, using
silica nanospheres, that we call Quantum Dot-‘‘Onion’’-Multi-
code (QOM), following our previous work published in Chem.
Commun.25 This novel procedure has several main features.
Firstly, it is facile and straightforward, avoiding complex
chemical reactions that may quench the CdSe/ZnS QDs lumi-
nescence. Secondly, QD loading and composition can be
controlled simply through the number of silica layers and QDs
selection respectively, thereby providing a means to tune the
nanosphere’s optical properties. Finally, the use of inert silica for
J. Mater. Chem., 2011, 21, 17673–17679 | 17673
Dow
nloa
ded
by U
nive
rsita
t Rov
ira
I V
irgi
li on
11
Dec
embe
r 20
12Pu
blis
hed
on 0
5 O
ctob
er 2
011
on h
ttp://
pubs
.rsc
.org
| do
i:10.
1039
/C1J
M13
125G
View Article Online
coating QDs avoids the leakage of heavy metal ions into the
environment and enhances the chemical stability of CdSe QDs.
Furthermore, the lack of toxicity is also an ideal platform for
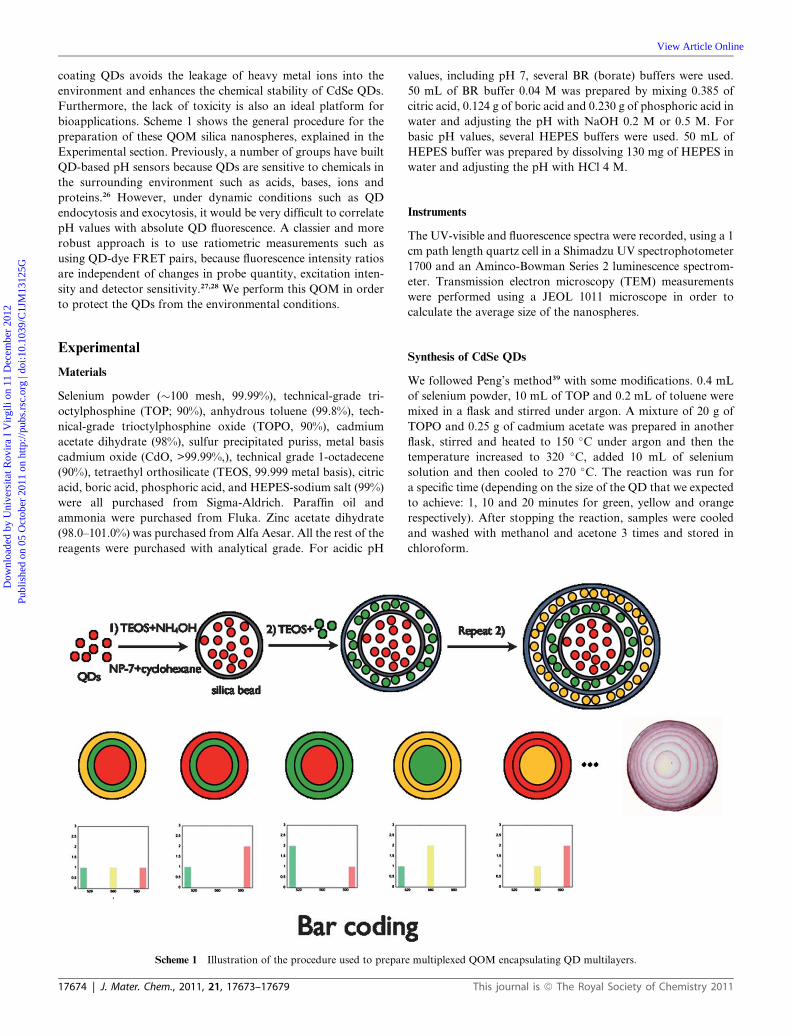
bioapplications. Scheme 1 shows the general procedure for the
preparation of these QOM silica nanospheres, explained in the
Experimental section. Previously, a number of groups have built
QD-based pH sensors because QDs are sensitive to chemicals in
the surrounding environment such as acids, bases, ions and
proteins.26 However, under dynamic conditions such as QD
endocytosis and exocytosis, it would be very difficult to correlate
pH values with absolute QD fluorescence. A classier and more
robust approach is to use ratiometric measurements such as
using QD-dye FRET pairs, because fluorescence intensity ratios
are independent of changes in probe quantity, excitation inten-
sity and detector sensitivity.27,28 We perform this QOM in order
to protect the QDs from the environmental conditions.
Experimental
Materials
Selenium powder (�100 mesh, 99.99%), technical-grade tri-
octylphosphine (TOP; 90%), anhydrous toluene (99.8%), tech-
nical-grade trioctylphosphine oxide (TOPO, 90%), cadmium
acetate dihydrate (98%), sulfur precipitated puriss, metal basis
cadmium oxide (CdO, >99.99%,), technical grade 1-octadecene
(90%), tetraethyl orthosilicate (TEOS, 99.999 metal basis), citric
acid, boric acid, phosphoric acid, and HEPES-sodium salt (99%)
were all purchased from Sigma-Aldrich. Paraffin oil and
ammonia were purchased from Fluka. Zinc acetate dihydrate
(98.0–101.0%) was purchased from Alfa Aesar. All the rest of the
reagents were purchased with analytical grade. For acidic pH
Scheme 1 Illustration of the procedure used to prepar
17674 | J. Mater. Chem., 2011, 21, 17673–17679
values, including pH 7, several BR (borate) buffers were used.
50 mL of BR buffer 0.04 M was prepared by mixing 0.385 of
citric acid, 0.124 g of boric acid and 0.230 g of phosphoric acid in
water and adjusting the pH with NaOH 0.2 M or 0.5 M. For
basic pH values, several HEPES buffers were used. 50 mL of
HEPES buffer was prepared by dissolving 130 mg of HEPES in
water and adjusting the pH with HCl 4 M.
Instruments
The UV-visible and fluorescence spectra were recorded, using a 1
cm path length quartz cell in a Shimadzu UV spectrophotometer
1700 and an Aminco-Bowman Series 2 luminescence spectrom-
eter. Transmission electron microscopy (TEM) measurements
were performed using a JEOL 1011 microscope in order to
calculate the average size of the nanospheres.
Synthesis of CdSe QDs
We followed Peng’s method39 with some modifications. 0.4 mL
of selenium powder, 10 mL of TOP and 0.2 mL of toluene were
mixed in a flask and stirred under argon. A mixture of 20 g of
TOPO and 0.25 g of cadmium acetate was prepared in another
flask, stirred and heated to 150 �C under argon and then the
temperature increased to 320 �C, added 10 mL of selenium
solution and then cooled to 270 �C. The reaction was run for
a specific time (depending on the size of the QD that we expected
to achieve: 1, 10 and 20 minutes for green, yellow and orange
respectively). After stopping the reaction, samples were cooled
and washed with methanol and acetone 3 times and stored in
chloroform.
e multiplexed QOM encapsulating QD multilayers.
This journal is ª The Royal Society of Chemistry 2011
Dow
nloa
ded
by U
nive
rsita
t Rov
ira
I V
irgi
li on
11
Dec
embe
r 20
12Pu
blis
hed
on 0
5 O
ctob
er 2
011
on h
ttp://
pubs
.rsc
.org
| do
i:10.
1039
/C1J
M13
125G
View Article Online
ZnS coating of CdSe QDs
The CdSe QDs were coated with ZnS following a similar method
previously described40 with some minor modifications. A mixture
of 5 mL of QDs in chloroform, 0.0273 g of sulfur, 0.1866 g of zinc
acetate dihydrate and 50 mL of paraffin oil was prepared in
a round-bottomed flask and heated to 80 �C for 20 minutes.
When the mixture appeared homogeneous it was heated to
145 �C and kept at this temperature for 50 minutes. The solution
was then removed and cooled to room temperature. The CdSe/
ZnS (core/shell) was precipitated with copious amounts of
methanol and collected by centrifugation and decanting. The
CdSe/Zn was then resuspended in chloroform. The coating
procedure was repeated several times and in the final step of
centrifugation and decanting the CdSe/ZnS was resuspended and
stored in chloroform solution.
Synthesis of ZnxCd1 � xS
For a typical preparation of ZnxCd1 � xS,41 a mixture of 0.0032 g
of CdO, 0.0041 g of ZnO, 2.5 mL of oleic acid, and 20 mL of
octadecene was heated to 80 �C and degassed under argon for 20
min. The reaction vessel was then filled with argon, and its
temperature was increased to 310 �C. After the CdO and ZnO
precursors were dissolved completely to form a clear colorless
solution, the temperature was lowered to 300 �C. A solution of
0.016 g of sulfur in 5 mL of octadecene was quickly injected into
this hot solution, and the reaction mixture was kept at 300 �C for
the subsequent growth and annealing of the resulting nano-
crystals. Aliquots of the sample were taken at different time
intervals, and UV-vis and PL spectra were recorded for each
aliquot. These sampling aliquots were quenched in cold chloro-
form (25 �C) to terminate the growth of the particles
immediately.
QOM
The encapsulation of QDs into silica beads was performed
following our previously reported method.25 Amixture of 2.6 mL
of Tergitol NP7 and 15 mL of cyclohexane was prepared in
a flask and left to stir for 15 minutes. To this solution 800 mL of
QDs in chloroform solution and 640 mL of TEOS were added to
the previous mixture and left to stir for another 30 minutes. From
this moment on the reaction was conducted in the dark. 200 mL
of aqueous ammonia solution (30%) were added to start the
hydrolysis and left to stir for 24 hours. 800 mL of QD in chlo-
roform solution was then added to the previous mixture and left
to stir for 30 minutes. Then 100 mL of TEOS were added to the
reaction and left to stir for 24 hours. Another 800 mL of QDs in
chloroform solution was added to the reaction and left to stir for
30 minutes and 100 mL of TEOS were added to the mixtures and
left to stir for 24 hours. Acetone was added to stop the reaction
and the mixture was centrifuged for 20 minutes with ethanol 3
times at 3300g. The samples were stored in ethanol.
pH sensitivity
1 mL of silica-coated QDs (core) was added to 1 mL of several
buffers with different pH values from 2 to 11. They were incu-
bated for 1 h with continuous shaking. The pH stability test was
This journal is ª The Royal Society of Chemistry 2011
performed following the procedure described above, adding 1
mL of 1-layer QOM to 1 mL of several buffers with different pH
values from 4 to 9. The QOM was formed with a core with
590 nm CdSe/ZnS embedded QDs and an additional layer of
silica embedded with 520 nm green CdSe/ZnS QDs. They were
incubated for 1 h with continuous shaking.
Results and discussion
Incorporation of CdSe/ZnS QDs into silica beads forming QOM
There are two main types of routes to prepare silica spheres, the
St€ober method23,29–31 and the reverse microemulsion process. The
former is hard to apply if the nanoparticles are insoluble in
alcohol–water solution. For this reason, ligand exchange is
usually required prior to commencing the St€ober process for
QDs synthesized by organometallic methods. This exchange is
commonly associated with a decrease of fluorescent efficiency of
QDs and it therefore requires more sensitive fluorescence
measurement systems. In the case of aqueous QDs, the St€ober
method can be directly used to synthesize QDs@SiO2 to obtain
spheres with a controllable thickness of the silica shell over the
range from a few nanometres to several micrometres, but
multistep procedures32 are required and the size distribution of
QDs/SiO2 is not very narrow. An alternative method is the
reverse microemulsion method that uses water-in-oil micro-
emulsions where the silica spheres are synthesized by the
hydrolysis of tetraethoxysilane (TEOS), followed by their
condensation on water nanodroplets.33 Nanocomposites32,34 and
dye molecules35 can be encapsulated by the silica spheres as long
as they are soluble in water. Recently,36,37 a variant reverse
micelle-based approach was performed to synthesize silica-
coated hydrophobic QDs and other hydrophobic nanoparticles.
NP-7 is a surfactant that causes the microemulsion because of its
amphiphilic nature and it can also exchange the TOPO from
QDs to make them water-soluble to allow the QDs to be inside
the mini-pool or bubbles that will be surrounded by TEOS.
Ammonia reacts with TEOS to produce silica via hydrolysis, as
shown in Scheme 1. The effects of water and ammonia are
complex. Water catalyzes the hydrolysis and increases the
nucleation rate of silica particles. Lower water content reduces
supersaturation and favors the growth of the QD seed particles
over the nucleation of fresh silica. This is favoured by solvents
with higher dielectric constants (such as water), which favour
ionization of silanol groups and enhance electrostatic repulsion
between particles. Ammonia is also a catalyst for TEOS hydro-
lysis. Notwithstanding this the rate of spontaneous nucleation
was found to increase as the ammonia concentration was
lowered.
The UV-Vis absorption and emission spectra of synthesized
CdSe/ZnS and CdSe/ZnS@SiO2 QDs are presented in Fig. 1 and
show well-defined absorption peaks and small full width at half
maximum (FWHM), indicating a rather uniform and narrow size
distribution. Without the silica coating (see Fig. S1† in the ESI),
the colloidal solutions lose their homogeneity in less than a week
due to aggregation and precipitation of the QDs. We can observe
a blue shift due to corrosion of CdSe/ZnS during the embedding
process in which hydrolysis occurs.
J. Mater. Chem., 2011, 21, 17673–17679 | 17675
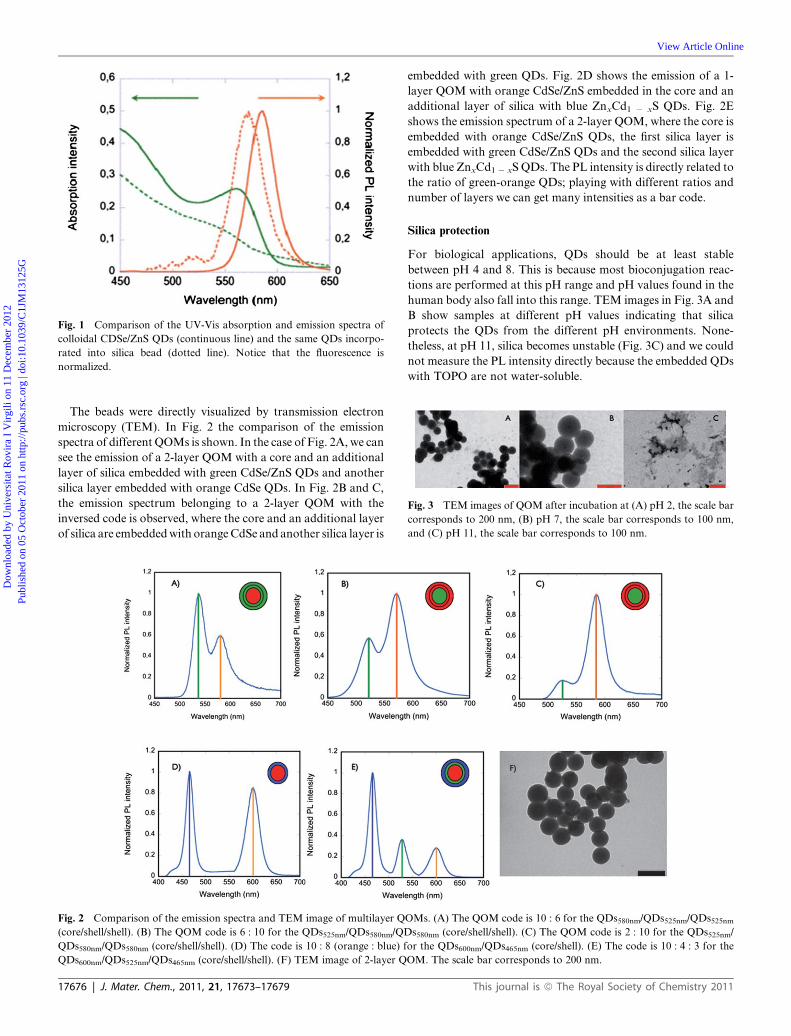
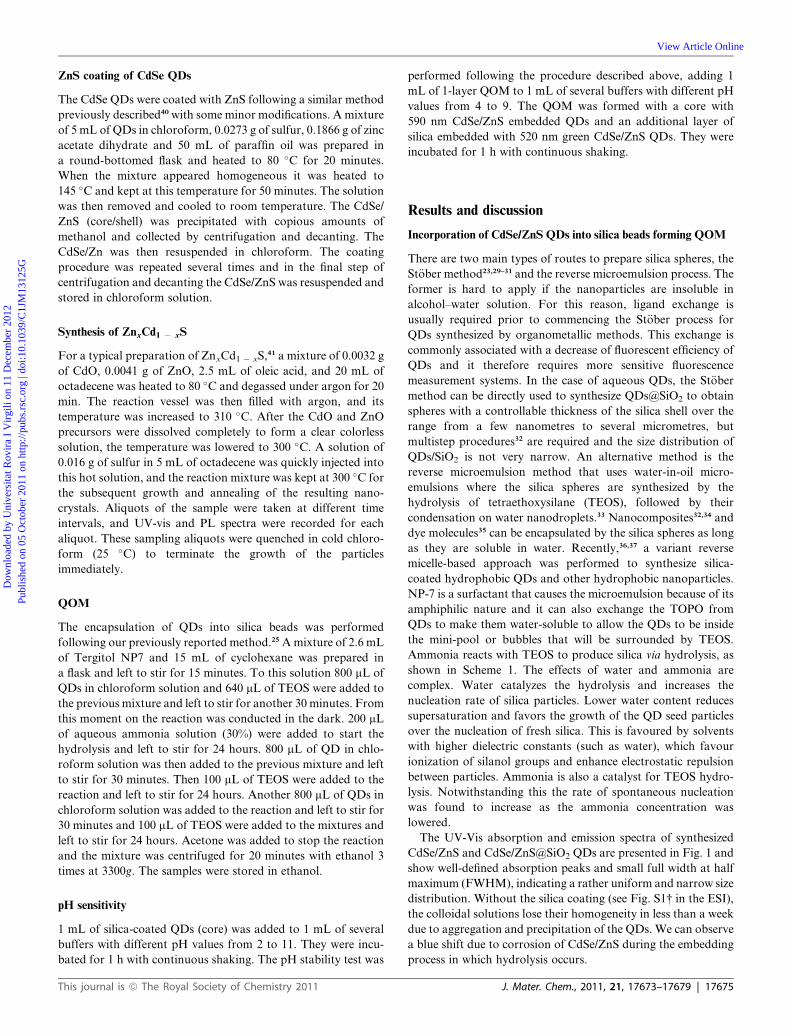
Fig. 1 Comparison of the UV-Vis absorption and emission spectra of
colloidal CDSe/ZnS QDs (continuous line) and the same QDs incorpo-
rated into silica bead (dotted line). Notice that the fluorescence is
normalized.
Fig. 3 TEM images of QOM after incubation at (A) pH 2, the scale bar
corresponds to 200 nm, (B) pH 7, the scale bar corresponds to 100 nm,
and (C) pH 11, the scale bar corresponds to 100 nm.
Dow
nloa
ded
by U
nive
rsita
t Rov
ira
I V
irgi
li on
11
Dec
embe
r 20
12Pu
blis
hed
on 0
5 O
ctob
er 2
011
on h
ttp://
pubs
.rsc
.org
| do
i:10.
1039
/C1J
M13
125G
View Article Online
The beads were directly visualized by transmission electron
microscopy (TEM). In Fig. 2 the comparison of the emission
spectra of different QOMs is shown. In the case of Fig. 2A, we can
see the emission of a 2-layer QOM with a core and an additional
layer of silica embedded with green CdSe/ZnS QDs and another
silica layer embedded with orange CdSe QDs. In Fig. 2B and C,
the emission spectrum belonging to a 2-layer QOM with the
inversed code is observed, where the core and an additional layer
of silica are embeddedwith orangeCdSe and another silica layer is
Fig. 2 Comparison of the emission spectra and TEM image of multilayer Q
(core/shell/shell). (B) The QOM code is 6 : 10 for the QDs525nm/QDs580nm/QD
QDs580nm/QDs580nm (core/shell/shell). (D) The code is 10 : 8 (orange : blue) f
QDs600nm/QDs525nm/QDs465nm (core/shell/shell). (F) TEM image of 2-layer Q
17676 | J. Mater. Chem., 2011, 21, 17673–17679
embedded with green QDs. Fig. 2D shows the emission of a 1-
layer QOM with orange CdSe/ZnS embedded in the core and an
additional layer of silica with blue ZnxCd1 � xS QDs. Fig. 2E
shows the emission spectrum of a 2-layer QOM, where the core is
embedded with orange CdSe/ZnS QDs, the first silica layer is
embedded with green CdSe/ZnS QDs and the second silica layer
with blue ZnxCd1 � xSQDs. The PL intensity is directly related to
the ratio of green-orange QDs; playing with different ratios and
number of layers we can get many intensities as a bar code.
Silica protection
For biological applications, QDs should be at least stable
between pH 4 and 8. This is because most bioconjugation reac-
tions are performed at this pH range and pH values found in the
human body also fall into this range. TEM images in Fig. 3A and
B show samples at different pH values indicating that silica
protects the QDs from the different pH environments. None-
theless, at pH 11, silica becomes unstable (Fig. 3C) and we could
not measure the PL intensity directly because the embedded QDs
with TOPO are not water-soluble.
OMs. (A) The QOM code is 10 : 6 for the QDs580nm/QDs525nm/QDs525nms580nm (core/shell/shell). (C) The QOM code is 2 : 10 for the QDs525nm/
or the QDs600nm/QDs465nm (core/shell). (E) The code is 10 : 4 : 3 for the
OM. The scale bar corresponds to 200 nm.
This journal is ª The Royal Society of Chemistry 2011
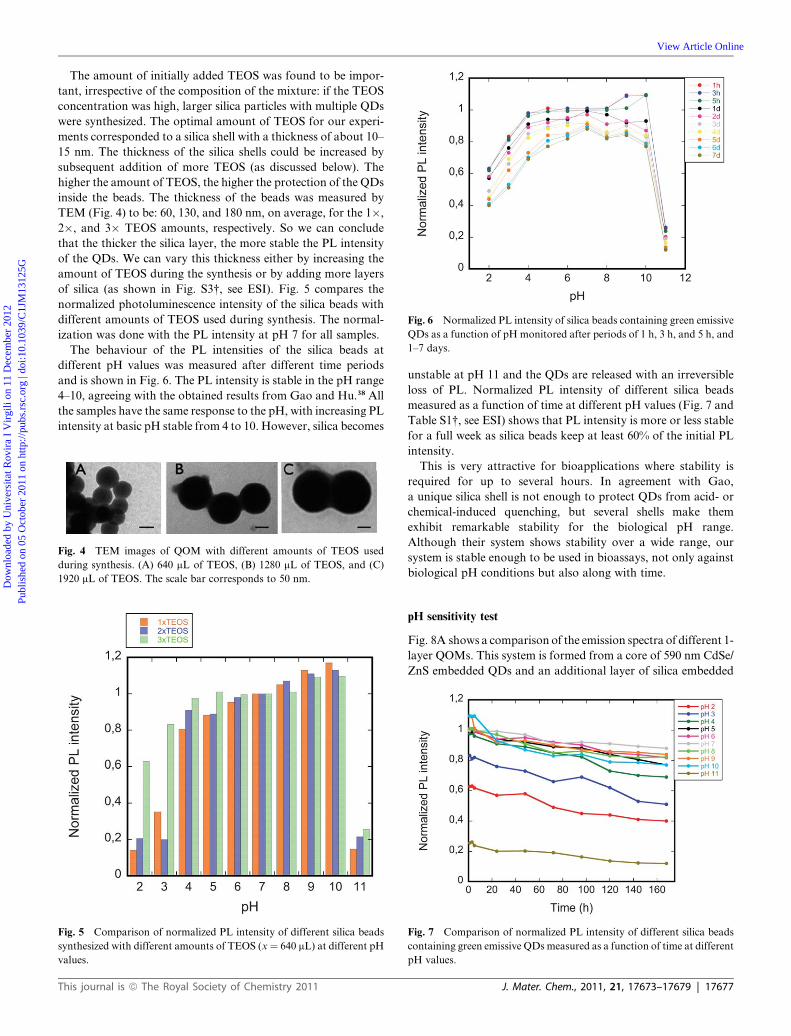
Fig. 6 Normalized PL intensity of silica beads containing green emissive
QDs as a function of pH monitored after periods of 1 h, 3 h, and 5 h, and
1–7 days.
Dow
nloa
ded
by U
nive
rsita
t Rov
ira
I V
irgi
li on
11
Dec
embe
r 20
12Pu
blis
hed
on 0
5 O
ctob
er 2
011
on h
ttp://
pubs
.rsc
.org
| do
i:10.
1039
/C1J
M13
125G
View Article Online
The amount of initially added TEOS was found to be impor-
tant, irrespective of the composition of the mixture: if the TEOS
concentration was high, larger silica particles with multiple QDs
were synthesized. The optimal amount of TEOS for our experi-
ments corresponded to a silica shell with a thickness of about 10–
15 nm. The thickness of the silica shells could be increased by
subsequent addition of more TEOS (as discussed below). The
higher the amount of TEOS, the higher the protection of the QDs
inside the beads. The thickness of the beads was measured by
TEM (Fig. 4) to be: 60, 130, and 180 nm, on average, for the 1�,
2�, and 3� TEOS amounts, respectively. So we can conclude
that the thicker the silica layer, the more stable the PL intensity
of the QDs. We can vary this thickness either by increasing the
amount of TEOS during the synthesis or by adding more layers
of silica (as shown in Fig. S3†, see ESI). Fig. 5 compares the
normalized photoluminescence intensity of the silica beads with
different amounts of TEOS used during synthesis. The normal-
ization was done with the PL intensity at pH 7 for all samples.
The behaviour of the PL intensities of the silica beads at
different pH values was measured after different time periods
and is shown in Fig. 6. The PL intensity is stable in the pH range
4–10, agreeing with the obtained results from Gao and Hu.38 All
the samples have the same response to the pH, with increasing PL
intensity at basic pH stable from 4 to 10. However, silica becomes
Fig. 4 TEM images of QOM with different amounts of TEOS used
during synthesis. (A) 640 mL of TEOS, (B) 1280 mL of TEOS, and (C)
1920 mL of TEOS. The scale bar corresponds to 50 nm.
Fig. 5 Comparison of normalized PL intensity of different silica beads
synthesized with different amounts of TEOS (x¼ 640 mL) at different pH
values.
This journal is ª The Royal Society of Chemistry 2011
unstable at pH 11 and the QDs are released with an irreversible
loss of PL. Normalized PL intensity of different silica beads
measured as a function of time at different pH values (Fig. 7 and
Table S1†, see ESI) shows that PL intensity is more or less stable
for a full week as silica beads keep at least 60% of the initial PL
intensity.
This is very attractive for bioapplications where stability is
required for up to several hours. In agreement with Gao,
a unique silica shell is not enough to protect QDs from acid- or
chemical-induced quenching, but several shells make them
exhibit remarkable stability for the biological pH range.
Although their system shows stability over a wide range, our
system is stable enough to be used in bioassays, not only against
biological pH conditions but also along with time.
pH sensitivity test
Fig. 8A shows a comparison of the emission spectra of different 1-
layer QOMs. This system is formed from a core of 590 nm CdSe/
ZnS embedded QDs and an additional layer of silica embedded
Fig. 7 Comparison of normalized PL intensity of different silica beads
containing green emissive QDs measured as a function of time at different
pH values.
J. Mater. Chem., 2011, 21, 17673–17679 | 17677
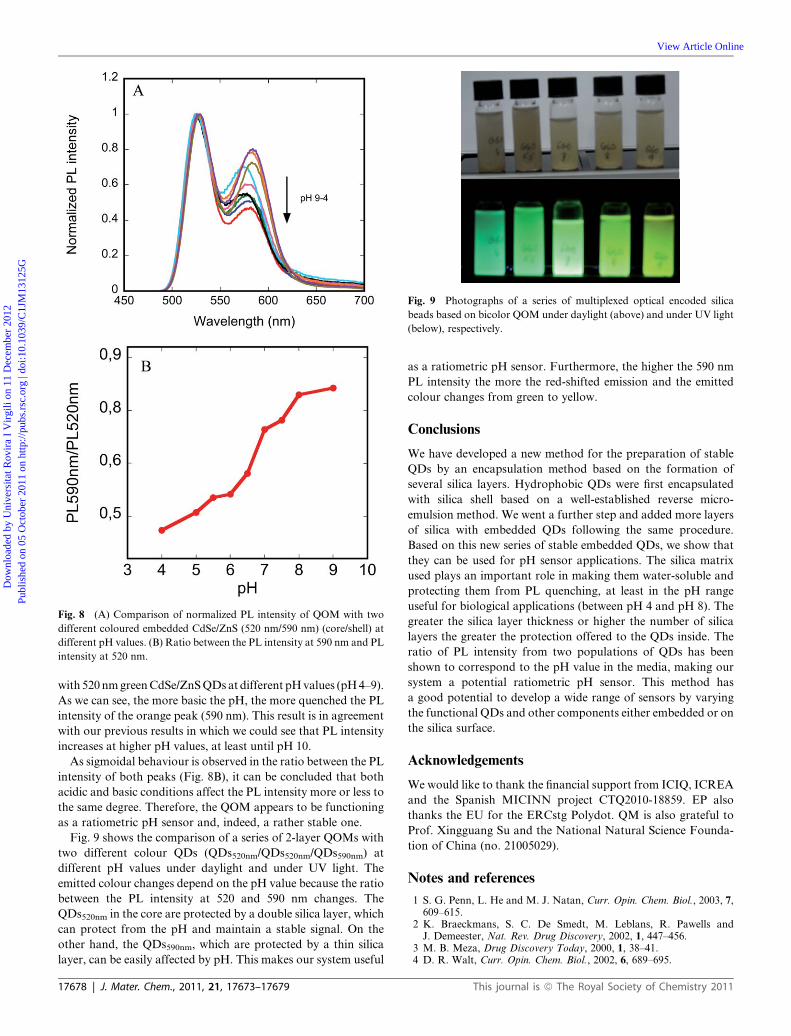
Fig. 8 (A) Comparison of normalized PL intensity of QOM with two
different coloured embedded CdSe/ZnS (520 nm/590 nm) (core/shell) at
different pH values. (B) Ratio between the PL intensity at 590 nm and PL
intensity at 520 nm.
Fig. 9 Photographs of a series of multiplexed optical encoded silica
beads based on bicolor QOM under daylight (above) and under UV light
(below), respectively.
Dow
nloa
ded
by U
nive
rsita
t Rov
ira
I V
irgi
li on
11
Dec
embe
r 20
12Pu
blis
hed
on 0
5 O
ctob
er 2
011
on h
ttp://
pubs
.rsc
.org
| do
i:10.
1039
/C1J
M13
125G
View Article Online
with 520nmgreenCdSe/ZnSQDs at different pHvalues (pH4–9).
As we can see, the more basic the pH, the more quenched the PL
intensity of the orange peak (590 nm). This result is in agreement
with our previous results in which we could see that PL intensity
increases at higher pH values, at least until pH 10.
As sigmoidal behaviour is observed in the ratio between the PL
intensity of both peaks (Fig. 8B), it can be concluded that both
acidic and basic conditions affect the PL intensity more or less to
the same degree. Therefore, the QOM appears to be functioning
as a ratiometric pH sensor and, indeed, a rather stable one.
Fig. 9 shows the comparison of a series of 2-layer QOMs with
two different colour QDs (QDs520nm/QDs520nm/QDs590nm) at
different pH values under daylight and under UV light. The
emitted colour changes depend on the pH value because the ratio
between the PL intensity at 520 and 590 nm changes. The
QDs520nm in the core are protected by a double silica layer, which
can protect from the pH and maintain a stable signal. On the
other hand, the QDs590nm, which are protected by a thin silica
layer, can be easily affected by pH. This makes our system useful
17678 | J. Mater. Chem., 2011, 21, 17673–17679
as a ratiometric pH sensor. Furthermore, the higher the 590 nm
PL intensity the more the red-shifted emission and the emitted
colour changes from green to yellow.
Conclusions
We have developed a new method for the preparation of stable
QDs by an encapsulation method based on the formation of
several silica layers. Hydrophobic QDs were first encapsulated
with silica shell based on a well-established reverse micro-
emulsion method. We went a further step and added more layers
of silica with embedded QDs following the same procedure.
Based on this new series of stable embedded QDs, we show that
they can be used for pH sensor applications. The silica matrix
used plays an important role in making them water-soluble and
protecting them from PL quenching, at least in the pH range
useful for biological applications (between pH 4 and pH 8). The
greater the silica layer thickness or higher the number of silica
layers the greater the protection offered to the QDs inside. The
ratio of PL intensity from two populations of QDs has been
shown to correspond to the pH value in the media, making our
system a potential ratiometric pH sensor. This method has
a good potential to develop a wide range of sensors by varying
the functional QDs and other components either embedded or on
the silica surface.
Acknowledgements
We would like to thank the financial support from ICIQ, ICREA
and the Spanish MICINN project CTQ2010-18859. EP also
thanks the EU for the ERCstg Polydot. QM is also grateful to
Prof. Xingguang Su and the National Natural Science Founda-
tion of China (no. 21005029).
Notes and references
1 S. G. Penn, L. He and M. J. Natan, Curr. Opin. Chem. Biol., 2003, 7,609–615.
2 K. Braeckmans, S. C. De Smedt, M. Leblans, R. Pawells andJ. Demeester, Nat. Rev. Drug Discovery, 2002, 1, 447–456.
3 M. B. Meza, Drug Discovery Today, 2000, 1, 38–41.4 D. R. Walt, Curr. Opin. Chem. Biol., 2002, 6, 689–695.
This journal is ª The Royal Society of Chemistry 2011
Dow
nloa
ded
by U
nive
rsita
t Rov
ira
I V
irgi
li on
11
Dec
embe
r 20
12Pu
blis
hed
on 0
5 O
ctob
er 2
011
on h
ttp://
pubs
.rsc
.org
| do
i:10.
1039
/C1J
M13
125G
View Article Online
5 M. Y. Han, X. H. Gao, J. Z. Su and S. M. Nie,Nat. Biotechnol., 2001,19, 631–635.
6 X. H. Gao and S. M. Nie, J. Phys. Chem. B, 2003, 107, 11575–11578.7 X. H. Gao, W. C. W. Chan and S. M. Nie, J. Biomed. Opt., 2002, 7,532–537.
8 N. Gaponik, I. L. Radtchenko, G. B. Sukhorukov, H. Weller andA. L. Rogach, Adv. Mater., 2002, 14, 879–882.
9 H. Xu, M. Sha, E. Y. Wong, J. Uphoff, Y. Xu, J. A. Traedway,A. Truong, E. O’Brien, S. Squith, M. Stubbins, N. K. Spurr,E. H. Lai and W. Mahoney, Nucleic Acids Res., 2003, 31, e43.
10 I. L. Medintz and H. Matoussi, Phys. Chem. Chem. Phys., 2009, 11,17–45.
11 I. L. Medintz, H. Matoussi and A. R. Clapp, Int. J. Nanomed., 2008,3, 151–167.
12 R. D. Misra, Nanomedicine, 2008, 3, 271–274.13 U. Resch-Genger, M. Grabolle, S. Cavaliere-Jaricot, R. Nitschke and
T. Nann, Nat. Methods, 2008, 5, 763–775.14 A. M. Smith, H. Duan, A. M. Mohs and S. Nie, Adv. Drug Delivery
Rev., 2008, 60, 1226–1240.15 E. Tholouli, E. Sweeney, E. Barrow, V. Clay, J. A. Hoyland and
R. J. Byers, J. Pathol., 2008, 216, 275–285.16 Y. Xing and J. Rao, Cancer Biomarkers, 2008, 4, 307–319.17 P. Zrazheuskiy and X. Gao, Nano Today, 2009, 4, 414–428.18 S. Santra, P. Zhang, K. Wang, R. Tapec and W. Tan, Anal. Chem.,
2001, 73, 4788–4793.19 L. Wang and W. Tan, Nano Lett., 2006, 6, 84–88.20 A. L. Rogach, D. Nagesha, J. W. Ostrander, M. Giersig and
N. A. Kotov, Chem. Mater., 2000, 12, 2676–2785.21 L. Jing, C. Yang, R. Qiao, M. Niu, M. Du, D. Wang and M. Gao,
Chem. Mater., 2010, 22, 420–427.22 P. Yang, M. Ando and N.Murase, J. Colloid Interface Sci., 2007, 316,
420–427.23 Y. Chan, J. P. Zimmer, M. Stroh, J. S. Steckel, R. R. Jain and
M. G. Bawendi, Adv. Mater., 2004, 16, 2092–2097.
This journal is ª The Royal Society of Chemistry 2011
24 M. Chao, K. Lim and K.Woo,Chem. Commun., 2010, 46, 5584–5586.25 Q. Ma; I. Castello-Serrano; E. Palomares. Chem. Commun., 2011, 25,
7071–7073.26 Y. S. Liu, Y. H. Sun, P. T. Vernier, C. H. Liang, S. Y. C. Chong and
M. A. Gundersen, J. Phys. Chem. C, 2007, 11, 2872–2878.27 T. Jin, A. Sasaki, M. Kinjo and J. A. Miyazaki, Chem. Commun.,
2010, 46, 2408–2410.28 P. T. Snee, R. C. Somers, G. Nair, J. P. Zimmer and M. G. Bawendi,
J. Am. Chem. Soc., 2006, 128, 13320–13321.29 A. Wolcott, D. Gerian, M. Visconte, J. Sun, A. Schwataberg, S. Chan
and J. Z. Zhing, J. Phys. Chem. B, 2006, 110, 5779–5789.
30 M. Bruchez, P. Moronne, P. Gn, J. S. Weiss and A. P. Alivisatos,Science, 1998, 281, 2013–2016.
31 T. Nann and P. Mulvaney, Angew. Chem., Int. Ed., 2004, 43, 5393–5396.
32 Y. Yang, L. Jing, X. Yu, J. Yan andM. Gao, Chem. Mater., 2007, 19,4123–4128.
33 S.-Y. Chang, L. Liu and S. A. Asher, J. Am. Chem. Soc., 1994, 116,6739–6744.
34 Z. Ye, M. Tan, G. Wang and J. Yuan, Anal. Chem., 2004, 76, 513–518.
35 X. Zhao, R. P. Bagwe and W. Tan, Adv. Mater., 2004, 16, 173–176.
36 N. R. Jana, C. Earhart and J. Y. Yin, Chem. Mater., 2007, 19, 5074–5082.
37 T. Selvan, T. T. Tan and J. Y. Yin, Adv. Mater., 2005, 17, 1620–1625.38 X. Gao and X. Hu, ACS Nano, 2010, 4, 6080–6086.39 J. Aldana, Y. A. Wang and X. Peng, J. Am. Chem. Soc., 2001, 112,
8844–8850.40 C. Q. Zhu, P. Wang, X. Wang and Y. Li, Nanoscale Res. Lett., 2008,
3, 213–220.41 X. Zong, Y. Fenf, W. Knoll and M. Han, J. Am. Chem. Soc., 2003,
125, 13559–13563.
J. Mater. Chem., 2011, 21, 17673–17679 | 17679
Top Related
Copyright © 2022 FDOKUMEN

