


Bahasa
Halaman
Hukum


Research Report AP-R624-20
Procurement Decision Tool A Case Study of the Toowoomba
Second Range Crossing
Procurement Decision Tool: A Case Study of the Toowoomba Second Range Crossing
Prepared by
Associate Professor Adrian Bridge
Publisher
Austroads Ltd. Level 9, 287 Elizabeth Street Sydney NSW 2000 Australia Phone: +61 2 8265 3300 [email protected] www.austroads.com.au
Project Manager
Ross Guppy
Abstract
The procurement decision tool (“the Tool”) is developed, empirically tested and successfully trialled to significantly advance Value-for-Money in the delivery of infrastructure.
The development and empirical testing of the Tool occurred as part of an Australian Research Council grant (ARC Major Infrastructure Procurement 2009-2013). The Tool is cited by Australia’s Productivity Commission (in their final report on Public Infrastructure in 2014) and cited by the International Transport Forum (ITF) at the OECD, as part of the “way forward” (in the biggest ever inter-governmental report on infrastructure in 2018). Additionally, the Tool is highlighted as part of a review of procurement choices in an upcoming publication by the National Bureau of Economic Research, USA.
The Tool is also trialled and validated on two major infrastructure projects, comprising a case study of a major road project (this report) and a major hospital. These case studies form the basis of the Tool’s forthcoming user guide to be published by Infrastructure Australia.
This research report presents the case study application and validation of the Tool on a major road, namely, the Toowoomba Second Range Crossing, Queensland, Australia.
About Austroads
Austroads is the peak organisation of Australasian road transport and traffic agencies.
Austroads’ purpose is to support our member organisations to deliver an improved Australasian road transport network. To succeed in this task, we undertake leading-edge road and transport research which underpins our input to policy development and published guidance on the design, construction and management of the road network and its associated infrastructure.
Austroads provides a collective approach that delivers value for money, encourages shared knowledge and drives consistency for road users.
Austroads is governed by a Board consisting of senior executive representatives from each of its eleven member organisations: • Transport for NSW • Department of Transport Victoria • Queensland Department of Transport and Main Roads • Main Roads Western Australia • Department of Planning, Transport and Infrastructure South
Australia • Department of State Growth Tasmania • Department of Infrastructure, Planning and Logistics
Northern Territory • Transport Canberra and City Services Directorate,
Australian Capital Territory • Department of Infrastructure, Transport, Regional
Development and Communications • Australian Local Government Association • New Zealand Transport Agency.
Keywords
Project delivery, procurement strategy, microeconomics, risk management, Value-for-Money.
ISBN 978-1-922382-05-4
Austroads Project No. APD6174
Austroads Publication No. AP-R624-20
Publication date June 2020
Pages 42
© Austroads 2020
This work is copyright. Apart from any use as permitted under the Copyright Act 1968, no part may be reproduced by any process without the prior written permission of Austroads.
Acknowledgements
The QUT research team (comprising Associate Professor Adrian Bridge, Gerald (Mango) Murphy PSM, Dr. Farshad Rezvani, Nora Kinnunen and Linda Carroli) gratefully acknowledge technical and financial support provided by Austroads, including its member organisations. The QUT research team also gratefully acknowledge assistance provided by: Jason Wishart (Queensland Treasury), Gavin Ross (Building Queensland), Stephen How Lum (Queensland Department of Transport and Main Roads), Tony Peglas (Aurecon), Gavin Brady (Wilde and Woollard), Brett Smiley (Fulton Hogan), Dejan Makovšek, Klaus Grewe, Dale Gilbert (Retired Director, Queensland Department of Public Works), Stephen Hogan, Robert Phillips, Jan Marie Brooks and Kristy Fairbairn (KMC Partners).
This report has been prepared for Austroads as part of its work to promote improved Australian and New Zealand transport outcomes by providing expert technical input on road and road transport issues.
Individual road agencies will determine their response to this report following consideration of their legislative or administrative arrangements, available funding, as well as local circumstances and priorities.
Austroads believes this publication to be correct at the time of printing and does not accept responsibility for any consequences arising from the use of information herein. Readers should rely on their own skill and judgement to apply information to particular issues.
Procurement Decision Tool: A Case Study of the Toowoomba Second Range Crossing
Austroads 2020 | page i
Summary
The Procurement Decision Tool (“the Tool”) was developed, empirically tested and successfully trialled to significantly advance Value-for-Money in the delivery of infrastructure. The development and empirical testing of the Tool occurred as part of an Australian Research Council grant.1 ‘
The Tool is cited by Australia’s Productivity Commission and is also cited by the International Transport Forum (ITF) at the OECD, in the biggest ever inter-governmental report on infrastructure, as one of two initiatives the ITF considers as the “way forward”.2 Additionally, the Tool is highlighted as part of a review of procurement choices in an upcoming publication by the National Bureau of Economic Research, USA.3 The Tool is also trialled and validated on two major infrastructure projects, comprising a case study of a major road project (this report) and a major hospital. These case studies form the basis of the Tool’s forthcoming user guide to be published by Infrastructure Australia.
The Tool is designed in such a way that it can replace the four-step procurement strategy development process in Section 4 of the Austroads and Australasian Procurement and Construction Council Building and Construction Procurement Guide, 2014 (‘the Guide”). The Tool dovetails with Austroads Guide to Project Delivery Part 1: Overview in a similar way as the Guide. That is, the Tool feeds into the “Evaluation” sub-phase in “Phase 2 – Delivery” of new civil or non-residential building projects in the “Project Management Framework” (in an initial strategic business case).
The identification of the most efficient bundling configuration (or contract packaging) within a project, including the most efficient nature of contracting (i.e. from collaborative to competitive contracting associated with each contracted bundle) is central to the Tool advancing Value-for-Money. In its development of efficient bundles and the development of the most efficient nature of contracting, the Tool relies entirely on state-of-the-art microeconomics.
The Tool is not pre-disposed to any mode of procurement. This feature of the Tool promotes objectivity in decision-making. And since both government and industry can equally effectively apply the Tool, this promotes accountability and transparency of decision-making. The effective application of the Tool is likely to yield benefits beyond microeconomic benefits (associated with the efficient delivery of individual projects) i.e. industry (or mesoeconomic) and macroeconomic benefits. With the prospect, post-coronavirus (COVID-19), of the most acute fiscally constrained environment since the Great Depression, the use of the Tool is compelling to ensure that the best Value-for-Money is delivered and demonstrated on each and every new infrastructure project.
While the primary use of the Tool is to guide future procurement decisions, it can also be used in review mode, to evaluate a completed, or actual, procurement decision.
This report presents the case study application and validation of the Tool (in review mode) on a major road, namely, the Toowoomba Second Range Crossing (TSRC), Queensland. The project is procured as a single contract comprising a bundle of design, construction and maintenance activities, using government finance (Queensland state and federal capital contributions) substantially for the design and construction activities and private finance for the maintenance activities. Meanwhile, core operations arising from the project are procured as part of an existing network of operational activity.
1 See pages 11-23 in the ARC Major Infrastructure Procurement 2009-2013 final report, available at: https://eprints.qut.edu.au/76520/. 2 See page 461 in the Productivity Commission’s final report on Public Infrastructure in 2014, available at:
https://www.pc.gov.au/inquiries/completed/infrastructure/report and see pages 109-112 in ITF (2018), Private Investment in Transport Infrastructure: Dealing with Uncertainty in Contracts, International Transport Forum, Paris, available at: https://www.itf-oecd.org/private-investment-infrastructure).
3 See chapter by Dejan Makovšek (ITF, OECD) and Adrian Bridge (QUT) “Procurement Choices and Infrastructure Costs” in upcoming National Bureau of Economic Research (NBER) book, “Economics of Infrastructure Investment”, edited by Professor Edward Glaeser, Harvard University, USA and Professor James Poterba, MIT, USA (to be published by Chicago University Press in 2020: https://www.nber.org/books/glae-6).

Procurement Decision Tool: A Case Study of the Toowoomba Second Range Crossing
Austroads 2020 | page ii
Given the small cost of maintenance, relative to the much larger cost of design and constructing TSRC, the procurement strategy recommended by the Tool for this project mostly matched the actual approach. Unlike the actual approach, however, the Tool identified maintenance as network activity and not as project specific activity. Because new maintenance arising from the project is identified as network activity, the Tool recommended that this activity is not procured as part of a project-based contract and that private finance is not used in TSRC. The method used to evaluate the recommendations from the Tool supported and validated the Tool’s recommendations for TSRC.
Procurement Decision Tool: A Case Study of the Toowoomba Second Range Crossing
Austroads 2020 | page i
Contents
Summary ......................................................................................................................................................... i
1. Introduction ............................................................................................................................................ 1 1.1 Background ...................................................................................................................................... 1
1.1.1 Overview of the Procurement Decision Tool ....................................................................... 1 1.1.2 Comparing the Guide and the Tool ..................................................................................... 3
1.2 Aim ................................................................................................................................................... 7 1.3 Assumptions and Delimitations ........................................................................................................ 7 1.4 Structure ........................................................................................................................................... 9
2. Outline of Steps in the Tool ................................................................................................................ 10 2.1 Introduction ..................................................................................................................................... 10
2.1.1 Economic Thought and Microeconomic Theory ................................................................ 10 2.1.2 Development, Empirical Testing and Trials ....................................................................... 11
2.2 Step 1. Activity Analysis ................................................................................................................. 12 2.3 Step 2. Project Specific-or-Network Analysis ................................................................................. 14 2.4 Step 3. Risk (Make-or-Buy) Analysis ............................................................................................. 14 2.5 Step 4. Contract Packaging (Bundling) Analysis ........................................................................... 17
2.5.1 Resolving the Inconsistent Nature of Bundling and Contract Packaging .......................... 17 2.5.2 Treatment of Pattern 8 Activities and Avoiding a Lack of Competition/Pre-Contract
Market Failure .................................................................................................................... 19 2.5.3 Treatment of Pattern 5 Activities and Avoiding Hold-up/Post-Contract Market Failure .... 20 2.5.4 Treatment of Pattern 6 and 7 Activities (Including Suitability of Private Finance) ............ 20 2.5.5 Road Project (in Figure 1.3) .............................................................................................. 24
2.6 Step 5. Competitive-or-Collaborative Contracting (Exchange Relationship) Analysis ................... 24 2.7 Validation and Discussion .............................................................................................................. 27
3. Case Study of Tool on TSRC .............................................................................................................. 29 3.1 Introduction ..................................................................................................................................... 29 3.2 Step 1. Activity Analysis ................................................................................................................. 30 3.3 Step 2. Project Specific-or-Network Analysis ................................................................................. 31 3.4 Step 3. Risk (Make-or-Buy) Analysis ............................................................................................. 31 3.5 Step 4. Contract Packaging (Bundling) Analysis ........................................................................... 31 3.6 Step 5. Collaborative-or-Competitive (Exchange Relationship) Analysis ...................................... 32 3.7 Validation and Discussion .............................................................................................................. 32
4. Conclusions and Recommendations ................................................................................................. 34 4.1 Conclusions .................................................................................................................................... 34 4.2 Recommendations ......................................................................................................................... 35
References ................................................................................................................................................... 36
Appendix A Questions for Step 3. Risk (Make-or-Buy) Analysis .................................................... 38 A.1 General Notes ................................................................................................................................ 38 A.2 Question 1. Asset Specificity (Transaction Costs Economics) ...................................................... 38
Procurement Decision Tool: A Case Study of the Toowoomba Second Range Crossing
Austroads 2020 | page ii
A.3 Question 2. Uncertainty (Transaction Costs Economics) .............................................................. 39 A.4 Question 3. Frequency (Transaction Costs Economics) ................................................................ 39 A.5 Question 4. Value (Resource-Based Theory) ................................................................................ 41 A.6 Question 5. Rarity (Resource-Based Theory) ................................................................................ 41 A.7 Question 6. Costly to Imitate (Resource-Based Theory) ............................................................... 42
Tables
Table 1.1: Priority of key performance attributes ......................................................................................... 8 Table 2.1: Mainstream microeconomic theories in the Tool ...................................................................... 11 Table 2.2: Step 1. Activity analysis (design activities) ............................................................................... 13 Table 2.3: Step 1. Activity analysis (construction activities)....................................................................... 13 Table 2.4: Step 1. Activity analysis (operations and maintenance activities) ............................................ 14 Table 2.5: Internalisation and externalisation framework ........................................................................... 16 Table 2.6: An example of an Internalisation Pattern (Pattern #1) .............................................................. 17 Table 2.7: Efficient bundling in pursuance of the key performance attributes ........................................... 21 Table 2.8: Efficient exchange relationships in pursuance of the key performance attributes .................... 26 Table 2.9: Efficient contract terms .............................................................................................................. 26 Table 3.1: Step 1. Activity analysis (design activities) ............................................................................... 30 Table 3.2: Step 1. Activity analysis (construction activities)....................................................................... 30 Table 3.3: Step 1. Activity analysis (operations and maintenance activities) ............................................ 30
Figures
Figure 1.1: Overview of microeconomics in the Tool .................................................................................... 1 Figure 1.2: Expressions of interest in Australian major roads and health projects ....................................... 6 Figure 1.3: A major public sector road with two expressions of interest ....................................................... 6 Figure 2.1: Capability and competence spectrum ....................................................................................... 15 Figure 2.2: Kicking a value-for-money goal ................................................................................................. 18 Figure 2.3: Bundling and contract packaging in the major public sector road project ................................ 24 Figure 3.1: Layout of TSRC ......................................................................................................................... 29
Procurement Decision Tool: A Case Study of the Toowoomba Second Range Crossing
Austroads 2020 | page 1
1. Introduction
1.1 Background
1.1.1 Overview of the Procurement Decision Tool
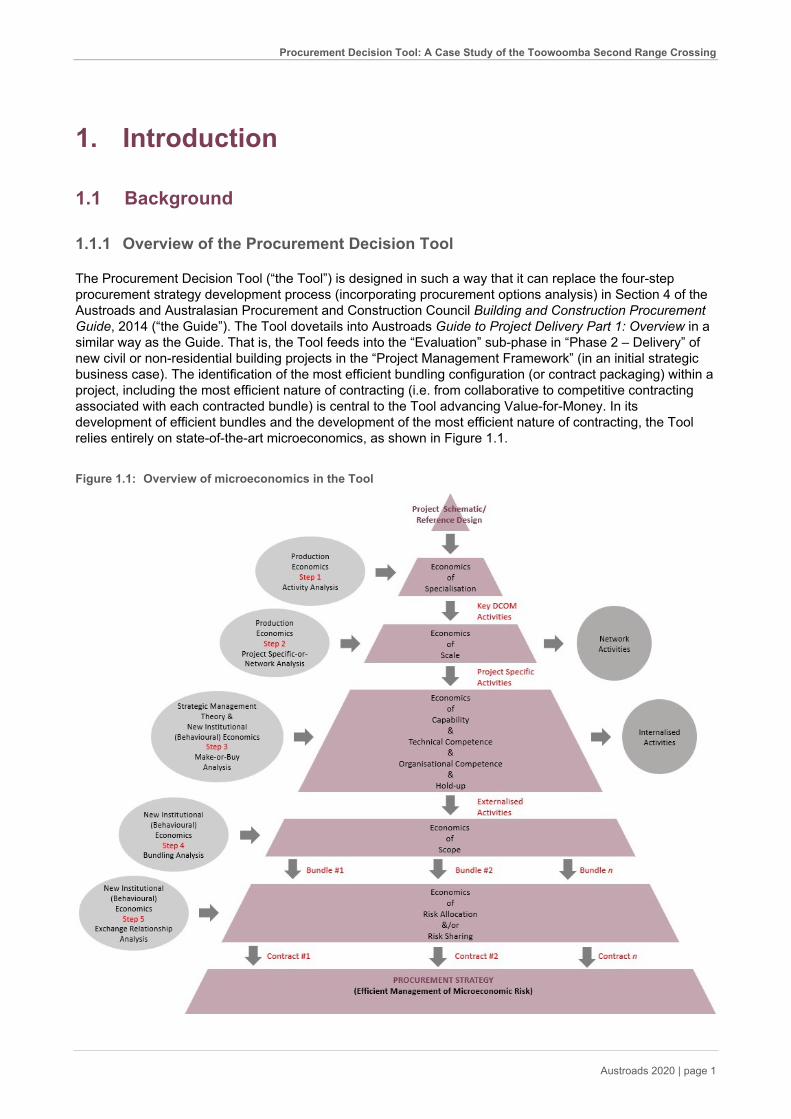
The Procurement Decision Tool (“the Tool”) is designed in such a way that it can replace the four-step procurement strategy development process (incorporating procurement options analysis) in Section 4 of the Austroads and Australasian Procurement and Construction Council Building and Construction Procurement Guide, 2014 (“the Guide”). The Tool dovetails into Austroads Guide to Project Delivery Part 1: Overview in a similar way as the Guide. That is, the Tool feeds into the “Evaluation” sub-phase in “Phase 2 – Delivery” of new civil or non-residential building projects in the “Project Management Framework” (in an initial strategic business case). The identification of the most efficient bundling configuration (or contract packaging) within a project, including the most efficient nature of contracting (i.e. from collaborative to competitive contracting associated with each contracted bundle) is central to the Tool advancing Value-for-Money. In its development of efficient bundles and the development of the most efficient nature of contracting, the Tool relies entirely on state-of-the-art microeconomics, as shown in Figure 1.1.
Figure 1.1: Overview of microeconomics in the Tool
Procurement Decision Tool: A Case Study of the Toowoomba Second Range Crossing
Austroads 2020 | page 2
As indicated in Figure 1.1 the Tool combines various schools of economic thought in order to develop a procurement strategy. This procurement strategy amounts to the efficient management of microeconomic risk in the externalisation of key design, construction, operations and maintenance (DCOM) activities arising from the project schematic, or reference design.
While efficient bundling (Step 4) is central to the efficient management of microeconomic risk, this relies on the partition of those activities that are more efficiently internalised and those activities that are more efficiently externalised, as well as the identification of different kinds (or categories) of risks associated with externalised activities (i.e. Step 3). The risk analysis in Step 3 depends on focusing on project-specific activity and excluding from the analysis those network activities in the new project that are both recurring and similar to already occurring activities in an existing network of infrastructure operated by government (i.e. Step 2). Meanwhile, Step 2 can only effectively commence once key DCOM activities have been identified (Step 1).
Returning to the configuration of efficient bundles of externalised project-specific activities in Step 4, the Tool guides the user to avoid market failure (both pre-contract and post-contract) by avoiding bundles that are either too large or too small. Bundles that are too large can create insufficient competition, which can lead to lack of downward pressure on prices and a lack of incentive to develop innovations (in response to performance specifications). Bundles that are too small can also lead to a lack of incentive to develop innovations. For example, where DCOM activities exhibit inherent complementarity, then there exists the potential for efficiency gains among those downstream activities whose outcomes depend on good decisions made in upstream activities (i.e. positive externalities). Assigning complementary activities (and their property rights) to one party best harnesses positive externalities because potential positive externalities can be missed when there are too many small bundles. Avoiding bundles that are too small also avoids unnecessary interface risks and associated risks of variance to the project’s schedule and/or budget and/or compliance with specifications. Additionally in Step 4, the Tool guides users to ensure that those DCOM activities associated with thin markets (and a potential source of pre-contract market failure) and those activities that incorporate inherent unpredictability (and a potential source of post-contract market failure) are either contracted separately or flagged as requiring different contractual terms within a bundle. The crafting of the most efficient number and size/s of bundles, as well as flagging the need for the differential treatment risks arising from potential troublesome activities (associated with thin markets and/or inherent unpredictability) in Step 4, is dependent on having categorised different kinds of risks in Step 3. These kinds of risks are associated with differential capabilities and competences across government and the market, as well as the market holding-up the government on the occurrence of a change in works, which can lead to significant delays and/or increased costs.
Having developed the most efficient number and size/s of bundles, including having flagged the need for the differential treatment risks associated with potential troublesome activities, the Tool guides the user to develop the most efficient nature of contracting associated with each bundle (i.e. ranging from collaborative to competitive contracting). In this final step, the Tool ensures the government avoids post-contract market failure arising from mistakenly pursuing a collaborative contract or mistakenly seeking a competitive contract. For example, a mistaken collaborative contact can include the government and its counterparty agreeing to a risk sharing regime associated with a budget. In such a contract, the government may suffer from lack of information associated with its inferior capabilities and competences concerning the delivery of the activities of the contract. This can mean that the government is not effectively able to collaborate and exercise the adaptive mechanisms in this contract, should a change of works occur. Consequently, the government remains vulnerable to hold-up by the counterparty. This situation is worsened when the counterparty is in a thin market. That is, the government’s sensitivity and vulnerability to hold-up, created by virtue of its sunk investment in the project, is exacerbated by high switching costs when there are only a few alternative potential counterparties.
A mistaken competitive contract can include the counterparty being remunerated on a fixed-price basis, in which the counterparty is responsible for those risks to which it has been allocated. In such a contract, government may suffer from a lack of an adaptive mechanism to address changes in the works when it could have effectively collaborated in mitigating potential additional costs. Government may also suffer a risk premium levied by the counterparty in respect of those risks that the counterparty cannot effectively control. For example, risks associated with third parties, when government and their counterparty could more effectively work together to resolve.

Procurement Decision Tool: A Case Study of the Toowoomba Second Range Crossing
Austroads 2020 | page 3
This overview of the Tool depicts a process of procurement decision-making by which the effectiveness of decisions at each step is dependent on the effectiveness of decisions made in preceding steps. This process is analogous to a steeplechase in which runners need to successfully clear each hurdle in order to reach the finish line. In the case of procurement decision-making, we can add to this analogy by envisioning the hurdles decreasing in height and difficulty as runners proceed. In other words, the ineffective completion of the initial steps in the Tool is likely to have a disproportionally more adverse effect on efficiency than the ineffective completion of the latter steps.
This is pertinent to a comparison between the current practice of procurement decision-making (for example, the four-step procurement strategy development process in the Guide) and the Tool. Much of the content in the first three steps in the Tool is missing in current practice. The logic of the Tool suggests that current procurement decision-making practice is being conducted on the basis of unreliable and invalid information and, in turn, is leading to inferior Value-for-Money outcomes – relative to those outcomes achievable via the Tool. This inference is explored further in the next section that compares the Guide with the Tool.
1.1.2 Comparing the Guide and the Tool
Generally
The pursuit of equitable risk allocation in contracts based on fundamental principles is common to both the Guide and the Tool. Equitable risk allocation amounts to an assertion only in the Guide, as it does not articulate any fundamental principles it purports to use. The Tool is designed to develop a procurement strategy that represents the efficient management of microeconomic risk (see Figure 1.1) because Value-for-Money is an economic concept. The Tool is explicit in its deployment of fundamental and state-of-the-art microeconomic principles.
Professional judgement is also a common feature in the Guide and the Tool. The Guide states professional judgement is required to work through each of its nominated steps to ensure that all relevant items, together with any project specific matters, not specifically listed in the Guide, are properly considered. However, the Guide only provides users with an outline of potential procurement options along with high-level instruction on the steps to be followed in developing a procurement strategy. As such, the Guide can be seen as a series of ‘black boxes’ that are susceptible to non-economic influence. While professional judgement is also required in the Tool, this judgement is restricted to technical aspects of the project, along with judgement concerning government and market capabilities relative to DCOM activities in the project. Therefore, the Tool is more precise than the Guide in terms of the way it requires users to adhere to its principles in order to process inputs into outputs in each step. Because the Tool can be reliably replicated by different users, this promotes transparency and accountability.
Step 1 of the Guide: Data Gathering
This step in the Guide involves gathering and documenting all information pertinent to the project, so that the project can be effectively profiled against potential delivery models and procurement methods. Similarly, in its first step, the Tool prompts the gathering of data concerning project objectives; project requirements; and project characteristics. As a minimum, the Tool requires the project’s schematic design or reference design (sufficient to identify key DCOM activities) as the starting point in its first step.
Procurement Decision Tool: A Case Study of the Toowoomba Second Range Crossing
Austroads 2020 | page 4
The first step in the Guide also involves the identification of all major project risks; the assessment of the availability and capability of the agency’s human resources; and the market’s appetite for risk and its views about different potential delivery models and capability, solicited by market soundings and industry briefings. In contrast, the Tool sees any attempt at surfacing all major risks at the stage of design associated with a project schematic (that incorporates inherent information gaps) as premature. Rather, the Tool assesses the ability of government versus the market to manage risks vis-à-vis key DCOM activities when these activities can be reliability identified at early schematic stage of design. That is, the Tool adopts a more appropriate unit of risk analysis (i.e. the activity) as opposed to government agencies and their consultants second guessing actual risks. The Tool undertakes this risk analysis as part of its third step and once key DCOM activities have been identified and the project-specific activities have been partitioned from network activities. The Tool postpones the direct input and opinions from the market until the completion of its fourth step (Bundling). This avoids the procurement strategy being unduly influenced by the market’s preferences, which may not provide the best value for the taxpayer. Where the Tool identifies a DCO, DCM or DCOM bundle, it envisages this can proceed, in the bundled approach identified, regardless of the market’s appetite for private financing this bundle.
Step 2 of the Guide: Preliminary Screening
The Guide states that a preliminary screening should be undertaken as early as possible in the procurement strategy development process to determine the likely nature of funding requirements and shortlist potential delivery models. The Guide specifically notes that Public-Private Partnership (PPP) delivery models should be considered as part of the screening process for projects above a certain financial threshold, typically either $50m or $100m. The Guide further advises that the inclusion of PPP models in the preliminary screening will enable agencies to either eliminate PPP models from the mix of potential delivery models under consideration or, where considered feasible, provide sufficient justification for undertaking additional analysis (via a detailed ‘Procurement Options Analysis’ and the ‘Public Sector Comparator’ process) to confirm suitability. In contrast, the Tool does not lead the user to consider a PPP mode procurement before a full analysis of risk and bundling has been completed i.e. at the end of the Tool’s fourth step. Consequently, the Tool protects users from being unduly influenced by short-term financial pressures, which can run counter to the imperative of the economics of whole-life Value-for-Money.
Step 3 of the Guide: Procurement Options Analysis (POA)
The Guide states that a thorough Procurement Options Analysis (POA) will substantially avoid increasing project risk and negatively impacting value-for-money. The Guide also states there are currently no established methods for doing POA. Typically, POA begins with subjective weightings applied to a range of attributes that the client considers important. These weightings are then multiplied by a utility factor representing the extent to which a procurement mode satisfies each attribute. The most desirable procurement is the mode with the highest score.
There are good reasons to presume that reliance on POA in the Guide is contributing to setting projects on an inferior Value-for-Money path relative to the path achievable by the Tool. For example, there is a lack of knowledge of the effect of procurement in operations and maintenance and this renders the development of utility factors vis-à-vis the long term consequences of procurement choice, at best, weak. In turn, this lack of knowledge of projects in their operations, leads clients and their agents to focus on those attributes about which there is more evidence of the performance of different procurement modes. However, this evidence is predominantly associated with design and construction. Hence, these attributes (observable by the end of construction) typically account for the substantial share of the combined weightings.
These attributes, associated with design and construction, are short-term and run counter to long-term Value-for-Money outcomes. More fundamentally, POA can be charged with leading to sub-optimal procurement choices because of the way in which it defines the cause i.e. procurement mode utility (mainly those construction related utilities e.g. concerning time and cost) in the same terms as the effect (i.e. clients’ weighted attributes that are often short-term requirements e.g. time or cost related). Hence, the POA becomes tautological, or non-scientific.
Procurement Decision Tool: A Case Study of the Toowoomba Second Range Crossing
Austroads 2020 | page 5
A reliance on POA in procurement selection is worsened when (and typically) it is applied to the entire bundle of project activities that the client has decided to externalise. Here, clients and/or their agents effectively roll-up various kinds of risks, including those risks that the market cannot efficiently manage. Procurement selection based on using POA often leads to unduly large bundles of externalised project activities that create unduly large contracts, and attempt to transfer too much risk. In doing so, POA has effectively baked into the procurement strategy both pre-contract and post-contract market failure. Finally, the Guide states that the outcomes of POA should be validated by further market soundings or comparison with other like projects. To the extent that other like projects have also been procured using a short-term and non-scientific POA method, then little can be gained by justifying a sub-optional procurement mode by reference to other sub-optimal procurement modes. In contrast, the Tool uses a non-tautological (scientific) and an empirically tested external measure of the validity of the procurement strategy that it recommends.
Step 4 of the Guide: Recommended Delivery Model and Procurement Method
The Guide also states that once the recommended delivery model(s) is established, project owners can decide what form of contract to use to formalise the delivery arrangement with the successful contractor. Similarly, the Tool identifies the most efficient contract terms in its final step.
Also in its final step, the Guide states that very large projects may be split into a number of components, proceeding under different delivery models and procurement methods. In contrast, the development of efficient bundles is central in the Tool and established in the Tool’s fourth step.
Evidence of Market Failure Associated with the Guide and POA
The comparison of the Guide and the Tool in this section begins to explain why we can expect the Guide to lead to inferior Value-for-Money outcomes – relative to those outcomes achievable via the Tool. This explanation is supported by evidence from the Australian Research Council (ARC) Major Infrastructure Procurement research project (Bridge and Bianchi, 2014 and Teo, 2014). In one of the studies in this ARC research project, a survey of 87 Australian public sector major road and health projects (worth AUD32 billion) procured using a similar approach to the Guide (including POA) delivered the following outcomes, all of which can run counter to Value-for-Money:
• A low number of higher value projects account for an appreciably higher proportion of the overall value;
• The majority of road and health projects are delivered as single contracts;
• Larger value projects (over AUD100 million) are dominated by Design and Construct, Alliancing, Early Contractor Involvement, and Managing Contractor approaches, which exclude operations and/or maintenance as part of the contract;
• The budget established in collaboration with the contractor (including a pain share/gain share regime) in the majority of health projects; and
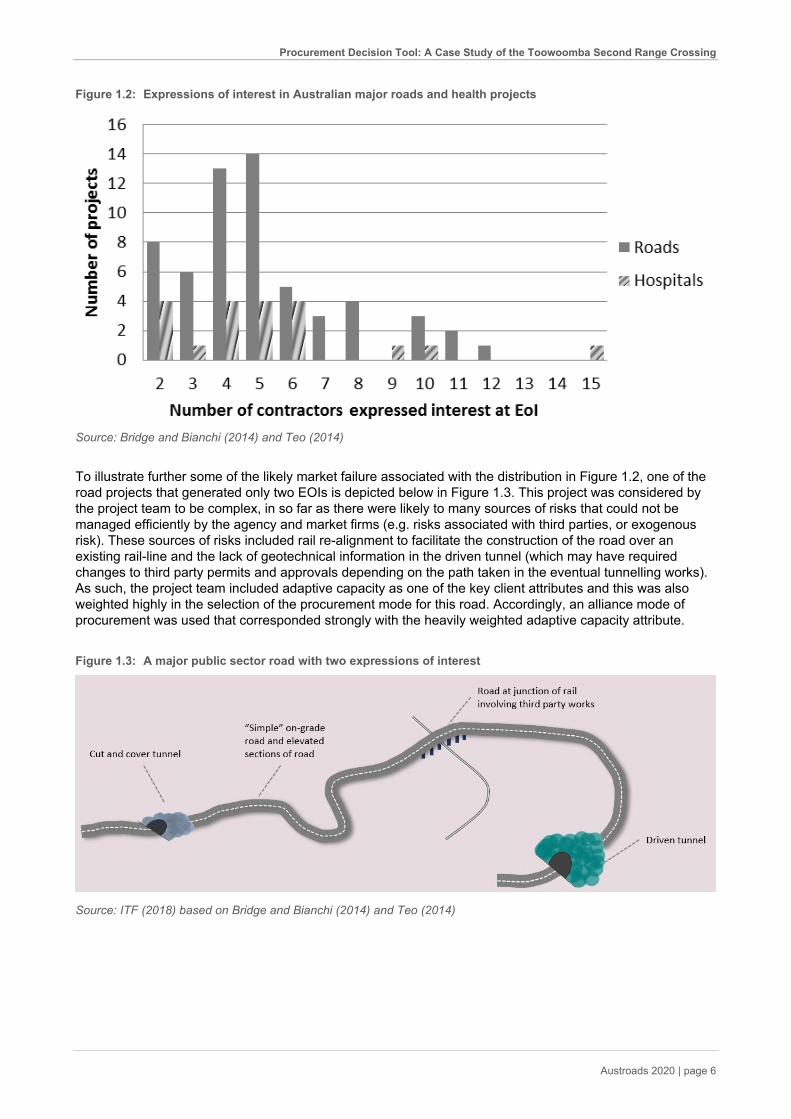
• Figure 1.2 shows Expressions of Interest (EOI) for this sample is right skewed and incorporates near 50 percent of projects (36 projects out of 79 projects, with missing data on this value on 8 projects) that achieved only between two and four EOI; and were likely subject to oligopoly pricing constraints and pre-contract market failure.
Procurement Decision Tool: A Case Study of the Toowoomba Second Range Crossing
Austroads 2020 | page 6
Figure 1.2: Expressions of interest in Australian major roads and health projects
Source: Bridge and Bianchi (2014) and Teo (2014)
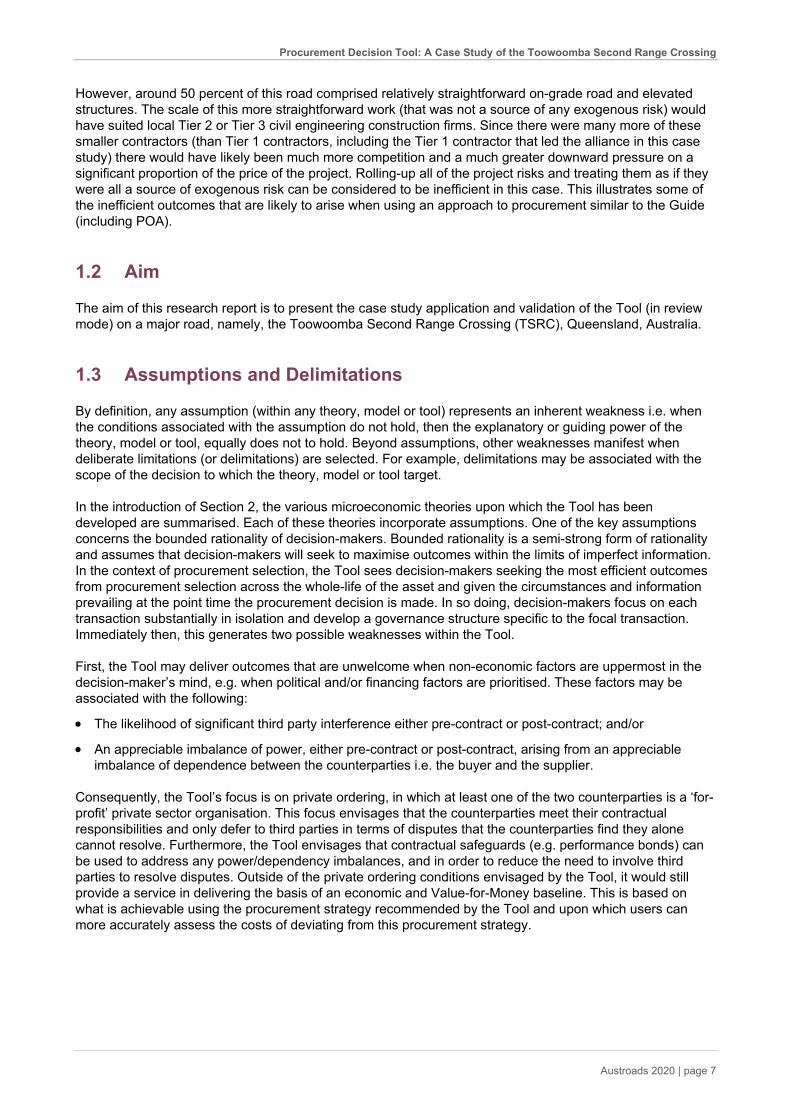
To illustrate further some of the likely market failure associated with the distribution in Figure 1.2, one of the road projects that generated only two EOIs is depicted below in Figure 1.3. This project was considered by the project team to be complex, in so far as there were likely to many sources of risks that could not be managed efficiently by the agency and market firms (e.g. risks associated with third parties, or exogenous risk). These sources of risks included rail re-alignment to facilitate the construction of the road over an existing rail-line and the lack of geotechnical information in the driven tunnel (which may have required changes to third party permits and approvals depending on the path taken in the eventual tunnelling works). As such, the project team included adaptive capacity as one of the key client attributes and this was also weighted highly in the selection of the procurement mode for this road. Accordingly, an alliance mode of procurement was used that corresponded strongly with the heavily weighted adaptive capacity attribute.
Figure 1.3: A major public sector road with two expressions of interest
Source: ITF (2018) based on Bridge and Bianchi (2014) and Teo (2014)
Procurement Decision Tool: A Case Study of the Toowoomba Second Range Crossing
Austroads 2020 | page 7
However, around 50 percent of this road comprised relatively straightforward on-grade road and elevated structures. The scale of this more straightforward work (that was not a source of any exogenous risk) would have suited local Tier 2 or Tier 3 civil engineering construction firms. Since there were many more of these smaller contractors (than Tier 1 contractors, including the Tier 1 contractor that led the alliance in this case study) there would have likely been much more competition and a much greater downward pressure on a significant proportion of the price of the project. Rolling-up all of the project risks and treating them as if they were all a source of exogenous risk can be considered to be inefficient in this case. This illustrates some of the inefficient outcomes that are likely to arise when using an approach to procurement similar to the Guide (including POA).
1.2 Aim
The aim of this research report is to present the case study application and validation of the Tool (in review mode) on a major road, namely, the Toowoomba Second Range Crossing (TSRC), Queensland, Australia.
1.3 Assumptions and Delimitations
By definition, any assumption (within any theory, model or tool) represents an inherent weakness i.e. when the conditions associated with the assumption do not hold, then the explanatory or guiding power of the theory, model or tool, equally does not to hold. Beyond assumptions, other weaknesses manifest when deliberate limitations (or delimitations) are selected. For example, delimitations may be associated with the scope of the decision to which the theory, model or tool target.
In the introduction of Section 2, the various microeconomic theories upon which the Tool has been developed are summarised. Each of these theories incorporate assumptions. One of the key assumptions concerns the bounded rationality of decision-makers. Bounded rationality is a semi-strong form of rationality and assumes that decision-makers will seek to maximise outcomes within the limits of imperfect information. In the context of procurement selection, the Tool sees decision-makers seeking the most efficient outcomes from procurement selection across the whole-life of the asset and given the circumstances and information prevailing at the point time the procurement decision is made. In so doing, decision-makers focus on each transaction substantially in isolation and develop a governance structure specific to the focal transaction. Immediately then, this generates two possible weaknesses within the Tool.
First, the Tool may deliver outcomes that are unwelcome when non-economic factors are uppermost in the decision-maker’s mind, e.g. when political and/or financing factors are prioritised. These factors may be associated with the following:
• The likelihood of significant third party interference either pre-contract or post-contract; and/or
• An appreciable imbalance of power, either pre-contract or post-contract, arising from an appreciable imbalance of dependence between the counterparties i.e. the buyer and the supplier.
Consequently, the Tool’s focus is on private ordering, in which at least one of the two counterparties is a ‘for-profit’ private sector organisation. This focus envisages that the counterparties meet their contractual responsibilities and only defer to third parties in terms of disputes that the counterparties find they alone cannot resolve. Furthermore, the Tool envisages that contractual safeguards (e.g. performance bonds) can be used to address any power/dependency imbalances, and in order to reduce the need to involve third parties to resolve disputes. Outside of the private ordering conditions envisaged by the Tool, it would still provide a service in delivering the basis of an economic and Value-for-Money baseline. This is based on what is achievable using the procurement strategy recommended by the Tool and upon which users can more accurately assess the costs of deviating from this procurement strategy.

Procurement Decision Tool: A Case Study of the Toowoomba Second Range Crossing
Austroads 2020 | page 8
Second, although the Tool assesses the prevailing conditions, and uses as much information as is available at this time, it does this in a static way. The Tool would need to be re-run if there is a delay in the period taken to act on the recommendations of the Tool and when, during this delay, there has been an appreciable change to the capabilities of government and/or the structure of the market. That said, the Tool is designed to be completed in a very short time and with modest resources, and so re-running the Tool should not present a significant impost.
There is a further assumption within the Tool that, under certain circumstances, could be seen as a weakness. The Tool adopts a definition of procurement and Value-for-Money that is consistent with the UK National Audit Office (2004) definition of procurement as, “the whole-life process of the acquisition of goods, services and works..., beginning when a potential requirement is identified and ending with the conclusion of service contract or ultimate disposal of an asset”, as well as HM Treasury (2008) definition of Value-for-Money, “securing the best mix of quality and effectiveness for the least outlay over the period of use of the goods or services bought. It is not about minimising upfront prices...”. In pursuance of its whole-of-life outlook, the Tool seeks to minimise whole-life costs (i.e. minimising the aggregate of capital and life cycle costs i.e. recurrent operating and maintenance costs) and to maximise utility by the direct users and direct operators of the asset. The Tool prioritises these whole-life outcomes over the minimisation only of capital costs (regardless of life cycle costs) and the minimisation only of life cycle costs (regardless of capital costs). The Tool also prioritises whole-life outcomes over the earliest construction start and finish times. Hence, the Tool is not applicable in cases where the least capital cost is an absolute imperative and/or an urgent start on site plus earliest opening date of the asset is required. The Tool’s whole-life outlook creates a profile of the relative importance of key performance attributes as shown in Table 1.1.
Table 1.1: Priority of key performance attributes
Time Start/Finish (Minimum)
Time Compliance (Certainty)
Capital Cost
(Minimum)
Lifecycle Cost
(Minimum)
Whole-Life Cost
(Minimum)
Cost Compliance (Certainty)
Quality Innovations (Maximum)
Quality Compliance (Certainty)
3 2 3 3 1 2 1 2
Note: 1 = Highest Priority; 2 = Moderate Priority; 3 = Least Priority
Beyond the assumptions, there are three delimitations associated with the scope of the Tool. First, the Tool only applies to those projects with the following features:
• Is bespoke: and
• Has a non-trivial capital commitment; and
• Delivers/is followed by an operational and/or maintenance phase (in the case of final product projects) or followed by manufacturing and a service requirement phase (in the case of prototype projects).
As such, the Tool does not apply to the following (and which may be more closely associated with the practice of purchasing):
• Goods and services that can be ‘bought off the shelf’; or
• Projects that are trivial, in terms of capital spending; or
• Projects without a long-term (i.e. without a maintenance or service phase).
Second, the Tool is designed to start at project schematic (or the point in time when DCOM activities can be identified) and it is designed to extend downstream to the point in time at which EOI are established. The Tool assesses only those costs and benefits affected by the procurement of DCOM activities and those costs and benefits affected by the approach to financing the project. That is, wider social, environmental and economic costs and benefits, associated with the upstream investment decision, are excluded. The Tool does not contain guiding apparatus to assist with any decisions beyond EOI. For example, it does not speak to downstream decisions concerning governance, tendering or contract administration (or any of the matters covered in Section 6 of the Guide).
Procurement Decision Tool: A Case Study of the Toowoomba Second Range Crossing
Austroads 2020 | page 9
Third, the Tool is restricted to analysing the procurement of project specific activities only, and is silent on the procurement of any network activities arising from the project that are recurrent and similar to activities in an existing network that is owned and operated by the decision-maker.
1.4 Structure
A brief chronological account of the Tool (from its antecedent theory through to its trialling) and further details on the operation of each of the Tool’s five steps, along with the approach to validating the outcomes from the Tool, is provided in the next section. This is followed by a summary of the TSRC and a summary of the application of each of the Tool’s five steps in the development of a procurement strategy for TSRC. Finally, a brief evaluation of the significance of the Tool is given, along with recommendations on the next steps in using the Tool for transport and traffic agencies that want to apply the Tool either in its review mode (on a project whose actual procurement decision is established) and/or in its guidance mode (on a new project in business case). It also recommended that the economics in the Tool be developed into a further tool to be applied to the procurement of network activity in roads including operations and maintenance.
Procurement Decision Tool: A Case Study of the Toowoomba Second Range Crossing
Austroads 2020 | page 10
2. Outline of Steps in the Tool
2.1 Introduction
2.1.1 Economic Thought and Microeconomic Theory
The Tool employs various schools of economic thought, in order to develop a procurement strategy. This procurement strategy amounts to the efficient management of microeconomic risk in the externalisation of key DCOM activities arising from the project schematic, or reference design.
The various schools of economic thought employed by the Tool, emanate from the modern era in the history of economics, beginning with Adam Smith and classical economics in the late 18th century. More specifically, the Tool uses microeconomic theories that correspond with today’s dominant and orthodox economic thought including assumptions concerning technical possibilities (incorporating diminishing returns to scale) and the rational choice of individual agents based on their preferences (constrained by their initial resources and by technological possibilities). Fundamentally, this mainstream economic thought assumes that resources are scarce, such that it is necessary to choose between competing alternatives. This creates the concept of opportunity cost (or trade-off), as selecting one alternative implies forgoing another alternative. As such, this mainstream thought frames the study of choice, as affected by incentives and resources, to explain and help guide decision-making. Contemporary mainstream microeconomics builds mainly on neoclassical economics that began to develop in the late 19th century. Among other things, neoclassical economics acknowledges the existence of market failure. More recently, a self-styled new institutional economics (NIE) has developed in the US and Europe. While NIE works largely within neoclassism, scholars on this school of thought expand the reach of conventional neoclassism by relaxing one or more of the assumptions in neoclassical economics (Samuels, 1995). For example, scholars within the NIE school embrace decision-making under risk and uncertainty, in contrast to classical decision-making under certainty.
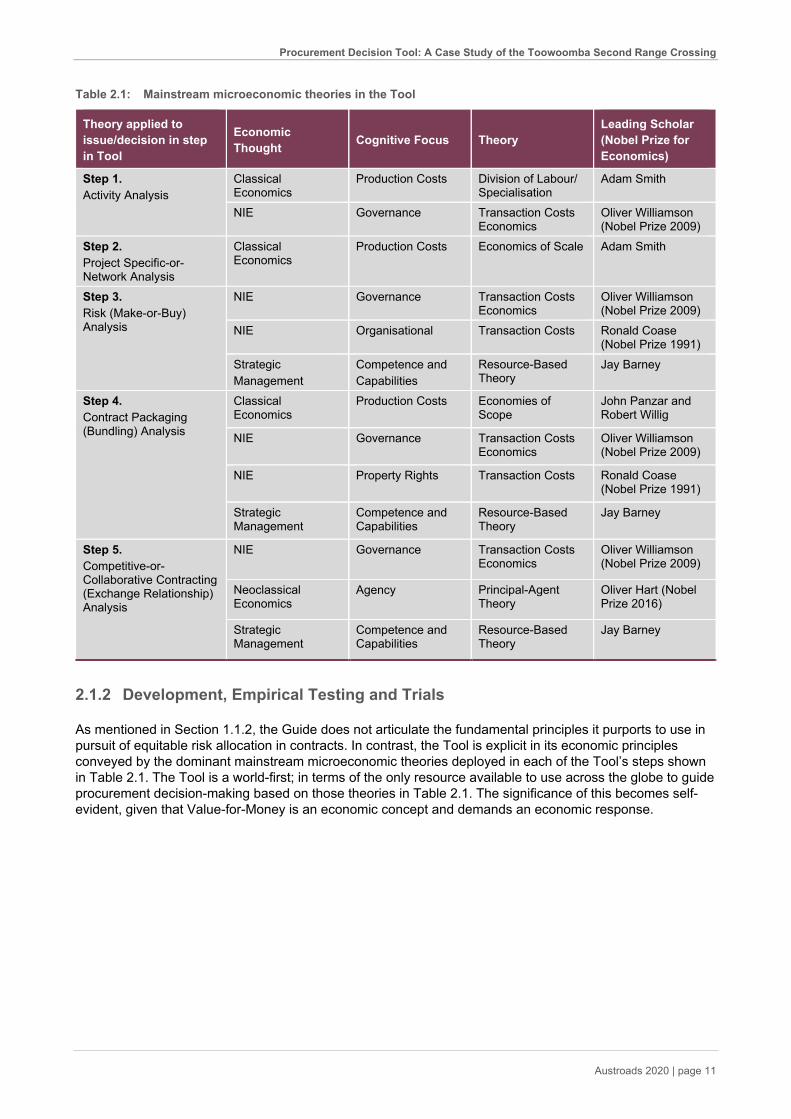
The Tool selects microeconomic theories either from, or consistent with this mainstream economic thought, ranging from classical economics to the NIE, and including a prominent theory from the capabilities perspective (in the field of strategic management). This suite of theory is summarized in Table 2.1.
In its use of the theories noted in Table 2.1, the Tool adopts the doctrine of theoretical pluralism. Theoretical pluralism approves of a plurality of irreconcilable theories for a given set of phenomena not as a transitory state but as an enduring state. This stands in contrast to theoretical monism, which posits that there exists only one theory for any set of phenomenon and that the aim of science is to find the unique and true theory. By adopting theoretical pluralism, the user entertains the idea that the total understanding of the given set of phenomenon (in this case procurement) can be enhanced by the coexistence and deployment of more than one theory. This idea is based on the view that any single theory inevitably only gives a partial account by virtue of its assumptions. A pluralistic approach reflects a certain pragmatism, as it is questionable whether grand unifying theories are possible, and particularly in the social sciences (Elster 1989). An attempt to combine the assumptions of alternative theories does not unify theories, if the logic of the respective theories needs to be changed and potentially weakened. Also, from a pragmatic perspective, pluralists accept the limitations of scientific procedures that may lack sufficient scrutiny to single out any one unique theory. In summary, theoretical pluralism is consistent with Lakatos’ (1977; 1978) notion of the progressiveness of Scientific Research Programs. That said, pluralists do not accept any combination of theories. Theories with contradictory, or rival claims, cannot be simultaneously entertained. That is, an acceptance of one theory implies a rejection of the other theories. In order to distinguish a complementary theory from a rival theory, the theories need to offer a better account of a known fact, or issue (noted in the first column of Table 2.1), under different conditions and/or account for some novel issue under similar conditions (Groenwegen and Vromen, 1996).
Procurement Decision Tool: A Case Study of the Toowoomba Second Range Crossing
Austroads 2020 | page 11
Table 2.1: Mainstream microeconomic theories in the Tool
Theory applied to issue/decision in step in Tool
Economic Thought Cognitive Focus Theory
Leading Scholar (Nobel Prize for Economics)
Step 1. Activity Analysis
Classical Economics
Production Costs Division of Labour/ Specialisation
Adam Smith
NIE Governance Transaction Costs Economics
Oliver Williamson (Nobel Prize 2009)
Step 2. Project Specific-or-Network Analysis
Classical Economics
Production Costs Economics of Scale Adam Smith
Step 3. Risk (Make-or-Buy) Analysis
NIE Governance Transaction Costs Economics
Oliver Williamson (Nobel Prize 2009)
NIE Organisational Transaction Costs Ronald Coase (Nobel Prize 1991)
Strategic Management
Competence and Capabilities
Resource-Based Theory
Jay Barney
Step 4. Contract Packaging (Bundling) Analysis
Classical Economics
Production Costs Economies of Scope
John Panzar and Robert Willig
NIE Governance Transaction Costs Economics
Oliver Williamson (Nobel Prize 2009)
NIE Property Rights Transaction Costs Ronald Coase (Nobel Prize 1991)
Strategic Management
Competence and Capabilities
Resource-Based Theory
Jay Barney
Step 5. Competitive-or-Collaborative Contracting (Exchange Relationship) Analysis
NIE Governance Transaction Costs Economics
Oliver Williamson (Nobel Prize 2009)
Neoclassical Economics
Agency Principal-Agent Theory
Oliver Hart (Nobel Prize 2016)
Strategic Management
Competence and Capabilities
Resource-Based Theory
Jay Barney
2.1.2 Development, Empirical Testing and Trials
As mentioned in Section 1.1.2, the Guide does not articulate the fundamental principles it purports to use in pursuit of equitable risk allocation in contracts. In contrast, the Tool is explicit in its economic principles conveyed by the dominant mainstream microeconomic theories deployed in each of the Tool’s steps shown in Table 2.1. The Tool is a world-first; in terms of the only resource available to use across the globe to guide procurement decision-making based on those theories in Table 2.1. The significance of this becomes self-evident, given that Value-for-Money is an economic concept and demands an economic response.
Procurement Decision Tool: A Case Study of the Toowoomba Second Range Crossing
Austroads 2020 | page 12
The Tool was developed in a PhD study by Teo (2014) that was funded by an Australian Research Council (ARC) grant.4 The key innovation delivered by this study is to organise and operationalise all of the theories in Table 2.1 into a coherent set of steps. For the first time, this study and the Tool it delivered gives users the means to harness the relative strengths of these complementary theories – all of which have been extensively empirically tested in their own right and stood the test of time, including three Nobel prize winning contributions. As such, the configuration of theory in the Tool is state-of-the-art and can be seen an extremely powerful resource to procurement decision-makers. Beyond the development of the application of theory in the Tool, the study by Teo (2014) also developed Expressions of Interest (EOI) as a proxy of Value-for-Money and mechanism (hypothesis) to validate the recommendations of the Tool.
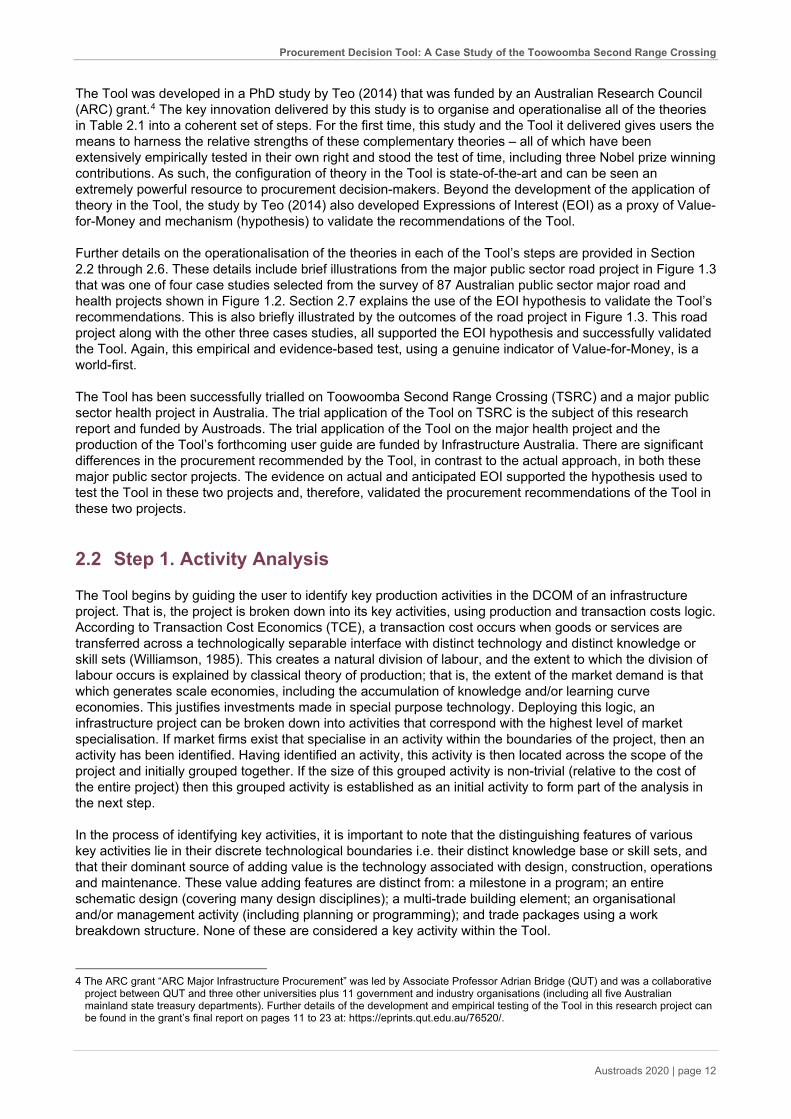
Further details on the operationalisation of the theories in each of the Tool’s steps are provided in Section 2.2 through 2.6. These details include brief illustrations from the major public sector road project in Figure 1.3 that was one of four case studies selected from the survey of 87 Australian public sector major road and health projects shown in Figure 1.2. Section 2.7 explains the use of the EOI hypothesis to validate the Tool’s recommendations. This is also briefly illustrated by the outcomes of the road project in Figure 1.3. This road project along with the other three cases studies, all supported the EOI hypothesis and successfully validated the Tool. Again, this empirical and evidence-based test, using a genuine indicator of Value-for-Money, is a world-first.
The Tool has been successfully trialled on Toowoomba Second Range Crossing (TSRC) and a major public sector health project in Australia. The trial application of the Tool on TSRC is the subject of this research report and funded by Austroads. The trial application of the Tool on the major health project and the production of the Tool’s forthcoming user guide are funded by Infrastructure Australia. There are significant differences in the procurement recommended by the Tool, in contrast to the actual approach, in both these major public sector projects. The evidence on actual and anticipated EOI supported the hypothesis used to test the Tool in these two projects and, therefore, validated the procurement recommendations of the Tool in these two projects.
2.2 Step 1. Activity Analysis
The Tool begins by guiding the user to identify key production activities in the DCOM of an infrastructure project. That is, the project is broken down into its key activities, using production and transaction costs logic. According to Transaction Cost Economics (TCE), a transaction cost occurs when goods or services are transferred across a technologically separable interface with distinct technology and distinct knowledge or skill sets (Williamson, 1985). This creates a natural division of labour, and the extent to which the division of labour occurs is explained by classical theory of production; that is, the extent of the market demand is that which generates scale economies, including the accumulation of knowledge and/or learning curve economies. This justifies investments made in special purpose technology. Deploying this logic, an infrastructure project can be broken down into activities that correspond with the highest level of market specialisation. If market firms exist that specialise in an activity within the boundaries of the project, then an activity has been identified. Having identified an activity, this activity is then located across the scope of the project and initially grouped together. If the size of this grouped activity is non-trivial (relative to the cost of the entire project) then this grouped activity is established as an initial activity to form part of the analysis in the next step.
In the process of identifying key activities, it is important to note that the distinguishing features of various key activities lie in their discrete technological boundaries i.e. their distinct knowledge base or skill sets, and that their dominant source of adding value is the technology associated with design, construction, operations and maintenance. These value adding features are distinct from: a milestone in a program; an entire schematic design (covering many design disciplines); a multi-trade building element; an organisational and/or management activity (including planning or programming); and trade packages using a work breakdown structure. None of these are considered a key activity within the Tool.
4 The ARC grant “ARC Major Infrastructure Procurement” was led by Associate Professor Adrian Bridge (QUT) and was a collaborative
project between QUT and three other universities plus 11 government and industry organisations (including all five Australian mainland state treasury departments). Further details of the development and empirical testing of the Tool in this research project can be found in the grant’s final report on pages 11 to 23 at: https://eprints.qut.edu.au/76520/.
Procurement Decision Tool: A Case Study of the Toowoomba Second Range Crossing
Austroads 2020 | page 13
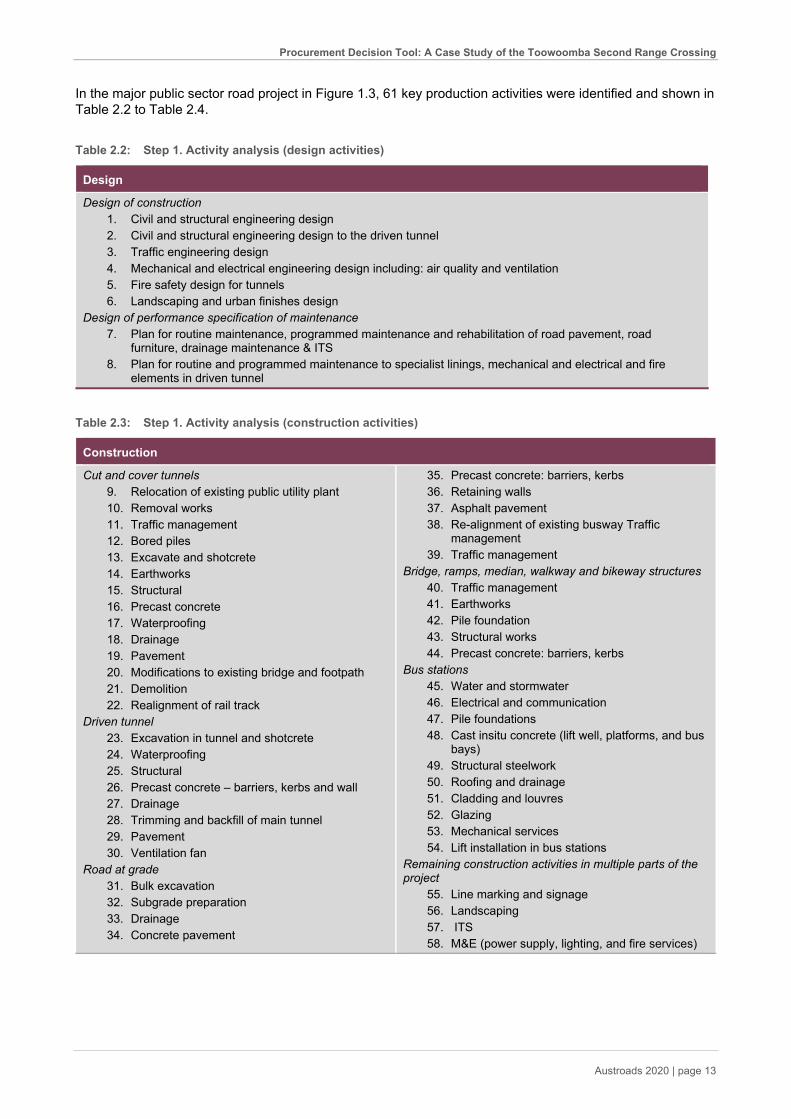
In the major public sector road project in Figure 1.3, 61 key production activities were identified and shown in Table 2.2 to Table 2.4.
Table 2.2: Step 1. Activity analysis (design activities)
Design
Design of construction 1. Civil and structural engineering design 2. Civil and structural engineering design to the driven tunnel 3. Traffic engineering design 4. Mechanical and electrical engineering design including: air quality and ventilation 5. Fire safety design for tunnels 6. Landscaping and urban finishes design
Design of performance specification of maintenance 7. Plan for routine maintenance, programmed maintenance and rehabilitation of road pavement, road
furniture, drainage maintenance & ITS 8. Plan for routine and programmed maintenance to specialist linings, mechanical and electrical and fire
elements in driven tunnel
Table 2.3: Step 1. Activity analysis (construction activities)
Construction
Cut and cover tunnels 9. Relocation of existing public utility plant 10. Removal works 11. Traffic management 12. Bored piles 13. Excavate and shotcrete 14. Earthworks 15. Structural 16. Precast concrete 17. Waterproofing 18. Drainage 19. Pavement 20. Modifications to existing bridge and footpath 21. Demolition 22. Realignment of rail track
Driven tunnel 23. Excavation in tunnel and shotcrete 24. Waterproofing 25. Structural 26. Precast concrete – barriers, kerbs and wall 27. Drainage 28. Trimming and backfill of main tunnel 29. Pavement 30. Ventilation fan
Road at grade 31. Bulk excavation 32. Subgrade preparation 33. Drainage 34. Concrete pavement
35. Precast concrete: barriers, kerbs 36. Retaining walls 37. Asphalt pavement 38. Re-alignment of existing busway Traffic
management 39. Traffic management
Bridge, ramps, median, walkway and bikeway structures 40. Traffic management 41. Earthworks 42. Pile foundation 43. Structural works 44. Precast concrete: barriers, kerbs
Bus stations 45. Water and stormwater 46. Electrical and communication 47. Pile foundations 48. Cast insitu concrete (lift well, platforms, and bus
bays) 49. Structural steelwork 50. Roofing and drainage 51. Cladding and louvres 52. Glazing 53. Mechanical services 54. Lift installation in bus stations
Remaining construction activities in multiple parts of the project
55. Line marking and signage 56. Landscaping 57. ITS 58. M&E (power supply, lighting, and fire services)
Procurement Decision Tool: A Case Study of the Toowoomba Second Range Crossing
Austroads 2020 | page 14
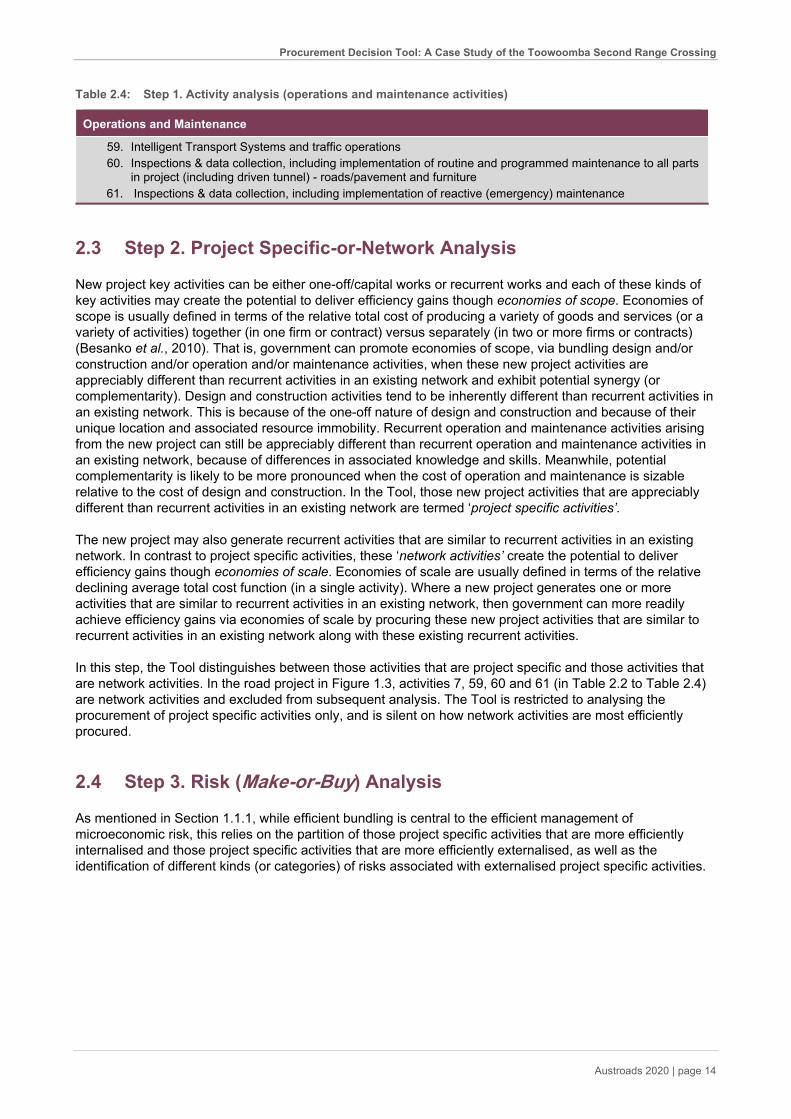
Table 2.4: Step 1. Activity analysis (operations and maintenance activities)
Operations and Maintenance
59. Intelligent Transport Systems and traffic operations 60. Inspections & data collection, including implementation of routine and programmed maintenance to all parts
in project (including driven tunnel) - roads/pavement and furniture 61. Inspections & data collection, including implementation of reactive (emergency) maintenance
2.3 Step 2. Project Specific-or-Network Analysis
New project key activities can be either one-off/capital works or recurrent works and each of these kinds of key activities may create the potential to deliver efficiency gains though economies of scope. Economies of scope is usually defined in terms of the relative total cost of producing a variety of goods and services (or a variety of activities) together (in one firm or contract) versus separately (in two or more firms or contracts) (Besanko et al., 2010). That is, government can promote economies of scope, via bundling design and/or construction and/or operation and/or maintenance activities, when these new project activities are appreciably different than recurrent activities in an existing network and exhibit potential synergy (or complementarity). Design and construction activities tend to be inherently different than recurrent activities in an existing network. This is because of the one-off nature of design and construction and because of their unique location and associated resource immobility. Recurrent operation and maintenance activities arising from the new project can still be appreciably different than recurrent operation and maintenance activities in an existing network, because of differences in associated knowledge and skills. Meanwhile, potential complementarity is likely to be more pronounced when the cost of operation and maintenance is sizable relative to the cost of design and construction. In the Tool, those new project activities that are appreciably different than recurrent activities in an existing network are termed ‘project specific activities’.
The new project may also generate recurrent activities that are similar to recurrent activities in an existing network. In contrast to project specific activities, these ‘network activities’ create the potential to deliver efficiency gains though economies of scale. Economies of scale are usually defined in terms of the relative declining average total cost function (in a single activity). Where a new project generates one or more activities that are similar to recurrent activities in an existing network, then government can more readily achieve efficiency gains via economies of scale by procuring these new project activities that are similar to recurrent activities in an existing network along with these existing recurrent activities.
In this step, the Tool distinguishes between those activities that are project specific and those activities that are network activities. In the road project in Figure 1.3, activities 7, 59, 60 and 61 (in Table 2.2 to Table 2.4) are network activities and excluded from subsequent analysis. The Tool is restricted to analysing the procurement of project specific activities only, and is silent on how network activities are most efficiently procured.
2.4 Step 3. Risk (Make-or-Buy) Analysis
As mentioned in Section 1.1.1, while efficient bundling is central to the efficient management of microeconomic risk, this relies on the partition of those project specific activities that are more efficiently internalised and those project specific activities that are more efficiently externalised, as well as the identification of different kinds (or categories) of risks associated with externalised project specific activities.
Procurement Decision Tool: A Case Study of the Toowoomba Second Range Crossing
Austroads 2020 | page 15
Internalisation, or the make decision, is a mode of operation in which government can exert direct control over resources within the activity and is either wholly responsible or majority responsible for the activity. As such, this definition would include a contract of employment, a government agency or a government majority-owned subsidiary. On the other hand, externalisation, or the buy decision, comprises all other modes of operation. From an economic viewpoint, the make-or-buy decision turns on a comparison of value created through internationalisation versus externalisation. It is unlikely that government will either wholly internalise the delivery of a piece of infrastructure or entirely externalise the delivery of an infrastructure project. Each project specific DCOM activity comprises different technology bases and requires different bundles of resources with different capabilities and competencies. Fundamentally, naturally occurring opportunities to develop learning curve economies and economies of scale across and within each key activity will favour either government or the private sector. This creates differences between government and private sector in terms of capabilities and competencies with respect to each of these key activities and their sub-activities, In turn, this creates differences between government and the private sector in terms of the ability to manage risks within each key activity. This explains different value positions achievable by the private sector relative to that achievable by government regarding each activity. In pursuance of best Value-for-Money the more efficient alternative for the delivery of the project specific activities becomes some combination of government and private provision and this explains why government is likely to make some project specific activities and buy other project specific activities.
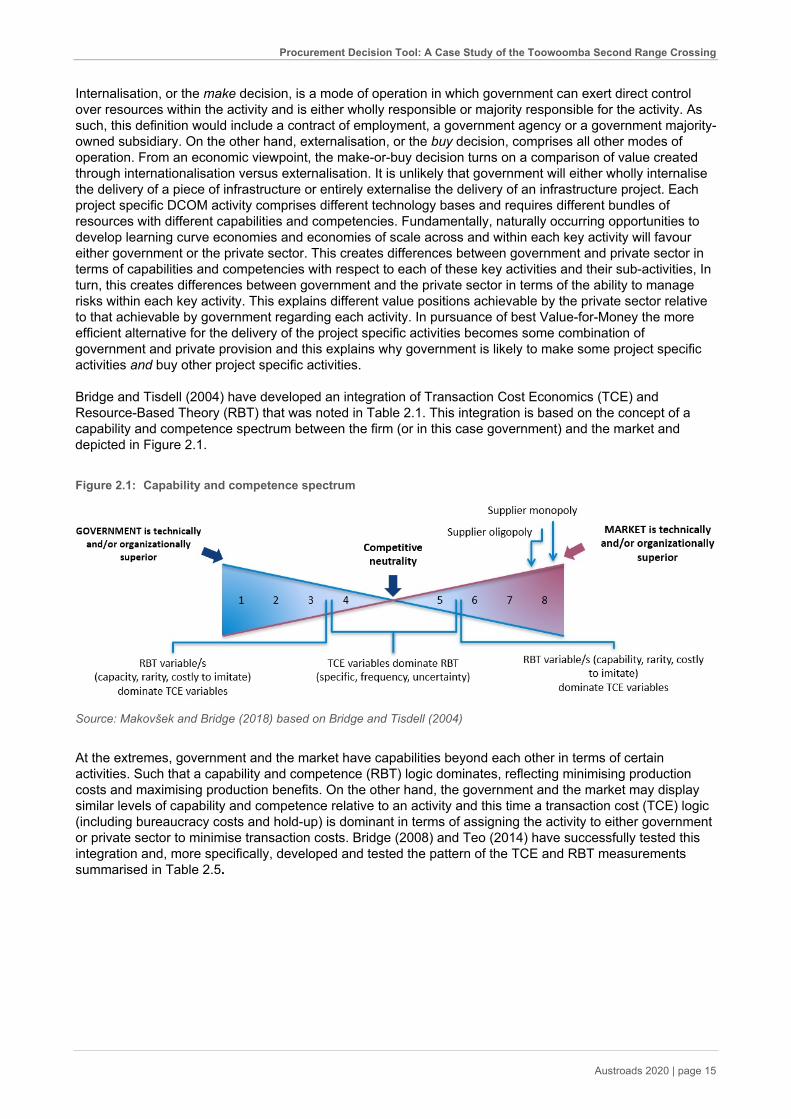
Bridge and Tisdell (2004) have developed an integration of Transaction Cost Economics (TCE) and Resource-Based Theory (RBT) that was noted in Table 2.1. This integration is based on the concept of a capability and competence spectrum between the firm (or in this case government) and the market and depicted in Figure 2.1.
Figure 2.1: Capability and competence spectrum
Source: Makovšek and Bridge (2018) based on Bridge and Tisdell (2004)
At the extremes, government and the market have capabilities beyond each other in terms of certain activities. Such that a capability and competence (RBT) logic dominates, reflecting minimising production costs and maximising production benefits. On the other hand, the government and the market may display similar levels of capability and competence relative to an activity and this time a transaction cost (TCE) logic (including bureaucracy costs and hold-up) is dominant in terms of assigning the activity to either government or private sector to minimise transaction costs. Bridge (2008) and Teo (2014) have successfully tested this integration and, more specifically, developed and tested the pattern of the TCE and RBT measurements summarised in Table 2.5.
Procurement Decision Tool: A Case Study of the Toowoomba Second Range Crossing
Austroads 2020 | page 16
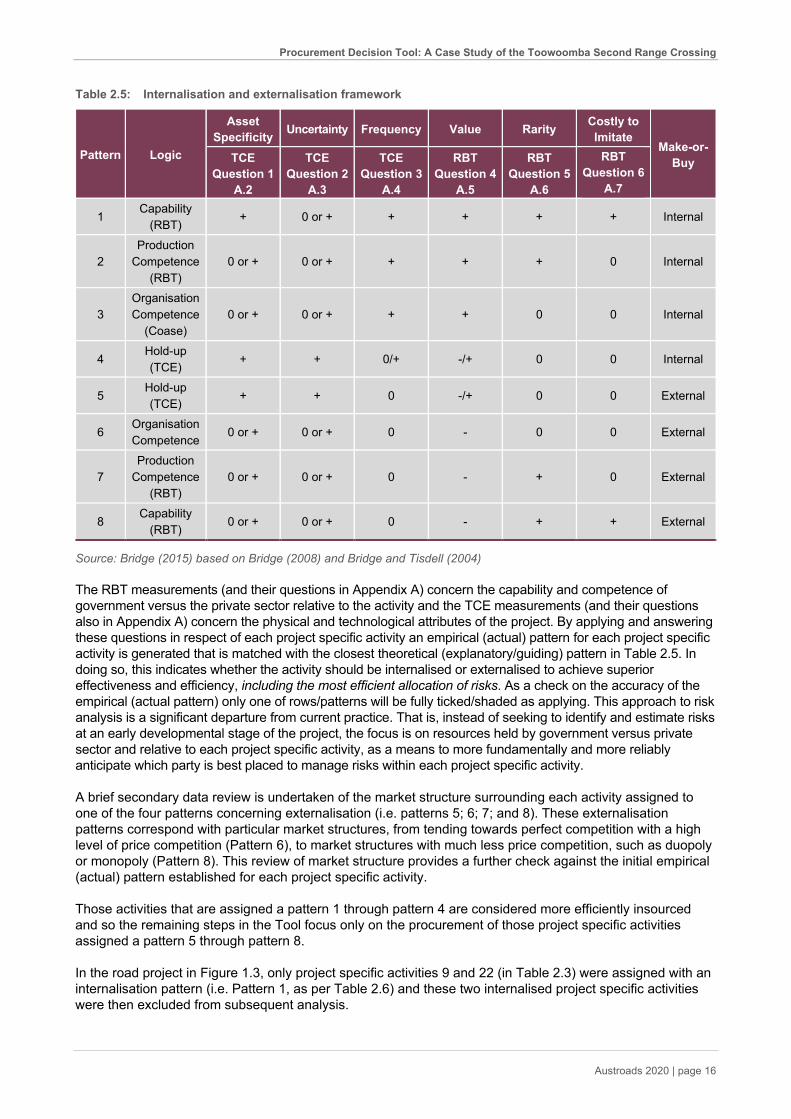
Table 2.5: Internalisation and externalisation framework
Source: Bridge (2015) based on Bridge (2008) and Bridge and Tisdell (2004)
The RBT measurements (and their questions in Appendix A) concern the capability and competence of government versus the private sector relative to the activity and the TCE measurements (and their questions also in Appendix A) concern the physical and technological attributes of the project. By applying and answering these questions in respect of each project specific activity an empirical (actual) pattern for each project specific activity is generated that is matched with the closest theoretical (explanatory/guiding) pattern in Table 2.5. In doing so, this indicates whether the activity should be internalised or externalised to achieve superior effectiveness and efficiency, including the most efficient allocation of risks. As a check on the accuracy of the empirical (actual pattern) only one of rows/patterns will be fully ticked/shaded as applying. This approach to risk analysis is a significant departure from current practice. That is, instead of seeking to identify and estimate risks at an early developmental stage of the project, the focus is on resources held by government versus private sector and relative to each project specific activity, as a means to more fundamentally and more reliably anticipate which party is best placed to manage risks within each project specific activity.
A brief secondary data review is undertaken of the market structure surrounding each activity assigned to one of the four patterns concerning externalisation (i.e. patterns 5; 6; 7; and 8). These externalisation patterns correspond with particular market structures, from tending towards perfect competition with a high level of price competition (Pattern 6), to market structures with much less price competition, such as duopoly or monopoly (Pattern 8). This review of market structure provides a further check against the initial empirical (actual) pattern established for each project specific activity.
Those activities that are assigned a pattern 1 through pattern 4 are considered more efficiently insourced and so the remaining steps in the Tool focus only on the procurement of those project specific activities assigned a pattern 5 through pattern 8.
In the road project in Figure 1.3, only project specific activities 9 and 22 (in Table 2.3) were assigned with an internalisation pattern (i.e. Pattern 1, as per Table 2.6) and these two internalised project specific activities were then excluded from subsequent analysis.
Pattern Logic
Asset Specificity Uncertainty Frequency Value Rarity Costly to
Imitate Make-or-
Buy TCE Question 1
A.2
TCE Question 2
A.3
TCE Question 3
A.4
RBT Question 4
A.5
RBT Question 5
A.6
RBT Question 6
A.7
1 Capability
(RBT) + 0 or + + + + + Internal
2 Production
Competence (RBT)
0 or + 0 or + + + + 0 Internal
3 Organisation Competence
(Coase) 0 or + 0 or + + + 0 0 Internal
4 Hold-up (TCE)
+ + 0/+ -/+ 0 0 Internal
5 Hold-up (TCE)
+ + 0 -/+ 0 0 External
6 Organisation Competence
0 or + 0 or + 0 - 0 0 External
7 Production
Competence (RBT)
0 or + 0 or + 0 - + 0 External
8 Capability
(RBT) 0 or + 0 or + 0 - + + External
Procurement Decision Tool: A Case Study of the Toowoomba Second Range Crossing
Austroads 2020 | page 17
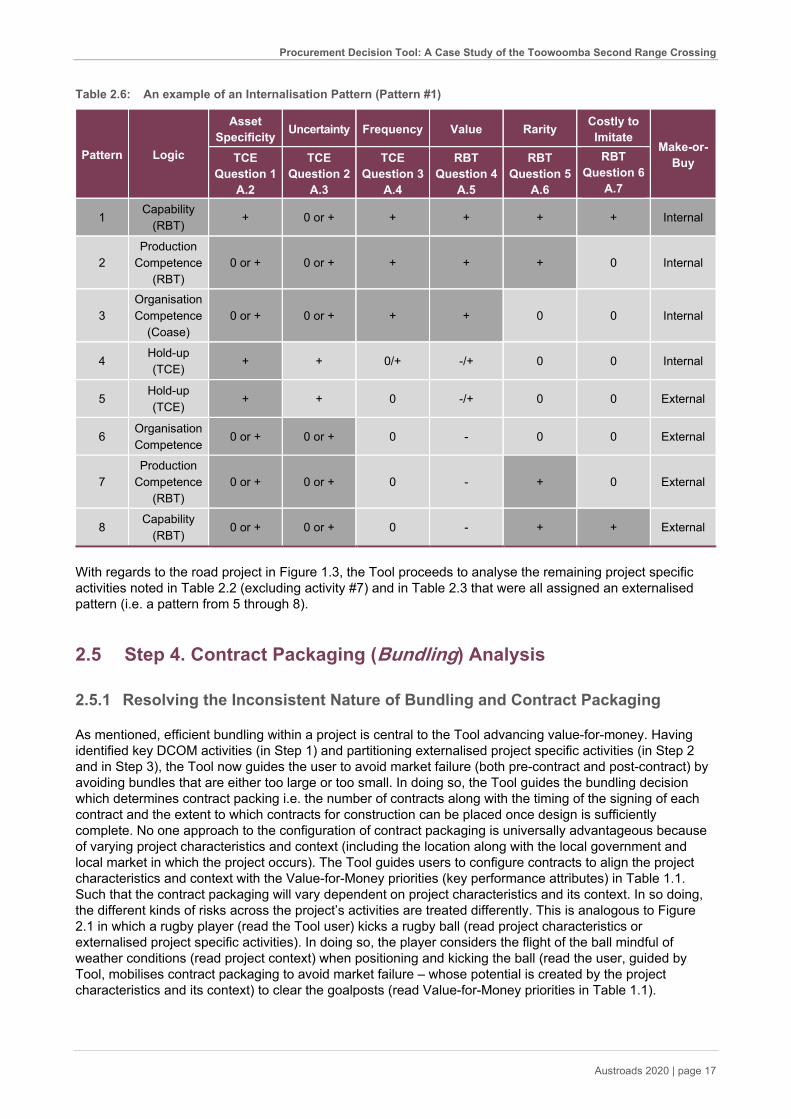
Table 2.6: An example of an Internalisation Pattern (Pattern #1)
With regards to the road project in Figure 1.3, the Tool proceeds to analyse the remaining project specific activities noted in Table 2.2 (excluding activity #7) and in Table 2.3 that were all assigned an externalised pattern (i.e. a pattern from 5 through 8).
2.5 Step 4. Contract Packaging (Bundling) Analysis
2.5.1 Resolving the Inconsistent Nature of Bundling and Contract Packaging
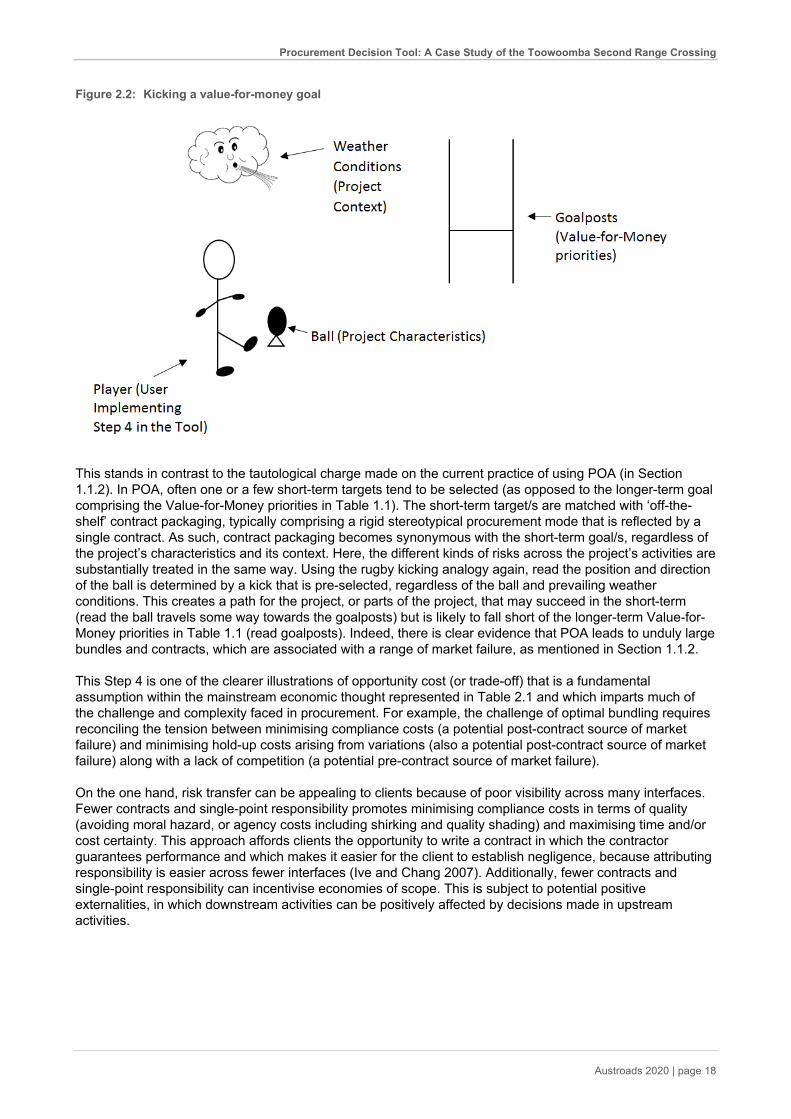
As mentioned, efficient bundling within a project is central to the Tool advancing value-for-money. Having identified key DCOM activities (in Step 1) and partitioning externalised project specific activities (in Step 2 and in Step 3), the Tool now guides the user to avoid market failure (both pre-contract and post-contract) by avoiding bundles that are either too large or too small. In doing so, the Tool guides the bundling decision which determines contract packing i.e. the number of contracts along with the timing of the signing of each contract and the extent to which contracts for construction can be placed once design is sufficiently complete. No one approach to the configuration of contract packaging is universally advantageous because of varying project characteristics and context (including the location along with the local government and local market in which the project occurs). The Tool guides users to configure contracts to align the project characteristics and context with the Value-for-Money priorities (key performance attributes) in Table 1.1. Such that the contract packaging will vary dependent on project characteristics and its context. In so doing, the different kinds of risks across the project’s activities are treated differently. This is analogous to Figure 2.1 in which a rugby player (read the Tool user) kicks a rugby ball (read project characteristics or externalised project specific activities). In doing so, the player considers the flight of the ball mindful of weather conditions (read project context) when positioning and kicking the ball (read the user, guided by Tool, mobilises contract packaging to avoid market failure – whose potential is created by the project characteristics and its context) to clear the goalposts (read Value-for-Money priorities in Table 1.1).
Pattern Logic
Asset Specificity Uncertainty Frequency Value Rarity Costly to
Imitate Make-or-
Buy TCE Question 1
A.2
TCE Question 2
A.3
TCE Question 3
A.4
RBT Question 4
A.5
RBT Question 5
A.6
RBT Question 6
A.7
1 Capability
(RBT) + 0 or + + + + + Internal
2 Production
Competence (RBT)
0 or + 0 or + + + + 0 Internal
3 Organisation Competence
(Coase) 0 or + 0 or + + + 0 0 Internal
4 Hold-up (TCE)
+ + 0/+ -/+ 0 0 Internal
5 Hold-up (TCE)
+ + 0 -/+ 0 0 External
6 Organisation Competence
0 or + 0 or + 0 - 0 0 External
7 Production
Competence (RBT)
0 or + 0 or + 0 - + 0 External
8 Capability
(RBT) 0 or + 0 or + 0 - + + External
Procurement Decision Tool: A Case Study of the Toowoomba Second Range Crossing
Austroads 2020 | page 18
Figure 2.2: Kicking a value-for-money goal
This stands in contrast to the tautological charge made on the current practice of using POA (in Section 1.1.2). In POA, often one or a few short-term targets tend to be selected (as opposed to the longer-term goal comprising the Value-for-Money priorities in Table 1.1). The short-term target/s are matched with ‘off-the-shelf’ contract packaging, typically comprising a rigid stereotypical procurement mode that is reflected by a single contract. As such, contract packaging becomes synonymous with the short-term goal/s, regardless of the project’s characteristics and its context. Here, the different kinds of risks across the project’s activities are substantially treated in the same way. Using the rugby kicking analogy again, read the position and direction of the ball is determined by a kick that is pre-selected, regardless of the ball and prevailing weather conditions. This creates a path for the project, or parts of the project, that may succeed in the short-term (read the ball travels some way towards the goalposts) but is likely to fall short of the longer-term Value-for-Money priorities in Table 1.1 (read goalposts). Indeed, there is clear evidence that POA leads to unduly large bundles and contracts, which are associated with a range of market failure, as mentioned in Section 1.1.2.
This Step 4 is one of the clearer illustrations of opportunity cost (or trade-off) that is a fundamental assumption within the mainstream economic thought represented in Table 2.1 and which imparts much of the challenge and complexity faced in procurement. For example, the challenge of optimal bundling requires reconciling the tension between minimising compliance costs (a potential post-contract source of market failure) and minimising hold-up costs arising from variations (also a potential post-contract source of market failure) along with a lack of competition (a potential pre-contract source of market failure).
On the one hand, risk transfer can be appealing to clients because of poor visibility across many interfaces. Fewer contracts and single-point responsibility promotes minimising compliance costs in terms of quality (avoiding moral hazard, or agency costs including shirking and quality shading) and maximising time and/or cost certainty. This approach affords clients the opportunity to write a contract in which the contractor guarantees performance and which makes it easier for the client to establish negligence, because attributing responsibility is easier across fewer interfaces (Ive and Chang 2007). Additionally, fewer contracts and single-point responsibility can incentivise economies of scope. This is subject to potential positive externalities, in which downstream activities can be positively affected by decisions made in upstream activities.

Procurement Decision Tool: A Case Study of the Toowoomba Second Range Crossing
Austroads 2020 | page 19
On the other hand, the benefits of fewer contracts and single point responsibility diminish (and more contracts become appealing) when the project requirements become more unpredictable that create a potential source of disturbance during the delivery of the project. Project requirements can be unpredictable because they are difficult to articulate in a project specification and/or when the external environment is laden with exogenous risk and uncertainty. With more unpredictability, more contracts are better, including more time to reduce some of the unpredictability of project requirements, which pushes back the time for the signing of contract/s. The timing of contract execution is important because of the “fundamental transformation” of bargaining power that occurs at contract execution (Williamson, 1985). That is, suppliers gain more power at contract execution as the project sees many bidders transforming into a single supplier, in a bilateral exchange with government. Suppliers can leverage this power to bargain for additional profit and/or better terms/conditions on the occurrence of a change in the works. This is known as hold-up and its likelihood increases in the presence of unpredictability.
Regardless of the unpredictability of project requirements, the virtues of fewer contracts and single point responsibility can also diminish (and, again, more contracts become appealing) when the contract representing the scope of these requirements becomes so large that it restricts the number of firms that are capable and willing to express an interest in bidding for the project. In summary, the attractiveness of fewer contracts and single point responsibility tends to diminish in the face of potential pre-contract and post-contract market failure.
The Tool resolves the tension between seeking the virtues of fewer contracts (more certainty) and pursuing the benefits of more contracts (less hold-up and more competition) by firstly focusing on activities that may be a source of pre-contract market failure (in which suppliers’ can exert their power to set high prices arising from activities with thin competition). Next, the Tool focuses on activities that may be a source of post-contract market failure (in which suppliers can behave in a negative opportunist way and hold-up government arising from activities with a high level of unpredictability). The key to the Tool achieving this, lie in it having already identified (in Step 3) different kinds (or categories) of risks associated with externalised activities. In brief, troublesome activities i.e. pattern 8 activities (thin market) and pattern 5 activities (hold-up) are treated very differently, including using more bundles/contracts, than pattern 6 and 7 activities. This allows pattern 6 and 7 activities to be procured with fewer contracts and a single point responsibility approach, as explained in the following sections.
2.5.2 Treatment of Pattern 8 Activities and Avoiding a Lack of Competition/Pre-Contract Market Failure
The tool begins this step by guiding the user to review all the project specific activities (remaining from Step 3) that are assigned a pattern 8. All the pattern 8 activities are reviewed to assess how many pattern 8 activities have occurred by virtue of the project size and the activity’s initial grouping across the scope of the project (mentioned in Step 1). Consideration is given to de-bundling each pattern 8 activity to see whether the activity would suit the next lower/smaller tier of suppliers. This would increase the pool of likely bidders and convert a pattern 8 activity into a pattern 6 or 7 activity (to be addressed in Section 2.5.4).
For each of the pattern 8 activities that cannot be de-bundled into a pattern 6 or 7 activity, then these activities are procured as a separate bundle/contract – provided there are no proximity issues associated with the activity. Where there is a proximity issue i.e. where the activity is intimately linked with another activity because of its physical location, then this activity is procured as a nominated supplier in the bundle/contract of pattern 6 and/or 7 activities associated with the proximity issue. Whether pattern 8 activities are procured separately or as a nominated supplier, this approach protects competition for bundles/contracts comprising pattern 6 and/or 7 activities. As such, this approach avoids pre-contract market failure and supports Key Performance Priority #3 (minimum capital cost and minimum lifecycle cost), which supports Key Performance Priority #1 (noted in Table 1.1).
Additionally, the contract terms with pattern 8 suppliers (whether procured separately or as a nominated supplier) are very different to those contractual terms with pattern 6 and/or 7 suppliers. This is explained in the Step 5.
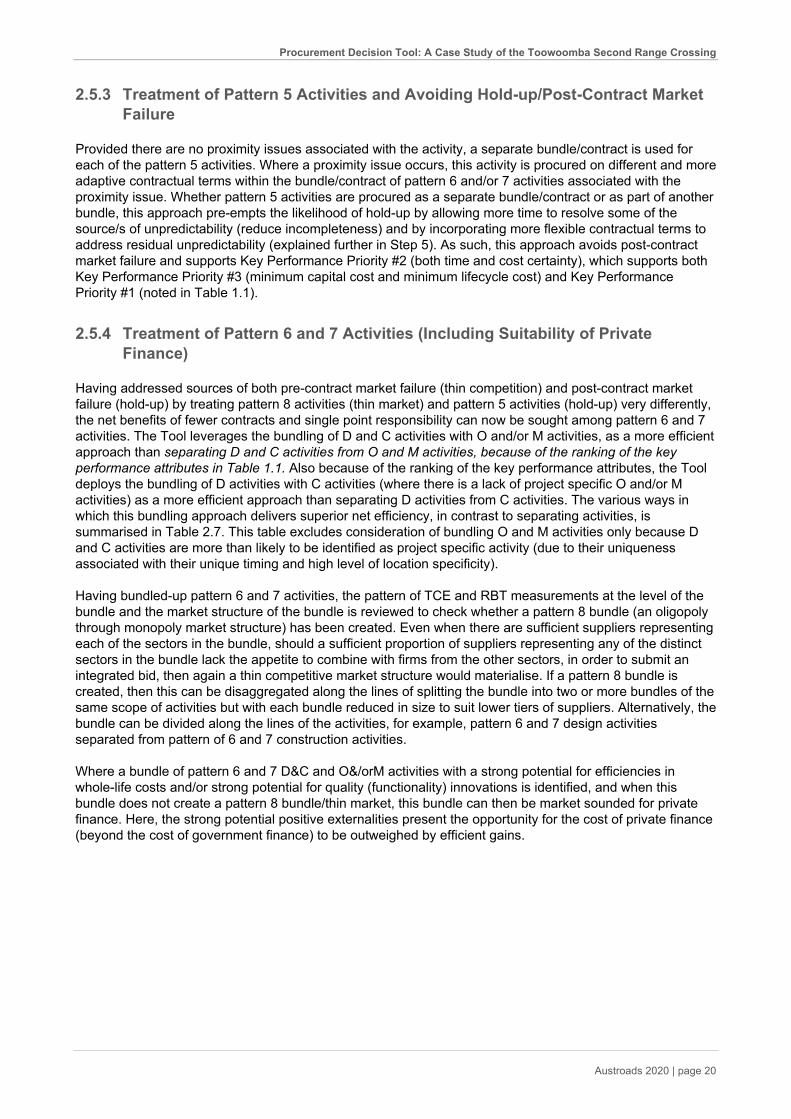
Procurement Decision Tool: A Case Study of the Toowoomba Second Range Crossing
Austroads 2020 | page 20
2.5.3 Treatment of Pattern 5 Activities and Avoiding Hold-up/Post-Contract Market Failure
Provided there are no proximity issues associated with the activity, a separate bundle/contract is used for each of the pattern 5 activities. Where a proximity issue occurs, this activity is procured on different and more adaptive contractual terms within the bundle/contract of pattern 6 and/or 7 activities associated with the proximity issue. Whether pattern 5 activities are procured as a separate bundle/contract or as part of another bundle, this approach pre-empts the likelihood of hold-up by allowing more time to resolve some of the source/s of unpredictability (reduce incompleteness) and by incorporating more flexible contractual terms to address residual unpredictability (explained further in Step 5). As such, this approach avoids post-contract market failure and supports Key Performance Priority #2 (both time and cost certainty), which supports both Key Performance Priority #3 (minimum capital cost and minimum lifecycle cost) and Key Performance Priority #1 (noted in Table 1.1).
2.5.4 Treatment of Pattern 6 and 7 Activities (Including Suitability of Private Finance)
Having addressed sources of both pre-contract market failure (thin competition) and post-contract market failure (hold-up) by treating pattern 8 activities (thin market) and pattern 5 activities (hold-up) very differently, the net benefits of fewer contracts and single point responsibility can now be sought among pattern 6 and 7 activities. The Tool leverages the bundling of D and C activities with O and/or M activities, as a more efficient approach than separating D and C activities from O and M activities, because of the ranking of the key performance attributes in Table 1.1. Also because of the ranking of the key performance attributes, the Tool deploys the bundling of D activities with C activities (where there is a lack of project specific O and/or M activities) as a more efficient approach than separating D activities from C activities. The various ways in which this bundling approach delivers superior net efficiency, in contrast to separating activities, is summarised in Table 2.7. This table excludes consideration of bundling O and M activities only because D and C activities are more than likely to be identified as project specific activity (due to their uniqueness associated with their unique timing and high level of location specificity).
Having bundled-up pattern 6 and 7 activities, the pattern of TCE and RBT measurements at the level of the bundle and the market structure of the bundle is reviewed to check whether a pattern 8 bundle (an oligopoly through monopoly market structure) has been created. Even when there are sufficient suppliers representing each of the sectors in the bundle, should a sufficient proportion of suppliers representing any of the distinct sectors in the bundle lack the appetite to combine with firms from the other sectors, in order to submit an integrated bid, then again a thin competitive market structure would materialise. If a pattern 8 bundle is created, then this can be disaggregated along the lines of splitting the bundle into two or more bundles of the same scope of activities but with each bundle reduced in size to suit lower tiers of suppliers. Alternatively, the bundle can be divided along the lines of the activities, for example, pattern 6 and 7 design activities separated from pattern of 6 and 7 construction activities.
Where a bundle of pattern 6 and 7 D&C and O&/orM activities with a strong potential for efficiencies in whole-life costs and/or strong potential for quality (functionality) innovations is identified, and when this bundle does not create a pattern 8 bundle/thin market, this bundle can then be market sounded for private finance. Here, the strong potential positive externalities present the opportunity for the cost of private finance (beyond the cost of government finance) to be outweighed by efficient gains.
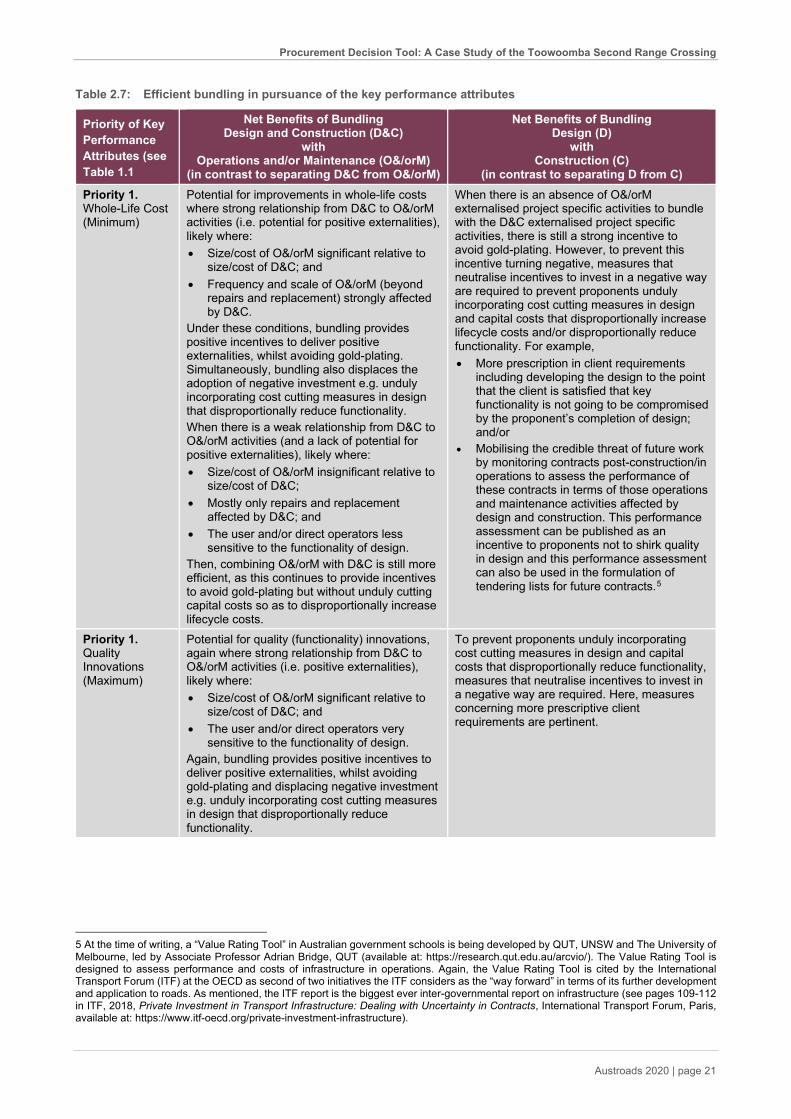
Procurement Decision Tool: A Case Study of the Toowoomba Second Range Crossing
Austroads 2020 | page 21
Table 2.7: Efficient bundling in pursuance of the key performance attributes
Priority of Key Performance Attributes (see Table 1.1)
Net Benefits of Bundling Design and Construction (D&C)
with Operations and/or Maintenance (O&/orM)
(in contrast to separating D&C from O&/orM)
Net Benefits of Bundling Design (D)
with Construction (C)
(in contrast to separating D from C) Priority 1. Whole-Life Cost (Minimum)
Potential for improvements in whole-life costs where strong relationship from D&C to O&/orM activities (i.e. potential for positive externalities), likely where: • Size/cost of O&/orM significant relative to
size/cost of D&C; and • Frequency and scale of O&/orM (beyond
repairs and replacement) strongly affected by D&C.
Under these conditions, bundling provides positive incentives to deliver positive externalities, whilst avoiding gold-plating. Simultaneously, bundling also displaces the adoption of negative investment e.g. unduly incorporating cost cutting measures in design that disproportionally reduce functionality. When there is a weak relationship from D&C to O&/orM activities (and a lack of potential for positive externalities), likely where: • Size/cost of O&/orM insignificant relative to
size/cost of D&C; • Mostly only repairs and replacement
affected by D&C; and • The user and/or direct operators less
sensitive to the functionality of design. Then, combining O&/orM with D&C is still more efficient, as this continues to provide incentives to avoid gold-plating but without unduly cutting capital costs so as to disproportionally increase lifecycle costs.
When there is an absence of O&/orM externalised project specific activities to bundle with the D&C externalised project specific activities, there is still a strong incentive to avoid gold-plating. However, to prevent this incentive turning negative, measures that neutralise incentives to invest in a negative way are required to prevent proponents unduly incorporating cost cutting measures in design and capital costs that disproportionally increase lifecycle costs and/or disproportionally reduce functionality. For example, • More prescription in client requirements
including developing the design to the point that the client is satisfied that key functionality is not going to be compromised by the proponent’s completion of design; and/or
• Mobilising the credible threat of future work by monitoring contracts post-construction/in operations to assess the performance of these contracts in terms of those operations and maintenance activities affected by design and construction. This performance assessment can be published as an incentive to proponents not to shirk quality in design and this performance assessment can also be used in the formulation of tendering lists for future contracts.5
Priority 1. Quality Innovations (Maximum)
Potential for quality (functionality) innovations, again where strong relationship from D&C to O&/orM activities (i.e. positive externalities), likely where: • Size/cost of O&/orM significant relative to
size/cost of D&C; and • The user and/or direct operators very
sensitive to the functionality of design. Again, bundling provides positive incentives to deliver positive externalities, whilst avoiding gold-plating and displacing negative investment e.g. unduly incorporating cost cutting measures in design that disproportionally reduce functionality.
To prevent proponents unduly incorporating cost cutting measures in design and capital costs that disproportionally reduce functionality, measures that neutralise incentives to invest in a negative way are required. Here, measures concerning more prescriptive client requirements are pertinent.
5 At the time of writing, a “Value Rating Tool” in Australian government schools is being developed by QUT, UNSW and The University of Melbourne, led by Associate Professor Adrian Bridge, QUT (available at: https://research.qut.edu.au/arcvio/). The Value Rating Tool is designed to assess performance and costs of infrastructure in operations. Again, the Value Rating Tool is cited by the International Transport Forum (ITF) at the OECD as second of two initiatives the ITF considers as the “way forward” in terms of its further development and application to roads. As mentioned, the ITF report is the biggest ever inter-governmental report on infrastructure (see pages 109-112 in ITF, 2018, Private Investment in Transport Infrastructure: Dealing with Uncertainty in Contracts, International Transport Forum, Paris, available at: https://www.itf-oecd.org/private-investment-infrastructure).
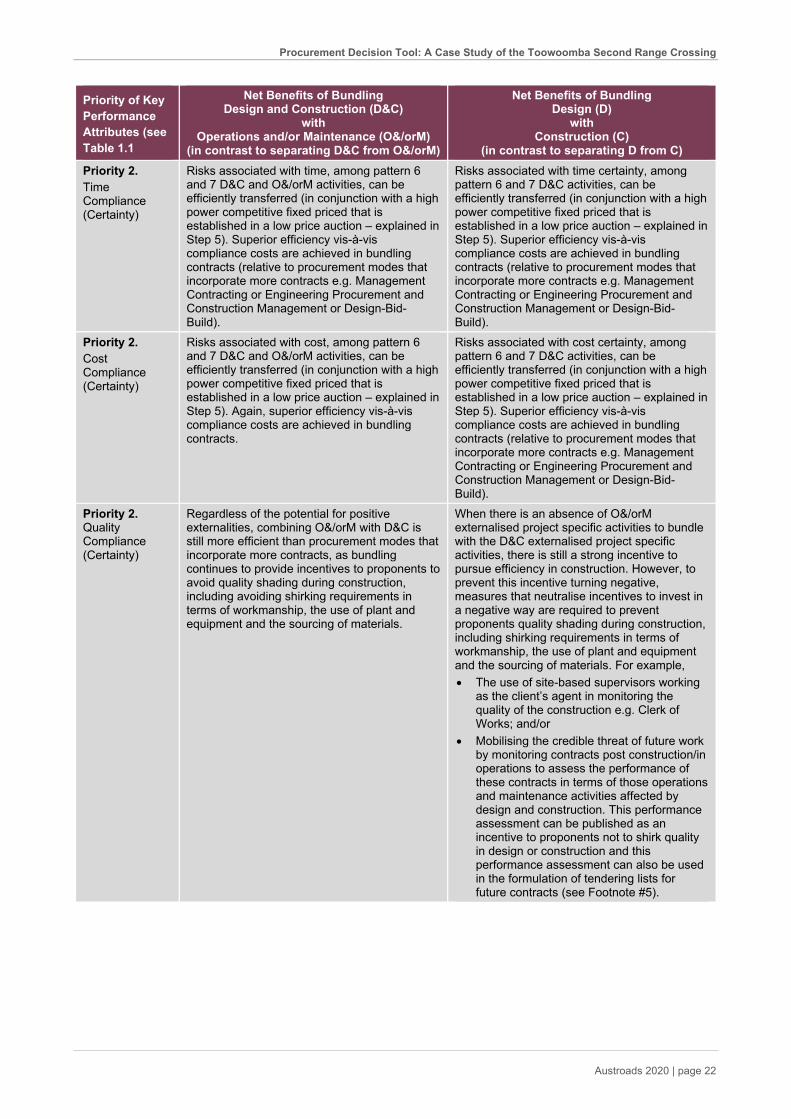
Procurement Decision Tool: A Case Study of the Toowoomba Second Range Crossing
Austroads 2020 | page 22
Priority of Key Performance Attributes (see Table 1.1)
Net Benefits of Bundling Design and Construction (D&C)
with Operations and/or Maintenance (O&/orM)
(in contrast to separating D&C from O&/orM)
Net Benefits of Bundling Design (D)
with Construction (C)
(in contrast to separating D from C) Priority 2. Time Compliance (Certainty)
Risks associated with time, among pattern 6 and 7 D&C and O&/orM activities, can be efficiently transferred (in conjunction with a high power competitive fixed priced that is established in a low price auction – explained in Step 5). Superior efficiency vis-à-vis compliance costs are achieved in bundling contracts (relative to procurement modes that incorporate more contracts e.g. Management Contracting or Engineering Procurement and Construction Management or Design-Bid-Build).
Risks associated with time certainty, among pattern 6 and 7 D&C activities, can be efficiently transferred (in conjunction with a high power competitive fixed priced that is established in a low price auction – explained in Step 5). Superior efficiency vis-à-vis compliance costs are achieved in bundling contracts (relative to procurement modes that incorporate more contracts e.g. Management Contracting or Engineering Procurement and Construction Management or Design-Bid-Build).
Priority 2. Cost Compliance (Certainty)
Risks associated with cost, among pattern 6 and 7 D&C and O&/orM activities, can be efficiently transferred (in conjunction with a high power competitive fixed priced that is established in a low price auction – explained in Step 5). Again, superior efficiency vis-à-vis compliance costs are achieved in bundling contracts.
Risks associated with cost certainty, among pattern 6 and 7 D&C activities, can be efficiently transferred (in conjunction with a high power competitive fixed priced that is established in a low price auction – explained in Step 5). Superior efficiency vis-à-vis compliance costs are achieved in bundling contracts (relative to procurement modes that incorporate more contracts e.g. Management Contracting or Engineering Procurement and Construction Management or Design-Bid-Build).
Priority 2. Quality Compliance (Certainty)
Regardless of the potential for positive externalities, combining O&/orM with D&C is still more efficient than procurement modes that incorporate more contracts, as bundling continues to provide incentives to proponents to avoid quality shading during construction, including avoiding shirking requirements in terms of workmanship, the use of plant and equipment and the sourcing of materials.
When there is an absence of O&/orM externalised project specific activities to bundle with the D&C externalised project specific activities, there is still a strong incentive to pursue efficiency in construction. However, to prevent this incentive turning negative, measures that neutralise incentives to invest in a negative way are required to prevent proponents quality shading during construction, including shirking requirements in terms of workmanship, the use of plant and equipment and the sourcing of materials. For example, • The use of site-based supervisors working
as the client’s agent in monitoring the quality of the construction e.g. Clerk of Works; and/or
• Mobilising the credible threat of future work by monitoring contracts post construction/in operations to assess the performance of these contracts in terms of those operations and maintenance activities affected by design and construction. This performance assessment can be published as an incentive to proponents not to shirk quality in design or construction and this performance assessment can also be used in the formulation of tendering lists for future contracts (see Footnote #5).
Procurement Decision Tool: A Case Study of the Toowoomba Second Range Crossing
Austroads 2020 | page 23
Priority of Key Performance Attributes (see Table 1.1)
Net Benefits of Bundling Design and Construction (D&C)
with Operations and/or Maintenance (O&/orM)
(in contrast to separating D&C from O&/orM)
Net Benefits of Bundling Design (D)
with Construction (C)
(in contrast to separating D from C) Priority 3. Capital Cost (Minimum)
Bundling D&C with O&/orM provides incentives to balance capital costs and lifecycle costs in pursuance of minimising whole-life costs (Priority 1). As such, this is unlikely to lead to the minimisation of either capital costs or lifecycle costs. Aggregating capital costs and lifecycle costs to minimise whole-life costs (in conjunction with a high power competitive fixed priced that is established in a low price auction – explained in Step 5) still creates incentives to avoid gold-plating and constrains capital costs and lifecycle costs.
When there is an absence of O&/orM externalised project specific activities to bundle with the D&C externalised project specific activities, there is a strong incentive to avoid gold-plating and minimise capital costs. However, to prevent this incentive turning negative, measures that neutralise incentives to invest in a negative way are required to prevent proponents unduly incorporating cost cutting measures in design and capital costs that disproportionally increase lifecycle costs and/or disproportionally reduce functionality. For example, more prescription in client requirements, and/or mobilising the credible threat of future work – as per Priority 1 (see above).
Priority 3. Lifecycle Cost (Minimum)
See above Priority 3. Minimising Capital Cost When there is an absence of O&/orM externalised project specific activities to bundle with the D&C externalised project specific activities, there is a strong incentive to avoid gold-plating and minimise capital costs. However, to prevent this incentive turning negative, measures that neutralise incentives to invest in a negative way are required to prevent proponents unduly incorporating cost cutting measures in design and capital costs that disproportionally increase lifecycle costs. Again, for example, more prescription in client requirements including performance specifying the life of elements and components.
Priority 3. Start/Finish Time (Minimum)
Bundling D&C with O&/orM does not represent the quickest approach to starting/finishing construction works. This is because time will be required to fully develop at least the client’s performance requirements and time will be needed for proponents to develop their outline design in order to submit their fixed price tender, before construction can commence. In contrast, there could be more contracts for construction that could be placed as soon as design for the relevant construction is completed e.g.as in Management Contracting or the Engineering Procurement and Construction Management approach. That said, bundling D&C with O&/orM is quicker than having one substantial contract for design and separating all design from construction, e.g. as in Design-Bid-Build. There is also compliance and cost related benefits arising from the client committing to developing their long-term performance requirements as fully as possible. For example, there becomes more time to attempt to resolve some of the unpredictability creating any pattern 5 activities. This may see the conversion of some of the pattern 5 activities into pattern 6 activities. This improves cost and time certainty (Priority 2), as well as reducing capital costs (Priority 3).
Bundling D with C does not represent the quickest approach to starting/finishing construction works. However, bundling D with C is quicker than having one substantial contract for design and separating all design from construction, e.g. as in Design-Bid-Build (see left Priority 3. Minimising Start/Finish Time).
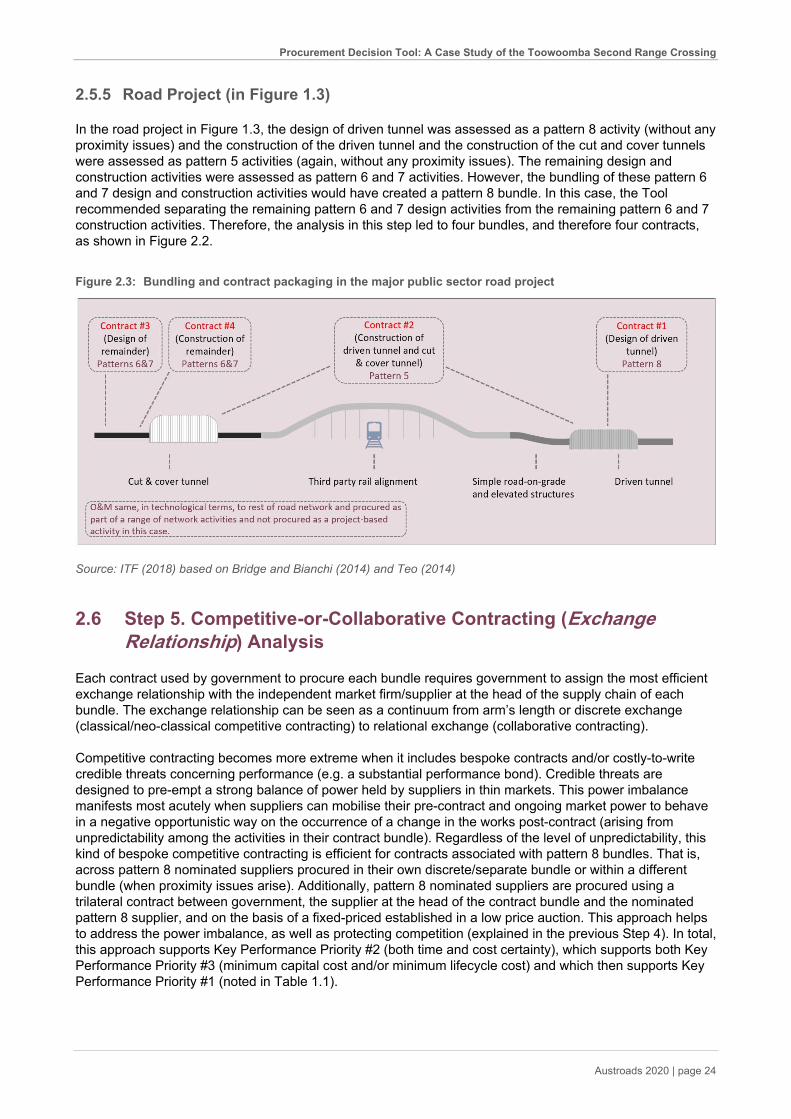
Procurement Decision Tool: A Case Study of the Toowoomba Second Range Crossing
Austroads 2020 | page 24
2.5.5 Road Project (in Figure 1.3)
In the road project in Figure 1.3, the design of driven tunnel was assessed as a pattern 8 activity (without any proximity issues) and the construction of the driven tunnel and the construction of the cut and cover tunnels were assessed as pattern 5 activities (again, without any proximity issues). The remaining design and construction activities were assessed as pattern 6 and 7 activities. However, the bundling of these pattern 6 and 7 design and construction activities would have created a pattern 8 bundle. In this case, the Tool recommended separating the remaining pattern 6 and 7 design activities from the remaining pattern 6 and 7 construction activities. Therefore, the analysis in this step led to four bundles, and therefore four contracts, as shown in Figure 2.2.
Figure 2.3: Bundling and contract packaging in the major public sector road project
Source: ITF (2018) based on Bridge and Bianchi (2014) and Teo (2014)
2.6 Step 5. Competitive-or-Collaborative Contracting (Exchange Relationship) Analysis
Each contract used by government to procure each bundle requires government to assign the most efficient exchange relationship with the independent market firm/supplier at the head of the supply chain of each bundle. The exchange relationship can be seen as a continuum from arm’s length or discrete exchange (classical/neo-classical competitive contracting) to relational exchange (collaborative contracting).
Competitive contracting becomes more extreme when it includes bespoke contracts and/or costly-to-write credible threats concerning performance (e.g. a substantial performance bond). Credible threats are designed to pre-empt a strong balance of power held by suppliers in thin markets. This power imbalance manifests most acutely when suppliers can mobilise their pre-contract and ongoing market power to behave in a negative opportunistic way on the occurrence of a change in the works post-contract (arising from unpredictability among the activities in their contract bundle). Regardless of the level of unpredictability, this kind of bespoke competitive contracting is efficient for contracts associated with pattern 8 bundles. That is, across pattern 8 nominated suppliers procured in their own discrete/separate bundle or within a different bundle (when proximity issues arise). Additionally, pattern 8 nominated suppliers are procured using a trilateral contract between government, the supplier at the head of the contract bundle and the nominated pattern 8 supplier, and on the basis of a fixed-priced established in a low price auction. This approach helps to address the power imbalance, as well as protecting competition (explained in the previous Step 4). In total, this approach supports Key Performance Priority #2 (both time and cost certainty), which supports both Key Performance Priority #3 (minimum capital cost and/or minimum lifecycle cost) and which then supports Key Performance Priority #1 (noted in Table 1.1).

Procurement Decision Tool: A Case Study of the Toowoomba Second Range Crossing
Austroads 2020 | page 25
At the other extreme of the exchange relationship continuum, collaborative contracting includes credible commitments, e.g. sharing contractual pains and gains associated with a negotiated budget, and which represent contractual adaptive mechanisms. Again, these adaptive mechanisms are designed to pre-empt suppliers leveraging their balance of power post-contract and behaving in a negative opportunistic way on the occurrence of a change in the works post-contract, arising from unpredictability among the activities in their contract bundle. This kind of collaborative contracting is efficient for contracts associated with pattern 5 bundles. That is, across pattern 5 suppliers procured in their own discrete/separate bundle or within a different bundle (when proximity issues arise).
Pattern 5 suppliers are procured using a payment mechanism in which risks are shared e.g. target pricing/pain-gain share regimes or a cost-plus a fee. This approach also supports Key Performance Priority #2 (both time and cost certainty), which supports both Key Performance Priority #3 (minimum capital cost and/or minimum lifecycle cost) and which then supports Key Performance Priority #1 (noted in Table 1.1).
Neo-classical competitive contracting is located between the extremes of competitive contracting (using bespoke contracts to engage suppliers in thin markets) and collaborative contracting. Neo-classical competitive contracting exhibits much more standardisation in contractual terms and with much less reliance on credible threats (other than those safeguarding mechanisms in standard contracts e.g. liquidated and ascertained damages and recourse to third party dispute resolution) along with much less reliance on credible commitments. Instead, this more moderate form of standard competitive contracting relies much more on the clear allocation of risk and responsibility among the parties to the contract. Standard competitive contracting is efficient for contracts associated with pattern 6 and/or 7 bundles. Pattern 6 and 7 suppliers are procured using a payment mechanism in which risks are clearly allocated and on the basis of a fixed-priced established in a low price auction. Again, this approach supports Key Performance Priority #2 (both time and cost certainty), which supports both Key Performance Priority #3 (minimum capital cost and/or minimum lifecycle cost) and which then supports Key Performance Priority #1 (noted in Table 1.1).
Exploring the exchange relationship continuum further, we can also see those bundles that comprise activities that are substantially predictable and, therefore, pattern 6 or 7 activity bundles, but which include a significant component of unpredictability. For example, labour and plant/equipment involved in an activity can be predictable, in proportion to the quantity of materials used, but the quantity of materials to be used can be unpredictable. In this case, standard competitive contracting is efficient when incorporating an adapting mechanism such as a schedule of rates in relation to work whose final in-place quantity is re-measured on completion. Such that the suppliers are allocated risks associated with labour, plant/equipment and the unit cost of materials, and the government assume the risks of the number of units of the material concerned. Therefore, this kind of pattern 6 and/or 7 bundle lay closer to stereotypical standard competitive contracting than collaborative contracting, as risks are allocated and the adaptive mechanism (scheduled of rates) falls short of a credible commitment/risk sharing mechanism. As such, this kind of pattern 6 and/or 7 bundle is still procured using a payment mechanism in which risks are clearly allocated and on the basis of fixed unit prices established in a low price auction. Once again, this approach supports Key Performance Priority #2 (both time and cost certainty), which supports both Key Performance Priority #3 (minimum capital cost and/or minimum lifecycle cost) and which then supports Key Performance Priority #1 (noted in Table 1.1).
The assignment of the most efficient exchange relationship in the contract with the supplier of each bundle, in terms of the exchange continuum from collaborating contracting, through standard competitive contracting, and through to bespoke competitive contracting is summarised in Table 2.8.
Having guided the user to identify the efficient position on the exchange relationship continuum, the Tool broadly addresses the remaining task of crafting the details, or contract terms, of the exchange relationship. The Tool does this by reference to Principal-Agent Theory (PAT). Eisenhardt (1989) recommends that PAT be adopted to investigate the problems inherent in a principal-agent relationship once a governance structure is established. In the context of the procurement decision, this governance structure is represented by the steps in the Tool including this step, which has guided the user to identify the most efficient exchange relationship and kind of contracting, be that competitive or collaborative contracting.
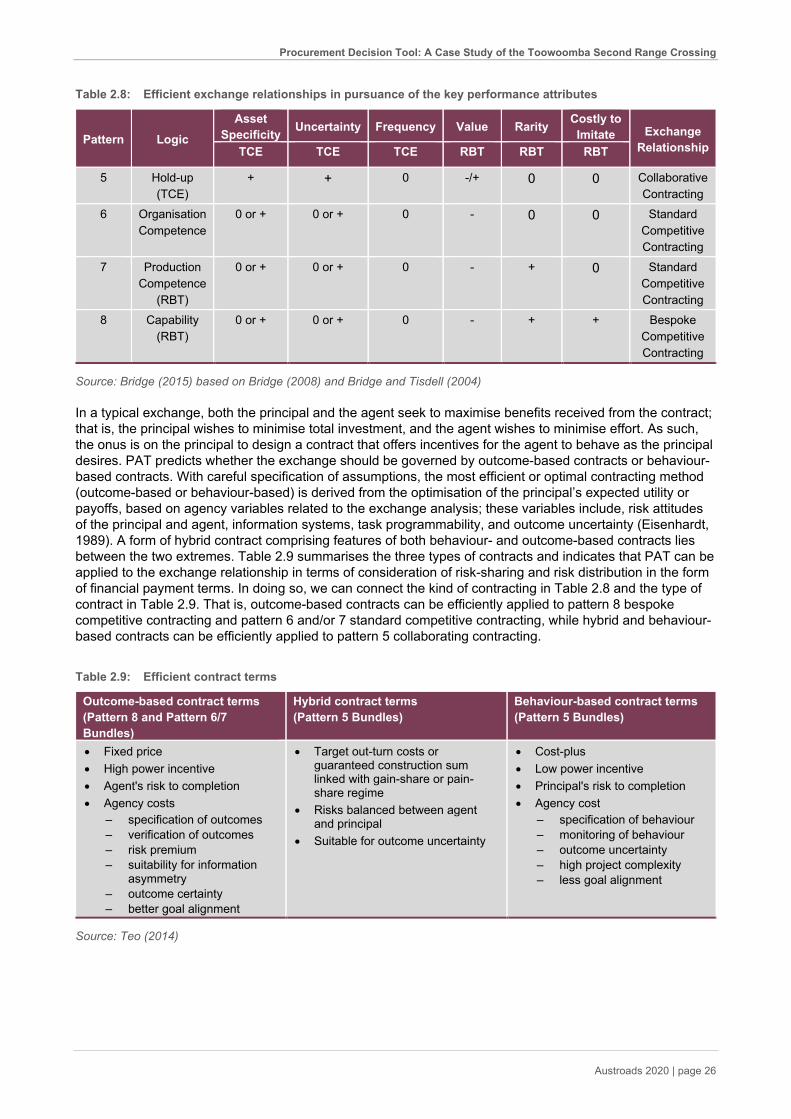
Procurement Decision Tool: A Case Study of the Toowoomba Second Range Crossing
Austroads 2020 | page 26
Table 2.8: Efficient exchange relationships in pursuance of the key performance attributes
Pattern Logic Asset
Specificity Uncertainty Frequency Value Rarity Costly to Imitate Exchange
Relationship TCE TCE TCE RBT RBT RBT
5 Hold-up (TCE)
+ + 0 -/+ 0 0 Collaborative Contracting
6 Organisation Competence
0 or + 0 or +
0 - 0 0 Standard Competitive Contracting
7 Production Competence
(RBT)
0 or + 0 or + 0 - + 0 Standard Competitive Contracting
8 Capability (RBT)
0 or + 0 or + 0 - + + Bespoke Competitive Contracting
Source: Bridge (2015) based on Bridge (2008) and Bridge and Tisdell (2004)
In a typical exchange, both the principal and the agent seek to maximise benefits received from the contract; that is, the principal wishes to minimise total investment, and the agent wishes to minimise effort. As such, the onus is on the principal to design a contract that offers incentives for the agent to behave as the principal desires. PAT predicts whether the exchange should be governed by outcome-based contracts or behaviour-based contracts. With careful specification of assumptions, the most efficient or optimal contracting method (outcome-based or behaviour-based) is derived from the optimisation of the principal’s expected utility or payoffs, based on agency variables related to the exchange analysis; these variables include, risk attitudes of the principal and agent, information systems, task programmability, and outcome uncertainty (Eisenhardt, 1989). A form of hybrid contract comprising features of both behaviour- and outcome-based contracts lies between the two extremes. Table 2.9 summarises the three types of contracts and indicates that PAT can be applied to the exchange relationship in terms of consideration of risk-sharing and risk distribution in the form of financial payment terms. In doing so, we can connect the kind of contracting in Table 2.8 and the type of contract in Table 2.9. That is, outcome-based contracts can be efficiently applied to pattern 8 bespoke competitive contracting and pattern 6 and/or 7 standard competitive contracting, while hybrid and behaviour-based contracts can be efficiently applied to pattern 5 collaborating contracting.
Table 2.9: Efficient contract terms
Outcome-based contract terms (Pattern 8 and Pattern 6/7 Bundles)
Hybrid contract terms (Pattern 5 Bundles)
Behaviour-based contract terms (Pattern 5 Bundles)
• Fixed price • High power incentive • Agent's risk to completion • Agency costs
– specification of outcomes – verification of outcomes – risk premium – suitability for information
asymmetry – outcome certainty – better goal alignment
• Target out-turn costs or guaranteed construction sum linked with gain-share or pain-share regime
• Risks balanced between agent and principal
• Suitable for outcome uncertainty
• Cost-plus • Low power incentive • Principal's risk to completion • Agency cost
– specification of behaviour – monitoring of behaviour – outcome uncertainty – high project complexity – less goal alignment
Source: Teo (2014)
Procurement Decision Tool: A Case Study of the Toowoomba Second Range Crossing
Austroads 2020 | page 27
In the road project in Figure 1.3, Contract #1 (design of driven tunnel) had a high incidence of all RBT measurements and high incidence of the TCE Asset Specificity and Uncertainty measurements (though low incidence of TCE’s Frequency measurement). Here then, while hold-up is a concern, the very high incidence of RBT’s Rare and Costly to Imitate measurements meant that the government had little choice (from the viewpoint of production) but to contract with the market. The Tool recommended bespoke competitive contracting (associated with this pattern 8 bundle) in conjunction with credible threats to incentivise performance. The TCE measurements and hold-up was also assessed as high in Contract #2 (construction of tunnels). This time, however, the RBT measurements were assessed as low and so government could have collaborated with the market and, therefore, the Tool recommended a relational exchange and collaborative contracting. Finally, the Tool assessed the TCE and RBT in contracts #3 (design of the remaining works) and #4 (construction of the remaining works) as lacking potential for pre-contact or post-contract market failure. Therefore, standard competitive contracting in conjunction with a fixed price payment mechanism, established in a low price auction, was deemed efficient.
2.7 Validation and Discussion
This research report presents the case study application and validation of the Tool (in review mode) on a major road, namely, the TSRC, Queensland, Australia. In order to validate the outcomes of the Tool, where these match or mismatch the actual approach to procuring TSRC, an assessment of Value-for-Money achievable by the actual approach versus the approach recommended by the Tool is required. Direct attempts to assess Value-for-Money, either by attempting to ascertain actual costs and benefits or by attempting to estimate costs and benefits, are problematic. This is due to the intractability of data, particularly with respect to surfacing and measuring costs and benefits in the operations and maintenance stage of built infrastructure. This is because costs are whole-life and include both internal and external transaction costs that are much less observable than production costs (comprising finance, design, construction, operations and maintenance costs). Meanwhile, benefits relate largely to the effects of the built infrastructure on the core activity and this can be difficult to objectively isolate and evaluate (KPMG and University College London, 2010; National Audit Office, 2011). The Public Sector Comparator (PSC) used to assess PPP bids is an example of the problems of attempting to directly estimate Value-for-Money. There is substantial controversy surrounding the veracity of the PSC that attempts to directly estimate the Net Present Value (NPV) of a project delivered via traditional government finance (based on a reference design) in order to compare it to the NPV of a number of PPP bids (Winch and Schmidt, 2016). Therefore, an alternative indirect approach to assessing Value-for-Money is more readily reliable. For an indirect approach to also be a valid approach, the indicator of Value-for-Money needs to meet the following criteria:
1. Established at early stage and close to the point in time just after the procurement decision has been made (timing criterion);
2. Avoids any charge of tautology (when cause and effect are measured in same terms) i.e. the Value-for-Money indicator (read effect) needs to be distinctly different to the key parameters in the Tool, which comprise the patterns in Step 3 of the Tool (read cause) (non-tautology criterion); and
3. Capture the potential for high bid prices, or pre-contract market failure, and the potential for hold-up, or post-contract market failure (market failure criterion).
Procurement Decision Tool: A Case Study of the Toowoomba Second Range Crossing
Austroads 2020 | page 28
Teo and Bridge (2017) identify Expressions of Interest (EOI), as meeting all three criteria, and because EOI are the equivalent of open tender bids, EOI reflect the extent to which the market is attracted by the project whilst not affected by any subjective filtering by government including the process of shortlisting bidding firms. Regarding the timing criterion, EOI are established at an early stage and, critically, very close to the point in time following the procurement decision. Consequently EOI are not affected by any sub-optimal microeconomic decision-making post the procurement decision. In terms of the non-tautological criterion, EOI avoids a charge of tautology. That is, EOI are distinctly different to any of the parameters in the Tool, and EOI are established externally to these parameters i.e. independent of any interference by the Tool’s user in developing the patterns in Step 3 of the Tool. Regarding the market failure criterion, high EOI (over 8 EOI) has been empirically shown in extensive studies in both the civil and building sectors to yield little production improvement in terms of lower prices and inferred incentives for design innovations (Gupta, 2002; Skitmore, 2002). At the same time, high EOI can indicate the prospect of market failure post-contract, with the market signalling that it is seeing potential to make gains from variations by behaving in a negative opportunistic way (Williamson, 1985). On the other hand, low EOI (4 or less) is not sufficient to avoid oligopoly pricing constraints, which results in ineffective competition and market failure pre-contract (Beattie, Goodacre, and Fearnley, 2003; Selten, 1973). For these reasons, 5-8 (inclusive) EOI is derived as optimal competition and both a reliable and valid indicator of Value-for-Money.
Teo and Bridge (2017) also develop a hypothesis, using EOI, to test and validate the outcomes of the Tool, where these match or mismatch the actual procurement approach, as follows:
Actual competition is expected to be within the optimum range of competition, i.e. 5 to 8 EOI inclusive, in cases where actual procurement substantially matches the procurement strategy recommended by the Tool; and actual competition is expected to be outside the optimum range of competition i.e. 4 or less EOI, or 9 or more EOI, in cases where actual procurement substantially mismatches the procurement strategy recommended by the Tool.
With regards to the application of the Tool to the major road project in Figure 1.3 that is summarised in the above five steps, it is clear the Tool’s recommended procurement approach substantially mismatched the actual approach (which was a single alliance contract). This outcome supports the above hypothesis since actual competition (two EOI) is outside the optimum range of competition (i.e. 4 or less EOI or 9 or more EOI). Therefore, the outcome of the Tool in the case of the road in Figure 1.3 is validated. Moreover, the Tool’s recommended approach would have likely seen EOI increase towards the optimum 5-8 EOI. As mentioned, the Tool’s recommended approach would have likely been appreciably more efficient than the actual approach selected because around 50 percent of this road comprised relatively straightforward on-grade road and elevated structures. The scale of this more straightforward work (that was not a source of any exogenous risk) would have suited local Tier 2 or Tier 3 civil engineering construction firms. Since there were many more of these smaller contractors (than Tier 1 contractors, including the Tier 1 contractor that led the alliance in this case study) there would have likely been much more competition and a much greater downward pressure on a significant proportion of the price of the project. In brief, rolling-up all the project risks and treating them as if they were all a source of exogenous risk is deemed inefficient in this case.
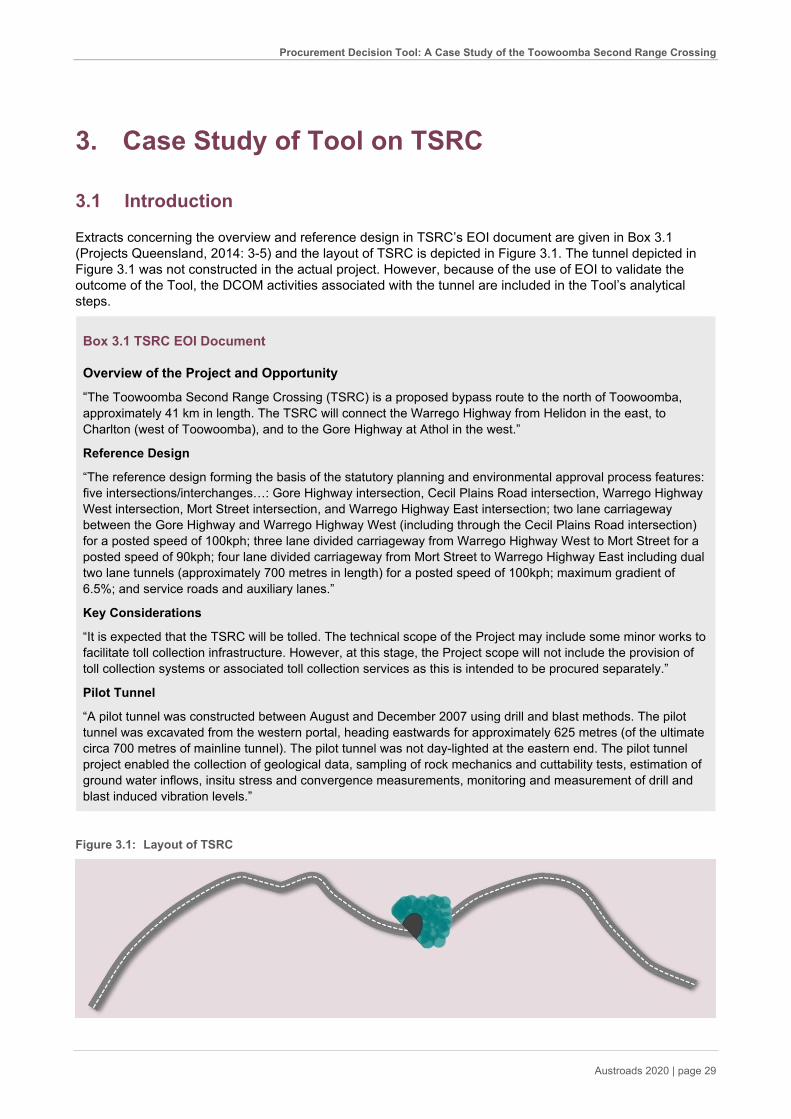
Procurement Decision Tool: A Case Study of the Toowoomba Second Range Crossing
Austroads 2020 | page 29
3. Case Study of Tool on TSRC
3.1 Introduction
Extracts concerning the overview and reference design in TSRC’s EOI document are given in Box 3.1 (Projects Queensland, 2014: 3-5) and the layout of TSRC is depicted in Figure 3.1. The tunnel depicted in Figure 3.1 was not constructed in the actual project. However, because of the use of EOI to validate the outcome of the Tool, the DCOM activities associated with the tunnel are included in the Tool’s analytical steps.
Box 3.1 TSRC EOI Document
Overview of the Project and Opportunity
“The Toowoomba Second Range Crossing (TSRC) is a proposed bypass route to the north of Toowoomba, approximately 41 km in length. The TSRC will connect the Warrego Highway from Helidon in the east, to Charlton (west of Toowoomba), and to the Gore Highway at Athol in the west.”
Reference Design
“The reference design forming the basis of the statutory planning and environmental approval process features: five intersections/interchanges…: Gore Highway intersection, Cecil Plains Road intersection, Warrego Highway West intersection, Mort Street intersection, and Warrego Highway East intersection; two lane carriageway between the Gore Highway and Warrego Highway West (including through the Cecil Plains Road intersection) for a posted speed of 100kph; three lane divided carriageway from Warrego Highway West to Mort Street for a posted speed of 90kph; four lane divided carriageway from Mort Street to Warrego Highway East including dual two lane tunnels (approximately 700 metres in length) for a posted speed of 100kph; maximum gradient of 6.5%; and service roads and auxiliary lanes.”
Key Considerations
“It is expected that the TSRC will be tolled. The technical scope of the Project may include some minor works to facilitate toll collection infrastructure. However, at this stage, the Project scope will not include the provision of toll collection systems or associated toll collection services as this is intended to be procured separately.”
Pilot Tunnel
“A pilot tunnel was constructed between August and December 2007 using drill and blast methods. The pilot tunnel was excavated from the western portal, heading eastwards for approximately 625 metres (of the ultimate circa 700 metres of mainline tunnel). The pilot tunnel was not day-lighted at the eastern end. The pilot tunnel project enabled the collection of geological data, sampling of rock mechanics and cuttability tests, estimation of ground water inflows, insitu stress and convergence measurements, monitoring and measurement of drill and blast induced vibration levels.”
Figure 3.1: Layout of TSRC
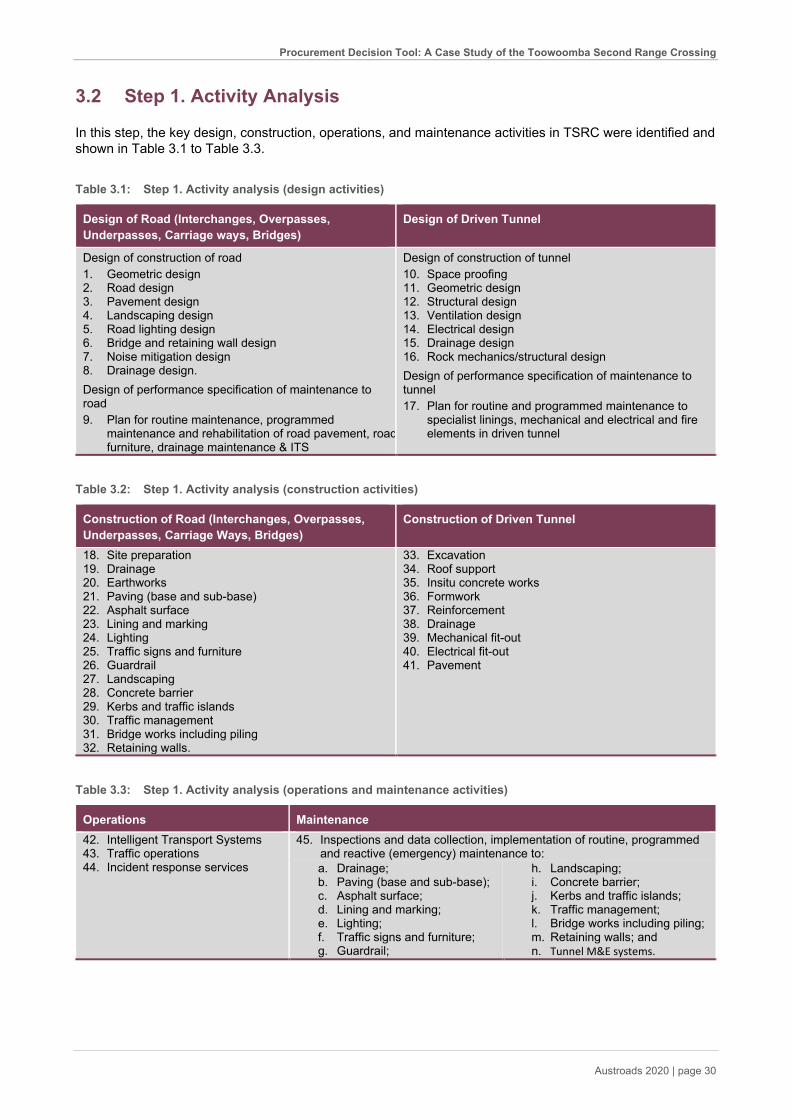
Procurement Decision Tool: A Case Study of the Toowoomba Second Range Crossing
Austroads 2020 | page 30
3.2 Step 1. Activity Analysis
In this step, the key design, construction, operations, and maintenance activities in TSRC were identified and shown in Table 3.1 to Table 3.3.
Table 3.1: Step 1. Activity analysis (design activities)
Design of Road (Interchanges, Overpasses, Underpasses, Carriage ways, Bridges)
Design of Driven Tunnel
Design of construction of road 1. Geometric design 2. Road design 3. Pavement design 4. Landscaping design 5. Road lighting design 6. Bridge and retaining wall design 7. Noise mitigation design 8. Drainage design. Design of performance specification of maintenance to road 9. Plan for routine maintenance, programmed
maintenance and rehabilitation of road pavement, road furniture, drainage maintenance & ITS
Design of construction of tunnel 10. Space proofing 11. Geometric design 12. Structural design 13. Ventilation design 14. Electrical design 15. Drainage design 16. Rock mechanics/structural design
Design of performance specification of maintenance to tunnel 17. Plan for routine and programmed maintenance to
specialist linings, mechanical and electrical and fire elements in driven tunnel
Table 3.2: Step 1. Activity analysis (construction activities)
Construction of Road (Interchanges, Overpasses, Underpasses, Carriage Ways, Bridges)
Construction of Driven Tunnel
18. Site preparation 19. Drainage 20. Earthworks 21. Paving (base and sub-base) 22. Asphalt surface 23. Lining and marking 24. Lighting 25. Traffic signs and furniture 26. Guardrail 27. Landscaping 28. Concrete barrier 29. Kerbs and traffic islands 30. Traffic management 31. Bridge works including piling 32. Retaining walls.
33. Excavation 34. Roof support 35. Insitu concrete works 36. Formwork 37. Reinforcement 38. Drainage 39. Mechanical fit-out 40. Electrical fit-out 41. Pavement
Table 3.3: Step 1. Activity analysis (operations and maintenance activities)
Operations Maintenance 42. Intelligent Transport Systems 43. Traffic operations 44. Incident response services
45. Inspections and data collection, implementation of routine, programmed and reactive (emergency) maintenance to: a. Drainage; b. Paving (base and sub-base); c. Asphalt surface; d. Lining and marking; e. Lighting; f. Traffic signs and furniture; g. Guardrail;
h. Landscaping; i. Concrete barrier; j. Kerbs and traffic islands; k. Traffic management; l. Bridge works including piling; m. Retaining walls; and n. Tunnel M&E systems.
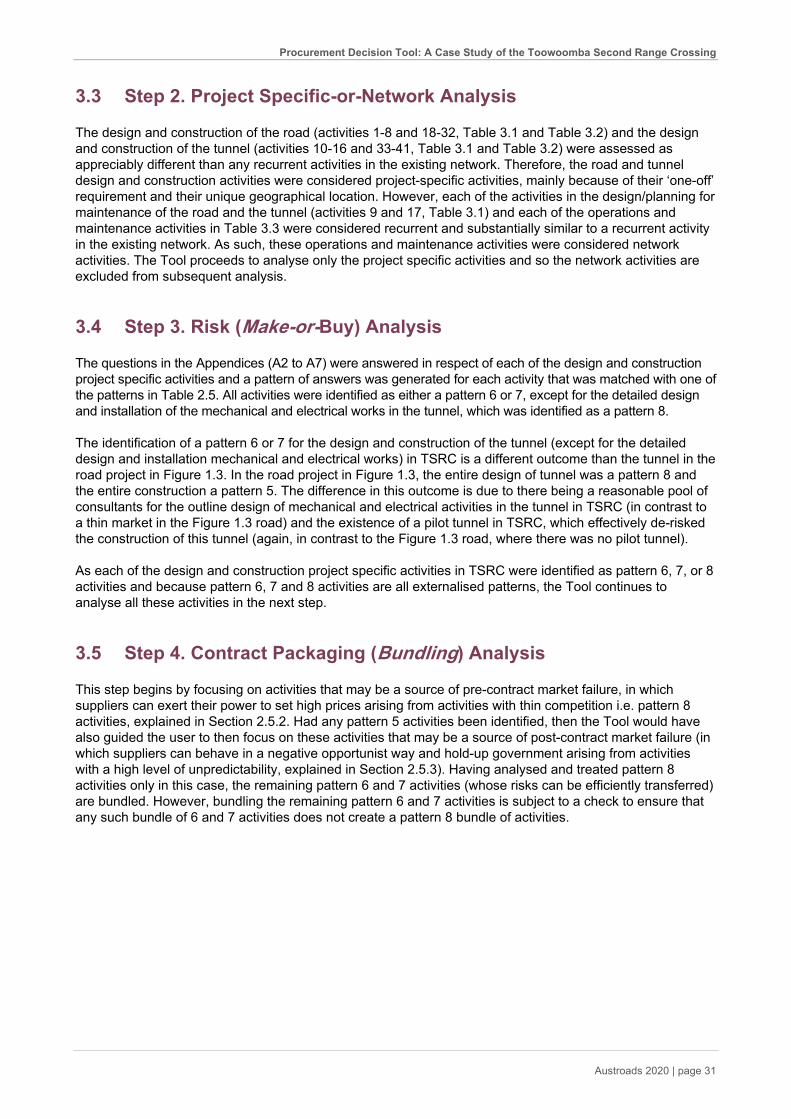
Procurement Decision Tool: A Case Study of the Toowoomba Second Range Crossing
Austroads 2020 | page 31
3.3 Step 2. Project Specific-or-Network Analysis
The design and construction of the road (activities 1-8 and 18-32, Table 3.1 and Table 3.2) and the design and construction of the tunnel (activities 10-16 and 33-41, Table 3.1 and Table 3.2) were assessed as appreciably different than any recurrent activities in the existing network. Therefore, the road and tunnel design and construction activities were considered project-specific activities, mainly because of their ‘one-off’ requirement and their unique geographical location. However, each of the activities in the design/planning for maintenance of the road and the tunnel (activities 9 and 17, Table 3.1) and each of the operations and maintenance activities in Table 3.3 were considered recurrent and substantially similar to a recurrent activity in the existing network. As such, these operations and maintenance activities were considered network activities. The Tool proceeds to analyse only the project specific activities and so the network activities are excluded from subsequent analysis.
3.4 Step 3. Risk (Make-or-Buy) Analysis
The questions in the Appendices (A2 to A7) were answered in respect of each of the design and construction project specific activities and a pattern of answers was generated for each activity that was matched with one of the patterns in Table 2.5. All activities were identified as either a pattern 6 or 7, except for the detailed design and installation of the mechanical and electrical works in the tunnel, which was identified as a pattern 8.
The identification of a pattern 6 or 7 for the design and construction of the tunnel (except for the detailed design and installation mechanical and electrical works) in TSRC is a different outcome than the tunnel in the road project in Figure 1.3. In the road project in Figure 1.3, the entire design of tunnel was a pattern 8 and the entire construction a pattern 5. The difference in this outcome is due to there being a reasonable pool of consultants for the outline design of mechanical and electrical activities in the tunnel in TSRC (in contrast to a thin market in the Figure 1.3 road) and the existence of a pilot tunnel in TSRC, which effectively de-risked the construction of this tunnel (again, in contrast to the Figure 1.3 road, where there was no pilot tunnel).
As each of the design and construction project specific activities in TSRC were identified as pattern 6, 7, or 8 activities and because pattern 6, 7 and 8 activities are all externalised patterns, the Tool continues to analyse all these activities in the next step.
3.5 Step 4. Contract Packaging (Bundling) Analysis
This step begins by focusing on activities that may be a source of pre-contract market failure, in which suppliers can exert their power to set high prices arising from activities with thin competition i.e. pattern 8 activities, explained in Section 2.5.2. Had any pattern 5 activities been identified, then the Tool would have also guided the user to then focus on these activities that may be a source of post-contract market failure (in which suppliers can behave in a negative opportunist way and hold-up government arising from activities with a high level of unpredictability, explained in Section 2.5.3). Having analysed and treated pattern 8 activities only in this case, the remaining pattern 6 and 7 activities (whose risks can be efficiently transferred) are bundled. However, bundling the remaining pattern 6 and 7 activities is subject to a check to ensure that any such bundle of 6 and 7 activities does not create a pattern 8 bundle of activities.
Procurement Decision Tool: A Case Study of the Toowoomba Second Range Crossing
Austroads 2020 | page 32
The detailed design and installation of the mechanical and electrical works in the tunnel, which was identified as a set of pattern 8 activities, are reviewed to assess whether these pattern 8 activities have occurred by virtue of the project size and the initial grouping of these activities across the scope of the project (mentioned in Step 1). In order to do this, consideration was given to de-bundling each pattern 8 activity to see whether the activity would suit the next lower/smaller tier of suppliers. This would increase the pool of likely bidders and convert a pattern 8 activity into a pattern 6 or 7 activity. In this case, however, de-bundling the detailed design and installation of the tunnel’s mechanical and electrical activities would not have created any pattern 6 or 7 activities because of the inherent thin market associated with the detailed design and installation of the tunnel’s mechanical and electrical activities. Therefore, these activities are procured as a separate bundle/contract, as there would not be any significant proximity issues associated with these activities. In so doing, this approach protects competition when bundling the remaining pattern 6 and 7 activities. The bundling of the remaining pattern 6 and 7 activities was assessed as not creating a pattern 8 bundle of activities.
In summary, this step resulted in the identification of two bundles and, therefore, two contracts:
• Bundle and Contract #1. Design and construction of all activities, except detailed design and installation of the mechanical and electrical activities in the tunnel.
• Bundle and Contract #2. Detailed design and installation of the mechanical and electrical activities in the tunnel.
3.6 Step 5. Collaborative-or-Competitive (Exchange Relationship) Analysis
In this final step, the Tool guides the user in the assignment of the most efficient exchange relationship in the contract with the supplier of each of the two bundles and in terms of the exchange continuum (from collaborating contracting, through standard competitive contracting, and through to bespoke competitive contracting, summarised in tables 2.8 and 2.9). As per table 2.8 and 2.9, standard competitive contracting using outcome-based contracting terms including a fixed-price payment mechanism (established in a low price auction) is recommended for Contract #1 because risks in this contract can be efficiently transferred, with the likelihood of market failure low. In terms of Contract #2, bespoke competitive contracting, again using outcome-based contracting terms including a fixed-price payment mechanism (established in a low price auction) is recommended. While risks can also be efficiently transferred in Contract #2, this time there is a high potential for market failure (because of the thin market associated with the activities in this contract) and so the contracting terms also include credible threats to incentivise performance.
3.7 Validation and Discussion
The project is actually procured as a single contract comprising a bundle of DCM activities, using government finance (Queensland state and federal capital contributions) substantially for the design and construction activities and private finance for the maintenance activities. Meanwhile, the core operations activities arising from the project are procured as part of an existing network of operational activity. Given the small cost of maintenance, relative to the much larger cost of design and constructing TSRC, the procurement strategy for this project recommended by the Tool mostly matches the actual approach. Unlike the actual approach, however, the Tool identified maintenance as network activity and not as project specific activity. Because new maintenance arising from the project is identified as network activity, the Tool recommends that this activity is not procured as part of any project-based contract and that private finance is not used in TSRC.

Procurement Decision Tool: A Case Study of the Toowoomba Second Range Crossing
Austroads 2020 | page 33
Since the Tool mostly matches the actual approach and given the hypothesis in Section 2.7, EOI are expected to be in the optimal 5-8 range. Based on anecdotal information from industry sources, it is taken that there were 5 to 6 EOI. Also based on anecdotal information from industry sources, the construction firms among the consortia expressing an interest would have preferred not to have a privately financed component. The absence of private finance may well have increased the number of firms expressing an interest, and closer to the optimum 8 EOI. Therefore, the recommendations from the Tool for TSRC are validated.
Procurement Decision Tool: A Case Study of the Toowoomba Second Range Crossing
Austroads 2020 | page 34
4. Conclusions and Recommendations
4.1 Conclusions
The identification of the most efficient bundling configuration (or contract packaging) within a project, including the most efficient nature of contracting (i.e. from collaborative to competitive contracting) associated with each contracted bundle, is central to the Tool advancing Value-for-Money. The application of the Tool in both the road in Figure 1.3 and in TSRC indicates significant improvements in Value-for-Money that would have likely been delivered by following the Tool’s recommendations in contrast to the actual approach taken in both these projects.
The road in Figure 1.3 was one of four case studies of major infrastructure projects used to test the Tool that was developed in the Australian Research Council (ARC) grant mentioned in the Summary. All four cases supported the hypothesis developed to test the Tool (Section 1.1.2). These results were further supported by the nationwide survey of civil and building contractors in the ARC grant, which indicates that the approach identified by the Tool in the one Health Case Study that mismatched the Tool’s recommendation was likely have seen a reduced number of EOI downwards towards the optimal 5-8 EOI range 5-8. And the approach in the Road Case Study (in Figure 1.3 in this report) was likely to have seen an increase in EOI upwards towards the optimal 5-8 EOI range. The Tool has also been supported by the results in its trialling in TSRC and a major health project.6 More broadly, by reference to the survey of 87 major road and health projects worth $32 billion in the ARC grant, the Tool is expected to more than double the chance that the procurement approach is successful in setting the project on a path to deliver superior VfM (in contrast to current practice). This expectation is based on only 43% of projects in the survey that achieved EOI in the optimal 5-8 range.
It is logical to expect that the application of the Tool will see the emergence of different approaches and innovations in patterns of procurement relating to the key procurement dimensions of size, bundling and exchange relationships. This is mainly because the Tool is exclusively an economic one, with a long-term orientation. For example, we can speculate that the use of the Tool may lead to increasing rationalisation of procurement across sectors. It may reveal greater scope for bundling operations and maintenance with design and construction in health projects, and the consideration of more of these projects as PPPs. It may also promote the use of PPPs for road projects that are very large and complex, and where a relatively high percentage of total costs are operations and maintenance costs. However, the relative efficiency gains achieved by procuring road maintenance on a network basis create a significant hurdle for the availability payment approach to a road with relatively straightforward operations and maintenance requirements. An exception could be a relatively straightforward toll road of lesser scale than the remaining network for which the PPP Company assumes the demand risk and absorbs any relative inefficiency risks involved in delivering operations and/or maintenance to that toll road. To the extent that any inefficiency arises, receipts retained by the PPP Company would need to offset these inefficiency costs.
6 The trial of the Tool on the major health project was funded by Infrastructure Australia and, as mentioned in the Summary, the trialling
of the Tool on both the major health project and TSRC forms the basis of the Tool’s forthcoming user guide to be published by Infrastructure Australia.

Procurement Decision Tool: A Case Study of the Toowoomba Second Range Crossing
Austroads 2020 | page 35
Increasing rationalisation of procurement across sectors may also lead to less reliance on stereotypical procurement that has tended to create incentives to minimise capital costs and/or minimise the time for construction. For example, this rationalisation might see less Managing Contractor and Early Contractor Involvement. Meanwhile, the Tool is likely to promote more finesse in deploying Alliancing, so that this mode is only employed for the new infrastructure project/parts of the new project if/when it can be efficient. The Tool is likely to guide these changes through cost improvements and benefits derived from allowing more time for planning and design development, and for the development of performance specifications to ensure that contestability is achieved and that the market is allowed to work as efficiently as possible. The Tool will also save time and costs to both government and industry by more reliably identifying the most suitable projects to be procured using a PPP approach, and by ensuring that the extra-over work involved in a PPP – including PPP procedure beyond performance specification and reference design up to financial close – is justified.
As the Tool relies entirely on state-of-the-art microeconomics it is not pre-disposed to any mode of procurement. This feature of the Tool promotes objectivity in decision-making. And since both government and industry can equally effectively apply the Tool, this promotes accountability and transparency of decision-making. More specifically, the Tool will provide a transparent and public interest document that can be fully disclosed mainly because the assessment in the Tool is semi-qualitative. That is, the answers (that are not monetised) to the questions in the Tool are designed to objectively capture known details concerning the market and project in a reliable fashion. As such, the Tool can supplement the Public Sector Comparator (PSC) in projects in which parts of the PSC are not published due to commercial-in-confidence concerns. Alternatively, it could also entirely replace the PSC in terms of what is published as justification for a PPP approach.
Finally, the effective application of the Tool is likely to yield benefits beyond microeconomic benefits (associated with the efficient delivery of individual projects) i.e. industry (or mesoeconomic) and macroeconomic benefits. With the prospect, post-coronavirus (COVID-19), of the most acute fiscally constrained environment since the Great Depression, the use of the Tool is compelling to ensure that the best Value-for-Money is delivered and demonstrated on each and every new infrastructure project.
4.2 Recommendations
There are two key recommendations for Austroads and its member organisations:
• Should a road transport or traffic agency want to use the Tool, either in its review mode (on a project whose actual procurement decision is established) and/or in its guidance mode (on a new project in business case), then it is recommended that the agency does not wait for the publication of the user guide by Infrastructure Australia. Instead, it is recommended that the agency contact Associate Professor Adrian Bridge at QUT to arrange for assistance to use the Tool. QUT can provide the agency with all the support needed to apply the Tool including training the agency’s staff to become self-reliant in the use of the Tool.
• While the Tool is silent on the procurement of network activity (identified in Step 2), all the economics in the Tool can be applied to network activity. It is also recommended that Austroads consider a proposal from QUT to develop the economics in the Tool into a further tool to be applied to the procurement of network activity including the operations and maintenance of roads.

Procurement Decision Tool: A Case Study of the Toowoomba Second Range Crossing
Austroads 2020 | page 36
References
Austroads (2014) Guide to Project Delivery Part 1: Overview, AGPD01-14, Austroads, Sydney, NSW.
Austroads and Australasian Procurement and Construction Council (2014) Building and Construction Procurement Guide – Principles and Options, AP-G92-14, Austroads, Sydney, NSW.
Beattie, V., Goodacre, A. and Fearnley, S. (2003) And then there were four: a study of UK audit market concentration—causes, consequences and the scope for market adjustment. Journal of Financial Regulation and Compliance, 11(3), 250–265.
Besanko, D., Dranove, D. and Shanley, M. (2010) Economics of strategy. 5th ed. New York: John Wiley & Sons.
Bridge, A. J. (2008) The determinants of the governance of air conditioning maintenance in Australian retail centres (Doctoral dissertation, Queensland University of Technology).
Bridge, A. J. (2015) A Reflected Spectrum to Strengthen Transaction Cost and Resource-Based Theories and to Advance the Theory of the Firm. Working Paper.
Bridge, A. J. and Tisdell, C. (2004) The determinants of the vertical boundaries of the construction firm. Construction Management and Economics, 22(8), 807-825.
Bridge, A., and Bianchi, R. (2014) Reforming the procurement of construction and financing of Australian infrastructure: advancing capacity, competition and investment, available at: https://eprints.qut.edu.au/76520/
Eisenhardt, K. M. (1989) Agency theory: An assessment and review. The Academy of Management Review, 14(1), 57-74.
Elster, J. (1989) Nuts and bolts for the social sciences. Cambridge: Cambridge University Press.
Groenewegen, J. and Vromen, J.J. (1996) A case for theoretical pluralism. In Transaction cost economics and beyond, ed. J. Groenewegen, 365-380. Dordrecht: Kluwer Academic Publishers.
Gupta, S. (2002) Competition and collusion in a government procurement auction market. Atl. Econ. J. 30(1), 13–25.
HM Treasury (2008) Infrastructure procurement: Delivering long-term value, London: Office of Public Sector Information.
ITF (2018), Private Investment in Transport Infrastructure: Dealing with Uncertainty in Contracts, International Transport Forum, Paris, available at: https://www.itf-oecd.org/private-investment-infrastructure
Ive, G., & Chang, C. Y. (2007) The principle of inconsistent trinity in the selection of procurement systems. Construction Management and Economics, 25(7), 677-690.
KPMG and University College London (2010) Operating Healthcare Infrastructure. London, UK.
Lakatos, I. (1977) Proofs and Refutations. Cambridge: Cambridge University Press.
Lakatos, I. (1978) The methodology of scientific research programmes. In Philosophical papers, eds. J. Worrall and G, Currie, Cambridge: Cambridge University Press.

Procurement Decision Tool: A Case Study of the Toowoomba Second Range Crossing
Austroads 2020 | page 37
Makovšek, D. and Bridge, A. J. (2018) The Procurement Design Assessment System: The roadmap towards it, Presentation at: Private Investment in Infrastructure: Dealing with uncertainty in contracts, Paris, France, 22 June 2018, available at: http://www.itf-oecd.org/private-investment-infrastructure.
National Audit Office (2004) Improving Procurement: Progress by the Office of Government Commerce in Improving Departments Capability to Procure Cost-Effectively.
National Audit Office (2011) Lessons from PFI and Other Projects (HC 920 Session 2010–2012). London.
Projects Queensland (2014) Toowoomba Second Range Crossing: Expression of Interest. Australian Government and Queensland Government.
Samuels, W.J. (1995) The present state of institutional economics. Cambridge Journal of Economics, 19, 569-590.
Selten, B., (1973) A simple model of imperfect competition, where 4 are few and 6 are many. Int. J. Game Theory, 2(1), 141–201.
Skitmore, M. (2002) Raftery curve construction for tender price forecasts. Construction Management and Economics, 20(1), 83–89.
Teo, P. (2014) The effect of procurement on competition and flexibility: determining the suitability of public-private partnerships in major infrastructure projects, Doctoral dissertation, Queensland University of Technology, available at: https://eprints.qut.edu.au/72914/
Teo, P. and Bridge, A. J. (2017). Crafting an efficient bundle of property rights to determine the suitability of a Public‐Private Partnership: A new theoretical framework. International Journal of Project Management, 35(3), 269-279.
Williamson, O.E. (1985) The economic institutions of capitalism. New York: The Free Press.
Winch, G., Schmidt, S. (2016) Public–private partnerships: a review of the UK private finance initiative. In: Jefferies, M.C., Rowlinson, S. (Eds.), New Forms of Procurement: Public Private Partnerships and Relational Contracting in the 21st Century. London: Taylor and Francis. 35–50.
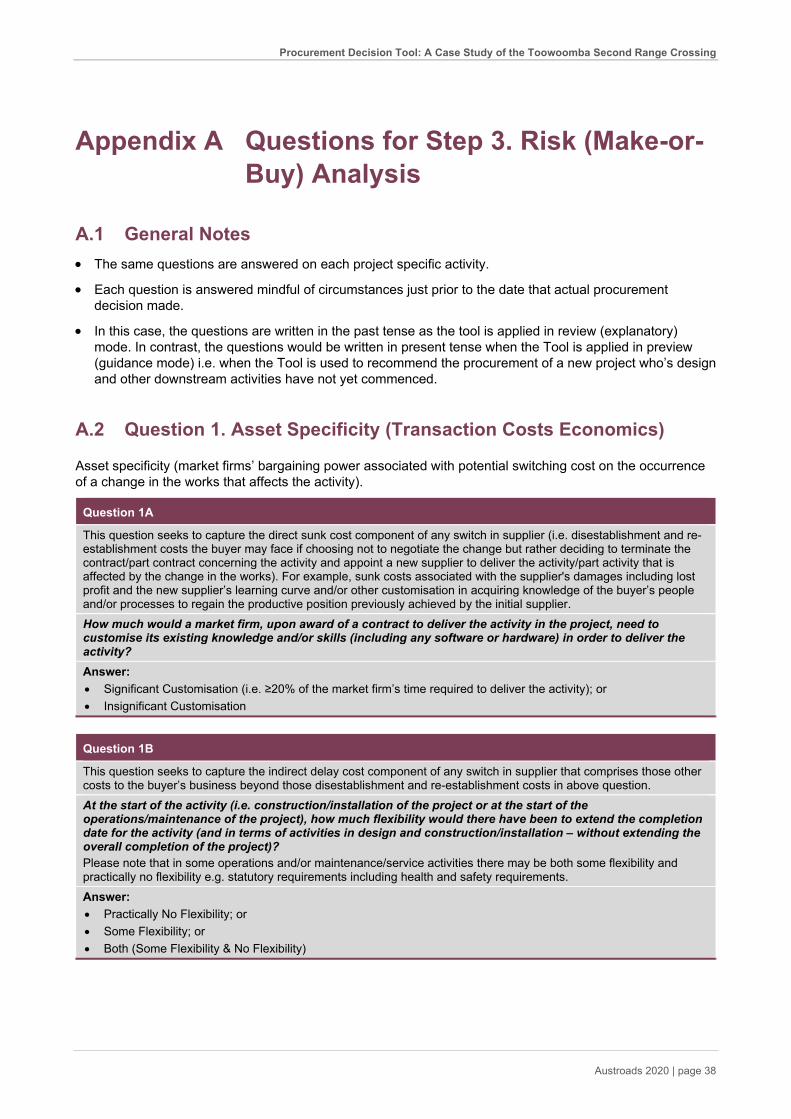
Procurement Decision Tool: A Case Study of the Toowoomba Second Range Crossing
Austroads 2020 | page 38
Appendix A Questions for Step 3. Risk (Make-or-Buy) Analysis
A.1 General Notes • The same questions are answered on each project specific activity.
• Each question is answered mindful of circumstances just prior to the date that actual procurement decision made.
• In this case, the questions are written in the past tense as the tool is applied in review (explanatory) mode. In contrast, the questions would be written in present tense when the Tool is applied in preview (guidance mode) i.e. when the Tool is used to recommend the procurement of a new project who’s design and other downstream activities have not yet commenced.
A.2 Question 1. Asset Specificity (Transaction Costs Economics)
Asset specificity (market firms’ bargaining power associated with potential switching cost on the occurrence of a change in the works that affects the activity).
Question 1A
This question seeks to capture the direct sunk cost component of any switch in supplier (i.e. disestablishment and re-establishment costs the buyer may face if choosing not to negotiate the change but rather deciding to terminate the contract/part contract concerning the activity and appoint a new supplier to deliver the activity/part activity that is affected by the change in the works). For example, sunk costs associated with the supplier's damages including lost profit and the new supplier’s learning curve and/or other customisation in acquiring knowledge of the buyer’s people and/or processes to regain the productive position previously achieved by the initial supplier. How much would a market firm, upon award of a contract to deliver the activity in the project, need to customise its existing knowledge and/or skills (including any software or hardware) in order to deliver the activity? Answer: • Significant Customisation (i.e. ≥20% of the market firm’s time required to deliver the activity); or • Insignificant Customisation
Question 1B
This question seeks to capture the indirect delay cost component of any switch in supplier that comprises those other costs to the buyer’s business beyond those disestablishment and re-establishment costs in above question. At the start of the activity (i.e. construction/installation of the project or at the start of the operations/maintenance of the project), how much flexibility would there have been to extend the completion date for the activity (and in terms of activities in design and construction/installation – without extending the overall completion of the project)? Please note that in some operations and/or maintenance/service activities there may be both some flexibility and practically no flexibility e.g. statutory requirements including health and safety requirements. Answer: • Practically No Flexibility; or • Some Flexibility; or • Both (Some Flexibility & No Flexibility)
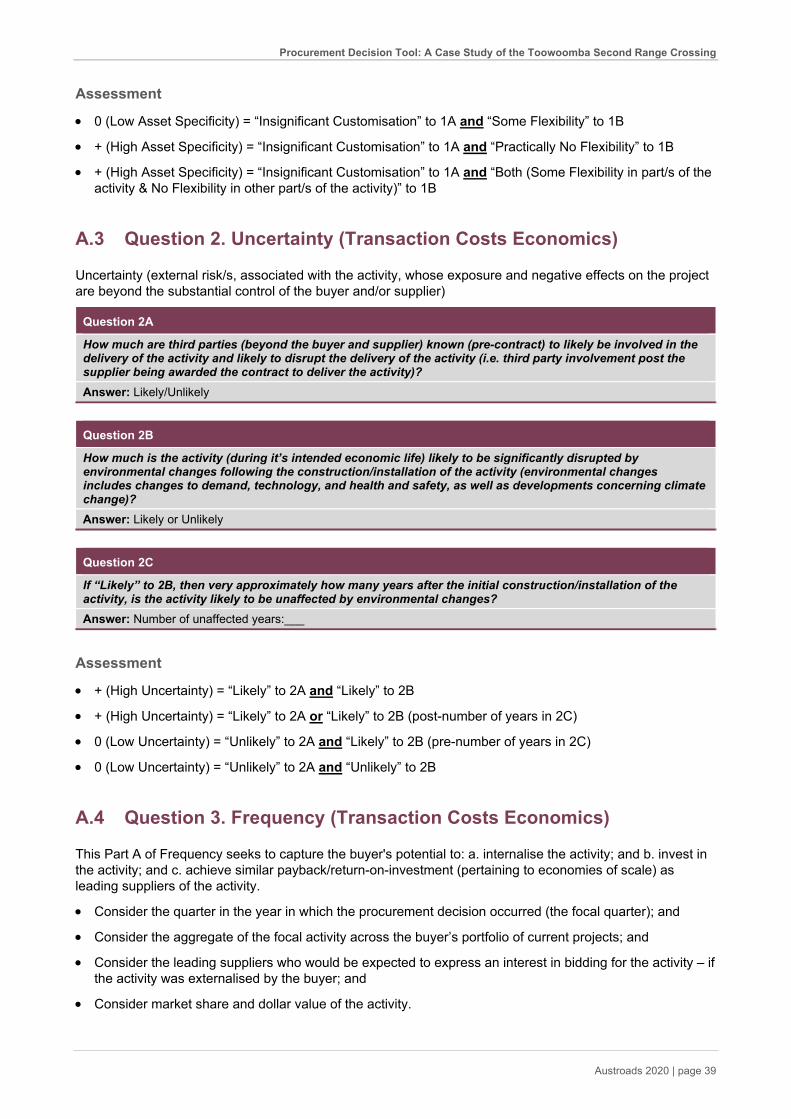
Procurement Decision Tool: A Case Study of the Toowoomba Second Range Crossing
Austroads 2020 | page 39
Assessment
• 0 (Low Asset Specificity) = “Insignificant Customisation” to 1A and “Some Flexibility” to 1B
• + (High Asset Specificity) = “Insignificant Customisation” to 1A and “Practically No Flexibility” to 1B
• + (High Asset Specificity) = “Insignificant Customisation” to 1A and “Both (Some Flexibility in part/s of the activity & No Flexibility in other part/s of the activity)” to 1B
A.3 Question 2. Uncertainty (Transaction Costs Economics)
Uncertainty (external risk/s, associated with the activity, whose exposure and negative effects on the project are beyond the substantial control of the buyer and/or supplier)
Question 2A
How much are third parties (beyond the buyer and supplier) known (pre-contract) to likely be involved in the delivery of the activity and likely to disrupt the delivery of the activity (i.e. third party involvement post the supplier being awarded the contract to deliver the activity)? Answer: Likely/Unlikely
Question 2B
How much is the activity (during it’s intended economic life) likely to be significantly disrupted by environmental changes following the construction/installation of the activity (environmental changes includes changes to demand, technology, and health and safety, as well as developments concerning climate change)? Answer: Likely or Unlikely
Question 2C
If “Likely” to 2B, then very approximately how many years after the initial construction/installation of the activity, is the activity likely to be unaffected by environmental changes? Answer: Number of unaffected years:___
Assessment
• + (High Uncertainty) = “Likely” to 2A and “Likely” to 2B
• + (High Uncertainty) = “Likely” to 2A or “Likely” to 2B (post-number of years in 2C)
• 0 (Low Uncertainty) = “Unlikely” to 2A and “Likely” to 2B (pre-number of years in 2C)
• 0 (Low Uncertainty) = “Unlikely” to 2A and “Unlikely” to 2B
A.4 Question 3. Frequency (Transaction Costs Economics)
This Part A of Frequency seeks to capture the buyer's potential to: a. internalise the activity; and b. invest in the activity; and c. achieve similar payback/return-on-investment (pertaining to economies of scale) as leading suppliers of the activity.
• Consider the quarter in the year in which the procurement decision occurred (the focal quarter); and
• Consider the aggregate of the focal activity across the buyer’s portfolio of current projects; and
• Consider the leading suppliers who would be expected to express an interest in bidding for the activity – if the activity was externalised by the buyer; and
• Consider market share and dollar value of the activity.
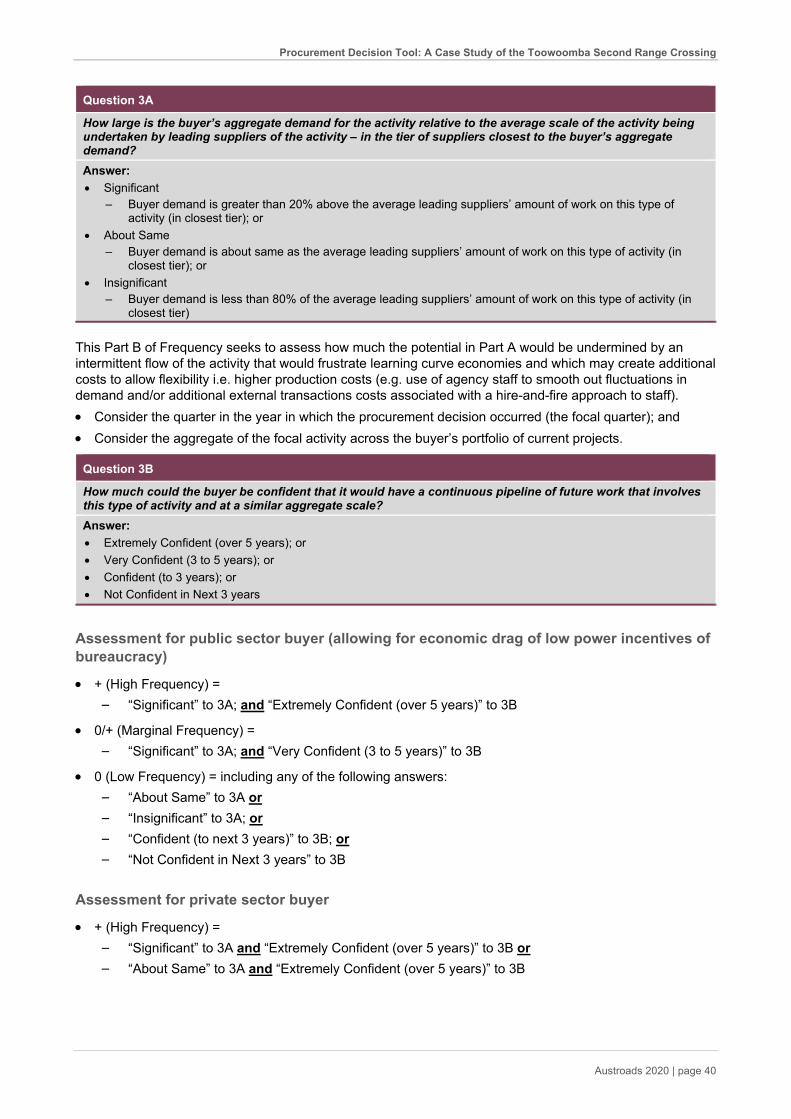
Procurement Decision Tool: A Case Study of the Toowoomba Second Range Crossing
Austroads 2020 | page 40
Question 3A
How large is the buyer’s aggregate demand for the activity relative to the average scale of the activity being undertaken by leading suppliers of the activity – in the tier of suppliers closest to the buyer’s aggregate demand? Answer: • Significant
– Buyer demand is greater than 20% above the average leading suppliers’ amount of work on this type of activity (in closest tier); or
• About Same – Buyer demand is about same as the average leading suppliers’ amount of work on this type of activity (in
closest tier); or • Insignificant
– Buyer demand is less than 80% of the average leading suppliers’ amount of work on this type of activity (in closest tier)
This Part B of Frequency seeks to assess how much the potential in Part A would be undermined by an intermittent flow of the activity that would frustrate learning curve economies and which may create additional costs to allow flexibility i.e. higher production costs (e.g. use of agency staff to smooth out fluctuations in demand and/or additional external transactions costs associated with a hire-and-fire approach to staff). • Consider the quarter in the year in which the procurement decision occurred (the focal quarter); and • Consider the aggregate of the focal activity across the buyer’s portfolio of current projects.
Question 3B
How much could the buyer be confident that it would have a continuous pipeline of future work that involves this type of activity and at a similar aggregate scale? Answer: • Extremely Confident (over 5 years); or • Very Confident (3 to 5 years); or • Confident (to 3 years); or • Not Confident in Next 3 years
Assessment for public sector buyer (allowing for economic drag of low power incentives of bureaucracy)
• + (High Frequency) = – “Significant” to 3A; and “Extremely Confident (over 5 years)” to 3B
• 0/+ (Marginal Frequency) = – “Significant” to 3A; and “Very Confident (3 to 5 years)” to 3B
• 0 (Low Frequency) = including any of the following answers: – “About Same” to 3A or – “Insignificant” to 3A; or – “Confident (to next 3 years)” to 3B; or – “Not Confident in Next 3 years” to 3B
Assessment for private sector buyer
• + (High Frequency) = – “Significant” to 3A and “Extremely Confident (over 5 years)” to 3B or – “About Same” to 3A and “Extremely Confident (over 5 years)” to 3B
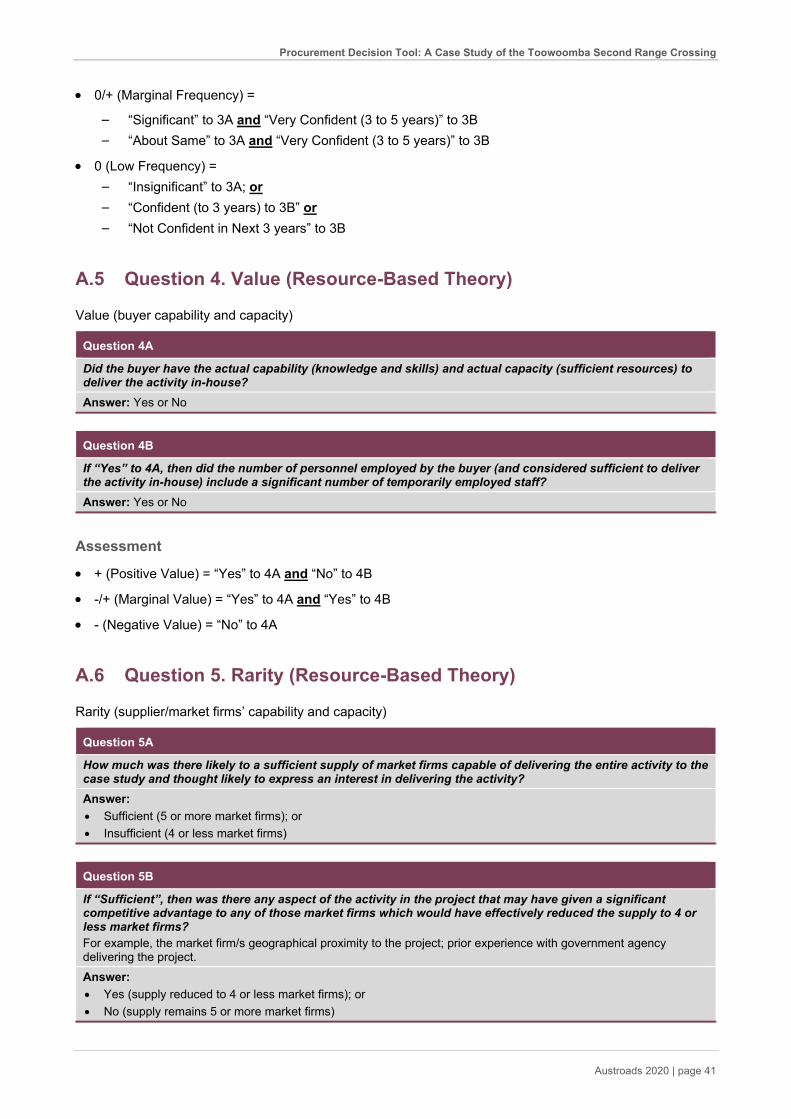
Procurement Decision Tool: A Case Study of the Toowoomba Second Range Crossing
Austroads 2020 | page 41
• 0/+ (Marginal Frequency) =
– “Significant” to 3A and “Very Confident (3 to 5 years)” to 3B – “About Same” to 3A and “Very Confident (3 to 5 years)” to 3B
• 0 (Low Frequency) = – “Insignificant” to 3A; or – “Confident (to 3 years) to 3B” or – “Not Confident in Next 3 years” to 3B
A.5 Question 4. Value (Resource-Based Theory)
Value (buyer capability and capacity)
Question 4A
Did the buyer have the actual capability (knowledge and skills) and actual capacity (sufficient resources) to deliver the activity in-house? Answer: Yes or No
Question 4B
If “Yes” to 4A, then did the number of personnel employed by the buyer (and considered sufficient to deliver the activity in-house) include a significant number of temporarily employed staff? Answer: Yes or No
Assessment
• + (Positive Value) = “Yes” to 4A and “No” to 4B
• -/+ (Marginal Value) = “Yes” to 4A and “Yes” to 4B
• - (Negative Value) = “No” to 4A
A.6 Question 5. Rarity (Resource-Based Theory)
Rarity (supplier/market firms’ capability and capacity)
Question 5A
How much was there likely to a sufficient supply of market firms capable of delivering the entire activity to the case study and thought likely to express an interest in delivering the activity? Answer: • Sufficient (5 or more market firms); or • Insufficient (4 or less market firms)
Question 5B
If “Sufficient”, then was there any aspect of the activity in the project that may have given a significant competitive advantage to any of those market firms which would have effectively reduced the supply to 4 or less market firms? For example, the market firm/s geographical proximity to the project; prior experience with government agency delivering the project. Answer: • Yes (supply reduced to 4 or less market firms); or • No (supply remains 5 or more market firms)
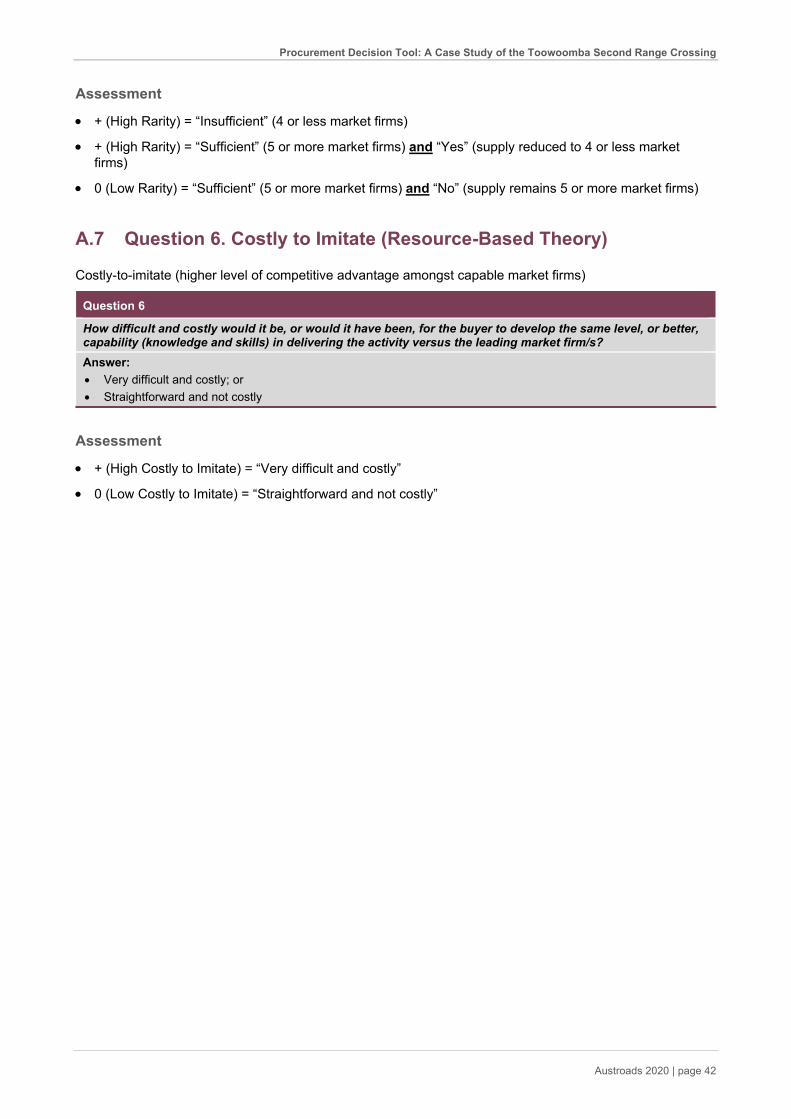
Procurement Decision Tool: A Case Study of the Toowoomba Second Range Crossing
Austroads 2020 | page 42
Assessment
• + (High Rarity) = “Insufficient” (4 or less market firms)
• + (High Rarity) = “Sufficient” (5 or more market firms) and “Yes” (supply reduced to 4 or less market firms)
• 0 (Low Rarity) = “Sufficient” (5 or more market firms) and “No” (supply remains 5 or more market firms)
A.7 Question 6. Costly to Imitate (Resource-Based Theory)
Costly-to-imitate (higher level of competitive advantage amongst capable market firms)
Question 6
How difficult and costly would it be, or would it have been, for the buyer to develop the same level, or better, capability (knowledge and skills) in delivering the activity versus the leading market firm/s? Answer: • Very difficult and costly; or • Straightforward and not costly
Assessment
• + (High Costly to Imitate) = “Very difficult and costly”
• 0 (Low Costly to Imitate) = “Straightforward and not costly”

Procurement Decision Tool: A Case Study of the Toowoomba Second Range Crossing
Austroads 2020 | page 43
Top Related
Copyright © 2022 FDOKUMEN

