


Bahasa
Halaman
Hukum


PHYSICOCHEMICAL PROPERTIES AND BAKING QUALITIES OF BAKED WHEAT PRODUCTS SUPPLEMENTED WITH CASSAVA AND PIGEON PEA FLOURS
By
Sarah Chilungo
A THESIS
Submitted to Michigan State University
in partial fulfillment of the requirements for the degree of
Food Science - Master of Science
2013

ABSTRACT
PHYSICOCHEMICAL PROPERTIES AND BAKING QUALITIES OF BAKED WHEAT PRODUCTS SUPPLEMENTED WITH CASSAVA AND PIGEON PEA FLOURS
By
Sarah Chilungo
Supplementation of wheat products with cassava and pigeon pea flours is a sustainable
way to produce economical and nutritious baked products. The aims of this study were to
evaluate the effects of cassava and pigeon pea flour supplementation on the physicochemical
properties (chemical composition, viscosity, dough rheology) of flour blends, baking quality
(bread and cookies), and digestibility of baked products from blended flour samples. Findings
revealed that supplementation with pigeon pea flour increased protein content of the bread
and cookie products. However, incorporation of cassava and pigeon pea flours resulted in
significantly impaired bread quality, such as lowering of loaf volume and height. The quality
attributes of blended flour cookies were superior to those of control (wheat cookies). The total
hydrocyanic acid content of baked samples was significantly higher when added cassava flour
levels increased, though still below the maximum allowable amount of 1 mg/kg. Both
carbohydrate and in vitro protein digestibility decreased as wheat flour was substituted with
cassava and pigeon pea flours, but still was above 50%.

iii
I dedicate this to the late Dr. Patrick Mviha who was then the Assistant Deputy Director of Agricultural Research Services. You always believed in me and were my inspiration. You saw
something in me that I did not see in myself. Your encouragement and assistance made it possible for me to pursue the course. I will always miss you and may your soul continue to rest
in peace.

iv
ACKNOWLEDGEMENTS
I would like to convey my sincere gratitude and appreciation to the various organizations,
institutions and individuals who played a vital role in the course of my studies and research.
Dr. Perry Ng – My Supervisor. Thank you for providing knowledge in the field of Food
Science and Baking for which I had no prior knowledge to great detail. Thanks for
showing me how to bake and use the various pieces of equipment required. More
importantly, thanks for providing knowledge, direction, support and inspiration in
writing this thesis.
Dr. Gale Strasburg and Dr. Leslie Bourquin- Committee Members. Thank you for
accepting to be on my committee. Your advice and suggestions helped to improve the
quality of this thesis.
USAID Malawi and Michigan State University for providing financial support required for
me to accomplish my MSc studies.
The Government of Malawi, especially the Department of Agricultural Research Services
under the Ministry of Agriculture, for the administrative and moral support.
Bakhresa Grain Milling Company (BMG) for providing baking laboratory and office
space. Also University of Malawi especially Chancellor College and Polytechnic for
laboratory and technical assistance with sample analysis. I could not have completed my
research study without you all.
My lab mates and fellow graduate students, thanks for the support in numerous ways.

v
Mom, dad, brothers and sister and all my friends and family for all your love,
encouragement, and support. Without you all I couldn’t have made it.

vi
TABLE OF CONTENTS
LIST OF TABLES ......................................................................................................................................... viii
LIST OF FIGURES ........................................................................................................................................ ix
CHAPTER 1 ................................................................................................................................................... 1
INTRODUCTION .......................................................................................................................................... 1
1.1 Objectives ......................................................................................................................................... 4
1.2 Hypothesis ........................................................................................................................................ 4
1.3 Justification ....................................................................................................................................... 4
CHAPTER 2 ................................................................................................................................................... 6
LITERATURE REVIEW .................................................................................................................................. 6
2.1 Wheat ................................................................................................................................................ 6
2.1.2 Gluten proteins ......................................................................................................... 6 2.2 Cassava (Manihot esculenta, Crantz) ............................................................................................ 8
2.2.1 Nutritive value of cassava flour ................................................................................ 9 2.2.2 Cyanogen content of cassava ......................................................................................... 9 2.2.3 Cassava processing ....................................................................................................... 10 2.2.4 Physicochemical properties of cassava flour ................................................................ 11 2.2.5 Pasting properties of cassava flour .............................................................................. 13 2.2.6 High quality cassava flour (HQCF) ................................................................................ 14
2.3 Pigeon peas (Cajanus cajan) ......................................................................................................... 15
2.3.1 Nutritive value of pigeon peas ..................................................................................... 15 2.3.2 Protein quality .............................................................................................................. 17 2.3.3 Antinutritional factors .................................................................................................. 18 2.3.4 Physicochemical properties of pigeon peas baked products ....................................... 19
CHAPTER 3 ................................................................................................................................................. 21
MATERIALS AND METHODS .................................................................................................................... 21
3.1 Raw materials ................................................................................................................................. 21
3.1.1 Pigeon pea flour preparation ....................................................................................... 21 3.1.2 Cassava flour preparation............................................................................................. 21 3.1.3 Wheat flour ................................................................................................................... 22
3.2 Flour blending................................................................................................................................. 22
3.3 Flour tests ....................................................................................................................................... 23
3.3.1 Determination of flour particle size ........................................................................ 23 3.3.2 Alveograph test ...................................................................................................... 24 3.3.3 Determination of α-amylase activity ...................................................................... 24 3.3.4 Determination of gluten content ............................................................................ 25 3.3.5 Determination of water and oil absorption capacities ........................................... 25 3.3.6 Determination of swelling power ........................................................................... 25
vii
3.3.7 Viscosity tests ......................................................................................................... 26 3.4 Baking studies ................................................................................................................................. 26
3.4.1 Breadmaking procedure ............................................................................................... 26 3.4.2 Physical analysis of bread samples ............................................................................... 28
3.5 Cookiemaking procedure .............................................................................................................. 28
3.5.1 Physical analysis of cookie samples .............................................................................. 29 3.6 Chemical analysis of flours, breads and cookies ....................................................................... 30
3.6.1 Protein analysis ............................................................................................................. 30 3.6.2 Fat analysis ................................................................................................................... 31 3.6.3 Moisture analysis .......................................................................................................... 31 3.6.4 Ash analysis ................................................................................................................... 31 3.6.5 Fiber analysis ................................................................................................................ 32
3.7 Determination of total HCN ......................................................................................................... 32
3.8 Digestibility studies ........................................................................................................................ 33
3.8.1 In vitro carbohydrate digestibility (IVCD) ..................................................................... 33 3.8.2 In vitro protein digestibility (IVPD) ............................................................................... 34
3.9 Experimental design and statistical analysis .............................................................................. 34
CHAPTER 4 ................................................................................................................................................. 36
RESULTS AND DISCUSSION ...................................................................................................................... 36
4.1. Chemical composition of flours .................................................................................................. 36
4.2. Particle size distribution of wheat, cassava and pigeon pea flours ....................................... 41
4.3. Falling Number and gluten content of flours and blends ....................................................... 42
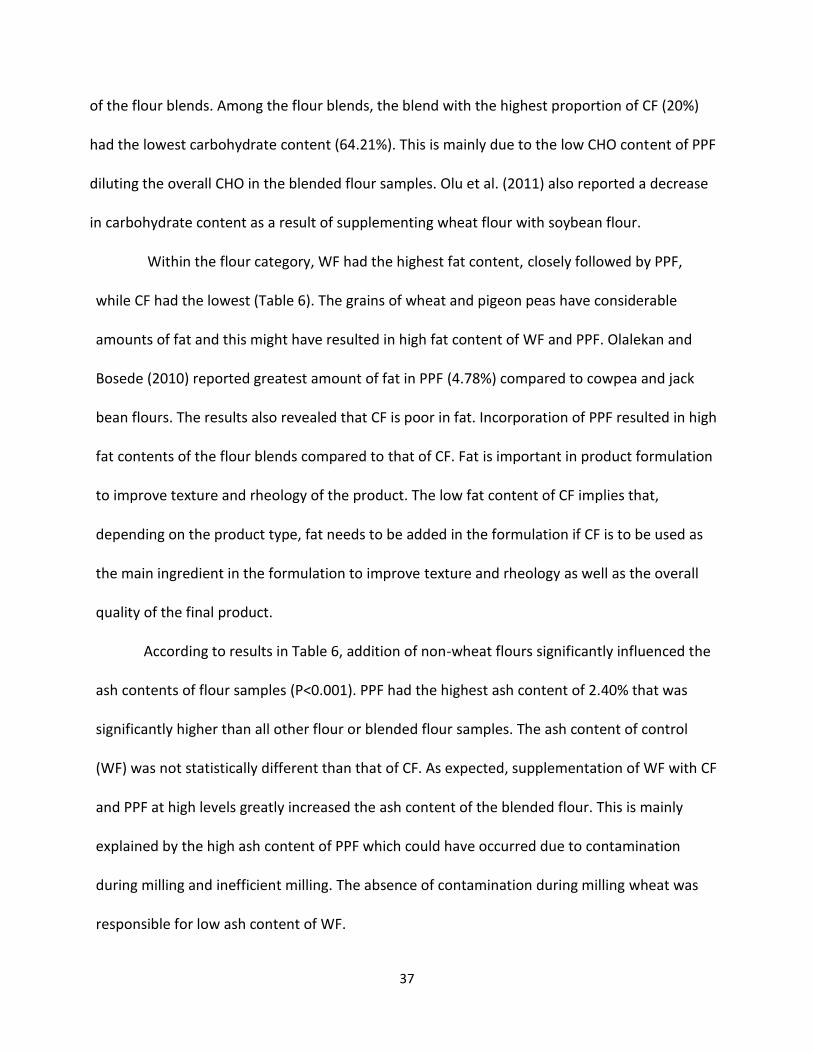
4.4. Work and Alveostrength .............................................................................................................. 44
4.5. Water and oil absorption capacities of flours and blends ...................................................... 46
4.6. Swelling power and viscosity of flours and blended flours..................................................... 48
4.7. Physical characteristics of bread made from wheat flour supplemented with cassava and pigeon pea flours .................................................................................................................................. 50
4.8. Physical characteristics of wheat cookies supplemented with cassava and pigeon pea flours ...................................................................................................................................................... 52
4.9. The effect of cassava and pigeon pea flours supplementation on chemical composition of breads and cookies............................................................................................................................... 53
4.10. Carbohydrate and protein digestibility of breads and cookies supplemented with cassava and pigeon pea flours ............................................................................................................ 61
CHAPTER 5 ................................................................................................................................................. 64
5.1. CONCLUSIONS ............................................................................................................................... 64
5.2. RECOMMENDATIONS AND SUGGESTED FUTURE STUDIES .................................................... 66
REFERENCES .............................................................................................................................................. 69

viii
LIST OF TABLES
Table 1. Chemical composition of fresh Cassava Root ................................................................... 9
Table 2. Nutritive Value of Pigeon Peas……………………………………………………………………………………17
Table 3. Composite Flour Formulations (% by weight) ................................................................. 23
Table 4. Breadmaking Formulation............................................................................................... 27
Table 5. Cookiemaking Formulation ............................................................................................. 29
Table 6. Chemical Composition1 (d.b.) of Wheat, Cassava, Pigeon Pea and Blended Flours ...... 40
Table 7. Particle Size Distribution1 (g/100g) of Wheat, Cassava and Pigeon Pea Flours ............. 42
Table 8. Falling Number1 and Gluten Content
1 of Flours and Blended Flour Samples ............... 44
Table 9. Work1 and Alveostrength
1 of Flours and Blended Flour Samples.................................. 46
Table 10.Water and Oil Absorption Capacities1 of Flour and Blended Flour Samples ................ 47
Table 11.Swelling Power1 and Viscosity
1 of Flours and Blended Flour Samples ......................... 50
Table 12. Physical Characterisitcs1 of Bread Made From Wheat Flour Supplemented with
Cassava and Pigeon pea Flours ..................................................................................................... 51
Table 13. Physical Characteristics1 of Cookie Made From Wheat Flour Supplemented with
Cassava and Pigeon pea Flours ..................................................................................................... 53
Table 14. Chemical Composition1 (d.b.) of Bread Made From Wheat Flour Supplemented with
Cassava and Pigeon pea Flours ..................................................................................................... 59
Table 15. Chemical Composition1 (d.b.) of Cookie Made From Wheat Flour Supplemented with
Cassava and Pigeon pea Flours ..................................................................................................... 60
Table 16. In vitro digestibility1 of Carbohydrate and Protein of Bread and Cookie Samples
Supplemented with Cassava and Pigeon Pea Flours .................................................................... 62

ix
LIST OF FIGURES
Figure 1. Flowchart for high quality cassava flour (HQCF) preparation ....................................... 22 Figure 2. Bread and cookie photographs ...................................................................................... 63

1
CHAPTER 1
INTRODUCTION
Wheat is the third most important cereal crop after maize and rice, with world
production of 695 million metric tons annually (FAO, 2008). Among the cereal flours, wheat is
extensively used for breadmaking among other uses. The unique breadmaking properties of
wheat flour are due to its gluten protein that, when hydrated, forms strong, cohesive dough
that retains gas and produces a light, aerated baked product (Hoseney, 1998). Malawi produces
wheat on a very small scale due to its ecology, and relies on importation of wheat and wheat
flour for its bakery and confectionery industry. Malawi has a domestic demand of 100,000
metric tons but only 5,000 metric tons is locally produced with 71,370 metric tons imported at
a cost of about $21.5 million a year (NSO, 2007). Such importation has led to a huge loss of
currency and increased retail price of baked wheat products. Due to the high cost of and high
demand for wheat flour, efforts are being directed toward developing, evaluating and providing
alternative formulations of flour for bread and cookie making. The new formulation of flour for
bread and cookie making is proposed to include cassava and pigeon pea flours, to be
substituted for a portion of wheat.
Cassava (Manihot esculenta) has been studied extensively as the best raw material to
partially replace wheat. Cassava flour is preferred in the bakery industry because of its good
baking properties and also low production cost compared to other non-wheat flours (Falade
and Akingbala, 2008). Some significant studies have been conducted to assess the feasibility of
incorporating cassava flour in wheat-based baked products. Defloor et al. (1995) and Khalil et
al. (2000) reported that partial replacement of cassava flour at 15% for wheat resulted in bread

2
with significantly improved quality and consumer acceptability. It has also been reported that
substitution of wheat flour with 20% cassava flour resulted in good color, flavor, and texture of
cookies (Mlingi et al., 1998). In general, the research findings have demonstrated the possibility
of partial substitution of wheat flour with cassava flour and, therefore, utilization of cassava
flour in baked products is suggested to minimize production costs and high retail prices of
baked products.
Despite research verifying the ability of wheat and cassava flour mixtures to improve the
color, flavor, and texture of baked products, and the high level of consumer acceptability, the
main weakness is the low levels of protein of cassava (1–2%) compared to wheat (10 – 15%).
These products could threaten the sustainability of human health, and might result in increased
prevalence of malnutrition if consumed for long and in relatively huge quantities (Balagopalan
et al., 1992). The nutritional status of the Malawian population remains critical. Although short-
term interventions such as vitamin supplementation and food fortification with vitamins and
micro nutrients have been done, the prevalence of malnutrition is still very high (FAO, 2010).
Moreover, supplementation and fortification are expensive and not effective. A more effective
and efficient approach to avoid chronic nutritional problems in populations consuming a large
amount of cassava-based products could be protein enrichment of the cassava flour used in the
preparation of such products (Graham and Archbold, 1984).
Significant studies have been implemented to improve the nutrient profile of cassava-
based products. According to Graham and Archbold (1984), compared to products made from
cassava flour alone, the protein-enriched products showed increase in protein content ranging
from 5-27% and were all highly acceptable by the members of the taste panel. The increase in
3
protein content in the baked products was due to the high protein content of the leguminous
flour with which cassava flour was supplemented.
The pigeon pea (Cajanus cajan) is an important grain legume commonly grown and
consumed in tropical and sub-tropical regions of the world (ICRISAT, 1991). In Malawi, pigeon
pea is underutilized as it is only consumed as relish in fresh or dry form, despite being
nutritious. Mature seeds have a protein content of 18.8% (dry basis), and are a rich source of
lysine but, like soybeans, are deficient in sulfur-containing amino acids such as methionine and
cysteine (Singh and Diwakar, 1993). On the other hand, cassava is deficient in lysine but
contains moderate amounts of methionine and cysteine (Longe, 1980). Therefore, it is
envisaged a blend of cassava and pigeon pea flours would result in enriched baked products
with a good balance of some of the essential amino acids.
Compared to soybeans, pigeon peas have been used little in baked foods or
confectionery products despite some research studies conducted. Gayle and others (1986)
reported that protein values increased from 9.2% to 13.0% as pigeon pea flour was increased in
wheat-pigeon pea flour bread. They further reported that the overall acceptability of the bread
was high. In an evaluation of cookies made from cocoyam and pigeon pea flour, Okpala and
Okoli (2011) observed that protein content ranged from 6.40% for cookies made from 100%
cocoyam flour to 12.97% for cookies made from 100% pigeon pea flour.
Utilization of local crops in baked products could lead to economic enhancement
through reduction of importation costs of wheat flour. In addition, use of local crops like
cassava and pigeon pea (Cajanus cajan) in baking will enable cheap and nutritious baked

4
products to become available and affordable to many people, thereby reducing prevalence of
malnutrition in the country.
1.1 Objectives
The objectives of the study were to;
produce pigeon pea and cassava flours,
evaluate the effects of supplementing wheat flour with pigeon pea and cassava flours
on dough rheology using the Alveograph,
assess the viscosity of wheat, cassava and pigeon pea blended and non-blended flours
using the Brookfield viscometer,
evaluate the physicochemical properties and baking qualities of breads and cookies
made from wheat-cassava-pigeon pea flour blends, and
evaluate the digestibility of carbohydrates and proteins in the baked products.
1.2 Hypothesis
Breads and cookies supplemented with pigeon pea and cassava flours will display
different physicochemical and baking properties from breads and cookies made from
wheat flour alone.
1.3 Justification
For many years Malawi has been relying on importation of wheat and wheat flour for its
bakery industry. Such importations have led to high production costs for baked products,

5
resulting in skyrocketing retail prices of baked products making the majority of the rural
communities unable to purchase such products. Past research has demonstrated that cassava
and pigeon pea flours can be partially substituted for wheat flour in the baking of bread and
cookies. This offers great opportunity to reduce overreliance on wheat flour as the only raw
material for bread and cookie making, and also should reduce retail prices of baked products.
Cassava and pigeon peas are the potential crops to be evaluated for blending with wheat flour
for products with increased baking qualities, human nutrition and reduced costs of production.
The targeted crops for blending with wheat flour are adaptable and largely produced in Malawi.
As a result, import costs for raw materials will be significantly reduced. In general, utilization of
cassava and pigeon pea flours will reduce overreliance on wheat flour and result in nutritious
products affordable to the rural masses, hence improving both Malawian nutrition and the
national economy.
Evaluation of the physicochemical and baking qualities of baked wheat products
supplemented with cassava and pigeon pea flours is a major step in facilitating utilization of the
flours in baking. Knowledge of these characteristics will enhance utilization of the flours in
bread and cookie making. Successful results from the study will be extended to the rural
communities so that they can have skills on standalone ability to make breads and cookies from
locally available raw materials. The main aim of the study, therefore, was to evaluate the
physicochemical properties and baking qualities of bread and cookie samples made from
wheat-cassava-pigeon pea flour blends as compared to non-blended wheat flour (control).

6
CHAPTER 2
LITERATURE REVIEW
2.1 Wheat
Wheat is the world’s third most important crop after maize and rice. Worldwide, wheat
flour is used as the raw material for baking. The gluten protein in wheat makes it a unique
substrate for breadmaking. The three main types of wheat are soft, hard, and durum. Unlike
hard and durum wheats, which are used mainly for bread and pasta products, respectively, soft
wheat has more than one major use, Including cookies, cakes, crackers and pretzels (Hoseney
1998).
The protein content varies significantly in wheat varieties and it ranges between 10 and
15% (Anjum and Walker, 2000). Wheat proteins contain albumins, globulins, gliadins and
glutenins. While albumins and globulins are soluble in water and salt solution, respectively,
gliadins and glutenins are collectively called gluten and are insoluble in water and salt solution.
It has been shown that the gluten proteins are responsible for the cohesive, viscoelastic
property of wheat flour dough and the dough’s ability to retain gas during fermentation as well
as dough setting during baking (Hoseney, 1998). To form cohesive and viscoelastic dough,
gluten requires adequate hydration and kneading to promote cross linkages between glutenins
and gliadins.
2.1.2 Gluten proteins
Among the cereal flours, only wheat flour has the ability to form gluten proteins when
mixed with water to form a viscoelastic material that retains gas, resulting in high quality baked

7
products. Hundreds of protein components which are present as either monomers or, linked by
interchain disulfide bonds, as oligomers and polymers make up the gluten proteins (Wrigley
and Beitz, 1998). They are unique because they are characterized by high contents of glutamine
and proline, but are low in basic amino acids like lysine. The low content of basic amino acids
implies that the level of electrical charges is very low. Thus, the low-charge density enhances
interaction among the molecules forming the gluten, a condition that appears to be extremely
necessary for dough formation (Hoseney, 1998).
The amino acid composition of gluten proteins also shows that about 35% of the total
amino acids have hydrophobic side chains and hence the polar sides are not accommodated in
the hydrophobic core of the protein (Hoseney, 1998). As a result, there is an increased
hydrophobic interaction between gluten proteins. The hydrophobic interactions significantly
contribute to the stabilization of gluten structure. In addition, the tendency of hydrophobic
interactions to increase in energy with increasing temperature provides even more stability
during the baking process.
Gliadin molecules have intra-molecular disulfide linkages resulting in a compact and
globular shape. Compared to glutenins, gliadins have a low molecular weight of about 40,000
(Hoseney, 1998). The presence of disulfide bonds explains the need to knead the dough to
break disulfide bonds between adjacent chains and realign them to form a continuous protein
sheet (Stauffer 1998). When hydrated, gliadins have little or no resistance to extension, and are
responsible for the dough’s cohesiveness.
Glutenin proteins are a heterogeneous group of proteins and multichained, linked by
interchain disulfide bonds, with average molecular weights of about 3 million (Hoseney, 1998).

8
The high molecular weight of glutenins has been recognized as one of the main contributing
factors to wheat’s desirable dough properties and baking performance. Physically, the protein is
resilient and rubbery but not prone to rupture and gives the wheat dough its property of
resistance to extension (Hoseney, 1998).
2.2 Cassava (Manihot esculenta, Crantz)
Cassava is an important source of food and income throughout the tropics, including
Africa, Asia and Latin America. About 600 million people in Africa, Asia and Latin America
depend on the plant for their survival, deriving calories and income from the roots and leaves
(IFAD, 2008). Cassava production in Africa has more than tripled since 1961, from 33 million
metric tons per year to 101 million metric tons, making the continent the largest producer in
the world (IFAD, 2008). Advantages of cassava as a crop include flexibility in planting and
harvesting time, drought tolerance, and ability of cassava to grow and produce in low nutrient
soils, where cereals and other crops do not grow well (Onwueme, 1978; Nassar, 2005).
In Malawi, cassava is the most important root crop. Cassava plays an important role as a
cash crop for smallholder farmers, middlemen, as well as sellers in various markets, and is
gradually becoming an important industrial crop (Benesi et al., 2001). It is grown country wide
and is a staple food crop for more than 30% of the population along the central and northern
lake shore areas of Lake Malawi and the Shire highlands (Moyo et al., 1998). Country wide,
cassava is used as a food supplement, a main part of breakfast, and snack food (Moyo et al.,
1998). Cassava leaves are an excellent source of protein compared to legumes and are
commonly consumed as vegetables in many parts of the country. The fresh cassava leaves

9
contain 17-18% dry weight protein (FAO, 1993). The leaves are particularly important in the dry
season when other green vegetables are in short supply.
2.2.1 Nutritive value of cassava flour
Cassava is commonly known to be a good and cheap source of carbohydrates. After
sugarcane, it is considered to be the highest producer of carbohydrates among crop plants. The
protein, vitamin and mineral contents in cassava are very low. In addition, it lacks essential
amino acids such as lysine (Balagopalan et al., 1992). In general, cassava is often considered
inferior to maize and wheat because of its low levels of proteins, vitamins and minerals. The
low protein content necessitates fortification of cassava flour with legume flour in order to
improve the protein content of the end product.
Table 1. Chemical Composition of Fresh Cassava Root Component Percentage (by weight)
Water 62 - 65 Carbohydrate 32 - 35 Protein 0.7 – 2.6 Fat 0.2 – 0.5 Fiber 0.8 – 1.3 Ash 0.3 – 1.3
Source: Cited by Wenham, 1995
2.2.2 Cyanogen content of cassava
All cassava plant parts, apart from the seeds, contain cyanogenic glycosides (CG), a
chemical substance responsible for bitterness of cassava roots and toxicity in humans. Cultivars
with <100 mg CG kg-1
fresh weight cassava are called ʽsweet’, while cultivars with 100 to 500
mg CG kg-1
are ʽbitter’ cassava (Wheatley et al., 1993). The most abundant CG in cassava is

10
Linamarin (85%), with lesser amounts of Lataustralin. Total CG concentration depends on
cultivar, environmental conditions during growth, agronomic practices and plant age
(McMahon et al., 1995). Linamarin is synthesized in the leaf and transported to the roots. It is
therefore a standard practice to process bitter cassava roots to remove CG before consumption
to avoid food poisoning. Hydrogen cyanide gas (HCN) is released from CG when cassava tubers
are macerated as in chewing or grating. According to O’Hair (1990), juice extraction,
fermentation, frying or a combination of these processing treatments aid in reducing the HCN
concentrations to safe levels. Akingbala et al. (2005) reported about 95% decrease in HCN
content after grating and nearly 98% decrease after fermentation of cassava.
2.2.3 Cassava processing
Due to high moisture content (~70%), fresh cassava tubers are highly perishable and
become inedible within 24-72 hours after harvest. Physiological deterioration starts as soon as
roots are harvested, due to enzymatic reactions, while secondary deterioration occurs 5 to 7
days after harvest. Secondary deterioration occurs due to microbial infection of mechanically
damaged tissues and results in some tissue discoloration with vascular streaks spreading from
the infected tissue (Wheatley and Chuzel, 1993). Therefore, processing of cassava helps to
reduce postharvest losses and stabilizes seasonal fluctuations in the supply of the crop (Hahn,
2007). In Malawi, processing of cassava is done on a small scale. Cassava is processed into
ingredients like flour and starch that are used in bread and doughnut making. Flour is
commonly used in the food industry while starch is used in both the food and non-food
industries. Industrial applications for cassava flour and starch depend on the physicochemical

11
properties and baking qualities of baked products. Therefore the study of physicochemical
properties and baking qualities of cassava flour in baked products is important.
2.2.4 Physicochemical properties of cassava flour
Efforts are being made to partially replace wheat flour in commercial food products with
non-wheat flours, as a promising means to increase utilization of indigenous crops. In view of
this, physicochemical and functional properties of CF have been studied to maximize its
industrial use. The functional properties of cassava and soy flour blends were studied by Akubar
and Ukwuru (2003). It was observed that CF had less capacity than soy flour (SF) to bind and
retain water as well as oil. The high water and oil absorption of SF was explained by the high
protein content of soybeans. Kinsell (1976) reported that soy protein absorbs water up to 200%
its weight whereas carbohydrate absorbs only 15% of its weight in water. Akubar and Ukwuru
(2003) further reported that the water and oil absorption capacities of the SF: CF blends
increased with increasing levels of SF. The flour blends had greater water and oil absorption
capacities than the CF alone. The properties may give an advantage to the blends comparative
to CF in baked doughs where hydration to improve handling characteristics is required.
Dough rheology studies showed that the dough development times for cassava and
wheat flour blends were shorter than for the 100% wheat flour (WF), and decreased as the
extent of substitution with CF increased (Eggleston, 1993). This was correlated with dilution of
gluten caused by the addition of the CF, and also indicated that water uptake by the various
components present in the CF was faster. Dough stability, which indicates how much additional
mixing can be applied to a dough sample before it begins to break down, was much lower for

12
doughs made with the flour blends than with 100% WF, suggesting an overall weakening of the
doughs with increased substitution of CF (Eggleston, 1993).
Evaluation of the physicochemical properties of biscuits made from wheat-cassava flour
blends showed that increases in the levels of CF resulted in decreases in protein content from
13.04% in 100% WF biscuits to 8.4% in 40% CF: 60% WF biscuits (Oluwamukomi et al., 2011).
This was attributed to the low protein content of the CF (1-2%) which would have lowered the
protein content of the wheat-cassava flour blend. Addition of 10% soy flour (SF) to CF resulted
in increases in protein and fat contents of cookies, thus improving the nutritive value of the
cassava cookies (Akubar and Ukwuru, 2003). For example, the 100% CF biscuits contained 1.6%
protein and 10.7% fat. These values increased to 32.2% protein and 30.5% fat, respectively, for
the 20:80 (CF: SF) biscuits which had the highest level of SF incorporation (Akubar and Ukwuru,
2003).
Addition of CF to SF resulted in reduced color, crispiness, taste and flavor of biscuits, but
increases in diameter, spread ratio and height of the biscuits were observed as cassava level
was increased (Oluwamukomi et al., 2011). The increase in diameter and spread ratio was due
to the starch polymer of cassava whose molecules is loosely connected and expands more
when heated (Oluwamukomi et al., 2011). Notably, there was no significant difference in the
overall acceptability between biscuits made with 100% WF and those made with the wheat-
cassava-soy flour blend. The findings strengthen the possibility of using cassava flour in biscuit
making.
Loaf volume of bread largely depends on the gluten content of wheat flour. This is the
reason why wheat is the unique raw material for breadmaking. When gluten is hydrated, it

13
forms a viscoelastic network that retains more gas during baking, hence yielding an increased
bread loaf volume (Hoseney, 1998). Use of composite flour, like cassava and wheat flour blend
has resulted in reduced loaf volume (Eggleston, 1993, Ciacco and D’Appolonia, 1976). The
reason for the reduced volume is the dilution of gluten protein as more cassava flour was
added. Despite the reduced volume, differences in consumer preference for wheat bread and
composite flour bread were not significant, thus acceptable bread can be made from composite
wheat-cassava flour.
Hydrogen cyanide is a poisonous substance that is found in cassava roots and therefore
its content in baked products made from cassava must be assessed to avoid food poisoning.
Oluwamukomi et al. (2011) reported that the hydrocyanic acid content (HCN) of the biscuits
increased as the level of cassava flour increased in the formulation, with 70% CF biscuits having
the highest HCN value of 0.02 mg/kg of product. This observed HCN content is below the
maximum allowable level of 1 mg/100 g of flour recommended by the Codex Alimentarius
Commission (1985), thus making the biscuits safe for human consumption.
2.2.5 Pasting properties of cassava flour
In the development of any food product from starchy crops, the knowledge of the
material’s pasting properties is needed to predict behavior under a given processing condition.
The pasting properties of flour and/or starch relate to swelling and solubility properties of
starch granules in the presence of moisture and heat. The pasting behavior of cassava flour was
well studied by Eggleston (1993). The researchers observed that the typical high degree of
swelling of cassava starch granules, on attaining the pasting temperature, results in a high peak

14
viscosity and that the subsequent paste is not very stable, readily breaking down. The pasting
properties were correlated with starch damage, as samples with high starch damage had low
peak viscosity values (Eggleston, 1993).
2.2.6 High quality cassava flour (HQCF)
Traditionally, cassava has been processed into flour by producing peeled dried cassava
chips that are then milled into flour. Alternatively, peeled roots of bitter varieties are
submerged in water for 2 to 3 days to detoxify and soften them. The roots are then dewatered
(pressing out the remaining water), dried, and milled into flour. Soaking and drying subjects the
roots to fermentation which renders them acidic with a strong odor. This makes the roots and
flour unsuitable for food utilization in industrial processing such as baking and confectionary
making.
High quality cassava flour production is a technique that produces high quality cassava
flour (HQCF) within 24 hours of harvesting fresh cassava roots, without the roots undergoing
fermentation. This is a method that was developed by the International Institute of Tropical
Agriculture (IITA) and it produces flour with low cyanide levels that is acceptable to food
industry users. Cassava roots from bitter and/or sweet varieties are peeled, washed, and grated
followed by adequate dewatering or pressing and immediate drying prior to milling and sieving
(Diedzoave et al., 2003). The taste of HQCF depends on the cassava variety that was used to
produce it. It could be white or cream in color, sweet or bland in taste, and odorless. HQCF has
become an important raw material in many African countries where cassava is grown on a large

15
scale, because it has properties similar to cassava starch and it has no odor associated with the
fermented flour.
2.3 Pigeon peas (Cajanus cajan)
The pigeon pea belongs to the family Leguminaseae and is among the important grain
legumes grown and consumed in the tropics and the semi-arid tropics of the world (ICRISAT,
1991). The crop is well known for its ability to tolerate drought and its wide adaptability to
different environmental conditions. In addition, it improves soil fertility and its biomass is a
good source of organic matter. Nutritionally, pigeon peas are rich in protein particularly lysine
but deficient in sulfur-containing amino acids such as methionine and cysteine. The protein
content of commonly grown pigeon peas has been reported to range between 18 and 26%. This
makes it a good complementary choice for use in baking of cereal and root- and tuber-based
products to enhance the nutritive value of the products. Throughout Africa, including Malawi,
the crop is grown for food and feed (ICRISAT, 1991). The green peas are cooked as a relish or a
snack. When dried, the legumes are also cooked as a relish and eaten along with maize or
cassava meal. In addition, the dried legumes are used as an ingredient in feed formulation for
poultry or cattle.
2.3.1 Nutritive value of pigeon peas
Starch and protein are the major constituents of pigeon pea grains. Aleytor and
Aladetimi (1989) and Oshodi and Ekperigin (1989) reported that pigeon peas contain a
moderate level of crude protein (21%), about the same as in cowpeas. Pigeon peas also contain

16
significant levels of fat and ash, which can potentially contribute to essential fatty acids and
minerals in the diet (Oshodi et al., 1993). The pigeon pea protein is extremely comparable with
soybean protein in its content of essential amino acids. Comparison of amino acid content and
the FAO/WHO (1985) amino acid reference values show that leucine, lysine, phenylalanine,
isoleucine and valine in pigeon peas were on the high side of the recommended range of amino
acid requirements for infants, and significantly higher than the minimum values recommended
for preschool and school children. However, pigeon peas are usually deficient in the sulfur-
containing amino acids, methionine and cysteine. They thus complement the essential amino
acids in cereals which contain methionine and cysteine but lack lysine as reported by Gopalan
et al. (1971) and Daniel et al. (1970).

17
Table 2. Nutritive Value of Pigeon Peas Constituents Green seed Mature seed
Protein (%) 21 18.8
Protein digestibility (%) 16.8 58.5
Trypsin inhibitor (units mg-1
) 2.8 9.9
Starch (%) 48.4 53.0
Starch digestibility (%) 53.0 36.2
Amylase inhibitor (units mg-1
) 17.3 26.9
Soluble sugars (%) 5.1 3.1
Flatulence factors (g 100g-1
soluble sugar) 10.3 53.5
Crude fiber (%) 8.2 6.6
Fat (%) 2.3 1.9
Minerals and trace elements (mg 100-1
g dry
matter)
Calcium 94.6 120.8
Magnesium 113.7 122.0
Copper 1.4 1.3
Iron 4.6 3.9
Zinc 2.5 2.3
Vitamins (mg 100-1
g fresh weight of edible
portion)
Carotene 469.0
Thiamin 0.3
Riboflavin 0.3
Niacin 3.0
Ascorbic acid (vitamin C) 25.0
Source: Faris et al, 1987.
2.3.2 Protein quality
Protein quality is a main factor for pigeon pea selection for use in any food processing
operation. The protein quality of pigeon peas is measured by the protein content, the levels of
various amino acids, and by protein digestibility (Singh and Eggum, 1984). The sulfur-containing
amino acids, methionine and cysteine, are the most limiting amino acids in legumes in general,
and very low contents of these amino acids were reported by Eggum and Beames (1983) for

18
legumes. Cooking is the common processing operation that has significant effects on protein
quality, in terms of amino acids and bioavailability of legume proteins. Cooking at high
temperatures or cooking for a long time may destroy certain amino acids and make them
unavailable, since each amino acid has its optimum temperature at which it is stable. Any
temperature above the optimum or excessive exposure to high temperatures may destroy the
amino acid and make it unavailable to the body when consumed by an individual.
2.3.3 Antinutritional factors
Pigeon peas have antinutritional factors such as digestive inhibitors, oligosaccharides,
phytates, and tannins. The digestive inhibitors and toxicants such as hemagglutinins inhibit the
activity of the digestive enzymes such as trypsin, chymotrypsin, and amylase (Onwuka, 2006).
Other antinutritional factors such as tannins and phytates decrease the absorption of divalent
metal ions in the intestine. These antinutritive factors form insoluble complexes with such
divalent ions as Fe++ and Zn++, and therefore make them unavailable for absorption (Elegbede
1998). However, the inhibitors can be removed wholly or in part by suitable processing
methods such as heating (Onwuka, 2006), soaking (Raw and Deosthale, 1982), fermentation
(Zamora and Fielda, 1979), decortication (Rao and Deosthale, 1982) and germination (Jaya et
al., 1975). Therefore, effective processing of pigeon peas before utilization is suggested to limit
the effect of antinutritional factors and enhance the nutritive value.

19
2.3.4 Physicochemical properties of pigeon peas baked products
Utilization of legumes such as pigeon pea flour in bread and confectionery products is
critical in an effort to introduce nutritious products through the creative use of indigenous
crops. This also serves to reduce importation costs of wheat flour, particularly in tropical
countries where environmental conditions are not suitable for wheat growing (Falade and
Akingbala, 2008). Pigeon pea flour has been little used in baked foods or confectionery
products despite extensive research work done on baking quality and functional properties.
Physicochemical properties of pigeon pea flour are important factors in determining the role of
the flour in food processing and its impact on product quality.
Significant research work has been done to study the physicochemical properties of
baked products made with pigeon pea flour. Gayle et al. (1986) reported that physical, sensory,
and nutritional characteristics of bread samples from wheat flour supplemented with pigeon
pea flour from 0-25% had no significant differences (P< 0.05) compared with unsupplemented
breads for the characteristics tested. In their study, as pigeon pea flour was increased from 0 to
25%, protein content of the bread increased from 9.2 to 13.0%, and lysine increased from 0.3 to
171.0 mg lysine/16 g N (Gayle et al., 1986).
The effect of pigeon pea flour supplementation on wheat flour biscuits was also studied
by Tiwari et al. (2011). Incorporation of pigeon pea dehulled flour (PPDF) and pigeon pea by-
product flour (PPBF) to wheat flour (WF) increased the protein content of biscuits from 6.21 to
8.00 g/100 g flour and from 6.21 to 8.64 g/100 g flour, respectively. Supplementation of PPDF
and PPBF affected diameter, thickness and spread ratio. In general, biscuit diameter was
reduced, while thickness increased with increased substitution level (Tiwari et al., 2011).

20
However, the relationships among flour composition and diameter and thickness were
statistically different. According to the authors, although the inclusion of PPDF and PPBF
affected the physical properties, the overall acceptability of PPDF and PPBF biscuits was not
statistically different from that of WF biscuits. In summary, the findings from the research study
confirm the feasibility of utilizing pigeon pea flour (PPF) in biscuit making.

21
CHAPTER 3
MATERIALS AND METHODS
3.1 Raw materials
3.1.1 Pigeon pea flour preparation
The pigeon pea grains were bought from Chitedze Agricultural Research Station in
Lilongwe, Malawi. The grains were graded, cleaned, and soaked in water for 38 hours, after
which they were dehulled manually while still wet. The loosened seeds were washed and oven-
dried at 500C for 7 hours or until the moisture content reached 11.5%. The dried grains were
milled by a hammer mill to pass through a 1 mm sieve, packaged in airtight containers, and
stored at room temperature (25 to 280C) until use.
3.1.2 Cassava flour preparation
High quality cassava four (HQCF) was used for bread and cookie baking in the study. The
flour was processed at Chinangwa Mbatata Roots and Tubers Enterprise (CMRTE) in Zomba,
Malawi. Cassava roots were peeled and washed before grating by a mechanical grater to form a
wet mash. After grating, the grits were compressed by a hydraulic jack to remove hydrocyanic
acid (HCN) and water. The lumps resulting from pressing were sundried on racks for 5 to 7
hours and then milled using a hammer mill. After milling, the flour was sieved to pass through a
0.5 mm sieve. The process took place within 24 hours of harvesting cassava to avoid
fermentation that often results in bad odor. HQCF was stored in airtight containers at room
temperature (25 to 280C) until use. Below is a flow chart of the procedure (Fig. 2).

22
Figure 1. Flowchart for high quality cassava flour (HQCF) preparation.
3.1.3 Wheat flour
Biscuit wheat flour from soft wheat was obtained from Bakhresa Grain Milling Company
(BGM, Blantyre, Malawi) as already-milled flour. The packaged flour samples were kept in
airtight containers and stored at room temperature (25 to 280C) until use.
3.2 Flour blending
The composite flours were blended as shown in Table 1. Wheat flour was used as a
control flour sample. Samples A, B, C and D were wheat flour substituted with increasing
amounts (5, 10, 15 and 20% w/w, respectively) of both cassava and pigeon pea flours. Samples
A, B, C and control were used for breadmaking while samples B, C, D and control were used for
cookie-making. Flours were mixed by a Hyaundai kitchen mixer (Beijing, China) at a speed
Peeling and washing
Grating and pressing
Sun drying (5 – 7 hr)
Milling
HQCF

23
setting of 1 for 5 min. The flour blends were kept in labeled airtight containers at room
temperature (25 to 280 C) until their use.
Table 3. Composite Flour Formulations (% by weight)
Sample Wheat flour (%) Cassava flour (%) Pigeon pea flour (%)
A 90 5 5
B 80 10 10
C 70 15 15
D 60 20 20
E (control) 100 - -
3.3 Flour tests
The flour tests in sections 3.3.1 through 3.3.4 were performed at BGM Company in
Blantrye, Malawi. The flour functional properties and viscosity studies in sections 3.3.5
through 3.3.7 were done at Chancellor College in the Zomba district of Malawi.
3.3.1 Determination of flour particle size
Particle size distributions of each of the three flour samples were determined using a
Ro-tap apparatus with sieves arranged in order of decreasing mesh sizes of 330, 250, 180, 150,
and 125 µm. One hundred grams of each sample was sieved by the apparatus for five minutes.
For each flour sample, the overs of each sieve were collected and weighed and the respective
particle size amount was expressed as g/100g.

24
3.3.2 Alveograph test
Alveograph testing was performed by the Chopin Alveograph (Paris, France) according
to AACCI Method 54-30A (AACCI, 2000) to determine gluten strength of each sample, in
duplicate. A sample of 250 grams of flour was mixed with 2.5% w/w salt solution to form a
dough. Circular dough patties were formed and then rested in the Alveograph in a
temperature-regulated compartment at 250C for about 20 min. The Alveograph blew air into a
dough patty, which expanded into a bubble that eventually broke. From the graph, the effect of
pigeon pea flour and cassava flour inclusion on the Alveostrength of wheat flour was
determined.
3.3.3 Determination of α-amylase activity
The Falling Number machine 1500 (Perten Instruments, Huddinge, Sweden) was used to
determine the α-amylase activity of flour and flour blends following AACCI Method 56-81B
(AACCI, 2000). Seven grams of sample was added to 25 ml water in a special tube and shaken
by the Falling Number machine to aid dispersion. The tube and its contents were heated in
boiling water at 1000C for 60 s. The viscosity of the gel at the end of heating time was
measured by allowing the stirrer-plunger to fall through the gel. The total heating time plus the
time the plunger took to fall the set distance through the gel is called the Falling Number. A
Falling Number value of 300 and above means low α-amylase activity.

25
3.3.4 Determination of gluten content
Gluten content was determined according to AACCI Method 38-12 (AACCI, 2000) by
Glutomatic (Perten Instruments, Huddinge, Sweden). Ten grams of flour was weighed and
loaded into the machine to form a dough. The dough was washed with 2% (w/v) salt solution
and centrifuged in a special sieve cassette. The centrifuged dough and remainders were
weighed and then weight of wet gluten was calculated.
3.3.5 Determination of water and oil absorption capacities
Water and oil absorption capacities of flours and blends were determined as described
by Eke and Akobundu (1993). One gram of flour sample was mixed with 10 ml distilled water or
oil in a weighed centrifuge tube. The slurry was agitated on a Vortex (Scientific Industries, Inc,
Bohemia, NY, USA) for 2 min, and allowed to stand at room temperature for 30 min. The slurry
was then centrifuged in a high speed micro centrifuge (Seiko Co. Ltd, Tokyo, Japan) at 500 X g
for 30 min. After centrifuging, the clear supernatant was decanted and discarded. The adhering
drops of oil and water were removed from the tube and the tube and its contents weighed. The
weight of water or oil absorbed by 1 g of flour was calculated as {(W2 – W1/W1) X 100} and
expressed as water or oil absorption capacity.
3.3.6 Determination of swelling power
Swelling power (SP) of each flour and each flour blend were determined according to
Eerlingen and Declour (1997) with some modifications. The SP of each flour sample was
measured at 700C and at 80
0C independently. A sample of 0.1 g was heated at 70
0C or 80
0C for

26
15 min in a water bath with intermittent shaking. The sample was then centrifuged by a high
speed micro centrifuge (Seiko Co. Ltd, Tokyo, Japan) at 3000 x g for 15 min. The supernatant
was decanted into a test tube and the sediment weighed. The decanted supernatant was also
collected, dried and weighed. SP was calculated as {(dry matter weight/sediment weight) X
100}.
3.3.7 Viscosity tests
Flour viscosity was measured by the Brookfield viscometer (Brookfield Engineering
Laboratories, Inc, Soughton, MA, USA) at 700C and at 80
0C independently. Each flour
suspension (50 g in 450 ml distilled water) was heated at 700C or 80
0C. Spindle number 3 was
used to stir the mixture at a shear rate of 100 rpm. A conversion factor of 20 was used to
convert the dial reading. Thus, the dial reading was multiplied by 20 to come up with viscosity
in centipoise (Cp).
3.4 Baking studies
3.4.1 Breadmaking procedure
Samples A, B, C and control were evaluated for breadmaking (Table 3) at BGM Company
in Blantrye, Malawi. The ingredients are listed in Table 4 with their formula amounts. Loaves of
bread were prepared from 200 g of pigeon pea-wheat-cassava flour blend or control wheat
flour (Table 4), according to AACCI Approved Method 10-10B (AACCI, 2000) with some
modifications. Breads were made in triplicate for each sample, with ingredients and amounts as

27
shown in Table 4. Yeast suspension, ascorbic acid solution, and sugar-salt solution were
prepared prior to mixing. Two hundred grams of flour (14% moisture basis), fungal amylase and
margarine were loaded into the mixer (MacAdams Baking Systems Pty Ltd, Cape Town, South
Africa). An indentation was made where the liquid ingredients were to be placed. Sugar-salt
solution, ascorbic acid, and yeast suspension were added in that order. Amount of water to be
added was determined from “hand feel” during preliminary baking tests. Dough was mixed
until smooth, approximately 4 to 7 minutes. Fermentation and proofing was done at 45 min by
a proofer (MacAdams Baking Systems Pty Ltd, Cape Town, South Africa). Sheeting and molding
was performed manually to a controlled thickness by means of gauge strips. First and second
sheetings were done at 3/16th
inch gauge strips. Panning was performed by 5/16th
inch and
then 3/16th inch gauge strips. The proofed doughs were baked in 18 x 8 x 6 cm baking trays at
1750C for 24 minutes. After baking, the bread was allowed to cool for 2 hours before physical
measurements. A batch of four loaves of bread was baked in a day and after physical
measurements, each loaf was wrapped in Ziplock bag and stored in a deep freezer at -40C until
chemical composition analysis.

28
Table 4. Breadmaking Formulation
Ingredient Amount per 200 g loaf
Flour or flour blend 200 g Sugar-salt solution 22 ml Margarine (50% fat) 20 g Fungal amylase 0.5 g Yeast suspension 40 ml Ascorbic acid 10 ml Water Variable (74 to 40 ml)
3.4.2 Physical analysis of bread samples
After sufficient cooling, the weight, volume, and height of each bread loaf were
measured. A digital balance (0.01 g accuracy) was used to measure bread weight. Volume was
measured by seed displacement method using rapeseed. A container of known volume was put
in a tray, and a bread loaf sample was placed inside the container. The container was then filled
with rape seed until overfilled. A straight edge was used to scrape across the top of the
container once to give a level surface. The volume of seed remaining in the container was
measured in a graduated cylinder and the amount of displaced seed calculated based on the
original known container volume. The procedure was repeated three times and the mean value
for displaced seed volume was calculated. The mean volume of the displaced seed was equated
to the volume of the bread loaf. Specific volume bread loaf was calculated as bread volume
divided by bread weight.
3.5 Cookiemaking procedure
Samples B, C, and D as indicated in Table 3 were evaluated alongside control (E) for
cookiemaking at BGM in Blantyre, Malawi. The ingredients included fine granulated brown
sugar, milk powder, iodized salt, baking powder and margarine and are listed with their formula

29
amounts in Table 5. Cookies were prepared according to AACCI Approved Method 10-54
(AACCI, 2000) with slight modifications. The batch size was adjusted to 200 g of flour or flour
blend. A single mixing stage was performed where all the ingredients were put into a mixer
(MacAdams Baking Systems Pty Ltd, Cape Town, South Africa) and mixed at low speed for a
total time of 2 min, with scraping after every 30 sec. The dough was rolled to the correct
thickness using gauge strips and cut using a 50 mm round cookie cutter. Cookies were baked at
1820C for 10 min in a convection oven. After cooling, cookies were analyzed for physical
characteristics. Cookies were baked in triplicate for each flour sample. A batch of cookies from
one flour sample was baked in a day. Physical measurements were taken after sufficient cooling
of cookies and thereafter cookies were put in a ziplock bag, and then stored in a deep freezer at
–40C until chemical composition analysis.
Table 5. Cookiemaking Formulation
3.5.1 Physical analysis of cookie samples
Cookies were analyzed for weight, diameter, height, and spread ratio. A digital balance
(0.01 g accuracy) was used to measure cookie weight. Two cookies from the same batch were
laid edge to edge and the total two-cookie diameter measured. Similarly, two cookies were
Ingredient Amount per batch
Flour or flour blend 200 g Sugar, fine brown granulated 80 g Margarine, (50% fat) 100 g Milk powder, (skim) 24 g Baking powder 3 g Salt 1 g Water Variable (45 to 55 ml)

30
stacked on top of each other and the total two-cookie height measured. Measurements were
done with digital Vernier calipers. Total two-cookie diameter divided by the total two-cookie
height gave the spread ratio.
3.6 Chemical analysis of flours, breads and cookies
The crude protein (Kjeldahl), fat (solvent extraction), moisture (oven), ash (muffle
furnace) and fiber contents were determined according to AOAC (1990) Methods.
Carbohydrate content was determined as the difference between the total sample weight and
that of the moisture, protein, fat, fiber, and minerals combined. Energy value (Kcal/100 g) was
calculated by the Atwater Method (Osborne and Voogt, 1998) (g of protein x 4; g of fat x 9; g of
carbohydrate x 4). Analyses were performed in duplicate for the flours, their composite blends
and the baked products. All the chemical analyses were done at Polytechnic in Blantyre,
Malawi.
3.6.1 Protein analysis
Protein content was determined by Kjeldahl Method. Two g dried sample were added to
2 tablets of mercuric sulfate and 250 ml sulfuric acid. The mixture was heated at 450 0C for 30
min in a Kjeltec digester until a clear solution was produced. 10 ml of 0.5% w/v sodium
hydroxide was added through a tube into a Kjeldhal distillation apparatus. The ammonia in the
sample was steam distilled for 5 min into a receiving flask containing 5% boric acid. The sample
was titrated with 0.1% v/v hydrochloric acid solution. Protein content was calculated by the
equation; Nitrogen X 5.8 for CF, WF, PPF and flour blends.

31
3.6.2 Fat analysis
Fat analysis was performed using an extraction apparatus. The apparatus consists of an
Extraction Unit and a Control Unit. Two g (W1) sample to be analyzed was weighed into
thimbles and inserted in the Extraction Unit. 80 ml of solvent was added into the extraction unit
and the thimble was closed with a cup. The cups were placed on an electrical heating plate to
heat the sample with extraction solvent. The 4-step extraction procedure consisted of boiling,
rinsing, recovery and pre-drying. After the extraction procedure, the sample was weighed again
(W2). Percent fat was calculated as {(W2 – W1)/W1 X 100}.
3.6.3 Moisture analysis
Five g (W1) sample was weighed into the container and placed in a vacuum oven at 130
0C for 1 hour. The sample was removed from the oven and cooled in a desiccator. After cooling,
the sample was weighed again (W2). Percent moisture was calculated as {(W1 – W2) X 100}.
3.6.4 Ash analysis
Two g of flour sample was weighed in a tarred crucible and transferred to a cool Muffle
Furnace before increasing the temperature stepwise to 6000C ± 5
0C. The temperature was
maintained for 4 hours or until a white ash was obtained. After ashing, the crucible was allowed
to cool in a desiccator and weighed soon after cooling. Percent ash was calculated as {(weight
of crucible and ash – weight of crucible)/ (weight of crucible and sample – weight of crucible) X
100}.

32
3.6.5 Fiber analysis
Two g of sample was weighed (W1) in a beaker and 150 ml of 1.25% sulfuric acid was
added. The sample was boiled for exactly 30 minutes while adding water continuously to the
boiling sulfuric acid to maintain the initial liquid level. After boiling, the boiled sample was
washed and filtered three times with 30 ml of hot deionized water. 150 ml of 1.25% preheated
potassium hydroxide (KOH) was added to the washed sample and then boiled for 30 minutes.
Water was continuously added to the boiling sample and KOH to maintain the initial liquid
level. After 30 minutes of boiling, the sample was washed and filtered twice using hot deionized
water and then cold deionized water to cool the sample. The sample was then washed three
times with 25 ml of acetone. The dry weight (W2) was determined after drying the sample in an
oven at 130 0C for an hour and cooling in a desiccator. Percent fiber was calculated as {(W2 –
W1/W1) x 100}.
3.7 Determination of total HCN
The HCN analyses were conducted at Chancellor College in Zomba, Malawi. Total
cyanogens of each of the baked samples was determined in duplicate using the Picrate Kit
Method (Bradbury et al., 1999) to assess the safety of the products for human consumption.
One hundred milligrams sample was placed in a small plastic bottle. A standard linamarase-
impregnated paper and 0.5 ml of water was added before the bottles were closed with a screw
cap. The bottles and contents were allowed to stand for 24 h at 300C, after which the Picrate
papers were removed from the plastic bottle and 5.0 mL of water added to elute the color. The

33
absorbance was measured at 510 nm using a UV-Visible spectrophotometer (Shimadzu
Corporation, Tokyo, Japan) and the value was used to determine the total cyanide content in
mg HCN equivalents/kg fresh weight = ppm. Total cyanide content was calculated by
multiplying the absorbance value by 396 (Bradbury et al., 1999); thereby giving an accurate
total cyanide analysis down to a minimum of 1 ppm total cyanide.
3.8 Digestibility studies
Digestibility studies were performed at Chancellor College in Zomba, Malawi.
3.8.1 In vitro carbohydrate digestibility (IVCD)
In vitro digestibility of carbohydrates of bread and cookie samples was determined
according to the method described by Shekib et al. (1988) based on starch-iodine color
changes. Samples of baked products were ground into powder in a blender. Starch was
extracted from the baked sample using 85% orthophosphoric acid. Five ml of starch solution
(obtained from a sample), 4 ml of 0.1 M phosphate buffer (pH 6.6), 1 ml of 0.003 M sodium
chloride, and 1 ml of α-amylase enzyme was measured and added into a test tube and the
whole solution mixed thoroughly to make the reaction mixture. Appropriate blanks with
enzymes were also prepared and incubated concurrently with samples at 370C for 1 hr. Aliquots
(0.2 ml) of the mixture were taken at time zero and at 1 hour after addition of the enzyme and
dispensed into 10 ml Lugol’s iodine solution (1:100 dilution) and the absorbance measured at
565 nm with a UV-Visible spectrophotometer (Shimadzu Corporation, Tokyo, Japan).
Absorbance of the blank was subtracted from each sample reading. Samples were analyzed in

34
duplicates. In vitro carbohydrate digestibility was calculated as: {(Absorbance at zero time –
Absorbance at 1 hour)/ Absorbance at zero time} x 100.
3.8.2 In vitro protein digestibility (IVPD)
Protein digestibility of bread and of cookie samples was determined in duplicate using
the procedure of Mertz et al. (1984). Samples of baked products were ground into powder by a
blender. Ground samples (200 mg) of bread or cookie was weighed into a flask and mixed with
35 ml of porcine pepsin (1.5 mg/ml of pepsin in 0.1 M phosphate buffer, pH 2.0). Samples were
incubated for 2 h at 370C in a shaking water bath. To stop digestion, 2 ml of 2M NaOH was
added. Samples were centrifuged using a High Speed Micro Centrifuge (Seiko Co., Ltd, Tokyo,
Japan) at 4900 X g, 40C for 20 min after which the supernatants were discarded. The residues
were washed and centrifuged twice, at the same centrifuge parameters, with 20 ml of 0.1 M
phosphate buffer (pH 7.0). Undigested nitrogen of the residues was determined using the
Kjeldahl method and multiplied by 5.8, to obtain undigested protein. The analyses were run in
duplicate baked sample. Digestibility was calculated as % digestibility protein (%P) = {(P in
sample ‒ undigested P)/P in sample x 100).
3.9 Experimental design and statistical analysis
The study was implemented in a complete block design with three replicates per sample
unless otherwise stated. Breads and cookies were made from wheat flour supplemented with
increasing levels of both pigeon pea and cassava flours (for total flour substitution levels of 10,

35
20, 30 and 40%). Pure wheat flour was used as the control for both bread and cookie samples.
Flour tests were performed prior to baking tests, while the chemical composition and
digestibility analysis were conducted on products after baking. All statistical analyses were
performed using GeneStat version 6.1 (Lawes Agricultural Trust, Rothamsted Experimental
Station, 2002). Analysis of variance (ANOVA) was performed to determine significant
differences among the samples. Means were compared using Fisher’s least significant
difference (LSD) procedure. Significance was defined at the 5% level.

36
CHAPTER 4
RESULTS AND DISCUSSION
4.1. Chemical composition of flours
Highly significant differences were observed among protein contents of samples (Table
6). Within the flour category, PPF (pigeon pea flour) had the highest amount of protein,
followed by the control (wheat flour, WF), and then CF (cassava flour), which was the
lowest. The protein contents of PPF and CF found in this study were similar to the literature
values for PPF (Eneche, 1999) and CF (Akubor and Ukwuru, 2003). The fact that PPF had the
highest amount of protein is mainly attributed to the high protein content of the pigeon pea
grain. Pigeon peas are legumes and are naturally rich in protein content. Among the blended
samples, the blend with 5% level of PPF substitution had the lowest protein content
(17.40%). Addition of PPF at high levels significantly enhanced protein content of the blended
samples. Thus, the high protein content of PPF makes it a useful material for supplementation of
lower protein flours, such as cassava and wheat flours, for preparation of protein-enriched
products.
All the test flours (WF, CF and PPF) originated from starchy crops, and thus samples
were analyzed for carbohydrate content (Table 6). Analysis of results shows significant
differences among samples (P<0.001). Within the flour category, the greatest amount of
carbohydrate was found in CF (84.00%), while PPF was the lowest. The results were expected
since cassava is mainly composed of carbohydrate available in the form of starch. Addition of CF
and PPF to WF in increasing proportions resulted in a stepwise decrease in carbohydrate content
37
of the flour blends. Among the flour blends, the blend with the highest proportion of CF (20%)
had the lowest carbohydrate content (64.21%). This is mainly due to the low CHO content of PPF
diluting the overall CHO in the blended flour samples. Olu et al. (2011) also reported a decrease
in carbohydrate content as a result of supplementing wheat flour with soybean flour.
Within the flour category, WF had the highest fat content, closely followed by PPF,
while CF had the lowest (Table 6). The grains of wheat and pigeon peas have considerable
amounts of fat and this might have resulted in high fat content of WF and PPF. Olalekan and
Bosede (2010) reported greatest amount of fat in PPF (4.78%) compared to cowpea and jack
bean flours. The results also revealed that CF is poor in fat. Incorporation of PPF resulted in high
fat contents of the flour blends compared to that of CF. Fat is important in product formulation
to improve texture and rheology of the product. The low fat content of CF implies that,
depending on the product type, fat needs to be added in the formulation if CF is to be used as
the main ingredient in the formulation to improve texture and rheology as well as the overall
quality of the final product.
According to results in Table 6, addition of non-wheat flours significantly influenced the
ash contents of flour samples (P<0.001). PPF had the highest ash content of 2.40% that was
significantly higher than all other flour or blended flour samples. The ash content of control
(WF) was not statistically different than that of CF. As expected, supplementation of WF with CF
and PPF at high levels greatly increased the ash content of the blended flour. This is mainly
explained by the high ash content of PPF which could have occurred due to contamination
during milling and inefficient milling. The absence of contamination during milling wheat was
responsible for low ash content of WF.

38
Incorporation of CF and PPF influenced the moisture contents of the blends. Within the
flour category, the moisture contents were 10.7%, 11.0% and 7.0% for WF, CF and PPF,
respectively (Table 6). The low moisture contents of the flours were also reflected in the blends;
the moisture contents of the blends ranged from 10.35% (60% WF) to 11% (90% WF). In
general, the moisture content of flour samples was low, which is important for storage of flours
for longer periods of time without deterioration.
Among the flour samples, the greatest amount of fiber was found in CF, whereas PPF
was the lowest (Table 6). The result is ascribed to the presence of high amounts of fiber in
cassava roots. The low fiber of PPF is explained mainly by the removal of the seed coat during
dehulling of pigeon pea grain. Addition of CF in high proportions (15 or 20%) resulted in marked
increases in fiber content of the blended flour samples. To this effect, the blended flour with
20% CF registered a fiber content of 1.45% representing a 19.4% increase in percent fiber
compared with control. The presence of fiber in CF is important as a source of dietary fiber in
baked products for human consumption. Dietary fiber is a non-starchy polysaccharide that is
neither digested nor absorbed in the stomach. The recent increased interest in dietary fiber is
related to its effects in the gastrointestinal tract. As undigested components, dietary fiber
increases satiety, promotes large bowel movements, and prevents bowel inflammatory
diseases and colorectal cancer (Topping and Anthony, 2003).
The energy of a food substance is a function of the total protein, fat and carbohydrates
present in that food. It is estimated by multiplying the gram amounts of protein, carbohydrate
and fat by their respective energy values (4, 4, and 9) and summing the three values. The
results have demonstrated that CF registered the lowest energy value (346.87 Kcal/100g)

39
among the three single-flour samples studied. The low energy of CF was expected because
cassava is a poor source of fat, which contributes the most energy by weight (9 kcal/g). A
stepwise decrease in amount of energy was observed among the blends due to addition of
increasing amounts of CF that diluted the fat contributed by WF and PPF. Notably, flour blends
with the highest content of CF (20 %) had the lowest energy value (355.43 kcal/100 g). Still, the
energy values of blended flours were above that of CF alone, implying that utilizing the flour
blends would result in higher energy baked products than from CF alone.

40
Table 6. Chemical Composition1 (d.b.) of Wheat, Cassava, Pigeon Pea and Blended Flours
Flour Sample2 % Protein % CHO % Fat % Ash % Moisture % Fiber Energy (kcal/100g)
100% WF 11.30b 67.24
e 3.00
e 0.61
a 10.75
b 1.20
c 364.76
c
100% CF 1.50a 84.00
g 0.80
a 0.84
a 11.00
c 1.80
d 346.87
a
100% PPF 32.65f 54.60
a 2.40
d 2.50
c 7.00
a 0.75
b 371.00
d
90%WF:5%CF:5%PPF 17.40b 68.30
f 1.94
c 0.57
a 11.00
c 0.80
a 360.24
bc
80%WF:10%CF:10%PPF 19.20c 66.52
d 1.77
bc 0.77
a 10.80
b 0.95
a 358.69
b
70%WF:15%CF:15%PPF 20.35d 65.31
c 1.58
bc 0.92
a 10.65
b 1.20
a 356.78
b
60%WF:20%CF:20%PPF 21.40e 64.21
b 1.45
b 1.15
b 10.35
b 1.45
a 355.43
b
SEM 0.16 0.27 0.17 0.17 0.28 0.09 2.20 1 Means with the same superscript in the same column are not significantly different (p<0.05). 2 WF = wheat flour, CF = cassava flour, PPF = pigeon pea flour, CHO = carbohydrate.

41
4.2. Particle size distribution of wheat, cassava and pigeon pea flours
Flour samples were sieved by a Ro tap apparatus with sieves arranged in order of
decreasing mesh size, and the amount of each particle size fraction was expressed as g/100g
sample. The result of particle size analysis showed that the amounts of PPF and of CF particles
were greatest in the large pore size category and decreased as mesh size decreased, while the
opposite was observed for WF (Table 7). This implies that WF was comprised of more small
particles (less than 125 µm) than were CF and PPF (Table 7). The presence of relatively large
particles of PPF is attributed to grain hardness and inefficient milling. On the other hand,
cassava roots contain some fiber which to some extent might be hard to fine mill and sieve
hence resulting in more large particles of CF. It is well established that the degree of flour
fineness in a milling operation depends on the type and efficiency of the applied machine
(Oladunmoye et al., 2010). The small grain size and tempering of wheat before milling improves
milling efficiency and resulted in fine particles. According to UNECA (1985), particle size of
about 130 µm is suitable for WF intended for baking bread, biscuits and other pastry products.
From their experience with composite flours, Crabtree and James (1982) indicated that particle
size of about 180 µm and fiber-free is ideal composite flour for breadmaking.
From the current findings, WF particle size distribution was within the range expected
for bread and cookie baking. Particle size is one of the most important characteristics of a flour,
which may influence other physicochemical properties such as swelling, water binding capacity
and pasting properties (Singh et al., 2003). The particle size distribution of a flour could be very
important for specific applications. Bearing these factors in mind, PPF and CF could be best raw
materials for products where lower water binding and smooth textures are not as important.

42
For breadmaking, the presence of fibers and large particles in flour might puncture the
expanding gas cells during fermentation, thereby reducing loaf volume. Moreover the fibers
and large particles of flour could result in a rough and speckled exterior bread loaf appearance.
(Crabtree and James, 1982).
Table 7. Particle Size Distribution1 (g/100g) of Wheat, Cassava and Pigeon Pea Flours
Flour
Sample2
>330 µm 330 - 250 µm 250 - 180 µm 180 - 150 µm 150 - 125 µm
100% WF - 0.001a 0.11
a 0.17
a 0.77
a
100% CF 11.98a 10.65
c 8.33
b 6.76
b 1.80
b
100% PPF 11.64a 9.30
b 8.31
b 7.45
b 2.04
c
SEM 0.30 0.16 0.09 0.25 0.05 1
Means with the same superscript in the same column are not significantly different (p<0.05). 2 WF = wheat flour, CF = cassava flour, PPF = pigeon pea flour.
4.3. Falling Number and gluten content of flours and blends
The Falling Number machine indirectly measures α-amylase activity via degree of
hydrolysis of starch granules in the paste. Alpha-amylase is an enzyme that degrades starch
when the grain is soaked in water. Flour with a low Falling Number (i.e., a less viscous starch
paste) is deemed to have high α-amylase activity and usually produces a weak bread dough that
does not rise much during baking. To this effect, Falling Numbers of flours and flour blends
were measured to assess the impact of CF and PPF supplementation on WF and establish its
effect on baking quality (Table 8). From the results in Table 8, the control (WF) and CF had
Falling Number values of 400 implying that there was very low α-amylase activity (i.e., highly
viscous starch paste). PPF had a mean Falling Number of 296, indicating that α-amylase activity
was high, resulting in a weakly viscous starch paste. The low Falling Number of PPF is ascribed

43
to soaking of pigeon peas during flour preparation that might have triggered the α-amylase
enzyme to start degrading starch. Substitution of WF with PPF alongside CF significantly
lowered the Falling Number of the flour blends studied. A study has been conducted on the
effect of α-amylase enzyme on the Falling Number of wheat flour and it was reported that
addition of malt to wheat-cassava composite flours resulted in reduced Falling Number,
indicating high α-amylase activity of the malt (Khalil et al., 1999). The study further revealed
that doughs made from wheat-cassava composite flours supplemented with α-amylase enzyme
were wet and sticky. Based on Khalil’s studies, use of bread improvers is encouraged where
flours with low Falling Numbers are used for breadmaking.
Gluten is a type of protein that is found in WF and it develops when the flour is
hydrated. Gluten content of flours and blends was measured according to AACCI Method 38-12
(AACCI, 2000) and the influence of CF and PPF supplementation on WF was established. It
should be noted that no gluten was determined in CF and PPF because naturally the two have
no gluten-forming protein. The gluten content of the control (28.80 %, Table 8) was significantly
higher than those of the blended flours. As expected, inclusion of non-gluten forming flours (CF
and PPF) resulted in dilution of gluten content of the blends compared to that of the control
(WF). Among the blends, gluten content decreased from 25.1% for 90% WF to 12.05% for 60%
WF. The decline in gluten content of flour blends is consistent with the reduced loaf volume of
bread made from the flour blends (see details in Table 12). The quantity of gluten is responsible
for extensibility and gas retention of the dough, and increased quantity results in a high quality
bread product. The findings of the current study support the previous findings by Hassan et al.
(2011) and Olu et al. (2011) in which the gluten content of the blended flours ranged from 32%

44
to 25% as WF was increasingly replaced by decorticated pigeon pea flour. Additionally, Olu et
al. (2011) reported a decline in wet gluten content from 20.4% (100% WF) to 0.4% with 70%WF:
30% soybean flour. According to the findings in the present study, it is suggested that where
flours with low gluten content are used for breadmaking, deliberate efforts need to be made to
improve bread loaf volume and quality.
Table 8. Falling Number1 and Gluten Content
1 of Flours and Blended Flour Samples
Flour Sample2 Falling Number (seconds) % Gluten
100% WF 400.00f 28.80
e
100% CF 400.00f ND
100% PPF 296.00e ND
90%WF:5%CF:5%PPF 283.00d 25.10
d
80%WF:10%CF:10%PPF 266.00c 23.50
c
70%WF:15%CF:15%PPF 261.00b 19.10
b
60%WF:20%CF:20%PPF 257.00a 12.05
a
SEM 0.76 0.12 1
Means with the same superscript in the same column are not significantly different (p<0.05). 2WF = wheat flour, CF = cassava flour, PPF = pigeon pea flour, ND= not determined
4.4. Work and Alveostrength
Work and Alveostrength of flours and blended flours were measured to determine the
effect of CF and PPF supplementation on wheat dough rheology. Due to the inherent lack of
gluten, work and Alveostrength of CF and PPF were not measured. Work and Alveostrength
significantly decreased with addition of non-wheat flours to WF (Table 9). Work refers to the
amount of energy required to inflate a piece of dough into a balloon before it ruptures, thereby
giving information about dough strength. From the results, more work was required to inflate
the control dough balloon than those of blends, resulting in significantly higher Alveostrength

45
values for WF. Consequently, the control exhibited the greatest work (221 kJ) and
Alveostrength (33.79) values, which were statistically different from the respective values for
the blends. Work and Alveostrength are greatly reduced by addition of CF and PPF, even at only
5% substitution levels, due to the dilution effect on gluten. The values of the measured
parameters (work and Alveostrength) displayed by WF are related to gluten content that is
responsible for dough extensibility. Similar results were reported by Wu et al. (2009) who found
that work and Alveostrength decreased notably as wheat flour was supplemented with
increasing proportions of sweet potato paste. Again, the authors attributed the result to
dilution of gluten in WF.
Gluten stretches enormously when hydrated and it needs a substantial amount of
energy to be inflated into a balloon before rupturing. The lower gluten content in the flour
blends resulted in reduced work and Alveostrength. The relatively low work values of blended
doughs might also be attributed to the presence of large flour particles in PPF and fibers in CF
that might have punctured the dough as it was being inflated, resulting in rupture of the dough
before full expansion. For the purpose of breadmaking, the results suggest that doughs made
from blended flours will be weak and not rise much during baking, hence producing reduced
volume loaves.
46
Table 9. Work1, and Alveostrength
1 of Flours and Blended Flour Samples
Flour Sample2 Work (Kj) Alveostrength
100% WF 221.00e
33.79e
100% CF ND ND 100% PPF ND ND 90%WF:5%CF:5%PPF 216.00
d 33.14
d
80%WF:10%CF:10%PPF 210.00c
32.11c
70%WF:15%CF:15%PPF 201.00b
30.81b
60%WF:20%CF:20%PPF 197.50a
30.12a
SEM 0.81 0.12 1
Means with the same superscript in the same column are not significantly different (p<0.05). 2WF = wheat flour, CF = cassava flour, PPF = pigeon pea flour, ND= not determined.
4.5. Water and oil absorption capacities of flours and blends
Supplementation of WF with CF and PPF significantly influenced the water absorption
capacity (WAC) and oil absorption capacity (OAC) of samples (P<0.001) (Table 10). Among the
samples, CF displayed the highest WAC (12.9%), followed by PPF, while the control had the
lowest (2.1%). The flour blends had moderate WAC values that were also higher than that of
the control (WF), and these increased as levels of non-wheat flours were increased in the
blends. Thus incorporation of CF and PPF at high levels significantly improved the WAC of flour
blends. A similar trend was observed in the OAC of the flour samples within the flour category.
The greatest OAC was observed for CF, while the control had the lowest. The OAC of the flour
blends decreased upon addition of CF and PPF, as compared to CF alone. To this effect, the
high WAC and OAC of CF might be attributed to the molecular structure of cassava starch.
Molecules of cassava starch are loosely linked, allowing for more penetration of liquid
materials. The presence of high levels of fat and protein in WF and PPF could explain the low

47
OAC of the flours. As a result, OAC values of flour blends were significantly lower than that of
CF alone.
These absorption capacity attributes may give advantage to the blends relative to the
single flours (CF, PPF and WF) in baked products where hydration to improve dough handling is
a preferred characteristic. The blends could also be used in formulations for products such as
ground meat, doughnuts and pancakes, where oil absorption is not of paramount importance.
It should be noted that the WAC and OAC of PPF found in this study are much lower than those
reported by Olalekan and Bosede (2010). The authors reported WAC and OAC values of 14.8%
and 18.9%, respectively, for PPF. Based on the results, the lower WAC of WF confirms the low
charge density and relative hydrophobicity of wheat protein that gives it a tendency to interact
more with itself. Therefore, WF could be more useful than CF and PPF as a functional ingredient
in viscous foods, like baked products, gravies and soups, to increase viscosity (Abulude et al.,
2006).
Table 10. Water and Oil Absorption Capacities1 of Flour and Blended Flour Samples
1 WAC = water absorption capacity, OAC = oil absorption capacity. Means with the same
superscript in the same column are not significantly different (p<0.05). 2WF = wheat flour, CF = cassava flour, PPF = pigeon pea flour.
Flour Sample2 % WAC % OAC
100% WF 6.1a 7.0
b
100% CF 12.9f 9.0
f
100% PPF 10.4e
7.1c
90%WF:5%CF:5%PPF 4.7b
7.5d
80%WF:10%CF:10%PPF 6.0c
7.1c
70%WF:15%CF:15%PPF 6.0c
7.7e
60%WF:20%CF:20%PPF 6.6d
6.4a
SEM 0.1 0.0

48
4.6. Swelling power and viscosity of flours and blended flours
The swelling power (SP) was assessed to observe the nature of bonds within starch
granules of flours and flour blends. Heating of samples in the presence of water at 700C or
800C, resulted in samples with different SP values (Table 11). Results indicated that SP values
of the flours and flour blends are influenced by temperature. Among the flours, CF had the
highest SP at both temperatures studied compared to those of WF and PPF. The SPs of the
blended flours were significantly lower than those of the pure flour samples. The variation in SP
is indicative of the differences in bonding forces within the starch granules of the samples
(Nwokocha et al., 2008). According to Balagopalan et al. (1988), the bonds relax with increases
in thermal agitation, causing the starch granules to imbibe water and swell. In the present
study, CF displayed weaker bonds within starch granules as indicated by the high SP values at
700C and 80
0C. Conversely, the low SPs of WF and PPF reflected their stronger bonding within
their starch granules.
In the development of any food product from starchy crops, knowledge of
physicochemical properties like viscosity or pasting properties of the starch, which is a main
component of flour, is needed to predict behavior under a given processing condition. In the
present study, flour viscosity was measured by the Brookfield viscometer (Brookfield
Engineering Laboratories, Inc. Stoughton, MA, 02702, USA) at 700C and 80
0C. The analysis of
results revealed that the viscosity of flour samples increased with increases in temperature.
Cassava flour had an initial viscosity of 1180 Cp at 700C and it reached a maximum viscosity of

49
1380 Cp at 800C that was significantly higher than control and flour blends. The viscosity
displayed by flour samples is related to their SP and the trend in viscosity results was almost the
mirror image of the SP results. The viscosity patterns may be related to the differences in
chemical composition of the various starches (amylose: amylopectin) and the nature of the
bonding within the starch structure. The starch polymer of CF has molecules that are loosely
linked (Oluwamukomi et al., 2011) and they easily absorb water and expand more when
heated, thereby increasing viscosity (Caicco and D’Applonia, 1976). PPF registered the lowest
viscosity at both temperatures, probably due to its low carbohydrate content. The flour blends
had intermediate viscosities but higher than those of PPF at both temperatures. This is ascribed
to incorporation of CF in the blends. Consequently, the viscosity of blends increased as the
proportion of CF was increased. According to Nuwamanya et al. (2010), the relatively low
viscosities of WF, PPF and flour blends would indicate better cooking properties. The results of
Nuwamanya et al. (2010) study further suggest that CF flour needs to be modified to change
the water holding properties of the starch granules and thus improve its application in the food
industry.

50
Table 11. Swelling Power1 and Viscosity
1 of Flours and Blended Flour Samples
Flour Sample2 % SP (70
0C) % SP (80
0C) Viscosity
700C (Cp) Viscosity 800C (Cp)
100% WF 4.2d
4.9d
36.5b 235.0
d
100% CF 5.6f
6.7e 1180.0
e 1380.0
f
100% PPF 4.3e
4.7d
22.0a 30.0
a
90%WF:5%CF:5%PPF 3.3b
3.8c 44.0
c 76.0
b
80%WF:10%CF:10%PPF 3.3b
3.6b
44.0c 140.0
c
70%WF:15%CF:15%PPF 3.6c
3.8c 46.0
c 165.5
c
60%WF:20%CF:20%PPF 3.0a
3.2a 55.0
d 335.0
e
SEM 0.1 0.1 2.0 3.4 1
WAC = water absorption capacity, OAC = oil absorption capacity, SP = swelling power. Means
with the same superscript in the same column are not significantly different (p<0.05). 2WF = wheat flour, CF = cassava flour, PPF = pigeon pea flour.
4.7. Physical characteristics of bread made from wheat flour supplemented with cassava and
pigeon pea flours
Physical characteristics of breads were measured to determine the effect of
supplementation of CF and PPF on baked loaf weight, height, and volume. In the present study,
breads made from the flour blends were denser compared to the control bread (WF) (Table 12,
Figure 2). In contrast, loaf height, volume and specific volume were higher for the control than
the composite breads. According to Wu et al. (2009), bread loaf weight is determined by
amount of baked dough, moisture, and carbon dioxide diffused out of the loaf during baking. It
should be known that bread loaf volume is affected by protein quality and quantity. The
presence of gluten protein in wheat flour was presumed responsible for the increased loaf
volume and height. Gluten develops when WF is mixed with water and it forms a matrix that
retains more gas. As the dough is baked, it expands more, thereby increasing loaf volume and

51
height. As a consequence of gas retention the bread loaf is lighter. However, addition of CF and
PPF to WF lowered the amount of gluten in the blends, causing poor gas retention and thus
reduced loaf volume and height of the blended flour breads.
The presence of fiber in CF and relatively large particles of PPF might also have played
significant roles in reducing loaf volume by puncturing gas cells as the dough was expanding.
The results are in agreement with findings by Eggleston et al. (1993) and Defloor et al. (1993).
Eggleston et al. (1993) reported a decrease in volume and specific volume of baked bread
samples as WF was substituted with cassava flour and starch at increasing levels. The reduction
in loaf volume as a result of increased supplementation of non-wheat flours is an undesirable
quality economically, and poses a threat to the baking industry. It is reasonable that bread with
a high loaf volume attracts more customers who believe that it is more valuable than a smaller
loaf of the same weight for the same price. It is therefore suggested that more research work
needs to be done to explore alternatives to improve breads made from blended flours. Such
efforts will attract bakers to use blended flours for breadmaking.
Table 12. Physical Characteristics1 of Bread Made from Wheat Flour Supplemented with
Cassava and Pigeon Pea Flours
Bread Sample2 Loaf weight (g) Loaf height (cm) Loaf volume (cm
3) Specific volume
100% WF 283.30a 16.17
d 1500
d 5.29
d
90%WF:5%CF:5%PPF 281.00a 12.10
c 1367
c 4.86
c
80%WF:10%CF:10%PPF 286.00a 7.67
b 917
b 3.20
b
70%WF:15%CF:15%PPF 296.00b 5.80
a 717
a 2.42
a
SEM 4.08 0.58 39.10 0.13 1Means with the same superscript in the same column are not significantly different (p<0.05).
2WF = wheat flour, CF = cassava flour, PPF = pigeon pea flour.

52
4.8. Physical characteristics of wheat cookies supplemented with cassava and pigeon pea
flours
Supplementation of WF with CF and PPF significantly improved the diameter and weight
of blended flour cookies (Table 13, Figure 2). The diameter and weight of the control cookies
were significantly lower than cookies with a high proportion of CF and PPF. However, increasing
supplementation with CF and PPF had no effect on cookie height and a non-significant
increasing trend for spread ratio. In general, the results showed that cookie diameter, weight,
height, and spread ratio increased as the level of non-WF supplementation was increased. The
elastic properties of gluten in WF to extend and contract when hydrated were likely responsible
for the smaller diameters of 100% WF cookies. Gluten tends to stretch more when hydrated
and during baking as the sugar melts. However, the stretching does not go far and it retracts
back, thereby reducing the cookie diameter. The dilution of gluten in the blended flours
resulted in increased cookie diameters. The weak connections of starch polymer molecules in
CF might have also contributed to increased expansion of blended flour cookies, yielding larger
diameters.
The current findings conform to findings of previous researchers. Enrichment of wheat-
cassava biscuits (cookies) with soy flour resulted in increases in weight, diameter and spread
ratio (Olowamukomi et al., 2011). As the proportion of cassava and soy flour increased in the
supplementation, the mean weight, diameter and spread ratio of the biscuits increased
considerably. The authors attributed the low spread ratio of wheat biscuits to the stronger
bonding of starch polymer molecules that resulted in limited expansion of the biscuits during
baking (Olowamukomi et al., 2011). The heavier weight and larger diameter of the blended

53
flour cookies are added advantages because such properties could attract higher prices at the
market. This implies that if baking industries adopt use of non-wheat flours, such as CF and PPF,
in cookie formulations, they are likely to increase their profits, while also improving nutrition of
the local population.
Table 13. Physical Characteristics1 of Cookies Made from Wheat Flour Supplemented with
Cassava and Pigeon Pea Flours
Cookie Sample2 Diameter (cm) Height (cm) Weight (g) Spread ratio
100% WF 9.18a 0.96
a 21.37
a 9.59
a
80%WF:10%CF:10%PPF 9.46ab
0.98a 25.70
bc 9.65
a
70%WF:15%CF:15%PPF 9.56bc
0.96a 23.17
ab 9.94
a
60%WF:20%CF:20%PPF 10.11c 1.00
a 26.10
bc 10.11
a
SEM 0.24 0.02 1.20 0.35 1Means with the same superscript in the same column are not significantly different (p<0.05).
2WF = wheat flour, CF = cassava flour, PPF = pigeon pea flour.
4.9. The effect of cassava and pigeon pea flours supplementation on chemical composition of
breads and cookies
Analysis of the chemical composition of breads and cookies revealed that the protein
content was significantly higher among samples made from blended flours (Tables 14 and 15)
as compared to their respective control samples. The high protein contents of blended flour
breads and cookies are due to high protein content of the blended flour samples from
supplementation with PPF. The findings are consistent with findings by Tiwari et al. (2011) and
Hassan et al. (2011) who reported that addition of PPF to WF increased the protein contents of
cookies and bread. Generally, it is clear that the protein content increased with increasing level
of PPF. In Malawi, pigeon peas are commonly consumed although pigeon pea as flour has not

54
been tested as a marketable commodity. If PPF is used to make protein-enriched products that
are acceptable for consumption, protein intake will increase and thereby may alleviate
malnutrition problems related to low protein intake.
Carbohydrate contents among the blended flour bread samples were not statistically
different from each other (Table 14). However, it is important to note that the carbohydrate
contents of blended flour breads were higher than that of the control. Similarly, the
carbohydrate contents among the blended flour cookies were not significantly different from
each other and were slightly higher as compared to the control (Table 15). There was no
consistent trend among the carbohydrate results for the baked products, and the carbohydrate
contents of the baked products did not correspond to the blended flours from which they were
made (Table 6). This could be due to differences in moisture of the baked breads as compared
to their respective flour samples from which they were made. Compared to breads, cookies
had the greatest amount of carbohydrate, due to the fact that baked cookies had a much lower
moisture level, i.e., they are a drier product than bread.
There were significant differences between the control and the blended flour samples in
fat content for breads and for cookies. Addition of non-wheat flours resulted in lower fat
contents in both products. The highest contents of fat were found in control bread (4.55%) and
control cookies (25.40%). It is worth noting that cookies had a significantly higher amount of
fat content compared to bread, due to the higher amount of fat in the cookie formulation. The
results are similar to findings by Gayle et al. (1986) where supplementation of WF with PPF in
bread resulted in a decrease in fat content from 5.93% (100% WF) to 5.0% (75% WF). In a
different study, replacement of WF with pigeon pea byproduct flour (PPBF) raised the fat

55
content of cookies (Tiwari et al., 2011). Although both WF and PPF are rich in fat, the fat
content of the products in the current study did not increase significantly because CF diluted
the fat present in WF and PPF. The fat content of the baked products was therefore greatly
dependent upon flour blend composition, since the amount of formulation fat added was held
constant for all bread samples and for all cookie samples.
According to results on Tables 14 and 15, the ash contents of bread and cookie samples
were significantly different between control and blended flour products. It is clear from the
results that the highest ash contents were found in blended products with the highest
proportion of CF and PPF. The high ash contents of blended flour bread and cookie samples are
mainly due to incorporation of PPF at high levels. Based on the results, supplementation with
PPF in the product formulation is encouraged to improve intake of minerals through
consumption of the products.
Moisture contents of breads and cookies were assessed to determine storability of the
products. The results indicated that the moisture contents among bread samples made from
blended flours were not statistically different from each other (Table 14), and that WF bread
had a significantly higher amount of moisture (37.20%) compared to the blended flour breads.
Within the blend breads, 80% WF bread had the lowest moisture content (34.00%). On the
contrary, the lowest moisture content of cookies was observed in 80% WF cookies (3.10%)
compared to 60% WF cookies which had the highest moisture content (4.80%, Table 15).
Similar findings were reported by Eneche (1999). The author found that the moisture content
of 100% maize flour cookies was 6.6% and it significantly decreased to 5.0% with 35% PPF

56
supplementation. The low moisture content of the products is important for prolonging their
shelf life.
After baking, bread has an initial crumb moisture content that is between 35% and 45%
(Strausser, 2004). From the result (Table 14), the moisture content of composite breads is
slightly below this range. Stalling of bread starts soon after baking as the bread loaf cools due to
migration of moisture from crumb to crust resulting in crystallization of amylopectin. As the
process continues, the texture of the crust increases (Strausser, 2004). Bread with more
moisture content than required, will have most of the moisture migrate to the crust creating a
favorable condition for the growth of molds hence staling.
Fiber contents of the blended flour bread and cookie samples increased as a result of
increased proportion of CF and PPF (Tables 14 and 15). The high fiber content of the blended
flour products was mainly contributed to by CF since the fiber content of CF was significantly
higher than that of WF and PPF (Table 6). Similar results were reported by Olowamukomi et al.
(2011) where incorporation of CF resulted in an increase in the fiber content from 0.2% in the
control (wheat flour) to 0.64% with 70% CF. Recently, inclusion of fiber in food has attracted
much attention due to its physiological benefits such as promoting large bowel movements and
preventing diseases like inflammatory bowel disease and colorectal cancer.
Energy values of the baked products were estimated to determine the amount of
energy to be gained from consumption of the products. The energy of all bread samples were
not significantly different from each other, indicating that supplementation of WF with CF and
PPF did not influence energy (kcal/100 g), and that the breads at any level of substitution
studied could give almost the same amount of energy when consumed (Table 14). Contrary to

57
the results for bread, the energy of cookies was significantly different among samples, with the
control cookies having the highest value compared to those of the blended flour cookies. Again,
the results imply that supplementation of WF with CF and PPF had a negative effect on the
energy of the baked products. Supplementation with CF, which is low in fat content, was
responsible for the relatively low energy values of the blended flour breads and cookies. Results
obtained in the present study show a general deviation from the previous literature by Tiwari et
al. (2011), Hassan et al. (2011) and Akunor and Onimawo (2003). For example Tawiri et al.
(2011) reported a small but statistically significant increase in calorific value of wheat bread
supplemented with decorticated pigeon pea flour (DPPF), from 386 kcal/100g (control) to 390
kcal/100g (25% DPPF). The energy values of cookies were much higher than those of bread
samples and were probably due to the high levels of fat and sugar in the cookie formulation.
Total hydrocyanic acid content (HCN) of baked samples significantly increased as the
level of CF increased in the formulation (P<0.001) (Tables 14 and 15). Thus, bread and cookie
samples with highest amounts of cassava had the greatest HCN contents. As anticipated, the
control (100% WF) bread and cookie samples had the lowest HCN contents, of 0.06 and 0.03
mg/kg, respectively. It is clear from the results that the HCN of breads were higher than that of
cookies, probably due to the baking of cookies at high temperature (1820C). The low HCN
content of the products could be partially explained by the pressing steps of cassava wet mash
during preparation of high quality cassava flour (HQCF). Most of the HCN was eliminated
alongside excess water as the wet mash was being pressed. Almazan (1990) reported a decline
in HCN of bread as a result of flour dilution by non-cassava flour and baking at high
temperature. Lower maximum levels of HCN are recommended for some products. According

58
to Codex Alimentarius Commission (1985) 1 mg HCN/ 100 g is the maximum limit allowable for
cassava flour. There is no maximum allowable HCN level for bread. However, 1 mg/kg, which is
one tenth that recommended by the Codex Allimentarius Commission and the maximum
allowable amount per RMRDC (2004), is probably safe for consumption. Although HCN levels
were slightly high in the study samples with high proportions of CF, the HCN contents were still
below 1 mg/kg. This implies that the products are safe for human consumption, without
causing health problems due to HCN.

59
Table 14. Chemical Composition1 (d.b.) of Bread Made From Wheat Flour Supplemented with Cassava and Pigeon pea Flours
Bread Sample2 % Protein % CHO % Fat % Ash % Moisture % Fiber Energy
(kcal/100g) Hydrocyanic acid (mg/kg)
100% WF 10.35a 46.15
a 4.55
c 1.40
a 37.20
c 0.35
a 266.95
a 0.06
a
90%WF:5%CF:5%PPF 10.95a 47.90
b 3.75
b 1.40
a 35.60
ab 0.40
a 269.15
a 0.16
b
80%WF:10%CF:10%PPF 11.70b 48.50
b 3.35
ab 1.70
b 34.00
a 0.75
b 270.90
a 0.19
c
70%WF:15%CF:15%PPF 12.00b 47.50
b 3.15
a 1.80
b 34.75
ab 0.80
b 266.35
a 0.21
c
SEM 0.23 0.34 0.14 0.07 0.44 0.06 2.15 0.01 1
Means with the same superscript in the same column are not significantly different (p<0.05). 2WF = wheat flour, CF = cassava flour, PPF = pigeon pea flour, CHO = carbohydrate.

60
Table 15. Chemical Composition1 (d.b.) of Cookie Made From Wheat Flour Supplemented with Cassava and Pigeon pea Flours
Cookie Sample2 % Protein % CHO % Fat % Ash % Moisture % Fiber Energy
(kcal/100g) Hydrocyanic acid (mg/kg)
100% WF 8.75a 59.31
a 25.40
b 1.35a 3.15
a 0.20
a 508.20
c 0.03
a
80%WF:10%CF:10%PPF 8.80a 61.80
a 21.40
a 1.65a 3.10
a 0.55
b 485.80
b 0.10
b
70%WF:15%CF:15%PPF 9.75a 60.90
a 19.85
a 1.85ab 3.80
a 0.70
bc 473.20
ab 0.14
c
60%WF:20%CF:20%PPF 11.05a 59.28
a 19.70
a 1.90b 4.80
a 0.75
bc 468.70
a 0.16
c
SEM 0.82 0.98 0.69 0.16 0.68 0.06 4.52 0.01 1
Means with the same superscript in the same column are not significantly different (p<0.05). 2WF = wheat flour, CF = cassava flour, PPF = pigeon pea flour, CHO = carbohydrate.

61
4.10. Carbohydrate and protein digestibility of breads and cookies supplemented with
cassava and pigeon pea flours
The quality and bio-availability of any nutrient is determined by its digestibility. Thus, in
vitro digestibility studies of carbohydrates and proteins were conducted to determine the
quality and bio-availability of the nutrients in the products. Both carbohydrate and protein
digestibility decreased as WF was replaced with cassava and pigeon pea flours (Table 16). It is
clear from the results that the highest in vitro carbohydrate digestibility (IVCD) of bread was
found for the control (66.8%), whereas 70% WF bread registered only 60.5%. The trend was
similar to the IVCD of cookies, for which cookies with the lowest proportion of WF (60%) had
the lowest IVCD (59.4%). The low rate of carbohydrate digestion in relation to high levels of
non-wheat flours is most likely explained by the high fiber content contributed by CF. The
fibers in CF are less susceptible to α-amylase hydrolysis in the analyses and might have
contributed to low IVCD of blended flour breads and cookies. The findings are in conformity
with observations by previous researchers. Mais (2008) reported that inclusion of fiber
significantly reduced the IVCD due to lower rates of sugar being released by α-amylase enzyme
in breads and cookies.
Baked samples with lowest protein contents (controls, Tables 14 and 15) had the
greatest in vitro protein digestibility (IVPD) whereas the samples with highest protein contents
had the lowest IVPD values (Table 16). The result found in the current study supports previous
findings by Okpala (2011) who reported a decline in IVPD of cookies as supplementation with
PPF and cocoyam was increased. Digestion of protein is reported to be reduced by
antinutritional factors such as trypsin inhibitors (Onwuka, 2006). Perhaps CF and PPF contained
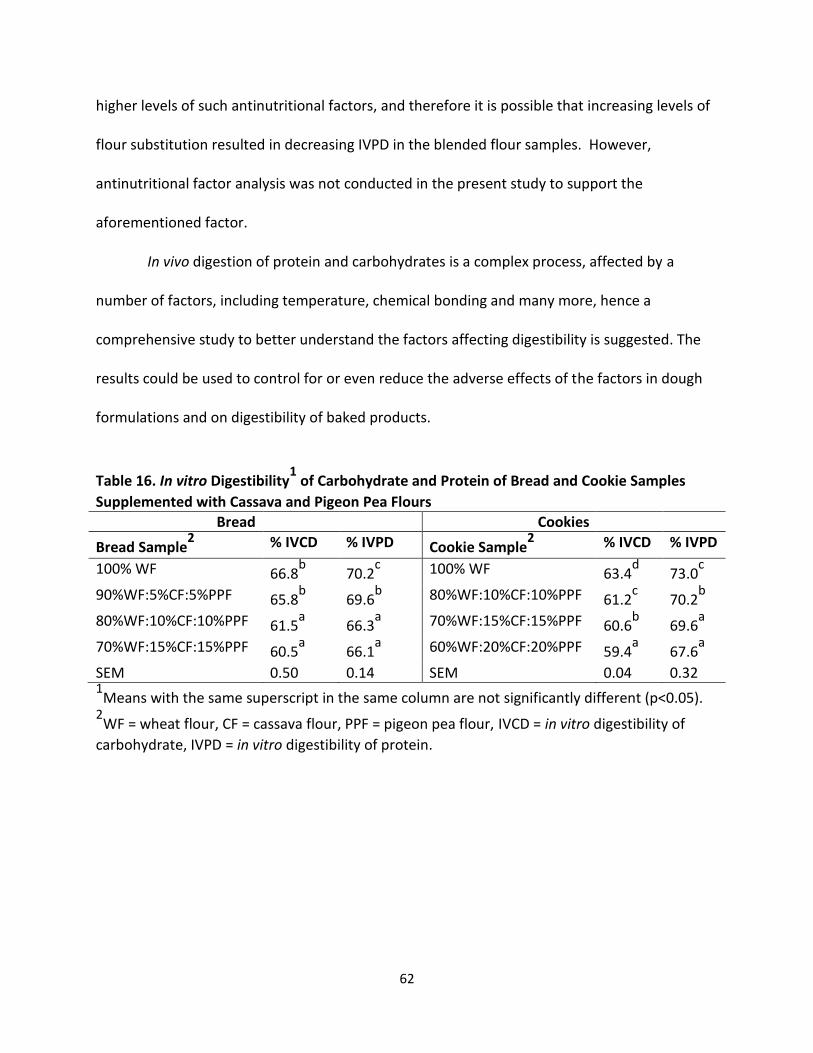
62
higher levels of such antinutritional factors, and therefore it is possible that increasing levels of
flour substitution resulted in decreasing IVPD in the blended flour samples. However,
antinutritional factor analysis was not conducted in the present study to support the
aforementioned factor.
In vivo digestion of protein and carbohydrates is a complex process, affected by a
number of factors, including temperature, chemical bonding and many more, hence a
comprehensive study to better understand the factors affecting digestibility is suggested. The
results could be used to control for or even reduce the adverse effects of the factors in dough
formulations and on digestibility of baked products.
Table 16. In vitro Digestibility1 of Carbohydrate and Protein of Bread and Cookie Samples
Supplemented with Cassava and Pigeon Pea Flours
Bread Cookies
Bread Sample2 % IVCD % IVPD Cookie Sample
2 % IVCD % IVPD
100% WF 66.8b 70.2
c 100% WF 63.4
d 73.0
c
90%WF:5%CF:5%PPF 65.8b 69.6
b 80%WF:10%CF:10%PPF 61.2
c 70.2
b
80%WF:10%CF:10%PPF 61.5a 66.3
a 70%WF:15%CF:15%PPF 60.6
b 69.6
a
70%WF:15%CF:15%PPF 60.5a 66.1
a 60%WF:20%CF:20%PPF 59.4
a 67.6
a
SEM 0.50 0.14 SEM 0.04 0.32 1Means with the same superscript in the same column are not significantly different (p<0.05).
2WF = wheat flour, CF = cassava flour, PPF = pigeon pea flour, IVCD = in vitro digestibility of
carbohydrate, IVPD = in vitro digestibility of protein.

63
Figure 2. Bread and cookie photographs. For interpretation of the references to color in this and
all other figures, the reader is referred to the electronic version of this thesis.
100% WF 80%WF: 10%CF: 10%PPF
70%WF:15%CF:15%PPF 60%WF:20%CF:20%PPF
100%WF 90%WF:5%CF:5%PPF
80%WF:10%CF:10%PPF 70%WF:15%CF:15%PPF

64
CHAPTER 5
5.1. CONCLUSIONS
The studies demonstrated that incorporation of cassava flour (CF) and pigeon pea flour
(PPF) influenced physical and chemical properties of wheat bread and cookies. From the results,
the protein content of wheat flour (WF) alone was significantly lower than those of blended
flours, and increased as the levels of CF and PPF were increased. Supplementation with CF and
PPF negatively affected the carbohydrate content and energy value of the flour blends. Thus,
the carbohydrate content and energy values of WF were higher than those of the flour blends.
Particle size analysis of the flours and flour blends has revealed that WF had a greater
proportion of small particles (<125 µm) than CF and PPF. On the other hand, CF and PPF were
comprised more of large particles (>330 µm). The particle sizes of the control flour (WF) were
within the recommended particle size range for breadmaking. Therefore, fine milling and
sieving of CF and PPF is suggested to achieve the recommended particle size for bread, biscuit
and pastry products (130 µm, UNECA, 1985).
The Falling Numbers of WF and CF were substantially higher than that of PPF (296). The
low Falling Number of PPF indicates high α-amylase activity (low paste viscosity). The result
could be due to soaking of pigeon pea grains during flour preparation that stimulated α-
amylase enzyme to start degrading starch leading to low paste viscosity. As expected, WF had
the highest gluten content compared to flour blends. Increasing quantities of CF and PPF at high
proportions progressively reduced the gluten contents of the flour blends. Similarly, work and
Alveostrength of the control flour (WF) were higher than of the flour blends. This was
explainable by the low gluten content of the flour blends.

65
The water absorption capacity (WAC) of CF was significantly higher than WAC values of
control (WF) and flour blends. WAC of CF was approximately six times higher than that of the
control flour. Supplementation with CF resulted in a slight increase in WAC of the flour blends.
In the same line, the oil absorption capacity (OAC) of CF was higher than of control and blended
flours. In addition, the swelling power (SP) of CF was significantly higher than those of control
and flour blends. The behavior exhibited by flour samples on WAC and OAC reveal their
molecular structure.
At each of the temperatures studied (70 and 80 degrees C); the flour viscosities among
samples were statistically different. CF exhibited the greatest flour viscosity at both
temperatures compared to control and flour blends. As the levels of supplementation were
increased, the viscosity of flour blends slightly increased. This was due to addition of CF at
increased levels. The low viscosities of WF and PPF are related to the cohesiveness of the starch
molecules of the flours.
Among the physical properties of bread, loaf volume was negatively affected due to the
dilution of gluten as CF and PPF were added at high levels. Conversely, bread loaf weight
increased with the supplementation of non-wheat flours and became denser as the proportion
of CF and PPF were increased in the formulation. In general, wheat bread had superior baking
quality attributes compared to blended flour breads. More studies on the use of non-wheat
flours alongside wheat flour (WF) are suggested to explore alternatives on how best to improve
the baking quality of blended flour bread. On the other hand, supplementation of WF with non-
wheat flours greatly improved the physical properties of cookies, including weight, diameter,
height, and spread ratio. The greatest cookie weight, diameter and spread ratio were found for

66
cookies with the highest amounts of CF and PPF, whereas the control cookies had the lowest
values for all parameters.
Supplementation of WF with CF and PPF increased protein content of the baked bread
and cookie products as compared to the counterpart control WF products. The increase in
protein content is explained by the addition of PPF at increased levels. The higher protein
contents of the products are important to improving the nutrition of people consuming such
products. However, the supplementation also notably decreased the fat and energy values of
the products. Although the fat content and energy values were lower than those of the studied
control, they were still higher than those of the typical bread consumed in Malawi and could
lead to improved nutrient intake. In addition, the in vitro digestibility of carbohydrates and in
vitro digestibility of protein of breads and cookies slightly decreased with increased
supplementation of CF and PPF but still, above 50%. This implies that consumption of large
quantities of CF- and PPF-enriched products might contribute to alleviating protein-energy
malnutrition in at-risk populations.
5.2. RECOMMENDATIONS AND SUGGESTED FUTURE STUDIES
The findings of the present study have clearly demonstrated the possibility of utilizing
CF and PPF in wheat breads and cookies. This would support industrial utilization and the
consumption of under-utilized crops such as pigeon peas. Therefore, large scale production of
the crops is encouraged to support industrial use.
Replication of the study is suggested to validate the findings. For example the results for
OAC, carbohydrate content and energy of the products were not consistent, so replication

67
would assist with validating the findings and coming up with concrete results. Expansion of the
study is also suggested to evaluate additional flour blend proportions to facilitate optimum
utilization of the flours in baking.
The upcoming studies should focus more on using specialized and appropriate
equipment like the Brabender Amylograph and Rapid Visco Analyzer (RVA) to get
comprehensive and accurate results about the properties of the flours being evaluated. For
example, there is the need to study flour’s viscosity at different temperatures and times to
establish gelatinization, setback and retrogadation properties with regards to starch present in
that flour sample. The information is critical to understanding factors that affect flour viscosity
and better control of food processing.
The in vitro digestibility studies only considered temperature, pH and enzyme
concentration as factors that affect carbohydrate and protein digestion. Biologically, in vivo
digestion is a complex process affected by many factors, including antinutritional factors,
chemical bonding and many more. Therefore it is suggested to conduct a detailed study on
digestibility of the products to establish their quality. The study should also combine amino acid
(AA) analysis with the enzyme assay to determine the available AA in the baked sample.
Quality of blended flour bread was compromised at higher levels of non-wheat flour
substitution, so there is a need to explore use of bread improvers to enhance quality of blended
flour bread thereby promoting use of the non-wheat flours in breadmaking. Texture analysis of
bread and cookies is also a recommended future study. Sensory studies are another important
area to assess for palatability and acceptability of the baked products, and thus encourage

68
increases in industrial production and consumption of the baked products made from the
blended flour materials.

69
REFERENCES

70
REFERENCES
Akingbala, J.O., Oyewole, O.B. Uzo-Peters, P.I., Karim, R.O., and Bacuss-Taylor, G.S.H. 2005. Evaluating stored cassava quality in gari production, Journal of Food, Agriculture and Environment 3:75-80. Akubor, P. I. and Onimawo, I. A. 2003a. Functional properties and performance of soybean and maize flour blends in cookies. Plant Foods for Human Nutrition. 58:1 -12. Akubor, P. I. and Ukwuru, M. U. 2003b. Functional properties and biscuit making potential of soybean and cassava flour blends. Plant Foods for Human Nutrition. 58: 1 – 12. Aleytor, V.A. and Aladetimi, O.O. 1989. Compositional evaluation of some cowpea varieties and some underutilized edible legumes in Nigeria. Die Nahrung. 33:999–1007.
Almazan, A. M. 1990. Effect of cassava flour variety and concentration on bread loaf quality. Cereal Chemistry 67 (1):97 – 99. Anjum, F.M. and Walker, C.E. 2000. Grain flour and bread making properties of eight Pakistani hard white spring wheat cultivars grown at three different locations for two years. Int J. Food Sci & Tech. 35 (4):407-416. AOAC. Official Methods of Analysis. 1990. Association of Official Analytical Chemists, Washington DC. AACCI Approved Methods. 2000. American Association of Cereal Chemists. St Paul, Minnesota, USA. Balagopalan, C., Padmaja, G., Nanda, S.K. and Moorthy, S.N. 1988. Cassava in Food, Feed and Industry. CRC Press Inc. Boca Raton, Florida. 126-127. Bokanga, M. 1995. Biotechnology and cassava processing in Africa. Food Technology 49(1):86-90. Bradbury, M. G., Egan, S. V., Bradbury, J. H. 1999. Picrate paper kits for determination of total cyanogens in cassava roots and all forms of cyanogens in cassava products. Journal of Science of Food and Agriculture. 79:593-601. Ciacco C. F., D’Appolonia B. L. 1978a. Baking studies with cassava and yam: Rheological and baking studies of tuber-wheat flour blends. Cereal Chem. 55:423-435. Ciacco C F, D’Appolonia B. L. 1976b. Characterization of starches from various tubers and their use in bread-baking. Cereal Chem. 54(5):1096 1107.

71
Crabtree, J. and James, A. W. 1982. Composite flour technology: TPI’s experience and opinions on the planning and implementation of national programmes. Trop Sci. 242:77-84. Codex Alimentarius Commission. 1985. Rep. Seventh Session of the Codex Coordinating Committee for Africa. FAO and WHO, Kenya, Nairobi. Daniel, V.A., D. Narayanaswamy, B.L. Desai, S. Kurien, M. Swaminathan and H.A. Parpia, 1970. Supplementary value of varying levels of red gram (Cajanus cajan) to poor diets based on rice and ragi. Indian J. Nutr. Dietetics. 7:358-362. Defloor, I., Leijskens, R., Bokanga, M., and Delcour, J.A. 1995a. Impact of genotype, crop age and planting season on the breadmaking and gelatinization properties of flour produced from cassava (Manihot esculenta Crantz). Journal of the Science of Food and Agriculture. 68:167–174 Defloor, I., Nys, M. and Delcour, J. A. 1993b. Wheat starch, cassava starch, and cassava flour impairment of the breadmaking potential of wheat flour. Cereal Chemistry. 70(5): 526 – 530. Diedzoave, N.T., Abass, A. B., Amoa-Awua, W. K. A. and Sablah, M. (2003). Training manual for the production of high quality cassava flour. National Board of Small Scale Industries (NBSSI) Accra, Ghana. Edward D. 1974. The industrial manufacture of cassava products: An economic study. Tropical products institute,Foreign and Commonwealth Office, Ministry of Overseas Development. Eggleston, G., Omoaka, P.O. and Arowshegbe, A.U. Flour. 1993. Starch and composite breadmaking quality of various cassava clones. J. Sci. Food Agric. 62:49-59. Eggum, B.O., and Beames, R.M. 1983. The nutritive value of seed proteins. In: Seed proteins: biochemistry, genetics, nutritive value. Gottschalk, W., and Muller, H.P. (eds.) pp 499-531. The Hague, Netherlands: Martinus Nijhoff/W. Junk Eke, O. S. and Akobundu E. N. T. 1993. Functional properties of African yam bean (Sphenosylis stenocarpa) seed flour as affected by Processing. Food Chem. 48:337-340. Elegbede, J.A. 1998. Legumes. In: Nutritional Quality of Plant Foods. A.U. Osagie and O.U. Eka, (eds.) pp. 53–83, Ambik Press, Benin City, Nigeria Eneche, E. H. 1999. Biscuit making potential of millet/pigeon pea flour blends. Plant Foods for Human Nutrition. 54: 21–27. Falade, K.O., and Akingbala, J.O. 2008. Improved nutrition and national development through the utilization of Cassava in baked foods. International Union of Food Science & Technology.

72
Faris, D.G., Saxena, K.B., Mazumdar, S., and Singh, U. 1987. Vegetable pigeon pea: a promising crop in India. ICRISAT, Patancheru, A.P. 502 324, India: International Crops Research Institute for the Semi -Arid Tropics. 34 HRDP SDS no. 14 FAO/WHO. 1985. Energy and protein requirements. Report of joint FAO/WHO export consultation. FAO Food and Nutrition paper 51, FAO/WHO, Rome, Italy Gayle, P.E., Knight, E.M., Adikins, J.S. and Harland, B.F. 1986. Nutritional and organopleptic evaluation of wheat breads supplemented with pigeon pea (Cajanus cajan) flour. Cereal chem. 63 (2): 136-138. Graham, H.D and Archbold, C.A. 1984. Enrichment of cassava products with soybean, peanut and whey protein. content and acceptance. Carib. J. Sci 18 : 1-4. Gopalan, C., Romasastri, B.V and Balasubramanian, S.C. 1971. Nutritive value of Indian foods. National Institute of Nutrition, Hyderabad, India. Hahn, S. K. 2007. An overview of traditional processing and utilization of cassava in Africa. http://agri.iiri.cgiar.org/library/docs/x5458E/x5458e05.htm. Accessed on February. 20 2012 Hassan, H. A. Mustafa, A. I. and Ahmed, A. R. 2011. Utilization of decorticated pigeon pea (Cajanus cajan) with wheat (Triticum aestivum) flours in breadmaking. Advacned Journal of Food Science and Technology. 3(6): 413–417. Hoseney, R.C. 1998. Principles of cereal science and technology. American Association of Cereal Chemists, Inc. St. Paul, Minnesota, USA. IFAD. 2008. Working together to enable smallholders to influence rural development policies in Africa. 00142, Rome, Italy. Khalil, A.H., Mansour, E.H., and Dawood, F.M. 1999. Influence of malt on rheological and baking properties of wheat-cassava composite flours. LWT – Food Science & Technology 33:159–164. Kinsella, J.E. 1976. Functional properties of proteins in foods: A survey. Crit. Rev. Food Sci. Nutr. 7:219–271 Longe, O. C. 1980. Effect of processing on the chemical composition and energy value of cassava. Nutr. Rep. Int. 21: 820–828. Mais, A. 2008. Utilization of sweet potato starch, flour and fiber in bread and biscuits; physic-chemical and nutritional characteristics. (MSc thesis). 178 p. Massey University. Mazurs, E. G., Schoch, T. J., Kite, F. E. 1957. Graphical analysis of the brabender viscosity curves of various starches. Cereal Chem. 34:141-152.

73
Mertz, E.T, Hassen, M.M, Whittern. C. C, Kirleis, A.W, Tut, L., and. Axtell, J.D. 1984. Pepsin digestibility of proteins in sorghum and other major cereals. Applied Biology. 81: 1-2. McMahon, J. M., White, W. L. B., and Sayre, R.T. 1995. Cynogenesis in cassava (Manihot esculenta crantz). Journal of experimental Botany. 46: 731-741. McWatters, K. H., Ouedraogo, J., Resurreccion, A.V A., Hung, Y. and Phillips, R. D. 2003. Physical and sensory characteristics of sugar cookies containing mixtures of wheat, fonio (Digitaria exilis) and cowpea (Vigna unguiculata) flours. Int. J. Food Sci. Technol. 38: 403-410. Mlingi, N., Mtunda, K., Ndunguru, G. T., Kiriwaggulu, A. and Mahungu, N. M. 1998. Promotion of cassava utilization for improvement of food security and income generation in Tanzania. Akoroda, M.O. & Ngeve, J.M. (eds). Proceedings of the 7th Triennial Symposium of the International Society for Root and Tuber Crops. Nuwamanya, E., Baguma, Y., Emmambux, N. and Rubaihayo, P. 2010. Crystalline and pasting properties of cassava starch are influenced by its molecular properties. African Journal of Food Sciences. 4 (1): 008 -015 Nwokocha, L. M., Williams, P. A. Aviara, N. A. and Senan, C. 2008. Comperative study of some properties of cassava (Manihot esculenta, crantz) and Cocoyam (colocasia esculenta, Linn) starches. Carbohydrate Polymers. 76 (3): 362 – 367. Okpala, L. C and. Okoli, E. C. 2011. Nutritional evaluation of cookies produced from Pigeon pea, Cocoyam and Sorghum flour blends. African Journal of Biotechnology. 10 (3): 433-438. Oladunmoye. O. O., Akinoso, R. and Olapade, A. A. 2010. Evaluation of some physical-chemical properties of wheat, cassava, maize and cowpea flours for breadmaking. Journal of Food Quality. 33(2010): 693 – 708. Olalekan, A. J. and Bosede, B. F. 2010. Comparative study on chemical composition and functional properties of three Nigerian Legumes (Jack beans, Pigeon pea and Cowpea). Journal of Emerging Trends in Engineering and Applied Sciences. 1(1): 89 – 95. Olu, M. Ogunmoyela, O. A. B., Oluwajoba, S. O., Olurin, T. O. and Ogundipe, M. R. 2011. The development of whole wheat dough meal enriched with soybeans. International Research Journal of Biochemistry and Bioinformants. 1 (10): 266 – 274. Oluwamukomi, M.O, Oluwalana, I.B and. Akinbowale, O.F. 2011. Physicochemical and sensory properties of wheat-cassava composite biscuit enriched with soy flour. African Journal of Food Science. 5 (2). 50 – 56. Osborne, O. R. and Vooget, P. 1978. Calculation of Calorific Value in the Analysis of Nutrients in Roots, Academic Press New York, 239-244

74
Oshodi, A.A., Olaofe, O. and Hall, G.M. 1993a. Amino acid, fatty acid and mineral composition of pigeon pea (Cajanus cajan). Int. J. Food Sci. Nutr. 43, 187–191. Oshodi, A.A. and Ekperigin, M.M. 1989b. Functional properties of Pigeon pea (Cajanus cajan) flour. Food Chem. 34:187–191. Onwuka, G.I. 2006. Soaking, boiling and antinutritional factors in pigeon peas (cajanus cajan) and cowpeas (vigna unguiculata). Journal of Food Processing and Preservation 30 (5):616-630 National Statistical office (NSO), Malawi. 2007 Nutrition and consumer protection. Fao.org. Accessed on 05/21/2012. Shekib, A. L, Sanir, M. E and Abu-Bakr, M.T. 1988. Studies on amylase inhibitors in some Egyptian legume seeds. Plant Foods Hum. Nutr. 38: 325-352. Singh, F. and Diwakar, B. 1993. Nutritive Value and Uses of Pigeon pea and Groundnut. International Crops Research Institute for the Semi-Arid Tropics Patancheru, Andhra Pradesh 502 324, India Singh, U., and Eggum, B.O. 1984. Factors affecting the protein quality of pigeon pea (Cajanus cajan L.). Qualitas Plantarum Plant Foods for Human Nutrition 34:273-283. Tannenbaum, S. 1974. Industrial processing in Nutrition in processed food proteins. Publishing Sc. Groups Inc. USA. Strausser, C.E. 2004. Reinventing bread. In: Production Manual and Baker’s Encyclopedia. Baking & Snack. Tiwari, B.K., Brennan, C.S., Jaganmohan, R., Surabi, A.,and Alagusundaram, K. 2011.Utilisation of pigeon pea (Cajanus cajan L) byproducts in biscuit manufacture. Food science and technology 44:1533-1537 Topping, D. L., Anthony, M. F., & Bird, F. (2003). Resistant starch as prebiotic and synbiotic: State of the art. Proceedings of the Nutrition Society, 62, 171–176. UNECA. 1985. The concept of composite flours: A Technical Compendium on Composite Flours. United Nations Economic Commission for Africa, Addis-Ababa. Vaidehi, M. P., Meena K, and Joshi, N. 1985. Sensory evaluation of cereal-pulse malt biscuits with high protein value. Cereal Foods World. 30:283. Wenham, J.1995. Post-harvest deterioration of cassava. Agriculture and consumer protection department. FAO. Rome, Italy

75
Wheatley, C. C, Orrego, J. I., Sandez, J. and Granados, E. 1993. Quality evaluation of cassava core collection at CIAT. In: Roca, W.M., and Thro, A.M. (eds). Proceedings of the first international scientific meeting of cassva biotechnology network. CIAT, Cartagena, Colombia, 255-264. Wrigley CW, Bietz JA, 1988. Proteins and amino acids. In: Pomeranz Y, Eds. Wheat: Chemistry and Technology 1. St. Paul, MN: American Association of Cereal Chemists, Inc. p 165-93. Wu, K. L., Sung, W. C. and Yang, C. H. 2009. Characteristics of dough and bread as affected by the incorporation of sweet potato paste in the formulation. Journal of Marine Science and Technology. 17(1): 13 – 22.
Top Related
Copyright © 2022 FDOKUMEN

