


Bahasa
Halaman
Hukum


TITLE
PHYSICO-CHEMICAL AND SHELF-LIFE STUDIES ON REDUCED FAT LEGUME-BASED
COOKIES USING SAGO FLOUR AS A FAT REPLACER
by
MOHAMMAD NOOR ADROS YAHYA
Thesis submitted in fulfillment of the requirements for the degree
of Master of Science
April 2004

ACKNOWLEDGEMENT
First, I thank Allah for the strength, health and the opportunity to complete this
thesis. To Dr. Noor Aziah Abdul Aziz, my supervisor, thank you for your patience,
guidance and advice throughout this project. You have been a great help, an inspiration,
and both a teacher and a dear friend.
I want to extend special thanks to Muhammad Ibrahim and Hasidah Mohd Yusof
who helped me tremendously with this project. You two were there for me, always, and
I will remember that. I would also like to extend thanks to all staff and graduate students
(Pak Ya, Zanzila, Hanani, Zuwariyah, Shazliana and others) from the Department of
Food Technology, for their gracious help during the course of this study.
I would like to thank my family and the Sarzali family for your unconditional
support, emotionally and financially. Finally, I would like to thank my fiancée, Junnita,
thanks for your love, support and the numerous personal sacrifices that you've made for
our relationship during this time.
This dissertation is dedicated to the memory of my loving mother, Rohani
Ikhwan. May Allah bless her soul.
Mohammad Noor Adros Yahya
April 2004
ii

TABLE OF CONTENTS
TITLE ................................................................................................................................ i ACKNOWLEDGEMENT .............................................................................................. ii TABLE OF CONTENTS ............................................................................................... iii LIST OF TABLES ......................................................................................................... vi LIST OF FIGURES ..................................................................................................... viii ABSTRAK ....................................................................................................................... x ABSTRACT ................................................................................................................... xii CHAPTER 1 INTRODUCTION ............................................................................... 1 CHAPTER 2 LITERATURE REVIEW ................................................................... 4
2.1 COOKIES ............................................................................................................ 4 2.1.1 Background ................................................................................................... 4 2.1.2 Definition of cookies ..................................................................................... 5 2.1.3 Nutritional aspect of cookies ......................................................................... 6 2.1.4 Ingredients ..................................................................................................... 8 2.1.5 Quality of cookies ....................................................................................... 10
2.2 LEGUME ........................................................................................................... 13 2.2.1 Background ................................................................................................. 13 2.2.2 Processing of legumes ................................................................................. 15 2.2.3 Legumes in cookies ..................................................................................... 16 2.2.4 Resistant starch ............................................................................................ 17 2.2.5 Legume starch digestibility ......................................................................... 18 2.2.6 Mungbean .................................................................................................... 21
2.2.6.1 Background ............................................................................................. 21 2.2.6.2 Classification ........................................................................................... 21 2.2.6.3 Composition ............................................................................................ 22
2.2.6.3.1 Minerals ............................................................................................. 22 2.2.6.3.2 Vitamin .............................................................................................. 23 2.2.6.3.3 Carbohydrate ..................................................................................... 24 2.2.6.3.4 Protein ............................................................................................... 24
2.2.6.4 Processing and Application ..................................................................... 25 2.2.7 Chickpea ...................................................................................................... 26
2.2.7.1 Background ............................................................................................. 26 2.2.7.2 Classification ........................................................................................... 27 2.2.7.3 Composition ............................................................................................ 27
2.2.7.3.1 Mineral .............................................................................................. 28 2.2.7.3.2 Vitamin .............................................................................................. 28 2.2.7.3.3 Carbohydrate ..................................................................................... 29 2.2.7.3.4 Protein ............................................................................................... 29
2.2.7.4 Processing and Applications ................................................................... 30
2.3 FAT REPLACER .............................................................................................. 30 2.3.1 Introduction ................................................................................................. 30 2.3.2 Definition of fat replacers ........................................................................... 33 2.3.3 Types of fat substitutes ................................................................................ 33
2.3.3.1 Lipid-Based Fat Substitutes .................................................................... 33
iii

2.3.3.2 Protein-Based Fat Substitutes .................................................................. 34 2.3.3.3 Carbohydrate-Based Fat Substitutes ....................................................... 35
2.3.4 Fat replacer in cookies ................................................................................. 35 2.3.5 Safety and regulation of fat replacer ........................................................... 37 2.3.6 Sago as fat replacer ..................................................................................... 40
2.4 SHELF-LIFE ..................................................................................................... 42 2.4.1 Definition of shelf-life ................................................................................. 42 2.4.2 Modes of Deterioration ............................................................................... 43
2.4.2.1 Physical Deterioration ............................................................................. 43 2.4.2.2 Chemical Deterioration ........................................................................... 44 2.4.2.3 Microbiological Deterioration ................................................................. 44
2.4.3 Deterioration in cookies .............................................................................. 46 2.4.4 Accelerated Shelf-Life Test ........................................................................ 47 2.4.5 Lipid Oxidation ........................................................................................... 48 2.4.6 Water Activity ............................................................................................. 51
CHAPTER 3 MATERIALS AND METHODS ..................................................... 53
3.1 Materials ............................................................................................................ 53
3.2 Cookie Formulation and Preparation ............................................................. 53
3.3 Chemical Analyses ............................................................................................. 55 3.3.1 Moisture ...................................................................................................... 55 3.3.2 Ash .............................................................................................................. 55 3.3.3 Fat ................................................................................................................ 57 3.3.4 Protein ......................................................................................................... 57 3.3.5 Crude Fibre .................................................................................................. 58 3.3.6 Carbohydrate ............................................................................................... 59 3.3.7 Total Dietary Fibre Analysis ....................................................................... 59 3.3.8 Trypsin Inhibitor Activity ........................................................................... 60 3.3.9 In Vitro Protein Digestibility (IVFD) .......................................................... 61 3.3.10 Amino Acid Analysis .................................................................................. 62 3.3.11 Determination of Resistant Starch ............................................................... 63
3.4 Physical Analyses ............................................................................................... 65 3.4.1 Observation with Scanning Electron Microscope (SEM) ........................... 65 3.4.2 Diameter, Thickness and Spread Ratio ....................................................... 65 3.4.3 Texture ........................................................................................................ 66 3.4.4 Colorimetry ................................................................................................. 66
3.5 Sensory Evaluation ............................................................................................ 67
3.6 Shelf-life .............................................................................................................. 67 3.6.1 Accelerated Shelf-Life Test (ASLT) ........................................................... 67 3.6.2 Peroxide Determination ............................................................................... 68 3.6.3 Sensory Analysis for ASLT ........................................................................ 69 3.6.4 Moisture Sorption Isotherm Determination ................................................ 69 3.6.5 Isotherm Models .......................................................................................... 70 3.6.6 Shelf-Life Calculation Using Moisture Vapour Transfer Method .............. 71
iv

3.7 Data Analysis ..................................................................................................... 72 CHAPTER 4 RESULT AND DISCUSSION .......................................................... 73
4.1 Proximate Analysis of Cookies ......................................................................... 73
4.2 Trypsin Inhibitor and In vitro Protein Digestibility ...................................... 77
4.3 Amino acid composition .................................................................................... 82
4.4 Resistant starch and Scanning Electron Microscope ..................................... 85
4.5 Thickness, diameter and spread ratio ............................................................. 95
4.6 Texture analysis ................................................................................................. 99
4.7 Colour ............................................................................................................... 102
4.8 Sensory analysis ............................................................................................... 105
4.9 Accelerated Shelf-Life Test ............................................................................ 108 4.9.1 Peroxide value ........................................................................................... 108 4.9.2 Shelf-life data ............................................................................................ 112
4.10 Sorption properties of Cookies ....................................................................... 115 CHAPTER 5 CONCLUSION AND RECOMMENDATIONS .......................... 119 REFERENCES ............................................................................................................ 121 APPENDICES ............................................................................................................. 132 LIST OF PUBLICATIONS AND AWARDS ............................................................... 8
v

LIST OF TABLES
Page
Table 2.1 World market size of cookies and savoury biscuit. (Anon, 2003) 4
Table 2.2 Market size of cookies and savoury biscuit in the United States (Anon, 2003) 5
Table 2.3 Classification of starches (Brown et al., 1995) 18
Table 2.4 Classification of foods according to the range of RS contents (% dry matter) (Goni et al., 1996) 19
Table 2.5 Proximate composition of 100g mungbean seed (Souci et al., 1994) 22
Table 2.6 Mineral compositions of 100g mungbean seed (Souci et al., 1994) 23
Table 2.7 Vitamin composition of 100g mungbean seed (Souci et al., 1994) 23
Table 2.8 Carbohydrate composition of 100g mungbean seed (Souci et al., 1994) 24
Table 2.9 Amino acid profiles of 100g mungbean seed (Souci et al., 1994) 25
Table 2.10 Proximate composition of 100g chickpea seed (Souci et al., 1994) 27
Table 2.11 Mineral composition of 100g chickpea seed (Souci et al., 1994) 28
Table 2.12 Vitamin composition of 100g chickpea seed (Souci et al., 1994) 28
Table 2.13 Carbohydrate composition of 100g chickpea seed (Souci et al., 1994) 29
Table 2.14 Amino acid composition of 100g chickpea (Souci et al., 1994) 30
Table 2.15 Actual and Projected Sales of Low-Fat Products in U.S ($bn) (Roller and Jones, 1996) 32
Table 2.16 National survey by the Calorie Control Council in 1996 of the most popular reduced fat products used by American adults (Roller and Jones, 1996)
32
vi

Table 2.17 Fat replacer used in cookies (Roller and Jones, 1996) 38
Table 2.18 Composition for 100g raw sago Metroxylon (Yong, 2001) 40
Table 2.19 Characteristics of sago and other starches (Yong, 2001) 41
Table 3.1 Formulation of Cookies 54
Table 4.1 The proximate composition of the six types of cookies 74
Table 4.2 Trypsin inhibitor activity of the six types of cookies 78
Table 4.3 In vitro protein digestibility of 6 types of cookies 79
Table 4.4 Results for essential amino acid profile of 6 types of cookies 83
Table 4.5 Results for non-essential amino acid profile of 6 types of cookies 84
Table 4.6 Resistant starch composition of the six types of cookies 85
Table 4.7 The L, a and b value for the six types of cookies 103
Table 4.8 Calculated Q10 value and shelf-life plot equation of 6 types of cookies 113
Table 4.9 Duration of time when cookies perceived to be unacceptable by sensory evaluation 114
Table 4.10 Calculated shelf-life of cookies at 25O C 114
Table 4.11 BET monolayer value of cookies 117
Table 4.12 Shelf-life of cookies according to the Moisture Vapour Transfer (MVT) method 118
vii

LIST OF FIGURES
Page
Figure 2.1 Generalized scheme for autoxidation of lipids (Nawar, 1985) 50
Figure 2.2 Water activity and rate of oxidation (Nawar, 1985) 51
Figure 3.1 Flowchart of analyses 56
Figure 4.1 Scanning electron micrographs of C cookies before baking (Magnification=X 500) 88
Figure 4.2 Scanning electron micrographs of C cookies after baking (magnification=X 500) 88
Figure 4.3 Scanning electron micrographs of CF cookies before baking (magnification=X 500) 89
Figure 4.4 Scanning electron micrographs of CF cookies after baking (magnification=X 500) 89
Figure 4.5 Scanning electron micrographs of MB cookies before baking (magnification=X 500) 90
Figure 4.6 Scanning electron micrographs of MB cookies after baking (magnification=X 500) 90
Figure 4.7 Scanning electron micrographs of MBF cookies before baking (magnification=X 500) 91
Figure 4.8 Scanning electron micrographs of MBF cookies after baking (magnification=X 500) 91
Figure 4.9 Scanning electron micrographs of CP cookies before baking (magnification=X 500) 93
Figure 4.10 Scanning electron micrographs of CP cookies after baking (magnification=X 500) 93
Figure 4.11 Scanning electron micrographs of CPF cookies before baking (magnification=X 500) 94
Figure 4.12 Scanning electron micrographs of CPF cookies after baking (magnification=X 500) 94
Figure 4.13 Effects of thickness, diameter and spread in the six types of cookies 96
Figure 4.14 Effects of hardness and crispness on the various types of cookies 100
viii

Figure 4.15 Result of sensory analysis for the six types of cookies 106
Figure 4.16 Peroxide formation in cookies during storage at 25°C 109
Figure 4.17 Peroxide formation in cookies during storage at 35°C 110
Figure 4.18 Peroxide formation in cookies during storage at 45°C 111
Figure 4.19 Moisture isotherm of 6 types of cookies 116
ix

KAJIAN SIFAT FIZIKO-KIMIA DAN JANGKA HAYAT BISKUT KURANG
LEMAK BERASASKAN LEGUM DENGAN MENGGUNAKAN TEPUNG SAGU
SEBAGAI PENUKAR LEMAK
ABSTRAK
Tepung sagu telah digunakan sebagai penukar lemak sebanyak 40% dan tepung gandum
telah digantikan dengan 35% tepung legum (kacang kuda dan kacang hijau) dalam
formulasi biskut. Kajian ini bertujuan untuk mengurangkan kandungan lemak di dalam
biskut melalui penggunaan kanji sagu sebagai ‘fat replacer’ serta meningkatkan kualiti
protein dan gentian melalui penggunaan tepung legum (kacang hijau dan kacang kuda).
Kesan penggunaan 40% sagu sebagai ‘fat replacer’ serta penggantian dengan 35%
tepung legum terhadap sifat-sifat fizikal, kimia, deria dan jangka hayat biskut telah
dijalankan. Semua biskut dengan ‘fat replacer’ [MBF (kacang hijau dengan penukar
lemak), CPF (kacang kuda dengan penukar lemak) dan CF (kawalan dengan penukar
lemak)] telah menunjukkan kandungan lembapan lebih tinggi secara signifikan (p<0.05)
berbanding biskut tanpa ‘fat replacer’ [MB (kacang hijau tanpa penukar lemak,
CP(kacang kuda tanpa penukar lemak) dan C (kawalan tanpa penukar lemak). Namum
demikian, kandungan lemak menurun secara signifikan (p<0.05) (30-32%) bagi biskut
dengan ‘fat replacer’. Kandungan protein bagi biskut yang mengandungi kacang hijau
(MB dan MBF) mempunyai kandungan protein yang tinggi secara signifikan (p<0.05)
(7.04% dan 7.17%). Kandungan abu juga berbeza secara signifikan bagi biskut dengan
kacang hijau berbanding biskut lain. Bagi kandungan gentian kasar, didapati biskut
kawalan (C dan CF) berbeza secara signifikan (p<0.05) berbanding biskut-biskut lain.
Kandungan gentian dietari biskut kacang kuda (CPF dan CP) adalah lebih tinggi secara
signifikan (p<0.05) (5.38% dan 5.03%) berbanding biskut-biskut lain. Biskut kacang
x

kuda (CP dan CPF) didapati mempunyai tahap perencat aktiviti tripsin yang tertinggi
(p<0.05) (3.76% dan 3.26%) tetapi sebaliknya mempunyai nilai kehadaman protein
terendah (70.76% dan 70.16%) berbanding biskut-biskut lain. Keputusan analisis asid
amino menunjukkan biskut-biskut yang menggunakan tepung legum mengandungi
kandungan lisina yang tinggi tetapi rendah kandungan metionina dan sistina. Biskut CP
didapati mempunyai diameter dan ‘spread ratio’ paling besar (p<0.05) berbanding
biskut lain. Penambahan ‘fat replacer’ didapati mengurangkan diameter dan ‘spread
ratio’ biskut secara signifikan (p<0.05). Analisis tekstur menunjukkan biskut dengan ‘fat
replacer’ (MBF, CPF dan CF) adalah lebih keras secara signifikan tetapi kurang rangup
berbanding biskut tanpa ‘fat replacer’ (MB, CP dan C). Dari segi warna, semua biskut
mengandungi ‘fat replacer’ didapati mempunyai warna lebih pucat dengan nilai L yang
tinggi (p>0.05) berbanding biskut tanpa ‘fat replacer’. Penilaian deria mendapati biskut
CP adalah paling disukai berbanding biskut-biskut lain. Kajian jangka hayat pantas
(ASLT) menunjukkan biskut kawalan (C dan CF) mempunyai jangka hayat paling lama
(280 hari). Analisis pemindahan lembapan menunjukkan biskut dengan ‘fat replacer’
mempunyai jangka hayat lebih pendek berbanding biskut tanpa ‘fat replacer’.
xi

ABSTRACT
Sago flour at 40% level was used as fat replacer in cookies together with wheat flour
substituted at 35% with chickpea and mungbean. The purpose of using sago flour was to
develop reduced fat with increased protein and fibre. The effects of adding 40% sago
flour to each type of 35% chickpea and mungbean flour were evaluated for physical,
chemical, sensory and shelf-life properties of cookies. All cookies with fat replacers
MBF (Mungbean cookies with fat replacers), CPF (Chickpea cookies with fat replacers)
and CF(control cookies with fat replacer) were shown to have significantly higher
(p<0.05) moisture content than cookies without fat replacer MB (mungbean cookies
without fat replacer), CP (chickpea cookies without fat replacer) and C (control cookies
without fat replacer). However, the fat content was significantly (p<0.05) reduced (30-
32%) for cookies with fat replacer (MBF, CPF and CF) compared to cookies without fat
replacer. Protein content of cookies containing mungbean flour and mungbean flour
without fat repalcer (MB and MBF) had significantly higher (p<0.05) amount of protein
(7.04% and 7.17%). The ash content of cookies with mungbean flour (MB and MBF)
were significantly higher (p<0.05) from the other treatments. For crude fibre content,
result showed that the control cookies (C and CF) were significantly higher (p<0.05)
from other cookies. Dietary fibre content of chickpea cookies (CPF and CP) was
significantly higher (p<0.05) (5.38% and 5.03%) as compared to other cookies. Level of
trypsin inhibitor activity for cookies containing chickpea (CP and CPF) were
significantly higher (p<0.05) (3.76% and 3.26%) as compared to other cookies but the
protein digestibility value of chickpea cookies was significantly lower (p<0.05) (70.76%
and 70.16%). In amino acid analysis, it was observed that cookies utilizing legume flour
had significantly higher level of lysine but lower in methionine and cysteine. CP cookies
xii

xiii
were observed to have the largest diameter and spread ratio (p<0.05) compared to other
types of cookies. Addition of fat replacer was noted to decrease the diameter and spread
ratio of cookies significantly (p<0.05). Textural analysis showed that cookies with fat
replacer (MBF, CPF and CF) were significantly (p<0.05) harder in texture but less
crispy as compared to cookies without fat replacer (MB, CP and C). In terms of colour,
all cookies with fat replacer were observed to have significantly higher (p>0.05) L value
compared with cookies without fat replacer indicating a lighter surface colour. Overall
acceptability of sensory evaluation showed that CP cookie was the most acceptable
among other cookies. Accelerated shelf-life studies showed that control cookies (C and
CF), was found to have the longest shelf-life (280 days) as compared with the other
types of cookies. Studies on moisture vapour transfer indicated that cookies with fat
replacer had a lower shelf-life as compared to those without fat replacer.

CHAPTER 1 INTRODUCTION
High intakes of dietary fat are implicated for the cause of coronary heart disease.
The Dietary Guidelines for Americans suggest that people choose a diet low in fat and
recommend that dietary fat comprise no more than 30% of daily energy intake for
healthy adults (Giese, 1996). The use of fat-modified foods was ranked as the easiest
and most preferred strategy to reduce fat intake in the long term (McEwan and Sharp,
2000).
The success of fat modified food depends on the sensory acceptability of fat
modified foods included in the diet and their similarity to their full-fat counterpart. Most
consumers are not ready to trade taste for health; therefore, reduced-fat products need to
be at least as acceptable as the full-fat ones even though they may have different taste
(Roller and Jones, 1996).
As consumers have attempted to reduce their fat intakes, the demand and
consumption of reduced-fat foods has increased. In the U.S, between 1995 and 1997,
the number of people that have eaten a food labelled as low-fat or non-fat had
increased from 73% to 75%. Fat-modified foods have become part of the national food
supply. From 1990 through 1998, 15697 fat-modified foods were introduced into the
market (Roller and Jones, 1996).
Baked products that are low in moisture, especially cookies are difficult to
prepare when the fat is reduced (Sanchez et al., 1995). Cookies are relatively high in
fat, and reducing the fat component alters appearance, flavour, aroma, and texture.
However, if the sweetness in the cookie is maintained, consumers will tolerate some
deviations from the standard recipe in both texture and flavour (Drewnowski et al.,
1998). Several studies using a variety of fat replacers have produced cookies judged to
1
be somewhat acceptable (Sanchez et al., 1995; Conforti et al., 1996; Armbrister and
Setser, 1994; Inglett et al., 1994).
Carbohydrates such as gum, starch, pectin, and cellulose have been used as
commercial fat replacers. Starch and their derivatives can also be added to food
products as fat replacers due to diverse binding properties (Akoh and Swanson, 1994).
They provide some of the functions of fat in foods such as providing texture,
mouthfeel, and opacity by binding water. Studies showed that Litesse (Danisco
Sweeteners, Surrey, England), a polydextrose, can be substituted for 25% to 35% of fat
in cookie recipes whereas Oatrim (Rhodia Convenience Foods. Cranbury, NJ), an oat
flour enzyme hydrolysate of soluble beta-glucans and amylodextrins, can replace 50%
of fat in bakery products without compromising sensory characteristics of quality (Akoh
and Swanson, 1994).
Sago flour, derived from sago palm (Metroxylon sagu) is mainly used in the food
industry as a thickening agent and stabilizer. Sago which is mostly grown in the district
of the Mukah and Dalat in Sarawak contributed almost 70% of all sago production in the
Malaysia. Sago has been used in traditional baked foods but it is usually added to a
formulation and not as fat replacer. Sago is high in carbohydrates, especially starches.
Because of this, it was theorized that sago might have the potential to replace some of
the fat in cookies. Nutritionally, sago is a healthful fat replacer because they are low in
fat and high in dietary fibre and minerals such as calcium and iron. They are also an
inexpensive, readily available food. An added benefit is that dietary fat absorption is
reduced in the presence of considerable dietary fibre.
Legumes are widely recognized as important sources of proteins. In many
regions of the world, legumes are the unique supply of protein in the diet. Bressani and
Elfas (1980) reported that essential amino acid pattern of legumes is almost similar to
2

the reference or animal protein. Thus, in the developing countries where the quality
proteins from animal sources are deficient, legumes can be used as protein supplement
in their diets. Incorporation of legume into a familiar product such as a cookie would
give the products better acceptability and distribution in the market thus supplying the
required quality proteins. Moreover, legumes were also reported to have a
considerable amount of resistant starch (RS) that has many beneficial physiological
effects in controlling and preventing various metabolic diseases such as diabetes
mellitus, coronary heart disease and colon cancer.
The main objectives of this study are to evaluate the effect of sago flour as a fat
replacer with the incorporation of mungbean and chickpea flour to increase the protein
and fibre content in cookies. Specific objectives are:
1. To determine the feasibility of using sago flour as a fat replacer
ingredient in cookies by comparing the organoleptic qualities of reduced
fat cookies as compared to high-fat control cookies.
2. To study the proximate, amino acid and resistant starch compositions
of reduced fat cookies supplemented with chickpea and mungbean
flour.
3. To study the effects of substituting sago flour with chickpea and
mungbean flour on the shelf-life of cookies.
4. To study the effects of substitution of chickpea and mungbean flour on
trypsin inhibitor activity and protein digestibility of cookies.
3
CHAPTER 2 LITERATURE REVIEW
2.1 COOKIES
2.1.1 Background
Cookies are popular and well-accepted snack food throughout the world. It is
very established in industrialized countries and is rapidly expanding in developing
countries. People from different age groups and backgrounds eat cookies. Cookies are
available in wide variety and are nutritious and simple to produce. It can be made easily
with readily available ingredients.
In most countries of the world, cookies form a very big food industry. Manley
(2000) reported that the four key factors for its success are:
i. their relatively long shelf-life.
ii. their great convenience as food products.
iii. the human liking and weakness for sugar and chocolate.
iv. their relatively good value for money.
The market for cookies has been growing rapidly. The world global market for
cookies reached a total of $29.3 billion in 1998 (Table 2.1). The U.S market for cookies
has increased considerably from 1997 to 2001 with a forecast of $6.3 billion in 2006
(Table 2.2). The development of healthier cookies products has been on the rise in
recent years.
Table 2.1 World market size of cookies and savoury biscuit. (Anon, 2003)
Market Size (US$ Million)
1994 1995 1996 1997 1998
Cookies 26175.40 28553.70 29.276.2 29.256.0 29376.0
Savoury Biscuit 9789.8 10550.5 11044.2 11283.9 11336.4
4

The market of cookies is expected to grow further with new products innovation
that emphasize on product fortification and the continued emergence of organic food.
The growth of demand of cookies in the market will also benefit the manufacturer
investment in new products, particularly in low calorie product such as fat and sugar
free cookies.
Table 2.2 Market size of cookies and savoury biscuit in the United States (Anon, 2003)
Market Size (US$ Million)
1997 2001 2002* 2006*
Cookies 5605.90 6259.70 6353.60 6365.80
Savoury biscuit 3605.60 4332.80 4384.70 4424.90
* forecasted
2.1.2 Definition of cookies
Cookies are sometimes confused with biscuit. The term cookie actually refers to
hard sweet or semi-sweet type of biscuits. The term cookies is adopted in North
America where biscuits can be confused with small soda raised bread or muffins. In
other countries, cookies refer to wire cut products that contain large pieces of various
ingredients like nut and chocolate (Manley, 2000).
Cookie has a lot of similarities with other bakery products such as bread or
cakes. According to Smith (1972), cookies can be defined as a type of bread that is
crispy, hard, have many varieties of flavour and made into small and thin shape. The
difference between bread and cookies is in terms of the levels of fat and sugar used and
the moisture content of the final product. In comparison with cakes, differences were
5

found in terms of the dough consistency and moisture content of cookies. Cakes were
baked in containers unlike cookies that were baked on any flat surface (Manley, 2000).
In biochemical terms, cookies are a semi fluid mixture, consisting of flour,
sugar, shortening, water and sodium bicarbonate and that are transformed into solid
form when treated by heat (Abboud and Hoseney, 1984). This semi fluid mixture,
undergo the baking process where heat will promote formation and dehydration of
dough, browning reaction and other physico-chemical processes. Baking will result in a
porous structure with good mechanical attributes (Piazza and Masi, 1997).
Smith (1972) reported that the final products of cookies are:
i) Based on the cereal –wheat, oat, corn, etc. and not considered a cookie if
more than 60% of its total weight is not based on cereal.
ii) Should have moisture content less than 5%.
2.1.3 Nutritional aspect of cookies
Cookies that have been classified as a snack food (Brown et al., 1998) are not
regarded by consumer as an important nutrient contributor but as a compliment for other
food (Lorenz, 1983). Cookies are usually eaten for its organoleptic attributes, but not for
nutritional factors. Cookies are usually high in fat and sugar but low in protein, fibre,
vitamin and minerals (Hoojjat and Zabik, 1984).
Majority of cookies have high levels of fat and sugar (Drewnowski et al., 1998).
Typical cookies formulation has a fat content of 20-60% and sugar of 25-55% based on
the weight of flour (Baltsavias et al., 1999). There are many varieties of cookies in the
market which utilized ingredient high in fat and sugar such as chocolate, marshmallow,
caramel, jam, jellies and icing.
6

Cookies are regarded as unhealthy and are rejected by weight conscious
consumers because of its high sugar and fat content (Zoulias et al., 2000). Fat has been
associated with diseases such as coronary heart diseases, high blood cholesterol, obesity
and gallbladder disease. High consumption of sugar is related to diabetes and dental
caries.
Cookies have the potential to be a significant contributor of essential nutrient in
the human diet (Akpapunam and Darbe, 1994). This is primarily because cookies are
very popular and well accepted by consumers including children (Zoulias et al., 2000).
Therefore cookies can be a good source of nutrient for children. Furthermore, cookies
have a long shelf-life and can be produced on a large scale for wider distribution
(Hoojjat and Zabik, 1984).
A successful way to improve the nutritional aspect of cookies is by preparing
cookies with enriched flour (Hoojjat and Zabik, 1983). In the United States, most
cookies are produced using enriched flour (Bednarcyk, 1987). Cookies using enriched
flour contain a significant amount of nutrient such as protein, vitamins and minerals.
These cookies are developed as a food supplement for children especially in developing
countries (Manley, 2000).
The protein content and quality of cookies can also be improved by substituting
cereal with legume as composite flour in cookies formulation. Cereals such as wheat are
low in lysine and total protein content and are in short supply in certain countries (Tsen
et al., 1975; Akpapumen and Darbe, 1994). Legumes with high protein content are
widely used as composite flour in the production of cookies. Among legumes that are
frequently used in cookies are cowpeas, great northern bean, faba bean, navy bean,
lupine bean, chickpea, field pea and soybean (Kissell and Yamazaki, 1975; Hoojjat and
Zabik, 1983; Patel and Rao, 1995).
7

In keeping up with the present trend for lower calorie products, producers of
cookies have reduced the amount of fat and sugar in the formulation. Cookie products
labelled with non-fat, low fat, reduced fat and no-sugar have been widely available for
consumer in recent years (Manley, 2000). It is mainly aimed at dieters who want to
reduce calorie intake. The use of sugar is replaced with substances like polydextrose,
acesulfame-K, cellulose and fibre in no sugar cookies product (Bullock et al., 1992).
Cookies utilize fat replacers such as Litesse, N-Flate, Stellar or Trim Choice in reduced
fat cookie formulation (Sanchez et al., 1995).
2.1.4 Ingredients
Compositions of cookie dough mainly consist of wheat flour, shortening,
sweetener and emulsifying agents. Cookies consist of 75% sugar, 60% shortening, 7%
eggs and 17% moisture as compared to flour weight (Armbrister and Setser, 1994).
Ingredients used in cookies formulation have a great influence on the characteristic and
quality of produced cookies (Ryu et al., 1993).
Flour, the main ingredient in cookies contributes to texture, hardness and shape
of the final cookie product. The quality and quantity of protein are the most important
criteria of flour for baking cookies. The protein will determine the amount of gluten
formation in cookies. A high protein content in flour will reduce spread factor in cookies
(Pyler, 1988). This is because high protein flour will have a higher development of
gluten network that will increase dough viscosity thus reducing cookie spread. It is
found that diameters of cookies are inversely related with protein content of flour (Leon
et al., 1996). Therefore, soft wheat flour is usually used in the production of cookies
because it has lower protein content. The protein content for soft wheat flour is usually
in the range of 7.00 – 7.5% for cookies.
8

Other flours that are used in making cookies include maize, oat, rye, sorghum,
millet, rice, barley, cassava and potato (Manley, 2000). There is a trend of utilizing
legume in cookie formulation so as to improve the nutritional quality of cookies
(Lorenz, 1983). Legume such as soybean is rich in protein and has been reported to be
well balanced in amino acid profile.
Sweeteners are important ingredients in the production of cookies. Sweeteners in
cookies not only contribute to sweetness but also add to the overall flavour and colour as
a result of caramelization and Maillard reaction. Sweeteners also act as a softening
agent, increasing moisture retention and volume of cookies (Pyler, 1988).
Selection of specific sweeteners is important because it gives a significant effect
to the final product. The types and amount of sweetener used will affect cookie spread,
appearance and crispness. The common types of sweetener used in cookies are sucrose,
brown sugar, inverse syrup, molasses, nutritive sweeteners such as honey and maple
syrup and non-nutritive sweetener like saccharin.
Shortening (fat) is an important component in making cookie. The types of
shortening used in cookies include butter, lard, beef fat, margarine and vegetable oil
(Whitley, 1971; Pyler, 1988). About 50% of shortening are used (based on flour weight)
in cookie formulation so as to achieve the desired crispness of cookies (Conforti et al.,
1996).
Fat has numerous functions in cookies. Fat acts as a dough stabilizer when
particles of fat are spread in the dough thus making it more stable. Fat also contributes
to the organoleptic qualities of cookies such as flavour and aroma. The added fat will
surround the gluten network formed in the dough. This will aid in the lubrication of
gluten during sheeting. As a result, a softer and more extensible dough will be formed.
9

This will also reduce hardness of cookies by interrupting the gluten structure of the
dough.
Eggs used in formulation of cookies contain lecithin that influences the texture
of cookies. Lecithin in eggs acts as an emulsifier that spreads the fat phase more
uniformly over the hydrophilic ingredients such as flour and sugar. This will aid in
reducing the hardness of cookies by interrupting the gluten structure of the dough
(Manley, 2000).
Eggs also enhance the colour, nutritive value and flavour of the desired cookies
(Matz and Matz, 1978). Albumen in eggs will produce very stable foams that will
support the weight of flour, sugar and other ingredients during baking. During mixing,
some protein of the albumen will be denatured and will improve the mechanical
attribute of other ingredients to bind together (Smith, 1972).
Leavening agents help to aerate the dough and result in a porous and lighter
cookie. In cookies, the leavening process is achieved by chemical substances. A
bicarbonate (leavening base) is combined with an acid phosphate that generates an acid-
base reaction in the presence of heat and moisture. This reaction will yield carbon
dioxide leavening gas in controlled volumes and rates (Lajoie and Thomas, 1991). The
bicarbonate neutralizes the acids in the formulation and adjusts the pH to the desired
crumb pH. Cookie attributes such as colour and flavour are greatly influenced by the
crumb pH. Baking of cookies requires a leavening agent that can react immediately
whilst releasing carbon dioxide before the structure of the dough sets. The most
common leavening agent used is sodium bicarbonate (Whitley, 1971; Pyler, 1988).
2.1.5 Quality of cookies
In bakery products, such as cookies, the quality aspect is given high priority.
Cookies are assessed in terms of texture (hardness and crispness), physical (spread ratio
10

and top grain) and flavour attributes (Bajaj et al., 1991). Quality of cookies is influenced
by factors such as flour quality, the right baking technique, and variety and ratio of
ingredient.
Texture is an important element of cookie quality. Texture of cookies is
described as a combined function of the size and shape of the crumb structure, the
moisture content and gradients, and the internal stresses produced during baking and
cooling (Gaines et al., 1992). Baking promotes dough structuring and dehydration and
development of browning reaction that resulted in a finished product with porous crumb
structure (Piazza and Masi, 1997). Recent development has enabled the use of
instrumental techniques for measuring cookies texture that are reproducible statistically.
The two attributes that are measured for cookies are hardness and crispness.
Crispness is the most important quality attribute in cookies. Crispness will
determine consumer acceptability and represent the critical factor in limiting cookies
shelf-life (Piazza and Masi, 1997). It is known that crispness of cookies is highly
sensitive to moisture content. Crispness is related to the amount of water molecule
bonded with the carbohydrate matrix that influences the relative mobility of the
amorphous and crystalline component (Piazza and Masi, 1997).
Hardness can be defined as the force required to fracture a cookie. Hardness of
cookies is mostly due to the protein content of flour. Gaines (1993) showed that the
development of gluten during mixing of dough produce harder cookies. Usually the
required hardness of cookies is just enough to maintain its shape during transportation
but fractures easily when chewed in the mouth.
Spread ratio or diameter of cookies has long been used to determine the quality
of flour for producing cookies (Doescher et al., 1987; Gaines, 1993). Spread ratio of a
cookie is the diameter divided by its thickness. Flour and sugar are the main hydrophilic
11

components in cookies that influence cookie spread. If the flour component is
hydrophobic, more water is available for the sugar component to form syrup and this
will reduce the viscosity of dough during baking (Gaines et al., 1992).
Hydrophilic starches have a negative relation with spread ratio of cookies.
During baking, hydrophilic starch granules absorbed moisture and become swollen and
gelatinised thus providing additional viscosity in cookies (Kim et al., 2001). When the
gelatinisation of starch increases, dough viscosity increases thus reducing cookie spread
(Tsen et al., 1975). Thus, starch gelatinisation increases thickness of cookies and retains
more moisture (Labell, 1983). This showed that the strong affinity of flour to water
influences spread ratio of cookies.
The existence of cracks that occur on the surface of cookies known as top grain
has been regarded as one of the quality attributes of cookies. Cookies with good top
grain have been considered as cookies with a lot of surface cracks that are produced
after baking resulting from the recrystallization of sucrose on the surface of cookie. Top
grain is also directly related to the diameter of cookies. A smaller diameter of cookies
will produce fewer surface cracks (Gaines and Finney, 1989).
Another important quality attribute of cookies is colour. Colour of cookies
greatly influences their acceptability (Zoulias et al., 2000). Colour can be measured by
using colour instrument or by a sensory panel. Colour of cookies is mainly due to
Maillard reaction during baking.
Flavour perception is a very important factor in determining consumer
acceptance of a cookie. Flavour of a cookie is mainly influenced by the fat, sugar and
flavour enhancer in its formulation (Manley, 2000). In producing new cookies that are
highly nutritious, the flavour of the cookies must be given priority so as to be attractive
to consumers (Lorenz, 1983).
12
A high quality cookie has a high spread ratio, attractive appearance, pleasant
flavour, brownish colour, high crispness but adequate hardness for easy chewing. The
storage condition must be controlled or the organoleptic attribute of cookie will change
and this will decrease its commercial value.
2.2 LEGUME
2.2.1 Background
The word legume, originated from the Latin word “legumin” which means the
harvesting of the grain inside the husk of a bean. Legume is also known as “pulse”
that refers to the bean’s seeds (Salunkhe and Kadam, 1989). The term legume based
foods consist of germinated and ungerminated legume seeds that are used in the
human diet. According to the Food and Agriculture Organization (FAO) (1977), the
word legume is used for all kinds of beans.
Before the introduction of potato, most poor people in the world consumed
legumes as their staple food (Salunkhe and Kadam, 1989). According to archaeologists,
legume were first grown in East Asia then in the Middle East. Nowadays legumes are an
important component in human nutrition, especially among the low-income groups of
people in developing countries. The term legume is commonly used in India; where it is
classified into three categories, namely grains, peas, and beans (Swaminathan, 1974).
Legumes for consumption are prepared in many ways, such as whole legumes called
grains or dehusked and split legumes, known as dhals. Red gram (pigeon pea, Cajanus
cajan), which is native of South-east Asia, is the most widely consumed legume,
especially in Southern India, where it is used mainly in the preparation of rasam, sambar
and other savoury dishes.
13

Several reports claimed that inclusion of legumes in the daily diet has many
beneficial physiological effects in controlling and preventing various metabolic diseases
such as diabetes mellitus, coronary heart disease and colon cancer. Currently, the role of
legumes as therapeutic agents in the diets of people suffering from metabolic disorders
is gaining interest (Shehata, et al., 1988; Simpson et al., 1981). Recent opinion on
healthy eating habits showed that there is an increase in the proportion of legume-based
plant carbohydrates, including starch in the diet. Legumes also belong to groups of food
that have the lowest blood glucose response.
Legumes are also considered as poor man’s meat. They are generally good
sources of slow release carbohydrates and are rich in proteins (18–25%). Soybean is
unique in containing about 35–43% proteins. Legumes are the cheapest sources of
supplementary proteins in Indian diets (Swaminathan, 1974). They are also good
sources of minerals and vitamins. It has been reported that germinated legumes are
richer in vitamin C and in some there is an increase in the riboflavin as well as niacin
contents upon germination (Swaminathan, 1988). Processed legumes such as puffed
Bengal gram contains proteins of fairly high biological value and is a good supplement
to the diets of children.
There are many varieties of legumes such as red gram (pigeon pea, Cajanus
cajan), black gram (Vigna mungo L.), broad bean (Vicia faba L.), Bengal gram
(chickpea, Cicer arietinum L.), cowpea (Vigna unguiculata L.), field bean (Dolichos
lablab), mungbean (Vigna radiata), horse gram (Dolichos biflorus), etc. which are
commonly used, especially by the poorer section of the world population.
14

2.2.2 Processing of legumes
Legumes are common components of diets all over the world. They are used in a
variety of food preparations either as such or in combination with cereals, because
cereal proteins are generally deficient in some essential amino acids. The use of legumes
assumes significance as a cheap and concentrated source of proteins, due to the high
cost of proteins of animal origin and their inaccessibility by the poorer section of the
population.
Legumes are generally consumed after processing into various products like
milling into dhal, puffing or roasting into snack foods, grinding into flour for different
food preparations or as germinated grains (Kurien, 1981). Many of the legumes contain
toxic factors such as trypsin inhibitors, haemagglutinins and growth inhibitors, which
are either partially or completely eliminated by different methods of processing, e.g.,
autoclaving. Heat processing in general, improves the nutritive value of legume
proteins, by inactivating trypsin and growth inhibitors and haemagglutinins
(Swaminathan, 1974).
Traditional methods of processing and cooking legumes have evolved to give
acceptable, appetizing and nutritious products. Processing of legumes increases the
digestibility and enhances the aroma, sensory qualities and nutritional attributes of
products. Processing not only improves palatability of foods but also increases the
bioavailability of nutrients.
Dehulling of legume seeds (into dhal) and splitting of cotyledons are often
carried out for better product profile and acceptability. Dehulling reduces cooking time
and has showed a negligible effect on the total protein content and amino acid
composition. Dehulling also removes tannins that lower protein digestibility (Bressani
and Elfas, 1980).
15

Soaking is a preliminary step common to almost all methods of preparing
legumes, prior to cooking. Soaking helps in the removal of seed coat and shortens the
cooking time.
The process of germination is an ancient and popular practice in many parts of
the world, particularly in Asia. Germinated legumes are often added to diets to increase
their acceptability and nutrient contents. Germination involves the breakdown of seed
reserves owing to increased enzyme activity. Upon germination, the content of vitamins
also increases considerably (Vijayaraghavan, 1981).
Heat treatment of all kinds inactivates anti nutritional enzymes and improves
flavour and overall acceptability of the foods prepared. Roasting, drying, toasting and
frying are some of the dry heat processing methods used for whole legume seeds, which
are eaten as snack foods, e.g., fried ground nuts, roasted chickpeas, etc.
Fried dhals are quite common in India, especially in South India. Bengal gram
dhal and green gram dhal are deep fat-fried with the addition of spice and salt mixture,
and are used as snack items. Fried bean cakes made from fried ground legume paste are
widely consumed throughout the world.
2.2.3 Legumes in cookies Legumes that have been studied for cookie fortification include cowpea, faba
bean, navy bean, chickpea and field pea (Patel and Rao, 1996). Mustafa et al., (1986)
reported that cookies made from 15% and 20% cowpea protein isolate were generally
acceptable as compared to the control cookies. Lorenz (1983) found the overall quality
of cookies to be quite satisfactory when wheat flour is substituted with up to 10% bean
flour. Heagzy and Faheid (1990) reported that wheat flour substitution with 10%
chickpea flour was possible without affecting baking and physical characteristic of
16

cookies. In general, these studies indicated that physical, organoleptic and nutritional
characteristic of cookies vary widely from legume to legume.
2.2.4 Resistant starch
Starches have been classified into several types based on their susceptibility to
amylases and consequent digestibility profile (Table 2.3, Brown et al., 1995). The
fraction of starch that is not hydrolysed in the small intestine but later fermented by the
colonic microflora is designated as resistant starch (RS), as it resists hydrolysis by the
amylolytic enzymes elaborated by the healthy human being (Champ et al., 1999).
RS which is not digested in the small intestine, (Asp, 1992; Asp and Bjorck,
1992) enters the large intestine, where it becomes an available substrate for bacterial
fermentation (Cummings and Englyst, 1991). Microbial fermentation of RS produces
several metabolic end products, short chain fatty acids (SCFA) such as acetic, propionic
and butyric acids, carbon dioxide, hydrogen and methane (Cummings and Englyst,
1987; Macfarlene and Cummings, 1991). Some studies indicate that fermentation of RS
specifically leads to an increase in butyric acid (Phillips et al., 1995). These SCFA are
of value to human nutrition in recent years. They have many beneficial physiological
effects of value to colonic health.
Diets rich in RS may have important effects on human health with some effects
similar to those reported for soluble dietary fibre (Annison and Topping, 1994). For
example, RS consumption has been related to reduced postprandial glycemic and
insulinemic responses, which may have beneficial implications in the management of
diabetes (Granfeldt et al., 1994). In vitro studies with human faeces have shown that
fermentation of RS yields relatively high amounts of butyrate as compared with other
non-starch polysaccharides (Cummings and Englyst, 1991).
17

Table 2.3 Classification of starches (Brown et al., 1995)
Type of starch Source Digestibility in
small intestines
Rapid digestible starch
Freshly cooked starchy food Rapid
Slowly digestible starch
Most raw cereals Slow but
complete
Resistant Starch (RS)
RS1 Physically inaccessible
Partially milled grains and seeds Resistant
RS2 Resistant granules
Raw potato and banana Resistant
RS3 Retrograded starch
Cooled, cooked potato, bread and corn flakes
Resistant
RS4 Chemically modified starch
Ether, ester and cross-linking of starch
Resistant
Birkett et al. (1996) have reported that RS has beneficial effects on putative
markers of colonic health, including increased faecal bulk, lower faecal pH and
increased concentration of SCFA (Cassidy et al., 1994). RS has also been suggested for
use in prebiotic composition to promote the growth of such beneficial microorganisms
as bifidobacterium (Brown, 1996). Since RS almost entirely passes through the small
intestine, it can behave as a substrate for growth of the prebiotic microorganisms.
2.2.5 Legume starch digestibility
Generally, among foods, legumes are of particular interest because they contain
high level of RS. Raw legume has more than 15% amount of RS, with cooked legume
18

between 5.0-15.0% amount of RS. This is high compared to other food such as cereals,
wheat or potato. Table 2.4 shows classification of foods according to the range of RS
contents (% dry matter).
Table 2.4 Classification of foods according to the range of RS contents (% dry matter) (Goni et al., 1996).
Amount of resistant starch (%)
Types of food
Negligible (< 1%)
Boiled potato (hot) Boiled (rice) Pasta Breakfast cereal containing high proportion of bran Wheat flour
Low (1-2.5%)
Breakfast cereal Biscuit Bread Pasta Boiled potato (cool) Boiled rice (cool)
Intermediate (2.5-5.0%)
Breakfast cereals (Corn Flakes, Rice Crispies) Fried potatoes Extruded legume
High (5.0-15.0%)
Cooked legumes (lentils, chick peas, beans) Peas Raw rice Autoclaved and cooled starches (Wheat, potato, maize) Cooked and frozen starchy foods
Very high (>15%)
Raw potatoes Raw legumes Unripe banana Retrograded amylose
19

Generally, legumes contain higher level of amylose (30–40%) compared to
cereals (Madhusudhan and Tharanathan, 1995). Cooked legumes are prone to retrograde
more quickly, thereby lowering the process of digestion. Processed legumes contain
significant amount of RS-3. The digestibility of legume starch is much lower than that
of cereal starch (Madhusudhan and Tharanathan, 1995).
The higher content of amylose in legumes, which probably lead to a higher RS
content, may possibly account for their low digestibility. High amylose cereal starch has
been shown to be digested at a significantly lower rate (Borchers, 1961). Legumes
contain more of proteins than cereals and protein-starch interaction in legumes may
equally contribute to their decrease in glycemic responses (Geervani and Theophilus,
1981).
Additionally, the presence of high amounts of dietary fibre and anti nutritional
factors such as phytates and amylase inhibitors may greatly influence the rate and extent
of legume starch digestibility. As a consequence of poor starch digestibility, legumes
promote slow and moderate post-prandial glucose and insulin responses (Jenkins et al.,
1982). Legume carbohydrates, known as ‘slow release carbohydrate’ because of this
property, are considered beneficial in the management of diabetes and hyperlipidemia.
Legume starches contain about 30–40% of amylose and processing of legumes
may lead to increase in the net RS content which may have important effects on human
physiology (Edwards, 1993). Several reports claim that inclusion of legumes in the daily
diet has many beneficial effects in preventing various metabolic diseases such as
diabetes mellitus, coronary heart disease and various types of cancer (Simpson et al.,
1981). Current interest in the role of legumes as therapeutic agents in the diets of people
suffering from metabolic disorders is growing (Thorne et al., 1983). In fact, grain
legumes are the major sources of RS and in turn dietary fibre (DF).
20

2.2.6 Mungbean 2.2.6.1 Background
Mungbean (Vigna radiata L.) is grown throughout Southeast Asia, Central
Africa and warmer parts of China and in the United States (Salunkhe and Kadam, 1989).
Mungbean is the most consumed legume in India. The annual world production of
mungbean between 1981-1985 is about 14 million-15 million tones (Singkhakul and
Jindal, 1990).
The reason for the mass production of mungbean is because it is a short duration
crop and has a wide adaptability. Compared to other plants, mungbean is more resistant
to diseases and dehydration, can be planted in arid conditions and harvested in 55-60
days (Adisarwanto et al., 1992).
The high nutritional profile of mungbean contributes to its wide application and
consumption through out the world. It is used in many types of food and is a cheap and
good source of protein. Mungbean is also almost free from flatulence causing factors.
Mungbean is easily digested and is suitable for children consumption. It is also suitable
as a baby food (El-Moneim, 1999).
2.2.6.2 Classification
The scientific name for mungbean is Vigna radiata (L). Besides that it is also
known as Azukia radiata (L.), Phaseolous raditus (L), Phasi\eolous aureus, Rudua
aurea (Roxb.) and Vigna aureus (Roxb). Mungbean has several other common names
such as green gram, golden gram, moong, mug and mag. Mungbean is classified under
the family Fabaceae and genus Vigna (Salunkhe and Kadam, 1989).
The seed of mungbean has 3 main components, which are the seed coat,
cotyledon and embryo. The coat represents 12.1%, cotyledon 85.6% while embryo 2.3%
21

of the total weight of the seed. The embryo has the highest protein and lipid content
while starch and fibre is concentrated in the cotyledon and coat (Salunkhe and Kadam,
1989).
2.2.6.3 Composition
The proximate composition of mungbean seed is stated in Table 2.5. Mungbean
is low in fat but high in fibre and protein content.
Table 2.5 Proximate composition of 100g mungbean seed (Souci et al., 1994)
Main ingredients unit
Moisture g 10.0
Protein g 24.0 Fat g 1.1 Carbohydrate g 43.61 Total dietary fibre g 15.75 Minerals
g
3.5
2.2.6.3.1 Minerals
Minerals such as calcium, phosphorus, iron, sodium and potassium are the most
abundant minerals found in mungbean (Table 2.6). The amount of minerals varies from
one variety to another. Calcium is mostly found is the seed coat. Phosphorus is
concentrated in the cotyledon. Iron can be found in the embryo and cotyledon (Salunkhe
and Kadam, 1989).
22
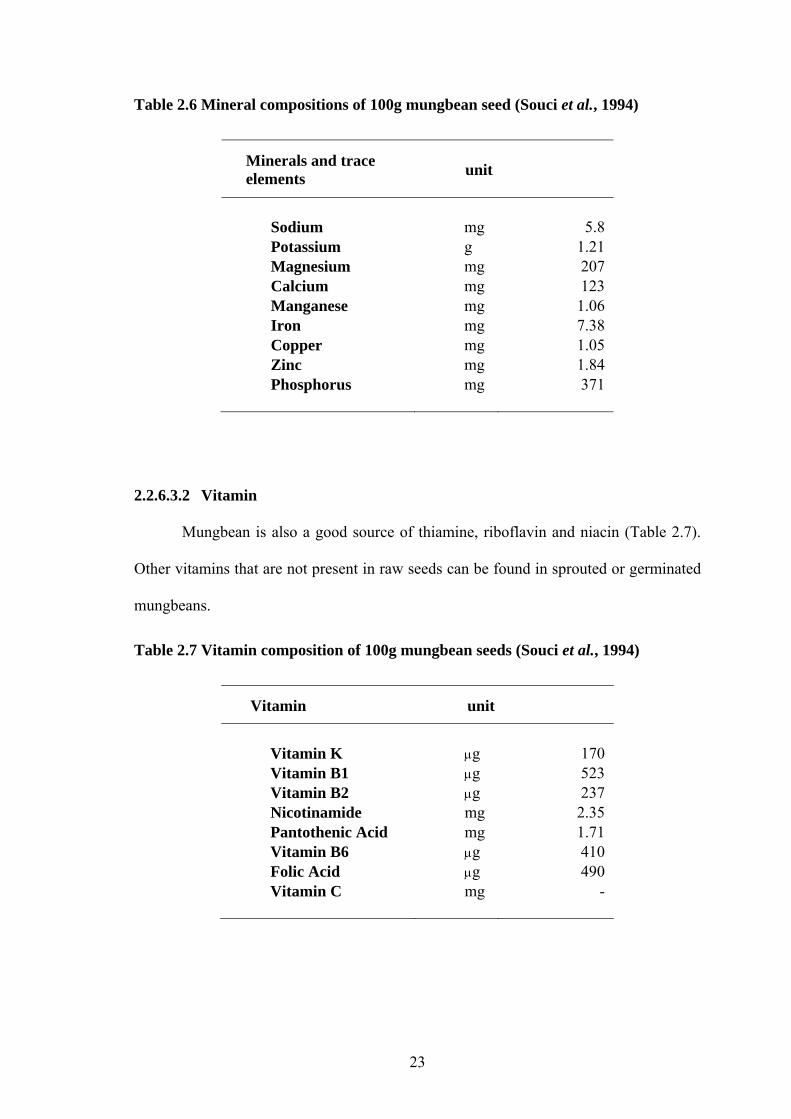
Table 2.6 Mineral compositions of 100g mungbean seed (Souci et al., 1994)
Minerals and trace elements unit
Sodium mg
5.8
Potassium g 1.21 Magnesium mg 207 Calcium mg 123 Manganese mg 1.06 Iron mg 7.38 Copper mg 1.05 Zinc mg 1.84 Phosphorus
mg
371
2.2.6.3.2 Vitamin
Mungbean is also a good source of thiamine, riboflavin and niacin (Table 2.7).
Other vitamins that are not present in raw seeds can be found in sprouted or germinated
mungbeans.
Table 2.7 Vitamin composition of 100g mungbean seeds (Souci et al., 1994)
Vitamin unit
Vitamin K μg
170
Vitamin B1 μg 523 Vitamin B2 μg 237 Nicotinamide mg 2.35 Pantothenic Acid mg 1.71 Vitamin B6 μg 410 Folic Acid μg 490 Vitamin C
mg
-
23

2.2.6.3.3 Carbohydrate
Carbohydrate composition of the whole mungbean seed is about 43.6%.
Carbohydrate in mungbean consists of sugar starch and fibre. Table 2.8 shows the
carbohydrate composition of mungbean. Its starch content has a 28.8% : 71.2% ratio of
amylose to amylopectin (Salunkhe and Kadam, 1989).
Table 2.8 Carbohydrate composition of 100g mungbean seed (Souci et al., 1994)
Carbohydrates unit
Glucose mg
645
Sucrose g 1.41 Rafinose mg 885 Stachyose g 1.68 Verbavose g 2.62 Starch g 41.55 Cellulose g 5.0
Others Soluble dietary fibre g 8.1 Non soluble dietary fibre
g
7.74
Fibre in mungbean consists of 2 main components, which are cellulose and non-
cellulose polymer such as hemicellulose and pectin. Mungbean has a sugar content of
about 7.2%. Legume flour has a considerably higher sugar content than wheat flour
(Navikul and D’Appolonia, 1978).
2.2.6.3.4 Protein
The protein content of mungbean seed is about 24.0% but differs among
cultivars. Globulin contributes to about 80% of protein reserves in mungbean seeds.
Mungbeans has low concentrations of sulphur-containing amino acids and tryptophan
24

Mungbeans has low concentrations of sulphur-containing amino acids and tryptophan
(Salunkhe and Kadam, 1989). The amino acid profile of mungbean is presented in Table
2.9. Mungbeans also contains inhibitor of trypsin but is considered low as compared to
other legumes.
Table 2.9 Amino acid profiles of 100g mungbean seed (Souci et al., 1994)
Amino acid unit
Alanine
g
1.3
Arginine g 1.9 Aspartic Acid g 3.38 Cystine mg 270 Glutamic Acid g 4.81 Glycine g 1.24 Histidine mg 830 Isoleusine g 1.27 Leucine g 2.22 Lysine g 1.95 Methionine mg 390 Phenylalanine g 1.65 Proline g 1.26 Serine g 1.45 Threonine g 1.02 Trytopphan mg 380 Tyrosine mg 800 Valine
g
1.45
2.2.6.4 Processing and Application
There is a great potential in the utilization of mungbeans in food product
sespecially as protein supplements in food. Mungbean flour is high in protein,
potassium, phosphorus and calcium. Mungbean flour also has a better amino acid
content compared to other legume flour (Dzudie and Hardy, 1996). Protein content of
25
Copyright © 2022 FDOKUMEN

