


Bahasa
Halaman
Hukum


PERCEIVED INFLUENCE OF ONLINE RESTAURANT GUIDES
We all eat food; some eat to live on, while some enjoy the experience of eating. This has
been around for ages, and every generation around the globe had their favorite cuisine and food
joints. But this generation has taken it to a different level.
Education and exposure to lot of cultures have helped our people enjoy and appreciate the
different style of cuisines (Solis, 2003). This in turn created a demand and now we can see a lot
of restaurants, each serving different types of food and beverage, from various locations and
cultures known to us. Also, we see lot of people from this generation have accepted these diverse
cultures around us, and thus we have an increase in food lovers around the world.
With the increase in food lovers, and the advances we see in technology and internet, it is
obvious that it have led to the creation of websites and apps that will aid the food lovers in their
subject of interest. As a result, we can see lot of websites being dedicated for cuisine and
beverages. Every style of cuisine has its own set of followers and pages on social media and they
are all constantly trying to make their interests famous amongst people.
Simultaneously, there is a boom in the restaurant industry too. Lot of new players have
come into the market, showcasing their own version of cuisine. Each food culture has many
restaurants around the place, and everyone is trying to differentiate their business with ambience,
space, service and other varieties of food.
Recently, this increase has made the restaurant business very dense and cluttered. As a
result, a new problem rose: the customers fail to know about a new player in the market, and
people have no track of the restaurants and how they are differentiated from one another. This
problem opened up new problems. Such as; where to get your favorite cuisine in a new city?
What would be the price range? What do others think about it?
This gave rise to online customer directories and guides. These websites give information
about various restaurants regionally. This may include menu cards, contact numbers, reservation
options, online ordering, etc. Some even have photos of the restaurant and location guides.
Reviews are also very popular, along with ratings. Popular websites such as Zomato, Burrp,
Timecity, Indiadelicacy, etc have already taken over the major portion of the Indian market.

2 PERCEIVED INFUENCE OF ONLINE RESTAURANT GUIDES
1.1 Review of Literature
Previous researches and articles have shown a significant level of correlation between
reviews and the direct effect on the behavioral patterns of the consulting individuals. A person
regards another individual’s opinions mainly when they face an ambiguity in the matter of
concern. In the case of hotels and restaurants the same situation arises frequently. With a large
variety of restaurants and cuisines popping up at every interval in Bangalore every now and then
and the lifestyle changes taking place, where the people are willing to step out from their comfort
zone and venture out and experience new things, the opinions and peer reviews have gained
greater value and significance. So much so, that it can either make or break an image.
Online product reviews provided by consumers who previously purchased products have
become a major information source for consumers and marketers regarding product quality (Hu
et al, 2009). From this, it can be understood that peer review online or information given online
about certain services and products are regarded important by those who seek to try out certain
products or services. Same is the case with restaurants.
Online consumer review websites improve the information available about product
quality. The impact of this information is larger for products of relatively unknown quality. As
this information flow improves, other forms of reputation such as chain affiliation should
continue to become less influential. On the consumer side, simplifying heuristics and signals of
reviewer quality seem to increase the impact of quality information (Luca, 2011).
It can be seen that online reviews have had a direct impact on the pricing power and
RevPAR in any hotels in countries in Northern Americas and in Europe. “What was remarkable
about the study is that positive online reputation doesn’t merely provide higher pricing power for
online sales, It is correlated to higher group booking rates and corporate negotiated rates in
addition to reservations made over the phone” (Anderson, 2012 by).
Though a lot of diners put a great amount of trust in the word of mouth especially from
those of known sources, they would also go an extra mile to ensure a good dining experience by
looking out for more information on the restaurants. This is done to ensure that they have a good
dining experience by taking into consideration different accounts of peer review. “Outside of
personal word of mouth recommendations, the channels that consumer’s relied on most were
user-generated review sites, such as YELP; the restaurant’s own website, and blogs” (Carin
Oliver, 2012).

3 PERCEIVED INFUENCE OF ONLINE RESTAURANT GUIDES
1.2 Research Gap
Though there are many articles written on the influence of peer reviews on behavior of an
individual and factors that influence a person’s opinion to visit a restaurant, not many research
have been done on this specific topic as of yet. As of now there have been many articles that
have been published online and in newspapers and magazines that have formed a good part of
this research undertaking. Though the articles give a specific point of view to the topic under
concern, it does not give a hard and fast proof and cannot be viewed as completely reliable as
they are just the viewpoint of the article’s author or just a handful of people that were
interviewed for the article. Moreover they have a tendency to be biased to a certain cause.

4 PERCEIVED INFUENCE OF ONLINE RESTAURANT GUIDES
1. Title: Service quality and customer satisfaction: Antecedents of customer’s re-patronage
intentions
Source: Yap Sheau Fen; Kew Mei Lian ,Kdu College, Sunway Academic Journal 4
Objective: To examine the relationship between service quality, customer satisfaction and
Customer’s re-patronage intentions in the context of the restaurant industry
Methodology:
The study was conducted using self-administered questionnaires with the consent from
the restaurant owner beforehand. Pilot testing was conducted using a convenience sample of 35
respondents. The survey was conducted in fusion restaurant from June 2006 to October 2006.
Data analysis:
Multiple linear regression analysis was conducted to analyze the influence of service
quality and satisfaction on re-patronage intention through SPSS 13.0. Three hypotheses were
tested to determine the relationship between the three factors.
H1: Service quality is positively related to re-patronage intentions.
H2: Customer satisfaction is positively related to re-patronage intentions.
H3: Customer satisfaction will be a stronger predictor of customer’s re-patronage intention than
service quality.
Findings:
This study focuses on the quality and satisfaction concepts and how they influence
customer behavioral intentions like purchase and loyalty intention, willingness to spread positive
word of mouth.
The study assumes three hypotheses based on previous literature review to measure
The direct effect of customer satisfaction on re-patronage intention
The direct effect of customer satisfaction on re-patronage intentions
The relative importance of service quality and customer satisfaction for the prediction of
customer re-patronage intentions.
The study shows that there is a direct effect of service quality and satisfaction on re-
patronage of customers. Also this study is also able to demonstrate that satisfaction is a stronger
predictor of re-patronage intentions.

5 PERCEIVED INFUENCE OF ONLINE RESTAURANT GUIDES
2. Title: The influence of the quality of the physical environment, food, and service on restaurant
image, customer perceived value, customer satisfaction, and behavioral intentions.
Source: Authors: Ryu, Kisang; Lee, Hye-Rin; Kim, Woon Gon
Publication title: International Journal of Contemporary Hospitality Management
Volume: 24 Issue: 2 Pages: 200-223
Publication year: 2012 Publication date: 2012
Publisher: Emerald Group Publishing, Limited
Objective:
The purpose of this study is to propose an integrated model that examines the impact of
three elements of food, service quality dimensions(physical environment, food and service)on
restaurant image, customer perceived value, customer satisfaction and behavioral intentions.
Methodology:
First a focus group interview was conducted by eight graduate students who patronized
authentic Chinese restaurants for six months. One of authors functioned as a moderator.
Participants freely discussed their criteria in evaluating the quality of the physical
environment, food quality, service quality, and the restaurant image. Responses from the focus
group helped to construct and refine the questionnaire. Data was collected from customers at an
authentic upscale Chinese restaurant located in a Southeastern state in the USA via a self-
administered questionnaire. 300 questionnaires were used for the final data analysis.
Data analysis:
The testing of the hypotheses in this study adopted a structural equation modeling (SEM)
designed to simultaneously examine the structural relationships among the proposed constructs.
The SEM analysis was based on the maximum likelihood method as an estimation method for
model evaluation and procedures.
Cronbach's alpha was used to assess the reliability of multi-item scales for each construct.
Findings:
The study tries to examine the integrated relationship between quality dimensions
(physical environment, food, and service), restaurant image, and customer perceived
value, customer satisfaction, and behavioral intentions in a Chinese restaurant context.
It shows that the all three elements of restaurant service quality dimensions were significant
determinants of the restaurant image.

6 PERCEIVED INFUENCE OF ONLINE RESTAURANT GUIDES
However, the food quality was also found to be a significant predictor of customer
perceived value, the quality of the physical environment and the service was not found to be a
significant antecedent of customer perceived value.
Also, the findings from the study indicate that the restaurant image is a significant
determinant of customer perceived value. While customer perceived value was the significant
determinant of customer satisfaction, the restaurant image was not a significant predictor of
customer satisfaction. In addition, the current study reinforces the positive impact of customer
satisfaction on loyalty behaviors.
3. Title: Reviews, Reputation, and Revenue: The Case of Yelp.com
Source: Michael Luca, Harvard Business School, September 2011
Methodology:
Data Collection: Two datasets were combined for this paper: restaurant reviews from Yelp.com
and revenue data from the Washington State Department of Revenue to gather revenues for all
restaurants in Seattle from 2003 through 2009.
To investigate the impact of Yelp, the author showed that changes in a restaurant’s rating are
correlated with changes in revenue, controlling for restaurant and quarter fixed effects.
Further, to support the claim that Yelp has a causal impact on revenue, the author exploits the
institutional features of Yelp to isolate variation in a restaurant’s rating that is exogenous
with respect to unobserved determinants of revenue.
In addition to specific reviews, Yelp presents the average rating for each restaurant, rounded
to the nearest half-star. The author implements a regression discontinuity design around the
rounding thresholds, taking advantage of this feature. He looked for discontinuous jumps in
revenue that follow discontinuous changes in rating.
Next he examined the impact of Yelp on revenues for chain restaurants.
Finally, he investigated whether the observed response to Yelp is consistent with Bayesian
learning.
Findings:
A one-star increase in Yelp rating leads to a 5-9 percent increase in revenue,
This effect is driven by independent restaurants; ratings do not affect restaurants with chain
affiliation chain restaurants have declined in market share as Yelp penetration has increased.

7 PERCEIVED INFUENCE OF ONLINE RESTAURANT GUIDES
Consumers do not use all available information and are more responsive to quality changes
that are more visible
Consumers respond more strongly when a rating contains more information.
4. Title: An Experimental Study of How Restaurant‐Owners’ Responses to Negative Reviews
affect Readers’ Intention to Visit.
Source: Evans, D.C., Oviatt, J., Slaymaker, J., Topado, C., Doherty, P., Ball, A., Sáenz, D., &
Wiley, E. (2012b). An experimental study of how restaurant‐owners’ responses to negative
reviews affect readers’ intention to visit. The Four Peaks Review, 2, 1‐12.
Research Question: When responding to negative reviews, especially publicly, what should
businesses say? Or should they say anything at all?
Research Objectives:
To measure how badly a first negative review affects readers’ intention to visit
To test whether any response from the restaurant is better than no response at all
To test whether a combative response (taken from Yelp) is as harmful as is generally
assumed
To test whether two different constructive responses (one taken from Yelp and one based on
PR theory) would return perceptions of the restaurant back to the level they were before the
negative review
Methodology:
An online experiment was built in which participants were randomly assigned to view one of
5 rich‐media scenarios. A random sample size of 259 readers was chosen to carefully controlled
mockups of a Yelp business profile and gathered their reactions.
Scenario 1: showed only the Restaurant Profile.
Scenario 2: added one Negative Customer Review to the Restaurant Profile above, but
showed no Business Response.
Scenario 3: added one Combative Business Response (taken from Yelp) to the above
Negative Review and Restaurant Profile.
Scenario 4: added instead a Constructive Business Response (taken from Yelp) to the above
Negative Review and Restaurant Profile.

8 PERCEIVED INFUENCE OF ONLINE RESTAURANT GUIDES
Scenario 5: added instead a Constructive Business Response (tailored to PR best‐practices) to
the above Negative Review and Restaurant Profile.
Findings:
The research was consistent with past research, a negative review significantly decreased
readers’ intention to visit a restaurant.
Of all the scenarios tested, readers were least likely to visit the restaurant when no response
was made to a negative review; even a combative response improved on silence.
The two more positive, constructive responses from the restaurant owners were able to
eliminate, but not reverse, the PR‐hit caused by a negative review.
The response that was tailored to PR best practices outperformed the polite but non‐expert
responses typically seen on Yelp.
5. Title: Beyond recommendations: local review websites and their impact.
Source: BARRY BROWN, Mobile Life, University of Stockholm
Introduction:
In this paper interviews with users, reviewers, and establishments is done to explore how
local review websites can change interactions around local places. Review websites such as Yelp
and Tripadvisor allow customers to ‘pre-visit’ establishments and areas of a city before an actual
visit. The collection of a large numbers of user generated reviews has also created a new genre of
writing - with reviewers gaining considerable pleasure from passing on word-of-mouth and
influencing others’ choices. Reviews also offer a new channel of communication between
establishments, customers and competitors.
Methodology:
First step that was carried out was scanning of literature on recommendations and in
particular the extensive work on producing sets of recommendations automatically from
preference data.
Secondly, a discussion on history of reviews of physical places and the development of
‘taste’ alongside a literature on what constitutes good taste was carried out.
The last step was research which looked specifically at online reviews and covered the
history of review collected on websites.

9 PERCEIVED INFUENCE OF ONLINE RESTAURANT GUIDES
Participants:
There were 28 participants interviewed in total:
14 review site users, with differences in terms of what sites they used, and what sites they
regularly reviewed
14 establishments selecting from the most reviewed types on Tripadvisor and Yelp.
Findings:
Review websites have their effects on businesses and readers, and they also encourage and
manage reviewers.
Reviews change the search for new establishments, businesses react to being reviewed.
A community of reviewers had developed around Yelp in particular, and this community
contributes to the massive proliferation of reviews on the Yelp website.
Through rearranging the information that the researcher gained about new places and
establishments, review websites did not revolutionize his city spaces, but they do rearrange
the effects of locality and proximity.
6. Title: How online reviews are crucial to a restaurant's takings
Source: Jamie Doward, observer.guardian.co.uk/, 2nd September 2012
Methodology:
The author has taken a work done by two economists from the University of California,
Berkeley, Professor Michael Anderson and Jeremy Magruder, published in a monthly edition of
the Economic Journal.
It represents the first attempt to gauge the relationship between online star ratings and
customers’ purchasing decisions, focusing on the positive effects of online ratings of over 300
restaurants in San Francisco, which helped in the formation of a star system on Yelp.com.
The improvements of an increase of half a star in a 1 – 5 scale without changing the
service, food menu or quality of food.
Number rating on 1 – 5 in decimals can become an average while giving star rating,
which can make a significant difference in quality for the online consumers. The study gathered
reviews and daily reservation availability for 328 restaurants in San Francisco, and found the
increase in star from 3 – 3.5 and later 3.5 to 4 has increased the chances of selling out from 13%
to 34% and to 53% respectively.

10 PERCEIVED INFUENCE OF ONLINE RESTAURANT GUIDES
Findings:
The online star ratings have a tangible influence in the visiting numbers of restaurants.
A half star increase can increase the chance of an increase by up to 19%.
Strong reviews have a positive influence in business than poor reviews, keeping the quality
of food and services, etc constant.
Social media and forums do not generate financial returns, but influences the consumers
judgement of the quality of goods and services.
7. Title: Restaurant Research
Source: Restaurant Research Jason Guenther, Barry Zimmerman
Objective: To find the assortment of reasons that persuades a person to dine at a particular
restaurant and also how big of a part the atmosphere plays.
Methodology: Two different restaurants were selected which were different from each other and
a primary research was conducted through a Questionnaire.
Findings:
Lighting can play a big role in making a restaurant seem comfortable and pleasing. The
lighting can make the patron feel comfortable or uneasy and thus their next visit will depend
on this.
Privacy is an important factor so people who want privacy would always go to the same kind
restaurants and vice versa
Comfort was another important factor. For a few, comfort can be as general as being
comfortable with your surroundings and more defining as how comfortable is your chair.
Vegetation seemed to be an important issue because it provides privacy, colour and natural
elements to an interior.
Architecture also is an important issue as some people enjoy seeing the old timber
architecture and others prefer the newer, fresher environment.
Colour can play an important role in eating behaviours and how a patron feels in the space.
The Colour of the interior can set the mood for the patron and make them either comfortable
or uncomfortable.

11 PERCEIVED INFUENCE OF ONLINE RESTAURANT GUIDES
Though the main factors for selecting a restaurant can be the food and the price but the other
factors like the above also plays an important role.
8. Title : Analysing the Effects of Social Media on the Hospitality Industry
Source: Analysing the effects of social media on the hospitality industry Gaurav Seth University
of Nevada 4-1- 2012
Publication detail: Published as UNLV Theses/Dissertations/Professional Papers/Capstones
Objective: The intent of this study is not to quantify how many hospitality businesses actively
use social media, rather it is to explore the areas and functions these businesses use social media
for, and understand how consumers perceive these new vehicles of communication. The study
will bring out a consumer’s perspective of the advantages of social media over traditional
marketing methods
Methodology: This research paper was compiled by comparing a variety of research from
academic journal articles and other sources of research-intensive literature.
Findings:
Majority of hotel bookings were made over the internet (45% in 2010) which exceeded the
share of travel agents.
Interactive marketing will comprise 21% of all marketing spending by 2014, and social
media will represent 3% to 6% of the interactive marketing spend.
Companies that promote satisfied customers to share their experiences on web-based,
company approved social networking platforms are more likely to draw new customers.
Also companies that address negative reviews retain dissatisfied customers; promote a
positive impact on the word-of-mouth and also improve their bottom line performance.
9. Title: Learning from the Crowd: Regression Discontinuity Estimates of the Effects of an Online
Review Database
Source: Learning from the Crowd: Regression Discontinuity Estimates of the Effects of an
Online Review Database Michael Anderson, Jeremy Magruder, The Economic Journal, 5 oct
2011
Objective:
To estimate the effect of yelp ratings on restaurant reservation availability.

12 PERCEIVED INFUENCE OF ONLINE RESTAURANT GUIDES
A second test for whether the Yelp effect is due to solving information problem groups
restaurants according to whether there are external sources of quality information.
Methodology:
In order to estimate the effect of yelp ratings on restaurant reservation availability two
independent sources were merged . The first data set consisted of the universe of Yelp
reviews for restaurants in San Francisco, California as of February 2011.The second data set
consisted of reservation availability data taken from a large online restaurant reservation
website from July 2010 through October 2010.
A second test for whether the Yelp effect is due to solving information problem groups
restaurants according to whether there are external sources of quality information. The
information for these was taken from San Francisco Chronicles annual Top 100 Restaurants
listing.
Findings:
Yelp aggregates consumer information on restaurant quality into convenient half-star ratings.
The higher ratings cause restaurant to sell out prime-time table 19 percentage points more
frequently. These effects are largest for restaurants where information is most scarce.
Restaurants that are not externally accredited sell out 27 percentage points more frequently
when they receive an extra half-star.
There is no evidence that these effects are due to manipulation of ratings, changes in
restaurant quality, or direct marketing effects of Yelp, and present additional supporting
evidence that customer flows change.
Yelp represents a highly efficient mechanism for social learning, and thus it is perhaps
unsurprising that its effects are so large when social learning effects have been documented
in many other less efficient contexts
10. Title: Electronic Meal Experience: A Content Analysis of Online Restaurant Comments.
Source: Cornell Hospitality Quarterly November 2010 vol. 51 no. 4 483-491
Methodology:
The author randomly selected 300 full-service restaurants from the 791 restaurants on the
London-eating site. Selection criteria were that the restaurant either had an online presence so
that the style of service could determine, or it had online articles that could serve the same

13 PERCEIVED INFUENCE OF ONLINE RESTAURANT GUIDES
purpose. He applied the Davis et al. (2008, 42) classification of full-service restaurants to include
their fine-dining and popular-catering categories. The original set of data of 2,292 was compiled
and included comments during March 2007. A content analysis was made to identify key factors
in the consumers’ reflective commentaries and thus suggest the key values in consumers’
restaurant preference structure model.
The content analysis (Krippendorff 1980) included a total of 2,471 comments (the
original 2,292 plus 179 during the recession). The original data of 2,292 comments from twenty
months (July 2005 to February 2007) were analyzed separately from the 179 comments retrieved
for the same three hundred restaurants for the months of December 2008 and January 2009.Then
frequencies of key variables were converted to percentages to make meaningful comparisons.
Findings:
Anonymity of this site does not unleash a negative tsunami and instead allows satisfied
customers to give a positive restaurant review is a message of great hope to restaurateurs who
might be concerned about such sites.
Price ranks fourth in the list of most frequently mentioned factors, with food and service at
the top
11. Title: Groundbreaking Survey Reveals How Diners Choose Restaurants
Source: Oliver, C. (2012, August 7). Angel Smith. Retrieved June 10, 2013, from Marketing
Article Library: http://angelsmith.net/inbound-marketing/groundbreaking-survey-reveals-how-
diners-choose-restaurants/
Summary: In the study conducted by Angel Smith on how diners are influenced on which
places to visit and eat their food or how restaurant choices are made, a sample size of 500 was
taken. In the result it was seen that 48.9% or the respondents said that they depend on the
opinions of their near and dear ones but out of these it was seen that 8 out of 10 would also
conduct extra research mostly online basically depending on consumer generated review sites,
blogs and restaurant websites.
Respondents were asked to rank the most important places they use for additional
restaurant research after receiving a recommendation from a trusted friend. User generated
review sites (27.7 percent) and the restaurant’s website (27.0 percent) were in a near statistical
tie as the most important places consumers turn. Other friends (25.2 percent) and food blogs

14 PERCEIVED INFUENCE OF ONLINE RESTAURANT GUIDES
(16.4 percent) were ranked as the second most important places for additional restaurant
research. Rounding out the top rankings, Google search was cited by 16.5 percent as the 3rd
most important place for those who do additional research.
12. Title: Cornell Hospitality Research: Online Reputation Directly Affects Pricing Power,
Occupancy & RevPAR
Source: Review Pro. (2012, November 16), Retrieved June 11, 2013.
Summary:
This article explored the relation between online reputation of restaurants and the
subsequent effects it had on different factors mainly the pricing power, occupancy and
RevPAR(Revenue per Available Room). The study was able to find not only a direct correlation
between positive online reviews and pricing power of the concerned restaurants but also saw that
it amounted to higher group booking rates and corporate negotiated rates in addition to
reservations made over the phone.
The findings were made on the basis of over 31,000 monthly observations over 2 ½ years
on midscale, upscale, and luxury hotels in 11 major metropolitan cities and by observing the
consumers in the North America and Europe: London, Milan, Rome, Madrid, Berlin, Prague,
Chicago, Los Angeles, New York, San Francisco, and Miami.

15 PERCEIVED INFUENCE OF ONLINE RESTAURANT GUIDES
3.1 Problem Statement
Earlier, that is before the era of internet and social media, consumers had preference in
selecting restaurants which was usually influenced by word of mouth, popularity or frequency of
visits. Lack of awareness of new restaurants was very much prevalent. Consumer loyalty existed
to a very large extent which made the industry stagnant.
Now, in this age, technology boom has removed all the barriers and opened the gates to
tremendous information available on the finger tips. Information about restaurants is freely
available online which notifies the consumers about the restaurant locations, ratings & rankings,
peer review, menu & price, photos, events, booking status, etc. This has changed the outlook of
the industry and its functioning. The new generation seems to have accepted the changing trend.
3.2 Research Questions
1. To what extent online guides influence the visiting decisions of the customers?
2. How components of online restaurant guides are ranked on the basis of customers'
preference?
3.3 Objectives
1. To identify the major factors that influence visiting intention of the customer.
2. To test the significance of the influence of online restaurant guides on visiting decision of the
customer.
3. To determine the influence of each component of online restaurant guides.
3.4 Scope of the Study
The study will mainly focus on the online restaurant guides and its influence on
consumers. The study will try to estimate and analyze the consumer behavior in Bangalore
region. The study includes restaurants, lounges, etc. but doesn’t include lodges and start hotels.

16 PERCEIVED INFUENCE OF ONLINE RESTAURANT GUIDES
3.5 Research Methodology
3.5.1 Type of Research
The study will adapt quantitative research method by administrating questionnaires to the
target group. We intend to first identify the factors that influence consumer visiting intention,
then concentrating mainly on determining the extent of influence of online restaurant guides. In
the later stage we will be evaluating, to what extent each component of the online restaurant
guide will impact its influence.
The research design is descriptive indicating the relationship between the online
restaurant guides and visiting intention controlling other factors.
3.5.2 Hypothesis
H1 Customer's visiting intention is influenced by the online restaurant guides
H2 Photos, ratings, peer comments, prices, menu card in the online restaurant guides influence
customers’ preference.
3.5.3 Sample Design
i. Target population: The target group will consist of people in the age group of 15 years to 45
years who regularly check for the online reviews of restaurants.
ii. Sampling Elements: Individuals who regularly check for the online reviews of restaurants
iii. Sampling Methodology: The sampling methodology used is Convenience Sampling.
Sampling will be done in shopping malls, Cafes and Gaming Centers where we can find large
target group.
iv. Sample Size: The sample size for the study is 283 respondents.
v. Data Collection Method: Data will be collected through Questionnaires for respondents. The
survey will be conducted in places where there is large crowd. Interviews will be also
conducted with the restaurant owners to get an insight on the issues.
3.6 Limitations of the Study
Previous researches and articles have shown a significant level of correlation between
reviews and the direct effect on the behavioral patterns of the consulting individuals. A person
regards another individual’s opinions mainly when they face an ambiguity in the matter of

17 PERCEIVED INFUENCE OF ONLINE RESTAURANT GUIDES
concern. In the case of hotels and restaurants the same situation arises frequently. With a large
variety of restaurants and cuisines popping up at every interval in Bangalore every now and then
and the lifestyle changes taking place, where the people are willing to step out from their comfort
zone and venture out and experience new things, the opinions and peer reviews have gained
greater value and significance. So much so, that it can either make or break an image.
Looking at it from a larger view, an individual’s opinion rest upon a variety of factors most
of which are not quantitative in nature making it hard to be measured empirically.
The sample being taken is strictly from Bangalore with a population of over 5 million, a
sample size of 200, is not enough to collectively form a strict conclusion on whether the
information given on online restaurant guides play a strong role on controlling the visiting
intentions of restaurant goers.
Factors that influence an individual’s opinion vary from person to person. What one
individual scales as a very important factor on his decision to visit a restaurant may not be
seen as that significant by the next one. There are many factors that influence a person’s
decisions to visit a restaurant and it is hard to take each and every variable into consideration
as a part of the research.

18 PERCEIVED INFUENCE OF ONLINE RESTAURANT GUIDES
4.1 Profile of Respondents
Chart 4.1.1: Age of the Respondent
Chart 4.1.2: Occupation of the Respondents

19 PERCEIVED INFUENCE OF ONLINE RESTAURANT GUIDES
Chart 4.1.3: Monthly Income of the Respondents
Table 4.1.1 Monthly Income
Frequency Percent
Valid
Percent
Cumulative
Percent
Valid Less than 10000 122 43.1 43.1 43.1
10000-20000 52 18.4 18.4 61.5
20000-30000 26 9.2 9.2 70.7
30000-40000 22 7.8 7.8 78.4
More than
40000
61 21.6 21.6 100.0
Total 283 100.0 100.0

20 PERCEIVED INFUENCE OF ONLINE RESTAURANT GUIDES
Chart 4.1.4: Frequency of Visiting a Restaurant
Table 4.1.2: Frequency of Visiting a Restaurant
Frequency Percent
Valid
Percent
Cumulative
Percent
Valid Less than 500 28 9.9 9.9 9.9
500-1000 51 18.0 18.0 27.9
1000-2000 61 21.6 21.6 49.5
2000-3000 67 23.7 23.7 73.1
More than
3000
76 26.9 26.9 100.0
Total 283 100.0 100.0

21 PERCEIVED INFUENCE OF ONLINE RESTAURANT GUIDES
Chart 4.1.5: Monthly Spending on Restaurants
Table 4.1.3 Monthly Spending on Restaurants
Frequency Percent
Valid
Percent
Cumulative
Percent
Valid Never 58 20.5 20.5 20.5
1-3 times 99 35.0 35.0 55.5
4-6 times 48 17.0 17.0 72.4
7-9 times 29 10.2 10.2 82.7
More than 10
times
49 17.3 17.3 100.0
Total 283 100.0 100.0
Interpretation:
The Age group of the respondents varies from 16 to 45 years with the maximum numbers
of respondents are from the age group of 23 years. The maximum number of the respondents as
seen from the data is students. Since most of the respondents are students the maximum number
of respondents in the sample are from the income group of less than 10000 followed by the
income group of more than Rs.40000.It can be observed that most of the respondents visit the
restaurants only 1-3 times in a month.. Largest number of the respondents is seen to be spending
22 PERCEIVED INFUENCE OF ONLINE RESTAURANT GUIDES
more than Rs.3000 on restaurants followed by the second largest number spending Rs.2000-3000
per month.
4.2 Research Questions
Research Question1: To what extent online guides influence the visiting decisions of the
customers?
HypothesisH1: Customer's visiting intention is influenced by the online restaurant guides
Null Hypothesis: Online restaurant guides have significant importance on the customer’s visiting
intention
Alternative Hypothesis: Online restaurant guides do not have significant importance on the
customer’s visiting intention
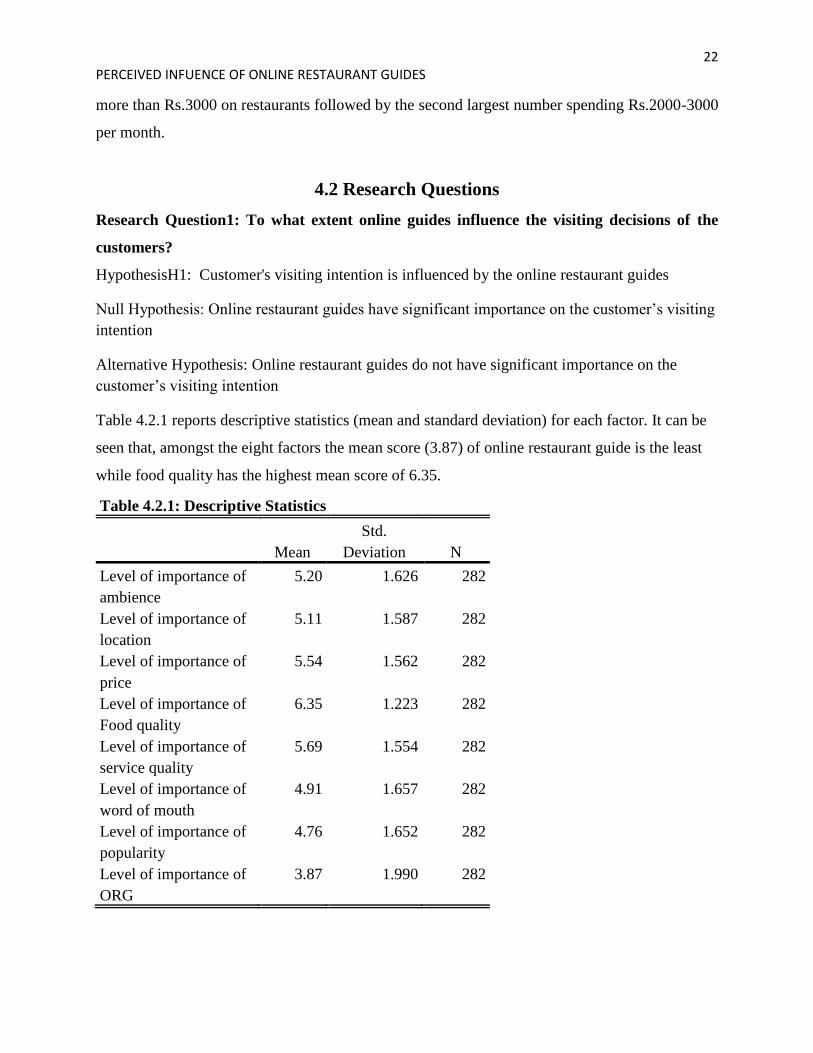
Table 4.2.1 reports descriptive statistics (mean and standard deviation) for each factor. It can be
seen that, amongst the eight factors the mean score (3.87) of online restaurant guide is the least
while food quality has the highest mean score of 6.35.
Table 4.2.1: Descriptive Statistics
Mean
Std.
Deviation N
Level of importance of
ambience
5.20 1.626 282
Level of importance of
location
5.11 1.587 282
Level of importance of
price
5.54 1.562 282
Level of importance of
Food quality
6.35 1.223 282
Level of importance of
service quality
5.69 1.554 282
Level of importance of
word of mouth
4.91 1.657 282
Level of importance of
popularity
4.76 1.652 282
Level of importance of
ORG
3.87 1.990 282

23 PERCEIVED INFUENCE OF ONLINE RESTAURANT GUIDES
Interpretation:
General Linear Model procedure in SPSS, version 19.0 is used to perform factorial
ANOVA analysis. GLM gives the flexibility to accommodate and assess the effect of more than
one categorical variable on the dependent variable.
Table 4.2.2 shows the pairwise comparisons of all the factors. Food quality has the
highest importance having significant positive mean difference with the other factors, followed
by Service quality and price. Service quality and price have almost equal level of importance,
however service quality has a positive mean difference of .145but a significance greater than
0.05( p=0.187). Ambience is the fourth important factor. Popularity and word of mouth have
low level of importance.
The mean difference of Online restaurant guides is negative with respect to ambience
(mean difference= -1.333; p=0.000).Also, Price is more important than online restaurant guides
as the mean difference between online restaurant guides and price is negative (Mean
difference=-1.677;p=0.000) .There is a significant negative mean difference between online
restaurant guides and food quality(mean difference=-2.489;p=0.000) indicating that food quality
has higher level of importance than online restaurant guides. Similarly, we can see that the mean
difference of online restaurant guides (ORG) is negative with respect to all the other factors and
also the significance is less than 0.05. Therefore it can be concluded at 0.05 level of significance
the null hypothesis is accepted. Hence, there is no significant importance of online restaurant
guides while considering visiting a restaurant.
Table 4.2.2: Pairwise Comparisons
(I) factor1 (J) factor1
Mean
Difference (I-J) Std. Error P value
95% Confidence Interval for
Difference
Lower Bound Upper Bound
Ambience Location .089 .090 .325 -.088 .266
Price -.344* .108 .002 -.556 -.132
Food quality -1.156* .088 .000 -1.330 -.982
Service
quality
-.489* .082 .000 -.650 -.328
Word of
mouth
.291* .102 .005 .090 .492

24 PERCEIVED INFUENCE OF ONLINE RESTAURANT GUIDES
Popularity .436* .100 .000 .239 .633
ORG 1.333* .121 .000 1.095 1.572
Location Ambience -.089 .090 .325 -.266 .088
Price -.433* .102 .000 -.633 -.232
Food quality -1.245* .102 .000 -1.445 -1.044
Service
quality
-.578* .097 .000 -.769 -.387
Word of
mouth
.202 .108 .061 -.010 .414
Popularity .348* .098 .000 .155 .540
ORG 1.245* .124 .000 1.000 1.489
Price Ambience .344* .108 .002 .132 .556
Location .433* .102 .000 .232 .633
Food quality -.812* .097 .000 -1.002 -.622
Service
quality
-.145 .110 .187 -.362 .071
Word of
Mouth
.635* .113 .000 .411 .858
Popularity .780* .106 .000 .571 .989
ORG 1.677* .131 .000 1.419 1.936
Food
Quality
Ambience 1.156* .088 .000 .982 1.330
Location 1.245* .102 .000 1.044 1.445
Price .812* .097 .000 .622 1.002
Service
quality
.667* .085 .000 .500 .833
Word of
mouth
1.447* .097 .000 1.255 1.638
Popularity 1.592* .103 .000 1.390 1.794
ORG 2.489* .128 .000 2.238 2.741
Service
Quality
Ambience .489* .082 .000 .328 .650
Location .578* .097 .000 .387 .769
Price .145 .110 .187 -.071 .362
Food quality -.667* .085 .000 -.833 -.500
Word of
mouth
.780* .097 .000 .589 .971
Popularity .926* .102 .000 .725 1.126
ORG 1.823* .120 .000 1.587 2.058
Word of Ambience -.291* .102 .005 -.492 -.090

25 PERCEIVED INFUENCE OF ONLINE RESTAURANT GUIDES
mouth Location -.202 .108 .061 -.414 .010
Price -.635* .113 .000 -.858 -.411
Food quality -1.447* .097 .000 -1.638 -1.255
Service
quality
-.780* .097 .000 -.971 -.589
Popularity .145 .086 .091 -.023 .314
ORG 1.043* .122 .000 .803 1.282
Popularity Ambience -.436* .100 .000 -.633 -.239
Location -.348* .098 .000 -.540 -.155
Price -.780* .106 .000 -.989 -.571
Food quality -1.592* .103 .000 -1.794 -1.390
Service
quality
-.926* .102 .000 -1.126 -.725
Word of
mouth
-.145 .086 .091 -.314 .023
ORG .897* .121 .000 .659 1.136
ORG Ambience -1.333* .121 .000 -1.572 -1.095
Location -1.245* .124 .000 -1.489 -1.000
Price -1.677* .131 .000 -1.936 -1.419
Food quality -2.489* .128 .000 -2.741 -2.238
Service
quality
-1.823* .120 .000 -2.058 -1.587
Word of
mouth
-1.043* .122 .000 -1.282 -.803
Popularity -.897* .121 .000 -1.136 -.659
Research Question 2: How components of online restaurant guides are ranked on the basis
of customers' preference?
HypothesisH1: Influence of Photos, ratings, peer comments, prices, menu card in the online
restaurant guides
Null Hypothesis: Influence of photos, ratings, peer comments, prices and menu card in the online
restaurant guides on customer’s preference is same.
Alternative Hypothesis: Influence of photos, ratings, peer comments, prices and menu card in the
online restaurant guides on customer’s preference is not same.

26 PERCEIVED INFUENCE OF ONLINE RESTAURANT GUIDES
Table 4.2.3 reports descriptive statistics (mean and standard deviation) for each Component of
online restaurant guides. Peer comments have higher level of importance for the customers
(mean=5.21) closely followed by menu card (mean=5.12). Photos is considered least important
while considering online restaurant guides (mean=4.52).
Table 4.2.3: Descriptive Statistics
Mean
Std.
Deviation N
Level of importance of
Photos component of
ORG
4.52 1.722 203
Level of importance of
ratings component of
ORG
4.89 1.389 203
Level of importance of
comments component
of ORG
5.21 1.498 203
Level of importance of
price component of
ORG
4.99 1.678 203
Level of importance of
menu card component
of ORG
5.12 1.585 203
Interpretation:
Peer comments are the most important component when compared to the other
components. The mean difference of peer comments with respect to other factors is positive
followed by menu card. Whereas Price is more important than the photos and Restaurant ratings.
Therefore it can be concluded that at 0.05 level of significance, the null hypothesis is rejected.

27 PERCEIVED INFUENCE OF ONLINE RESTAURANT GUIDES
Table 4.2.4: Pairwise Comparisons
(I) factor1 (J) factor1
Mean
Difference (I-
J) Std. Error Sig.a
95% Confidence Interval for
Differencea
Lower Bound Upper Bound
Photos Rating -.369* .120 .002 -.605 -.133
Peer
comments
-.685* .132 .000 -.944 -.425
Price -.463* .145 .002 -.748 -.178
Menucard -.596* .143 .000 -.878 -.314
Rating Photos .369* .120 .002 .133 .605
Peer
comments
-.315* .104 .003 -.521 -.110
Price -.094 .130 .472 -.350 .163
Menucard -.227 .126 .073 -.475 .022
Peer
comments
Photos .685* .132 .000 .425 .944
Rating .315* .104 .003 .110 .521
Price .222 .135 .102 -.044 .487
Menucard .089 .124 .475 -.155 .333
Price Photos .463* .145 .002 .178 .748
Rating .094 .130 .472 -.163 .350
Peer
comments
-.222 .135 .102 -.487 .044
Menucard -.133 .116 .253 -.362 .096
Menucard Photos .596* .143 .000 .314 .878
Rating .227 .126 .073 -.022 .475
Peer
comments
-.089 .124 .475 -.333 .155
Menucard .133 .116 .253 -.096 .362
Interpretation:
Table 4.2.5 shows the cross tabulation between the frequency of visit and the visiting online
restaurant guides. It is seen that as the frequency of visit increases the percentage of
respondents visiting an online restaurant guides for selecting a restaurant increases. 62.1%
of the respondents visit online restaurant guides for selecting a restaurant as compared to
37.9%.

28 PERCEIVED INFUENCE OF ONLINE RESTAURANT GUIDES
Table 4.2.5: Cross Tabulation
Do you visit online
restaurant guide for
selecting a restaurant
Total Yes No
In a month, how
often do you visit a
restaurant
Never Count 24 34 58
% within In a month,
how often do you visit a
restaurant
41.4% 58.6% 100.0
%
1-3 times Count 58 40 98
% within In a month,
how often do you visit a
restaurant
59.2% 40.8% 100.0
%
4-6 times Count 33 15 48
% within In a month,
how often do you visit a
restaurant
68.8% 31.3% 100.0
%
7-9 times Count 25 4 29
% within In a month,
how often do you visit a
restaurant
86.2% 13.8% 100.0
%
More
than 10
times
Count 35 14 49
% within In a month,
how often do you visit a
restaurant
71.4% 28.6% 100.0
%
Total Count 175 107 282
% within In a month,
how often do you visit a
restaurant
62.1% 37.9% 100.0
%

29 PERCEIVED INFUENCE OF ONLINE RESTAURANT GUIDES
Chart 4.2: Visiting Online Restaurant Guides

30 PERCEIVED INFUENCE OF ONLINE RESTAURANT GUIDES
5.1 Discussion of Findings
1. To identify the major factors that influence visiting intention of the customer.
From the analysis it can be concluded that the major factor that is influencing the
respondents is food quality. Service quality has also emerged to be an important factor being
equally important as the price. Ambience and location do not have much significance. However
word of mouth and popularity of restaurants do not have much influence on the visiting intention
of the respondents.
2. To test the significance of the influence of online restaurant guides on visiting decision of
the customer
Online restaurant guides have the least importance while considering visiting a restaurant.
Even though online restaurant guides are visited often, they do not necessarily influence the
visiting intention of the customer. From the analysis it is seen that the online restaurant guides
are considered least important of all the factors and contribute very little in influencing the
visiting intention of the customers. Therefore, it
Another important finding is that with the increase in the frequency of restaurant visits,
the percentage of respondents checking online restaurant guides increases.
3. To determine the influence of each component of online restaurant guides
Components of online restaurant guides i.e. Photos, Rating, Peer comments, Price and
Menu card have different level of influence on the customer preference. Peer comments have the
most influence on the customers’ preference. Menu Card displayed in the online restaurant
guides are the next influential factor.
5.2 Implications of Findings
Our study shows that Food quality and Service Quality are the major factors considered
by customers for visiting a restaurant which is in line with the findings of the researches already
conducted in this area. When it comes to online restaurant guides in the Indian context we can
observe that the online restaurant guides do not have as much significance as compared to the
research conducted in the same area internationally. Thus the study establishes that online

31 PERCEIVED INFUENCE OF ONLINE RESTAURANT GUIDES
restaurant guides do not majorly alter the decision making of an Indian customer, and to the
extent it does, it is observed that this alteration is influenced by peer comments followed by the
menu card and price rather than ratings and the photos.
Conclusion

32 PERCEIVED INFUENCE OF ONLINE RESTAURANT GUIDES
With the advances in technology and internet, we can see lot of websites being dedicated
for cuisine and beverages. Simultaneously, there is a boom in the restaurant industry too. Lot of
new players has come into the market and everyone is trying to differentiate their business with
ambience, space, service and other varieties of food. With the increasing popularity of the online
restaurant guides, it is generally thought that they are having higher influence on the customers’
visiting intention of the restaurants. However the study shows that the major factors influencing
the customers’ visiting intentions are food quality, service quality and price. Online restaurant
guides are not considered important in their decision making process.
Even though people visit online restaurant guides, it is may be just to have a check on the
restaurants rather than make their decisions on visiting a restaurant based on it. Also Peer
comments about the restaurant dining experience have more influence on the customers than the
other components of the online restaurant guides. Menu card is also considered as an important
component while checking an online restaurant guides. Photos are considered the least important
component.
Online restaurant guides are effective way for gathering information about the
restaurants. However they are merely looked at as a supporting tool. They are primarily
influenced by the food, service quality, and price. Online restaurant guides have lot of scope in
the future provided they communicate their purpose effectively.
References

33 PERCEIVED INFUENCE OF ONLINE RESTAURANT GUIDES
Electronic Meal Experience: A Content Analysis of Online Restaurant Comments. (2010,
November). Cornell Hospitality Quarterly, 51(4), pp. 483-491.
Review Pro. (2012, November 16). Retrieved June 11, 2013, from
http://www.reviewpro.com/cornell-reputation-revenue-research-14442
Oliver, C. (2012, August 7). Angel Smith. Retrieved June 10, 2013, from Marketing Article
Library: http://angelsmith.net/inbound-marketing/groundbreaking-survey-reveals-how-
diners-choose-restaurants/
Solis, K. T. (2003). How Can I Learn about Different Cultures? Retrieved 2013, from
www.wisegeek.com.
QUESTIONNAIRE

34 PERCEIVED INFUENCE OF ONLINE RESTAURANT GUIDES
This survey is being conducted in partial fulfillment of Market Research project as part of MBA program at Christ University
Institute of Management. In appreciation for your honest participation in this study by completing this survey and submitting it to
questionnaire administrator, we promise to keep this information confidential and the use of this information will be purely for
academic purpose.
Name: Age (in years) :
Occupation (Tick whichever appropriate):
Professional / Business / Employed by an organization / Students / Homemaker /
Others ________________
Please tick the appropriate answer for the questions below ()
Q1. What is your monthly income (INR)?
Less than 10000 30000 – 40000
10000 – 20000 More than 40000
20000 – 30000
Q2. In a month how often do you visit a restaurant?
Less than 3 times 10-12 times
3-6 times More than 12 times
7-9 times
Q3. How much do you spend monthly on restaurants (INR)?
Less than 500 2000 - 3000
500 – 1000 More than 3000
1000 – 2000
Q4. Rate the level of Importance (1 to 7) of factors you consider for visiting a restaurant.
(7 being - Extremely Important and 1 being – Not at all Important)

35 PERCEIVED INFUENCE OF ONLINE RESTAURANT GUIDES
Please encircle the appropriate option
FACTORS
Ambience 7 6 5 4 3 2 1
Location 7 6 5 4 3 2 1
Price 7 6 5 4 3 2 1
Food Quality 7 6 5 4 3 2 1
Service Quality 7 6 5 4 3 2 1
Word of Mouth 7 6 5 4 3 2 1
Popularity 7 6 5 4 3 2 1
Online Restaurant Guide 7 6 5 4 3 2 1
Q5. Do you visit Online Restaurant Guide for selecting a restaurant?
Yes No
If yes, then continue.
Q6. Out of 10 restaurants that you visit, how many are selected on the basis of online restaurant
guides?
___ / 10
Q7. Which Online Restaurant Guide(s) do you refer seeking information on restaurants?
Zomato
Burp
Justeat
Others _____________________
Please tick the appropriate bubble for the questions below ()

36 PERCEIVED INFUENCE OF ONLINE RESTAURANT GUIDES
Q8. Photos of restaurants on Online Restaurant Guides encourage me to visit a restaurant.
Q9. Restaurants ratings on Online Restaurant Guides can alter my impression about a restaurant.
Q10. Peer comments about restaurants on Online Restaurant Guides effect my decision making
to visit a restaurant.
Q11. Before selecting a restaurant, I check the prices on Online Restaurant Guides.
Q12. Depending on the menu card available on Online Restaurant Guides, I decide on the cuisine
and make a choice of a restaurant.
Thank you for your valuable participation
PROFILE OF PROJECT TEAM
Strongly
Agree Strongly
Disagree
Strongly
Agree
Strongly
Agree
Strongly
Agree
Strongly
Agree
Strongly
Disagree
Strongly
Disagree
Strongly
Disagree
Strongly
Disagree

37 PERCEIVED INFUENCE OF ONLINE RESTAURANT GUIDES
Sl.
No. Name
Register
No. Role Background Personal Strengths & skills
1 Aswin Dan
Abraham 1221403
Point of
Contact
B.Com in
Computer
Application
Leadership quality, creative
thinking, Presentation skills
2 Chinmai
K.P. 1221444
Team
Member
B.E. in Civil
Engineering
Sound analytical and
statistical skills, Logical
Thinking, Presentation skills
3 Niharika
Rai 1221453
Team
Member
1 year of work
experience in
Infosys,
B.E. in
Telecommunication
Good analytical skills,
leadership quality,
Presentation skills
4 Vinisha
James 1221460
Team
Member
10 months work
experience in Dell,
B.Tech. in
Biotechnology
Creative thinking, Sound
analytical skills, Presentation
skills
5. Dhanashree
Sreesan 1221545
Team
Member
B.B.M in
Marketing
Presentation skills, Creative
mind, Communication skills
Top Related
Copyright © 2022 FDOKUMEN

