


Bahasa
Halaman
Hukum


Particle modelling of the hybrid negative ion source
This article has been downloaded from IOPscience. Please scroll down to see the full text article.
2011 Plasma Sources Sci. Technol. 20 024009
(http://iopscience.iop.org/0963-0252/20/2/024009)
Download details:
IP Address: 193.204.182.245
The article was downloaded on 03/04/2011 at 09:49
Please note that terms and conditions apply.
View the table of contents for this issue, or go to the journal homepage for more
Home Search Collections Journals About Contact us My IOPscience
IOP PUBLISHING PLASMA SOURCES SCIENCE AND TECHNOLOGY
Plasma Sources Sci. Technol. 20 (2011) 024009 (7pp) doi:10.1088/0963-0252/20/2/024009
Particle modelling of the hybrid negativeion sourceF Taccogna1, P Minelli1, P Diomede2, S Longo1,2, M Capitelli1,2 andR Schneider3
1 Istituto di Metodologie Inorganiche e di Plasmi - CNR, Sect. Bari, via Amendola 122/D,70126 Bari, Italy2 Dipartimento di Chimica, Universita’ degli Studi di Bari, via Orabona 4, 70126 Bari, Italy3 Institute of Physics, Ernst-Moritz-Arndt University, Felix-Hausdorff Str. 6, 17489 Greifswald, Germany
E-mail: [email protected]
Received 28 July 2010, in final form 8 November 2010Published 1 April 2011Online at stacks.iop.org/PSST/20/024009
AbstractIn this paper we present results of different particle-based models of expansion and extractionregions for the ITER negative ion source. Results show the important role of electron-inducedprocesses (eV excitation and dissociation) and gas–surface and plasma–surface interactions(atom recombinative desorption and ion neutralization) for the production of negative ionprecursors. The spatial distribution of neutral and ionized caesium as well as the drag due tothe deuterium flow and its re-evaporation from the plasma grid is calculated. Theself-consistent two-dimensional electric field distribution in the extraction region allows abetter understanding of the transport of surface-produced negative ions towards the orifice.The model delivers an extraction probability of less than 25%.
(Some figures in this article are in colour only in the electronic version)
1. Introduction
Neutral beam injection heating has been a reliable and powerfulmethod to heat and drive the current of fusion plasmas. Atenergies above 100 keV/nucleon, the neutralization efficiencyfor positive ions decreases drastically while staying at around60% for negative ions. Therefore, a negative-ion-based NBIsystem is inevitable for a large-scaled and current-driven fusionexperiment such as ITER, where an injection energy of 1 MeVis needed [1].
It is generally accepted [2, 3] that H− ions are producedin two different ways:
• in the volume by dissociative attachment of slow electrons(Te < 2 eV) to highly vibrationally excited levels ofhydrogen molecules, H2;
• on caesiated surfaces by atomic and ionic conversion,because caesium lowers the work function of the metalsurface and therefore increases the electron transferprobability to the particle hitting the surface.
In both cases the production of negative ions requiresthe formation of precursors: vibrationally excited hydrogen
molecules for volume production and ions and hot atoms forsurface production.
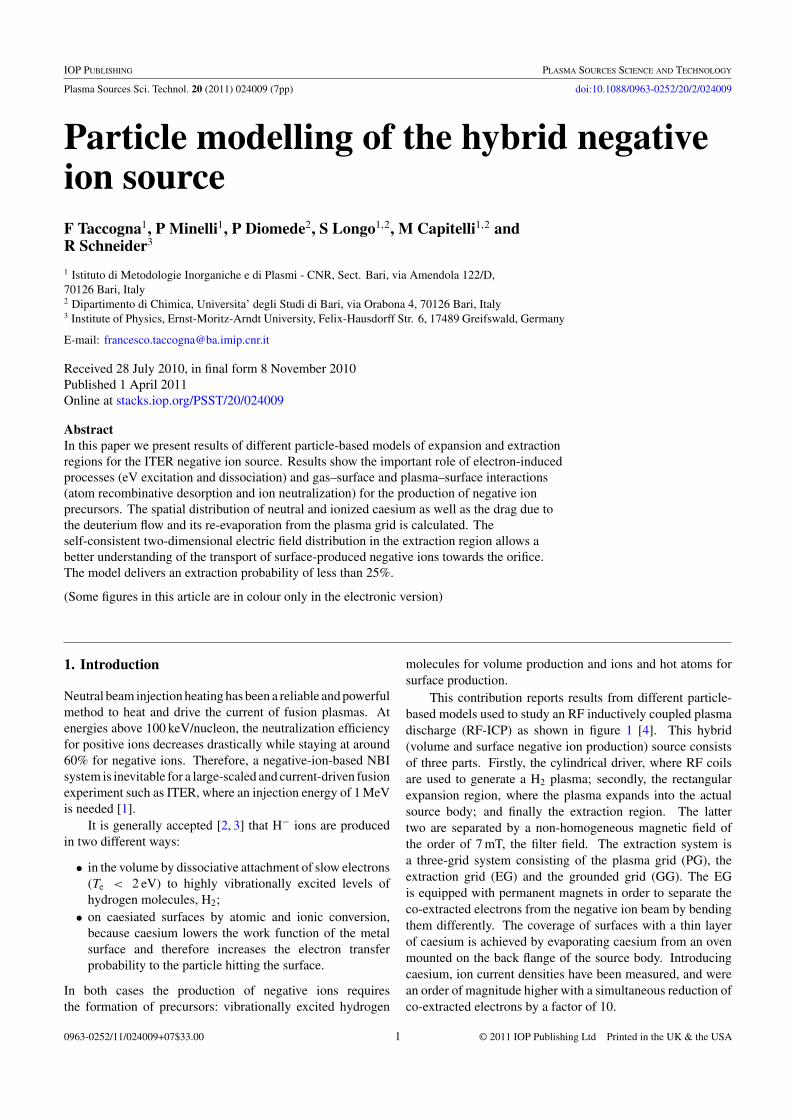
This contribution reports results from different particle-based models used to study an RF inductively coupled plasmadischarge (RF-ICP) as shown in figure 1 [4]. This hybrid(volume and surface negative ion production) source consistsof three parts. Firstly, the cylindrical driver, where RF coilsare used to generate a H2 plasma; secondly, the rectangularexpansion region, where the plasma expands into the actualsource body; and finally the extraction region. The lattertwo are separated by a non-homogeneous magnetic field ofthe order of 7 mT, the filter field. The extraction system isa three-grid system consisting of the plasma grid (PG), theextraction grid (EG) and the grounded grid (GG). The EGis equipped with permanent magnets in order to separate theco-extracted electrons from the negative ion beam by bendingthem differently. The coverage of surfaces with a thin layerof caesium is achieved by evaporating caesium from an ovenmounted on the back flange of the source body. Introducingcaesium, ion current densities have been measured, and werean order of magnitude higher with a simultaneous reduction ofco-extracted electrons by a factor of 10.
0963-0252/11/024009+07$33.00 1 © 2011 IOP Publishing Ltd Printed in the UK & the USA
Plasma Sources Sci. Technol. 20 (2011) 024009 F Taccogna et al
Figure 1. Sketch of the RF-ICP hybrid negative ion source.
2. Gas kinetics and dynamics in the expansion region
In order to understand the formation of negative ion precursors,a direct simulation Monte Carlo (DSMC) model (from the exitplane of the driver to the entrance of the extraction region, 2 cmfrom the PG) has been developed.
In the expansion region, the plasma is continuouslyreplenished from the driver region. Therefore, the plasmasubsystem is considered as a fixed background. An axial decaydue to the expansion of the plasma is used according to theexponential profiles [5, 6]
n(z) = n0e−z/0.13, (1a)
Te(z) = Te,0e−z/0.23, (1b)
where z is in metres and n0 = 1 × 10¹⁸ m−3 and Te,0 = 8 eVare the values at the driver exit plane. The molar fractions ofthe ion species H+
i (the index i is used to refer to the differentpositive ions) are estimated for typical operative conditions ofthe RF negative ion source [7]:
χ(H+) = 0.4; χ(H+2) = 0.4; χ(H+
3) = 0.2 (2)
while the ion temperature is fixed at Ti = 0.8 eV.Into this plasma background, neutral pseudo-particles of
H and H2 are launched from the source line (at the driverexit plane at z = 0 m) with a half-Maxwellian velocitydistribution and a Boltzmann vibrational population. For theatoms a translational temperature of TH = 12 000 K has beenconsidered, while for molecules a translational temperature,TH2 = 1200 K, equal to the vibrational temperature Tv waschosen [6, 8]. The ratio of [H]/[H2]= 0.2 [8] between atomicand molecular density is fixed at the source location. Anopen boundary condition is implemented on the right side ofthe simulation domain. All the parameters were chosen torepresent the experimental conditions as closely as possible.
The first electronic state of hydrogen atoms H (n = 1 s)is considered. In fact, due to the typical neutral time scale(�t ≈ 10−8 s), the spontaneous emission process is consideredto be fast and all electronic excited states of H decay into theground state. For the molecules, fifteen vibrational levels of
the fundamental electronic state of H2 (X 1 ∑+g , v = 0, . . ., 14)
are taken into account. Owing to the scaling of relaxationtimes τVT � τRT ∼ τTT, one can usually treat the problemof vibrational relaxation by assuming that both the rotationaland translational degrees of freedom have already attainedequilibrium.
For the plasma conditions studied here, direct electron-impact excitation [9] appears to be the dominant vibrationalheating mechanism. Electron excitation processes aredistinguished in direct vibrational excitation (eV processes)and vibrational excitation caused by the radiative decay ofhigher singlet electronic states (EV processes). The formerinvolve excitations only with jumps |vf − vi| < 5, whilethe latter are not limited in the vibrational level jumps.Proton induced excitation (pV), charge exchange (p-CX) anddissociation (pV-diss) are also included [10].
Concerning the destruction processes of vibrational states,electron-induced electronic excitations, ionization, dissocia-tion, dissociative ionization and dissociative attachment [9] ofH2 molecules are taken into account in the model.
As neutral–neutral relaxation processes, the vibrational–translational exchange between molecule–atom (Vt) andmolecule–molecule (VT) and the vibrational–vibrational (VV)exchange between molecules are considered [11, 12]. Theseprocesses are important at high vibrational levels.
In the model the transverse coordinates x and y ofparticles are updated and when a neutral collides with the wallmolecular relaxation/dissociation and atom recombination are,respectively, processed for molecules and atoms. Theseprocesses play an important role due to the high aspect ratio(surface to volume ratio) of the expansion region.
For H2 molecules, a constant value of the stickingprobability (γstick,H2 = 0.01 [13]), and in case of reflectiona constant dissociation probability of γdiss = 0.08 [14], is usedto simulate the emission of atoms from the surface. If themolecule does not dissociate, according to a set of repopulationprobabilities (see figure 1 in [15]) the final vibrational stateafter wall collision is chosen.
For an H atom impacting on the wall, a constant value ofthe sticking probability is again used (γstick,H = 0.5 [16]). Ifthe atom does not stick on the surface, reactive recombinative
2
Plasma Sources Sci. Technol. 20 (2011) 024009 F Taccogna et al
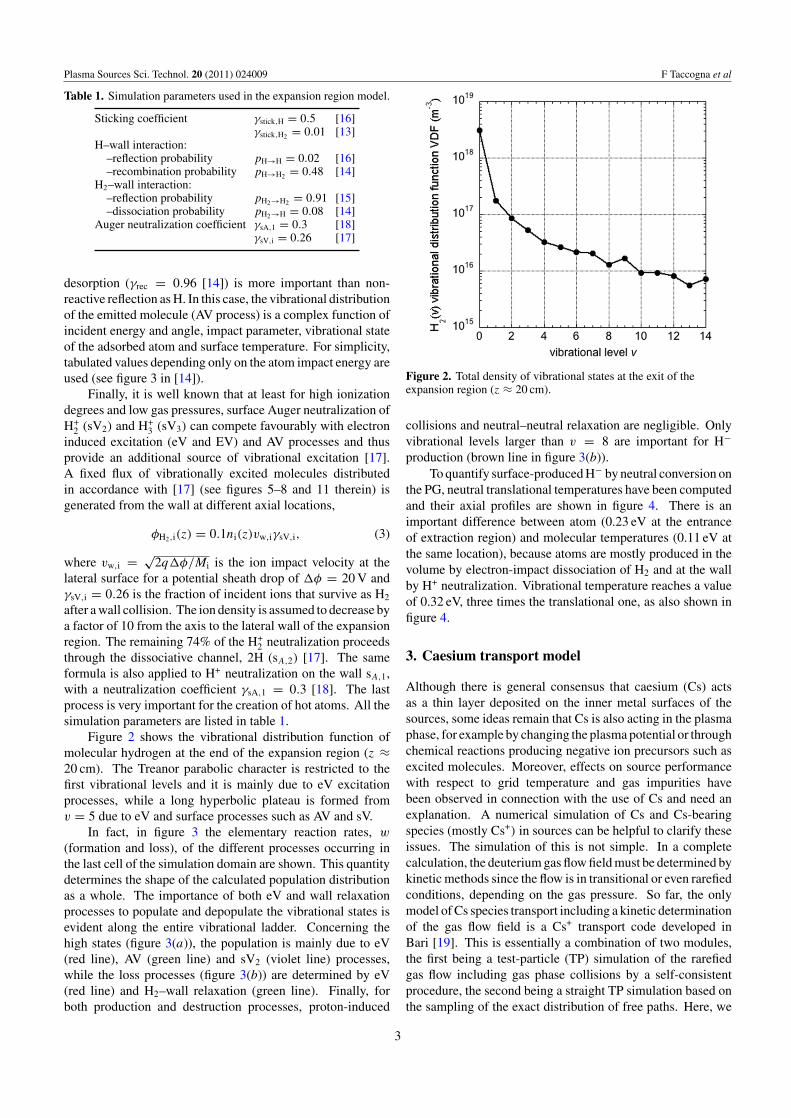
Table 1. Simulation parameters used in the expansion region model.
Sticking coefficient γstick,H = 0.5 [16]γstick,H2 = 0.01 [13]
H–wall interaction:–reflection probability pH→H = 0.02 [16]–recombination probability pH→H2 = 0.48 [14]
H2–wall interaction:–reflection probability pH2→H2 = 0.91 [15]–dissociation probability pH2→H = 0.08 [14]
Auger neutralization coefficient γsA,1 = 0.3 [18]γsV,i = 0.26 [17]
desorption (γrec = 0.96 [14]) is more important than non-reactive reflection as H. In this case, the vibrational distributionof the emitted molecule (AV process) is a complex function ofincident energy and angle, impact parameter, vibrational stateof the adsorbed atom and surface temperature. For simplicity,tabulated values depending only on the atom impact energy areused (see figure 3 in [14]).
Finally, it is well known that at least for high ionizationdegrees and low gas pressures, surface Auger neutralization ofH+
2 (sV2) and H+3 (sV3) can compete favourably with electron
induced excitation (eV and EV) and AV processes and thusprovide an additional source of vibrational excitation [17].A fixed flux of vibrationally excited molecules distributedin accordance with [17] (see figures 5–8 and 11 therein) isgenerated from the wall at different axial locations,
φH2,i(z) = 0.1ni(z)vw,iγsV,i, (3)
where vw,i = √2q�φ/Mi is the ion impact velocity at the
lateral surface for a potential sheath drop of �φ = 20 V andγsV,i = 0.26 is the fraction of incident ions that survive as H2
after a wall collision. The ion density is assumed to decrease bya factor of 10 from the axis to the lateral wall of the expansionregion. The remaining 74% of the H+
2 neutralization proceedsthrough the dissociative channel, 2H (sA,2) [17]. The sameformula is also applied to H+ neutralization on the wall sA,1,with a neutralization coefficient γsA,1 = 0.3 [18]. The lastprocess is very important for the creation of hot atoms. All thesimulation parameters are listed in table 1.
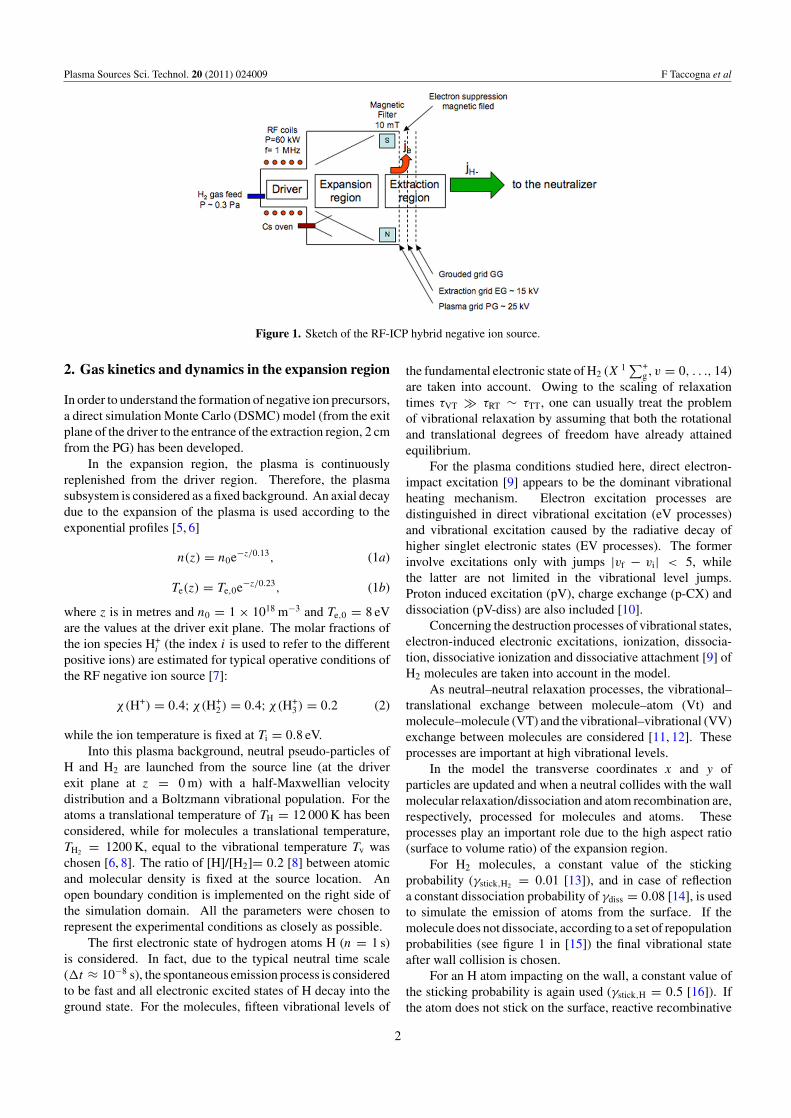
Figure 2 shows the vibrational distribution function ofmolecular hydrogen at the end of the expansion region (z ≈20 cm). The Treanor parabolic character is restricted to thefirst vibrational levels and it is mainly due to eV excitationprocesses, while a long hyperbolic plateau is formed fromv = 5 due to eV and surface processes such as AV and sV.
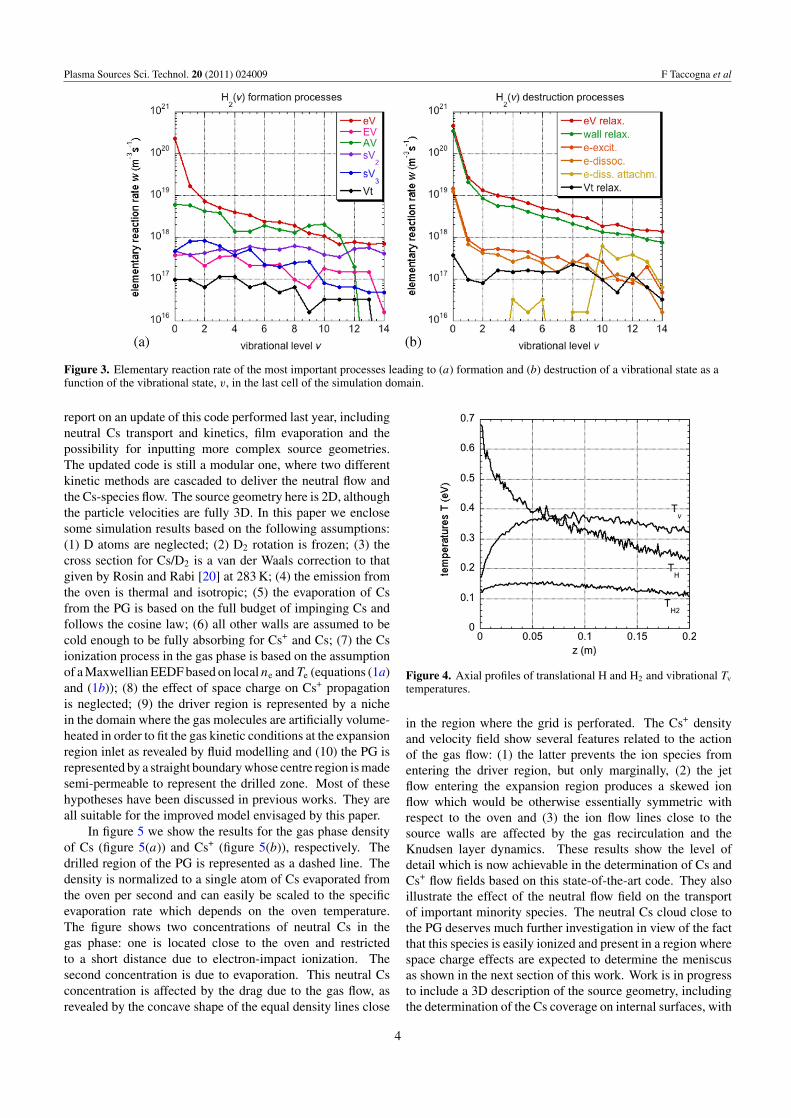
In fact, in figure 3 the elementary reaction rates, w
(formation and loss), of the different processes occurring inthe last cell of the simulation domain are shown. This quantitydetermines the shape of the calculated population distributionas a whole. The importance of both eV and wall relaxationprocesses to populate and depopulate the vibrational states isevident along the entire vibrational ladder. Concerning thehigh states (figure 3(a)), the population is mainly due to eV(red line), AV (green line) and sV2 (violet line) processes,while the loss processes (figure 3(b)) are determined by eV(red line) and H2–wall relaxation (green line). Finally, forboth production and destruction processes, proton-induced
Figure 2. Total density of vibrational states at the exit of theexpansion region (z ≈ 20 cm).
collisions and neutral–neutral relaxation are negligible. Onlyvibrational levels larger than v = 8 are important for H−
production (brown line in figure 3(b)).To quantify surface-produced H− by neutral conversion on
the PG, neutral translational temperatures have been computedand their axial profiles are shown in figure 4. There is animportant difference between atom (0.23 eV at the entranceof extraction region) and molecular temperatures (0.11 eV atthe same location), because atoms are mostly produced in thevolume by electron-impact dissociation of H2 and at the wallby H+ neutralization. Vibrational temperature reaches a valueof 0.32 eV, three times the translational one, as also shown infigure 4.
3. Caesium transport model
Although there is general consensus that caesium (Cs) actsas a thin layer deposited on the inner metal surfaces of thesources, some ideas remain that Cs is also acting in the plasmaphase, for example by changing the plasma potential or throughchemical reactions producing negative ion precursors such asexcited molecules. Moreover, effects on source performancewith respect to grid temperature and gas impurities havebeen observed in connection with the use of Cs and need anexplanation. A numerical simulation of Cs and Cs-bearingspecies (mostly Cs+) in sources can be helpful to clarify theseissues. The simulation of this is not simple. In a completecalculation, the deuterium gas flow field must be determined bykinetic methods since the flow is in transitional or even rarefiedconditions, depending on the gas pressure. So far, the onlymodel of Cs species transport including a kinetic determinationof the gas flow field is a Cs+ transport code developed inBari [19]. This is essentially a combination of two modules,the first being a test-particle (TP) simulation of the rarefiedgas flow including gas phase collisions by a self-consistentprocedure, the second being a straight TP simulation based onthe sampling of the exact distribution of free paths. Here, we
3
Plasma Sources Sci. Technol. 20 (2011) 024009 F Taccogna et al
Figure 3. Elementary reaction rate of the most important processes leading to (a) formation and (b) destruction of a vibrational state as afunction of the vibrational state, v, in the last cell of the simulation domain.
report on an update of this code performed last year, includingneutral Cs transport and kinetics, film evaporation and thepossibility for inputting more complex source geometries.The updated code is still a modular one, where two differentkinetic methods are cascaded to deliver the neutral flow andthe Cs-species flow. The source geometry here is 2D, althoughthe particle velocities are fully 3D. In this paper we enclosesome simulation results based on the following assumptions:(1) D atoms are neglected; (2) D2 rotation is frozen; (3) thecross section for Cs/D2 is a van der Waals correction to thatgiven by Rosin and Rabi [20] at 283 K; (4) the emission fromthe oven is thermal and isotropic; (5) the evaporation of Csfrom the PG is based on the full budget of impinging Cs andfollows the cosine law; (6) all other walls are assumed to becold enough to be fully absorbing for Cs+ and Cs; (7) the Csionization process in the gas phase is based on the assumptionof a Maxwellian EEDF based on local ne and Te (equations (1a)and (1b)); (8) the effect of space charge on Cs+ propagationis neglected; (9) the driver region is represented by a nichein the domain where the gas molecules are artificially volume-heated in order to fit the gas kinetic conditions at the expansionregion inlet as revealed by fluid modelling and (10) the PG isrepresented by a straight boundary whose centre region is madesemi-permeable to represent the drilled zone. Most of thesehypotheses have been discussed in previous works. They areall suitable for the improved model envisaged by this paper.
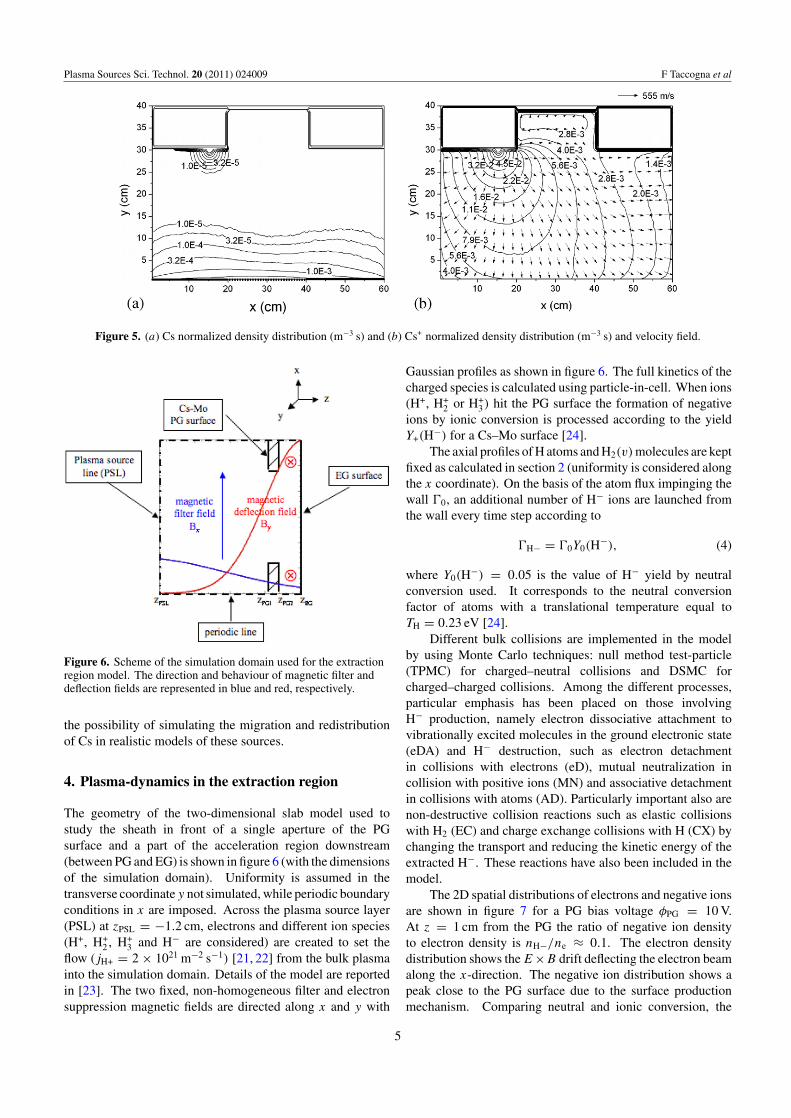
In figure 5 we show the results for the gas phase densityof Cs (figure 5(a)) and Cs+ (figure 5(b)), respectively. Thedrilled region of the PG is represented as a dashed line. Thedensity is normalized to a single atom of Cs evaporated fromthe oven per second and can easily be scaled to the specificevaporation rate which depends on the oven temperature.The figure shows two concentrations of neutral Cs in thegas phase: one is located close to the oven and restrictedto a short distance due to electron-impact ionization. Thesecond concentration is due to evaporation. This neutral Csconcentration is affected by the drag due to the gas flow, asrevealed by the concave shape of the equal density lines close
Figure 4. Axial profiles of translational H and H2 and vibrational Tv
temperatures.
in the region where the grid is perforated. The Cs+ densityand velocity field show several features related to the actionof the gas flow: (1) the latter prevents the ion species fromentering the driver region, but only marginally, (2) the jetflow entering the expansion region produces a skewed ionflow which would be otherwise essentially symmetric withrespect to the oven and (3) the ion flow lines close to thesource walls are affected by the gas recirculation and theKnudsen layer dynamics. These results show the level ofdetail which is now achievable in the determination of Cs andCs+ flow fields based on this state-of-the-art code. They alsoillustrate the effect of the neutral flow field on the transportof important minority species. The neutral Cs cloud close tothe PG deserves much further investigation in view of the factthat this species is easily ionized and present in a region wherespace charge effects are expected to determine the meniscusas shown in the next section of this work. Work is in progressto include a 3D description of the source geometry, includingthe determination of the Cs coverage on internal surfaces, with
4
Plasma Sources Sci. Technol. 20 (2011) 024009 F Taccogna et al
Figure 5. (a) Cs normalized density distribution (m−3 s) and (b) Cs+ normalized density distribution (m−3 s) and velocity field.
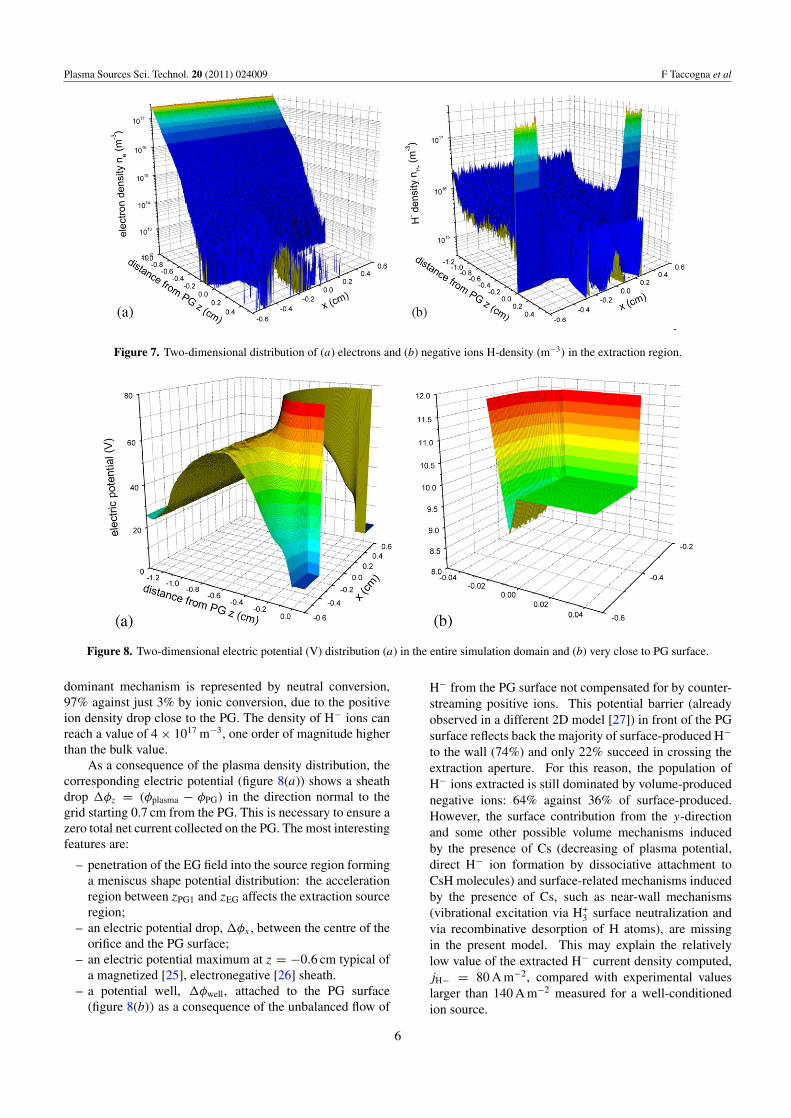
Figure 6. Scheme of the simulation domain used for the extractionregion model. The direction and behaviour of magnetic filter anddeflection fields are represented in blue and red, respectively.
the possibility of simulating the migration and redistributionof Cs in realistic models of these sources.
4. Plasma-dynamics in the extraction region
The geometry of the two-dimensional slab model used tostudy the sheath in front of a single aperture of the PGsurface and a part of the acceleration region downstream(between PG and EG) is shown in figure 6 (with the dimensionsof the simulation domain). Uniformity is assumed in thetransverse coordinate y not simulated, while periodic boundaryconditions in x are imposed. Across the plasma source layer(PSL) at zPSL = −1.2 cm, electrons and different ion species(H+, H+
2 , H+3 and H− are considered) are created to set the
flow (jH+ = 2 × 10²¹ m−2 s−1) [21, 22] from the bulk plasmainto the simulation domain. Details of the model are reportedin [23]. The two fixed, non-homogeneous filter and electronsuppression magnetic fields are directed along x and y with
Gaussian profiles as shown in figure 6. The full kinetics of thecharged species is calculated using particle-in-cell. When ions(H+, H+
2 or H+3) hit the PG surface the formation of negative
ions by ionic conversion is processed according to the yieldY+(H−) for a Cs–Mo surface [24].
The axial profiles of H atoms and H2(v) molecules are keptfixed as calculated in section 2 (uniformity is considered alongthe x coordinate). On the basis of the atom flux impinging thewall �0, an additional number of H− ions are launched fromthe wall every time step according to
�H− = �0Y0(H−), (4)
where Y0(H−) = 0.05 is the value of H− yield by neutralconversion used. It corresponds to the neutral conversionfactor of atoms with a translational temperature equal toTH = 0.23 eV [24].
Different bulk collisions are implemented in the modelby using Monte Carlo techniques: null method test-particle(TPMC) for charged–neutral collisions and DSMC forcharged–charged collisions. Among the different processes,particular emphasis has been placed on those involvingH− production, namely electron dissociative attachment tovibrationally excited molecules in the ground electronic state(eDA) and H− destruction, such as electron detachmentin collisions with electrons (eD), mutual neutralization incollision with positive ions (MN) and associative detachmentin collisions with atoms (AD). Particularly important also arenon-destructive collision reactions such as elastic collisionswith H2 (EC) and charge exchange collisions with H (CX) bychanging the transport and reducing the kinetic energy of theextracted H−. These reactions have also been included in themodel.
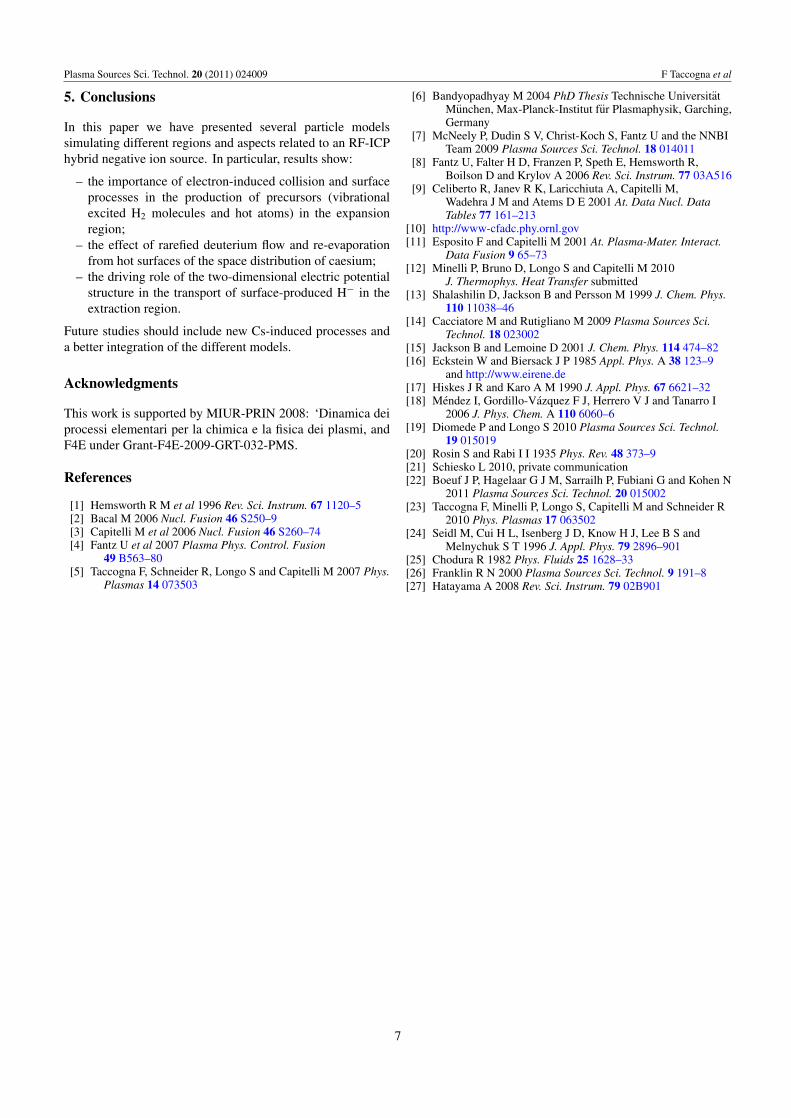
The 2D spatial distributions of electrons and negative ionsare shown in figure 7 for a PG bias voltage φPG = 10 V.At z = 1 cm from the PG the ratio of negative ion densityto electron density is nH−/ne ≈ 0.1. The electron densitydistribution shows the E×B drift deflecting the electron beamalong the x-direction. The negative ion distribution shows apeak close to the PG surface due to the surface productionmechanism. Comparing neutral and ionic conversion, the
5
Plasma Sources Sci. Technol. 20 (2011) 024009 F Taccogna et al
Figure 7. Two-dimensional distribution of (a) electrons and (b) negative ions H-density (m−3) in the extraction region.
Figure 8. Two-dimensional electric potential (V) distribution (a) in the entire simulation domain and (b) very close to PG surface.
dominant mechanism is represented by neutral conversion,97% against just 3% by ionic conversion, due to the positiveion density drop close to the PG. The density of H− ions canreach a value of 4 × 10¹⁷ m−3, one order of magnitude higherthan the bulk value.
As a consequence of the plasma density distribution, thecorresponding electric potential (figure 8(a)) shows a sheathdrop �φz = (φplasma − φPG) in the direction normal to thegrid starting 0.7 cm from the PG. This is necessary to ensure azero total net current collected on the PG. The most interestingfeatures are:
– penetration of the EG field into the source region forminga meniscus shape potential distribution: the accelerationregion between zPG1 and zEG affects the extraction sourceregion;
– an electric potential drop, �φx , between the centre of theorifice and the PG surface;
– an electric potential maximum at z = −0.6 cm typical ofa magnetized [25], electronegative [26] sheath.
– a potential well, �φwell, attached to the PG surface(figure 8(b)) as a consequence of the unbalanced flow of
H− from the PG surface not compensated for by counter-streaming positive ions. This potential barrier (alreadyobserved in a different 2D model [27]) in front of the PGsurface reflects back the majority of surface-produced H−
to the wall (74%) and only 22% succeed in crossing theextraction aperture. For this reason, the population ofH− ions extracted is still dominated by volume-producednegative ions: 64% against 36% of surface-produced.However, the surface contribution from the y-directionand some other possible volume mechanisms inducedby the presence of Cs (decreasing of plasma potential,direct H− ion formation by dissociative attachment toCsH molecules) and surface-related mechanisms inducedby the presence of Cs, such as near-wall mechanisms(vibrational excitation via H+
3 surface neutralization andvia recombinative desorption of H atoms), are missingin the present model. This may explain the relativelylow value of the extracted H− current density computed,jH− = 80 A m−2, compared with experimental valueslarger than 140 A m−2 measured for a well-conditionedion source.
6
Plasma Sources Sci. Technol. 20 (2011) 024009 F Taccogna et al
5. Conclusions
In this paper we have presented several particle modelssimulating different regions and aspects related to an RF-ICPhybrid negative ion source. In particular, results show:
– the importance of electron-induced collision and surfaceprocesses in the production of precursors (vibrationalexcited H2 molecules and hot atoms) in the expansionregion;
– the effect of rarefied deuterium flow and re-evaporationfrom hot surfaces of the space distribution of caesium;
– the driving role of the two-dimensional electric potentialstructure in the transport of surface-produced H− in theextraction region.
Future studies should include new Cs-induced processes anda better integration of the different models.
Acknowledgments
This work is supported by MIUR-PRIN 2008: ‘Dinamica deiprocessi elementari per la chimica e la fisica dei plasmi, andF4E under Grant-F4E-2009-GRT-032-PMS.
References
[1] Hemsworth R M et al 1996 Rev. Sci. Instrum. 67 1120–5[2] Bacal M 2006 Nucl. Fusion 46 S250–9[3] Capitelli M et al 2006 Nucl. Fusion 46 S260–74[4] Fantz U et al 2007 Plasma Phys. Control. Fusion
49 B563–80[5] Taccogna F, Schneider R, Longo S and Capitelli M 2007 Phys.
Plasmas 14 073503
[6] Bandyopadhyay M 2004 PhD Thesis Technische UniversitatMunchen, Max-Planck-Institut fur Plasmaphysik, Garching,Germany
[7] McNeely P, Dudin S V, Christ-Koch S, Fantz U and the NNBITeam 2009 Plasma Sources Sci. Technol. 18 014011
[8] Fantz U, Falter H D, Franzen P, Speth E, Hemsworth R,Boilson D and Krylov A 2006 Rev. Sci. Instrum. 77 03A516
[9] Celiberto R, Janev R K, Laricchiuta A, Capitelli M,Wadehra J M and Atems D E 2001 At. Data Nucl. DataTables 77 161–213
[10] http://www-cfadc.phy.ornl.gov[11] Esposito F and Capitelli M 2001 At. Plasma-Mater. Interact.
Data Fusion 9 65–73[12] Minelli P, Bruno D, Longo S and Capitelli M 2010
J. Thermophys. Heat Transfer submitted[13] Shalashilin D, Jackson B and Persson M 1999 J. Chem. Phys.
110 11038–46[14] Cacciatore M and Rutigliano M 2009 Plasma Sources Sci.
Technol. 18 023002[15] Jackson B and Lemoine D 2001 J. Chem. Phys. 114 474–82[16] Eckstein W and Biersack J P 1985 Appl. Phys. A 38 123–9
and http://www.eirene.de[17] Hiskes J R and Karo A M 1990 J. Appl. Phys. 67 6621–32[18] Mendez I, Gordillo-Vazquez F J, Herrero V J and Tanarro I
2006 J. Phys. Chem. A 110 6060–6[19] Diomede P and Longo S 2010 Plasma Sources Sci. Technol.
19 015019[20] Rosin S and Rabi I I 1935 Phys. Rev. 48 373–9[21] Schiesko L 2010, private communication[22] Boeuf J P, Hagelaar G J M, Sarrailh P, Fubiani G and Kohen N
2011 Plasma Sources Sci. Technol. 20 015002[23] Taccogna F, Minelli P, Longo S, Capitelli M and Schneider R
2010 Phys. Plasmas 17 063502[24] Seidl M, Cui H L, Isenberg J D, Know H J, Lee B S and
Melnychuk S T 1996 J. Appl. Phys. 79 2896–901[25] Chodura R 1982 Phys. Fluids 25 1628–33[26] Franklin R N 2000 Plasma Sources Sci. Technol. 9 191–8[27] Hatayama A 2008 Rev. Sci. Instrum. 79 02B901
7
Top Related
Copyright © 2022 FDOKUMEN

