


Bahasa
Halaman
Hukum


D:\oldD\MY_STUDY\MY_DISSERPROPERSAL\DISSERTATIONFULL\CompleteProposal\TharaAudit04Times_Wee\01_cover-eng-res-new.docx
OPINION MINING FOR ONLINE
TEACHING EVALUATION
Somjin Phiakoksong
A Thesis Submitted in Partial Fulfillment of the Requirements for the
Degree of Doctor of Information Science in Information Technology
Suranaree University of Technology
Academic Year 2015

D:\oldD\MY_STUDY\MY_DISSERPROPERSAL\DISSERTATIONFULL\CompleteProposal\TharaAudit04Times_Wee\02_cover-thai-res1.docx
การท าเหมองความคดเหนส าหรบการประเมนการสอนออนไลน
นายสมจน เปยโคกสง
วทยานพนธนเปนสวนหนงของการศกษาตามหลกสตรปรญญาวทยาการสารสนเทศดษฎบณฑต สาขาวชาเทคโนโลยสารสนเทศ มหาวทยาลยเทคโนโลยสรนาร
ปการศกษา 2558


สมจน เปยโคกสง : การท าเหมองความคดเหนส าหรบการประเมนการสอนออนไลน (OPINION MINING FOR ONLINE TEACHING EVALUATION) อาจารยทปรกษา :
ผชวยศาสตราจารย ดร.ธรา องสกล, 210 หนา.
การวจย นมว ตถประสงคเพอ 1) บง ชองคประกอบของลกษณะการสอนทด และ
2) ออกแบบและพฒนากรอบการท างานทมประสทธภาพเพอการวเคราะหความคดเหนของนกศกษา
จากการประเมนการสอนออนไลนจ าแนกตามองคประกอบของลกษณะการสอนทด โดยใชเทคนค
ทางสถตและเครองจกรเรยนร ในสวนของการระบถงองคประกอบลกษณะการสอนทด
ใชแบบสอบถามในการส ารวจขอมลจากคณาจารยประจ า 97 คนและนกศกษามหาวทยาลย
เทคโนโลยสรนาร 474 คน วเคราะหขอมลดวยโมเดลสมการเชงโครงสราง (SEM) ในการออกแบบ
และพฒนากรอบการท างานทมประสทธภาพเพอการวเคราะหขอความความคดเหนของนกศกษา
ขอมลทน ามาทดลอง ไดแก ขอความความคดเหนของนกศกษาจ านวน 40,000 ขอความจากระบบ
ประเมนการสอนออนไลน ซงไดมาโดยวธการสมอยางงาย
ผลการวจยพบวา
1. องคประกอบของลกษณะการสอนทด ประกอบดวย 6 องคประกอบและคาน าหนกของ
แตละองคประกอบ ดงน 1) องคความร (2.55) 2) การเตรยมการสอน (2.19) 3) เทคนคและกลวธ
การสอน (4.57) 4) การวดและประเมนผล (2.01) 5) สอและอปกรณการสอน (1.75) และ
6) บคลกลกษณะ (3.90) โดยมคาสถตไคสแควรเทากบ 27.77 องศาอสระ 31 ความนาจะเปน 0.63
คาดชนระดบความกลมกลน 0.99 คาดชนรากก าลงสองเฉลย 0.019 คาดงกลาว แสดงวา
องคประกอบทน าเสนอสอดคลองตามขอมลเชงประจกษทรวบรวมจากอาจารยและนกศกษาไดเปน
อยางด
2. กรอบการท างานเพอการวเคราะหขอความความคดเหน ประกอบดวย 3 โมดลหลก ไดแก
1) เตรยมขอมลภาษาเบองตน 2) วเคราะหความคดเหน และ 3) การรวมกลมและการท าใหมองเหน
ซงระบบสามารถสกดสารสนเทศทสอดคลองตามองคประกอบของลกษณะการสอนทดและ
สามารถประมาณคาประสทธภาพการสอนของอาจารยได โดยเทคนคทใหประสทธภาพสงสด คอ
การใชโครงขายประสาทเทยมหลายชนส าหรบการวเคราะหกระถดถอย มระดบความสมพนธ
เชงล าดบโดยรวมในระดบสงท 0.689 อยางมนยส าคททางสถตท 0.01 พจารณาตามกลมจ านวน

II
D:\JinFolder\MY_DISSERPROPERSAL\DISSERTATIONFULL\CompleteProposal\TharaAudit04Times_Wee\04_abstract-thai-16-3.docx
ความคดเหนตออาจารย พบวา กลมทมความคดเหนมากกวาหรอเทากบ 107 ขอความตออาจารย ม
ระดบความสมพนธเชงล าดบทสงถง 0.777 เมอเพมกลมทมความคดเหนมากกวาหรอเทากบ 39
ขอความกลมมากกวาหรอเทากบ 15 ขอความ กลมมากกวาหรอเทากบ 5 ขอความ และ มากกวาหรอ
เทากบ 1 ขอความ มระดบความสมพนธเชงล าดบ 0.722, 0.656, 0.690 และ 0.689 อยางมนยส าคท
ทางสถตท 0.01 ตามล าดบ
สาขาวชาเทคโนโลยสารสนเทศ ลายมอชอนกศกษา ปการศกษา 2558 ลายมอชออาจารยทปรกษา

SOMJIN PHIAKOKSONG : OPINION MINING FOR ONLINE TEACHING
EVALUATION. THESIS ADVISOR : ASST. PROF. THARA ANGSKUN,
Ph.D., 210 PP.
GOOD TEACHING CHARACTERISTICS/STUDENT FEEDBACK/
OPINION MINING
The purposes of this research were: 1) to identify the component of good
teaching characteristics, and 2) design and develop an efficient framework for analysis
the student feedback from online teaching evaluation according to the component of
good teaching characteristics, by utilizing the statistical technique and machine
learning technique. In section of identifying the component of good teaching
characteristics. The questionnaire was used to survey data from 97 faculty and 474
students of Suranaree University of Technology (SUT). These data were analyzed with
the Structural Equation Model (SEM) approach. In order to design and develop
an efficient framework for analysis student feedback. The experimental dataset is
40,000 student feedbacks from online teaching evaluation system which obtained by
simple random sampling technique.
The research findings are as follows:
1. The component of good teaching characteristics consists of 6 components
with their factor loading as follows: 1) Knowledge (2.55) 2) Teaching preparation
(2.19) 3) Teaching techniques and strategies (4.57) 4) Measurement and evaluation
(2.01) 5) Teaching media and materials (1.75) and 6) Personality (3.90). It had a 27.77
of Chi-square where df = 31, p-value equal to 0.63, GFI was 0.99, and SRMR was

IV
0.019. These statistical values indicated that the purpose components were corresponding
with the empirical data that gather from SUT faculty and students.
2. A framework for analysis student feedbacks consists of 3 main modules
including: 1) Linguistics Pre-processing 2) Opinion Analysis and 3) Aggregation and
Visualization. This proposed framework can extracted information that corresponds
with the component of good teaching characteristics, and also estimated their teaching
performance score. The technique that provides highest performance was the Multi-
Layer Perceptron for Regression. The overall performance was 0.689 of Spearman-
Rho order ranking correlation with statistical significant at 0.01. Considering in
the number of feedbacks per each faculty, the group which have feedback more than
107 per faculty obtained high level of ranking correlation (r = 0.777). Cumulative with
the other groups (≥ 39 feedbacks, ≥ 15 feedbacks, ≥ 5 feedbacks, and ≥ 1 feedback),
they obtained the ranking correlation equal to 0.722, 0.656, 0.690 and 0.689 with
statistical significant at 0.01, respectively.
School of Information Technology Student’s Signature
Academic Year 2015 Advisor’s Signature

ACKNOWLEDGEMENTS
This dissertation could not have been completed without the guidance and
support of the kind people around me.
First, I would like to express my sincere gratitude to my research supervisors,
Asst. Prof. Dr. Thara Angskun and Asst. Prof. Dr. Jitimon Angskun, for their
excellent guidance, enthusiastic encouragement and immense knowledge.
Their guidance helps me in all the time of research and writing of this dissertation.
Without them, I would not have been able to complete my dissertation.
My grateful thanks to the committees for my dissertation, who are
Assoc. Prof. Dr. Weerapong Polnigongit, Assoc. Prof. Dr. Kitsana Waiyamai, Assoc.
Prof. Dr. Kittisak Kerdprasop, and Asst. Prof. Dr. Suphakit Niwattanakul for his
insightful comments and helping me keep things in perspective.
I would like to express my very great appreciation to Asst. Prof. Dr.
Neunghathai Khopolklang, Dr. Nisachol Chamnongsri, Dr. Panida Subsorn,
Miss Doungjai Kanjanasin, and Miss Suparak Mernkrathoke, which dedication their
time for given the valuable suggestion, which affect to this dissertation is
progression.
Finally, I most gratefully acknowledge my parents. They are always
supporting me and cheering me up with their best wishes.
Somjin Phiakoksong

CONTENTS
Page
ABSTRACT IN THAI ..................................................................................................... I
ABSTRACT IN ENGLISH........................................................................................... III
ACKNOWLEDGEMENTS ........................................................................................... V
CONTENTS .................................................................................................................. VI
LIST OF TABLES ......................................................................................................... X
LIST OF FIGURES...................................................................................................... XII
CHAPTER
1 INTRODUCTION .............................................................................................. 1
1.1 Statement and significance of problem ......................................................... 1
1.2 The objectives of study ................................................................................. 6
1.3 Research question .......................................................................................... 6
1.4 Hypothesis ..................................................................................................... 6
1.5 Expected results ............................................................................................ 7
1.6 Scope of study .............................................................................................. 7
1.7 Definitions ..................................................................................................... 7
2 LITERATURE REVIEW .................................................................................. 9
2.1 Teaching factors and characteristics of good teaching ............................... 10
2.1.1 Teaching and learning process ........................................................... 11
2.1.2 Literature review of teaching factors and characteristics
of good teaching ................................................................................ 14
VII
CONTENTS (Continued)
Page
2.1.3 Structural Equation Modeling ............................................................ 16
2.2 Thai language processing and application .................................................. 20
2.2.1 Fundamental of natural language processing ..................................... 21 2.2.2 Thai language processing 18
2.2.2 Thai language processing ................................................................... 23 2.2.2 Thai language processing 18
2.3 Linguistic resource and dictionary ............................................................. 37
2.3.1 Lexicon and Thai dictionary .............................................................. 37
2.3.2 String similarity approaches .............................................................. 41
2.3.3 Association measurement .................................................................. 47
2.4 Opinion mining .......................................................................................... 48
2.4.1 Overview of opinion mining ............................................................. 48
2.4.2 Machine learning and statistical approaches for opinion mining....... 54
2.5 Related work ............................................................................................... 82
2.5.1 Opinion mining in non-educational field .......................................... 82
2.5.2 Opinion mining in educational field .................................................. 85
2.5.3 Opinion mining with Thai language .................................................. 90
2.6 Summary ..................................................................................................... 94
3 RESEARCH METHODOLOGY ................................................................... 96
3.1 Methodology .............................................................................................. 96
3.1.1 Studying related theory and existing work ........................................ 97
3.1.2 Framework modeling and development ........................................... 101
VIII
CONTENTS (Continued)
Page
3.1.3 Evaluation of quality and performance of system ............................ 129 3.2 Population and samples 103
3.2 Population and samples ............................................................................ 134
3.3 Research instruments ................................................................................ 135
3.3.1 Design and develop instruments ..................................................... 135
3.3.2 Instruments for evaluation ............................................................... 136
3.4 Data collection and analysis ..................................................................... 137
4 EXPERIMENTAL RESULTS AND DISCUSSIONS ................................ 139
4.1 The experiment and result of good teaching characteristics model ......... 139
4.1.1 Evaluation of good teaching characteristics model .......................... 140
4.2 The experiment and result of the proposed framework ........................... 146
4.2.1 Evaluation of sub-module performance ........................................... 147
4.2.2 Evaluation of overall performance ................................................... 156
4.3 Discussions ............................................................................................... 163
4.3.1 The results of the hypothesis testing ................................................ 163
4.3.2 The discussion of imperfect results .................................................. 165
5 CONCLUSIONS AND RESEARCH RECOMMENDATIONS ............... 168
5.1 Summary of the research findings ............................................................. 168
5.2 The limitation of the study ........................................................................ 171
5.3 The application of the study ...................................................................... 173
5.4 Recommendation for future study ............................................................. 173

IX
CONTENTS (Continued)
Page
REFERENCE ............................................................................................................ 175
APPENDICES ........................................................................................................... 195
CURRICULUM VITAE ........................................................................................... 210

LIST OF TABLES
Table Page
2.1 Summary of previous studies on the characteristics of good teaching ........... 14
2.2 Characteristics and properties of Thai language ............................................ 24
2.3 NAiST corpus tagset ...................................................................................... 30
2.4 ORCHID corpus tagset .................................................................................. 33
2.5 An excerpt of SentiWordNet files structure .................................................... 39
2.6 A neuron’s common activation function ......................................................... 75
2.7 Selected previous studies on OM (Non-Educational field)............................. 83
2.8 Previous studies on OM (Educational field) ................................................... 85
2.9 Comparison of existing work of OM in educational field ............................. 88
3.1 Demonstration of majority voting on semantic similarity ............................ 119
3.2 Statistical indicators of SEM model fitting .................................................. 130
3.3 Confusion matrix of classification ............................................................... 131
3.4 Strength of correlation value ........................................................................ 134
4.1 Identifying and selecting good teaching characteristics items ..................... 141
4.2 Core components and principal factors of good teaching
characteristics model .................................................................................... 143
4.3 Confusion matrix of feature and opinion extraction .................................... 150
4.4 Evaluation of extracting feature and opinion words .................................... 150
4.5 Confusion matrix of polarity identification .................................................. 152

XI
LIST OF TABLES (Continued)
Table Page
4.6 Evaluation of polarity identification ............................................................. 153
4.7 Performance of good teaching characteristic estimator ................................ 156
4.8 Spearman’s rho rank order correlation of overall performance .................... 158
4.9 The optimal weight parameter of MLPR model ........................................... 160

LIST OF FIGURES
Figure Page
1.1 Closing the loop between teaching and student’s feedback .............................. 3
2.1 Relationship between Measurement model and Path model ........................... 18
2.2 Level of linguistics analysis ............................................................................ 22
2.3 WordNet interface (Synonymy representation) ............................................... 38
2.4 LEXiTRON dictionary interface ..................................................................... 41
2.5 Overview of opinion mining ............................................................................ 49
2.6 An example of kNN classification .................................................................. 61
2.7 Supporting hyperplanes and margin of SVM ................................................. 68
2.8 Traditional SVM and SVM Regression .......................................................... 72
2.9 Biological and Artificial Neural Network model ........................................... 74
2.10 Linear regression line ..................................................................................... 81
3.1 Conceptual framework of research methodology ........................................... 97
3.2 The architecture of the proposed system ...................................................... 105
3.3 The process of the feature/opinion extraction module ................................. 107
3.4 Generating of n-gram data records ............................................................... 109
3.5 A transaction file with classes tagging ......................................................... 110
3.6 N-gram majority voting process ................................................................... 112
3.7 String matching with Lexicon lookup .......................................................... 113

XIII
LIST OF FIGURES (Continued)
Figure Page
3.8 Process of the polarity identification module ............................................... 114
3.9 Polarity identification training dataset ......................................................... 115
3.10 The process of the opinion phrase scoring module ..................................... 117
3.11 Opinion score from SentiWordNet .............................................................. 121
3.12 Estimation of good teaching characteristic level ......................................... 122
3.13 Represent of knowledge storing of an individual teacher ........................... 125
3.14 Good teaching characteristics in faculty level ............................................. 126
3.15 Good teaching characteristics in department level ...................................... 127
3.16 Good teaching characteristics in individual levels ...................................... 128
3.17 Comparison of good teaching characteristics in individual levels .............. 128
4.1 The structure of good teaching characteristics ............................................ 146
4.2 Performance measurement of feature and opinion classifiers ..................... 149
4.3 The distribution of student’s feedback data ................................................. 157
4.4 Spearman-rho rank correlation coefficient on cumulative five groups ....... 159
4.5 The Multi-Layer Perception for Regression model ..................................... 159

CHAPTER 1
INTRODUCTION
1.1 Statement and Significance of Problem
Over the centuries, education plays a vital role as the foundation of society.
The progressive society and wealthy economy are
A result of the good citizen which has the high quality of education. Education
has ability to change and advance the society, contributing the growth of national
income and individual learning (Varghes, 2007). In international communities there
are established international organizations that promote the education as one of
principle task to developed country e.g., United Nations Educational, Scientific, and
Cultural Organization (UNESCO), Organization for Economic Co-operation and
Development (OECD), etc.
Every countries concentrate on the importance of education to be
an infrastructure for developing the country. Governments are responsible for
enforcing the educational policy and established the educational institute from primary
education to higher education. Educational institutes become the main source to
provide education, accumulate and transfer knowledge, stimulate people to generate
new ideas (Varghes, 2007), and cultivate ethics to people becoming the good citizen.
Therefore, the quality of educational institute is an importance issue that should bring
up to standard and acceptable by national and international people.

2
Several public and private educational institutes were established and operated
complying with the government’s education policy. All educational levels, especially,
higher education is under the social pressure. The demand of educational stakeholders
(e.g, students, parents, employees and public) is growing. They expect the educational
institutes to provide the quality of teaching and learning process up to the standard and
correspond with economic situation (Jallade, Radi and Cuenin, 2001; Hogg, R. and
Hogg, M., 1995).
To meet these expectations, several higher education institutes are concerned
to improve their education quality. In early 1970s, a unit called “Faculty development”
is first established in USA. This unit focuses on developing teaching skills. The unit
specializes in improving the teaching effectiveness of faculty members (Isil Kabakci
and Odabasi, 2008). The American Association of Higher Education (AAHE)
identifies the goal of Faculty development as follows; 1) providing teachers with
training opportunities to achieve maximum effectiveness; 2) ensuring that employees
develop their skills and capabilities to be able to work efficiently and respond rapidly
to changes within their organizations; 3) improving performance of their present
duties; 4) ensuring that the best use is made of the natural abilities and individual
skills of all employees for the benefit of the organization and their career (Bokonjic,
Ljuca and Steiner, 2009). To achieve these faculty development’s goals, useful
resource in regard to the quality of teaching is needed.
To develop quality of teaching, feedbacks from the educational stakeholder are
a valuable resource that educational institute should not be ignored (Kannan and
Bielikova, 2010). Several educational institutes usually use the questionnaire to survey
information from stakeholders. Especially, surveying information from students who

3
are direct stakeholder that affected by the different quality of educational institutes.
In correspondence with Coyle and Powney (1990, quote in Powney and Hall, 1998),
the student’s feedback is an important component that occurs in a loop linking
between teachings and learning as shown in Figure 1.1.
Figure 1.1 Closing the loop between teaching and student’s feedback
(Coyle and Powney, 1990, quote in Powney and Hall, 1998)
In recent years, to gather information from stakeholder, a popular tool called
“Student Evaluations of Teaching (SET)” has been used in educational institute,
especially, universities and colleges. SET is used to survey the opinion about
the quality of classroom’s teaching and learning processes from students who have
enrolled in various subjects (Moss and Hendry, 2002). These educational institutes use
the information of this evaluation to monitor quality of teaching and to help teachers
improve their teaching effectiveness. The administrator also use these SET results as
fundamental information for planning their administration policy such as promoting

4
instructors, selecting teachers and assistant teachers for teaching awards, assigning
teachers to courses, hiring new instructors, etc. (Badur and Mardikyan, 2011).
Generally, a SET is consists of a series of question items which presents
in three basic types: 1) Close-ended question: it is a question form which fixed
the choices of answer including: Multiple Choice Question (MCQ) and Rating Scale
responses, 2) Open-ended question: it is a question form that allow students to
response in free format of text paragraphs and 3) Combination of two mentioned types
of question. SET are answered by students anonymously at the end of the semester
without the faculty member’s presence (Alhija and Fresko, 2009; Sproule, 2000).
Thanks to the advent of computer network technologies. The traditional paper-
based surveying of SET is transformed into electronic-based surveying (also known as
“Teaching Evaluation System”) (Moss and Hendry, 2002). However, these electronic-
based questionnaires still keep the traditional format similar to paper-based
questionnaires. Most of the electronic-based questionnaire are appeared in the third
forms which combining of close-ended and open-ended question.
Regarding close-ended question, Jordan (2011) described the characteristics of
close-ended question as follows; 1) the answer of student seems to provide higher
positive rating, 2) the data is excellent quantitative, but limit in details. It is not much
helpful for institutional level evaluation apart from ranking, 3) the questions are vetted
by administrators and faculty groups that influence what can and cannot be asked, and
4) these close-ended question are only created to present some aspects that
the administrator or committees had paid attention. While, the open-ended question is
the most important part which can give a clearer picture of what the students really
feel or think. It is able to provide insight on how a course was conducted, what went

5
well, and what could be improved. In addition, these open-ended question can reveal
other perspectives which are not take into account by the close-ended question (Abd-
Elrahman, Andreu and Abbott, 2010; Jordan, 2011).
As mentioned above, the characteristic of answer in closed-ended question is
the structured data that provide the quantitative data which is easy to analyze and
compare by statistical calculations. While the answer of open-ended question is
student’s opinion or attitude about teaching process which represented in free format
of text paragraph.
Although, the student opinion is useful, unfortunately these student’s opinions
are usually ignored to take into analysis. Because of the characteristics of the open-end
question’s answer are unstructured data which is difficult to process with the simple
statistical process (Reja, Manfreda, Hlebec and Vehovar, 2003; Jordan, 2011).
Moreover, free format and vast amount of these data seem to be a problem for
the administrators and faculties to spend time to analyze these unstructured data of
student’s opinion.
To overcome this problem, a process called “Opinion Mining (OM)” which
gets the great interesting that can extract useful information from vast amount of
stakeholder feedbacks. This process provides the benefit for human in aspects of
decreasing the analyzing time and human's burden. Technically, this process is a cross-
discipline field between Information Retrieval and Computational Linguistics
(Bhuiyan, Xu and Josang, 2009). It aims on the automatic process that can analyze
the opinion or attitude of an individual from text sentences, which represented
in natural language. To the best of our knowledge, OM is often implemented in
the business field. There are only few studies which applied OM in the education field.
6
This study aims to design and develop an efficient opinion mining framework
to analyze Thai student feedback. The final results of this framework are knowledge
that uses to indicate the strengths and weakness of individual teaching that correspond
with good teaching characteristics.
1.2 The Objectives of Study
The objectives of this dissertation are as follows:
1. To identify the component of good teaching characteristics that
corresponds with Thai educational context.
2. To design and develop an efficient opinion mining framework for
analyzing student feedback from online teaching evaluation corresponds with good
teaching characteristics.
1.3 Research question
1. What are the components of good teaching characteristic in Thai
educational context?
2. What is the performance of opinion mining framework that can analyze
Thai student feedbacks?
1.4 Hypothesis
1. The component of good teaching characteristics has the statistical indicator
results higher than the standardized thresholds.
7
2. The proposed opinion mining framework can compute the entire opinion
score from student feedback correctly with correlation greater than or equal 70% of
ranking correlation.
1.5 Expected Results
1. Obtain the components of good teaching characteristics which correspond
with Thai educational context.
2. Obtain an efficient opinion mining framework that can indicate the strength
and weakness in teaching from Thai student feedback.
1.6 Scope of Study
This study aims to analyze Thai student’s feedback sentences which respond in
online teaching evaluation system of Suranaree University of Technology (SUT).
1.7 Definitions
1. Online teaching evaluation system:
It is an electronic system for student to evaluate teaching process.
This system is used to survey information about the quality of teaching from
the students of Suranaree University of Technology.
2. Good teaching characteristics:
List of teaching characteristics that the teacher and students of Suranaree
University of Technology have identified that be the good characteristic of teaching.
This list has been statistically verified that the characteristics are good teaching
characteristics which correspond with Thai educational context.

8
3. Opinion sentence:
The feedback sentences that obtain from open-end questions answered
in online teaching evaluation system. These sentences express the opinion or attitude
of Thai students on the efficiency of teaching of their teacher in each course.
4. Opinion mining:
A field of data mining that combined the machine learning technique and
natural language processing to analyze vast amounts of unstructured text data.
The result of this process is the knowledge that corresponds with objective of
the study.
5. Feature words:
The word that was extracted from student feedback sentence. These words
identify the aspect of teaching characteristic of their teacher which corresponds with
the good teaching characteristics.
6. Opinion words:
The word that was extracted from student feedback sentence. These words
imply the attitude of student in teaching of their teacher in regarding to the good
teaching characteristics.
7. Good teaching knowledge:
The opinion scores and the extracted phrases about teaching characteristics
from opinion mining framework. The teacher can use these scores to indicate strength
and weakness in their teaching performance that correspond with good teaching
characteristics.

CHAPTER 2
LITERATURE REVIEW
To develop an efficient opinion mining framework for extraction knowledge
from Thai student’s feedbacks. The six major sections are studied and summarize.
These sections consisting of, 1) Teaching factors and characteristics of good teaching,
this section described about theoretical of teaching and previous studies that related
with the characteristics or components of good teacher, 2) Thai language processing
and application, this section contains the characteristics of Thai language and list of
recently application that handle with Thai language, 3) Linguistic resources, described
about the available lexicon which can utilize in Thai language mining process, and
4) Opinion mining is a section that describes general process of opinion mining, and
also presented some efficient machine learning and statistical technique that used in
this work. The last two sections are the related work and summary of overall reviewed.
These six major sections are described as follows:
2.1 Teaching factors and characteristics of good teaching
2.1.1 Teaching and learning process
2.1.2 Literature review of teaching factors and characteristics of good
teaching
2.1.3 Structural Equation Modeling
2.2 Thai language processing and application
2.2.1 Fundamental of Natural Language Processing

10
2.2.2 Thai language and processing
1) Characteristics of Thai language
2) Applications for Thai language processing
- Word segmentation application
- Part-Of-Speech tagging application
2.3 Linguistic resources
2.3.1 Lexicon and Thai dictionary
1) WordNet and SentiWordNet
2) LEXiTRON
2.3.2 String similarity approaches
1) Text similarity
2) Semantics similarity
2.4 Opinion Mining
2.4.1 Overview of Opinion Mining
2.4.2 Machine Learning and Statistical approaches for Opinion Mining
2.5 Related work
2.5.1 Opinion Mining in Non-Educational field
2.5.2 Opinion Mining in Education field
2.5.3 Opinion Mining with Thai language
2.6 Summary
2.1 Teaching factors and characteristics of good teaching
Teaching is an important part of education process that aims to change
the student behavior follow the learning objectives. Lacking of improving teaching

11
process would affect the quality of education. Teaching is a process that depends on
several factors such as content, teaching activity, teaching experience of teacher in
order to encourage the student to learn, etc. In order to understand the good teaching
characteristics, there is some background knowledge that related with teaching process
as described below:
2.1.1 Teaching and learning process
Over the last two decade, there are several definitions about teaching and
learning defined by the educationists and philosophers.
Hills (1982 quote in Jaitiang, 2003) defined that “Teaching is process that
provides the education to the students which arise on the interaction between teacher
and their students”.
Moore (1992 quote in Jaitiang, 2003) defined that “Teaching is behavior
of any person that attempts to help and support other persons to enhance themselves”.
Boonchuvong (1990 quote in Jaitiang, 2003) defined meaning of teaching
is “The organization of experiments that suitable for the students to learn or change
their behavior in better aspect”.
Jaitiang (2003) defined that “Teaching is interaction process between
teacher and learners in order to change their learners’ behavior that correspond with
the learning objective”.
Good (1959 quote in Nakhon Ratchasima Teacher College, 1993) defined
the definition of teaching in two aspects that are 1) “Teaching” is providing of
education to children in the school and 2) “Teaching” is preparing the activities,
materials and giving the consulting about learning process to children.

12
Gagne et al. (1992 quote in Srisai, 2003) state that “Teaching is a group
of events or situation that facilitates the learners to achieve the learning objectives”.
As mentioned above, the definition of “Teaching” can be defined as
“The suitable process that provide by teacher to support or facilitate their students in
order to enhance themselves”.
Normally, “Teaching and learning” is process that the learners had
learning together with any activity and under the suggestion of teacher. Learners
would receive the experience that establishes knowledge, understanding, ability, skills
and good attitudes to enhance themselves (Nakhon Ratchasima Teacher College,
1993). In teaching and learning process, there are several things that teacher should
concentrate as follows:
1) Teaching: Effort of any person that would manage the learning activity
to make a person or group of persons obtains the learning process.
2) Purpose or Objective of teaching: the goal of learning process that
make any learner enhance themselves in the aspect of human body, emotional, social
and intelligence. This purpose would help the learner have ability to solve problem in
real life.
3) Principle to teaching methodology: Knowledge and technique to teach
the learner to learn by doing, experiment, research, and problem solving by
themselves.
4) Important components that make teaching successful: They consist of
Teacher (or Faculty), Contents, Learner and Understanding of the teacher about
learning process.

13
- Teacher (or Faculty): Ability and personality of teacher that
influences to the learning of learner. Teacher should enhance themselves personality to
support the learning of learner. Selecting of teaching techniques and adopt of their
teaching process with various methods to make attention to learner.
- Contents: the suitable of contents for learning process is an important
component. Systematic of content management would support the learner to learn
faster and easier. Teacher should concern about the different structure and nature of
contents in each group of experiments that provide to the student.
- Learner: the quality of learner is the outcome of teaching. Each
learner has difference of ability to learn. Providing the educational to different
persons, teacher should prepare the teaching process for individual and a group of
persons.
- Understanding of the teacher about learning process: Learning
process is the process which makes change on student’s behavior. In aspect of
teaching, learning is the ability of learner to learn and adopt any experience to solve
the problem. Learning is a direct affect from any action of learner in the class, while,
the teacher is a facilitator to encourage the educational atmosphere in the class.
5) Having evaluation process: Teaching should have monitoring
the progress of learner. Evaluation process helps the teacher to assess the successful of
teaching and learning process.
As mentioned above, the quality of teaching and learning process is
involved with the teacher. Teacher is the major component that influences and
linkages between the learning experiment and student. The teacher who has
the professional skill of teaching will help students to achieve their objective learning.

14
2.1.2 Literature review of Teaching factors and characteristics of good
teaching
“Teacher” (or “Faculty” in higher educational context) is an important
component in teaching and learning process. Therefore, the basic knowledge on the
teaching and learning process is the basic requirement of every teacher. Knowing
about the characteristic and factor of good teaching would be guideline for the teacher
to achieve the high quality of teaching in practice.
Educational researchers had studies and proposed the characteristic and
factor of good teaching under the difference context of educational institutes.
Summary of previous studies on good teaching characteristics are shown in Table 2.1.
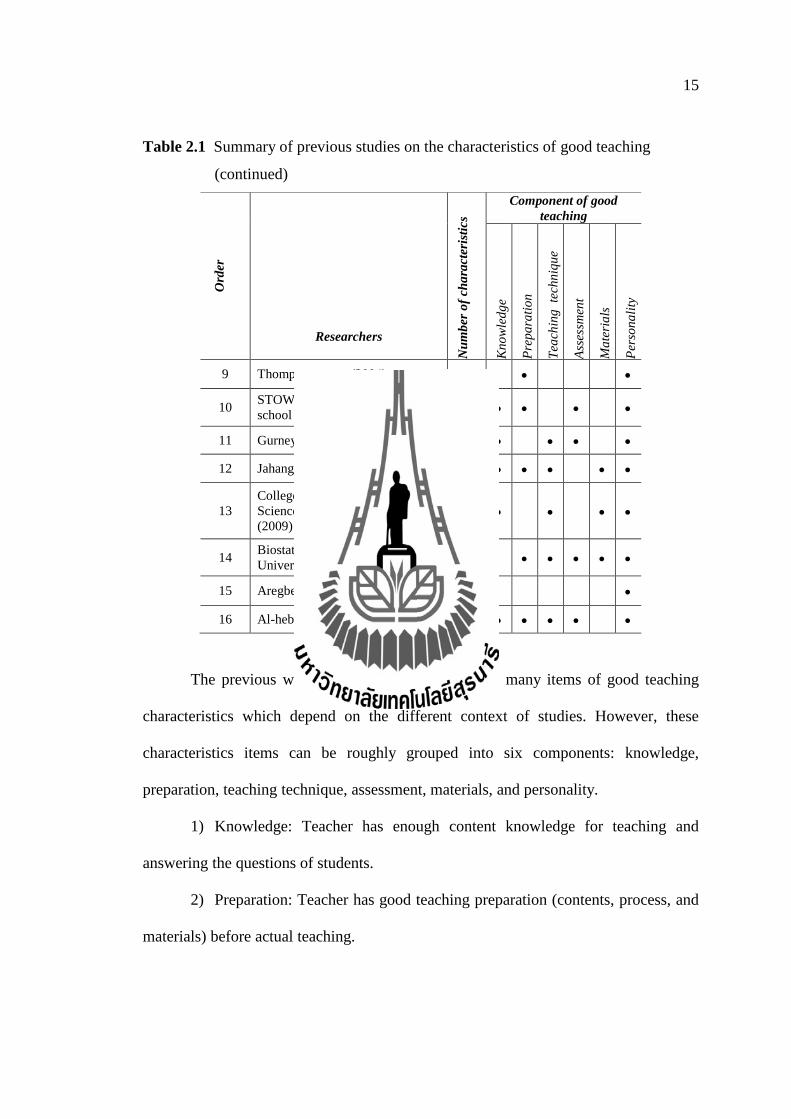
Table 2.1 Summary of previous studies on the characteristics of good teaching
Ord
er
Nu
mb
er o
f ch
ara
cter
isti
cs
of
goo
d t
each
ing
Component of good
teaching
Researchers
Kn
ow
led
ge
Pre
pa
rati
on
Tea
chin
g
tech
niq
ue
Ass
essm
ent
Ma
teri
als
Per
son
ali
ty
1 Cooper and Foy (1967) 43
2 Eble (1971) 5
3 Sheffield (1974) 10
4 Ebro (1977) 9
5 Lewis (1982) 8
6 Landbeck (1997) 3
7 Smith (1980) 8
8 Jaitiang (2003: In Thai) 13
15
Table 2.1 Summary of previous studies on the characteristics of good teaching
(continued)
Ord
er
Nu
mb
er o
f ch
ara
cter
isti
cs
of
goo
d t
each
ing
Component of good
teaching
Researchers
Kn
ow
led
ge
Pre
pa
rati
on
Tea
chin
g
tech
niq
ue
Ass
essm
ent
Ma
teri
als
Per
son
ali
ty
9 Thompson et al., (2004) 12
10 STOW on the world primary
school (2005) 11
11 Gurney (2007) 5
12 Jahangiri and Mucciolo (2008) 21
13
College of Agricultural and Life
Sciences, University of Florida
(2009)
5
14 Biostatistics, Johns Hopkins
University (2009) 39
15 Aregbeyen (2010) 17
16 Al-hebaishi (2010) 4
The previous works have shown that there are many items of good teaching
characteristics which depend on the different context of studies. However, these
characteristics items can be roughly grouped into six components: knowledge,
preparation, teaching technique, assessment, materials, and personality.
1) Knowledge: Teacher has enough content knowledge for teaching and
answering the questions of students.
2) Preparation: Teacher has good teaching preparation (contents, process, and
materials) before actual teaching.

16
3) Teaching technique: Teacher has methods and techniques to transfer
his/her knowledge to the students and also has the ability to control his/her students in
the classroom.
4) Assessment: Teacher has fair judgment and validity of the assessment
process to indicate achievements of students.
5) Material: Teacher utilizes suitable teaching materials and has teaching
assistants to support his/her teaching process.
6) Personality: Teacher has good personal behavior and good human relations.
Additionally, most of the previous works indicated that the teaching techniques
and personality components are the most important components of good teaching
characteristics.
Knowing of good the teaching characteristics would be benefit for the teacher
in order to improve their teaching style. However, these teaching characteristics
should be adopted in appropriate manner with the educational institute context.
2.1.3 Structural Equation Modeling
Structural Equation modeling (SEM) is a research approach used in many
academic disciplines, including information systems and marketing (Jacobson et al.,
2009). SEM is a general term that describes a large number of statistical models which
are used to test and validate substantive theories with empirical data (Lei and Wu,
2007). This technique combines a measurement model (or Confirmatory Factor
Analysis (CFA)) and structural model into a simultaneous statistical test. The patterns
of relationships between these latent variables are constructed based on the study of
educational theory. SEM is a statistical method to model the relationships among
multiple predictor and criterion variables (Hoe, 2008).

17
Lei and Wu (2007) explained that SEM involves several statistical
techniques e.g., Factor analysis, Path analysis, and Regression. These statistics are
used to evaluate two models: a measurement model and a path model.
1) Measurement model: is a measuring of latent variables originated
from psychometric theories. Unobserved latent variables cannot be measured directly
but are indicated by responses to a number of observable variables (indicators).
In social sciences, latent constructs are a set of indirect observation variables (latent
variables) such as intelligence or reading ability. These variables and their
relationships are often gauged by responses to a battery of items that are designed
to tap those constructs. Responses of a study participant to those items are supposed
to reflect where the participant stands on the latent variable. Statistical techniques such
as factor analysis, exploratory or confirmatory, have been widely used to extract
the number of latent constructs underlying the observed responses and to evaluate
the adequacy of each item or variables as indicators for the latent constructs they are
supposed to measure.
2) Path model (also known as “Structural Model”): is a statistical
approach which is an extension of multiple regressions. It involves various multiple
regression models that are estimated simultaneously. This provides a more effective
and direct way of mediation modeling, indirect effects, and other complex
relationships among variables. Path analysis can be considered a special case of SEM
in which structural relations among observed (vs. latent) variables are modeled.
Structural relations are hypotheses about directional influences or causal relations of
multiple variables (e.g., how the independent variables affect dependent variables).
Hence, path analysis (and also the more generalized; SEM) is sometimes referred

18
as causal modeling. Because analyzing interrelations among variables is a major part
of SEM and these interrelations are hypothesized to generate specific observed
covariance (or correlation) patterns among the variables, SEM is also sometimes
called covariance structure analysis. The relationship between Measurement model
and Path model can be depicted as shown in Figure 2.1.
In general, every SEM analysis goes through the steps of model
specification, data collection, model estimation, model evaluation, and (possibly)
model modification. Issues pertaining to each of these steps are discussed below.
Figure 2.1 Relationship between Measurement model and Path model
1) Model Specification: a sound model is theoretical based. Theory is
based on findings in the literature, knowledge in the field, or one’s educated guesses,
from which causes and effects among variables within the theory are specified.
Models are often easily conceptualized and communicated in graphical forms. In these
graphical forms, a directional arrow () is universally used to indicate a hypothesized
Measurement model
Path model

19
causal direction. The variables to which arrows are pointing are commonly termed
endogenous variables (or dependent variables) and the variables having no arrows
pointing to them are called exogenous variables (or independent variables).
Unexplained covariance among variables is indicated by curved arrows (). Observed
variables are commonly enclosed in rectangular boxes and latent constructs are
enclosed in circular or elliptical shapes.
2) Data Characteristics: like conventional statistical techniques, score
reliability and validity should be considered in selecting measurement instruments for
the constructs of interest and sample size needs to be determined preferably based on
power considerations. The sample size required to provide unbiased parameter
estimates and accurate model fit information for SEM models depends on model
characteristics (e.g., model size) as well as score characteristics of measured variables
(e.g., score scale and distribution).
3) Model Estimation: a properly specified structural Equation model
often has some fixed parameters and some free parameters to be estimated from
the data. As an illustration in Figure 2.1, it shows the diagram of a conceptual model
which consist of parameter and . That is, when the parameter value of a visible path
is fixed to a constant, the parameter is not estimated from the data. Free parameters
are estimated through iterative procedures to minimize a certain discrepancy or
fit function between the observed covariance matrix (data) and the model-implied
covariance matrix (model). Definitions of the discrepancy function depend on
specific methods used to estimate the model parameters. A commonly used
discrepancy function is derived from the maximum likelihood method.
20
4) Model Evaluation: once model parameters have been estimated, one would
like to make a dichotomous decision, either to retain or reject the hypothesized model.
Essentially, a statistical hypothesis-testing problem with the null hypothesis being that
the model under consideration fits the data. The overall model goodness of fit is
reflected by the magnitude of discrepancy between the sample covariance matrix
and the covariance matrix implied by the model with the parameter estimation (a.k.a.
the minimum of the fit function or Fmin). Most measurement of overall model
goodness of fit are functionally related to Fmin. The model test statistic (N–1) Fmin,
where N is the sample size, has a chi-square distribution (i.e., it is a chi-square test)
when the model is correctly specified and can be used to test the null hypothesis that
the model fits the data.
To obtain good teaching characteristics, the good teaching characteristics items
that proposed in previous studies are summarized as a questionnaire. Social research
process is used to survey information from Thai instructors and Thai students.
The good teaching characteristics that appropriate with Thai educational context are
revealed. These good teaching characteristics are used to be initial structure of
knowledge base of the proposed system.
2.2 Thai language processing and application
To develop a system that deals with human language, the basic knowledge
about processing of natural language are required. This section presents
the fundamental of Natural Language Processing (NLP), the characteristics of Thai
language processing, and the linguistic resources for Thai language.

21
2.2.1 Fundamental of Natural Language Processing
Natural language processing (NLP) is a widely field that aims to studying
on linguistic processing. The definition of NLP is defined by several scholars as
follows: Hayes and Carbonell (1983) states that “Natural language processing is
the formulation and investigation of computationally effective mechanisms for
communication through natural language”. Liddy (1998: p. 137) states that “Natural
language processing is a set of computational techniques for analyzing and
representing naturally occurring texts at one or more levels of linguistic analysis for
the purpose of achieving human-like language processing for a range of tasks or
applications”. Dale, Moisl and Somers (2000: p. v) states in “Handbook of Natural
Language Processing” that “NLP concern with the design and implementation of
effective natural language input and output components for computational systems”.
According to these definitions, NLP is a process or a technique to analyze
linguistic structure, extracting meaningful information from natural language or
input/product of natural language that human-like. Presently, NLP was implemented
as underneath technique of several tasks that support in building an automatic system,
e.g., Information Retrieval (IR) (Paul and Lisa, 1988: p. 85; Nihalani, Silakari, and
Motwani, 2011), Information Extraction (IE), Machine Translation (MT) (Hutchins
and Somers, 1992: p. 2) and Text Summarization (TS) (Das and Martins, 2007).
To develop the application that could extract or understand the meaning
of text or spoken language. NLP defines the level of linguistics analysis in six levels as
shown in Figure 2.2.

22
Figure 2.2 Level of linguistics analysis (Liddy, 1998: p. 138)
2.1) Morphological level: this level has to deal with the smallest
grammatical units of language called “morphemes”. This is the smallest meaningful
pieces of words. For example, the morpheme “ed” at the end of a verb tells that the
action took place in the past. Additionally, simple things like adding the morpheme
“un” to “lawfully” drastically change the meaning of the word.
2.2) Lexical level: this level is concerned with linguistic processing at
the word level and includes such processing including Part-Of-Speech tagging.
When humans hear or read a sentence, they determine that a word can function both as
a verb and as a noun, either a verb or a noun in that particular sentence. Knowing
about Part-Of-Speech of word is useful for word sense disambiguation.
2.3) Syntactic level: this level is concerned the order and arrangement
of words within a sentence convey meaning. For example, the sentence “อธบาย/แลว/
เขาใจ/ไมคอย/งง” contains the same words as “ไมคอย/เขาใจ/อธบาย/แลว/งง” but the simple
ordering of those words conveys a world of difference in meaning.
2.4) Semantic level: this level is concerned with understanding
the meaning of words within context i.e., humans are able to unambiguously

23
understand words when they hear them or read them in a sentence even though many
words have multiple meanings. For example, in the English language, the most
commonly occurring verbs each have eleven meanings (or senses) and the most
frequently used nouns have nine senses, but humans can correctly select the one sense
or meaning that is intended by the author or speaker.
2.5) Discourse level: this level is concerned with units of text larger
than a sentence. Discourse is a newer area of linguistic applications, having begun as
an area of linguistic study in the 1970s. Discourse linguistics is concerned with
the linguistic features that enable humans. For example, to understand the eighth
sentence in a paragraph partly because of the meaning they extracted from the first to
seventh sentences. Discourse is also concerned with utilizing the fact that texts of a
particular type (a.k.a. “genre”) have a predicable informational structure and that
humans use this structure to infer meaning that is not explicitly conveyed at any of the
other levels in the model.
2.6) Pragmatic level: this level is concerned with the knowledge and
meaning that we assign to text using our world knowledge. For example, the phrase
“Third World Countries” does not just mean those three words to a reader. Pragmatic
knowledge brings in a lot of other understanding, such as which are the Third World
Countries and the general socioeconomic conditions in these countries.
2.2.2 Thai language processing
NLP were studied mostly on the European languages which roots of word
are from Latin such as English, Dutch, French, Spanish, etc. Research on Asian
language has thrived in the past few years. There is a workshop initiated in 2001 called
“The Asian Language Resources Workshops”. Since 2006, several conferences
24
including COLING/ACL published papers that deal with Bengali, Filipina, Hindi,
Marathi, Thai, Urdu, and Vietnamese (Huang, Tokunaga and Lee, 2006: pp. 209-210).
Thai is a language which is used in some countries of South-East Asia, especially
Thailand. Characteristic of Thai language had studied and described in the following
section.
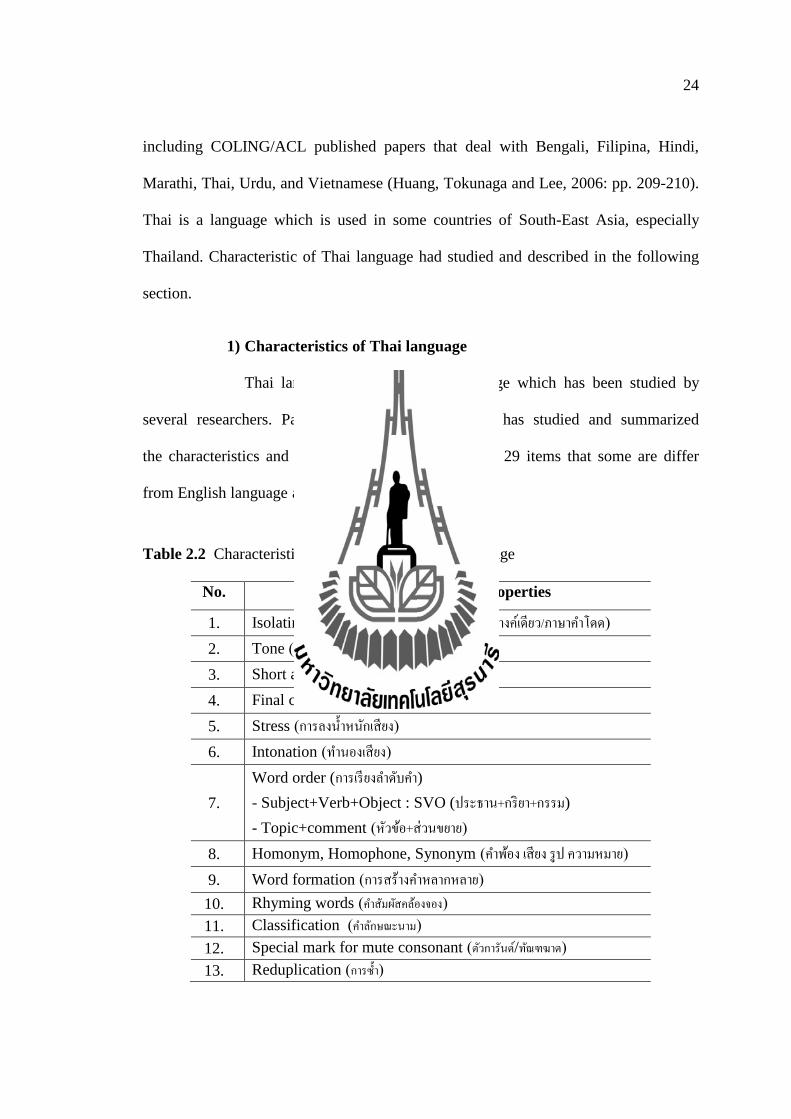
1) Characteristics of Thai language
Thai language is an attractive language which has been studied by
several researchers. Palingoon (2011: pp. 171-172) has studied and summarized
the characteristics and properties of Thai language as 29 items that some are differ
from English language as shown in Table 2.2.
Table 2.2 Characteristics and properties of Thai language
No. Characteristics and properties
1. Isolating/Monosyllabic language (ค าพยางคเดยว/ภาษาค าโดด)
2. Tone (เสยงวรรณยกต)
3. Short and Long vowel (สระสน-ยาว) 4. Final consonant (พยญชนะทายค า) 5. Stress (การลงน าหนกเสยง) 6. Intonation (ท านองเสยง)
7.
Word order (การเรยงล าดบค า) - Subject+Verb+Object : SVO (ประธาน+กรยา+กรรม)
- Topic+comment (หวขอ+สวนขยาย) 8. Homonym, Homophone, Synonym (ค าพอง เสยง รป ความหมาย) 9. Word formation (การสรางค าหลากหลาย) 10. Rhyming words (ค าสมผสคลองจอง) 11. Classification (ค าลกษณะนาม)
12. Special mark for mute consonant (ตวการนต/ทณฑฆาต)
13. Reduplication (การซ า)

25
Table 2.2 Characteristics and properties of Thai language (continued)
No. Characteristics and properties
14. Register (ระดบการใชภาษา) 15. Particle/ ending word (ค าลงทาย) 16. Reduced word (การละค า) 17. Serial verb (กรยาเรยง) 18. Syllable structure (โครงสรางพยางค: C(C) V(V1-5) C)
19. Discourse-oriented language (ภาษาองขอความ)
20. Word space (การเวนวรรคระหวางค า) 21. Space functions (หนาทของการเวนวรรค)
22. Capital letter (ไมมอกษรตวใหญ)
23. Vowel position (ต าแหนงของรปสระ)
24. Collocation (ค าปรากฏรวม)
25. Polysemy (ค าหลายหนาทและค าหลายความหมาย) 26. Interrogative sentence (ประโยคค าถามมลกษณะเฉพาะ)
27. Left to Right writing (การเขยนเรยงจากซายไปขวา) 28. Variation of tones to letters (การผนอกษร) 29. Diphthong (ค าควบกล า)
According to mentioned characteristics of Thai language, Thai
researchers were studied and identified the obstacle of NLP with Thai language in four
major issues as follows (Sornlertlamvanich et al., 2000; Jirawan and Asanee, 2006;
Sukhum, Nitsuwat and Haruechaiyasak, 2011).
1) Thai language does not have the punctuation marks, such as space
or full stop to identify word or sentence boundary and also does not have the capital
letter.
2) The ambiguous of word meaning when appears in different
position in sentence or in difference context.

26
3) There are special word genres, such as Name Entity,
Transliteration word or Phrase from word compounding.
4) Flexible of grammatical structural, some component of sentence
(subject or object) can be omitted.
Furthermore, Palingoon (2011: pp. 179-185) described the effect of
“Electronics grammar” which is an evolution of written style. This is an obstacle
characteristic of language processing e.g., the words which written follow speaking
sound, repeating of vowel or characters, using the group of symbols to represent their
feeling called “emotion”. These special characteristics of written forms usually found
in modern communication system e.g., Short-Messaging-Service (SMS), Web Board,
Chats room, Web Blog or Social media (e.g., Facebook, Twitter, etc.).
According to the characteristics of language and written style as
mentioned above, there are three principal problems of NLP with Thai language are
defined, that are 1) Word segmentation, 2) Sentence segmentation, and 3) Lexicon
ambiguity (Modhiran et. al., 2005).
2) Applications for Thai language processing
To overcome the problems as stated above, there are several
applications were developed to process Thai language as follows.
2.1) Word Segmentation Application
Text segmentation or term tokenization is one of the fundamental
tasks in natural language processing (NLP). Most NLP applications require input text
to be tokenized into individual terms or words before being processed further. For
example, in machine translation, text must first be tokenized into a series of terms

27
before it can be further analyzed and translated into another language. For information
retrieval systems, in which the inputs are text documents and text queries, text is first
tokenized into individual terms. The processed terms are then organized into
an inverted file index data structure for fast retrieval. In speech synthesis applications,
the tokenized terms are segmented further into syllables, which are then mapped into
phoneme units. Like Chinese, Japanese, and Korean, the Thai written language is
unsegmented, i.e., it is written continuously without the use of word delimiters
(Haruechaiyasak, Kongyoung and Dailey, 2008). Presently, there are several
application were develop to tokenize Thai language such as SWATH, LibThai, KUcut,
LexTo, TLexs etc.
- SWATH: Smart Word Analysis for Thai (SWATH) is
a general-purpose utility for analyzing Thai word boundaries and inserting predefined
word delimiter codes. The original version was released by Charoenpornsawat (1999).
It can be used to preprocess Thai LaTeX documents. The longest matching and
maximal matching algorithms are used as segmentation algorithm. It also included
the bigram part of speech tagging based on Orchid corpora resource. The latest version
contains 23,944 words in internal dictionary. These words are extracted from Thai
common dictionary and manually added by maintainer.
- LibThai: an open source libraries for Thai language support
which developed by Karoonboonyanan et al. (2001). It performed under Unix/Linux
platform. This library consists of character support, character properties, string
manipulators, string collation, input/output method and word segmenting. The word
segmenting feature of LibThai was implemented the maximal matching algorithm and
selected the minimal number of words for speed optimization in practice. It contains

28
23,563 words from Thai dictionary of the Royal Institute of Thailand. The words in
LibThai dictionary are manually added by maintainer.
- KUcut: KU wordcut is a Thai word segmentation program
which proposed in 2003 (Sudprasert and Kawtrakul, 2003). It was continue developed
with Python language and disseminated under the license of Kasetsart University,
NAiST Research Laboratory. It differs from SWATH in aspects of using the novel
unsupervised machine learning algorithm as a main process to segment unknown
words.
- LexTo: Thai Lexeme Tokenizer (NECTEC, 2004; 2006) is a
word segmentation program which obtains the winner award for Enhancing the
Standard of Thai Language Processing (BEST 2009). It was developed by National
Electronics and Computer Technology Center (NECTEC), Thailand. LexTo is an open
source software which released under the license of GNU Lesser General Public
License (LGPL). It uses the longest matching algorithm with the dictionary base. The
initial dictionary of LexTo is derived from the LEXiTRON which consist 42,221
words.
- TLexs: Thai Lexeme Analyser (Haruechaiyasak and
Kongyoung, 2009; NECTEC, 2009) is a word segmentation application which
proposed in the InterBEST 2009 Thai Word Segmentation workshop. It is a machine
learning system which used the Conditional Random Fields (CRFs) as segmentation
algorithm.
Both of the LexTo and TLexs were developed by NECTEC,
which available online via Sansarn website (NECTEC, 2004). The difference between
both is “LexTo” is dictionary based that allows users to add specific words to the

29
dictionary. This implies that LexTo is dynamic application. While “TLexs” uses
Conditional Random Field (CRF) as method to segment words. It was already
modeled from a five million word corpus (Thumrongluck and Mongkolnavin, 2011).
This implies that TLexs restricts to add up new specific words into it.
2.2) Part-Of-Speech tagging application
Part-Of-Speech (POS) tagging is usually considered as front-end
preparation process. In the past two decades, most POS tagging systems were based on
a sequential classification approach, decomposing a sequence labeling task into
a series of classification subtasks. The state of the art of tagging was achieved by
virtue of well-developed machine learning method e.g., the Maximum Entropy model,
the Support Vector Machine, etc. (Chen and Kit, 2011). Several Part-Of-Speech
tagging application were released for English language processing. To the best our
knowledge, there are few resources and applications developed to process Thai
language. The Part-Of-Speech tagset and tagging applications are described as
follows.
2.2.1) Thai linguistic corpus and Part-Of-Speech tagset
The existing Thai corpus is divided into two types; Speech
and Text corpus which developed by many Thai Universities. Originally, the goal of
the text corpus is used only inside their own laboratory. From surveying of Kawtrakul
et al., (2002), there are some of Thai text corpus were developed, that are the NAiST
corpus (Kawtrakul et al., 1995) and ORCHID corpus (Sornlertlamvanich,
Charoenporn and Isahara, 1997).

30
- NAiST corpus: this corpus introduced in 1996.
The primary aim is to collect document from magazines for training and testing
program in Written Production Assistance system (Kawtrakul et al., 1995). This
corpus is continued collecting and released under the license of NAiST Research
Laboratory, Kasetsart University, Thailand. NAiST corpus consists of 60,511,974
words with the 49 Part-Of-Speech tagset (NAiST, n.d.). These Part-Of-Speech tagset
is shows in Table 2.3.
Table 2.3 NAiST corpus tagset
No. POS Description Example Words
NOUN
1. npn Proper noun น าดอกไม อจฉรา 2. nnum Cardinal number พน หมน แสน ลาน etc.
3. norm Ordinal Number Marker ท
4. nlab Label noun 1 2 ก ข 5. ncn Common noun ชาง มา 6. nct Collective noun ฝง พวก พรรค 7. ntit Title noun นาย นาง นางสาว
PRONOUN
8. pper Personal pronoun เขา คณ ทาน ฉน
9. pdem Demonstrative pronoun น นน นน
10. pind Indefinite pronoun ใคร ๆ ผใด ตาง บาง 11. ppos Possessive pronoun ของคณ ของเรา 12. prfx Reflexive pronoun เอง ตวเอง 13. prec Reciprocal pronoun กน
14. prel Relative pronoun ท ซง อน
15. pint Interrogative pronoun ท าไม อะไร อยางไร VERB
16. vi Intransitive verb เดน นง ซม กดดน กระจาย 17. vt Transitive verb กรณา กลว กวนใจ 18. vcau Causative verb ให ท าให

31
Table 2.3 NAiST corpus tagset (continued)
No. POS Description Example Words
19. vcs Complementary state verb เปน อย คอ กลาวคอ 20. vex Existential verb ม 21. prev Pre-verb จะ ยง คง ก าลง ยอม 22. vpost Post-verb ไป มา ขน ลง 23. honm Honorific marker พระ ทรง พระราช
DETERMINER 24. det Determiner น นน 25. indet Indefinite determiner ใด อน อยางไร
ADJECTIVE 26. adj Adjective ขยน ก าย า กตตมศกด
ADVERB 27. adv Adverb กลางคน กวา แรก สดทาย กอน หลง 28. advm1 Adverb marker1 อยาง 29. advm2 Adverb marker2 เปน 30. advm3 Adverb marker3 โดย 31. advm4 Adverb marker4 สก 32. advm5 Adverb marker5 ตาม
CLASSIFIER 33. cl Classifier เชอก เซนตเมตร ทาง ประเทศ ชน etc.
CONJUNCTION 34. conj Conjunction และ ในทน 35. conjd Double conjunction ทง...และ ไม...ก ทง....ทง 36. conjncl Noun clause conjunction วา ให ไดแก เชน PREPOSITION 37. prep Preposition กบ โดย เมอ ตรง 38. prepc Co-preposition ระหวาง...กบ ตงแต...จนถง
INTERJECTION 39. int Interjection เอะ ออ อย วาย ดอก ดกร

32
Table 2.3 NAiST corpus tagset (continued)
No. POS Description Example Words
PREFIX 40. pref1 Prefix1 การ ความ 41. pref2 Prefix2 ผ นก 42. pref3 Prefix3 ชาว
PARTICLE 43. aff Affirmative คะ ครบ จา ครบผม 44. part Particle นก นนเอง เปนตน
NAGATIVE 45. neg Negative ไม ม ไร
PUNCTUATION 46. punc Punctuation . - , ‘
IDIOM 48. idm Idiom รกววใหผก รกลกใหต
PASSIVE VOICE MARKER 48. psm Passive voice marker ถก โดน
SYMBOL 49. sym Symbol ฯลฯ ฯ % ๆ
- ORCHID corpus: ORCHID is the code name of
a project for building Thai POS tagged corpus which initiated by a group of
researchers from Communications Research Laboratory (CRL) of Japan and
National Electronics and Computer Technology Center (NECTEC) of Thailand.
This project started in April 1996. The purpose of this project is to prepare Thai
language corpus for linguistic research, especially, developing applications for
processing Thai language under the computational environment. The structure of
the ORCHID Corpus consists of 2 types of text, that are the information line,
a line beginning with a “%” character, and the numbering line, a line beginning
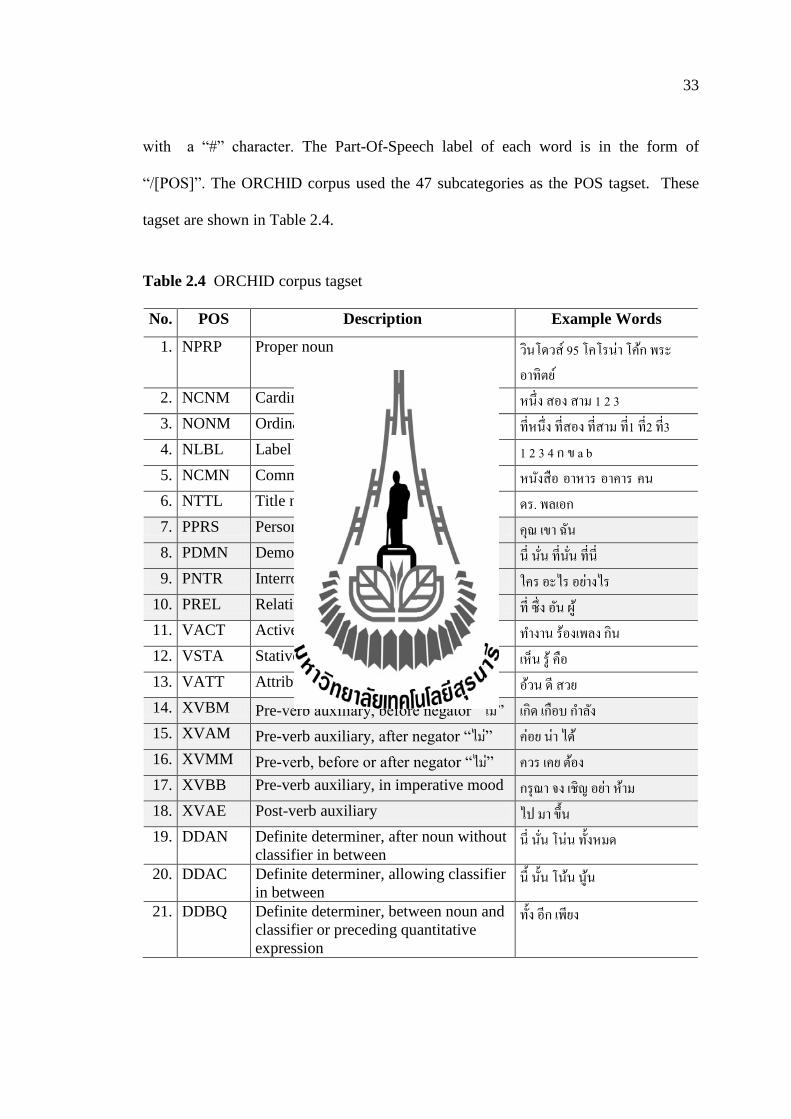
33
with a “#” character. The Part-Of-Speech label of each word is in the form of
“/[POS]”. The ORCHID corpus used the 47 subcategories as the POS tagset. These
tagset are shown in Table 2.4.
Table 2.4 ORCHID corpus tagset
No. POS Description Example Words
1. NPRP Proper noun วนโดวส 95 โคโรนา โคก พระอาทตย
2. NCNM Cardinal number หนง สอง สาม 1 2 3 3. NONM Ordinal number ทหนง ทสอง ทสาม ท1 ท2 ท3 4. NLBL Label noun 1 2 3 4 ก ข a b 5. NCMN Common noun หนงสอ อาหาร อาคาร คน
6. NTTL Title noun ดร. พลเอก 7. PPRS Personal pronoun คณ เขา ฉน 8. PDMN Demonstrative pronoun น นน ทนน ทน 9. PNTR Interrogative pronoun ใคร อะไร อยางไร
10. PREL Relative pronoun ท ซง อน ผ 11. VACT Active verb ท างาน รองเพลง กน 12. VSTA Stative verb เหน ร คอ 13. VATT Attributive verb อวน ด สวย 14. XVBM Pre-verb auxiliary, before negator “ไม” เกด เกอบ ก าลง 15. XVAM Pre-verb auxiliary, after negator “ไม” คอย นา ได 16. XVMM Pre-verb, before or after negator “ไม” ควร เคย ตอง 17. XVBB Pre-verb auxiliary, in imperative mood กรณา จง เชญ อยา หาม 18. XVAE Post-verb auxiliary ไป มา ขน 19. DDAN Definite determiner, after noun without
classifier in between น นน โนน ทงหมด
20. DDAC Definite determiner, allowing classifier
in between น นน โนน นน
21. DDBQ Definite determiner, between noun and
classifier or preceding quantitative
expression
ทง อก เพยง

34
Table 2.4 ORCHID corpus tagset (continued)
No. POS Description Example Words
22. DDAQ Definite determiner, following
quantitative expression พอด ถวน
23. DIAC Indefinite determiner, following noun;
allowing classifier in between ไหน อน ตางๆ
24. DIBQ Indefinite determiner, between noun
and classifier or preceding quantitative
expression
บาง ประมาณ เกอบ
25. DIAQ Indefinite determiner, following
quantitative expression กวา เศษ
26. DCNM Determiner, cardinal number
expression หนงคน เสอ 2 ตว
27. DONM Determiner, ordinal number expression ทหนง ทสอง ทสดทาย 28. ADVN Adverb with normal form เกง เรว ชา สม าเสมอ 29. ADVI Adverb with iterative form เรว ๆ เสมอ ๆ ชา ๆ 30. ADVP Adverb with prefixed form โดยเรว 31. ADVS Sentential adverb โดยปกต ธรรมดา 32. CNIT Unit classifier ตว คน เลม 33. CLTV Collective classifier ค กลม ฝง เชง ทาง ดาน แบบ รน 34. CMTR Measurement classifier กโลกรม แกว ชวโมง 35. CFQC Frequency classifier ครง เทยว 36. CVBL Verbal classifier มวน มด 37. JCRG Coordinating conjunction และ หรอ แต 38. JCMP Comparative conjunction กวา เหมอนกบ เทากบ 39. JSBR Subordinating conjunction เพราะวา เนองจาก ท แมวา ถา 40. RPRE Preposition จาก ละ ของ ใต บน 41. INT Interjection โอย โอ เออ เอ ออ 42. FIXN Nominal prefix การท างาน ความสนกสนาน 43. FIXV Adverbial prefix อยางเรว 44. EAFF Ending for affirmative sentence จะ จะ คะ ครบ นะ นา เถอะ 45. EITT Ending for interrogative sentence หรอ เหรอ ไหม มย 46. NEG Negator ไม มได ไมได ม 47. PUNC Punctuation เครองหมายตาง ๆ เชน (, ), “, ,, ;

35
Both of the NAiST corpus and ORCHID corpus were widely
used as principal corpus for NLP researchers to develop a Part-Of-Speech software
package or Web service that handle with Thai language. However, there are only few
software that could deals with Part-Of-Speech tagging for Thai language are available,
e.g., SWATH, KUcut, Jitar (with NAiST model), OpenNLP. The description of this
software is as follows.
As mentioned in section of Word Segmentation Application,
the SWATH and KUcut were released as standalone applications; however, there are
some attempts to implement them as service via Internet system.
- Thaisemantics.org: Poltree and Saikaew (2012) create
a website, namely, “Thaisemantics.org” which provided a service to segment Thai
sentences into word and tag their Part-Of-Speech. The proposed services are
developed base on the SWATH and ORCHID tagset.
- KU Wordcut Demo: Sudprasert and Kawtrakul (2003)
were proposed a website which implemented the KUcut as underneath process. The
website called the “KU Wordcut Demo”. The demonstration website was provided
NLP functions as same as Thaisemantics.org website; however, it was developed as
web application which limits the maximum input is 500 characters.
Beside, two mentioned websites; there are some standalone
applications for Part-Of-Speech tagging with Thai language named “Jitar (with NAiST
model)” and “OpenNLP”.
- Jitar (with NAiST model): Jitar is a generally Part-Of-
Speech tagger which is original developed by Daniël de Kok (2010). It is a Java
application based on a trigram Hidden Markov Model (HMM) algorithm. Recently,

36
Vee Satayamas, a Thai researcher of NAiST Research Laboratory has released
the Thai Part-Of-Speech model for Jitar. It can access via NAiST website (NAiST,
2011). As same as the KU Wordcut Demo, Jitar with Thai language processing was
modeled based on the NAiST corpus.
- Apache OpenNLP: “The Apache Software Foundation”
developed a Natural Language Processing library called “OpenNLP” (Apache
Software Foundation, 2010). This software library is a machine learning based toolkit.
It supports most common NLP tasks, such as tokenization, sentence segmentation,
Part-Of-Speech tagging, etc. It also supports various European languages. To tag
the Part-Of-Speech for Thai language, the language model was trained and available
for OpenNLP version 1.4, which can access via sourceforge.net website. The
OpenNLP language model is based on ORCHID corpus.
As mentioned before, the word segmentation and Part-Of-Speech tagging
are basic requirement of any application that handle with Natural Language
Processing. In this work, the LexTo is selected as our word segmentation tool because
of its flexibility in recognizing new words that are not included in the dictionary.
In context of student feedbacks where spoken language is used more often than written
one, LexTo appears to be a more appropriate tool. In regarding to the Part-Of-Speech
tagging application, Zeng et al. (2013) presented an experiment about performance of
Jitar and Apache OpenNLP. This experiment revealed that Jitar given a little bit higher
of accuracies than Apache OpenNLP. In practice, Apache OpenNLP provided
the Application Programming Interface (API) with complete of their manual and also
can use it as Command Line Interface (CLI). These characteristics provided benefit for
the developer in order to include it as part of a developed system. While the Jitar only

37
provided the Command Line Interface (CLI) and lack of their examples to used it.
Per above reasons, the Apache OpenNLP is selected as Part-Of-Speech tagging in this
work.
2.3 Linguistic resources and dictionary
Linguistic resources and dictionary are very important to Information Retrieval
and Natural Language Processing fields. There are several work used these linguistic
resources in aspect of, referring the meaning of word, finding and computing of word
similarity, and also used as pre-defined categories to classify document contents.
The famous general purposed linguistic resource is “WordNet” (Miller, 1995). It was
invented in English language. There are extended version of WordNet in various
languages e.g., Spanish, Italian, German, French, and Asian language called
“AsianWordNet” (Sornlertlamvanich et al., 2009). There is an extension of WordNet
which provide the benefit for opinion mining tasks, called “SentiWordNet” (Esuli and
Sebastiani, 2006). Besides, there are the other effort to build the linguistic resource for
opinion mining tasks e.g., Bing Liu's Opinion Lexicon, MPQA Subjectivity Lexicon,
Harvard General Inquirer, LIWC, SenticNet, etc. (Potts, 2011, Cambria and Hussain,
2012).
2.3.1 Lexicon and Thai dictionary
1) WordNet and SentiWordNet
1.1) WordNet: WordNet is a famous linguistic resource (a.k.a.
“Princeton WordNet (PWN)”). At initial stage, it was developed as part of a project
began in 1985 with a group of psychologists and linguists under the direction of
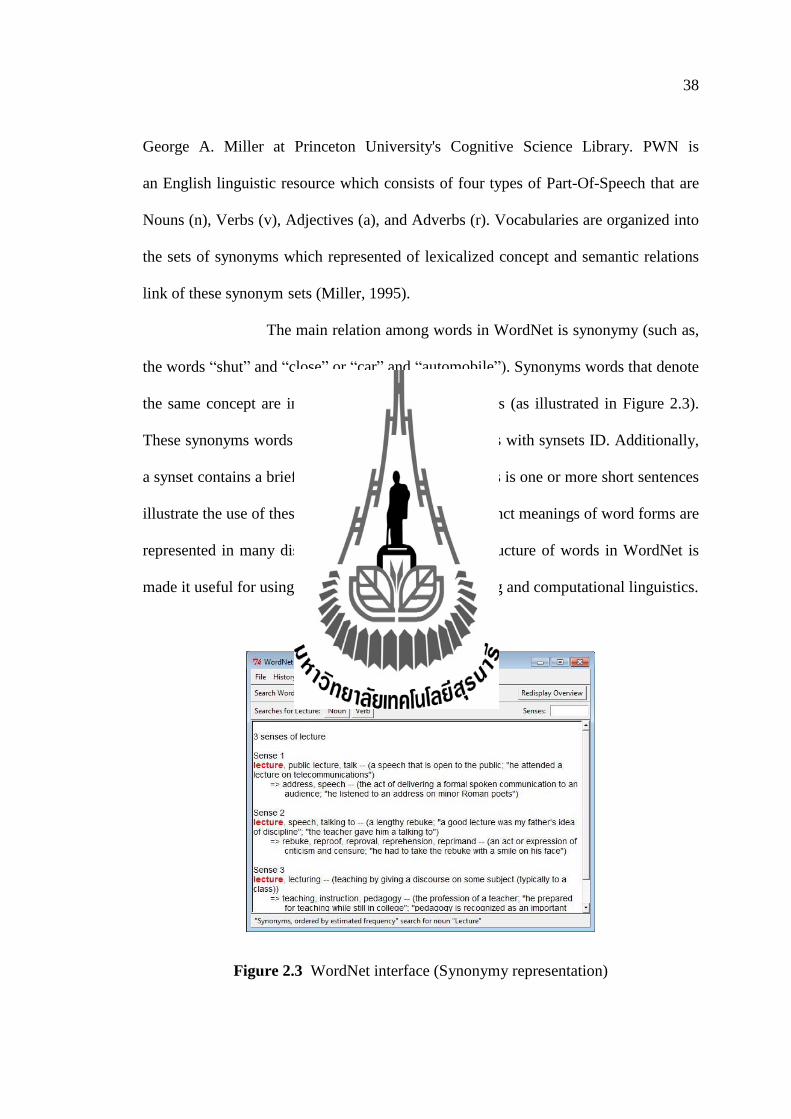
38
George A. Miller at Princeton University's Cognitive Science Library. PWN is
an English linguistic resource which consists of four types of Part-Of-Speech that are
Nouns (n), Verbs (v), Adjectives (a), and Adverbs (r). Vocabularies are organized into
the sets of synonyms which represented of lexicalized concept and semantic relations
link of these synonym sets (Miller, 1995).
The main relation among words in WordNet is synonymy (such as,
the words “shut” and “close” or “car” and “automobile”). Synonyms words that denote
the same concept are interchangeable in many contexts (as illustrated in Figure 2.3).
These synonyms words are grouped into unordered sets with synsets ID. Additionally,
a synset contains a brief definition called “gloss”. Gloss is one or more short sentences
illustrate the use of these synset members. Several distinct meanings of word forms are
represented in many distinct synsets. This network structure of words in WordNet is
made it useful for using in Natural Language Processing and computational linguistics.
Figure 2.3 WordNet interface (Synonymy representation)

39
1.2) SentiWordNet: a linguistics resource which was developed based
on terminology of WordNet, called “SentiWordNet” (Esuli and Sebastiani, 2006).
This linguistics resource has a specified purpose to support the opinion mining task.
This resource used semi-supervised learning approach to estimate opinion score of
each terminology. The feature set for classifiers obtain from Term Frequency-Inverse
Document Frequency (TF-IDF) and Cosine normalized weighting. The supervised
learning algorithms (Rocchio and SVMs) are used to generate several semi-
independent classifiers. Initializing with a small hand-labeled set (seed set),
this automatic process are generates more labeled data with their opinion score. It uses
WordNet lexical relationships to expand both “Positive” and “Negative” sets of terms.
Terminologies of SentiWordNet and opinion score are stored in a plain text file.
An excerpt of SentiWordNet file structure is shown in Table 2.5.
Table 2.5 An excerpt of SentiWordNet files structure
POS ID PosScore NegScore SynsetTerms Gloss
a 00001740 0.125 0.000 able#1 (usually followed by
`to') having the
necessary means or
skill or know-how or
…
a 00002098 0.000 0.750 unable#1 (usually followed by
`to') not having the
necessary means …
… … … … … …
n 00604811 0.000 0.000 teachership#1 the position of teacher
n 00604910 0.000 0.250 thaneship#1 the position of thane
… … … … … …
v 02768874 0.375 0.125 glow#3
burn#2
shine intensely, as if
with …
v 02769077 0.000 0.625 gutter#1 burn unsteadily,
feebly, …
… … … … … …

40
According to SentiWordnet files structure, these terms score can used
in several style (Kreutzer and Witte, 2013). The six common ways to use these score
are, 1) Sum up all scores, 2) Average all scores, 3) Sum up only for adjectives,
4) Average only for adjectives, 5) Average of all non-zero scores, and 6) Majority
vote.
Although, there are general purposed linguistic resources available to
access, however, those linguistic resources were developed base on European
language. To develop a system that handles with Thai language processing, Thai
dictionary is another important linguistic resource that should be concerned. Several
existing of Thai dictionary is available and it also provides services both in online and
offline e.g., LEXiTRON, LongDo Dictionary, the Royal Institute Dictionary and
SEAlang library, etc. (Charoenporn et al., 2003, Metamedia Technology, 2003,
TICFIA Program, 2005, The Royal Institute, n.d.). LEXiTRON is a famous Thai
linguistic dictionary that many researchers are referencing.
2) LEXiTRON
2.1) LEXiTRON: (Charoenporn et al., 2003) is the first Thai-English
corpus-based dictionary which is a project of Human Language Technology
Laboratory of NECTEC. LEXiTRON was started in 1994. The structure of
LEXiTRON is defined by a set of sample sentences and usages. In addition to their
basic information, it provides Part-Of-Speech, classifier, verb pattern, synonym,
antonym, and pronunciation. It was aimed to be a dictionary for writing. Most of
the lexicons are originated from the dictionary developed for using with the Machine
Translation project (the research and development of Multi-lingual Machine
Translation System for Asian countries, 1987-1997). These information and word

41
entry are suitable for both human and machine use. The first version of LEXiTRON
was launched in 1996 as a CD-ROM dictionary for human use. Recently, after
a concentrated revision, the second version was released under the open source
concept for the contents. It is available in both stand-alone and on-line versions at
NECTEC website (NECTEC, 2003). An example screenshot is shown in Figure 2.4.
Figure 2.4 LEXiTRON Dictionary interface
2.3.2 String similarity approaches
Gomaa and Fahmy (2013) had studied and categorized several similarity
algorithms that related with text processing. Those algorithms were roughly separated
into two groups including: 1) Text similarity and 2) Semantic similarity.
1) Text similarity
In text similarity, there are several algorithm were proposed e.g.,
Longest Common Substring (LCS), Levenshtein, Jaro, Jaro-Winkler, etc. These
algorithms are “Character-based”. Another type of text similarity is “Terms-based”

42
e.g., Block distance, Cosine similarity, Dice’s coefficient, Jaccard similarity, Overlap
coefficient, etc. Details of some algorithms were presented as follows:
1.1) Jaro similarity: The Jaro algorithm is commonly used for name
matching in data linkage systems. It is suitable and provides good performance for
short text length. It account for insertion, deletion and transposition. The algorithm
calculates the number c of common characters (agreeing characters that are within half
the length of longer string) and the number of transpositions t. A similarity measure is
calculated as Equation (2.1).
1
( 1, 2)3 | 1| | 2 |
jaro
c c c tsim s s
s s c
(2.1)
1.2) Jaro-Winkler similarity: Base on the Jaro algorithm, W.E.
Winkler improves performance of the traditional Jaro algorithm by applying ideas
from empirical studies. The empirical studies revealed that there are fewer errors
typically occur at the beginning of texts data. The Winkler increases the Jaro similarity
measure for agreeing initial characters (up to four). It is calculated as Equation (2.2).
( 1, 2) ( 1, 2) (1.0 ( 1, 2))10
wink jaro jaro
psim s s sim s s sim s s (2.2)
With p being the number of agreeing characters at the beginning of
two strings, where p = max(p0, 4). For example: “peter” and “petra” have p=3, while,
“peter” and “peter pan” have p=4.
1.3) Jaccard similarity: The Jaccard is a simple similarity method
which computed the number of shared term over the number of all unique terms in
both strings. Although, it was categorize into Term-based similarity, however, it can
43
perform in level of n-sequence characters (a.k.a. n-grams). A similarity measure is
calculated as Equation (2.3).
( 1, 2) 1jaccard
psim s s
p q r
(2.3)
Where p is number of term co-occurrence for both s1 and s2. q is
number of term that only occur in s1. r is number of term that only occur in s2.
2) Semantic similarity
In semantic similarity, Gomaa and Fahmy (2013) categorized
similarity approaches into three types including: 1) Corpus-base similarity,
2) Knowledge-based similarity, and 3) Hybrid similarity. The first one is “Corpus-base
similarity” which using complicated computation with large linguistic corpus to
extract similarity score. There are several famous approach in this type e.g.,
Hyperspace Analogue to Language (HAL), Latent Semantic Analysis (LSA),
Pointwise Mutual Information (PMI), Normalized Google Distance (NGD), etc.
The second type of semantic similarity is “Knowledge-based similarity”. This type
requires a well structure of linguistic relationship to identify the closer of word
meaning. The last one is “Hybrid similarity” which applies several approaches as
described above to identify the semantic similarity of word.
Semantic computation based on WordNet is a type of Knowledge-
based similarity. WordNet is a famous linguistics resource which several researchers
utilized to compute semantic similarity of word. Semantics similarity techniques on
WordNet can be categorized into four main groups (Varelas et al., 2005) that are:
1) Edge Counting Methods: Measuring the similarity between two terms (concepts) as

44
a function of the length of the path linking the terms and the position of the terms in
the taxonomy, 2) Information Content Methods: Measuring the difference in
information content of the two terms as a function of their probability of term
occurrence in a corpus, 3) Feature Based Methods: Measuring the similarity between
two terms as a function of their properties (e.g., their definitions or “glosses” in
WordNet) or based on their relationships to other similar terms in the taxonomy, and
4) Hybrid Methods: This method combines several method of the previous groups.
Term similarity is computed by matching synonyms, term neighborhoods, and term
features. The popular methods of semantics similarity are described as follows:
2.1) Hirst–St-Onge: In 1998, Hirst and St-Onge proposed a semantic
measurement. This is a measuring of semantic relatedness that two lexicalized
concepts are semantically close, if their WordNet synsets are connected by a path that
is not too long and does not change direction too often. The strength of the relationship
is given by:
1 2 1 2( 1, 2) ( , ) ( , )HSSim c c C len c c k turns c c (2.4)
Where C and k are constants (in practice, they used C = 8 and k = 1),
and turns(c1,c2) is the number of times the path between c1 and c2 changes direction. if
no such path exists, SimHS(c1, c2) is zero and the synsets are deemed unrelated.
2.2) Leacock–Chodorow: Leacock and Chodorow proposed
a technique which rely on the length len(c1, c2) of the shortest path between two
synsets for their measure of similarity. However, they limit on IS-A links and scale the
path length by the overall depth D of the taxonomy. The similarity is given by:

45
( 1, 2)
( 1, 2) log2
LC
len c csim c c
D
(2.5)
2.3) Resnik: Resnik’s approach is the first technique that bring
ontology and corpus together. The idea of this technique is the similarity between
a pair of concepts may be judged by “the extent to which they share information”.
Resnik defined the similarity between two concepts lexicalized in WordNet to be
the information content of their lowest super-ordinate, lso(c1, c2):. The similarity is
given by:
( 1, 2) log ( ( 1, 2))ressim c c p lso c c (2.6)
Where p(c) is the probability of encountering an instance of a synset c
in some specific corpus.
2.4) Jiang–Conrath: Jiang and Conrath’s approach is an information
content. However, they used the conditional probability of encountering an instance of
a child-synset given an instance of a parent synset. Thus the information content of
the two nodes is the most specific and plays a part. Notice that this formula measures
semantic distance in the inverse of similarity. The similarity is given by:
( 1, 2) 2log( ( ( 1, 2))) (log( ( 1)) log( ( 2)))JCSim c c p lso c c p c p c (2.7)
2.5) Lin: Lin’s approach is similarity measure approach which follows
the Jiang and Conrath theory. But, there is different fashion form of SimJC .
2 log ( ( 1, 2))
( 1, 2)log ( 1) log ( 2)
lin
p lso c cSim c c
p c p c
(2.8)

46
Recently, another technique of semantics similarity is proposed.
This technique was proposed by Kamps et al. (2004).
2.6) Kamps: It implements the idea of famous psychological theory,
called “the Charles Osgood’s theory of semantic differentiation” with WordNet.
They used semantic differential technique with the several pairs of bipolar words to
scale the responses of subjects to words, short phrases, or texts. An example of bipolar
words such as “active/passive”, “good/bad”, “optimistic/pessimistic”, “positive/negative”,
“strong/weak”, “serious/humorous”, “ugly/beautiful”, etc. This technique defined
a function to measure the relative distance of a word to the two reference words, called
“the evaluative factor (EVA)”. For example, measuring of word w is having semantic
closest with any words between “good” and “bad”: can be defined are shown in
Equation 2.9.
),(
),(),()(
badgoodd
goodwdbadwdwEVA
(2.9)
Where d is the distance between two words which obtain by used
semantic similarity approach as mentioned above. However, the boundary positions of
words on the opposite site are not entirely justified. Using the geometry of triangle
rule, the EVA function is redefined as Equation 2.10.
1 2
( ( , ) ( , )) (( ( , ) ( , ))( )
( , )
d w bad d w good d w bad d w goodEVA w
d bad good
(2.10)
In addition, there are other factors could be used, e.g., “the potency factor
(POT)” and “the activity factor (ACT)”. These factors used same equation with
the difference types of pair of word references.

47
According to those semantics similarity approaches as mentioned above,
the semantic similarity based on WordNet resource is an attractive approach to use in
the development of an efficient opinion mining framework that can handle with Thai
student’s feedback. Moreover, the LEXiTRON, SentiWordNet and Machine Learning
technique would be collaborate with WordNet to extract useful knowledge from
student feedback to indicate teaching performance of teacher.
2.3.3 Association Measurement
Extraction of collocation from a corpus is a well-known problem in
the field of natural language processing. It is typically carried out by employing some
kind of a statistical measure that indicates whether or not two words occur together
more often than by chance (Petrovic et al., 2006). There are three algorithms that most
widely used in extraction task as follows:
1) Pointwise Mutual Information (PMI): It is a measure that comes
from the field of information theory. It measures the amount of the occurrence of one
word from given information of the other word as Equation 2.11.
2
( )( ) = log
( ) ( )
P xyPMI x, y
P x P y (2.11)
Where x and y are words and P(x), P(y), P(xy) are probability of
occurrence of words x, y, and digram xy.
2) Chi-square test (2): It emerges from the fields of statistics which
deal with hypothesis testing. The hypothesis is accept “null-hypotesis” if “word x and
y occur together by chance”). It defined as Equation 2.12.

48
2
2 =
ij ij
i , j ij
O E
E (2.12)
Where Oij and Eij are observed and expected frequencies in a
contingency table.
3) The Log-Likelihood ratio (LL): It is a statistical test based on
the likelihood ratio, which expresses how many times more likely the data are under
one model than the other. Similarly Chi-square test, data are presented in contingency
table. It defined as Equation 2.13.
2 =
ij
ij
i , j ij
OG O log
E (2.13)
2.4 Opinion Mining
2.4.1 Overview of Opinion Mining
A popular field of data mining that deals with the human attitude and
their expression is “Opinion Mining (OM)” (a.k.a. “Sentiment Analysis”). OM is
interdisciplinary between Information Retrieval (IR) and Natural Language Processing
(NLP). The aim of OM is an attempt to take advantage from vast amounts of user’s
feedback by analysis and extracts with the sophisticated process and presents
the formal knowledge. Several researchers reviewed main processes and also
classified OM in several groups of characteristics e.g.; Bhuiyan, Xu and Josang
(2009); Lee, D., Jeong and Lee, S. (2008); Abbasi, Chen and Salem (2008); Tsytsarau
and Palpanas (2012). The overview of Opinion Mining can be depicted as Figure 2.5.

49
Figure 2.5 Overview of Opinion Mining
According to studying of Lee et al. (2008), OM research can be divided
into three major research areas, including:
I. Development of linguistic resource.
II. Sentiment classification.
III. Opinion summarization.
In the development of linguistic resource areas, researcher emphasizes to
construct linguistic resource for describing how authors express inter-subjective and
ideological position. This area involves with linguistics theory such as Appraisal
theory (Martin and White, 2005; Whitelaw, Garg and Argamon, 2005), Rhetorical
structure theory (Heerschop, Goossen and Hogenboom, 2011) and computational
linguistics. The result of this area is a lexicon that can be used as linguistics resource
for the two remaining areas.

50
The last two areas of OM research are “Sentiment classification” and
“Opinion summarization”. They are much overlapping of process and results (They
can be called “Subjectivity Analysis”). This subjectivity analysis composed of three
steps: i) identification, ii) classification and iii) aggregation. Identification and
classification steps are involved with sentiment classification process. The result of
these steps is producing sentiment values for texts paragraph. The identification step is
a task to identify text paragraph or sentence into factual (Objective) or opinion
(Subjective) texts. The classification step is to locate the position of texts on two
polarities (binary categorization) such as “positive/negative”, “good/bad”, or
classification on multi-classes categorization such as “positive/negative/neutral” (a.k.a.
“discrete categorization”). Furthermore, this step measured the numeral rates value of
opinion on each polar called “strength of polarity”. Esuli and Sebastiani (2005, 2006)
defined the steps of sentiment classification as three specific subtasks that are
1) Determining subjectivity: Deciding whether a piece of text is factual or subjective
(i.e. expresses an opinion about a particular topic), 2) Determining polarity: Deciding
whether the expressed sentiment of a subjective piece of text is positive or negative,
and 3) Determining strength of polarity: Grading the intensity of the expressed
sentiment in a subjective piece of text. The first task of these steps can be considered
as the identification step; while the two remain tasks are the classification steps.
Besides the step in sentiment classification, there is the last step of
opinion summarization that is the aggregation step. This step involved in aggregate of
sentiments scores (strength of polarity) from previous steps and presents them as
textual summarization, overall scores, feature scores, or visualizes them as graphs or
charts, etc. Overall, these steps are mostly utilized several sophisticated approach that

51
related with statistical and mining techniques, machine learning or artificial
intelligence (especially, involved with linguistics computational).
Considering of “Level of Analysis”, Bhuiyan et al. (2009) had studied
and proposed the taxonomy of OM which represented as a hierarchy structure.
Bhuiyan’s taxonomy divided OM into three sub-categories based on level of analysis
including: document level, sentence level and feature-based level. The process of
analysis is corresponding with the step in sentiment classification area.
Document level is classifying the overall sentiments expressed by
the authors of the entire document text (can be considered as text paragraph).
The purpose of this level is to determine whether the document is positive, negative or
neural about a certain object. The sentence level is subtle level that performs in two
steps: i) Identify each sentence as subjective or objective and ii) Classify and
determine their sentiment (positive, negative or neutral) whether it is a subjective
sentence. Furthermore, it is possible to analyze more subtle in phrase level (Wilson,
Wiebe and Hoffmann, 2005). The phrase level is related with noun/verb phrase of
sentences that is the source of opinion on object. The document and sentence level
always has roughness analyze (a.k.a. “Coarse-grained analysis”) (Clayton et al., 2011).
Recently, there is a special case of OM, named, “Feature-based level”. It is categorized
as “Fine-grained analysis” which is more detailed of analysis on feature of
the interesting object. Feature-based level comprise of three tasks: (i) Extract object
feature that are commented (ii) Determine their sentiment and (iii) Group feature
synonyms and produce a summary (Hu and Liu, 2004; Liu, 2011). The analysis
process of feature-based level is similar with general OM analysis process. However,
there is some difference in the aspect of this level considered and analyzed each

52
feature of an object as an independent object. The feature-based level is useful for
supporting the decision of customer who concerns on some features of an object.
In fact, basic process of analysis in feature-based level utilizes the coarse-grained
analysis.
Considering of “Approaches”, Tsytsarau and Palpanas (2012)
summarized approaches of OM analysis into four groups. They are 1) Machine
learning, 2) Dictionary, 3) Statistical, and 4) Semantic approaches. The machine
learning approach is a sophisticated solution that had been most frequently exploited
in the classification problem. Normally, this approach comprises of two-steps: (i) learn
the model from a training data, and (ii) classify the unseen data based on the trained
model. The dictionary approach relies on a pre-built dictionary that contains several
vocabularies and their meanings. The dictionary approach can also combine with
machine learning methods in order to analyze the opinion. The statistical approach
used the mathematical and statistical method as computational model. This approach
requires the large linguistics corpus. Frequency of word occurrence is used to identify
polarities of words. The semantic approach based on formal structure and annotated
dictionary. This approach use the relative shortest distance of “synonym” relation to
identify polarities of words. In addition, these approaches can be categorized into two
groups based on their resource used, that are corpus-based and dictionary-based
groups. The corpus-based group used unstructured data to find co-occurrence patterns
of words to determine the sentiment of words or phrases. The dictionary-based group
used synonyms and antonyms in structured data to determine word sentiments
(Bhuiyan et al., 2009). The approaches that classified as corpus-based group are

53
statistical approach and machine learning approach, and the remaining approaches are
in dictionary-based group.
Several existing works of OM, e.g., Mcdonald, et al. (2007), Yessenalina,
Yue and Cardie (2010), etc. revealed the trend of OM research in last few years.
They are focusing on analysis in subtle level, mixed of different level of analysis and
combine several approach of analysis. They give more fine grains of results and can
also summarize as overall of satisfactions on products or services.
Definition in Opinion Mining
In commercial field, there are some important basic terminology and
definition that related with “Opinions Mining” are described by Liu (2011: pp. 418-
422) as follows:
Definition (object): An object O is an entity which can be a product,
person, event, organization, or topic. It is associated with a pair,
O: (T, A), where T is a hierarchy of components (or parts), sub-
components, and so on, and A is a set of attributes of O.
Each component has its own set of sub-components and
attributes.
Example 1: A particular brand of cellular phone is an object. It has a set
of components, e.g., battery, and screen, and also a set of
attributes, e.g., voice quality, size, and weight. The battery
component also has its set of attributes, e.g., battery life, and
battery size.

54
Definition (opinion passage on a feature): An opinion passage on
a feature f of an object O evaluated in d is a group of
consecutive sentences in d that expresses a positive or negative
opinion on f.
Definition (explicit and implicit feature): If a feature f or any of its
synonyms appears in a sentence s, f is called an explicit feature
in s. If neither f nor any of its synonyms appear in s but f is
implied, then f is called an implicit feature in s.
Example 2: “battery life” in the following sentence is an explicit feature:
“The battery life of this phone is too short”. While, “This phone
is too large”. “large” is an implicit feature that imply to the Size
feature.
Definition (opinion holder): The holder of an opinion is the person or
organization that expresses the opinion.
Definition (opinion): An opinion on a feature f is a positive or negative
view, attitude, emotion or appraisal on f from an opinion holder.
Definition (opinion orientation): The orientation of an opinion on
a feature f indicates whether the opinion is positive, negative or
neutral.
2.4.2 Machine Learning and Statistical approaches for Opinion Mining
As described in previous section (Overview of opinion mining),
the opinion mining process consists of three sub-tasks: 1) Determining subjectivity

55
2) Determining polarity and 3) Determining strength of polarity. Determining
subjectivity task aims to decide the given sentence comprise of factual or opinion.
While the last two sub-tasks attempt to indicate the polarity direction of given opinion
sentence and identify the strength of these polarity direction. Follow of these sub-
tasks, the supervised machine learning is the most widely used technique that
implemented in opinion mining process. This section explains some well-known
features in opinion mining, supervised machine learning and statistical technique that
implement in opinion mining tasks (Sukhum, Nitsuwat and Haruechaiyasak, 2011;
Shelke, Deshpande and Thakre, 2012; Hajmohammadi, Ibrahim and Othman, 2012).
1) Feature types
To implement supervised machine learning technique in opinion
mining, the appropriate feature set is a necessary component to train a machine
learning model. There are several types of feature that used to train machine learning
model as follows:
- Words: word is common type of feature that used in opinion mining
process. It is basic structure of sentence. A word consists of sequence of consonants
and vowels. In English, each word is separated with the blank space character.
The punctuation character is used to indicate the boundary of sentence. While Asian
language e.g. Chinese, Japanese, Thai, etc. does not have the punctuation marks to
identify word or sentence boundary.
- Part-Of-Speech (POS): derived from word feature, POS is used to
indicate the function of each word in sentence. There are several types of POS defined
depend on their language. In WordNet, four types of POS include Noun, Verb,

56
Adjective and Adverb are defined. In ORCHID and NAiST corpus (as mentioned in
Section 2.2.1), several type of POS with more subtle categories are defined.
- Cues words: these words are the context word in sentence.
These words are useful to imply the given sentence consists of important information
such as “อยากให” (wish), “ควรจะ” (shall), etc. Also, includes “ดวยเหมอนกน” (too), “แตวา”
(but), and the negation word.
- Keywords and synonyms: Keyword and synonym words are
phrases or sets of word feature. Keywords are the important words in the interested
domain. Synonyms are the different words that have the same meaning with a word.
- Term position: the position is a feature type which probably effects
on decision of the polarity of sentence. This is the numeral value that obtained from
position of words or keywords in a sentence or paragraph. For example, In English
sentence, many words in text paragraph contains positive words throughout; however,
there is a presence of a negative sentiment at the end of sentence. It will influence on
deciding role to determine the sentiment of sentence.
2) Feature representation
To analyze those aforementioned features, there are two types of
feature representation includes 1) Term Frequency-Inverse Document Frequency and
2) N-gram (Pang, Lee and Vaithyanathan, 2002; Jotheeswaran, Loganathan and
Madhu Sudhanan, 2012).
- Term Frequency-Inverse Document Frequency (TF-IDF):
TF-IDF is a common type of data representation. This model is a vector space model
that considers the text paragraph as documents. A document (d) is represented as
vector (v) in the dimensional space of documents (D). The Term-Frequency (TF) is

57
the number of occurrence of this term is given by term frequency which denoted by
freq(x,d). The association of a term x with respect to the given document d is measured
by the term-frequency matrix TF(x,d). The term frequencies are assigned values
depending on the occurrence of the terms. TF(x,d) is assigned either zero, if
the document does not contain the term x. Otherwise, The number could be set as
TF(x,d) = 1 when term x occur in the document d. Beside direct use of term frequency,
the relative term frequency is a kind of term occurrence representation. It is the term
frequency versus the total number of occurrence of all terms in document. The term
frequency is generally normalized by Equation 2.14:
TF(x,d) =
0 ( , ) 0
1 log 1 log ( , )
freq x d
freq x d Otherwise
(2.14)
The Inverse Document Frequency (IDF) represents the scaling factor
of TF. The importance of a term x is scaled down if term occurs frequently in many
documents due to its reduced discriminative power. IDF(x) is defined as follows in
Equation 2.15:
IDF(x) = 1
logx
D
d
(2.15)
Where D is total number of document in corpus, xd is the number
of documents that contains term x. According to Equation 2.14-2.15 the complete of
TF-IDF model is obtained by multiplication of each TF(x,a) with their own IDF(x)
value. In case of misspelling, error typing, stemming, the syntactic or semantic
similarity computation can apply to decide the word is occurred in a document.

58
Moreover, the dimensionality reduction technique such as Principal Component
Analysis, Chi-Square Attribute selection, Information-Gain, etc. can used to obtain
the importance features.
- N-grams: Instead of using individual words as features. A technique
called “n-gram” is invented to generate dataset. The n-gram dataset is generated by
placing a small window over a sentence or a text, in which only n words are visible at
the same time. The simplest n-gram dataset is Unigram model (n=1). This is a model
in which we only look at one word at a time. In fact, n-grams start to become interesting
when n is two (a bigram) or greater. For example, a sentence “อาจารยพดเรวไปนดนง”
(Teacher speaks a little faster). After text segmentation process, the sequences of term
“อาจารย/ พด/ เรว/ ไป/ นดนง” are obtained. Variant length of n-gram data can generate
from this term sequences, For example:
Unigram: “อาจารย” , “พด”, “เรว”, “ไป”, “นดนง”
Bigram: “อาจารย_พด”, “พด_เรว”, “เรว_ไป”, “ไป_นดนง”
Trigram: “อาจารย_พด_เรว”, “พด_เรว_ไป”, “เรว_ไป_นดนง”
N-gram could apply with TF-IDF model or directly uses as features in
machine learning technique. In same fashion, n-gram can use with the Part-Of-Speech
features.
3) Machine learning and Statistical approaches
The machine learning provided benefits to decrease time-consuming
of human activity and still retain the efficiency equivalent with the human
performance. Recently, the machine learning becomes the popular technique that uses
in several tasks of opinion mining e.g. Wiebe and Riloff (2005) used the Naïve Bayes
classifier to identify subjective sentence, Bullington, Endres and Rahman (2007)

59
classified the genre of answer in open-ended question with Support Vector Machine.
Hu and Liu (2006) extracted product feature with the Class Sequential Rule
(an extended of association rules), Pang, Lee and Vaithyanathan (2002) classifies
the given sentence into binary-categories (positive or negative), etc. This section
explains the four well-known supervised machine learning technique that used in
opinion mining tasks including: 1) k-Nearest Neighbors, 2) Association Rules,
3) Naïve Bayes, 4) Support Vector Machine, and 5) Artificial Neural Network.
3.1) k-Nearest Neighbors
“k-Nearest Neighbors” (kNN) is a lazy learning method in
the sense that no model is learned from the training data. Learning only occurs when
a text example needs to be classified. kNN is simple and most yet effective classes of
classification algorithms in use. Their principle is based on the assumption that,
the class of a new yet unseen occurrence is likely to be that of the majority of its
closest “neighbor” instances from the training set. Thus the k-nearest neighbor
algorithm works by inspecting the k closest instances in the data set to a new
occurrence that needs to be classified, and making a prediction based on what classes
the majority of the k neighbors belong to. The notion of closeness is formally given by
a distance function between two points in the attribute space. An example of distance
function typically used is the standard Euclidean distance between two points in
an n-dimensional space, where n is the number of attributes in the data set. The kNN
algorithm is shown in Algorithm 2.1.

60
Algorithm 2.1: Basic kNN Algorithm
Input : D, the set of training objects,
z, the test object which is a vector of attribute values, and
L, the set of classes label
Output : cz L, the class of z
Steps :
For Each object y D do
Compute d(z,y), the distance between z and y;
end
Select N D, the set (neighborhood) of k closest training object
for z;
cz = arg max ( ( ))yy Nv L
I v class c
Where ( )I is an indicator function that returns the value 1 if its
argument is true and 0, otherwise.
Liu (2011) explain using of kNN algorithm in sentiment
classification as follows: Suppose we have two classes of data that is Positive class
() and Negative class (). The test data point is (). If 1-nearest neighbor (k=1) is
used, the test point will be classified as Positive class. If 2-nearest neighbor (k=2) is
used, the class cannot be decided. Because of there are different classes of two closest
neighborhoods. If 3-nearest neighbor (k=3) is used, the Positive class is assigned
corresponding with the majority class of its closest neighborhoods (as depicted in
Figure 2.6).

61
Figure 2.6 An example of kNN classification
3.2) Association Rules
“Association Rules” (AR) is a mining technique that attempts to
extract pattern of data co-occurrence relationships and represents in set rules
(Antecedent and Consequent) with their satisfaction score (Support and Confidence).
The classic application of association rule mining is used with the market basket data,
which aims to discover how items purchased by customers in a store are associated.
An example association rule is
“Cheese”, “Beef” “Beer” [Support=10%, Confidence=80%]
A rule consist of two measurements of rule strength that are
Support and Confidence. This rule says that there are 10% of customers buy “Cheese”,
“Beef” and “Beer” together, and those who buy “Cheese” and “Beef” also buy “Beer”
with 80% of the time.
The formal statement of association rule can explain as follows
(Agrawal, Imielinski and Swami, 1993): Let I = {i1, i2,…, im} be a set of items. Let D
be a set of transactions, where each transaction T is a set of items such that T I.
Associate with each transaction is a unique identifier, called its TID. We say that
a transaction T contains X, a set of some items is I, if X T. An association rule is
k=1
k=2
k=3

62
an implication of the form X Y, where X I, Y I, and X Y = . The rule X
Y holds in the transaction set D with confidence c, if c% of transactions in D that
contain X also contain Y. The rule X Y has support s in the transaction set D, if s%
of transactions in D contains X Y. The best known mining association rule algorithm
is the Apriori algorithm as shown in Algorithm 2.2.
Algorithm 2.2: Apriori algorithm (Liu, 2011)
Input : T, the set of transaction,
minsup, the threshold of minimum support,
Output : F, the set of overall frequent itemsets
Steps :
C1 all transaction T;
F1 {f | f C1, f.count/n >= minsup} # find 1-frequency itemsets
For (k=2; Fk-1 ; k++) do # find k-frequency itemsets
C1 Candidate-gen(Fk-1); # call Algorithm 2.2.1
For Each t T do
For Each c Ck do
If c is contained in t then c.count++;
end
end
Fk { c Ck | c.count/n >= minsup}
end
return F {F1 … Fk-1 Fk};

63
Algorithm 2.2.1: Candidate-gen function (used in Algorithm 2.2)
Input : Fk-1 , the set of transaction that have support value >= minsup,
Output : Ck , the candidate of frequent itemsets
Steps :
Ck ;
Forall f1, f2 Fk-1
with f1 = {i1, …, ik-2, ik-1} and f2 = {i1, …, ik-2, i’k-1}
and ik-1 < i’k-1 do
c {i1, …, ik-1, i’k-1}; // join the two itemsets f1 and f2
Ck Ck {c};
For Each (k-1)-subset s of c do
If (s Fk-1 ) then delete c from Ck ;
End
End
Return Ck ;
Association rule mining is loop works in two steps:
1) Generate all frequent itemsets: A frequent itemset is an itemset
that has transaction Support above minsup.
2) Generate all confident association rules from the frequent
itemsets: A confident association rule is a rule with Confidence above minconf.
In classification tasks, a technique called “Classification Based on
Association (CBA)” is a widely used technique in several fields (Liu, Hsu and Ma,
1998; Kim et al., 2009). In opinion mining, a type of rules set that obtain by
an extended of association rule called “Class Association Rule (CAR)” is used with
this technique. The idea to generate rules of CAR is a bit different from Apriori
algorithm, in aspect of all selected rules are fixed as consequent values as Class label.

64
To classification with CBA, there are three rules should be concerned to decide
the class for the new unknown data point when several association rules are appeared
(Waiyamai and Pongsiripreeda, 2005):
1) If the confidence value of rule no. 1 is greater than the rule
no.2, then rule no.1 is important than rule no.2.
2) If the confidence value of rule no. 1 is equals to rule no.2, then
considered the support value. If the support value of rule no. 1 is greater than rule
no.2, then rule no.1 is important than rule no.2.
3) If both of confidences and supports of all rules are equal,
the rule that early generating is important than another rules.
However, if several rules have same confidence and support
values are existed. The majority classes that obtained for these rules are assigned to
the new unknown data.
3.3) Naïve Bayes
“Naïve Bayes” (NB) is a simple probabilistic model based on
the Bayes rule along with a strong independence assumption. It involves a simplifying
conditional independence assumption. In text classification tasks, Naïve Bayes is
an effective algorithm; because of the conditionally independent of the data on each
other. This assumption does not affect the accuracy in text classification by much, but
this assumption makes fast classification algorithms applicable for the problem.
Moreover, it is particularly suited when the data inputs are high-dimensionality.
Naïve Bayes classifier assigns the class c* = argmaxc P(c | x), to a given document x.
This classifier is based on Bayes’ rule as shown in Equation 2.16.

65
( | )P c x = ( ) ( | )
( )
P c P x c
P x (2.16)
Where ( )P x plays no role in select c*. To estimate
the term ( | )P x c , Naïve Bayes decomposes it by assuming the xi are conditionally
independent given c class as shown in Equation 2.17.
( | )NBP c x := 1
( ) ( | )
( )
m
iiP c P x c
P x
(2.17)
Where m is the number of features and xi is the feature vector.
Consider a training method consists of a relative frequency
estimation ( )P c and ( | )iP x c . Despite its simplicity and the fact that it’s conditional
independence assumption clearly does not hold in real-world situations. Naïve Bayes
tends to perform well and optimal for certain problem classes with highly dependent
features. The computational example of Naïve Bayes classifier can be illustrated
below (Kantaradzic, 2003):
1) Given training dataset consisting of three features (A1, A2 and
A3) with target class (C). The objective is to assign the class to the new unknown data
point, X = {A1=1, A2=2, A3=2, C=?}. The detail of training dataset is as follows:
A1 A2 A3 C
1 2 1 1
0 0 1 1
2 1 2 2
1 2 1 2
0 1 2 1
2 2 2 2
1 0 1 1
1 2 2 ?

66
2) Compute prior probabilities P(C) of the classes:
P(C=1) = 4/7 = 0.5714 and P(C=2) = 3/7 = 0.4286
3) Compute conditional probabilities P(xt | ci) for every features
value of the new unknown X = {A1=1, A2=2, A3=2, C=?}:
P(A1 = 1 | C=1) = 2/4 = 0.50 and P(A1 = 1 | C=2) = 1/3 = 0.33
P(A2 = 2 | C=1) = 1/4 = 0.25 and P(A2 = 2 | C=2) = 2/3 = 0.66
P(A3 = 2 | C=1) = 1/4 = 0.25 and P(A3 = 2 | C=2) = 2/3 = 0.66
4) Under the assumption of conditional independence of features,
compute conditional probabilities P(X | C) will be:
P(X | C=1) = P(A1 = 1 | C=1) P(A2 = 2 | C=1)
P(A3 = 2 | C=1)
= 0.50 0.25 0.25 = 0.03125
P(X | C=2) = P(A1 = 1 | C=2) P(A2 = 2 | C=2)
P(A3 = 2 | C=2)
= 0.33 0.66 0.66 = 0.14375
5) Obtain the proportional value of P(C|X) by multiplying these
conditional probabilities P(X |C) with corresponding prior probabilities P(C):
P(C =1| X) P(X | C=1) P(C=1)
= 0.03125 0.5714 = 0.0179
P(C =2| X) P(X | C=2) P(C=2)
= 0.14375 0.4286 = 0.0616

67
6) Find their maximum of probabilities value:
P(C=? | X) = argmax{P(C =1| X) , P(C =2| X)}
= argmax{0.0179, 0.0616} = 0.0616
According to argmaxc P(c | x) results, the new unknown data
X = {A1=1, A2=2, A3=2} is belongs to the class C = 2 with the maximum probability
value 0.0616.
3.4) Support Vector Machine
“Support Vector Machine” (SVM) is a supervised machine
learning technique which developed by Vapnik in 1995. It has been applied
successfully in many text classification tasks and provides several principal
advantages: first, SVM is robust in high dimensional spaces; second, any feature is
relevant to use in classification; finally, it is robust when there is a sparsely set of
samples (Saleh, MartíN-Valdivia, Montejo-RáEz and UreñA-LóPez, 2011). In opinion
mining, Support Vector Machines have been applied in order to classify a set of
opinions as positives or negatives.
The basic idea of SVM is to find an optimal hyperplane to
separate two classes with the largest margin from pre-classified data. After this
hyperplane is determined, it is used for classifying data into two classes based on
which side they are located. By applying appropriate transformations (kernel function)
to the data spaces, then compute the separating hyperplane. SVM classification can be
depicted as Figure 2.7.

68
Figure 2.7 Supporting hyperplanes and margin of SVM
To build a classifier, SVM finds a linear function as Equation
2.18.
( )f x = bw x . (2.18)
So that an input vector xi is assigned to the positive class if
f(xi) ≥ 0, and to the negative class otherwise, as Equation 2.19.
yi = 1 0
1 0
if w x b
if w x b (2.19)
With the margin of SVM is (d+ + d- ) = 2
w
Khairnar and Kinikar (2013) demonstrated a computational
example of linear SVM classifier with 1-dimensional of dataset as follows:
1) Given training dataset consisting of one feature (X1) with
target class (C).
1 bw x
1 bw x
0 bw x
w
margin Y=1
Y=-1
d-
x
x
d+
b
w

69
X1 C
0 +1
1 -1
2 -1
3 +1
2) Kernel function plays vital role in SVM classification.
The appropriate transformation function (kernel function) uses to map these data
points to feature space. Commonly used kernel functions are “Linear function”,
“Polynomial function” and “Gaussian Radial Basis Function (RBF)” (Liu, 2011).
To demonstrate, a simple polynomial function is selected,
( )K x =
dx , where d = 2, is used. This means multiplying the X1 feature value to
power of 2 (X12). This mapping result is stored in X2 feature.
X1 X2 = K(X1) C
0 0 +1
1 1 -1
2 4 -1
3 9 +1
3) Finding the three hyperplanes that correspond with
following functions;
bw x = 1 (Positive class),
bw x = -1 (Negative class), and
bw x = 0 (Hyperplane).
These Equations can expand as follows:

70
- Positive class: w1x1 + w2x2 + b = 1
- Negative class: w1x1 + w2x2 + b = -1
- Hyperplane: w1x1 + w2x2 + b = 0
4) Solve w and b for Positive and Negative classes.
- Positive class: w1x1 + w2x2 +b = 1
w1(0) + w2(0) + b = 1 (data points no.1) and
w1(3) + w2(9) + b = 1 (data points no.4)
- Negative class: w1x1 + w2x2 + b = -1 (data points no.2 and
no.3)
w1(1) + w2(1) + b = -1 (data points no.2) and
w1(2) + w2(4) + b = -1 (data points no.3)
Using linear algebra with this simple example, the optimal
solution of above systematic Equations are w1 = -3, w2 = 1, and b = 1. Generally,
numerous of features in training dataset, the parameter estimation of SVM is
complicated process. Transforming of these Equation into Lagrangian form and using
a numerical optimization process called “Quadratic programming” is find solution.
5) Substitution these optimal value: w1 = -3, w2 = 1, and b = 1
in systematic Equations. The hyperplane of each classes are obtained as follows:
- Positive class: w1x1 + w2x2 + b = 1
(-3)x1 + (1)x2 + 1 = 1
x2 = 3x1
- Negative class: w1x1 + w2x2 + b = -1
(-3)x1 + (1)x2 + 1 = -1
x2 = -2 + 3x1

71
- Hyperplane class: w1x1 + w2x2 + b = 0
(-3)x1 + (1)x2 + 1 = 0
x2 = -1 + 3x1
6) New co-ordinate (X2) of each hyperplane is produced as
follows:
X1 X2 Hyperplane
(X2)
Positive
(X2)
Negative(X2) C
0 0 -1 0 -2 +1
1 1 2 3 1 -1
2 4 5 6 4 -1
3 9 8 9 7 +1
The margin of SVM can computed by 2
w :
Margin = 2 2 2
1 2
2
iw w w =
2 2
2
( 3) (1) = 0.6324555
To classify, the new unknown data point X1=2.8, w1 = -3, w2 = 1,
and b = 1. Substitute X1 value and compute X2 with polynomial kernel function.
w x b = w1x1 + w2x2 + b
= -3(2.8) + 1(2.82) + 1 = 0.44
According to Equation 2.18, this new unknown data point
obtained result greater than 0, it belongs to the +1 class.
Beside, using SVM in classification task, there is development of
SVM for function estimation called “Sequential Minimal Optimization algorithm for
Support Vector Machine Regression (SVR)” (Smola and Scholkopf, 2003). SVR has

72
the same properties as the traditional SVM which using the margin maximization and
kernel trick for non-linear mapping. The goal of SVR function is to estimate
the parameters weight vector (w) and bias (b) of function that best fit to the training
data. By approximating all pairs (xi,yi) from training dataset, while maintain
the differences between estimated values (y) and real values (y) under the soft margin
( precision). This idea can be depicted as Figure 2.8.
Figure 2.8 (A) Traditional SVM and (B) SVM Regression
(Smola and Scholkopf, 2003)
Similarly traditional SVM, the SVR can write as a convex
optimization problem. However, traditional SVM is not allowing some error that data
point are exceeds the margin. To deal with noise data in the training data, some
additional variables are applied in the soft margin of SVR function. The slack
variables () deal with infeasible constraints of the optimization problem by imposing
the penalty to the excess deviations which larger than , and an arbitrary constant C
(C > 0) is the trade-off parameter between the margin size and amount of errors.
The SVR can be revised as a primal optimization problem as Equation 2.20.
(A) (B)

73
Minimize 22 21
( ) ( , ), 02
ii
i
L C C w, w
Subject to ^
^
,
,
, 0
i i i
i i i
i i
y b
b y
w x
w x (2.20)
To obtained the optimize solution of weight vector (w), slack
variable () and bias variable (b), Equation 2.20 would be solved by using
the quadratics programming method, in Lagrangian dual problem form (See more
details, Smola and Scholkopf, 2003).
3.5) Artificial Neural Network
“Artificial Neural Network” (ANN) is a machine learning
technique which several previous studies indicated that it provided good performance
for many classification task (Sharma and Dey, 2012; Ghiassi, Skinner and Zimbra,
2013; Khatri, Singhal and Johri, 2014). The inspiration of ANN is biological neural
network model. The basic computational unit of ANN is a neuron. A neuron consists
of several dendrites which used to retrieve inputs data. These inputs were computed
and aggregated inside a cell body, than a result was passed to the terminal axon which
connects with other dendrites (synapse) of next neuron node. Based on this biological
characteristics, ANN simulate a set of computational processors which interconnected
and operated in parallel fashion in each own small sphere (as depict as Figure 2.9).

74
Figure 2.9 Biological and Artificial Neural Network Model
(Maltarollo, Hon rio and Ferreira da Silva, 2013)
In mathematical terms, a neuron of ANN (k) is the weight sum of
multiplication between inputs (x) and their weight (w) in m-dimensional. This process
can express in vector notation as a scalar product of two m-dimensional vectors
(as shown in Equation 2.21).
knet X W (2.21)
Where
0 1 2 0 1 2{ , , ,..., }, { , , ,..., } m k k k kmX x x x x W w w w w
Finally, an artificial neuron computed the output (yk) with a certain
function which used netk value as input. This function called “Activation functions”
(Equation 2.22).
( )k ky f net (2.22)
Some commonly used activation function are given in Table 2.6

75
Table 2.6 A neuron’s common activation function (Kantaradzic, 2003, p. 198)
Activation Function Input / Output Relation Example graphs
Hard Limit 1 0
0 0
if nety
if net
Symmetrical
Hard Limit
1 0
1 0
if nety
if net
Linear y net
Saturating Linear 1 1
0& 1
0 0
if net
y net if net net
if net

76
Table 2.6 A neuron’s common activation function (continued)
Activation Function Input / Output Relation Example graphs
Symmetric Saturating
Linear
1 1
1& 1
1 1
if net
y net if net net
if net
Log-Sigmoid 1
1
nety
e
Hyperbolic Tangent
Sigmoid
net net
net net
e ey
e e
There are several kind of Artificial Neural Network Models were
developed e.g. Discrete Hopfield, Kohonen Self-Organizing Map, Fuzzy Associative
Memory, Boltzmann Machine, Perceptron, Backprogagation, etc. (Suh, 2012).
In learning process of these ANN model, there are four common parameters which are
affected and used to determine performance of model as follows:

77
1) Number of Hidden Layers: in most neural network models,
the number of hidden layers is either manually decided at the beginning or is
determined automatically by the training dataset. For example, a multiple-layer
perceptron with continuous output, used non-linear function as activation function,
there is one hidden layer with an arbitrarily larger number of neuron nodes. However,
there is no unified theory yet as to how many hidden layers or nodes are needed.
2) Number of Hidden Nodes: there is no way of determining good
network architecture just from the number of inputs and outputs. Therefore, simply
trying several networks with different number of hidden nodes, and choose the one
with the least estimated generalization error is the best technique.
3) Early Stopping: Sometime neural-network model was learned
very long time, because it involves training and validation. To reduce this learning
time, a method called “early stopping” is used. It can perform as follows:
- Divide the available data into training and validation sets.
This can decrease the complexity of data.
- Use a large number of hidden nodes. The greater number of
nodes make easier to distinguish and generated the useful rules. But this also increases
calculation time.
- Use very small random initial values. An initial value usually
setting between -0.1 to 0.1. This small value prevents all nodes reach the same state.
- Use a slow learning rate. Slow learning helps to avoid
oscillation of the result.
- Compute the validation error rate periodically during training.
- Stop training when the validation error rate “starts to go up”.

78
4) Convergence Curve: To determine how many iterations process
should be stopped? The total mean-square error for the neural-network can be used to
determine the oscillation rate for convergence.
For classification, an Artificial Neural Network need to learning
pattern from training data, with some parameter setting as mentioned above.
An example learning process of ANN (Backpropagation) is illustrated in Algorithm
2.3.
Algorithm 2.3: Backpropagation Learning process (Suh, 2012)
1. Set the parameter of the network.
2. Set the uniform random numbers for weight vector Wxh, Why
and bias vector h , y.
3. Obtain an input training vector X and the desired output
vector T.
4. Calculate the output vector Y as follows:
[ ] [ ][ ] [ ] [ ]i
net h W i h X i h
4.1 Calculate the output vector H in the hidden layer.
4.2 Calculate the output vector Y (used activation
function).
[ ] [ ][ ] [ ] [ ] i
net j W h j H h j
[ ] ( [ ])Y j f net j
5. Calculate the value .
(1 )( )j j j j jY Y T Y
5.1 Calculate the value j in the output layer.
5.2 Calculate the value h.
(1 )h h h hj j
j
H H W

79
6. Adjust the weight.
6.1 At the output layer: ,hi jy j k y jW H
6.2 At the hidden layer: ,ih hx h i h hW X
7. Update W and .
7.1 At the output layer:
,hj hj hj j j jy y y y y yW W W
7.2 At the hidden layer:
,ih ih hj h h hh x x h h hW W W
8. Repeat steps 3-7 until the network converges.
With the advantage characteristic of ANN that deal with non-linearity
problem. Besides, using ANN in classification task, a type of ANN for regression task
was proposed by Hall et. al., (2009) called “MLPregressor”. This ANN is
implemented in “WEKA” application. It consists of a single-hidden layer of Multi-
Layer Perceptron (MLP). The difference of this model is using numerical optimization
method called “Broyden-Fletcher-Goldfarb-Shanno (BFGS) method” to obtain
optimized weight vector. These optimized weights are given by minimizing based on
the squared error plus a quadratic penalty (ridge parameter). The ridge parameter is
used to determine the penalty on the size of the weights. The “quadratic penalty”
refers to the squared sum of weights exclude the non-bias, which is multiplied by
the ridge parameter before being added to half the mean-squared error. All attributes
and target output are standardized. Instead of linear function, this regression model
used the logistic function as the activation function in each units of model.

80
3.6) Linear Regression
“Linear Regression” is a statistical technique to estimate or
predict an output value from given input data. The mechanic of regression is finding
the best line to fit between variables, so that one variable can be used to predict
the other. It can formal written as Equation 2.23 (Bhardwaj, n.d.; Kantaradzic, 2003).
Y X (2.23)
Where Y is dependent variable vector (responses), X is independent
variable vector (predictor), and , are regression coefficient. These coefficients can
be solved by the method of least squares, which minimizes the error between
the actual data points and the estimated line. The residual sum of squares is often
called the sum of squares of the error about the regression line and it is denoted by
SSE (as shown in Equation 2.24).
2 2 2
1 1 1
( ) ( )n n n
i i i i i
i i i
SSE e y y y x
(2.24)
Where y is the real output value given in the data set, and y is a
responses value obtained from the model. Differentiating SSE with respect to and
can written as Equation 2.25-2.26.
1
2 ( )n
i i i
i
SSEx y x
(2.25)
1
2 ( )
n
i i
i
SSEy ax
(2.26)

81
Setting these partial derivatives equal to zero (minimization of
the total error) and solve for the and , then re-arrange these result. The coefficient
and are obtained as Equation 2.27-2.28.
1 1
n n
i i
i i
y x
n n
(2.27)
1 1
1
2
2 1
1
n n
i ini i
i i
i
n
ini
i
i
y x
y xn
x
xn
(2.28)
For example, given the sample data in the form of a table (Figure 2.10
(left)). Computing the and coefficient follow the Equation 2.27 and 2.28.
The regression line can depict as Figure 2.10 (right).
x y
1 3
8 9
11 11
4 5
3 2
Figure 2.10 Linear regression line
Linear function is a simple case of prediction model with one input
variable. For several input variables, linear function is extends to Multiple Linear
1.031+0.920x

82
Regression model (MLR). MLR is used to model the linear relationship between
a dependent variable and one or more independent variables. MLR is based on least
squares: the model is fit such that the sum-of-squares of differences of observed and
predicted values is minimized. The model expresses the value of a dependent variable
as a linear function of one or more predictor variables and an error term (as Equation
2.9).
ikikiii exxxy ,2,21,1 ... (2.9)
Where xi,k is value of kth
input values, is regression constant, i are
coefficient on the kth
inputs and e is error term. With numerous of coefficient variables
estimation, the numerical iteration technique such as Newton-Raphson method,
Conjugate Gradient method, Expectation–Maximization method were popular used to
obtain the optimal solution instead of using Linear algebra.
These statistical approaches and well-known machine learning
technique are wildly used in several tasks of mining process. This work would
experiment with these well-known machine learning techniques on Thai student’s
feedback. The performance of machine learning on several types of features are
compared and presented in next chapter.
2.5 Related work
2.5.1 Opinion Mining in Non-Educational field
In the last decade, OM was an attractive field to study and review by
many researchers e.g., Abbasi et al. (2008), Zhou and Chaovalit (2008), Tsytsarau and

83
Palpanas (2012) summarized OM research from 1997 to 2009. Continuing from
the previous studies, this study review recent trend of OM research starting from 2010
to present and summarize in three perspectives as depicted in Figure 2.5. These three
perspectives consist of: 1) Research area: the areas of OM that previous studies are
concerned. 2) Level of analysis: these levels of OM that previous studies are analyzed,
and 3) Analysis approaches: the analysis approach that previous studies are used.
The selected of previous studies on OM with their experimental dataset are shown in
Table 2.7.
Table 2.7 Selected previous studies on OM (Non-Educational field).
Research
areas
Levels of
analysis
Analysis
approaches Experimental
Authors R1 R2 R3 L1 L2 L3 L4 A1 A2 A3 A4 Dataset
Year 2011
Bollegala, Weir and Carroll
(2011)
Product review
Drury and Almeida (2011) News corpus
Engonopoulos et al. (2011) Product review
Hu and Li (2011) Product review
Neviarouskaya, Prendinger
and Ishizuka (2011)
Develop Holistic
lexicon
Sarvabhotla, Pingali and
Varma (2011)
Movie review
Wang and Liu (2011) Telephone
conversation
Wu and Tan (2011) Product review
Xia, Zong and Li (2011) Movie review
Zhang et al. (2011) Product review

84
Table 2.7 Selected previous studies on OM (Non-Educational field) (continued)
Research
areas
Levels of
analysis
Analysis
approaches Experimental
Authors R1 R2 R3 L1 L2 L3 L4 A1 A2 A3 A4 Dataset
Year 2010
Balahur, Kabadjov and
Steinberger (2010)
Blogs
Das and Bandyopadhyay
(2010)
News corpus
Du et al.(2010) Product/Service
review
Fu and Wang (2010) News corpus
He (2010) Product review
Hui and Gregory (2010) Blogs
Kechaou, Benammar and
Alimi (2010)
Product review
Khan, A., Baharudin and
Khan, K.(2010)
Movie reviews
Nishikawa et al. (2010) Restaurant
reviews
Yan-Yan, Bing and Ting
(2010)
Product review
Yessenalina, Yue and
Cardie (2010)
Movie reviews/
Political debate
Research areas: (R1) Development of linguistic resource, (R2) Sentiment classification,
(R3) Opinion summarization
Levels of analysis: (L1) Document level, (L2) Sentence level, (L3) Word (Phrase) level, (L4) Feature-base
Analysis approaches: (A1) Dictionary approach, (A2) Machine learning approach,
(A3) Statistical approach, (A4) Semantic approach
Most of the previous studies are paid attention on the feedback of
customer in commercial fields. The commercial field is an attractive field because
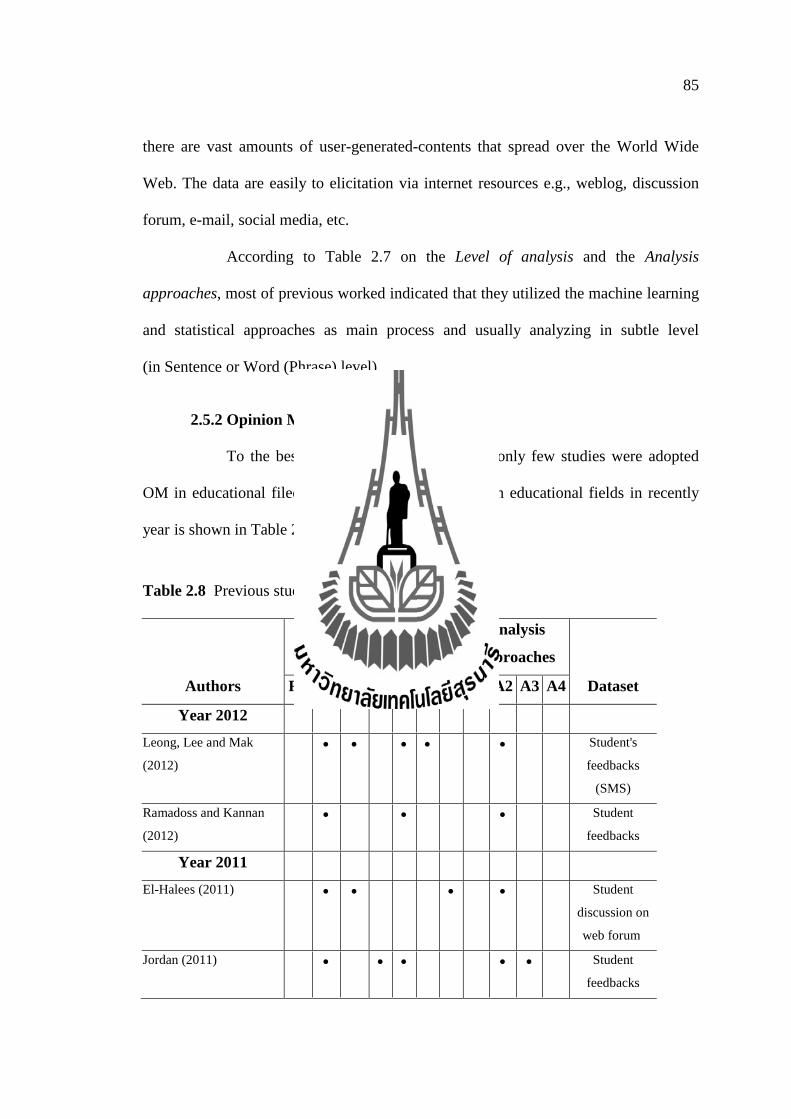
85
there are vast amounts of user-generated-contents that spread over the World Wide
Web. The data are easily to elicitation via internet resources e.g., weblog, discussion
forum, e-mail, social media, etc.
According to Table 2.7 on the Level of analysis and the Analysis
approaches, most of previous worked indicated that they utilized the machine learning
and statistical approaches as main process and usually analyzing in subtle level
(in Sentence or Word (Phrase) level).
2.5.2 Opinion Mining in Educational field
To the best of our knowledge, there are only few studies were adopted
OM in educational filed. The summarization of OM in educational fields in recently
year is shown in Table 2.8.
Table 2.8 Previous studies on OM (Educational field).
Research
areas
Levels of
analysis
Analysis
approaches
Authors R1 R2 R3 L1 L2 L3 L4 A1 A2 A3 A4 Dataset
Year 2012
Leong, Lee and Mak
(2012)
Student's
feedbacks
(SMS)
Ramadoss and Kannan
(2012)
Student
feedbacks
Year 2011
El-Halees (2011) Student
discussion on
web forum
Jordan (2011) Student
feedbacks

86
Table 2.8 Previous studies on OM (Educational field) (continued)
Research
areas
Levels of
analysis
Analysis
approaches
Authors R1 R2 R3 L1 L2 L3 L4 A1 A2 A3 A4 Dataset
Year 2010
Abd-Elrahman, Andreu
and Abbott (2010)
Student
feedbacks
Kannan and Bielikova
(2010)
Educational
feedbacks
Research areas: (R1) Development of linguistic resource, (R2) Sentiment classification,
(R3) Opinion summarization
Levels of analysis: (L1) Document level, (L2) Sentence level, (L3) Word (Phrase) level, (L4) Feature-base
Analysis approaches: (A1) Dictionary approach, (A2) Machine learning approach,
(A3) Statistical approach, (A4) Semantic approach
Kannan and Bielikova (2010) proposed a conceptual framework of
a system called “The Institution Ecosystem”. This conceptual framework used
K-means and Intuitive clustering approach to mining stakeholder’s feedbacks
(Employee, People, Parent and Student). Taxonomy from these feedbacks is created.
They visualize the data in high dimensional spaces. Pattern and relationships of
taxonomy was discovered through the correlation and classification technique.
Abd-Elrahman, Andreu and Abbott (2010) analyzed the data from course
evaluation. Manually categorizes are analyzed against with the automatically
co-occurrence counting categorizes. Five major elements of the teaching process were
defined: 1) Course, 2) Instructor, 3) Assessment, 4) Material, and 5) Delivery.
A simple statistical formula called “Teaching Evaluation Index (TEI)” is proposed.
TEI compute the ratios of counting data from both manners (Manual and Automatics)
into quantitative information. The result indicated that the performance of automatics

87
co-occurrence-base analysis and human manually has strong correlation and
correctness.
El-Halees (2011) used OM to evaluate the quality of course.
The student’s feedback sentences which discussed on web forum were selected as
resource. Differ from Abd-Elrahman, Andreu and Abbott (2010) as mentioned above,
five major features of teaching were extracted including: 1) Teacher, 2) Content,
3) Exams, 4) Marks, and 5) Books. The three popular machine learning methods:
K-nearest, Naïve Bayes and Support Vector Machine were applied to classify
feedback. The classifier was classifying feedback into bipolar of opinion (Positive and
Negative) following the five pre-defined features and visualizes opinion score as
bar graph of each feature in a course.
Ramadoss and Kannan (2012) proposed a teaching evaluation system that
collected the feedbacks from students. The purpose system consists of three types of
questions: 1) Rating scale question, 2) Multiple choices question, and 3) Short
descriptive question. They used OM to analyze the answer of short descriptive
question. The explicit features of opinion were extracted from rule-base patterns,
while the implicit feature is ignored. The result showed that the rule-base patterns
provided the highest rate of precision and recall.
Jordan (2011) explored the hidden dimensions of teaching quality from
the student’s feedback that questionnaire were not coverage. Text pre-processing
techniques (stop-word removing and word stemming) were applied to filter the noise
data. Inverse Document Frequency (IDF) and K-means algorithm were used as basic
process to analyze and identify the quality of teaching. Principle Component Analysis
(PCA) was used to reveal the core component that most students concerned.

88
The last but not the least, Leong, Lee and Mak (2012) proposed
a teaching evaluation system called “SMS Response management System (SMSRS)”.
This system is a platform independent web-application. The system allows audience in
a class to send their responses and feedback via Short Message Service (SMS).
SMSRS deal with the error typing and emotion expression in SMS. The feature and
opinion were extracted through rule-base patterns. The exploratory data analysis was
used to group each feature into a concept. The concept was visualized and ranked
as bar chart and network graph following the terms of frequency and percentage
of occurrence. These existing works as mentioned above are compared as shown
in Table 2.9.
Table 2.9 Comparison of existing work of OM in educational field
Authors Approach Representation Polarity
categorizes
Scoring
Kannan
and
Bielikova
(2010)
- Extraction:
Pattern matching
(Rule base)
- Classification:
K-means &
Intuitive clustering
- Taxonomy
hierarchical
- Visualization (high
dimensional spaces)
Binary-class
(Positive/Negative)
- Count of
word
occurrence
Abd-
Elrahman,
Andreu
and Abbott
(2010)
- Extraction:
Manual/Automatic
word counting
- Classification:
Matching with
keyword list
5 categories
(pre-defined from
comments)
1) Course 2) Instructor
3) Assessment 4)
Material and 5)
Delivery
Binary-class
(Positive/Negative)
- Count of
word
occurrence
:TEI index
(ratio of
Pos/Neg
word)

89
Table 2.9 Comparison of existing work of OM in educational field (continued)
Authors Approach Representation Polarity
categorizes
Scoring
El-Halees
(2011)
- Extraction:
Association rule
mining
- Classification:
Machine learning
(NB, kNN, SVM)
with keyword list
5 categories (pre-
defined from
comments)
1) Contain 2) Teacher
3) Exams 4) Marks and
5) Books
-Visualization (Bar
chart)
Multi-classes
(Positive/Negative/
Neural)
Count of word
occurrence
(% of Pos/Neg
word)
Ramadoss
and Kannan
(2012)
- Extraction :
Pattern matching
(Rule base)
- Classification :
Matching with
keyword list
15 categories (pre-
defined from close-end
questions)
Binary-class
(Positive/Negative)
Count of word
occurrence
Jordan
(2011)
- Extraction :
TF-IDF,
PCASVD
- Classification :
K-Means
3 majors categories
with 11 sub-categories
(pre-defined from
previous studies)
Multi-classes
(Positive/Negative/
Neural)
Count of word
occurrence
Leong, Lee
and Mak
(2012)
- Extraction :
Pattern matching
(rule base)
- Classification :
Exploratory data
analysis
Top 4 categories
1) Lecture 2) Pace 3)
Jokes and 4) Teacher
(ranking follows % of
word occurrence)
-Visualization
(Network graph)
Binary-class
(Positive/Negative)
Count of
linking
between word
on graph
Table 2.9 revealed that the sentiment classification and opinion summarization
are attracted research area in educational field. The machine learning and statistics
approach are the most popular processes to extract and classify data. Analyzing
was performed in sentence level. Data usually categorize into binary classes.

90
Several numbers of teaching characteristics are predefined and represented based on
the quantity of observed data (counting of word occurrence).
2.5.3 Opinion Mining with Thai language
Sriphaew, Takamura and Okumura (2009) described the potential process
for an opinion mining to work on some other language by applying the existing
methods with some language-specific information, labeled of the target languages and
machine translation services.
For subjective/objective identification, the simplest way to classify
whether the given text is subjective or objective is to use the terms or structure
of text as cues for identification. For example, a sentence that contains the term
which express the feeling such as “I think that” or “I feel that”, is usually subjective
sentence, or texts that are under the topic of “review” or “comment” can be assumed
as an opinionated texts. To apply this for Thai, the lexical cues can directly
defined in order to detect the subjective sentences from the objective ones, but
the pre-process of word segmentation and sentence boundary detection must be
applied beforehand.
For sentiment classification, several techniques have been developed to
find out the semantic orientation of the opinion. The orientation can be classified into
three classes named “positive”, “negative” and “neutral”. Sentiment classification can
be performed in different levels of granularity of text, i.e., word, phrase, sentence,
paragraph or document. Most of the techniques are based on machine learning
approach where the labeled data is provided for learning the classification model.
This is a main obstacle to the resource-scarce language such as Thai since such
labeled data is not available and it consumes considerable time and large human

91
efforts if we want to construct one. However, some techniques for cross-lingual
analysis can make it feasible by using machine translation services as tools to
translate the English labeled corpus to the other target languages, then applying
learning technique for cross-learning on the corpus.
In additional, extracting the features of the entities or topics are extracted
with their underlying opinions. A feature or aspect can be an attribute, component
or a function of an entity. For example, the picture quality, size and weight can be
the features of a camera. To implement this task, mining technique is applied to extract
the features or aspects of the entities by finding the noun phrases that are usually
occurred with the terms that express the opinion.
In the last decade, several Thai researchers attempt to develop an opinion
mining process that deals with Thai language. These previous work have
characteristics which correspond with the description by Sriphaew et. al.(2009).
However, it is experiments in commercial fields. List of previous work as follows:
Haruechaiyasak, Kongthon, Palingoon and Sangkeettrakarn (2010)
constructed Thai language resource for feature based opinion mining. These lexicons
were designed to distinguish lexicons into two types: Domain-dependent and Domain-
independent lexicons. The domain-dependent starts by setting the domain scope such
as digital camera. The next step is to design a set of features (main-features) and sub-
features associated with the given domain. Finally, the polar words lexicon is
constructed. These words represent either positive or negative views on features.
The other type of lexicon is domain-independent. It consists of with six different types
of words including: 1) Particles (ending word which make politeness sentence),
2) Negative words, 3) Degree words, 4) Auxiliary verbs, 5) Prepositions, and

92
6) Stop words. To collect more lexicons, linguistics patterns called “Dual pattern
extraction” is constructed to extract more features and polar word from the untagged
corpus.
Thumrongluck and Mongkolnavin (2011) developed an automatics
system to summarize Thai consumer product reviews. This system extract feature of
product by Term Frequency-Inverse Class Frequency (TFICF), an extended of TFIDF
model which consider co-occurrence between terms and classes. To determine their
polarity, the initial words list (seed words) is created, Then the related words is
expanded with WordNet. The Reverse-Distance-Weight (RDW) is a weighting score
technique for the opinion word term position that surrounds the feature word.
The summation of weight score is used to determine polarity direction.
Kongthon, Haruechaiyasak, Sangkeettrakarn, Palingoon and Wunnasri
(2011) extended the previous works of Haruechaiyasak et. al.(2010). The lexicon
about hotel reviews is used to develop an opinion mining system called
“HotelOpinion”. This system is a feature-based level that can compare between
difference hotels. Their polarities of each feature are obtained by summation of total
number of positive and negative words occurrence.
Sukhum, Nitsuwat and Haruechaiyasak (2011) studies to identify
the opinion sentence in political news. The performance of three well-known machine
learning techniques: k-Nearest neighbors, Naïve Bayes, and Support Vector Machine
against with several types of text features are compared. Experiments are conducted at
sentence level. The experimental results indicated that Naïve Bayes classifier with
prior-knowledge base features (Clue words, Keywords, and Name Entity) given
the overall performance (Precision, Recall, and F-measure) higher than 0.80.

93
Pongtanu, Rungwarawut, Arch-Int, N. and Arch-Int, S. (2012) classified
the customer satisfaction. The experiment performed at document level. The two
machine learning techniques: Decision tree and Naïve Bayes are compared against
with the term presence model of keywords. The results indicated that Decision tree
delivered an average of accuracy at 95.50%, while Naïve Bayes delivered an average
of accuracy at 95.33%.
Phawattanakul and Luenam (2013) mined the suggestion of Thai
television program reviews. The aim of this work is similar to the subjective/objective
identification tasks. The process of this works consists of two parts: 1) constructing
knowledge based and 2) classifying each suggestion in the reviews as either
“suggestion” or “non-suggestion” sentence. In first part, their knowledge base consists
of four types of words including: 1) Domain-dependency (DW), 2) Part-Of-Speech
(POS), 3) Domain wordlists (DW), and 4) Association wordlist (AW). The first two
are obtained with Thai text-processing application. The third word type is considered
and selected by expert domain, while the fourth word type is obtained by association
rules mining. To classify, this knowledge base is used to extract and tag the important
words in sentence. Combination of several word types are generated and represented
in TF-IDF model. The Support Vector Machine is used as classifier. The result
indicated that SVM with the feature that comprise the word, POS, and AW tagging
given the better performance (Precision is 0.83, Recall is 0.94, and F-measure is 0.88).
The last but not the least, Apisuwankun and Mongkolnavin (2013) extend
the previous work of Thumrongluck and Mongkolnavin (2011). This work aims to
identify the opinion strength score. A technique called “Human coder subjective
judgment” that derived from Thelwall et al. (2010) is used. This technique uses expert

94
to assign the strength score of individual word lists of bipolar in 5 scales (Positive: +1
to +5, Negative: -1 to -5). This score uses with some syntactic rules of word order.
For example, a word obtained 4 strength score of positive, if there is a negative word
appeared in front of them, the polarity will be inverted to negative. The training
dataset is generated from short sentence with these rules by fixed the strength score as
target class. Association rule mining is implemented to obtain the significant rules.
The opinion strength score obtained by summation of the strength score of overall
sentence.
According to the previous work, the machine learning technique showed
the significant of performance. However, the human effort is still required. This work
aims to develop a system which uses the hybrid approach that combines the machine
learning, statistical approach and semantic approach. The machine learning and
statistical approach provide the significant of performance, while the semantics
approach makes more accuracy of classification similar to using human manually.
Moreover, this work focuses in the educational domain. Thai student’s feedback is
analyzed in sentence level and represented as feature based level (fine-grain analysis).
This proposed system provides the benefit to indicate the quality of individual
teaching based on the good teaching characteristics categories.
2.6 Summary
According to the related theoretical and previous studies, there are only few
works, which adopted OM in the educational data. Most of the previous work of OM
is developed on European language. To the best of our knowledge, there is no

95
implementation of OM in order to analyze and extract information from educational
feedback that expressed in Thai Language.
Firstly, the social research technique is implemented to identify the component
of good teaching characteristics that correspond with Thai educational context.
Then study about adapt OM approach with Thai student's feedback and design
a framework to extract information form Thai student feedbacks.
Secondly, to develop a system that can be analyzed and extracted useful
information about teaching process from Thai student’s feedback. The process of
analysis is based on the opinion mining steps. Several instruments are implemented
e.g., Thai language applications, Linguistics resources, the machine learning
technique, statistical technique and semantics computational technique are combined
in order to develop this proposed system.
Finally, the useful information from this proposed framework are stored
in database. This information can be used to indicate the strength or weakness in
teaching process of individual teacher.
The rest of this dissertation is organized as follows: developing process of
a knowledge extraction system from online teaching evaluation system is described
in the Chapter 3. Chapter 4 explained the experiments and results of this study,
the conclusion and future work is presented in the Chapter 5.
CHAPTER 3
RESEARCH METHODOLOGY
This chapter presents the methodology to develop a framework to extract
knowledge and useful information from online teaching evaluation. Methodology of
this study is described as follows:
3.1 Methodology
3.1.1 Study of related theory and existing work
3.1.2 Framework modeling and development
3.1.3 Framework evaluation
3.2 Population and Samples
3.3 Research Instruments
3.3.1 Design and development instruments
3.3.2 Instruments for evaluation
3.4 Data Collection and Analysis
3.1 Methodology
This study is an “Applied research” which aims to develop a framework for
extracting knowledge and useful information about teaching process from Thai
student’s feedback. The Software Development Life Cycle process (SDLC) was
applied as the development process. Data mining and statistical approaches were used
as a core process of knowledge extraction. Appropriate information and knowledge

97
for improving teaching process are stored and represented via ontology model.
The conceptual framework of research methodology is depicted in Figure 3.1.
Figure 3.1 Conceptual framework of research methodology
3.1.1 Study related theory and existing work
The purpose of this step is to study theory that related with developing
process of an opinion mining framework for online teaching evaluation. Three main
theories are studied consisting of 1) Teaching factors and characteristics of good
teaching, 2) Thai language processing and applications, and 3) Opinion Mining.
Summary of these studies are described as follows:

98
1. Teaching factors and characteristics of good teaching
This study aims to analyze and identify whether factors and
characteristics of teaching influence to the quality of teaching process. As described
in previous chapter (Chapter 2: Table 2.1), several characteristics of good teaching are
identified by educationists and researchers. These factors can be roughly categorized
into six groups as follows: Knowledge, Preparation, Teaching technique, Assessment,
Material and Personality.
Several characteristics of good teaching are identified on their
different educational context. To identify the teaching characteristics which are
appropriate for Thai educational context. Summary of these good teaching
characteristics and social science research process is applied to identify the good
teaching characteristics in Thai educational context. The process of modeling and
refining are explained in the framework modeling and development section (Section
3.1.2).
2. Thai language processing
Summary of problems of Thai language and their application are
described as follows:
1) Thai language does not have the punctuation marks, such as space
or full stop to identify word or sentence boundary. Thai language also does not have
the capital letter.
2) The ambiguous of word meaning when appears in different
position in sentence or in different context.
3) There are special word genres, such as Name Entity,
Transliteration word or Phrase from word compounding.

99
4) Flexible of grammatical structure, e.g., some component of
sentence (subject or object) can be omitted.
Additionally, there is the effect of “Electronics grammar” e.g.,
the words, which are written follow speaking sound, repeating of vowel or characters,
using the group of symbols to represent their feeling called “emotion”, etc.
These special characteristics of written forms usually found in modern
communication system, e.g., Short-Messaging-Service (SMS), Web Board, Chats
room, Web Blog, Social media (e.g., Facebook, Twitter, etc.), and online teaching
evaluation.
To overcome these problems, Word segmentation and Part-Of-
Speech tagging application are prerequisite process. For Thai language, there are some
available application for Thai word segmentation such as “SWATH”, “LibThai”,
“KUcut”, “LexTo”, and “TLexs”. Application for Part-Of-Speech tagging, e.g.,
“SWATH”, “KUcut”, “Jitar (with NAiST model)”, and “OpenNLP” are presented.
There are other efforts to adopt the software as services via internet system such as
“Thaisemantics.org” and “KU Wordcut Demo”. There are two popular Part-Of-Speech
tagsets called “ORCHID tagset” and “NAiST tagset”.
Beside, application for text pre-processing, the linguistics resource
and dictionaries are used. The most popular referring linguistics resource is WordNet.
It is a general purpose linguistics resource with well-formed of structure.
The semantics similarity techniques based on WordNet is presented to solve the
ambiguity problem. The SentiWordNet is used as initial of opinion score. A Thai-
English dictionary called “LEXiTRON” would be used as supplementary linguistics
resource to link between Thai and English language.
100
3. Opinion Mining
The aim of Opinion Mining (OM) is an attempt to take advantage
from vast amounts of user’s feedback by analyzing and extracting useful information
with sophisticated processes. The research areas of OM can be divided into three areas
including: 1) Development of linguistic resource, 2) Sentiment classification, and
3) Opinion summarization.
The first area is “Development of linguistic resource”. This area aims
to develop a lexicon with word’s polarity. Bosco, Patti and Bolioli (2015) stated that
there are three main steps to develop a corpus: collection, annotation and analysis.
Each of them is strongly influenced by the others. For instance, the analysis and
exploitation of a corpus can reveal limits of the annotation or data sampling, which
can be respectively addressed by improving annotation and collecting more adequate
data. In order to automatically develop linguistic resource, several researchers used
sophisticated machine learning technique to extract and identify important words from
several available corpuses.
The second area is “Sentiment classification”. This area is a popularly
studied area that most researchers were paid attention. This area involved with
Identification and Classification steps. According to Esuli and Sebastiani (2005), steps
of Sentiment classification can be explained as three specific subtasks: 1) Determining
subjectivity, 2) Determining polarity, and 3) Determining strength of polarity.
The last one is “Opinion summarization”. It expected to allow all
possible reviews to be efficiently utilized by users. Given multiple reviews, the text
summarizer outputs consist of ordered sentences. A typical summary can be
considered as multi-document summarization. Existing summarizers focus on

101
organizing sentences to include important information in the given document into
a summary under some size limitation. Unfortunately, most of these summarizers
completely ignore coherence of the summary, which improves reader’s comprehension
as reported (Nishikawa, Hasegawa, Matsuo and Kikui, 2010).
Although, there are popular used of Opinion Mining however it only
spread over in commercial field. In the last decades, only few work study on
educational data, e.g., Kannan and Bielikova (2010), Abd-Elrahman, Andreu and
Abbott (2010), Jordan (2011), El-Halees (2011), Ramadoss and Kannan (2012), and
Leong, Lee and Mak (2012). These previous works on educational data, the machine
learning and statistical approaches were used as main process to mine these opinion
passages. Analyzing is operated on the feature set of interest object and analyze in
subtle level.
According to the fundamental theories as mentioned above, designing
and developing of an opinion mining framework for online teaching evaluation are
presented in the next section.
3.1.2 Framework modeling and development
In this section, an opinion mining framework for online teaching
evaluation is presented. This proposed framework was modeled and developed
correspond to the objective of this study consists of three important issues as follow:
1. Analyzing and modeling of good teaching characteristics
2. Design and develop an opinion mining framework for online teaching
evaluation
The first issue is answered the objective of studies that “To identify
the component of good teaching characteristics that corresponds with Thai educational

102
context”. The last two issues are answered the objective of this studies that “To design
and develop an efficient opinion mining framework for analyze student feedback from
online teaching evaluation corresponds to good teaching characteristics”.
1. Analyzing and modeling of good teaching characteristics
Several previous works, as discussed in Chapter 2, defined several
characteristics of good teaching. To refine and select items of good teaching
characteristics, which are appropriated and corresponded with Thai educational
context, the social research approach and Structural Equation Modeling (SEM)
technique are applied. SEM is a general term that describes a large number of
statistical models which are used to test and validate substantive theories with
empirical data. This technique combines a measurement model (or Confirmatory
Factor Analysis: CFA) and structural model into a simultaneous statistical test.
The patterns of relationships between factors (latent variables) that obtain from factor
analysis process are constructed based on the study of educational theory (Lei and Wu,
2007; Hoe, 2008; Jacobson et al., 2009). The process to analyze and model of good
teaching characteristics can be described as follows:
1.1. Population and Samples
The population is separated into two groups consisting of 1)
Faculty: the full time instructors at Suranaree University of Technology (SUT),
Thailand, and 2) Students: the learners who are studying undergraduate level at SUT.
The table for determining sample size (Krejcie and Morgan, 1970) was used to
determine of sample size. The total amount of sample units consisting of 97 SUT
faculty and 474 students were selected with the simple random sampling technique.

103
1.2. Development of Research Instruments and Quality testing
1) Review the educational textbooks, academic papers and
results of previous work that related to the teaching and learning process, and then
synthesizing the characteristics of the teaching process and good teaching
characteristics.
2) Synthesizing the list of good teaching characteristics items
(reviewing of literature as mentioned in Chapter 2). The Likert scale questionnaire
which consists of 66 items based on previous studies were constructed (Appendix A).
Initially, these questionnaire items are categorized into six component of good
teaching. The numbers of items of each component as follows: Knowledge (4 items),
Preparation (4 items), Teaching technique (28 items), Assessment (8 items), Materials
(4 items), and Personality (18 items).
3) The questionnaire was designed for answering two questions
including: 1) these question items are the good teaching characteristics that correspond
to Thailand’s learning context; and 2) these good teaching characteristic items are easy
to observe by students and/or easy to practice by teachers.
4) Quality testing of research instrument, The Index of Item
Objective Congruence (IOC) was computed to indicate validity of the question item
with objective of surveying. The Cronbach’s α-coefficient (Cronbach, 1951) is used to
indicate the reliability of overall questionnaire. This questionnaire was try-out with 30
students and 10 teacher of Suranaree University of Technology. The question items
are obtained IOC scores between 0.88 and 1.00, which above the minimum threshold
(at 0.50). In aspect of reliability of questionnaire, these questionnaires obtained a high
reliability rate at 0.983.

104
1.3. Data analysis
The Structural Equation Modeling (SEM) is used to confirm the
structure of good teaching characteristics model. The phase of data analysis is
separated into two stages: (1) Identifying and selecting the good teaching
characteristics that correspond with teaching and learning process and (2) Developing
the good teaching characteristics model. The process and statistical methods that are
used to analyze data can be described as follows:
1) Identifying and selecting items: the Index of Item Objective
Congruence method is adopted to analyze the closed-end questions. The items that
obtained the IOC score higher than the threshold value (at 0.50) will be identified as
characteristics of good teaching where the teacher and student are concerned.
2) Developing a good teaching characteristics model: This
phase consists of two stages; First stage is categorization the questionnaire items by
utilized the Exploratory Factor Analysis (EFA). This stage providing and confirming
the properly group of each questionnaire item and new terminology of good teaching
component were redefined. Moreover, the result of EFA produces new latent variables
which are used in SEM model, and Second stage, the second order Confirmatory
Factor Analysis (CFA) is computed to indicate the fitness of the model (Overall
structure of relationship between observed variable and latent variables) with
empirical data. The principal factors and factor loading value that affect the teaching
and learning process are presented as the final model.
Structure of good teaching characteristics model and statistical
indicator results are presented in Chapter 4.

105
2. Design and development of an opinion mining framework for
online teaching evaluation
Principal contribution of this study is to design and develop
a framework that can extract knowledge to indicate the strength or weakness of
teaching process from student’s feedback. The Opinion Mining (OM) is used as core
process of analyzing. Reviewing of literatures in previous chapter (in Chapter 2:
Opinion mining) is used as fundamental theory to design and develop this proposed
framework. Three main modules are; 1) Linguistic pre-processing, 2) Opinion
analysis, and 3) Aggregation and Visualization. The architecture of proposed
framework is shown in Figure 3.2.
Figure 3.2 The architecture of the proposed system
This framework retrieved free format text paragraph of student’s
feedback from the database of online teaching evaluation system. These paragraphs
are passed through the proposed system. The function of each module and processing
step can be described as follows:

106
1. Linguistic pre-processing
This first module can be considered as data cleaning and
preparing process. This module consists of two basic tasks including: 1) Spell-
checking/Repeated characters removing and 2) Tokenization/Part-Of-Speech tagging.
Spell-checking/Repeated characters removing task is to clean unwanted data in student
feedback paragraph by searching and replacing the redundant of characters. Also,
remove all symbols with regular expression. After that, in Tokenization/Part-Of-
Speech tagging, student feedback was segmented by using LexTo application. Part-Of-
Speech of each word was tagged by ApacheNLP application with ORCHID tagsets.
The final result of this module is set of word tokens with tagged Part-Of-Speech of
each word.
2. Opinion Analysis
This is the main computational module which is used to obtain
the opinion score from student feedback. Esuli and Sebastiani (2005, 2006) defined
the steps of sentiment classification as three specific subtasks, which are
1) Determining subjectivity, 2) Determining polarity, and 3) Determining strength of
polarity. In this work, three sub-modules of opinion mining are: 1) Feature/Opinion
extraction, 2) Polarity identification, and 3) Opinion phrase scoring. Processes of each
sub-module are described as follows:
2.1 Feature/Opinion extraction
This is the first task of proposed framework. It aims to
decide which word in tokens list are “Feature” or “Opinion” words. In previous
studies, identification and extraction tasks are usually rely on integration of the rule-
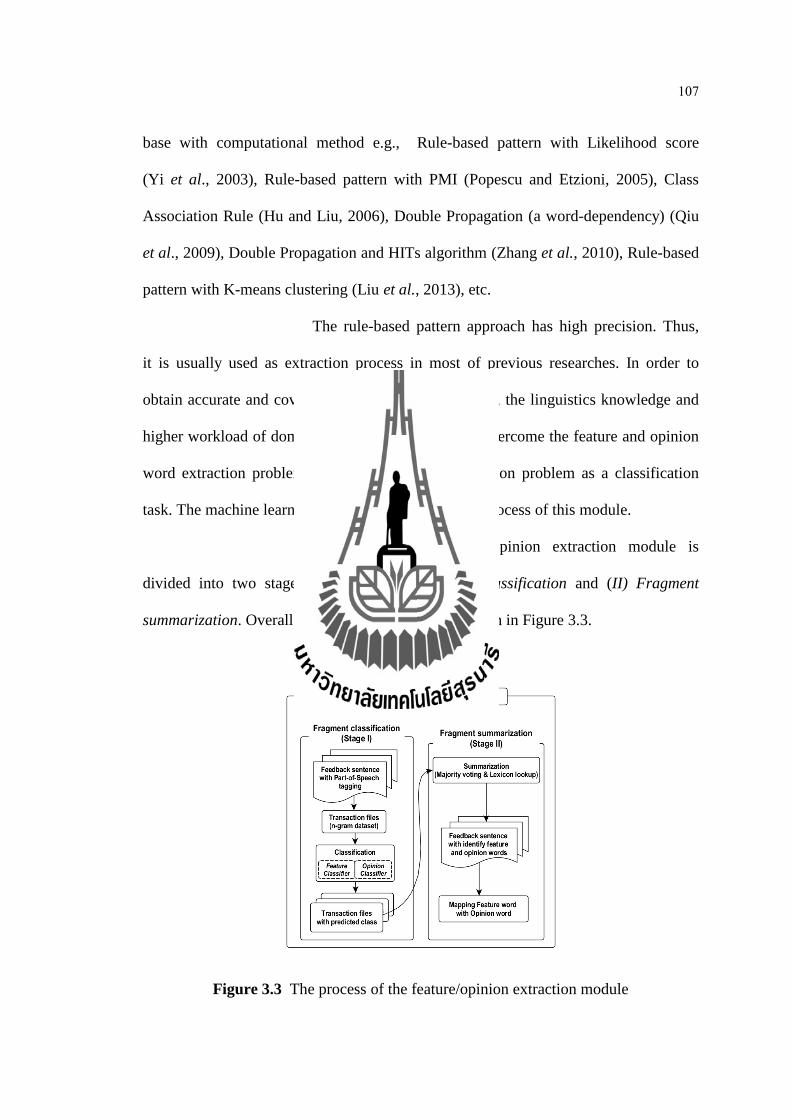
107
base with computational method e.g., Rule-based pattern with Likelihood score
(Yi et al., 2003), Rule-based pattern with PMI (Popescu and Etzioni, 2005), Class
Association Rule (Hu and Liu, 2006), Double Propagation (a word-dependency) (Qiu
et al., 2009), Double Propagation and HITs algorithm (Zhang et al., 2010), Rule-based
pattern with K-means clustering (Liu et al., 2013), etc.
The rule-based pattern approach has high precision. Thus,
it is usually used as extraction process in most of previous researches. In order to
obtain accurate and coverage of syntactic rules pattern, the linguistics knowledge and
higher workload of domain expert was required. To overcome the feature and opinion
word extraction problem, this work considers extraction problem as a classification
task. The machine learning approach is used as main process of this module.
Structure of this feature/opinion extraction module is
divided into two stages consist of (I) Fragment classification and (II) Fragment
summarization. Overall process of this module is shown in Figure 3.3.
Figure 3.3 The process of the feature/opinion extraction module

108
Fragment classification (Stage I)
The initial data of this stage are feedback sentence with their
Part-Of-Speech that obtained from previous module: Linguistic Pre-processing
(as shown in Figure 3.2). The vital technique of this stage is the two classifiers with
transaction files. Transaction file is the n-gram dataset. For classification, transaction
file and classifiers are generated as follows:
1) Transaction file generated from feedback sentence,
the n-gram technique is widely used in the text mining. The n-grams are used as
a process to generate a dataset for training the classifier. According to the experiment
of Hu and Liu (2006), the optimal size of n-grams is 3 word sequences. The example
of a 3-gram dataset which is generated from a sentence is shown in Figure 3.4.
2) Those 3-gram data records are arranged and stored in
a transaction file. The common structure of this transaction file consists of 6 variables
including: the first three variables are 3-gram words sequentially (TEXT1-TEXT3) and
the last three variables are Part-Of-Speech of each word (POS1-POS3) (Hu and Liu,
2006). To train the classifier, two copies of this transaction file are generated.
These two transaction files are “feature” and “opinion” dataset. They have different
target class variables (FCLASS and OCLASS). The FCLASS is target class for feature
dataset which is used to train the feature classifier. Likewise, the opinion dataset uses
the OCLASS as target class for training the opinion classifier.

109
Figure 3.4 Generating of n-gram data records
Both of target class variables consist of eight pre-defined
categories. These categories consist of 1) “000”, 2) “001”, 3) “010”, 4) “011”,
5) “100”, 6) “101”, 7) “110”, and 8) “111”. The values of class variables are adapted
from “IO” encoding method (Breck et al., 2007). The objective of each number
(“0” or “1”) is any bits that have “1” value indicate that the word at this position is a
candidate feature word in FCLASS transaction file; whereas “0” means this word is not
identified as a feature word. Similarly, these “0” and “1” used to identify an opinion
word position in OCLASS transaction file. To prepare these training datasets,
Thai native speaker is asked to assign the categories of class in each n-gram data
record. An example structure of the transaction file is illustrated in Figure 3.5.
3) Obtaining the best two classifiers, the machine learning is
trained to identify whether word position in n-gram fragment of feedback sentence.
The four machine learning techniques including: 1) Naïve Bayes (NB), 2) Support
Vector Machine (SVM), 3) K-nearest neighbor (KNN), and 4) Classification Based on

110
Associations (CBA) (Hu and Liu, 2006; Liu et al., 1998), are trained with feature and
opinion datasets in order to obtain the best classifier. The WEKA (The Waikato
Environment for Knowledge Analysis) (Hall et al., 2009) with their default parameters
and 10-fold cross-validations are used to trained and tested those classifiers. Finally,
the best two classifiers (Feature classifier and Opinion classifier) are selected for
classifying each n-gram data record into 8 categorizes as mentioned above.
The performances of classifiers are presented in Chapter 4. Then, these classification
results are forwarded as data input to the next stage II (the fragment summarization
stage).
Figure 3.5 A transaction file with classes tagging

111
Fragment summarization (Stage II)
According to the result of Stage I, those results are a part of
the original feedback sentence which breaks down into n-gram data records. To obtain
the complete results of extracting feature and opinion words of these sentences.
This stage utilized the simple technique called “Majority voting” which is used to
decide whether word in the overlapping position should be assigned as “0” or “1”.
1) The process of n-gram majority voting is shown in
Algorithm 3.1.
Algorithm 3.1: N-gram majority voting
Input : - M is Total number of n-gram data records of a sentence
- C is Set of classification result of n-gram data record (predicted
by classifier)
- k is Size of n-gram (k = 3)
- BCx is Counter of “0” and “1” votes
Output : - SC is fragment merged results of a sentence
Steps :
1. Set i = 1, SC = Ci
2. Set BC0[k+M-1] = BC1[k+M-1]={NULL}
3. Do while i < M ### Counting “0/1” step
Ci = Ci << (M-i), i = (i+1)
For j= i, j < (i+k), j++
Select case {Ci[j]}
Case 0 -> BC0[j]++
Case 1 -> BC1[j]++
Loop
Loop

112
4. For j = i, j < (k + M - 1), j++ ### Decision step
If BC0[j] = NULL and BC1[j] != NULL Then SC[j]=1
If BC0[j] != NULL and BC1[j] = NULL Then SC[j]=0
If BC0[j] <= BC1[j] Then SC[j] = 1
If BC0[j] > BC1[j] Then SC[j] = 0
Loop
5. Return SC
This n-gram majority voting process as illustrated above can
also be simple as depicted in Figure 3.6. Moreover, the lexicon lookup with fuzzy
string matching are implemented to indicate the position of stop words and well-
known words as feature or opinion word. Sukhum et al. (2011) suggested that list of
keywords is a technique which give benefit for improving the efficient of a system that
deal with natural language.
Figure 3.6 N-gram majority voting process

113
2) A string similarity method called “Jaro-Winkler” (Cohen
et al., 2003) is used to compare between the stop word list (Kesorn, 2013) (lexicon
lookup) and each word in a feedback sentence. The threshold value of similarity score
is set at 0.90. If the similarity scores more than the threshold, it would be fixed as “0”.
This process is shown in Figure 3.7.
Figure 3.7 String matching with Lexicon lookup
3) Finally, the final output of these steps is the feedback
sentence which having word position indicator of feature word and opinion word.
For identifying the opinion words, the same process is repeated with the opinion
classifier. The feature and opinion words are obtained by extract the word that have
“1” indicators.
4) There are several features and opinion words were
extracted. These words were mapped based on highest of Pointwise Mutual
Information (PMI) score. Finally, this extraction can be reduced as a feature word with
several of opinion words. The evaluation result of the Feature/Opinion extraction
sub-module is presented in Chapter 4.

114
2.2 Polarity identification
After the opinion words are obtained, a sub-module called
“Polarity identification” is performed. The aim of this sub-module is to categorize
the polarity of the opinion word into 3 categories. The main technique of this process
is slightly differs from previous sub-module. The machine learning technique is used
as a core process without using the majority voting in decision step. The three machine
learning classifiers are trained with this n-gram data set. Their performances are
compared, and then the best classifier was selected to be the polarity classifier.
Process of polarity identification sub-module can be depicted in Figure 3.8.
Figure 3.8 Process of the polarity identification module
In this module the machine learning was trained as follows:
1) Generating the training dataset: the dataset based on
n-gram are generated. This training data set consists of simple structure similar to
previous training dataset. It consists of 6 variables with 1 target class variable.

115
The 6 variables including: the first three variables (TEXT1-TEXT3) are the word
sequence from student feedback sentence. The last three variables (POS1-POS3) are
the Part-Of-Speech of each word in sequence. The target class is different from
previous training dataset (in Feature/Opinion extraction module). It consists of
3 categorizes that are “Positive”, “Negative”, and “Neutral”. To prepare these training
datasets, Thai native speaker is asked to assign the categories of class in each n-gram
data record. The example structure of this dataset is illustrated in Figure 3.9.
Figure 3.9 Polarity identification training dataset
2) The WEKA application is used to model the three
classifiers called 1) Naïve Bayes (NB), 2) Support Vector Machine (SVM), and
3) Decision Tree (DT). The WEKA default parameters were configured, and 10-fold
cross-validations method is used to train and test those classifiers. The best classifier is
selected as the polarity classifier. Similar to previous module (Feature/Opinion
extraction), the string matching technique with the known polarity word lists (e.g.
“However”, “But”, “Should”, “Needs”, “Best”, etc.) are used to fixed their polarity.

116
3) To identify their polarity, the context of opinion word that
obtained from previous module is used as n-gram data record. There are 4 rules to
arrange these words tokenize into the form of n-gram data record.
- If an opinion word has other words on both left and right
side, the opinion word is set as TEXT2, while the left word and the right word is set as
TEXT1 and TEXT3, respectively.
- If an opinion words only have the other words on
the right side, the opinion word is set as TEXT1, and the next two consecutive words
are set as TEXT2 and TEXT3, respectively.
- If an opinion word only has the words on the left side,
then the opinion word is set as TEXT3, while the previous two words are set as TEXT1
and TEXT2, respectively.
- If the size of n-gram is shorter than 3, the opinion word
is set as TEXT2. The other variables are replaced with Blank space and set their Part-
Of-Speech as punctuation (“PUNC”).
Then this n-gram data record is used to predict their
polarity with the best classifier as mentioned above.
4) Finally, a feature word is mapped with several opinion
words. With different polarity of several opinion word, a context-dependent rules list
which proposed by Romanyshyn (2013) is used to aggregate several polarity with
same feature word. The evaluation result of the polarity identification sub-module is
presented in Chapter 4.
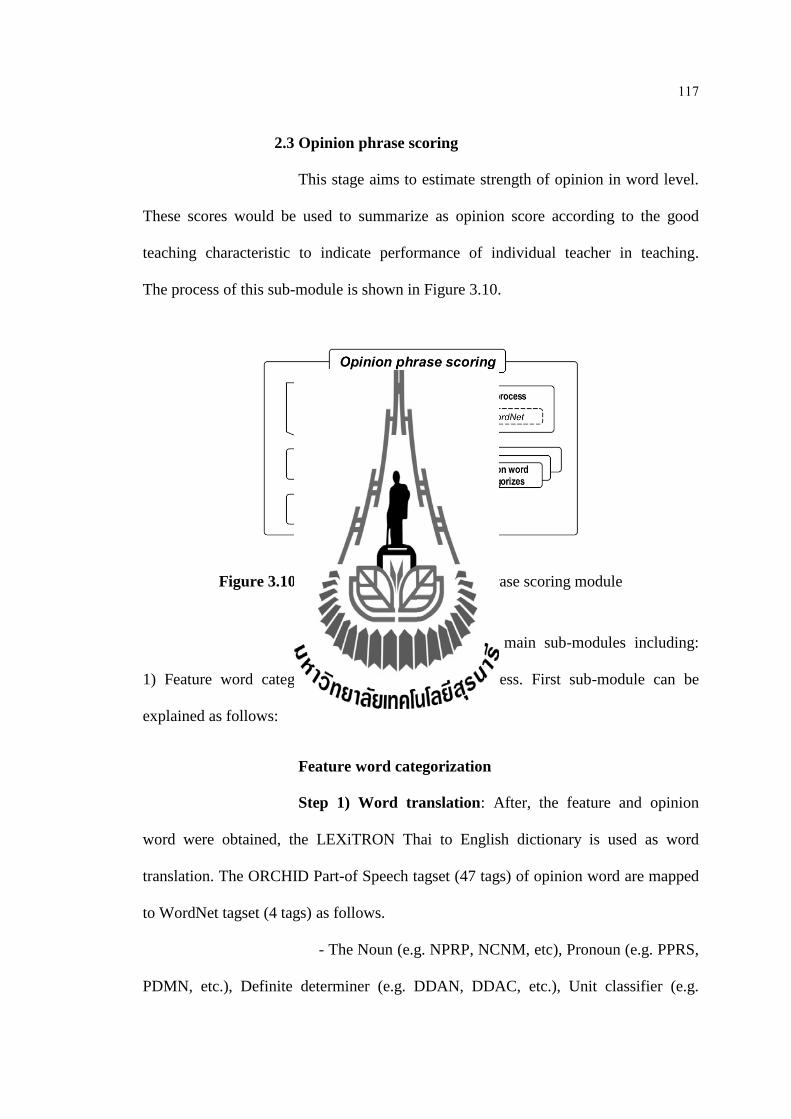
117
2.3 Opinion phrase scoring
This stage aims to estimate strength of opinion in word level.
These scores would be used to summarize as opinion score according to the good
teaching characteristic to indicate performance of individual teacher in teaching.
The process of this sub-module is shown in Figure 3.10.
Figure 3.10 The process of the opinion phrase scoring module
This module consists of two main sub-modules including:
1) Feature word categorization and 2) Scoring process. First sub-module can be
explained as follows:
Feature word categorization
Step 1) Word translation: After, the feature and opinion
word were obtained, the LEXiTRON Thai to English dictionary is used as word
translation. The ORCHID Part-of Speech tagset (47 tags) of opinion word are mapped
to WordNet tagset (4 tags) as follows.
- The Noun (e.g. NPRP, NCNM, etc), Pronoun (e.g. PPRS,
PDMN, etc.), Definite determiner (e.g. DDAN, DDAC, etc.), Unit classifier (e.g.
118
CNIT, CLTV, etc.), Prefix and Ending (e.g. FIXN, EAFF, etc.) are mapped as “n”
tags.
- The Verb (e.g. VACT, VSTA, etc.), Pre-verb auxiliary
(e.g. XVBM, XVMM, etc.) are mapped as “v” tags.
- The Adverb and Adjective (e.g. ADVN, ADVI, etc.) are
mapped as “a” tags.
- The Conjunction, Preposition and Interjection (e.g.
JCRG, JCMP, JSBR, RPRE, INT, etc.) are mapped as “r” tags.
Step 2) Categorize Feature word: this process attempts to
categorize the feature word into the appropriate category of good teaching
characteristics. Several semantic similarities via WordNet are computed with this
feature word. A feature word would be assigned as member of a category which
having maximum count of semantic similarity. The seed words (keywords of
each categorize) are used to compute semantic similarity with the feature word.
For example, Let the word “อธบาย” (Explain) and “ใสใจ” (Care) are Teaching
feature words. Given two sets of seed word from two categories as follow:
Teaching technique = {“lecture”, “demonstration”, “step”, “structure”,
“emphasis”, “collaborative”}
Personality = {“enthusiasm”, “willing”, “responsibility”, “honor”, “respect”,
“friendly}
Choose the three semantic similarity methods, e.g., Resnik
method, Adapted Lesk-Tanimoto method, and Jiang and Conrath method. Then,
compute their semantic similarity between the feature word and each seed words
(as shown in Table 3.1).

119
Step 3) Counting the majority vote: Maximum numbers of
similarity score of each categorize were counted. Following of above example,
the “Explain” word, the Resnik method and Jiang & Conrath method provided
maximum of similarity score with seed word of “Teaching technique” category. It has
2 out of 3 voter methods; therefore, the “Explain” word is assigned as member of
“Teaching technique” category. While, “Care” word, is assigned into “Personality”
category with 2 out of 3 voter methods.
Table 3.1 Demonstration of majority voting on semantic similarity
Resnik Adapted Leak Jiang & Conrath
Feature
word “Explain” n v a r n v a r n v a r
Teaching
technique
(C3)
lecture - 3.581 - - - 0.132 - - - 0.134 - -
demonstration - - - - - - - - - - - -
step - 2.943 - - - 0.067 - - - 0.099 - -
structure - - - - - 0.062 - - - 0.058 - -
emphasis - - - - - - - - - - - -
collaborative - - - - - - - - - - - -
Personality
(C6)
enthusiasm - - - - - - - - - - - -
willing - - - - - - - - - - - -
responsibility - - - - - - - - - - - -
honor - - - - - 0.119 - - - 0.073 - -
respect - - - - - 0.137 - - - 0.074 - -
friendly - - - - - - - - - - - -
Feature
word “Care” n v a r n v a r n v a r
Teaching
technique
(C3)
lecture 3.383 - - - 0.066 0.087 - - 0.085 0.070 - -
demonstration 3.383 - - - 0.088 - - - 0.122 - - -
step 4.595 - - - 0.104 0.079 - - 0.109 0.072 - -
structure 2.775 - - - 0.090 0.087 - - 0.096 0.059 - -
emphasis 3.169 - - - 0.040 - - - 0.090 - - -
collaborative - - - - - - - - - - - -

120
Table 3.1 Demonstration of majority voting on semantic similarity (continued)
Resnik Adapted Leak Jiang & Conrath
Feature
word “Care” n v a r n v a r n v a r
Personality
(C6)
enthusiasm 4.628 - - - 0.178 - - - 0.120 - - -
willing 4.100 - - - 0.146 - - - 0.076 - - -
responsibility - - - - 0.201 - - - 0.106 - - -
honor 3.169 3.132 - - 0.049 0.145 - - 0.097 0.098 - -
respect 4.628 3.132 - - 0.180 0.136 - - 0.087 0.100 - -
friendly 0.779 - - - 0.050 - - - - - - -
Scoring process
This framework used opinion score from SentiWordNet.
The SentiWordNet is a linguistic resource which provides opinion score of word that
related with WordNet synsets. Each word in SentiWordNet consists of two polarity
score that are “Positive” and “Negative”. There are several methods to use these scores
(as described in Chapter 2). In this work, the average scores of opinion word that
corresponded with their polarity can be computed as shown in following example:
Step 1) Identify polarity of opinion word: Suppose that
a feedback sentence is “อาจารยอธบายไดชดเจน”. This sentence was tokenized and Part-Of-
Speech tagged as “อาจารย (NCMN) / อธบาย (VACT) / ได (XVAE) / ชดเจน (ADVN)”.
The word “ชดเจน” was assigned as opinion word. Then, the polarity identification step
predicts it’s polarity to “Positive”.
Step 2) Translated opinion word: The opinion word
“ชดเจน” is translated as “Clearly” using the LEXiTRON dictionary. The Part-Of-
Speech “ADVN” was mapped as “a” in WordNet tagset. Text similarity method was
mapped between “Clearly” of LEXiTRON to “Clearly” word of SentiWordNet.

121
Step 3) Retrieving opinion scores: from all synsets of
the “Clearly” word from SentiWordNet (as shown in Figure 3.11). The arithmetic
mean of opinion score is used to compute score of “ชดเจน” as follows:
(0.250+0.125+0.000+0.375)/4 = 0.188 (of positive polarity)
Finally, the arithmetic mean of opinion score on each
categorizes are used as input variables to estimate good teaching characteristics level.
Indicating of good teaching characteristics level as explained in next section.
Figure 3.11 Opinion score from SentiWordNet
3. Aggregation and Visualization
As described in previous section, each good teaching
characteristic category was separately computed their opinion score. This module aims
to summarize all of those opinion score for indicating the quantitative levels of good

122
teaching characteristics of individual teacher. This proposed module consists of two
sub-modules are: 1) Good teaching characteristics aggregation and 2) Good teaching
visualization.
3.1 Good teaching characteristics aggregation
This step aims to indicate level of good teaching of
individual by aggregate all of opinion score for each category into a total good
teaching score. The machine learning for regression is vital technique to estimate these
good teaching level score as depicted in Figure 3.12.
Figure 3.12 Estimation of good teaching characteristic level
The step of good teaching characteristics aggregation is as
follows:
Step 1) Data preparation: in previous module, the feature
word and their opinion score from student feedback are obtained. 13 variables of input
data are used to train machine learning model. These variables consists of: 6 variables
of the average of opinion score on each categories, 6 variables of total number of
123
opinion words on each categorizes, and a variable of the total number of student
feedbacks are used as input data. The output of the process is numerical value to
indicate the level of good teaching.
Step 2) Aggregation model: the statistical and machine
learning techniques are employed to model an aggregator. This aggregator used to
summarize all input data as a numerical value of good teaching level. The WEKA is
used as modeling application. Four well-known machine learning techniques are used
as estimation model including:
- Multiple Linear Regression (MLR): it is
a statistical method which deals with several variables of input (x) to estimate one
output (y). This model is similar to the simple linear regression that tries to map input
and output on linear function. In WEKA, configurations of modeling environment are;
1) Using all variables of input data in regression function, 2) Eliminate co-linear
attributes, and 3) Ridge parameter is 1.0-E8.
- Support Vector Machine for Regression (SVR):
it is an implement of the Support Vector Machine for regression task. With
the characteristics of SVM, the optimal hyperplane of SVM can be considered as
regression function. To model the SVR, parameters setting are: 1) The polynomial
kernel ( , ) , pK x y x y is used, where p is 1, and 2) The RegSMOImproved
algorithm which proposed by Shevade et al., (2000) is selected as learning algorithm.
- Multilayer Perceptron (MLP): it is a feed-forward
of Artificial Neural Network. The learning algorithm of MLP is backpropagation
process. In WEKA, classification task all of node in each layers (the hidden and output
layer) used sigmoid function as activation functions. However, in case of estimation

124
task (the output as numeric value) the unthreshold linear function is used as activation
functions. The default parameter settings are: 1) the number of hidden layers is 1,
2) the number of nodes in hidden layer is 7. It is defaults number of nodes that can be
computed by number of variables (variables + class) divided by 2, and 3) the learning
rate and momentum are 0.3 and 0.2, respectively, and 4) All of numerical variables
are normalized.
- Multilayer Perceptron for Regression (MLPR):
a variant type of MLP which proposed by Hall et al., (2009). It consists of one hidden
layer and optimization class by minimizing the squared error plus a quadratic penalty
with the Broyden-Fletcher-Goldfarb-Shanno (BFGS) method. The ridge parameter is
used to determine the penalty on the size of the weights estimation. The logistics
function is used as activation function. Experimental configuration are; 1) the number
of hidden units is 7 (this number based on MLP method as described above).
2) The ridge penalty factor is 0.01 (default), and 3) Instead of using BFGS method,
the conjugate gradient descent method is used.
The model that delivered the highest performance would
select as good teaching level estimator of this proposed framework.
Step 3) Knowledge storing: this is final step which all of
extracted information about good teaching characteristics of individual teacher is
stored in a database or specific purposed of knowledge base e.g., Good teaching
characteristics ontology (Phiakoksong, Niwattanakul, and Angskun, 2013). The detail
of good teaching characteristics data consisting of; 1) Detail of individual teachers
(e.g. Teacher’s name, Teacher’s ID, etc.), 2) Student feedback paragraph,
3) The extracted feature word and their opinion, 4) The opinion score, 5) The average

125
of opinion score of each categories of good teaching characteristics, and 6) The level
of good teaching characteristics. The relation of these extracted information can
depicted in Figure 3.13.
Figure 3.13 Represent of knowledge storing of an individual teacher
In this aggregation process, the estimator (machine learning
model) is vital technique to obtain the good teaching characteristic level of each
individual teacher. The model performance is measured and presented in Chapter 4.
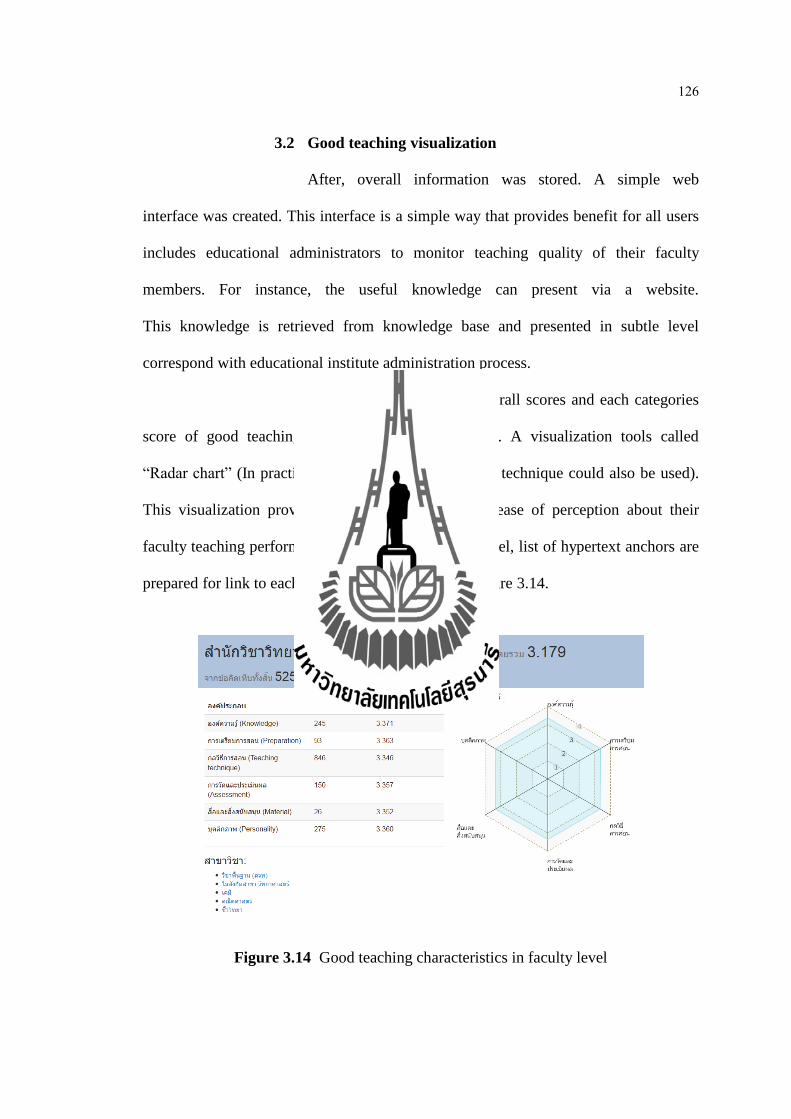
126
3.2 Good teaching visualization
After, overall information was stored. A simple web
interface was created. This interface is a simple way that provides benefit for all users
includes educational administrators to monitor teaching quality of their faculty
members. For instance, the useful knowledge can present via a website.
This knowledge is retrieved from knowledge base and presented in subtle level
correspond with educational institute administration process.
First of all, faculty level, overall scores and each categories
score of good teaching characteristics are presented. A visualization tools called
“Radar chart” (In practice, other types of visualization technique could also be used).
This visualization provided benefit for users in the ease of perception about their
faculty teaching performance. To consider in subtle level, list of hypertext anchors are
prepared for link to each department as depicted in Figure 3.14.
Figure 3.14 Good teaching characteristics in faculty level
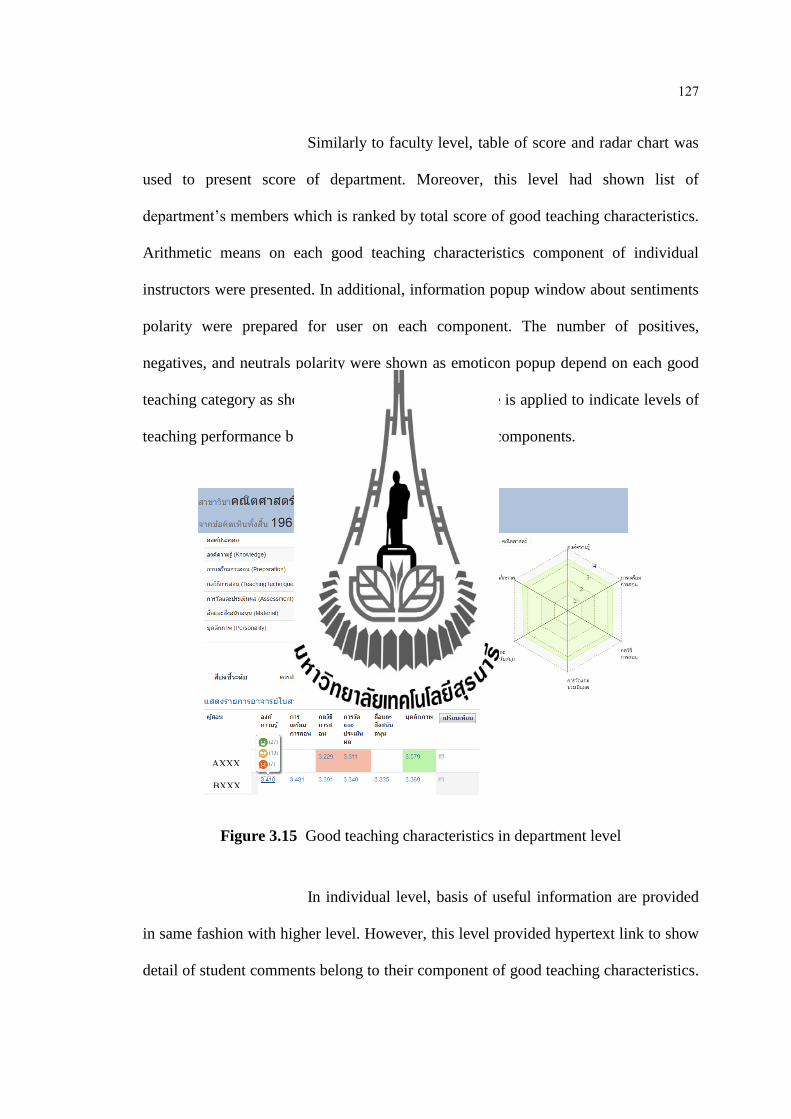
127
Similarly to faculty level, table of score and radar chart was
used to present score of department. Moreover, this level had shown list of
department’s members which is ranked by total score of good teaching characteristics.
Arithmetic means on each good teaching characteristics component of individual
instructors were presented. In additional, information popup window about sentiments
polarity were prepared for user on each component. The number of positives,
negatives, and neutrals polarity were shown as emoticon popup depend on each good
teaching category as shown in Figure 3.15. Color shade is applied to indicate levels of
teaching performance based on score on each teaching components.
Figure 3.15 Good teaching characteristics in department level
In individual level, basis of useful information are provided
in same fashion with higher level. However, this level provided hypertext link to show
detail of student comments belong to their component of good teaching characteristics.
AXXX
BXXX

128
The feature word and opinion word of each paragraph of student feedback were
markup as color (as shown in Figure 3.16).
Figure 3.16 Good teaching characteristics in individual levels
For administration, these teaching performances could
compare between individual teachers in their department which useful to indicate
strength or weakness in teaching process of their faculty members as shown in
Figure 3.17.
Figure 3.17 Comparison of Good teaching characteristics in individual levels
XXXXXXX XXXXXXX
AXXX BXXX CXXX DXXX AXXX
BXXX
CXXX
DXXX

129
3.1.3 Evaluation of quality and performance of system
In previous section (Modeling and developing the framework), there
are two important components that should be concerned. They are 1) the structure of
good teaching characteristics, and 2) the performance of the proposed framework to
analyze Thai student feedback. Evaluation of the quality and performance of this
proposed framework are as follows:
1) The structure of good teaching characteristics
The good teaching characteristics model is studied based on
several of good teaching characteristics that defined in previous work. Obtaining
teaching characteristics that suitable with Thai educational context, social science
research process is implemented. The items of good teaching characteristics from
previous studies are summarized as questionnaire. The questionnaire is used in
surveying the information from the Thai teachers and students in higher education
level. The good teaching characteristics are modeled by utilizing the Structural
Equation Modeling (SEM) technique. SEM is a set of statistical process that used to
extract the latent concepts and find their relationships.
1.1) Evaluation of good teaching characteristics structure
To indicate whether the quality of obtained model is
fitted with the empirical data. There are several statistical indicators were proposed.
Hooper, Coughlan and Mullen (2008) were summarized these statistical indicators and
their thresholds as shown in Table 3.2.

130
Table 3.2 Statistical indicators of SEM model fitting
Statistical indicators Criteria values
Chi-square (2) Low
2 relative to degrees of freedom (df),
where df=1
( ( 1))2
n n t with
an insignificant p-value (p > 0.05)
Root Mean Square Error of
Approximation (RMSEA)
Value less than 0.07
Goodness-of-fit index (GFI) Value greater than 0.95
Adjusted goodness-of-fit index
(AGFI)
Values greater than 0.95
Standardized root mean square
residual (SRMR)
Value less than 0.08
Comparative fit index (CFI) Value greater than 0.95
2) Performance of the prototype framework
Besides, the structure of good teaching characteristic that
proposed in previous section. The performance of computational process in
1) The opinion analysis module and 2) Good teaching aggregation and summarization
module are equally important. The sub-modules and overall performance were
evaluated as follows:
2.1) Evaluation of sub-module performance
The three sub-modules consists of; 1) Feature/Opinion
Extraction, 2) Polarity Identification, and 3) Good teaching characteristic aggregation.
The first two sub-modules were evaluated with the common indicators including:
Precision (P), Recall (R), f-measure (F) and Accuracy (A). The minimum threshold

131
value of performance is at least 80% of accuracy score. The correctness of
classification is represented as confusion matrix as shown in Table 3.3.
Table 3.3 Confusion matrix of classification
Predicted class
Yes (+) No (-)
Actual class Yes (+) TP FN
No (-) FP TN
Where, TP (True positives): These are cases in which
we predicted as Positive class, and they actually are the Positive class.
TN (true negatives): The cases were predicted as Negative
class, and they are not in Negative class.
FP (false positives): The cases were predicted as Positive
class, but they are not the Positive class (Also known as a “Type I error”).
FN (false negatives): The cases were predicted as Negative
class, but they are the Positive class (Also known as a “Type II error”).
Using these terms, the performance of classification process
can be evaluated as Equation 3.1-3.4.
( )
TPRecall
TP FN
(3.1)
( )
TPPrecision
TP FP
(3.2)
( )
TP TNAccuracy
TP FP FN TN
(3.3)

132
2( )
Precision RecallF measure
Precision Recall
(3.4)
In case of multi-classes classification, Macro-Averaged and
Micro-Averaged are used to present their overall performance (Sokolova and
Lapalme, 2009) as shown in Equation 3.5-3.6.
1
1
1
1
,
,
N
i
ir
N
i
ip
N
i
ia
N
i
if
Recall
MacroAvgN
Precision
MacroAvgN
Accuracy
MacroAvgN
F measure
MacroAvgN
(3.5)
1
1
1
1
1
1
,
( )
,
( )
( )
( )
2( )
N
i
ir N
i
i
N
i
ip N
i
i
N
i
ia N
i
i
p r
f
p r
TP
MicroAvg
TP FN
TP
MicroAvg
TP FP
TP TN
MicroAvg
TP FP FN TN
MicroAvg MicroAvgMicroAvg
MicroAvg MicroAvg
(3.6)

133
The last sub-module aim to estimate opinion scores and
indicated the good teaching characteristic score that related with teaching evaluation
score. The statistical indicators including: 1) the Mean Absolute Error (MAE) and
2) Root Mean Squared Error (RMSE) are used to compare performance of model.
The MAE and RMSE are represented as Equation 3.7 and 3.8, respectively.
1
1 n
t t
t
MAE A Fn
(3.7)
2
1
1 n
t t
t
RMSE A Fn
(3.8)
Where, At is actually score of teaching evaluation score of
a teacher (t), Ft is estimated score of a teacher (t), and n is total number of teacher.
2.2) Evaluation of overall performance
The second objective of this work state that the expected
performances of this propose framework has the high correlation with individual
teaching evaluation score. To measure this correlation, the good teaching
characteristics score from the proposed framework is measured against the total
teaching evaluation score from close-end question. The Spearman’s rho rank
correlation () is used to indicate this performance. If X and Y are ranks, simplify
the Pearson product-moment correlation coefficient (r) formula yields the following
expressions as shown in Equation 3.9.
2
1
3
6
1
N
i
i
d
N N
(3.9)

134
Where, di=Xi-Yi is the difference in ranks of the two
variables, and N is number of pairs between X and Y. The correlation coefficients
always lie between -1 and +1. The more the correlation coefficient comes closer to -1
or +1. The sign symbol indicates the direction of correlation. The plus (+) sign shows
that if X have higher ranking than the Y, it would have high ranks belong to X.
The minus (-) sign is vice versa. The interpretations of spearman’s rho rank correlation
level are shown in Table 3.4.
Table 3.4 Strength of correlation value (Hinkle, Wiersma, and Jurs, 1998)
Interpretation of
correlation value
0.90 - 1.00 Very strong
0.70 - 0.89 Strong
0.50 - 0.69 Moderate
0.30 - 0.49 Weak
0.00 - 0.29 Very weak
3.2 Population and samples
To identify good teaching characteristics that corresponds with Thai
educational context. The population and samples for good teaching characteristic
model is separated into two groups consisting of 1) Faculty: the full time instructors at
Suranaree University of Technology (SUT), Thailand, and 2) Students: the learners
who are studying at the undergraduate level at SUT. The table for determining sample
size (Krejcie and Morgan, 1970) was used to determine sample size. The total amount

135
of sample units consisting of 97 faculty and 474 students were selected with
the simple random sampling technique.
3.3 Research Instruments
The instruments that utilized in this study divided into two groups including:
1) Design and development instruments and 2) Evaluation instruments.
3.3.1 Design and development instruments
In this section, two groups of instruments are presented.
1) Good teaching characteristics questionnaire: this questionnaire is
construct based on summary from previous defined of good teaching characteristics.
It consists of 66 question items with two types of answer that are:
1.1) Three choices answer: it comprises “Yes, certainly (+1)”,
“Uncertain (0)”, “Absolutely not (-1)”. This type of answer is used to identify items
that are characteristics of good teaching, which appropriate with Thai educational
context and
1.2) Rating scales (5 scales): this questionnaire is used to model the
good teaching characteristics model for surveying data.
2) Instrument for design and develop the proposed system: selected
applications and online services that have been utilized to develop the propose system
is listed below:
- Java Development Kit 6 Update 20 or above
- LexTo: Thai Lexeme Tokenizer
- Apache OpenNLP version 1.4.3 (ORCHID tagset)
- SentiWordNet (Linguistics resources)

136
- WordNet (Lexical database of English)
- LEXiTRON, (Thai-English dictionary)
- WS4J: WordNet Similarity for Java
- WEKA 3.7.10 (Waikato Environment for Knowledge Analysis)
3.3.2 Instruments for Evaluation
Three instruments are used in evaluation process including:
1) LISREL: It is a windows application which consists of several
statistical packages for analyzing and modeling data such as Structural Equation
Modeling, Multilevel Structural Equation Modeling, Multilevel Linear and Nonlinear
Modeling, Formal Inference-based Recursive Modeling and Generalized Linear
Modeling. This study used the LISREL version 8.72 to analyze and model the good
teaching characteristics.
2) Weka3 (Data Mining Software in Java): the Weka is a collection
of machine learning algorithms for data mining tasks. The algorithms can either be
applied directly to a dataset or called from Java code. Weka contains tools for data
pre-processing, classification, regression, clustering, association rules, and
visualization. It is also well-suited for developing new machine learning schemes (Hall
et al., 2009).
3) SPSS (Statistical Package for the Social Sciences): It was
an integrated set of programs for the management and statistical analysis of social
science data, developed especially for the processing and analysis of data from
questionnaire surveys.

137
3.4 Data Collection and Analysis
There are two phases of data collecting and analyzing processes including:
1. Good teaching characteristics model: to analyze the good teaching
characteristics, the steps of collecting data are as follows:
- The good teaching characteristic questionnaire are disseminate to
the sample group (97 faculty and 474 students of Suranaree University of
Technology).
- Given three weeks to collect the answered questionnaire from the sample
group.
- Questionnaire’s answer is encoded in appropriate format for LISREL
application.
- Good teaching characteristics are modeled. The LISREL is used to fit
model and the statistical indicators were computed. The important indicators that
described in previous section (Section 3.1.3: Evaluation of quality and performance of
system) are compared with the output statistical values to indicate the quality of model
is fitted with the empirical data.
2. Performance of the proposed framework: the student’s feedbacks are
sampling from the Online Teaching Evaluation system of Suranaree University of
Technology. These feedbacks are used in process of design and develop framework
for mining student feedbacks. The performance of the three sub-modules consists of;
(1) Feature/Opinion Extraction, (2) Polarity Identification, and (3) Good teaching
characteristic aggregation, are measured via the WEKA and SPSS software.

138
According to the research methodology process as mentioned above,
the experimental results and their performances are described in Chapter 4 and
the conclusion and suggestion for future research are presented in Chapter 5.

CHAPTER 4
EXPERIMENTAL RESULTS AND DISCUSSIONS
This chapter presents the result of modeling and developing a framework
to extract knowledge and useful information from online teaching evaluation.
The first two sections will be presented the experimental result and their performance
and last one is discussion section as follows:
4.1 The experiment and result of good teaching characteristics model
4.1.1 Evaluation of good teaching characteristics model
4.2 The experiment and result of the proposed framework
4.2.1 Evaluation of sub-module performance
4.2.2 Evaluation of overall performance
4.3 Discussions
4.3.1 The results of the hypothesis testing
4.3.2 The discussion of imperfect results
4.1 The experiment and result of good teaching characteristics
model
Following the first objective of this study, that is “To identify the component
of good teaching characteristics that corresponds with Thai educational context”.
The social research process is implemented and their results are described in next
section:

140
4.1.1 Evaluation of good teaching characteristics model
Experimental process:
1. The population is separated into two groups consisting of 1) Teachers:
the full time instructors at Suranaree University of Technology (SUT), Thailand, and
2) Students: the learners who are studying at the undergraduate level at SUT. The table
for determining sample size (Krejcie and Morgan, 1970) was used to determine sample
size. The total amount of sample units consisting of 97 teachers and 474 students were
selected with the simple random sampling technique.
2. Synthesizing the list of good teaching characteristics items from
reviewing of literature as mentioned in section 2.1. The questionnaire which consists
of 66 items based on the 6 teaching components were constructed (in Appendix I).
The numbers of items of good teaching characteristics are roughly grouped as follows:
Knowledge (4 items), Preparation (4 items), Teaching technique (28 items),
Assessment (8 items), Materials (4 items), and Personality (18 items).
3. Testing the quality of questionnaire, The Index of Item Objective
Congruence (IOC) and The Cronbach’s α-coefficient (Cronbach, 1951) was computed.
These question items are obtained IOC scores (for validity measurement) between
0.88 and 1.00, which above the minimum threshold (at 0.50). In aspect of reliability of
questionnaire (based on Cronbach’s α-coefficient), these questionnaires obtained
a high reliability rate at 0.983.
Experimental results:
1. Identifying of good teaching characteristics items: The 66 items of
closed-end questions with 3 choices of answers (“Yes, certainly (+1)”, “Uncertain
(0)”, “Absolutely not (-1)”) are answered by the samples. To indicate items that are

141
good teaching characteristics, the IOC score is adopted. The value of IOC at 0.50 is
determined as a threshold. Any items of the questionnaire those are equal or higher
than 0.5 are selected as good teaching characteristics. The IOC result is shown in
Table 4.1.
Table 4.1 Identifying and selecting good teaching characteristics items
Initial Number IOC score
Good teaching of selected Teacher Student
components items Min-Max Average Min-Max Average
Knowledge 4 1.00-1.00 1.00 0.95-0.97 0.96
Preparation 4 0.98-1.00 0.99 0.97-0.98 0.97
Teaching
T technique
28 0.89-1.00 0.97 0.96-0.99 0.97
Assessment 8 0.96-1.00 0.98 0.95-0.97 0.97
Materials 4 0.83-1.00 0.94 0.97-0.98 0.98
Personality 18 0.94-1.00 0.98 0.97-0.98 0.98
Total 66 0.83-1.00 0.98 0.95-0.99 0.97
The results in Table 4.1 illustrated that the teachers and students
indicated all of questionnaire items (66 items) describe the characteristics of good
teaching. The teacher has given the IOC scores between 0.83 and 1.00. Teachers
indicate that the knowledge (1.00) and preparation (0.99) are important factors of
teaching characteristics. While the student indicated that the personality (0.98) and
materials (0.98) are important factors of teaching characteristics in the aspects of
students. These questionnaire items are used to develop a good teaching characteristics
model.
2. Developing a good teaching characteristics model: Afterward, the 66
items with 5 point Likert scales questionnaire are answered. The Exploratory Factor

142
Analysis (EFA) and the second order Confirmatory Factor Analysis (second order
CFA) are used to develop a good teaching characteristics model.
2.1) In the first stage, the EFA is employed to extract the principal
factors (latent variables) and factor loading scores of each component. These principal
factors are assigned as variables in the stages of model development. The factor
loadings (the 1st factor loading) of these principal factors are obtained.
2.2) In the second stages, the second order CFA was used to model
the good teaching characteristics from these principal factors. The factor loadings of
the six core components are obtained (the 2nd
factor loading). After that some
conceptual key terms were redefined for covers the meaning of questionnaire items in
each group as follows:
- “Knowledge” still used the original conceptual terminology.
It describe about content and practical knowledge for teaching and answering the
questions of students.
- “Teaching preparation” was used instead of “Preparation”. It
covers about preparation to teach (contents, process, and materials) before actual
teaching.
- “Teaching techniques and strategies” was used instead of
“Teaching technique” which covers about individual teaching technique and teaching
plan (long term teaching plan) to transfer knowledge to their students, and also include
ability to control his/her students in the classroom.
- “Measurement and evaluation” was used instead of
“Assessment” which concern about ability to create testing question, individual

143
teaching to judgment and validity of the evaluation process that provide the benefit to
indicate achievements and learning progression of students.
- “Teaching media and materials” was used instead of
“Material”. It covers several kinds of resources that used to be learning resource.
Moreover, it covers about creating and utilizing the suitable materials, and also covers
about having teaching assistants to support his/her teaching process.
- “Personality” is still used the original conceptual
terminology. It describes individual personal behavior of teacher and good human
relations. This component affect to student attention in class and their relationship
between teacher and their student.
The result of good teaching characteristics model and their
statistical indicators are shown in Table 4.2.
Table 4.2 Core components and principal factors of good teaching characteristics
model
Good teaching
components
Principal factors of each
components Item No.
The 1st
factor
loading
The 2nd
factor
loading
1. Knowledge
(KNOWLEDG)
1.1) Knowledge fundamental
(KN_FUND)
1.1 – 1.4 0.280 2.55
2. Teaching
preparation
(PREPARE)
2.1) Teaching preparation
(TE_PREP)
2.1 – 2.4 0.350 2.19
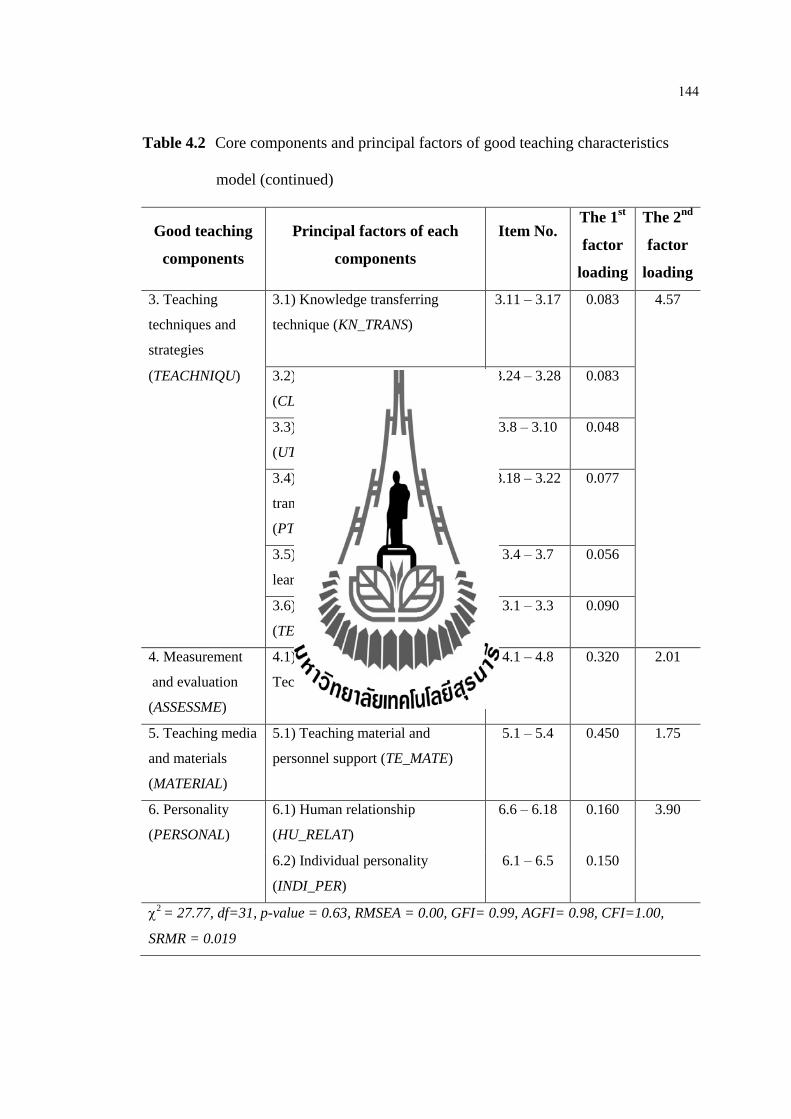
144
Table 4.2 Core components and principal factors of good teaching characteristics
model (continued)
Good teaching
components
Principal factors of each
components
Item No.
The 1st
factor
loading
The 2nd
factor
loading
3. Teaching
techniques and
strategies
3.1) Knowledge transferring
technique (KN_TRANS)
3.11 – 3.17 0.083 4.57
(TEACHNIQU) 3.2) Classroom administration
(CL_ADMIN)
3.24 – 3.28 0.083
3.3) Utilizing the feedback
(UT_FEEDS)
3.8 – 3.10 0.048
3.4) Practical knowledge
transferring technique
(PT_KNOW)
3.18 – 3.22 0.077
3.5) Supporting student-centered
learning (ST_CENT)
3.4 – 3.7 0.056
3.6) Teaching is structured
(TE_STRUCT)
3.1 – 3.3 0.090
4. Measurement
and evaluation
(ASSESSME)
4.1) Measurement and evaluation
Techniques (ME_TECH)
4.1 – 4.8 0.320 2.01
5. Teaching media
and materials
(MATERIAL)
5.1) Teaching material and
personnel support (TE_MATE)
5.1 – 5.4 0.450 1.75
6. Personality
(PERSONAL)
6.1) Human relationship
(HU_RELAT)
6.6 – 6.18 0.160 3.90
6.2) Individual personality
(INDI_PER)
6.1 – 6.5 0.150
2 = 27.77, df=31, p-value = 0.63, RMSEA = 0.00, GFI= 0.99, AGFI= 0.98, CFI=1.00,
SRMR = 0.019

145
Table 4.2 showed that there are 12 factors (1st factors) are explored in
this questionnaire. Four out of the six components consist of one factor including:
“Knowledge” (KN_FUND: 0.280), “Teaching preparation” (TE_PREP: 0.350),
“Measurement and evaluation” (ME_TECH: 0.320) and “Teaching media and
materials” (TE_MATE: 0.450) components. While “Teaching techniques and
strategies” components consist of six factors with factor loading scores between 0.048
and 0.090 (UT_FEEDS: 0.048, ST_CENT: 0.056, PT_KNOW: 0.077, KN_TRANS:
0.083, CL_ADMIN: 0.083 and TE_STRUCT: 0.090). The “Personality” component
consists of two factors with factor loading scores of 0.150 and 0.160 (INDI_PER:
0.150 and HU_RELAT: 0.160). The second order CFA revealed that the “Teaching
techniques and strategies” component obtained the highest of the factor loading at
4.57. The next important component is the “Personality” component with the 3.90 of
the factor loading.
To verify that this proposed model is fitted with the empirical data, the
important statistical indicators are computed including: the Chi-Square is 27.77 where
df = 31, p-value is 0.63, RMSEA is 0.00, GFI is 0.99, AGFI is 0.98, CFI is 1.00 and
SRMR is 0.019. Compared with the threshold values (as mentioned in Chapter 3
Section 3.1.3 ), that is p-value > 0.05, RMSEA < 0.07, GFI > 0.95, AGFI > 0.95, CFI
> 0.95 and SRMR < 0.08 (Hooper et. al., 2008). These statistical indicators indicate
that the good teaching characteristics model is consistent with the empirical data.
The structure of this proposed model can be depicted in Figure 4.1.

146
Figure 4.1 The structure of good teaching characteristics
4.2 The experiment and result of the proposed framework
Following the second objective of this study, that is “To design and develop an
efficient opinion mining framework for analyze student feedback from online teaching
evaluation corresponds to good teaching characteristics”. An opinion mining process
that deal with Thai student feedback was designed and developed. The machine
learning and statistical technique are used as core process in several sub-modules.
This section presents the performance of four sub-modules and overall performance of
the proposed framework. The four sub-modules including: 1) Feature/Opinion
extraction, 2) Polarity identification, 3) Opinion phrase scoring, and 4) Good teaching
characteristic aggregation. While, overall performance is measured via level of rank
147
correlation with the empirical data (i.e., teaching evaluation score from close-end
question). The experimental results are as follows:
4.2.1 Evaluation of sub-module performance
1) Feature/Opinion extraction
This is a sub-module of “Opinion Analysis” module. The aims of
this sub-module is extracted the feature and opinion word from student feedback
paragraph. Their experimental process is as follow steps:
Experimental process:
The student feedbacks which are used in this experiment are
obtained from Teaching Evaluation System of Suranaree University of Technology,
Thailand. 500 of feedback paragraphs (a set of sentences) were randomly selected.
The data were preprocessed via the Linguistic pre-processing module (Chapter 3:
Figure 3.2). Then each paragraph was broken down into 3-gram data record. Finally,
the 3,591 of 3-gram data records were obtained. The hold-out technique was applied to
split both datasets into two parts. First part, 2,520 of data records were used as
a training dataset to build the best two classifiers (the feature classifier and the opinion
classifier). While 999 of remaining data records were reserved as validate dataset.
Five Thai native speakers are asked to assign classes labels (eight categories of classes
i.e. “000”, “001”, “010”, “100”, “011”, “110”, “101”, and “111”) for each 3-grams
data record of both datasets. Two training datasets are obtained and used to model two
effective classifiers. While the second dataset is used as test dataset to measure
the performance of information extraction. This dataset consists of 1,351 words of

148
vocabularies (478 of feature words, 396 of opinion words and 477 of undefined
words).
Experimental results:
(1) Fragment classification: It is the first stage of this sub-module.
The classifier is a vital technique of this stage. To construct two effective classifiers
(Feature and Opinion classifiers), the four well known machine learning techniques
are used in the experiment. They are 1) Naïve Bayes (NB), 2) Support Vector Machine
(SVM), 3) K-nearest neighbor (KNN) with K=3, and 4) Classification Based on
Associations (CBA) with parameter setting according to experimental of Hu and Liu
(2006). These machine learning techniques modeled in WEKA environment on two
training datasets (Feature dataset and Opinion datasets). The 10-fold cross-validation
was used to measure the effectiveness of these classifiers. The best two classifiers
were selected and used in the proposed framework. Their performance (Precision,
Recall, F-measure and Accuracy) of these machines learning technique (as shown in
Figure 4.2).
In Figure 4.2 indicates that the Support Vector Machine (SVM)
seem to be the best classifier for all of word types. The SVM obtained 0.718 of
precision (P), 0.726 of recall (R), 0.722 of f-measure (F), and 0.726 of accuracy (A)
for classified n-gram feature data records. While classifying the opinion word, the
SVM got 0.675 of precision, 0.689 of recall, 0.682 of f-measure, and 0.689 of
accuracy.

149
Figure 4.2 Performance measurement of feature and opinion classifier
Besides, the Naïve Bayes (NB) was a good candidate classifier.
The NB got the performance more than 0.600 of every measure. Whereas the K-
Nearest Neighbor (KNN) and Classification Based on Associations (CBA) classifiers
got low performance (lower than 0.600 on overall evaluation). Because of this low
performance result of the KNN and CBA classifiers, both of them were discarded to
use in summarization step (Fragment summarization).
(2) Fragment summarization: It is the second stage which
merges back each n-gram classification result original sentence to indicate which word
is feature or opinion word. The n-gram majority voting was used with the best two
classifier (Naïve Bayes and Support Vector Machine) results. The stop word was
filtered with syntactic similarity are performed. The dataset consists of 1,351 words of
vocabularies (478 of feature words, 396 of opinion words and 477 of undefined
words). The confusion matrix and their performance are shown in Table 4.3 – 4.4.

150
Table 4.3 Confusion matrix of feature and opinion extraction
Naïve Bayes (NB)
Support Vector Machine (SVM)
Predicted
Predicted
Feature word
1 0
Feature word
1 0
Actual
1 386 92
Actual
1 408 70
0 60 813
0 106 767
Predicted Predicted
Opinion word 1 0 Opinion word 1 0
Actual 1 271 125 Actual 1 264 132
0 40 915 0 26 929
The results from Table 4.3 are used to compute the common
evaluation values (e.g., Precision, Recall, F-measure and Accuracy) as shown in Table
4.4.
Table 4.4 Evaluation of extracting feature and opinion words
Classifier Type of
word P R F A
Naïve Bayes Feature 0.865 0.808 0.836 0.887
Opinion 0.871 0.684 0.766 0.878
Support Vector Machine Feature 0.794 0.854 0.823 0.870
Opinion 0.910 0.667 0.770 0.883
In Table 4.4, the evaluation results indicated that the Naïve Bayes
(NB) classifier (with a fragment summarization process) was given the good
performance for identifying feature words. All of evaluation (precision, recall,
accuracy) were higher than 0.800. While the Support Vector Machine (SVM) classifier

151
produced good performance for identifying opinion words. The precision was 0.910,
recall is 0.667, f-measure is 0.770, and accuracy is 0.883.
2) Polarity Identification
The polarity words that obtained from previous sub-module was
used as input data for the polarity identification module. The aim of this sub-module is
to predict their polarity of given opinion word. Their experimental process can be
described as follows;
Experimental process:
The opinion word that identified by previous sub-module were
used. By expanding the word around this extracted opinion word in 3 window size.
The 3-grams data records are obtained as follows. 500 feedback paragraphs of Thai
students were randomly selected. They were break down into 2,519 of 3-grams data
records. The classes of this n-grams dataset separated into three groups of polarity that
are “Positive”, “Negative”, and “Neutral”. The five Thai native speakers were asked to
determine the appropriate class of these 3-grams data records. The polarity classes
consist of 1,111 of Neutral, 930 of Positive, and 479 of Negative. Due to imbalance of
Negative class, the Synthetic Minority Over-sampling Technique (SMOTE) technique
was used to over-sampling the negative to 862 data records. The three well-known
machine learning including; 1) Naïve Bayes (NB), 2) Support Vector Machine (SVM),
3) K-nearest neighbor (KNN) with K=3, and 4) Classification Based on Associations
(CBA) were trained with this dataset. The best classifier is selected as polarity
classifier of the proposed framework. The performances of three machine learning are
described as follows:

152
Experimental results:
To measure the performances of these machine learning.
The WEKA software with their default configuration is used to model. 1) K-nearest
neighbor with (K=3), 2) Classification Based on Associations (CBA), 3) Naïve Bayes
with default parameter and 4) Support Vector Machine with Linear Kernel.
Their performances was tested with 10-folds cross validation. The confusion matrix
and their performance can be illustrated in Table 4.5 – 4.6.
Table 4.5 Confusion matrix of polarity identification
K-nearest neighbor (KNN)
Predicted
Neutral Positive Negative
Actual Neutral 845 134 132
Positive 286 526 118
Negative 166 135 561
Classification Based on Associations
(CBA)
Predicted
Neutral Positive Negative
Actual Neutral 802 166 143
Positive 281 516 133
Negative 264 265 333
Naïve Bayes (NB)
Predicted
Neutral Positive Negative
Actual Neutral 871 140 100
Positive 196 643 91
Negative 98 79 685
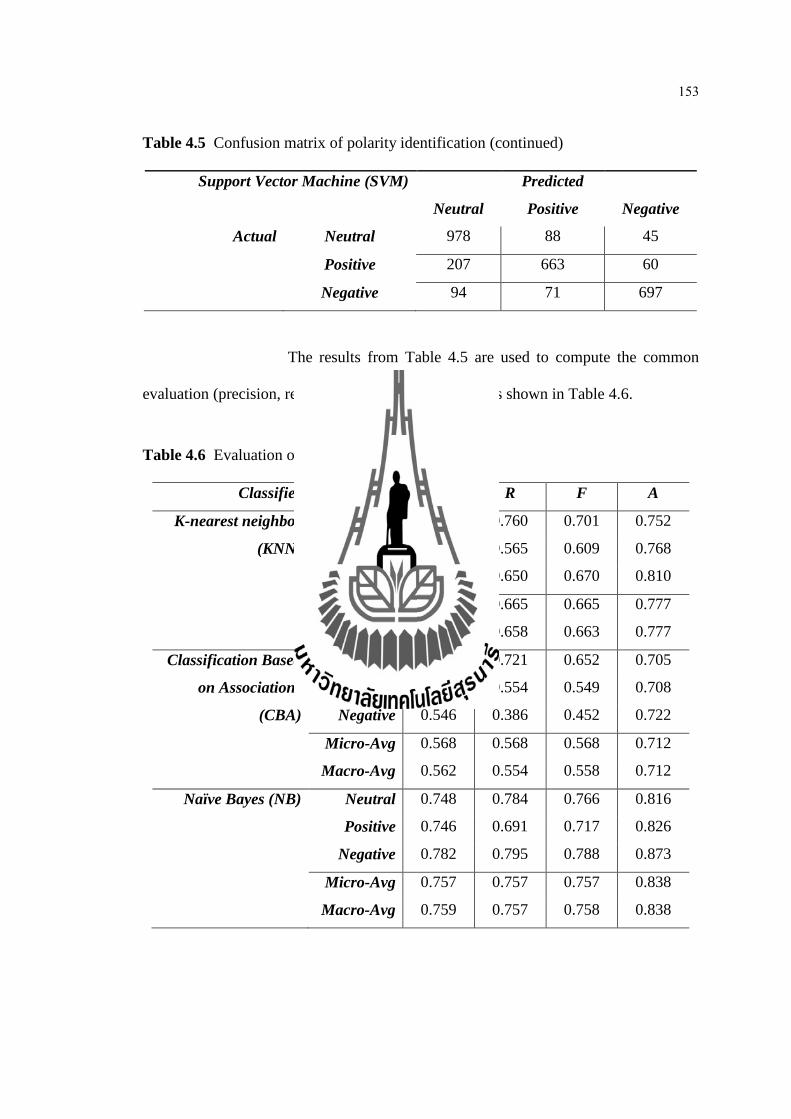
153
Table 4.5 Confusion matrix of polarity identification (continued)
Support Vector Machine (SVM)
Predicted
Neutral Positive Negative
Actual Neutral 978 88 45
Positive 207 663 60
Negative 94 71 697
The results from Table 4.5 are used to compute the common
evaluation (precision, recall, f-measure and accuracy) as shown in Table 4.6.
Table 4.6 Evaluation of polarity identification
Classifier P R F A
K-nearest neighbor Neutral 0.651 0.760 0.701 0.752
(KNN) Positive 0.661 0.565 0.609 0.768
Negative 0.691 0.650 0.670 0.810
Micro-Avg 0.665 0.665 0.665 0.777
Macro-Avg 0.668 0.658 0.663 0.777
Classification Based Neutral 0.595 0.721 0.652 0.705
on Associations Positive 0.544 0.554 0.549 0.708
(CBA) Negative 0.546 0.386 0.452 0.722
Micro-Avg 0.568 0.568 0.568 0.712
Macro-Avg 0.562 0.554 0.558 0.712
Naïve Bayes (NB) Neutral 0.748 0.784 0.766 0.816
Positive 0.746 0.691 0.717 0.826
Negative 0.782 0.795 0.788 0.873
Micro-Avg 0.757 0.757 0.757 0.838
Macro-Avg 0.759 0.757 0.758 0.838

154
Table 4.6 Evaluation of polarity identification (continued)
Classifier P R F A
Support Vector Neutral 0.765 0.880 0.818 0.850
Machine (SVM) Positive 0.807 0.713 0.757 0.853
Negative 0.869 0.809 0.838 0.907
Micro-Avg 0.805 0.805 0.805 0.870
Macro-Avg 0.813 0.801 0.807 0.870
In Table 4.6, the evaluation results indicated that the Support
Vector Machine (SVM) and Naïve Bayes (NB) classifiers produced the good
performance for polarity identification. The accuracy of both classifier are higher than
0.80. However, consider the precision, recall and f-measure rate, the Support Vector
Machine obtained the higher than 0.80 of the Micro and Macro-average of precision,
recall, f-measure and accuracy, while other classifiers obtained the performance score
less than 0.80.
3) Good teaching characteristic aggregation
The aim of this final sub-module is to indicate of the good teaching
characteristics level of individual teacher. The result from previous sub-module
(Opinion Phrase scoring) are used as input data. The output is numerical value which
having range of score in 0.00 to 4.00 (correspond with teaching evaluation score).
The high value of output indicates that the teacher has high characteristic of good
teaching. On the other hand, the low value indicates that the teacher should improve
their teaching. In aggregation process, the regression technique is main process.
Several machine learning and statistical techniques are models and their performances
are measured. Their experimental process of this sub-module is as follows:

155
Experimental process:
(1) 10,000 of student feedbacks are randomly selected to modeling
an efficient aggregator. These feedbacks are processed follow the previous module of
this proposed framework. The opinion scores are computed and used in
the experiment.
(2) To model an estimator, the input data consisting of 13 variables.
These variables consists of; the 6 variables of the average of opinion score on each
categories, the 6 variables of total number of opinion phrases on each categories, and
1 variable of the total number of student feedbacks are used as input data. The output
of this process is numerical value that used to indicate the level of good teaching
characteristics.
(3) Four well-known machine learning techniques were used in
experimental including; 1) Multiple Linear Regression (MLR), 2) Support Vector
Machine for Regression (SVR), 3) Multi-layer Perceptron (MLP) and 4) Multi-layer
Perceptron for Regression (MLPR). The 10-folds cross-validation is used as testing
mode.
The performance of these four machine learning and statistical
technique are described as follows:
Experimental results:
The four machines learning against with opinion scores are
summarized as shown in Table 4.7.

156
Table 4.7 Performance of good teaching characteristic estimator
Input score
(opinion score) Models MAE RMSE
SentiWordNet MLR 0.1694 0.2257
MLP 0.1995 0.2689
MLPR 0.1822 0.2449
SVR 0.1696 0.2271
As shown in Table 4.7, all models are obtained the MAE and
RMSE rate less than 0.30. The Multiple Linear Regression (MLR) and the Support
Vector Machine for Regression (SVR) delivered the best estimation score. The MAE
and RMSE rate of SVR are lower than other models.
4.2.2 Evaluation of overall performance
As described in previous section, all of sub-modules are important
component of the proposed framework. The final results of this proposed framework
indicate the good teaching characteristics of individual teacher. Normally, the total
teaching evaluation score from close-ended question imply how much the student
prefers in their teacher. Evaluating overall performance, the correlation coefficient of
ranking between the rank of total teaching evaluation score and ranking from
aggregation opinion score module should be in high level. The experimental process of
the proposed framework is as follows:
Experimental process:
(1) 40,000 of student feedback are randomly selected. These feedbacks
were processed follow the proposed framework as described above. The data
distribution of these feedbacks can be depicted in Figure 4.3.

157
(2) These student feedbacks were drawn from 585 teachers; the median
of these feedbacks is 23 feedbacks per a teacher. The minimum number of feedback is
1 and maximum is 1,327. The range value is 1,326 feedbacks. It has the right skewness
characteristic. According to this characteristic, these feedbacks data were separated
into 5 groups follow the percentiles of data. These groups consist of; 1) 1-4 feedbacks
(20 percentiles), 2) 5-14 feedbacks (40 percentiles), 3) 15-38 feedbacks (60 percentiles),
4) 39-106 feedbacks (80 percentiles), and 5) More than 106 feedback (100 percentiles).
Figure 4.3 The distribution of student’s feedback data
As described in previous section, the overall performance of
the proposed framework as follows:
Experimental results:
The expectation of this study is that the proposed framework had
the correctness of ranking at high level (greater than or equal 70% of ranking
correlation). The statistical indicator called “Spearman-rho rank order correlation” is

158
used to measure this performance. The ranking correlation is computed between
the ranks of good teaching characteristics of proposed framework against with the rank
from teaching evaluation score. Interpretation of the correlation values follows
the criteria in Table 3.4 (Chapter 3). The criteria levels are 0.70-0.89 is strong
correlation, and 0.50-0.69 is moderate. The spearman-rho rank order correlation is
shown in Table 4.8.
Table 4.8 Spearman’s rho rank order correlation of overall performance
Aggregation
method
N Correlation
Coefficient
p-value
Average of SWN 585 0.132 1.412E-03**
MLR 585 0.273 1.977E-11**
SVR 585 0.294 3.632E-13**
MLP 585 0.543 4.121E-46**
MLPR 585 0.689 1.395E-83**
** p-value 0.01 (N > 30, use the critical value from Pearson’s correlation)
As shown in Table 4.8, using the Multi-Layer Perceptron for
Regression provided moderate performance (more than 0.689). While, directly used of
average of SentiWordNet score provided the lowest of rank correlation at 0.132.
Considering on number of feedback distribution, the performance of
Multi-Layer Perception for Regression (MLPR) evaluated with the group of feedbacks
(as depicted in Figure 4.4). The result indicated that group that had student feedbacks
more than 107 delivered a high level of rank correlation at 0.777. When cumulated
with the group that had student feedbacks more than 39. The rank correlation
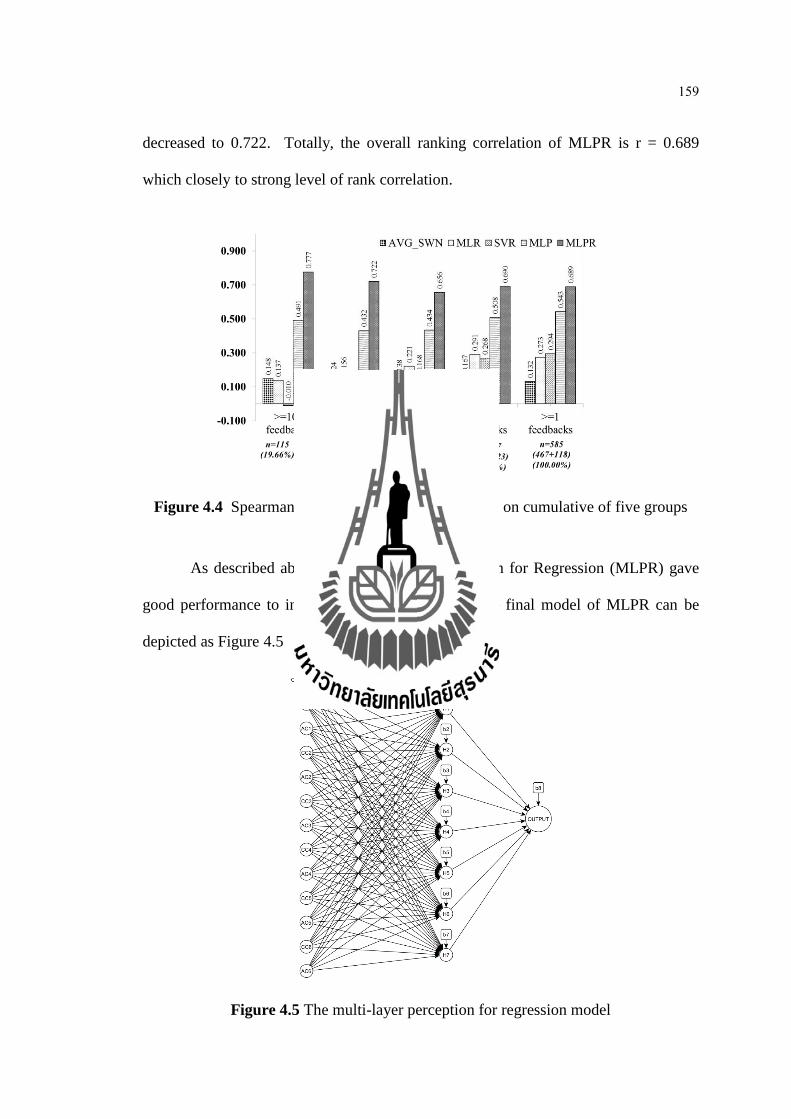
159
decreased to 0.722. Totally, the overall ranking correlation of MLPR is r = 0.689
which closely to strong level of rank correlation.
Figure 4.4 Spearman-rho rank correlation coefficient on cumulative of five groups
As described above, the Multi-Layer Perception for Regression (MLPR) gave
good performance to indicate quality of teaching. The final model of MLPR can be
depicted as Figure 4.5
Figure 4.5 The multi-layer perception for regression model

160
the optimal weight parameter of this model is shown in Table 4.9.
Table 4.9 The optimal weight parameter of MLPR model
Weight of node Weight of node
Input node (Input Hidden) (Hidden Output)
H1 -4.496
CCOMMENT -0.479
CC1 -1.334
AC1 -1.426
CC2 0.646
AC2 0.063
CC3 -5.850
AC3 0.817
CC4 1.634
AC4 -0.426
CC5 0.619
AC5 -0.173
CC6 -4.366
AC6 -1.967
Bias (b1) -1.978
H2 -4.971
CCOMMENT -0.187
CC1 1.306
AC1 1.044
CC2 1.076
AC2 -0.378
CC3 5.748
AC3 -0.452
CC4 -1.814
AC4 0.093
CC5 0.273
AC5 0.289
CC6 3.410
AC6 1.306
Bias (b2) 2.344
H3 1.249
CCOMMENT 3.020
CC1 -5.669
AC1 3.907
CC2 -4.201
AC2 1.373
CC3 2.833

161
Table 4.9 The optimal weight parameter of MLPR model (continued)
Weight of node Weight of node
Input node (Input Hidden) (Hidden Output)
AC3 0.755
CC4 0.303
AC4 -1.444
CC5 -1.250
AC5 1.760
CC6 1.950
AC6 -1.319
Bias (b3) -1.473
H4 4.363
CCOMMENT 1.138
CC1 1.315
AC1 0.240
CC2 -0.248
AC2 0.218
CC3 -0.595
AC3 0.718
CC4 -0.479
AC4 0.080
CC5 -0.128
AC5 0.332
CC6 -0.895
AC6 0.078
Bias (b4) 2.201
H5 -1.426
CCOMMENT -6.047
CC1 -0.450
AC1 1.383
CC2 5.698
AC2 2.931
CC3 -5.771
AC3 1.053
CC4 2.967
AC4 1.631
CC5 1.157
AC5 1.108
CC6 -6.930
AC6 -0.471
Bias (b5) -2.124
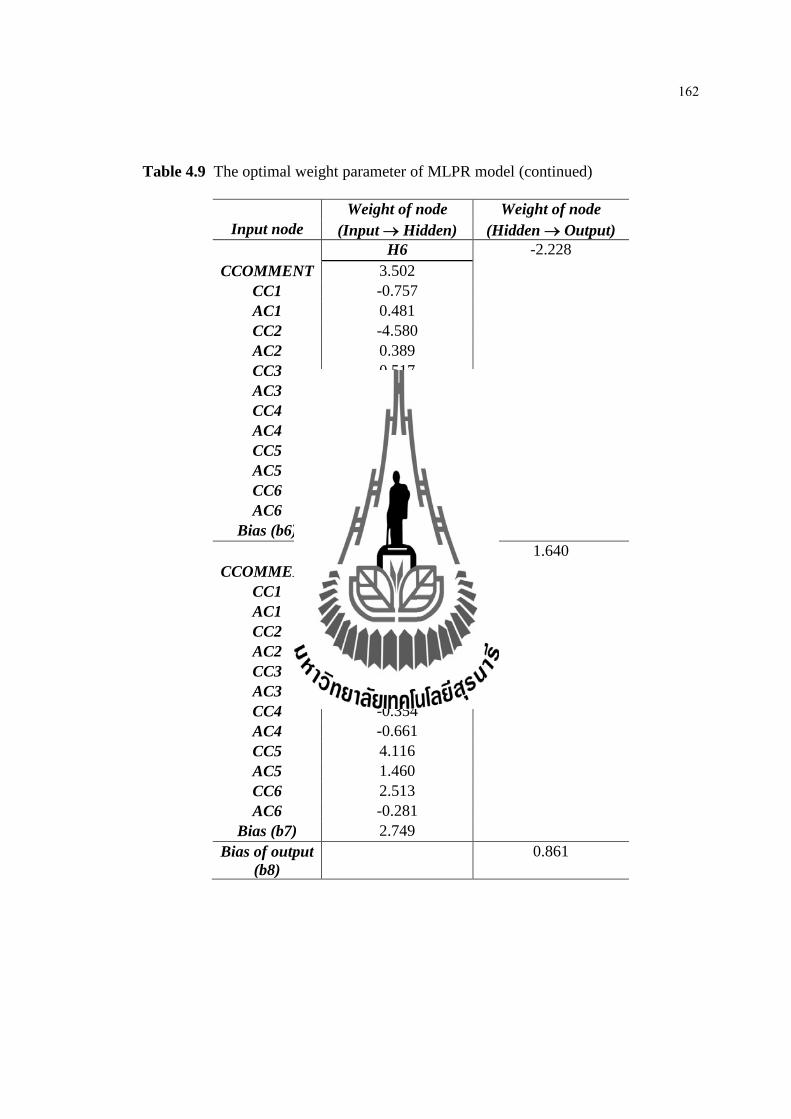
162
Table 4.9 The optimal weight parameter of MLPR model (continued)
Weight of node Weight of node
Input node (Input Hidden) (Hidden Output)
H6 -2.228
CCOMMENT 3.502
CC1 -0.757
AC1 0.481
CC2 -4.580
AC2 0.389
CC3 0.517
AC3 -0.759
CC4 -0.410
AC4 -1.219
CC5 -0.084
AC5 1.773
CC6 1.609
AC6 -0.600
Bias (b6) -1.785
H7 1.640
CCOMMENT -5.826
CC1 -0.877
AC1 -0.594
CC2 2.175
AC2 -0.182
CC3 5.248
AC3 -0.926
CC4 -0.354
AC4 -0.661
CC5 4.116
AC5 1.460
CC6 2.513
AC6 -0.281
Bias (b7) 2.749
Bias of output
(b8)
0.861

163
4.3 Discussions
As mentioned in the Chapter 1, the main purposes of this study are; 1) To
identify the component of good teaching characteristics that corresponds with Thai
educational context, and 2) To design and develop an efficient opinion mining
framework for analyze student feedback from online teaching evaluation corresponds
to good teaching characteristics.
4.3.1 The results of the hypothesis testing
The two main hypothesis of this research are 1) Obtain the extract
component of good teaching characteristics which correspond with Thai educational
context, and 2) Obtain an efficient opinion mining framework to indicate the strength
and weakness of individual teaching from Thai student feedback, correctly with
ranking correlation at high level (greater than or equal 70% of ranking correlation).
The First Research Hypothesis:
The evaluation results of modeling good teaching characteristics
(Section 4.1) showed that the good teaching characteristics base on educational theory
consist of 6 components including:
1. Knowledge
1.1 Knowledge fundamental
2. Teaching preparation
2.1 Teaching preparation
3. Teaching techniques and strategies
3.1 Knowledge transferring technique
3.2 Classroom administration

164
3.3 Utilizing the feedback
3.4 Practical knowledge transferring technique
3.5 Supporting student-centered learning
3.6 Structured teaching
4. Measurement and evaluation
4.1 Measurement and evaluation Techniques
5. Teaching media and materials
5.1 Teaching material and personnel support
6. Personality
6.1 Human relationship
6.2 Individual personality
The important component of good teaching characteristics are
“Teaching technique”, “Personality”, “Knowledge”, “Preparation”, “Assessment”, and
“Material”, respectively. The statistical indicators of this good teaching characteristic
model are 2 = 27.77 (p-value = 0.63) where df = 31, RMSEA = 0.00, GFI = 0.99,
AGFI = 0.98, CFI = 1.00, and SRMR = 0.019. These statistical indicators indicated
that the proposed of good teaching characteristic model is correspond with
the educational context of teacher and student of SUT.
The Second Research Hypothesis:
Obtaining an efficient opinion mining framework to indicate the
strength and weakness of individual teaching from Thai student feedback, correctly
with ranking correlation at high level (greater than or equal 70% of ranking
correlation).

165
As described in Section 4.2, the results of sub-modules and overall
performance are reported. Most of sub-modules relied on the machine learning
technique. The efficient of sub-module consist of; 1) Feature/Opinion extraction has
the higher rate of accuracy (0.887) for feature word extraction with Naïve Bayes, and
the accuracy at 0.883 for opinion word extraction with Support Vector Machine,
2) Polarity identification has the higher rate of accuracy (0.870) by using Support
Vector Machine, and 3) Good teaching characteristic aggregation have the MAE and
RMSE rate less than 0.30 for all machine learning model.
The overall performance of the proposed framework was measured by
the Spearman-rho rank correlation. The statistical results shown that the Multi-Layer
Perceptron for Regression (MLPR) yields the high level of rank correlation (r=0.689)
with statistical significant at 0.01. Considering with cumulative of sub-groups,
the Multi-Layer Perceptron for Regression (MLPR) yields the highest level of
correlation at 0.777 in the group that has feedback more than 107 feedbacks. However,
there is decreasing of the correlation rate when cumulated with other groups that have
the low number of student feedbacks.
4.3.2 The discussion of imperfect results
Although, the evaluation results of sub-modules and overall
performance of the proposed framework are high performance. However, there are
imperfect occurred in these evaluation results. Many reasons for the imperfect results
of these sub-modules are discussed as follows:
1) The effect of un-coverage and small size of training dataset, at
initial stage of opinion mining, the feature and their opinion word extraction.
Generally, previous studies used the dependency syntactic rule as extraction tool.

166
It provided good performance for many languages which have strictly grammatical
pattern. However, Thai language is flexible syntactic grammar which can re-arrange
word position. Moreover, Thai language does not use the punctuation or blank space to
break a sentence. This characteristic make Thai language has the complicated
structure. This study proposed a process which used machine learning technique as
extraction process. The prerequisite of machine learning required the large enough and
coverage of linguistic data in the interesting domain. Using the small size of training
dataset affects to efficiency of the classifier.
2) The lacking of terminology in the educational context. This study
used terminology from the LEXiTRON dictionary which is the general purposed
dictionary. However, terminologies in educational context is specific terminology such
as special word, abbreviated, slang word, etc. These words usually occurred during
analysis process. To obtain better performance, these words need to be classified and
organized by the knowledge experts in educational domain. Example of these words are
“หองปฏบตการ”, “หองแลบ”, “หองทดลอง”, “Laboratory”, “LAB”, etc. should be categorized
into a concept word.
3) The lacking of Thai subjective lexicon development. Several
linguistic subjective lexicons are available e.g., SentiWordNet, WordNet-Affect,
SenticNet, MPQA Opinion Corpus, etc. However, most of previous work that dealt
with Thai language usually developed their own subjective linguistic lexicon. There is
no evidence that formal lexicon of Thai subjective lexicon was deployed. Because of
this reason, this study used the translation process to link between Thai and English
language. This translation process affect to performance of many tasks in the proposed

167
framework. Moreover, the subjective score (opinion score) that develop from
the different language may not suitable to directly apply with another context.
The last but not the least, the overall of this study is summarized and
some recommendations for future research are presented in Chapter 5.

CHAPTER 5
CONCLUSIONS AND RESEARCH RECOMMENDATIONS
This chapter presents a summary of the research findings, the limitation of this
study and recommendations for future research studies.
5.1 Summary of the research findings
This study aims to identify the good teaching characteristics and develop
an efficient opinion mining framework for extract knowledge from student feedbacks.
To identify the good teaching characteristics, the social research process is
implemented. Reviewing of previous educational researches that related with
characteristics of good teaching is summarized. The Likert scale questionnaire about
good teaching characteristic is developed for data surveying. This questionnaire
consists of 66 items based on the characteristic of good teaching from previous
studies. The population and sample units draw from the full time instructors and
students of Suranaree University of Technology. The total amount of sample units
consists of 97 faculty and 474 students. The reliability of this questionnaire is in high
level at 0.983. The indexes of item objective congruence (IOC) of each item are higher
than the threshold value at 0.50. The Structural Equation Modeling (SEM) approach is
used to model the structure of good teaching characteristics. The Exploratory Factor
Analysis (CFA) and the secondary order Confirmative Factor Analysis between
the observed variables and the latent variables are computed. The SEM statistical

169
indicators indicated that the good teaching characteristics model correspond with
the empirical data that survey from teachers and students in Thai educational context.
Finally, the opinion mining framework for extracting knowledge from student
feedbacks is designed and developed. This framework consist of three main model
including; 1) Linguistic pre-processing, 2) Opinion analysis, and 3) Aggregation and
Visualization. The first main module is data pre-preparation process that separate text
paragraph to word and tag their Part-Of-Speech. The second main module consists of
three sub-modules including; 1) Feature/Opinion extraction, 2) Polarity identification,
and 3) Opinion phrase scoring. These sub-modules are mined the subjectivity from
student feedbacks. These subjective indicate which characteristics in teaching process
are satisfied. In Feature/Opinion extraction, Naïve Bayes classifier and Support Vector
Machine with n-gram majority voting are used as Feature and Opinion word
extractors, respectively. In Polarity identification sub-module, Support Vector
Machine is used as polarity identification from the given opinion word. The last sub-
module of opinion analysis is Opinion scoring. The feature words are categorized by
using majority voting based on semantic similarity score. While the score of opinion
words are obtained from SentiWordNet. Finally, the third main module consists of
only two sub-modules. First sub-module is Good teaching aggregation. This sub
module aims to aggregate the score of six good teaching characteristics as a numerical
value (total score). This numerical value used to as indicator of individual good
teaching characteristics level. The Multi-Layer Perceptron for Regression model is the
best estimator for indicate good teaching characteristics level. Finally, Good teaching
visualization is used to visualizing all information including; teacher detail, student
feedback, feature and opinion word, their score, and good teaching characteristics

170
level for aggregation. These information are stored in a database for later retrieve,
reuse and visualization in subtle levels.
The research findings are summarized as follows:
5.1.1 Identifying the good teaching characteristics, the questionnaire about
good teaching characteristics is developed based on the previous studies. 97 teachers
and 474 students of Suranaree University of Technology are answered these
questionnaire. The SEM approach is used to model the good teaching characteristics.
The good teaching characteristics consist of six components including; 1) Knowledge,
2) Teaching preparation, 3) Teaching techniques and strategies, 4) Measurement and
evaluation, 5) Teaching media and materials and, 6) Personality. The good teaching
characteristic model consists of 12 observed variables (n) which summarized from 66
items of questionnaire. 47 parameters (t) of paths and covariance coefficients of model
have to estimate. The statistical indicator results of SEM are 2 = 27.77 (p-value =
0.63) where df = 31, RMSEA = 0.00, GFI = 0.99, AGFI = 0.98, CFI = 1.00, SRMR =
0.019. Compared with the threshold values that is p-value > 0.05, RMSEA < 0.07,
GFI > 0.95, AGFI > 0.95, CFI > 0.95 and SRMR < 0.08. These statistical indicators
result passed the standard threshold. These comparisons indicate that the good
teaching characteristics model consistent with the empirical data from teachers and
students.
5.1.2 To develop an efficient opinion mining framework for indicating
the strength and weakness of individual teaching from Thai student feedback.
The efficient framework consists of; 1) Feature/Opinion extraction sub-module:
the Naïve Bayes model delivered high rates of performances to extract feature words
(the precision at 0.865, recall at 0.808, accuracy at 0.887, and f-measure at 0.836).

171
While the Support Vector Machine model delivered high rates of performances to
extract opinion words (the precision at 0.910, recall at 0.667, accuracy at 0.883, and
f-measure at 0.770). 2) Polarity identification sub-module have the high rate of
performances (precision at 0.813, recall at 0.801, accuracy at 0.870, and f-measure at
0.807) by using the Support Vector Machine, and 3) Good teaching characteristic
aggregation sub-module, the four well known of machine learning models consisting
of Multiple Linear Regression (MLR), Support Vector Machine for Regression (SVR),
Multi-Layer Perceptron (MLP), and Multi-Layer Perceptron for Regression (MLPR)
given the MAE and RMSE rates less than 0.30 for good teaching score estimation.
The overall performance of the proposed framework is measured by the Spearman-rho
rank order correlation. The statistical results shown that the Multi-Layer Perceptron
for Regression is the best model that delivered the high level of rank correlation
(r = 0.689) with statistical significant at 0.01. Considering in the number of feedbacks
per each teacher, the group which have feedback more than 107 per teacher obtained
high level of ranking correlation (r = 0.777). Cumulative with the other groups ( 39
feedbacks, 15 feedbacks, 5 feedbacks, and 1 feedback), they obtained the
ranking correlation equal to 0.722, 0.656, 0.690 and 0.689 with statistical significant at
0.01, respectively.
5.2 The limitation of the study
The limitation of the design and development of an efficient opinion mining
framework for extracting knowledge from student feedbacks are described as follows:
5.2.1 This research deals with Thai natural language by analyzing
unstructured texts that stored in an online teaching evaluation system. Due to a natural

172
language is typically used for human communication, the language usage based on
individual expression which is arbitrary distinction. Generally, most of the previous
work deals with English language which used the dependency syntactic rule to extract
information. The dependency syntactic rules deliver the good performance with
the language that has strictly grammatical structure. However, there is no strictly
grammatical structure in Thai language. Thai language also does not used punctuation
to break a sentence. Therefore, this study used the machine learning technique instead
of dependency syntactic rule. Although the machine learning deliver good
performance in many research, however, the large enough and coverage of the sample
cases of training dataset is required. Small size and un-coverage of training dataset
yield unable to extract all of the feature and opinion words, which affected to
consequences stage of the proposed framework.
5.2.2 Lacking of Thai subjective lexicon for directly used. The word
translation process by Thai–English dictionary is used as background technique. Then,
these words are mapped to terminology in SentiWordNet. Unfortunately, un-coverage
between Thai and English vocabulary affected many words could not be translated.
Consequently of incomplete of translation affect many feature word and opinion word
cannot assign their scores. Moreover, many emerging words or phrases including
idioms, proverbs, slangs, and transliteration word, are often written in student
feedback. These words affected the proposed framework does not automatically
categorize those words into the proper predefined categories; although, there are
attempt to use semantic similarity approach. However, it still relies on the word
translation process.
173
5.3 The application of the study
The benefit of this research could be useful in educational administration.
In individual level, the teacher perceives their strength and weakness of teaching and
learning process. This knowledge can be used to improve their teaching style in
current semester, and also use as fundamental knowledge to design the teaching and
learning activity for the next semester.
In administration, the information from student feedback can be used to
indicate the teaching performance of faculty members. The administrator can consider
this useful information and assign the training course for the teacher who has some
weakness in teaching, promoting the teacher who obtained the good teaching
characteristics, or to design the group of teaching expertise to be mentors for new
faculty members.
In collaboration between institutes, if there is disclosure information,
it possible to exchange the teachers between institutions which provide benefit for
improving quality of education.
In addition, the design of this proposed framework could be applied to analyze
other type of Thai text paragraph, such as column news, essay answers, or other
reviews (e.g. product and service reviews, book reviews, etc.)
5.4 Recommendation for future study
There are some improvements that could be performed in the near future as
described below:
5.4.1 Developing the educational terminology lexicon is necessary for feature
and opinion word extraction. Every type of words (e.g., slang, abbreviate,
174
transliteration word, etc.) should categorize into a concept word and store in a well-
structure such as taxonomy or ontology. It could provide good benefit for decreasing
the operation time and deliver higher accuracy of results.
5.4.2 Developing Thai opinion word lexicon, the opinion lexicon which was
developed in different language and different context affect to the opinion score
determination. To obtain the better performance, developing Thai opinion word
lexicon with their score similar to SentiWordNet, is a solution to deliver higher
performance of opinion score aggregation.
5.4.3 Thai language has delicate level of subjective expression which
different from other languages e.g. “ดมาก”, “ดเยยม”, “ดทสด”, “เจง”, “แจม”, “แจว”, etc.
Implementing of syntactic rule to extract modifier of the opinion score, and estimate
their score in subtle level with the sophisticate technique (e.g. Analytic Hierarchy
Process (AHP), Analytic Network Process (ANP), HIT algorithm, etc.) would provide
the fine-gain score for indicating the good teaching characteristics of individual
teacher.

REFERENCES
Abbasi, A., Chen, H. and Salem, A. (2008). Sentiment Analysis in Multiple Languages:
Feature Selection for Opinion Classification in Web Forums. ACM
Transaction on Information System. 26(3): 1-34.
Abd-Elrahman, A., Andreu, M. and Abbott, T. (2010). Using Text Data Mining
Techniques for Understanding Free-style Question Answers in Course
Evaluation Forms. Research in Higher Education Journal. 9: 12-23.
Alhija, F. N. and Fresko, B. (2009). Student Evaluation of Instruction: What Can Be
Learned From Student’s Written Comments?. Studies in Educational
Evaluation. 35: 37-44.
Al-hebaishi, S. (2010). Characteristics of a Good Teacher [On-line]. Available:
http://www.dr-safaa-efl.com/wp-content/uploads/2010/01/Char_Good_
Teacher1.doc.
Apache Software Foundation, (2010). OpenNLP [On-line]. Available: http://opennlp.
sourceforge.net/models-1.4 /thai/
Apisuwankun, P. and Mongkolnavin, J. (2013). Opinion Strength Identification in
Customer Review Summarizing System Using Association Rule Technique.
In Proceedings of the International Conference on E-Technologies and
Business on the Web (EBW2013) (pp. 16-21). Bangkok: Thailand.
Aregbeyen, O. (2010). Students Perceptions of Effective Teaching and Effective
Lecturer Characteristics at the University of Ibadan, Nigeria. Pakistan
Journal of Social Sciences. 7(2): 62-69.
176
Badur, B. and Mardikyan, S. (2011). Analyzing Teaching Performance of Instructors
Using Data Mining Techniques. Information in Education. 10(2): 245-257.
Bhardwaj, A. (n. d.). Data Preprocessing Techniques for Data Mining. E-book on
Data Mining Techniques and Tools for Knowledge Discovery in
Agricultural Datasets [On-line]. Available: http://iasri.res.in/ebook/
win_school_aa/notes/Data_Preprocessing.pdf
Bhuiyan, T., Xu, Y. and Josang, A. (2009). State-of-the-Art Review on Opinion
Mining from Online Customers’ Feedback. In Proceedings of the 9th
Asia-
Pacific Complex Systems Conference (pp. 385-390). Tokyo: Chuo
University.
Biostatistics, Johns Hopkins University. (2009). TA Training Day [On-line].
Available: http://www. biostat.jhsph. edu/ research/TAtraining/listing.pdf.
Bokonjic, D., Ljuca, F. and Steiner, T. (2009). Faculty Development: Manual of
Teaching and learning in Medicine [On-line]. Available: http://www.bhmed-
emanual.org/book/export/html/108
Bosco, C., Patti, V. and Bolioli, A. (2015). Developing Corpora for Sentiment
Analysis: the Case of Irony and Senti–TUT (Extended Abstract). In
Proceedings of the Twenty-Fourth International Joint Conference on
Artificial Intelligence (IJCAI 2015) (pp. 4158-4162). Buenos Aires:
Argentina.
Breck, E., Choi, Y. and Cardie, C. (2007). Identifying Expressions of Opinion in
Context. In Proceedings of the 20th
International Joint Conference on
Artificial Intelligence (IJCAI'07) (pp. 2683-2688). San Francisco, CA:
USA.

177
Bullington, J., Endres, I. and Rahman, M. A. (2007). Open-Ended Question
Classification Using Support Vector Machines. In Proceeding of Midwest
Artificial Intelligence and Cognitive Science Conference (MAICS 2007).
Chicago: USA.
Cambria, E. and Hussain, A. (2012). Sentic Computing: Techniques, Tools, and
Applications. Springer: Dordrecht, Netherlands.
Charoenporn, T., Sornlertlamvanich, V., Kasuriya, S., Hansakunbuntheung, C. and
Isahara, H., (2003). Open Collaborative Development of the Thai Linguistics
Resources for Natural Language Processing. In Proceeding of
ELSNET/ENABLER Workshop (pp. 1193-1196). Paris: France.
Charoenpornsawat, P. (1999). Feature-based Thai Word Segmentation (In Thai).
Master's Thesis, Computer Engineering, Chulalongkorn University,
Bangkok, Thailand.
Cohen, W., Ravikumar, P. and Fienberg, S. (2003). A Comparison of String Distance
Matrics for Name-Maching Tasks. In Proceedings of Workshop on
Information Integration on the Web (IIWeb-03) (pp. 73-78). Acapulco:
Mexico.
Clayton, R. F., Danielle, S. C., Jonathon, J. K. and Ashley, J. L. (2011). Coarse and
Fine-Grained Sentiment Analysis of Social Media Text. Johns Hopkins
APL Technical Digest. 30(1): 22-30.
College of Agricultural and Life Sciences, University of Florida. (2009).
Characteristics of Good Teaching [On-line]. Available: http://cals.ufl.edu/
faculty_staff/pdfs/teachingtips/2009-10-Characteristics of Good Teaching.pdf.
178
Cronbach, L. J. (1951). Coefficient Alpha and the Internal Structure of Tests.
Psychometrika. 16 (3): 297–334.
Dale, R., Moisl, H. and Somers, H., (2000). Handbook of Natural Language
Processing. Marcel Dekker Inc.
Das, D. and Martins, A. F. T. (2007). A Survey on Automatic Text Summarization.
Literature Survey for the Language and Statistics II Course at CMU
[On-line]. Available: http://www.cs.cmu.edu/~afm/Home_files/Das_Martins
_ survey_ summarization.pdf.
Daniël de Kok, (2010). Jitar HMM part of speech tagger [On-line]. Available:
https://github.com/danieldk/jitar
Eble, K. (1971). The Recognition and Evaluation of Teaching. American
Association of University Professors, Salt Lake City.
Ebro, L. (1977). Instractional Behavior Patterns of Distinguished University
Teachers. Ph.D. Dissertation, Ohio State University: USA.
El-Halees, A. (2011). Mining Opinions in User-Generated Contents to Improve Course
Evaluation. Software Engineering and Computer Systems: CCIS Part II.
180: 170-115.
Esuli, A. and Sebastiani, F. (2005). Determining the Semantic Orientation of Terms
Through Gloss Classification. In Proceedings of the 14th
ACM
international conference on Information and knowledge management
(CIKM '05) (pp. 617-624). New York: USA.
________. (2006). SENTIWORDNET: A Publicly Available Lexical Resource for
Opinion Mining. In Proceeding of the 5th
Conference on Language
Resources and Evaluation (LREC 06) (pp. 417-422). Genoa: Italy.

179
Ghiassi, M., Skinner, J. and Zimbra, D. (2013). Twitter Brand Sentiment Analysis:
a Hybrid System Using N-gram Analysis and Dynamic Artificial Neural
Network. Expert Systems with Applications. 40: 6266-6282.
Gomaa, W. H. and Fahmy, A. A. (2013). A Survey of Text Similarity Approaches.
International Journal of Computer Application. 68(13): 13-18.
Gurney, P. (2007). Five Factors for Effective Teaching. New Zealand Journal of
Teachers’ Work. 4(2): 89-98.
Hall, M., Frank, E., Holmes, G., Pfahringer, B., Reutemann, P. and Witten, I. H.
(2009). The WEKA Data Mining Software: An Update. ACM SIGKDD
Explorations Newsletter archive. 11(1): 10-18.
Hajmohammadi, M. S., Ibrahim, R. and Othman, Z. A. (2012). Opinion Mining and
Sentiment Analysis: A Survey. International Journal of Computers &
Technology. 2(3): 171-178.
Haruechaiyasak, C., and Kongyoung, S. (2009). TLex: Thai Lexeme Analyser Based
on the Conditional Random Fields. In Proceedings of 2009 Eighth
International Symposium on Natural Language Processing (SNLP 2009)
(pp. 1-5), Bangkok: Thailand.
Haruechaiyasak, C., Kongyoung, S. and Dailey, M. (2008). A Comparative Study on
Thai Word Segmentation Approaches. In Proceedings of the 5th
International Conference on Electrical Engineering/Electronics, Computer,
Telecommunications and Information Technology (ECTI-CON 2008)
(pp. 125-128), Krabi: Thailand.
180
Haruechaiyasak, C., Kongthon, A., Palingoon, P. and Sangkeettrakarn, C. (2010).
Constructing Thai Opinion Mining Resource: A Case Study on Hotel
Reviews. In Proceedings of the 8th
Workshop on Asian Language
Resources (pp. 64-71). Beijing: China.
Hayes, P. J. and Carbonell, J. G., (1983). A Tutorial on Techniques and
Applications for Natural Language Processing [On-line]. Available:
http://repository.cmu.edu/compsci/1484.
Heerschop, B., Goossen, F., and Hogenboom, A. (2011). Polarity Analysis of Texts
Using Discourse Structure. In Proceeding of the 20th
ACM Conference on
Information and Knowledge Management (CIKM’11) (pp. 1061-1070).
Glasgow, Scotland: UK.
Hinkle, D. E., Wiersma, W., and Jurs, S.G. (1998). Applied Statistics for the
Behavioral Sciences (4th
edition). Boston: USA.
Hoe, S. L. (2008). Issues and Procedures in Adopting Structural Equation Modeling
Technique. Journal of Applied Quantitative Method. 3(1): 79-83.
Hogg, R. V. and Hogg, M. C. (1995). Continuous Quality Improvement in Higher
Education. International Statistical Review. 63(1): 35-48.
Hooper, D., Coughlan, J. and Mullen, M. R. (2008). Structural Equation Modeling:
Guidelines for Determining Model Fit. The Electronic Journal of Business
Research Methods. 6(1): 53-60.
Hu, M. and Liu, B. (2004). Mining and summarizing customer reviews. In
Proceedings of the 10th
ACM SIGKDD International Conference on
Knowledge Discovery and Data Mining (KDD’ 04) (pp. 168-177). Seattle:
USA.

181
Hu, M. and Liu, B. (2006). Opinion Feature Extraction Using Class Sequential Rules.
In Proceedings of AAAI-CAAW-06, the Spring Symposia on
Computational Approaches to Analyzing Weblogs (pp. 1-6). Stanford:
USA.
Huang, C., Tokunaga, T. and Lee, S. Y. M., (2006). Asian Language Processing:
Current State-of-the-Art. Language Resources and Evaluation. 40(3-4):
208-218.
Hutchins, W. J. and Somers, H. L. (1992). An Introduction to Machine Translation.
London: Academic Press.
Isil Kabakci, H. and Odabasi, F. (2008). The Organization of the Faculty Development
Programs for Research Assistants: The Case of Education Faculties in
Turkey. The Turkish Online Journal of Educational Technology (TOJET).
7(3): 56-63
Jacobson, D., Pehlivan, E., Vilvovsky, S. and Wong, W. (2009). Combining Web
Mining Techniques and Structural Equations Modeling for Measuring
E-commerce Perceptions: Case Studies in Business, Industry and
Government Statistics (CS-BIGS). 2(2): 99-108.
Jahangiri, L., and Mucciolo, T. W. (2008). Characteristics of Effective Classroom
Teachers as Identified by Students and Professionals: A Qualitative Study.
Journal of Dental Education. 72(4): 484-493.
Jaitiang, A., (2003). Principles of teaching (3rd
edition) (In Thai). Ordien store
publishing: Bangkok.
182
Jallade, L., Radi, M. and Cuenin, S. (2001). National Education Policies and
Programmes and International Cooperation: What Role for UNESCO?.
Education Policies and Strategies 1, UNESCO: Paris.
Jirawan, C. and Asanee, K. (2006). Thai Elementary Discourse Unit Segmentation
by Using Discourse Segmentation Cues and Syntactic Information
(In Thai). MS.c. Thesis, Kasetsart University, Thailand.
Jordan, D. W. (2011). Re-Thinking Student Written Comments in Course
Evaluations: Text Mining Unstructured Data for Program and
Institutional Assessment. Ph.D. Dissertation, California State University,
Stanislaus.
Jotheeswaran, J., Loganathan, R., and Madhu Sudhanan, B. (2012). Feature Reduction
Using Principal Component Analysis for Opinion Mining. International
Journal of Computer Science and Telecommunications. 3(5): 118-121.
Karoonboonyanan, T., Silpa-Anan C., Kiatisevi, P., Veerathanabutr, P. and
Ampornaramveth, V., (2001). LibThai Library [On-line]. Available:
http://linux.thai.net/projects/libthai.
Kamps, J., Marx, M., Mokken, R. J. and Rijke, M. (2004). Using WordNet to Measure
Semantic Orientation of Adjectives. In Proceedings of the 4th
International
Conference on Language Resources and Evaluation (LREC 2004)
(pp. 1115-1118). European Language Resources Association: Paris.
Kannan, R. and Bielikova, M. (2010). Mining Feedbacks and Opinions in Educational
Environment. International Journal of Computer Applications. 1(10):
33-36.

183
Kantaradzic, M, (2003). Data Mining, Concents, Models, Methods, and Algorithms.
Wiley-Interscience publication: USA.
Kawtrakul, A., Kumtanode, S., Jamjanya, T. and Jewriyavech, C., (1995). A Lexibase
Model for Writing Production Assistant System. In Proceeding of the
Second Symposium on Natural Language Processing (SNLP’95)
(pp. 226-236). Kasetsart University, Bangkok: Thailand.
Kawtrakul, A., Suktarachan, M., Varasai, P. and Chanlekha. H., (2002). A State of the
Art of Thai Language Resources and Thai Language Behavior Analysis and
Modeling. In Proceedings of the 3rd
Workshop on Asian Language
Resources and International (COLING '02), (pp. 1-8). Association for
Computational Linguistics, Stroudsburg, PA: USA.
Kesorn, W. (2013). Similarity Measurement of Thai Documents Using Natural
Language Processing (In Thai). Master's Thesis, Computer Science, Chiang
Mai University, Chiang Mai, Thailand.
Khairnar, J. and Kinikar, M. (2013). Machine Learning Algorithms for Opinion
Mining and Sentiment Classification. International Journal of Scientific
and Research Publications (IJSRP). 3(6): 1-6.
Khatri, S. K., Singhal, H. and Johri, P. (2014). Sentiment Analysis to Predict Bombay
Stock Exchange Using Artificial Neutral Network. In Proceeding of
Reliability, Infocom Technologies and Optimization (ICRITO) (Trends
and Future Directions) 2014 (3rd
) (pp. 1-5). Noida: India.

184
Kim, W. Y., Ryu, J. S., Kim, K. I. and Kim, U. M. (2009). A Method for Opinion
Mining of Product Reviews Using Association Rules. In Proceedings of the
2nd
International Conference on Interaction Sciences: Information
Technology, Culture and Human (pp. 270-274). New York: USA.
Kreutzer, J. and Witte, N. (2013). Opinion Mining Using SentiWordNet [On-line].
Available: http://stp.lingfil.uu.se/~santinim/sais/Ass1_Essays/Neele_Julia_
SentiWordNet_V01.pdf
Krejcie, R.V. and Morgan, D.W. (1970). Determining Sample Size for Research
Activities. Educational and Psychological Measurement. 30(3): 607-610.
Kongthon, A., Haruechaiyasak, C., Sangkeettrakarn, C., Palingoon, P. and Wunnasri,
W. (2011). HotelOpinion: An Opinion Mining System on Hotel Reviews in
Thailand. In Proceeding of Technology Management in the Energy Smart
World (PICMET’11) (pp. 1-6). Portland: USA.
Landbeck, R., (1997). What Students Think about Good Teaching: an Exploratory
Survey at the University of the South Pacific. In Proceeding of the Higher
Educational Research and Development Society of Australasia Annual
Conference (HERDSA) (pp. 17-30). Adelaide: Australia.
Lee, D., Jeong, O. and Lee, S. (2008). Opinion Mining of Customer Feedback Data on
the Web. In Proceedings of the 2nd
International Conference on
Ubiquitous Information Management and Communication (ICUIMC
'08) (pp. 230-235). New York: USA.
Lei, P. and Wu, Q. (2007). Introduction to Structural Equation Modeling: Issues and
Practical Considerations. Educational Measurement: Issues and Practice.
26(3): 33-43.

185
Leong, C. K., Lee, Y. H. and Mak, W. K. (2012). Mining Sentiments in SMS Texts for
Teaching Evaluation. Expert System with Application. 39(2012): 2548-
2589.
Lewis, K. and et al., (1982). The Large Class Analysis Project. Austin, TX:
University of Texas at Austion.
Liddy, E. D. (1998). Natural Language Processing for Information Retrieval and
Knowledge Discovery. In Proceeding of Visualizing Subject Access for
21st Century Information Resources (pp. 137-147). Urbana-Champaign:
USA.
Liu, B., Hsu, W., and Ma, Y. (1998). Integrating Classification and Association Rule
Mining. In Proceedings of the 4th
International Conference on
Knowledge Discovery and Data Mining (KDD-98) (pp. 80-86), New York,
USA, 1998.
Liu, B. (2011). Web Data Mining: Exploring Hyperlinks, Contents and Usage
Data (2nd
edition). Springer: New York.
Liu, L., Lv, Z. and Wang, H. (2013). Extract Product Features in Chinese Web for
Opinion Mining. Journal of Software. 8(3): 627-632.
a ta . . n . . and Fe e a da va . . . Applications
of Artificial Neural Networks in Chemical Problems [On-line]. Available:
http://cdn.intechopen.com/pdfs-wm/39067.pdf.
Martin, J. R. and White, P. (2005). The Language of Evaluation: Appraisal in
English. Palgrave: London.

186
Mcdonald, R., Hannan, K., Neylon, T., Wells, M. and Reynar, J. (2007). Structured
Models for Fine-to-Coarse Sentiment Analysis. In Proceedings of the 45th
Annual Meeting of the Association of Computational Linguistics (ACL-
07) (pp. 432-439). Prague: Czech Republic.
Metamedia Technology (2003). LongDo Dict [On-line]. Available: http://dict.longdo.com
Miller, G. A. (1995). WordNet: A Lexical Database for English. Communications of
the ACM. 38(11): 39-41.
Modhiran, T., Kosawat, K., Klaithin, S., Boriboon, M. and Supnithi, T. (2005).
PARSITte: Online Thai-English Machine Translation. In Proceeding of the
Tenth Machine Translation Summit (MT SUMMIT X) (pp. 404-411).
Phuket: Thailand.
Moss, J. and Hendry, G. (2002). Use of Electronics Survey in Course Evaluation.
British Journal of Educational Technology. 33(5): 583-592.
Nakhon Ratchasima Teacher College. (1993). Principles of teaching (In Thai).
Department of Curriculum and Teaching, Faculty of Educational: Nakhon
Ratchasima.
NAiST, (n.d.). A User’s Guide to the Grammatical Tagging of NAiST Corpus
[On-line]. Available: http://naist.cpe.ku.ac.th/iknow/posguid.pdf
________ (2011). Jitar_model_large [On-line]. Available: http://naist.cpe.ku.ac.th/pkg/
jitar-20100224.zip
NECTEC, (2003). LEXiTRON [On-line]. Available: http://lexitron.nectec.or.th
________ (2004). Sarsarn [On-line]. Available: http://www.sansarn.com
________ (2006). LexTo: Thai Lexeme Tokenizer [On-line]. Available:
http://www.sansarn.com/lexto/

187
_______ (2009). TLexs: Thai Lexeme Analyzer [On-line]. Available:
http://www.sansarn.com/tlexs/
Nihalani, N., Silakari, S. and Motwani, M., (2011). Natural Language Interface for
Database: A Brief Review. IJCSI International Journal of Computer
Science. 8(2): 600-608.
Nishikawa, H., Hasegawa, T., Matsou, Y. and Kikui, G. (2010). Opinion
Summarization with Integer Linear Programming Formulation for Sentence
Extraction and Ordering. In Proceedings of the 23rd
International
Conference on Computational Linguistics: Posters (COLING '10)
(pp. 910-918). Beijing: China.
Palingoon, P. (2554). Thai Electronic Corpus (In Thai). Bangkok: NSTDA.
Pang, B., Lee, L. and Vaithyanathan, S. (2002). Thumbs Up?: Sentiment Classification
Using Machine Learning Techniques. In Proceedings of the ACL-02
conference on Empirical methods in natural language processing
(EMNLP '02) (pp.79-86). Stroudsburg, PA: USA.
Paul, S. J. and Lisa, F. R. (1988). Natural Language Techniques for Intelligent
Information Retrieval. In Proceedings of the 11th
Annual International
ACM SIGIR Conference on Research and Development in Information
Retrieval (SIGIR’88) (pp. 85-99). Grenoble: France.
Petrovic, S., Snajder, J., Basic, B. D., and Kolar, M. (2006). Comparision of
Collocation Extaction Measures for Document Indexing. Journal of
Computing and Information Technology-CIT. 14(4): 321-327.

188
Phawattanakul, K. and Luenam, P. (2013). Suggestion Mining and Knowledge
Construction from Thai Television Program Reviews. In Proceedings of the
International Multi Conference of Engineers and Computer Scientists
2013 (IMECS 2013) (pp. 307-312). Kowloon: Hong Kong.
Phiakoksong, S., Niwattanakul, S., and Angskun, T. (2013). An Application of
Structural Equation Modeling for Developing Good Teaching Characteristics
Ontology. Informatics in Education. 12(2): 253-272.
Poltree, S. and Saikaew, S. (2012). Thai Word Segmentation Web Service. In
Proceeding of the Joint International Symposium on Natural Language
Processing and Agricultural Ontology Service 2011 (SNLP-AOS 2011)
(pp. 1-5). Bangkok: Thailand.
Pongtanu, P., Rungwarawut, W., Arch-Int, N. and Arch-Int, S. (2012). Customer
Satisfaction Analysis from Comments Using Opinion Mining (In Thai). In
Proceeding of 4th
Conference on Knowledge and Smart Technology
(KST 2012) (pp. 53-60). Chonburi: Thailand.
Popescu, A. and Etzioni, O. (2005). Extracting Product Features and Opinions from
Reviews. In Proceeding of the conference on Human Language
Technology and Empirical Methods in Natural Language Processing
(HLT '05) (pp. 339-346). Stroudsburg, PA: USA.
Potts, C. (2011). Sentiment Symposium Tutorial: Lexicons [On-line]. Available:
http://sentiment.christopherpotts.net/lexicons.html
Powney, J. and Hall, S. (1998). Closing the Loop: The Impact of Student Feedback
on Student’s Subsequent Learning. The SCRE center research in
education: University of Glasgow.

189
Qiu, G., Liu, B., Bu, J. and Chen, C. (2009). Expanding Domain Sentiment Lexicon
Through Double Propagation. In Proceedings of the 21st International
Joint Conference on Artificial Intelligence (IJCAI'09) (pp. 1199-1204).
San Francisco, CA: USA.
Ramadoss, B. and Kannan, R. (2012). Extracting Features and Sentiment Words from
Feedbacks of Learners in Academic Environments. In Proceeding of 2012
International Conference on Industrial and Intelligent Information
(ICIII 2012) (pp. 115-120). IACSIT Press: Singapore.
Reja, U., Manfreda, K. L., Hlebec, V. and Vehovar, V. (2003). Open-ended vs. Close-
ended Questions in Web Questionnaires. Developments in Applied
Statistics. 19(1): 159-177.
Romanyshyn, M. (2013). Rule-based Sentiment Analysis of Ukrainian Reviews.
International Journal of Artificial Intelligence & Application (IJAIA).
4(4): 103-111.
Saleh, M. R., MartíN-Valdivia, M. T., Montejo-RáEz, A. and UreñA-LóPez, L. A.
(2011). Experiments with SVM to Classify Opinions in Different Domains.
Expert Systems with Applications. 38(12): 14799-14804.
Sharma, A. and Dey, S. (2012). An Artificial Neural Network Based Approach for
Sentiment Analysis of Opinionated Text. In Proceeding of the 2012 ACM
Research in Applied Computation Symposium (pp. 37-42). San Antonio:
Texas.
Sheffield, E., (1974). Teaching in the Universities-No One Way. McGill-Queen’s
University Press, Montreal: USA.

190
Shelke, N. M., Deshpande, S. and Thakre, V. (2012). Survey of Techniques for
Opinion Mining. International Journal of Computer Applications. 57(13):
30-35.
Shevade, S. K., Keerthi, S. S., Bhattacharyya, C. and Murthy, K. R. K. (2000).
Improvements to the SMO Algorithm for SVM Regression. IEEE
Transactions on Neural Networks. 11(5): 1188-1193.
Sokolova, M. and Lapalme, G. (2009). A Systematic Analysis of Performance Measures
for Classification Tasks. Information Processing and Management. 45(4):
427-437.
Sornlertlamvanich, V., Charoenporn, T. and Isahara, H. (1997). ORCHID: Thai Part-
Of-Speech Tagged Corpus. Technical Report Orchid TR-NECTEC-1997-
001 (pp. 5-19). NECTEC: Thailand.
Sornlertlamvanich, V., Charoenporn, T., Robkop, K., Mokarat, C. and Isahara, H.,
(2009). Review on Development of Asian WordNet. JAPIO 2009 Year
Book (pp. 276-285). Japan Patent Information Organization: Japan.
Sornlertlamvanich, V., Potipiti, T., Wutiwiwatchai, C. and Mittrapiyanuruk, P.,
(2000). The State of the Art in Thai Language Processing. In Proceedings of
the 38th
Annual Meeting on Association for Computational Linguistics
(ACL '00) (pp. 1-2). Association for Computational Linguistics,
Stroudsburg, PA: USA.
Sriphaew, K., Takamura, H. and Okumura, M. (2009). Sentiment Analysis for Thai
Natural Language Processing. In Proceedings of the 2nd
Thailand-Japan
International Academic Conference (TJIA 2009) (pp. 123-124). Kyoto:
Japan.

191
Srisai, S. (2006). Teaching in Higher Education (4th
) (In Thai). Faculty of
Education, Chulalongkorn University: Bangkok.
Smith, R. (1980). A Checklist for Good Teaching. Teaching and Learning Centre,
Concordia University: Canada.
Smola, A. J. and Scholkopf, B. (2003). A Tutorial on Support Vector Regression.
Statistics and Computation. 14(3): 199-222.
Sproule, R. (2000). Student Evaluation of Teaching: Methodological Critique.
Education Policy Analysis Archives. 8(50): 1-23.
STOW ON THE WOLD PRIMARY SCHOOL, (2005). Characteristics of Effective
Teaching and Learning Checklist [On-line]. Available: http://www.stow-
on-the-wold.gloucs.sch.uk/Policies/thepolicies/characteristicsofeffectiveteaching
learning.pdf.
Sudprasert, S. and Kawtrakul, A. (2003). Thai Word Segmentation Based on Global
and Local Unsupervised Learning. In Proceeding of the 7th
National
Computer Science and Engineering Conference (NCSEC’2003) (pp. 1-8).
Chonburi: Thailand.
Suh, S. C. (2012). Practical Application of Data Mining. Jones & Bartlett Learning:
USA.
Sukhum, K., Nitsuwat, S. and Haruechaiyasak, C. (2011). Opinion Detection in Thai
Political News Columns Based on Subjectivity Analysis. Information
Technology Journal. 7(14): 32-37.
The Royal Institute, (n.d.). The Royal Institute Dictionary [On-line]. Available:
http://rirs3.royin.go.th/dictionary.asp

192
Thelwall, M., Buckley, K., Paltoglou, G., and Cai, D. (2010). Sentiment Strength
Detection in Short Informal Text. Journal of the American Society for
Information Science and Technology. 61(12): 2544-2558.
Thompson, S., Greer, G. J., and Greer, B. B., (2004). Highly Qualified for Successful
Teaching: Characteristics Every Teacher Should Possess [On-line].
Available: http://www.usca.edu/essays/vol102004/thompson.pdf.
Thumrongluck, T. and Mongkolnavin, J. (2011). The Development of an Automated
System for Summarizing Product Reviews of Thai Consumer (In Thai).
Chulalongkorn Business Review. 33(2): 40-62.
TICFIA Program, (2005). SEALANG Project [On-line]. Available: http://www.sealang.net
Tsytsarau, M. and Palpanas, T. (2012). Survey on Mining Subjective Data on the Web.
Data Mining and Knowledge Discovery. 24(3): 478-514.
Varelas, G., Voutsakis, E., Raftopoulou, P., Petrakis, E. G. M. and Milios, E. E.
(2005). Semantic Similarity Methods in WordNet and Their Application to
Information Retrieval on the Web. In Proceedings of the 7th
Annual ACM
International Workshop on Web Information and Data Management
(WIDM '05) (pp. 10–16). New York: USA.
Varghes, N.V. (2007). Higher Education and Development. International Institute
for Educational Planning Newsletter. 25(1): 2-3.
Waiyamai, K. and Pongsiripreeda, T. (2005). Applying Association Rule Discovery to
Select Laws and Articles for Lawsuit. In Proceedings of Pacific Asia
Conference on Information Systems (PACIS 2005) (pp. 90-101).
Bangkok: Thailand.

193
Whitelaw, C., Garg, N. and Argamon, S. (2005). Using Appraisal Groups for
Sentiment Analysis. In Proceedings of the 14th
ACM International
Conference on Information and Knowledge Management (CIKM’ 05)
(pp. 625-631). Bremen: Germany.
Wilson, T., Wiebe, J. and Hoffmann, P. (2005). Recognizing Contextual Polarity in
Phrase-Level Sentiment Analysis. In Proceedings of the Conference on
Human Language Technology and Empirical Methods in Natural
Language Processing (HLT' 05) (pp. 347-354). Vancouver: Canada.
Wiebe, J. and Riloff, E. (2005). Creating Subjective and Objective Sentence
Classifiers from Unannotated Texts. In Proceedings of the 6th
International
Conference on Computational Linguistics and Intelligent Text
Processing (CICLing'05) (pp. 486-497), Berlin: Heidelberg.
Yessenalina, A., Yue, Y. and Cardie, C. (2010). Multi-Level Structured Models for
Document-Level Sentiment Classification. In Proceedings of the 2010
Conference on Empirical Methods in Natural Language Processing
(EMNLP'10) (pp. 1046-1056). Massachusetts: USA.
Yi, J., Nasukawa, T., Bunescu, R., and Niblack, W. (2003). Sentiment Analyzer:
Extracting Sentiments about a Given Topic Using Natural Language
Processing Techniques. In Proceedings of the 3rd
IEEE International
Conference on Data Mining (ICDM’03) (pp. 427-434). Melbourne,
Florida: USA.
Zeng, X, Chao, L. S., Wong, D. F. and He, L. (2013). iTagger: Part-Of-Speech
Tagging Based on SBCB Learning Algorithm. Applied Mechanics and
Materials. 284-287(1): 3449-3453.

194
Zhang, L., Liu, B., Lim, S., and O'Brien-Strain, E. (2010). Extracting and Ranking
Product Features in Opinion Documents. In Proceedings of the 23rd
International Conference on Computational Linguistics: Posters
(COLING '10) (pp. 1462-1470). Association for Computational Linguistics,
Stroudsburg, PA: USA.
Zhou, L. and Chaovalit, P. (2008). Ontology-Supported Polarity Mining. Journal of
the American Society for Information Science and Technology. 59(1):
98-110.

APPENDIX A
Good Teaching Characteristics
Questionnaire Items
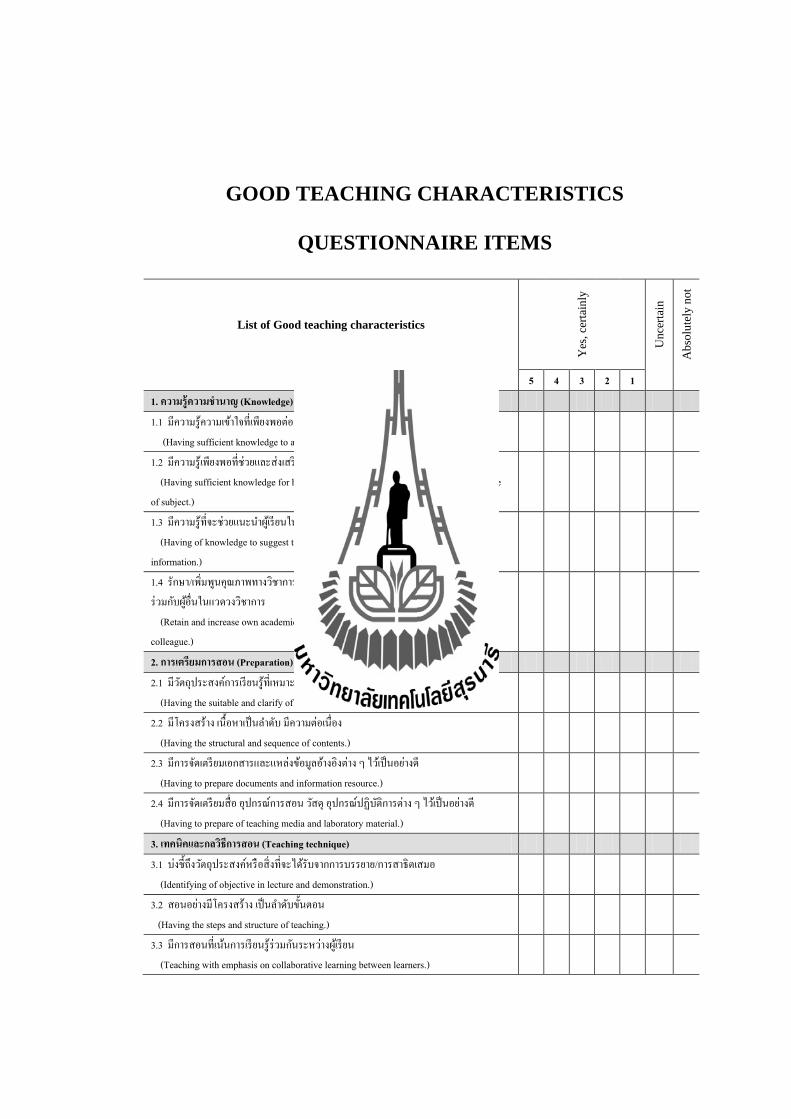
GOOD TEACHING CHARACTERISTICS
QUESTIONNAIRE ITEMS
List of Good teaching characteristics
Yes
, ce
rtai
nly
Un
cert
ain
Ab
solu
tely
no
t
5 4 3 2 1 1. ความรความช านาญ (Knowledge) 1.1 มความรความเขาใจทเพยงพอตอการตอบขอค าถามของผเรยนสวนใหญ (Having sufficient knowledge to answer the most of question from student.)
1.2 มความรเพยงพอทชวยและสงเสรมใหผเรยนรและเขาใจในหลกการของรายวชาได (Having sufficient knowledge for help and support the learner to understand in principle of subject.)
1.3 มความรทจะชวยแนะน าผเรยนในการคนควา หาขอมลสารสนเทศท ถกตอง เหมาะสม (Having of knowledge to suggest the student to research and finding the relevant information.)
1.4 รกษา/เพมพนคณภาพทางวชาการโดยการศกษา คนควา เขารวมกจกรรมหรอท างานรวมกบผอนในแวดวงวชาการ (Retain and increase own academic knowledge from research and participate with colleague.)
2. การเตรยมการสอน (Preparation) 2.1 มวตถประสงคการเรยนรทเหมาะสม ชดเจน (Having the suitable and clarify of objective learning.)
2.2 มโครงสราง เนอหาเปนล าดบ มความตอเนอง (Having the structural and sequence of contents.)
2.3 มการจดเตรยมเอกสารและแหลงขอมลอางองตาง ๆ ไวเปนอยางด (Having to prepare documents and information resource.)
2.4 มการจดเตรยมสอ อปกรณการสอน วสด อปกรณปฏบตการตาง ๆ ไวเปนอยางด (Having to prepare of teaching media and laboratory material.)
3. เทคนคและกลวธการสอน (Teaching technique) 3.1 บงชถงวตถประสงคหรอสงทจะไดรบจากการบรรยาย/การสาธตเสมอ (Identifying of objective in lecture and demonstration.)
3.2 สอนอยางมโครงสราง เปนล าดบขนตอน (Having the steps and structure of teaching.)
3.3 มการสอนทเนนการเรยนรรวมกนระหวางผเรยน (Teaching with emphasis on collaborative learning between learners.)

197
List of Good teaching characteristics
Yes
, ce
rtai
nly
Un
cert
ain
Ab
solu
tely
no
t
5 4 3 2 1 3.4 เปดโอกาสใหผเรยนซกถามทงในและนอกชนเรยน (Giving the opportunities for learner to ask the question, both inside and outside of classroom.)
3.5 สนบสนนใหผเรยนมสวนรวมในการอภปราย (Facilitating the learner to participate in classroom discussion activity.)
3.6 สงเสรมใหผเรยนเกดการเรยนร ศกษา คนควา และทดลองปฏบตไดดวยตนเอง (Supporting the learner to learn, searching, and experimenting by himself.)
3.7 เสรมสรางใหผเรยนเกดความมนใจในความรความสามารถของตน (Supporting the learner to have confidence in knowledge and ability of himself.)
3.8 ใหขอมลยอนกลบไดรวดเรว และเปนประโยชนแกผเรยน (Immediately responding of useful feedback for learner.)
3.9 ใชขอมลเดมและขอมลยอนกลบใหเปนประโยชน เพอการก าหนดแผนและเปาหมายการเรยนรใหเหมาะสม (Utilizing of previous data and feedback for planning and determine the objective learning.)
3.10 ใชขอมลเดมและขอมลยอนกลบใหเปนประโยชน การปรบปรง วธการสอนใหเหมาะสมกบผเรยน (Utilizing of previous data and feedback for adapts teaching process that suitable for learner.)
3.11 พด บรรยายและน าเสนอดวยน าเสยงทชดเจน เปนจงหวะ ระดบเสยงเหมาะสม และแสดงถงความมนใจ (Presenting with the clear sound, has nice rhythm of speaking and showing of confident in lecture.)
3.12 พด บรรยาย/อธบายไดอยาง กระจางชด ไดใจความและมเหตมผล (Explaining with clearly, rationality and concisely.)
3.13 หลกเลยงการใชภาษาทยงยาก/ภาษาสแลง (Avoiding use of complex word or slang word.)
3.14 เขยนบรรยาย ถกตอง ชดเจน เปนระเบยบและอานงาย (Writing to explaining is correct, clearly and easy to read.)
3.15 สาธต/แสดงตวอยาง ในการปฏบตการไดอยางชดเจน และเขาใจไดงาย (Demonstration the practical process with clearly and easy to understand.)
3.16 ใหตวอยาง/สาธตการปฏบตการทชดเจน มจดเชอมโยงระหวางทฤษฎสการปฏบต /ผลลพธและบทสรป (Providing the practical examples and demonstrate with clearly of linkage between theoretical, practical, experimental results and conclusion.)
3.17 ใหตวอยางมความเหมาะสมกบระดบผเรยน ชวยเสรมใหผเรยนมแรงจงใจในการเรยน (Providing the example that suitable for ability and reinforce learner to learning.)

198
List of Good teaching characteristics
Yes
, ce
rtai
nly
Un
cert
ain
Ab
solu
tely
no
t
5 4 3 2 1 3.18 น าเสนอประสบการณการเรยนรของทาน ใหแกผเรยนเพอเปนแบบอยางแกผเรยน (Transferring of self-learning experience as role models for learner.)
3.19 แนะน า/สอดแทรกประสบการณจรงในขณะศกษา ดงาน หรอการออกปฏบตการภาคสนาม (Suggesting and insert the real experience in study activity or in field works.)
3.20 ใหตวอยางทมประโยชนทจะสามารถน าไปประยกตใชไดในชวตประจ าวน (Providing the useful examples that can apply in real life.)
3.21 มทกษะการเขยนบนทกทมประสทธภาพ ตรงประเดนและเขาใจไดงาย (Having skill to note taking in relevant issue and easy to understand.)
3.22 มการสรปประเดนเนอหา ในการบรรยายอยเสมอ (Having of a conclusion of lecture.)
3.23 มการบรหารจดการเวลาในการสอนเนอหาตาง ๆ ไดด (Having a good management of teaching time in each of topics.)
3.24 ดแลและควบคมการสอนในชนเรยนขนาดตาง ๆ ไดเปนอยางด (Having ability to take care and control the teaching in the various class sizes.)
3.25 ควบคมกจกรรม การน าเสนอ อภปรายภายในชนเรยน ใหตรงประเดน และอยในกรอบเวลา (Controlling of classroom activity e.g. presenting, discussion, etc. make it correspond with learning objective and in the time.)
3.26 ทกษะบรรยาย/สาธต และบคลกภาพทดงดดใหผเรยนเกดความสนใจในการเรยนไดด (Having skill that make demonstration and explanation are attractive which affect learners to pay attention to learn.)
3.27 สนใจในรายละเอยดตาง ๆ ทอาจสงผลตอความผดพลาดในการเรยนการสอน (Concern in teaching detail that affect to make mistakes in teaching.)
3.28 สอดแทรกอารมณขน ลดความตงเครยดในชนเรยน (Decreasing of seriously atmosphere of teaching with humor.)
4. การวดและประเมนผล (Assessment) 4.1 ใชขอค าถาม/วธการวดทเหมาะสมกบระดบของผเรยน (Using of questions and measurement methods that suitable with the ability of learner.)
4.2 ใชขอค าถาม/วธการวดทเสรมสรางการเรยนร เชงวเคราะห สงเคราะห (Using of questions and measurement methods that supported the student to have analytical and synthetic thinking.)
4.3 ใชขอค าถามในเชงวนจฉย เพอชวยระบถงจดบกพรองของผเรยน (Using diagnostic question to identify the weakness of learner.)

199
List of Good teaching characteristics
Yes
, ce
rtai
nly
Un
cert
ain
Ab
solu
tely
no
t
5 4 3 2 1 4.4 ใชการบาน/งานมอบทสงเสรมการขยายขอบเขตการเรยนร (Providing assignments and homework that support the learner to extended their boundary of learning.)
4.5 มการวดและประเมนผลอยอยางสม าเสมอ (กอน, ระหวาง, หลงเรยน) (Always having to measure and evaluate of learner (before, during and after teaching).)
4.6 ประเมนผลทสอดคลองตามวตถประสงคการเรยนรของรายวชา (Having the assessment that corresponds with the objective learning.)
4.7 ประเมนผลอยางละเอยดถถวน ครอบคลม ประเดนความร (Assessment with delicate and coverage of all important topic.)
4.8 ประเมนผลเพอน าขอมลไปใชบงชจดบกพรองทควรแกไข (Using information from assessment to indicate the weakness point of teaching and learning.)
5. สอและอปกรณการสอน (Materials) 5.1 ปรบปรง/แกไข เนอหา ความรในสอและเอกสารใหมความถกตอง ทนสมยอยเสมอ (Always update, audit for correctness of contents in documentation for teaching.)
5.2 สอการสอนและเอกสารประกอบการสอน มคณภาพ ชดเจน อานงาย (Having of high quality of teaching media and documents that clearly and easy to read.)
5.3 ใชเทคโนโลยสารสนเทศ (สอและแหลงขอมลอเลกทรอนกส) ไดอยางเหมาะสม (Using of suitable Information technology (media and electronic resources).)
5.4 ใชบคลากร (ผชวยสอน) ชวยสนบสนนการสอนไดอยางเหมาะสม (Using Teaching Assistant to assist in teaching process in suitable manner.)
6. บคลกลกษณะ (Personality) 6.1 กระตอรอรน ตงใจ และรบผดชอบในการสอน (Having of enthusiasm, willingness and responsibility in teaching.)
6.2 ใหเกยรตและเคารพในสทธของผเรยน (Providing of honor and respect the rights of learner.)
6.3 มความเปนกนเอง ไมถอตน (Having a friendly and not haughty.)
6.4 มอารมณขน และมจตใจใหเบกบานเสมอ (Having of humor and always joyfully.)
6.5 มความยตธรรม และใหความเสมอภาค (Having of justice and equality.)
6.6 มเมตตา กรณา (Having benevolence.)
6.7 มความอดทน อดกลน (Having tolerated.)

200
List of Good teaching characteristics
Yes
, ce
rtai
nly
Un
cert
ain
Ab
solu
tely
no
t
5 4 3 2 1 6.9 มระเบยบ สะอาด แตงกายสภาพ (Having orderly, clean and appropriate of dress.)
6.10 มมนษยสมพนธทด เปดเผย พบปะสงคม (Having of good interpersonal skill, disclosure and social interaction.)
6.11 ยอมรบความผดพลาด และพยายามปรบปรงแกไข (Admit a mistake and try to improve.)
6.12 ทมเท ในการสนบสนน ชวยเหลอใหผเรยนทประสบปญหาสามารถกาวผานอปสรรค (Dedicating to support and help learners who are obstacle in overcome those barriers.)
6.13 มปฏสมพนธทดภายในชนเรยนระหวางอาจารยและลกศษย (Having of good interaction of teacher and learner in classroom.)
6.14 สนบสนน ใหก าลงใจและเปนแรงบนดาลใจแกผเรยนอยเสมอ (Providing of support, encouragement and inspiration to students regularly.)
6.15 เขาพบเพอพดคย/ขอค าปรกษาไดงาย (Easy to found for conversation or asking for consult.)
6.16 ใหค าแนะน าทมประโยชนแกผเรยนทประสบปญหา ทงในและนอกชนเรยน (Giving the useful advice to students who are facing the problems, both inside and outside the classroom.)
6.17 มใจกวางเปดรบขอมลและรบทราบความตองการของผเรยน (Having generous, open mind to perceive information and requirement of learner.)
6.18 ดแล เอาใจใส อยางทวถง (เชน การจดจ าชอผเรยน หรอเรองราวทเกยวของกบผเรยนได) (Thoroughly takes care and attention (i.e. can recognize the name of learner or memorize the stories of learner).)

APPENDIX B
List of Initial Vocabulary of
Good Teaching Characteristics

LIST OF INITIAL VOCABULARY
OF GOOD TEACHING CHARACTERISTICS
SEED WORDS
Kn
ow
led
ge
Tea
chin
g
pre
pa
rati
on
Tea
chin
g
tech
niq
ues
an
d
stra
teg
ies
Mea
sure
men
t a
nd
eva
lua
tio
n
Tea
chin
g m
edia
an
d m
ate
ria
ls
Per
son
ali
ty
LIST OF NOUNS
Ability
Activity
Adapts
Administration
Admit
Advice
Assessment
Assignments
Atmosphere
Attention
Audit
Avoiding
Barriers
Benevolence
Boundary
Care
Class
Classroom

203
SEED WORDS
Kn
ow
led
ge
Tea
chin
g
pre
pa
rati
on
Tea
chin
g
tech
niq
ues
an
d
stra
teg
ies
Mea
sure
men
t a
nd
eva
lua
tio
n
Tea
chin
g m
edia
an
d m
ate
ria
ls
Per
son
ali
ty
Colleague
Concern
Conclusion
Confidence
Contents
Conversation
Correctness
Coverage
Data
Demonstration
Detail
Disclosure
Discussion
Document
Documentation
Dress
Emphasis
Encouragement
Enthusiasm
Equality
Evaluation
Examples
Experience
Explanation
Feedbacks
Field

204
SEED WORDS
Kn
ow
led
ge
Tea
chin
g
pre
pa
rati
on
Tea
chin
g
tech
niq
ues
an
d
stra
teg
ies
Mea
sure
men
t a
nd
eva
lua
tio
n
Tea
chin
g m
edia
an
d m
ate
ria
ls
Per
son
ali
ty
Help
Himself
Honor
Human
Humility
Humor
Increase
Information
Information technology
Inspiration
Interaction
Issue
Justice
Knowledge
Laboratory
Learner
Learning
Lecture
Life
Linkage
Management
Manner
Material
Measurement
Media
Methods

205
SEED WORDS
Kn
ow
led
ge
Tea
chin
g
pre
pa
rati
on
Tea
chin
g
tech
niq
ues
an
d
stra
teg
ies
Mea
sure
men
t a
nd
eva
lua
tio
n
Tea
chin
g m
edia
an
d m
ate
ria
ls
Per
son
ali
ty
Mind
Mistakes
Models
Name
Objective
Obstacle
Opportunities
Personal
Personality
Planning
Point
Preparation
Principle
Problems
Process
Quality
Question
Rationality
Relationship
Requirement
Research
Resource
Responsibility
Results
Retain
Rhythm

206
SEED WORDS
Kn
ow
led
ge
Tea
chin
g
pre
pa
rati
on
Tea
chin
g
tech
niq
ues
an
d
stra
teg
ies
Mea
sure
men
t a
nd
eva
lua
tio
n
Tea
chin
g m
edia
an
d m
ate
ria
ls
Per
son
ali
ty
Rights
Role
Sequence
Size
Skill
Slang
Sound
Steps
Stories
Structure
Student
Study
Subject
Support
Teacher
Teaching
Teaching assistant
Technique
Thinking
Thoroughly
Time
Topic
Transfer
Use
Weakness
Willingness

207
SEED WORDS
Kn
ow
led
ge
Tea
chin
g
pre
pa
rati
on
Tea
chin
g
tech
niq
ues
an
d
stra
teg
ies
Mea
sure
men
t a
nd
eva
lua
tio
n
Tea
chin
g m
edia
an
d m
ate
ria
ls
Per
son
ali
ty
Word
Works
LIST OF VERBS
Affect
Answer
Applied
Are
Asking
Assist
Centered
Clarity
Consult
Control
Controlling
Correspond
Decreasing
Dedicating
Demonstrate
Determine
Evaluate
Experimenting
Explaining
Extended
Facilitating
Facing
Finding

208
SEED WORDS
Kn
ow
led
ge
Tea
chin
g
pre
pa
rati
on
Tea
chin
g
tech
niq
ues
an
d
stra
teg
ies
Mea
sure
men
t a
nd
eva
lua
tio
n
Tea
chin
g m
edia
an
d m
ate
ria
ls
Per
son
ali
ty
Found
Giving
Has
Having
Help
Home works
Identifying
Improve
Indicate
Insert
Learn
Make
Measure
Memorize
Note taking
Overcome
Participate
Pay
Perceive
Prepare
Presenting
Providing
Read
Recognize
Reinforce
Respect
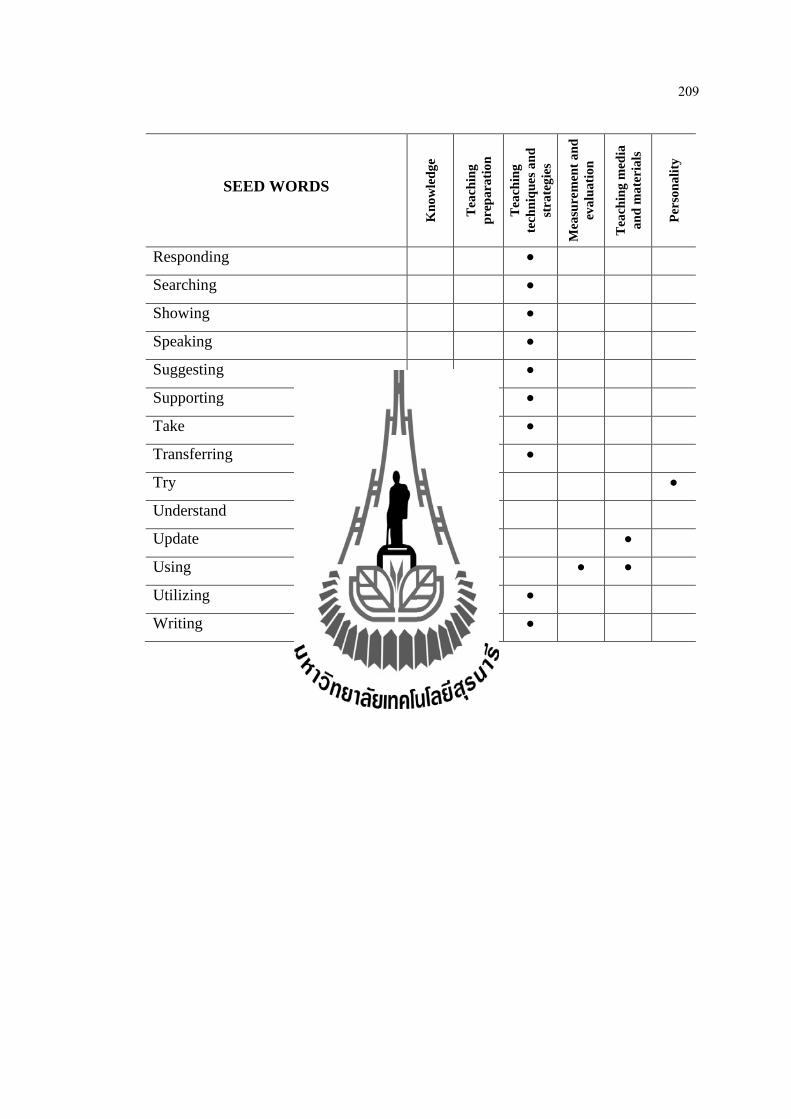
209
SEED WORDS
Kn
ow
led
ge
Tea
chin
g
pre
pa
rati
on
Tea
chin
g
tech
niq
ues
an
d
stra
teg
ies
Mea
sure
men
t a
nd
eva
lua
tio
n
Tea
chin
g m
edia
an
d m
ate
ria
ls
Per
son
ali
ty
Responding
Searching
Showing
Speaking
Suggesting
Supporting
Take
Transferring
Try
Understand
Update
Using
Utilizing
Writing

CURRICULUM VITAE
Mr. Somjin Phiakoksong was born on December 26, 1977 in Nakhon
Ratchasima Province, Thailand. He received Bachelor of Measurement and Evaluation
in Education from Nakhon Ratchasima Ratchabhat University. In 2008, he got
a potential graduate scholarship and received Master of Information Science from
Suranaree University of Technology, Thailand in 2010. In 2011, he pursues his
doctoral degree in Information Technology Program at Suranaree University of
Technology. His major research interests are in Statistical analysis, Knowledge
management and Data and text mining.
Copyright © 2022 FDOKUMEN

