


Bahasa
Halaman
Hukum

arX
iv:0
810.
4995
v1 [
astr
o-ph
] 2
8 O
ct 2
008
Observation of an anomalous positron abundance in the cosmic
radiation
O. Adriani,1, 2 G. C. Barbarino,3, 4 G. A. Bazilevskaya,5 R. Bellotti,6, 7 M. Boezio,8 E. A.
Bogomolov,9 L. Bonechi,1, 2 M. Bongi,2 V. Bonvicini,8 S. Bottai,2 A. Bruno,6, 7 F. Cafagna,7
D. Campana,4 P. Carlson,10 M. Casolino,11 G. Castellini,12 M. P. De Pascale,11, 13 G. De
Rosa,4 N. De Simone,11, 13 V. Di Felice,11, 13 A. M. Galper,14 L. Grishantseva,14 P.
Hofverberg,10 A. Leonov,14 S. V. Koldashov,14 S. Y. Krutkov,9 A. N. Kvashnin,15 V.
Malvezzi,11 L. Marcelli,11 W. Menn,16 V. V. Mikhailov,14 E. Mocchiutti,8 S. Orsi,10 G.
Osteria,4 P. Papini,2 M. Pearce,10 P. Picozza,11, 13 M. Ricci,17 S. B. Ricciarini,2 M. Simon,16
R. Sparvoli,11, 13 P. Spillantini,1, 2 Y. I. Stozhkov,15 A. Vacchi,8 E. Vannuccini,2 G.
Vasilyev,9 S. A. Voronov,14 Y. T. Yurkin,14 G. Zampa,8 N. Zampa,8 and V. G. Zverev14
1Physics Department of University of Florence,
I-50019 Sesto Fiorentino, Florence, Italy
2INFN, Sezione di Florence, I-50019 Sesto Fiorentino, Florence, Italy
3Physics Department of University of Naples “Federico II”, I-80126 Naples, Italy
4INFN, Sezione di Naples, I-80126 Naples, Italy
5Lebedev Physical Institute, Leninsky Prospekt 53, RU-119991 Moscow, Russia
6Physics Department of University of Bari, I-70126 Bari, Italy
7INFN, Sezione di Bari, I-70126 Bari, Italy
8INFN, Sezione di Trieste, I-34012 Trieste, Italy
9Ioffe Physical Technical Institute, RU-194021 St. Petersburg, Russia
10Physics Department of the Royal Institute of
Technology (KTH), SE-10691 Stockholm, Sweden
11INFN, Sezione di Rome “Tor Vergata”, I-00133 Rome, Italy
12 IFAC, I-50019 Sesto Fiorentino, Florence, Italy
13Physics Department of University of Rome “Tor Vergata”, I-00133 Rome, Italy
14Moscow Engineering and Physics Institute, RU-11540 Moscow, Russia
15Lebedev Physical Institute, RU-119991 Moscow, Russia
16Physics Department of Universitat Siegen, D-57068 Siegen, Germany
17INFN, Laboratori Nazionali di Frascati,
1
Via Enrico Fermi 40, I-00044 Frascati, Italy
(Dated: October 28, 2008)
Abstract
Positrons are known to be produced in interactions between cosmic-ray nuclei and interstellar
matter (“secondary production”). Positrons may, however, also be created by dark matter particle
annihilations in the galactic halo or in the magnetospheres of near-by pulsars. The nature of
dark matter is one of the most prominent open questions in science today. An observation of
positrons from pulsars would open a new observation window on these sources. Here we present
results from the PAMELA satellite experiment on the positron abundance in the cosmic radiation
for the energy range 1.5 - 100 GeV. Our high energy data deviate significantly from predictions of
secondary production models, and may constitute the first indirect evidence of dark matter particle
annihilations, or the first observation of positron production from near-by pulsars. We also present
evidence that solar activity significantly affects the abundance of positrons at low energies.
2
Measurements of cosmic-ray positrons (e+) and electrons (e−) address a number of ques-
tions in contemporary astrophysics, such as the nature and distribution of particle sources
in our galaxy, and the subsequent propagation of cosmic-rays through the galaxy and the
solar magnetosphere. Positrons are believed to be mainly created in secondary production
processes resulting from the interaction of cosmic-ray nuclei with the interstellar gas. A
ratio of positron and electron fluxes (φ), the positron fraction, φ(e+) / (φ(e+) + φ(e−)), can
be used to investigate possible primary sources. If secondary production dominates, the
positron fraction is expected to fall as a smooth function of increasing energy.
The energy budget of the Universe can be broken down into baryonic matter (about 5%),
dark matter (about 23%) and dark energy (about 72%) (e.g.[1]). Many particle candidates
have been proposed for the dark matter component. The most widely studied are the
neutralino from supersymmetric models (e.g.[2]) and the lightest Kaluza Klein particle from
extra dimension models (e.g.[3]). The gravitino (e.g.[4]) is also an interesting candidate.
High energy antiparticles such as positrons[5, 6, 7, 8, 9, 10, 11, 12, 13] and antiprotons[2, 14]
can be produced during the annihilation or decay of these dark matter particles in our galaxy.
In a previous publication[15] we presented the antiproton-to-proton flux ratio in the energy
range 1-100 GeV. The data follow the trend expected from secondary production calculations
for antiprotons and place significant constraints on contributions to the antiproton flux
from dark matter particle annihilations. The possible production of positrons from nearby
astrophysical sources, such as pulsars[16, 17, 18, 19, 20], must be taken into account when
interpreting potential dark matter signals.
Cosmic-ray positrons and electrons have been studied mainly by balloon-borne instru-
ments with correspondingly short observation times, and significant atmospheric overburden
(for a review see[21]). Their results show large discrepancies, especially at high energies
(above 10 GeV). This high energy region is the most interesting since the poorly understood
modulation of particle fluxes by the solar wind has no relevant effect and possible signatures
of primary components should be most evident. Although too statistically limited to draw
any significant conclusions, the most recent high energy measurements[22, 23, 24] indicate
a flatter positron fraction than expected from secondary production models.
3
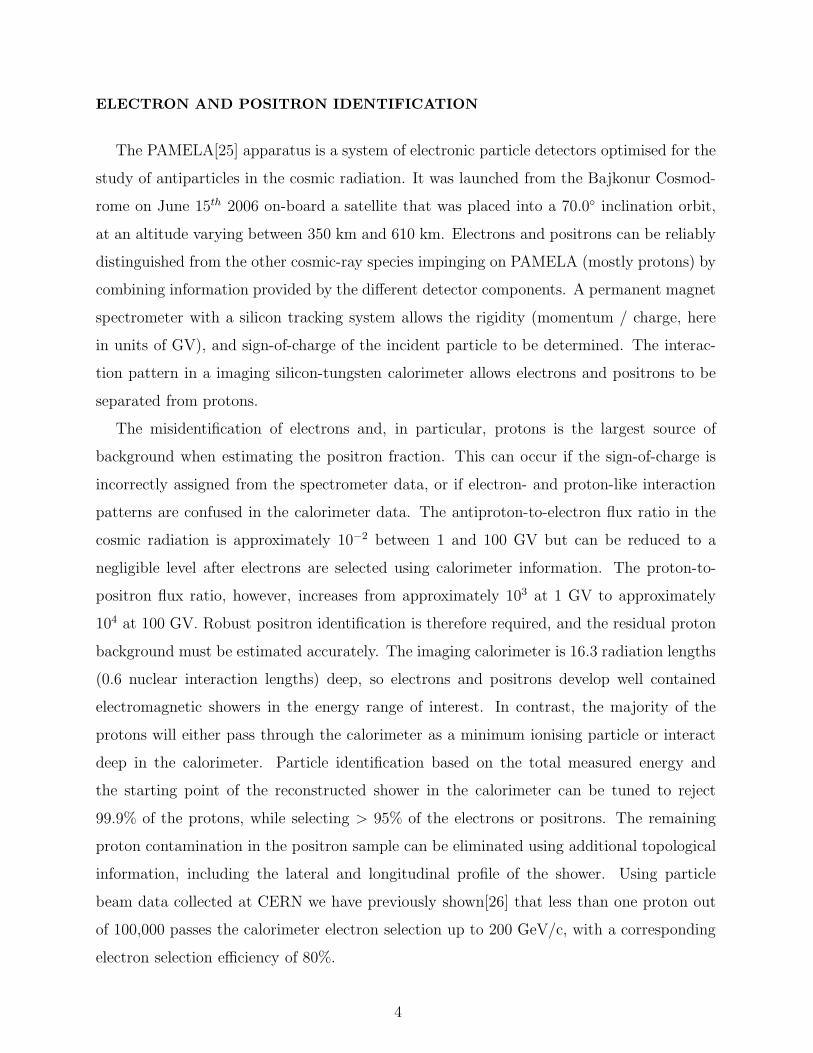
ELECTRON AND POSITRON IDENTIFICATION
The PAMELA[25] apparatus is a system of electronic particle detectors optimised for the
study of antiparticles in the cosmic radiation. It was launched from the Bajkonur Cosmod-
rome on June 15th 2006 on-board a satellite that was placed into a 70.0◦ inclination orbit,
at an altitude varying between 350 km and 610 km. Electrons and positrons can be reliably
distinguished from the other cosmic-ray species impinging on PAMELA (mostly protons) by
combining information provided by the different detector components. A permanent magnet
spectrometer with a silicon tracking system allows the rigidity (momentum / charge, here
in units of GV), and sign-of-charge of the incident particle to be determined. The interac-
tion pattern in a imaging silicon-tungsten calorimeter allows electrons and positrons to be
separated from protons.
The misidentification of electrons and, in particular, protons is the largest source of
background when estimating the positron fraction. This can occur if the sign-of-charge is
incorrectly assigned from the spectrometer data, or if electron- and proton-like interaction
patterns are confused in the calorimeter data. The antiproton-to-electron flux ratio in the
cosmic radiation is approximately 10−2 between 1 and 100 GV but can be reduced to a
negligible level after electrons are selected using calorimeter information. The proton-to-
positron flux ratio, however, increases from approximately 103 at 1 GV to approximately
104 at 100 GV. Robust positron identification is therefore required, and the residual proton
background must be estimated accurately. The imaging calorimeter is 16.3 radiation lengths
(0.6 nuclear interaction lengths) deep, so electrons and positrons develop well contained
electromagnetic showers in the energy range of interest. In contrast, the majority of the
protons will either pass through the calorimeter as a minimum ionising particle or interact
deep in the calorimeter. Particle identification based on the total measured energy and
the starting point of the reconstructed shower in the calorimeter can be tuned to reject
99.9% of the protons, while selecting > 95% of the electrons or positrons. The remaining
proton contamination in the positron sample can be eliminated using additional topological
information, including the lateral and longitudinal profile of the shower. Using particle
beam data collected at CERN we have previously shown[26] that less than one proton out
of 100,000 passes the calorimeter electron selection up to 200 GeV/c, with a corresponding
electron selection efficiency of 80%.
4
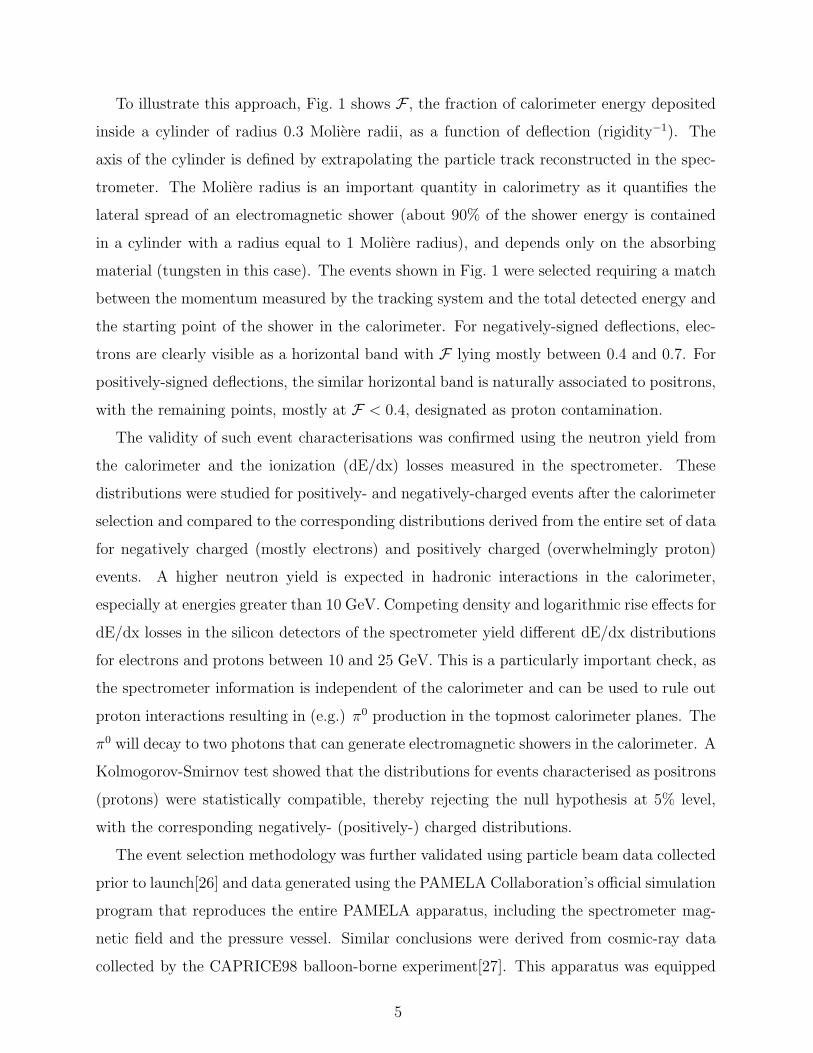
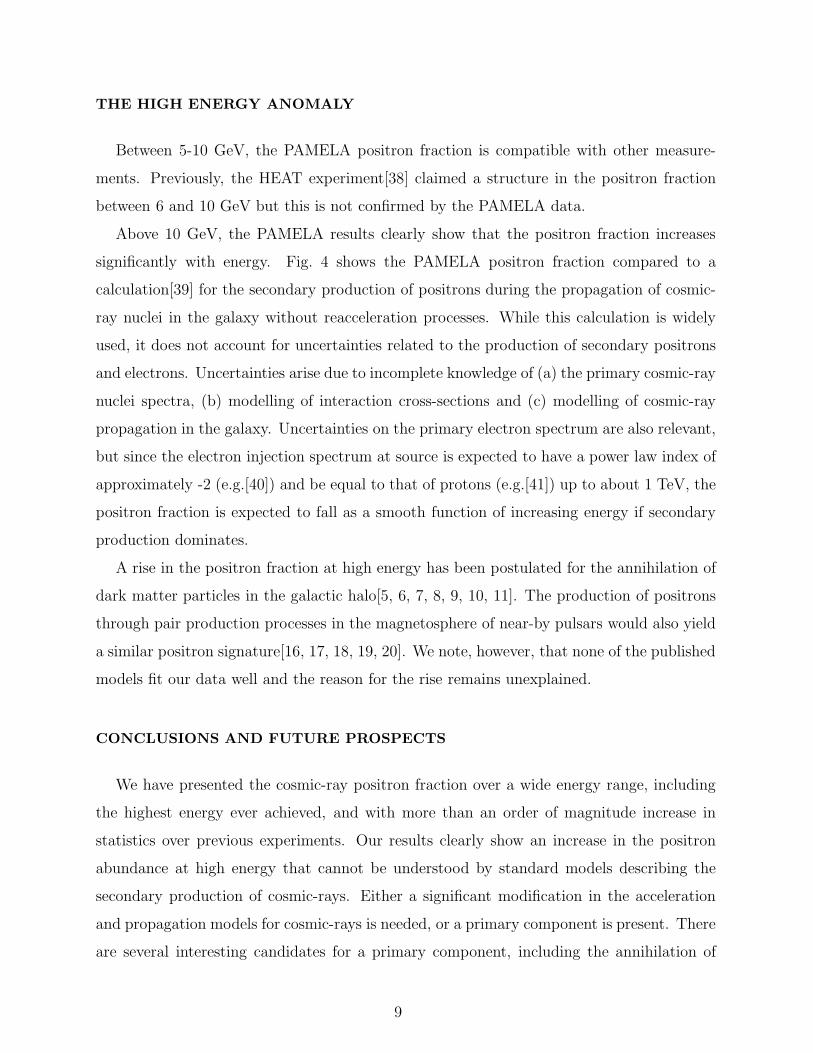
To illustrate this approach, Fig. 1 shows F , the fraction of calorimeter energy deposited
inside a cylinder of radius 0.3 Moliere radii, as a function of deflection (rigidity−1). The
axis of the cylinder is defined by extrapolating the particle track reconstructed in the spec-
trometer. The Moliere radius is an important quantity in calorimetry as it quantifies the
lateral spread of an electromagnetic shower (about 90% of the shower energy is contained
in a cylinder with a radius equal to 1 Moliere radius), and depends only on the absorbing
material (tungsten in this case). The events shown in Fig. 1 were selected requiring a match
between the momentum measured by the tracking system and the total detected energy and
the starting point of the shower in the calorimeter. For negatively-signed deflections, elec-
trons are clearly visible as a horizontal band with F lying mostly between 0.4 and 0.7. For
positively-signed deflections, the similar horizontal band is naturally associated to positrons,
with the remaining points, mostly at F < 0.4, designated as proton contamination.
The validity of such event characterisations was confirmed using the neutron yield from
the calorimeter and the ionization (dE/dx) losses measured in the spectrometer. These
distributions were studied for positively- and negatively-charged events after the calorimeter
selection and compared to the corresponding distributions derived from the entire set of data
for negatively charged (mostly electrons) and positively charged (overwhelmingly proton)
events. A higher neutron yield is expected in hadronic interactions in the calorimeter,
especially at energies greater than 10 GeV. Competing density and logarithmic rise effects for
dE/dx losses in the silicon detectors of the spectrometer yield different dE/dx distributions
for electrons and protons between 10 and 25 GeV. This is a particularly important check, as
the spectrometer information is independent of the calorimeter and can be used to rule out
proton interactions resulting in (e.g.) π0 production in the topmost calorimeter planes. The
π0 will decay to two photons that can generate electromagnetic showers in the calorimeter. A
Kolmogorov-Smirnov test showed that the distributions for events characterised as positrons
(protons) were statistically compatible, thereby rejecting the null hypothesis at 5% level,
with the corresponding negatively- (positively-) charged distributions.
The event selection methodology was further validated using particle beam data collected
prior to launch[26] and data generated using the PAMELA Collaboration’s official simulation
program that reproduces the entire PAMELA apparatus, including the spectrometer mag-
netic field and the pressure vessel. Similar conclusions were derived from cosmic-ray data
collected by the CAPRICE98 balloon-borne experiment[27]. This apparatus was equipped
5
with a similar but thinner (7 radiation lengths) silicon-tungsten calorimeter. A gas-RICH
detector allowed background-free samples of protons (i.e. no positron contamination) to be
selected up to 50 GeV. Within the limits of available statistics, the reconstructed proton
and electron/positron lateral energy distributions were fully consistent with those obtained
with the PAMELA calorimeter.
BACKGROUND ESTIMATION
While the distribution shown in Fig. 1 presents a clear positron signature, the residual
proton background distribution must be quantified. This distribution was obtained using
the flight calorimeter data. There was no dependence on simulations. The total calorimeter
depth of 22 detector planes was divided in two non-mutually exclusive parts: an upper part
comprising planes 1-20, and a lower part comprising planes 3-22. Calorimeter variables (e.g.
total detected energy, and lateral shower spread) were evaluated for both parts. Electrons
and positrons can be identified in the upper part of the calorimeter using the total detected
energy and the starting point of the shower. The positron component in positively charged
events can be significantly reduced by selecting particles that do not interact in the first
2 planes (only 2% of electrons and positrons with rigidities greater than 1.5 GV pass this
condition). This results in a nearly pure sample of protons entering the lower part of the
calorimeter (planes 3-22). The procedure was validated using simulations. As an example
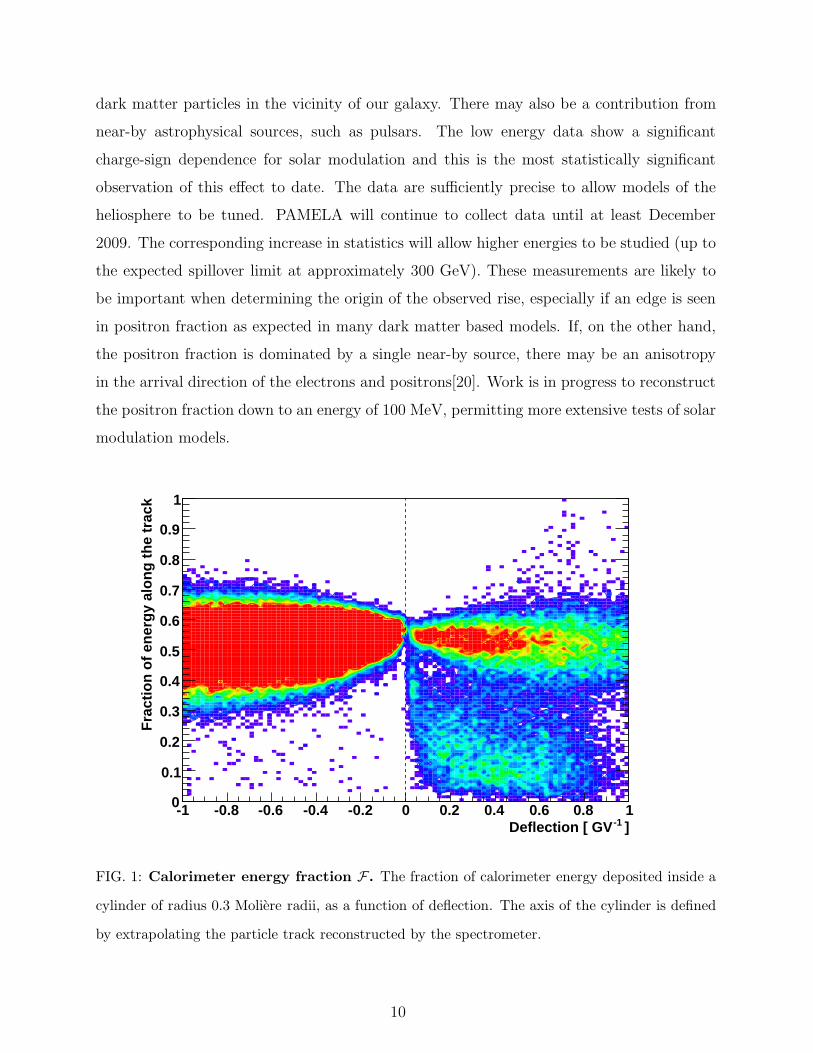
Fig. 2a shows the energy fraction variable, F , for negatively charged particles in the rigidity
range 28–42 GV selected as electrons in the upper half of the calorimeter. Panels (b) and
(c) show the F distributions for positively-charged particles obtained for the lower (upper)
part of the calorimeter, i.e. protons (protons and positrons). The distributions in panels
(a) and (b) are clearly different while panel (c) shows a mixture of the two distributions,
which strongly supports the positron interpretation for the electron-like F distribution in
the sample of positively charged events. A parametric bootstrap analysis with maximum
likelihood fitting was performed on the distributions shown in Fig. 2 for a number of rigidity
intervals, and the numbers of detected electrons, positrons, and contaminating protons were
obtained. As a cross-check, a non-parametric statistic analysis, using Kolmogorov-Smirnov
tests, were applied to electron, positron and proton distributions. The results (numbers
of identified positrons and protons) were statistically consistent (well within one standard
6
deviation) with those obtained using the parametric method.
THE POSITRON FRACTION
The results presented here are based on the data-set collected by PAMELA between July
2006 and February 2008. More than 109 triggers were accumulated during a total acqui-
sition time of approximately 500 days. From these triggered events 151,672 electrons and
9,430 positrons were identified in the energy interval 1.5 - 100 GeV. Results are presented
as a positron fraction and are shown in Table I. The detection efficiencies for electrons and
positrons are assumed to cancel since the physical processes that these species undergo in
the PAMELA detectors can be assumed to be identical across the energy range of interest.
Possible bias arising from a sign-of-charge dependence on the acceptance due to the spec-
trometer magnetic field configuration and East-West effects caused by the Earth’s magnetic
field were excluded as follows. Effects due to the spectrometer magnetic field were stud-
ied using the PAMELA Collaboration’s simulation software. No significant difference was
found between the electron and positron detection efficiency above 1 GV. East-West effects
as well as contamination from re-entrant albedo particles (secondary particles produced by
cosmic-rays interacting with the Earth’s atmosphere that are scattered upward but lack suf-
ficient energy to leave the Earth’s magnetic field and re-enter the atmosphere in the opposite
hemisphere but at a similar magnetic latitude) are significant around and below the lowest
permitted rigidity for a charged cosmic-ray to reach the Earth from infinite distance, known
as the geomagnetic cut-off. The geomagnetic cut-off for the PAMELA orbit varies from
less than 100 MV for the highest orbital latitudes to approximately 15 GV for equatorial
regions. In this work, only events with a measured rigidity exceeding the estimated vertical
(PAMELA z-axis) geomagnetic cut-off by a factor of 1.3 were considered. This reduced
East-West effects and re-entrant particle contamination to a negligible amount. The ver-
tical geomagnetic cut-off was determined following the Størmer formalism (e.g.[28]) on an
event-by-event basis and using orbital parameters reconstructed at a rate of 1 Hz.
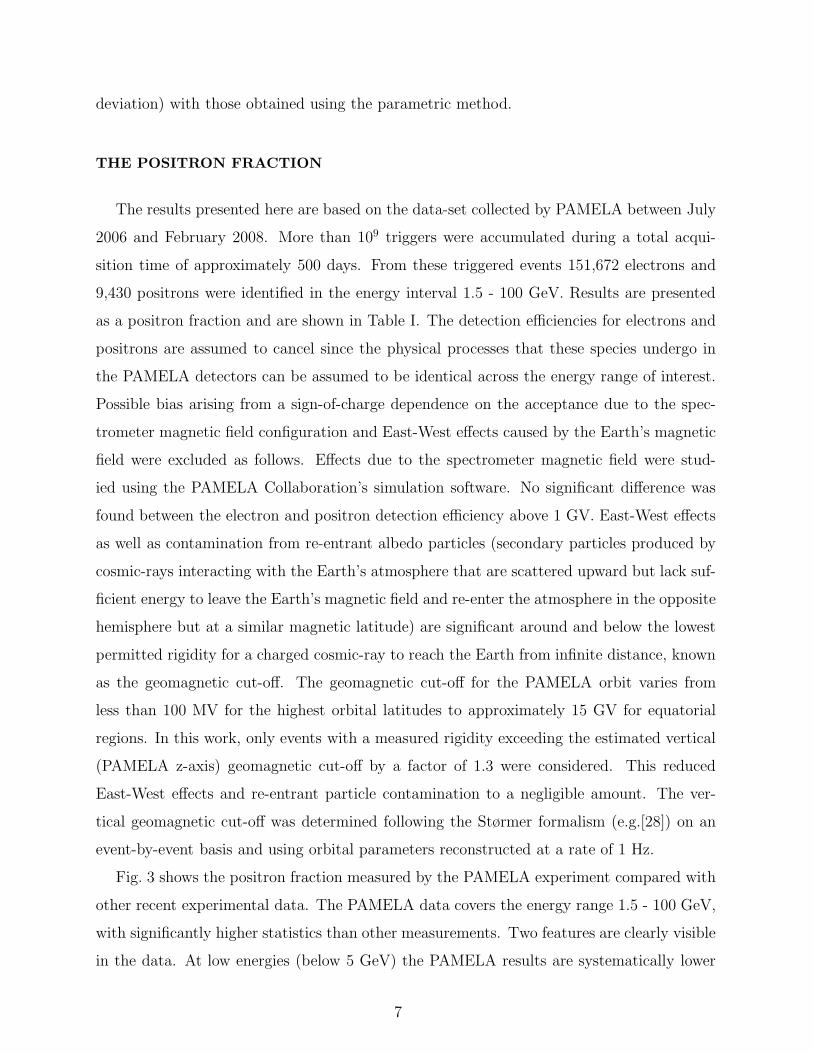
Fig. 3 shows the positron fraction measured by the PAMELA experiment compared with
other recent experimental data. The PAMELA data covers the energy range 1.5 - 100 GeV,
with significantly higher statistics than other measurements. Two features are clearly visible
in the data. At low energies (below 5 GeV) the PAMELA results are systematically lower
7
than data collected during the 1990’s and at high energies (above 10 GeV) the PAMELA
results show that the positron fraction increases significantly with energy.
OBSERVATION OF CHARGE-SIGN DEPENDENT SOLAR MODULATION EF-
FECTS
The solar wind modifies the energy spectra of cosmic-rays within the solar system. This
effect is called solar modulation and can have a significant effect on cosmic-rays with energies
less than about 10 GeV. The amount of solar modulation depends on solar activity, which
has an approximately sinusoidal time dependence and is most evident at solar maximum,
when the low energy cosmic ray flux is at a minimum. The peak-to-peak period is 11 years,
but a complete ’solar cycle’ is 22 years long since at each maximum the polarity of the solar
magnetic field reverses. The low energy difference between the PAMELA results and those
from CAPRICE94[32], HEAT95[31] and AMS-01[33] are interpreted as a consequence of
solar modulation effects. These older results were collected during the previous solar cycle
which favored positively-charged particles due to the solar polarity. Indications that solar
modulation effects depend on the cosmic-ray sign-of-charge have been clearly seen in the
antiproton-to-proton flux ratio measured before and after the most recent (2000) reversal of
the solar magnetic field by a series of flights of the BESS balloon-borne experiment[36]. In
this case, solar modulation effects were seen mostly at low rigidities (<2 GV), and during
a period of maximum solar activity. During the period of solar minimum corresponding to
PAMELA data taking, solar modulation becomes negligible in the BESS data-set. The low
cosmic-ray antiproton flux limits a detailed study of this effect. In the PAMELA data-set,
charge dependent solar modulation effects on electrons and positrons are evident up to nearly
5 GV, even during the current period of minimum solar activity. Contemporary models
interpret charge-sign dependent modulation in the heliosphere as being due to gradient,
curvature and current sheet drift effects[37]. Drift effects are at their largest during solar
minimum conditions and mostly affect low mass particles such as electrons and positrons,
with electrons being favoured in the current solar cycle. A balloon-borne experiment which
flew in June 2006 has also observed a low positron fraction[35] at low energies, but with
large statistical uncertainties.
8
THE HIGH ENERGY ANOMALY
Between 5-10 GeV, the PAMELA positron fraction is compatible with other measure-
ments. Previously, the HEAT experiment[38] claimed a structure in the positron fraction
between 6 and 10 GeV but this is not confirmed by the PAMELA data.
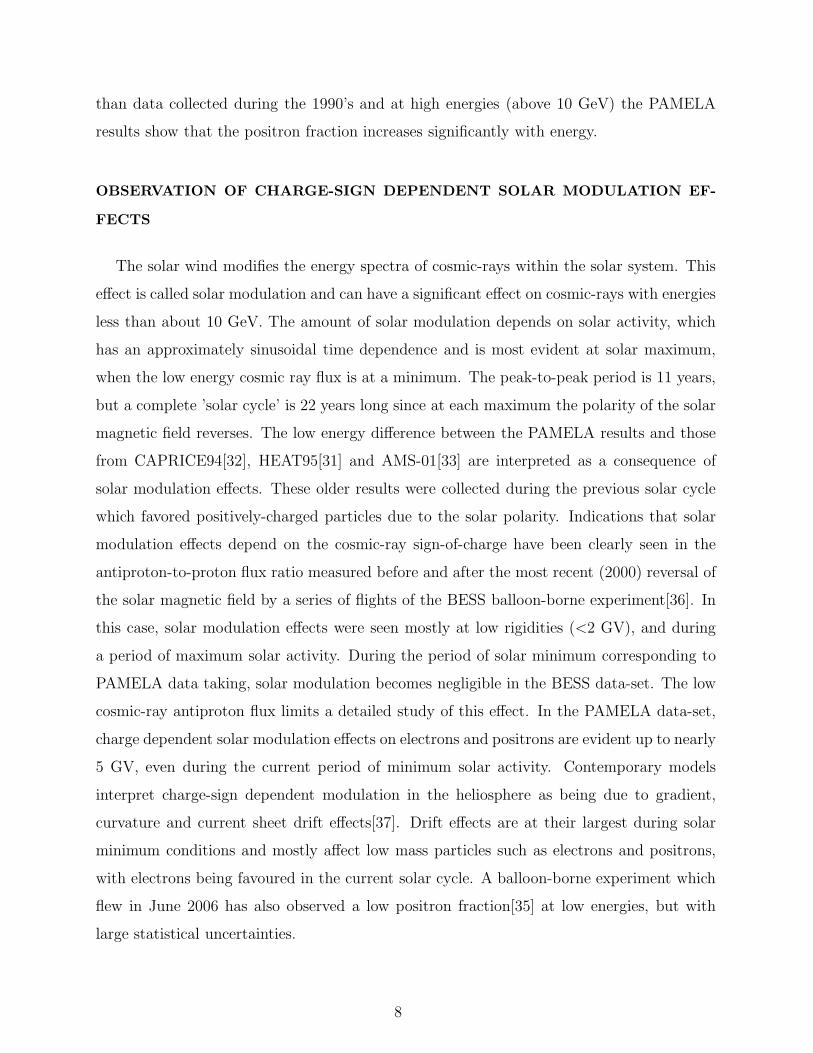
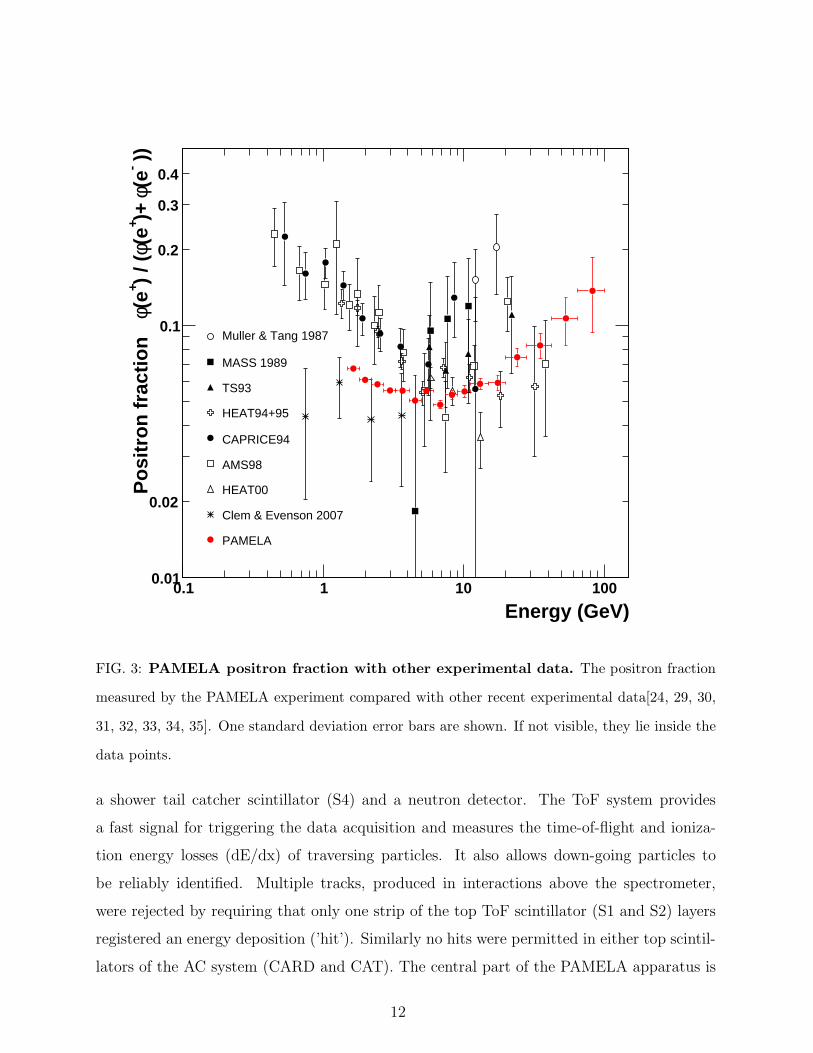
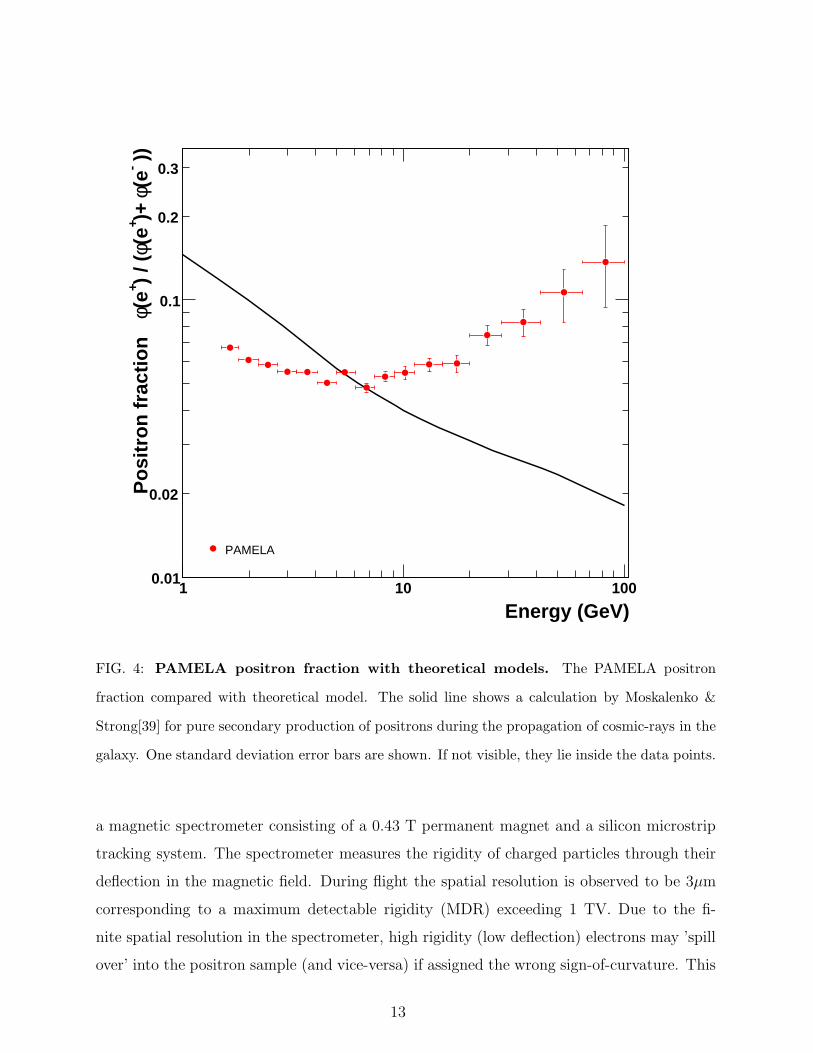
Above 10 GeV, the PAMELA results clearly show that the positron fraction increases
significantly with energy. Fig. 4 shows the PAMELA positron fraction compared to a
calculation[39] for the secondary production of positrons during the propagation of cosmic-
ray nuclei in the galaxy without reacceleration processes. While this calculation is widely
used, it does not account for uncertainties related to the production of secondary positrons
and electrons. Uncertainties arise due to incomplete knowledge of (a) the primary cosmic-ray
nuclei spectra, (b) modelling of interaction cross-sections and (c) modelling of cosmic-ray
propagation in the galaxy. Uncertainties on the primary electron spectrum are also relevant,
but since the electron injection spectrum at source is expected to have a power law index of
approximately -2 (e.g.[40]) and be equal to that of protons (e.g.[41]) up to about 1 TeV, the
positron fraction is expected to fall as a smooth function of increasing energy if secondary
production dominates.
A rise in the positron fraction at high energy has been postulated for the annihilation of
dark matter particles in the galactic halo[5, 6, 7, 8, 9, 10, 11]. The production of positrons
through pair production processes in the magnetosphere of near-by pulsars would also yield
a similar positron signature[16, 17, 18, 19, 20]. We note, however, that none of the published
models fit our data well and the reason for the rise remains unexplained.
CONCLUSIONS AND FUTURE PROSPECTS
We have presented the cosmic-ray positron fraction over a wide energy range, including
the highest energy ever achieved, and with more than an order of magnitude increase in
statistics over previous experiments. Our results clearly show an increase in the positron
abundance at high energy that cannot be understood by standard models describing the
secondary production of cosmic-rays. Either a significant modification in the acceleration
and propagation models for cosmic-rays is needed, or a primary component is present. There
are several interesting candidates for a primary component, including the annihilation of
9
dark matter particles in the vicinity of our galaxy. There may also be a contribution from
near-by astrophysical sources, such as pulsars. The low energy data show a significant
charge-sign dependence for solar modulation and this is the most statistically significant
observation of this effect to date. The data are sufficiently precise to allow models of the
heliosphere to be tuned. PAMELA will continue to collect data until at least December
2009. The corresponding increase in statistics will allow higher energies to be studied (up to
the expected spillover limit at approximately 300 GeV). These measurements are likely to
be important when determining the origin of the observed rise, especially if an edge is seen
in positron fraction as expected in many dark matter based models. If, on the other hand,
the positron fraction is dominated by a single near-by source, there may be an anisotropy
in the arrival direction of the electrons and positrons[20]. Work is in progress to reconstruct
the positron fraction down to an energy of 100 MeV, permitting more extensive tests of solar
modulation models.
]-1Deflection [ GV-1 -0.8 -0.6 -0.4 -0.2 0 0.2 0.4 0.6 0.8 1
Fra
ctio
n o
f en
erg
y al
on
g t
he
trac
k
0
0.1
0.2
0.3
0.4
0.5
0.6
0.7
0.8
0.9
1
FIG. 1: Calorimeter energy fraction F. The fraction of calorimeter energy deposited inside a
cylinder of radius 0.3 Moliere radii, as a function of deflection. The axis of the cylinder is defined
by extrapolating the particle track reconstructed by the spectrometer.
10
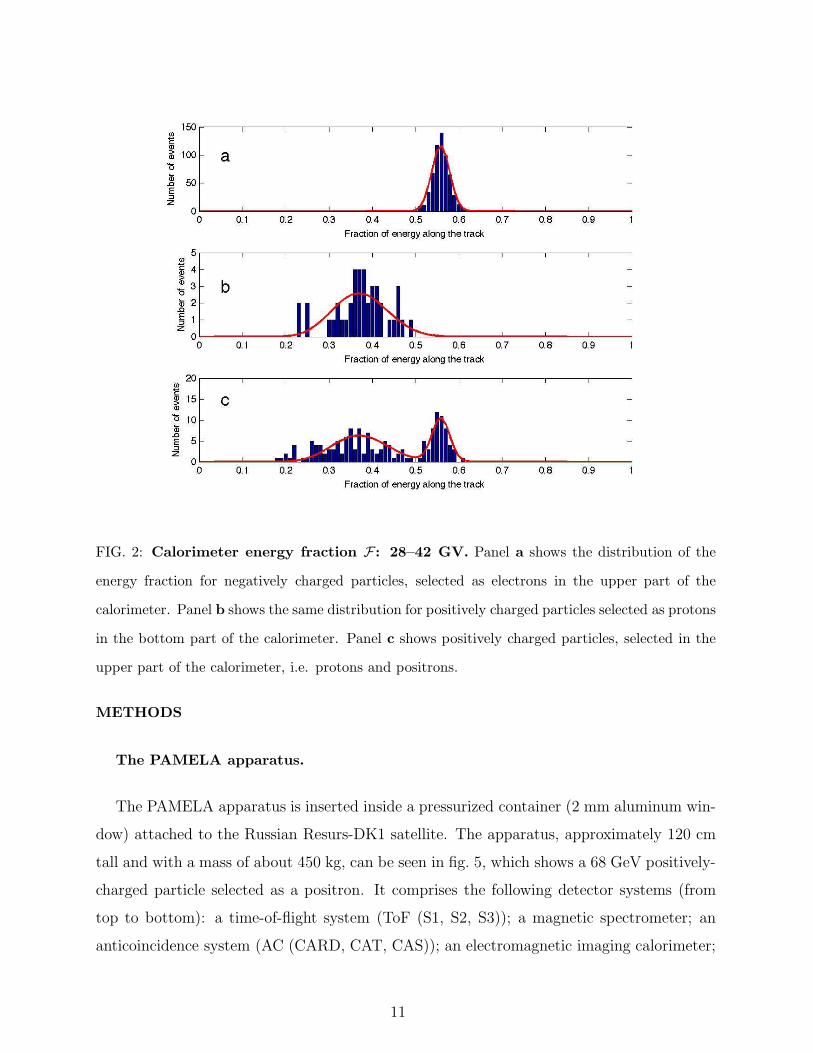
FIG. 2: Calorimeter energy fraction F: 28–42 GV. Panel a shows the distribution of the
energy fraction for negatively charged particles, selected as electrons in the upper part of the
calorimeter. Panel b shows the same distribution for positively charged particles selected as protons
in the bottom part of the calorimeter. Panel c shows positively charged particles, selected in the
upper part of the calorimeter, i.e. protons and positrons.
METHODS
The PAMELA apparatus.
The PAMELA apparatus is inserted inside a pressurized container (2 mm aluminum win-
dow) attached to the Russian Resurs-DK1 satellite. The apparatus, approximately 120 cm
tall and with a mass of about 450 kg, can be seen in fig. 5, which shows a 68 GeV positively-
charged particle selected as a positron. It comprises the following detector systems (from
top to bottom): a time-of-flight system (ToF (S1, S2, S3)); a magnetic spectrometer; an
anticoincidence system (AC (CARD, CAT, CAS)); an electromagnetic imaging calorimeter;
11
Energy (GeV)0.1 1 10 100
))
-(eφ
)+
+(eφ
) / (
+(eφ
Po
sitr
on
fra
ctio
n
0.01
0.02
0.1
0.2
0.3
0.4
Muller & Tang 1987
MASS 1989
TS93
HEAT94+95
CAPRICE94
AMS98
HEAT00
Clem & Evenson 2007
PAMELA
FIG. 3: PAMELA positron fraction with other experimental data. The positron fraction
measured by the PAMELA experiment compared with other recent experimental data[24, 29, 30,
31, 32, 33, 34, 35]. One standard deviation error bars are shown. If not visible, they lie inside the
data points.
a shower tail catcher scintillator (S4) and a neutron detector. The ToF system provides
a fast signal for triggering the data acquisition and measures the time-of-flight and ioniza-
tion energy losses (dE/dx) of traversing particles. It also allows down-going particles to
be reliably identified. Multiple tracks, produced in interactions above the spectrometer,
were rejected by requiring that only one strip of the top ToF scintillator (S1 and S2) layers
registered an energy deposition (’hit’). Similarly no hits were permitted in either top scintil-
lators of the AC system (CARD and CAT). The central part of the PAMELA apparatus is
12
Energy (GeV)1 10 100
))
-(eφ
)+
+(eφ
) / (
+(eφ
Po
sitr
on
fra
ctio
n
0.01
0.02
0.1
0.2
0.3
PAMELA
FIG. 4: PAMELA positron fraction with theoretical models. The PAMELA positron
fraction compared with theoretical model. The solid line shows a calculation by Moskalenko &
Strong[39] for pure secondary production of positrons during the propagation of cosmic-rays in the
galaxy. One standard deviation error bars are shown. If not visible, they lie inside the data points.
a magnetic spectrometer consisting of a 0.43 T permanent magnet and a silicon microstrip
tracking system. The spectrometer measures the rigidity of charged particles through their
deflection in the magnetic field. During flight the spatial resolution is observed to be 3µm
corresponding to a maximum detectable rigidity (MDR) exceeding 1 TV. Due to the fi-
nite spatial resolution in the spectrometer, high rigidity (low deflection) electrons may ’spill
over’ into the positron sample (and vice-versa) if assigned the wrong sign-of-curvature. This
13

spillover background was eliminated by imposing a set of strict selection criteria on the
quality of the fitted tracks. The spillover limit for positrons is estimated from flight data
and simulation to be approximately 300 GeV, as expected from particle beam tests. The
dE/dx losses measured in S1 and the silicon layers of the magnetic spectrometer were used
to select minimum ionizing singly charged particles (mip) by requiring the measured dE/dx
to be less than twice that expected from a mip. The sampling calorimeter comprises 44
silicon sensor planes interleaved with 22 plates of tungsten absorber. Each tungsten layer
has a thickness of 0.26 cm corresponding to 0.74 radiation lengths. Positrons (electrons) can
be selected from a background of protons (antiprotons) by studying the properties of the
energy deposition and interaction topology. A high dynamic-range scintillator system and
a neutron detector are mounted under the calorimeter at the bottom of the apparatus.
Statistical methods.
For each energy interval, the distribution of the calorimeter energy fraction (F) for
positively-charged particles (e.g. Fig. 2c) was expressed as mixture distribution[43] of
positrons (i.e. signal, electrons as in Fig. 2a) and protons (background, e.g. Fig. 2b):
f(F) = p · g1(F ; q1) + (1 − p) · g2(F ; q2) (1)
where the parameter p gives the mixture proportion; g1(F ; q1) and g2(F ; q2) are the prob-
ability density functions (p.d.f.) for positrons/electrons and protons, respectively. The
p.d.f.’s g1 and g2 were determined by analysing two samples of pure electrons (Fig. 2a) and
protons (Fig. 2b) in the same energy range. We used a Beta distribution for both the elec-
tron/positron signal g1 and for the proton background g2. In both cases parameter sets q1
and q2 were determined from a maximum likelihood fit.
The mixture proportion p was estimated by means of a bootstrap procedure [44] followed
by the maximum likelihood method. As first step, the experimental distribution was re-
sampled, by means of a bootstrap procedure, N = 1000 times. For each re-sample i (i =
1, . . . N) we estimated the unknown parameter pi by means of an un-binned maximum
likelihood analysis. The likelihood is defined by:
Li = ΠKj=1[pig1(Fj ; q1) + (1 − pi)g2(Fj; q2)]
where K is the total number of positive particles (e.g. Fig. 2c) and j=1,...,K.
14
The best fit point for pi corresponds to the maximum Li. Therefore as a result we
obtained from eq. 1 N estimations of the number of positrons candidates (n+i ). Then, the
final number of positron candidates was obtained as
n =1
N
N∑
i=1
n+i
We also estimated the α-level confidence interval including all the values of n+i between the
α/2 and 1- α/2 percentiles of the n+i distribution. We chose one standard deviation as the
confidence interval.
An alternative non-parametric statistical method to evaluate the proton background re-
quired the construction of a test sample. The test sample was built by combining the proton
sample with a weight w and the electron sample with a weight 1 − w, with w ∈ (0, 1). The
value of w is chosen by minimizing the Kolmogorov-Smirnov distance between the positive
sample and the test one. Furthermore, a Mann–Whitney test is applied around the positron
peak in order to check if the two sets are compatible. After the normalization of the test
sample, the proton background is found by counting only the proton events (with their
own weight) inside the positron selection region. The calculation of the confidence interval
is based on the likelihood ratio test[45], by considering proper probability models for the
positron signal, the proton background, the selection efficiency and the weight w.
ACKNOWLEDGMENTS
We would like to thank D. Marinucci for helpful discuss concerning the statystical meth-
ods, D. Muller and S. Swordy and their group at University of Chicago, G. Bellettini and G.
Chiarelli for helpful discussion on the data analysis and L. Bergstrom for useful comments
on the interpretation of our results. We acknowledge support from The Italian Space Agency
(ASI), Deutsches Zentrum fur Luft- und Raumfahrt (DLR), The Swedish National Space
Board, The Swedish Research Council, The Russian Space Agency (Roscosmos) and The
Russian Foundation for Basic Research.
Competing Interests The authors declare that they have no competing financial inter-
ests.
Correspondence Correspondence and requests for materials should be addressed to
P.P. (email: [email protected]).
15
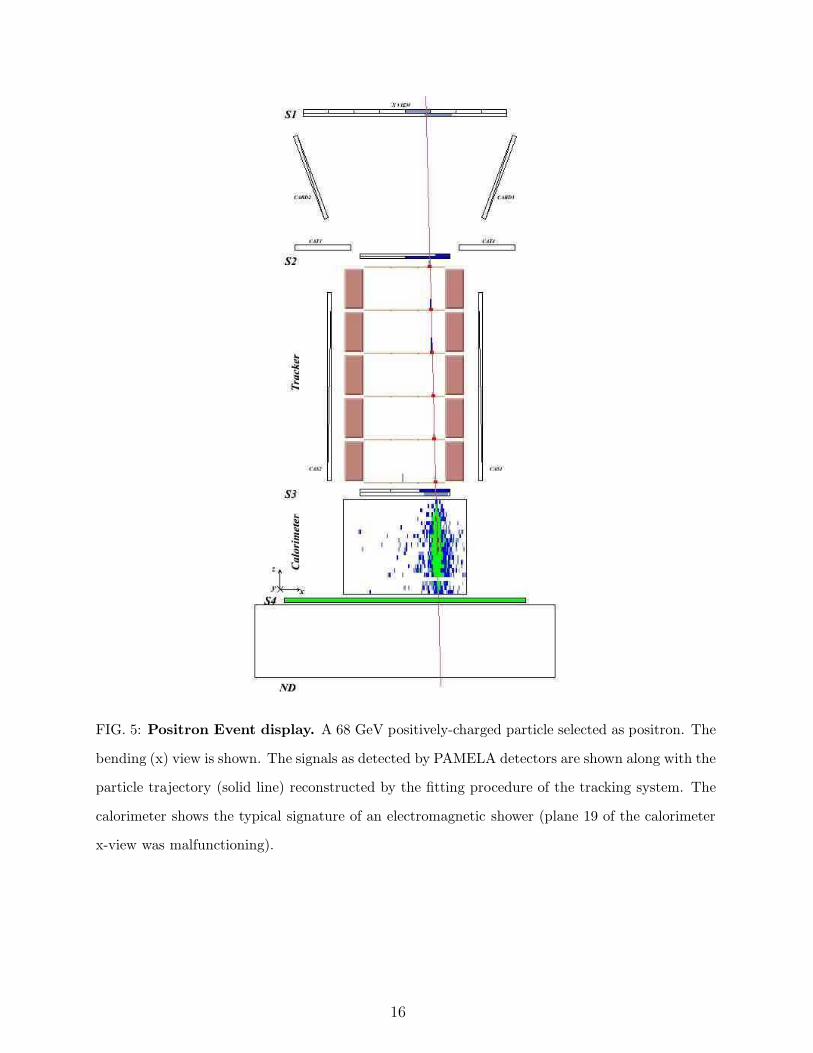
FIG. 5: Positron Event display. A 68 GeV positively-charged particle selected as positron. The
bending (x) view is shown. The signals as detected by PAMELA detectors are shown along with the
particle trajectory (solid line) reconstructed by the fitting procedure of the tracking system. The
calorimeter shows the typical signature of an electromagnetic shower (plane 19 of the calorimeter
x-view was malfunctioning).
16
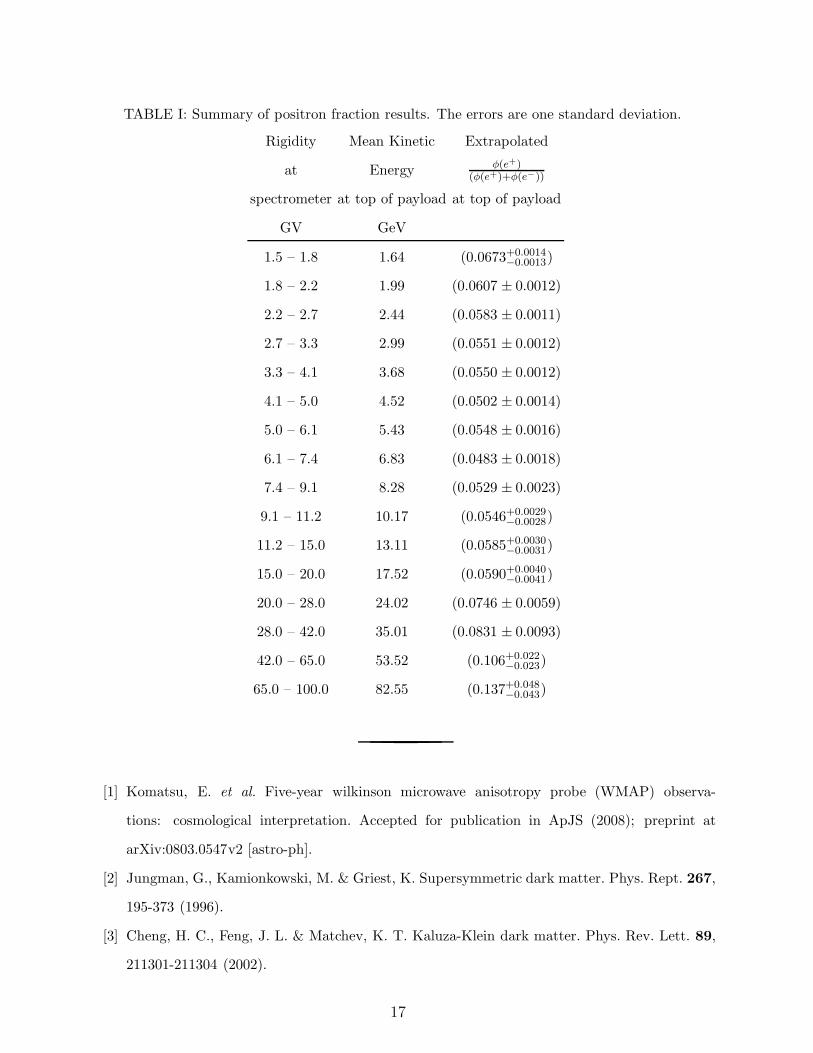
TABLE I: Summary of positron fraction results. The errors are one standard deviation.
Rigidity Mean Kinetic Extrapolated
at Energy φ(e+)(φ(e+)+φ(e−))
spectrometer at top of payload at top of payload
GV GeV
1.5 – 1.8 1.64 (0.0673+0.0014−0.0013)
1.8 – 2.2 1.99 (0.0607 ± 0.0012)
2.2 – 2.7 2.44 (0.0583 ± 0.0011)
2.7 – 3.3 2.99 (0.0551 ± 0.0012)
3.3 – 4.1 3.68 (0.0550 ± 0.0012)
4.1 – 5.0 4.52 (0.0502 ± 0.0014)
5.0 – 6.1 5.43 (0.0548 ± 0.0016)
6.1 – 7.4 6.83 (0.0483 ± 0.0018)
7.4 – 9.1 8.28 (0.0529 ± 0.0023)
9.1 – 11.2 10.17 (0.0546+0.0029−0.0028)
11.2 – 15.0 13.11 (0.0585+0.0030−0.0031)
15.0 – 20.0 17.52 (0.0590+0.0040−0.0041)
20.0 – 28.0 24.02 (0.0746 ± 0.0059)
28.0 – 42.0 35.01 (0.0831 ± 0.0093)
42.0 – 65.0 53.52 (0.106+0.022−0.023)
65.0 – 100.0 82.55 (0.137+0.048−0.043)
[1] Komatsu, E. et al. Five-year wilkinson microwave anisotropy probe (WMAP) observa-
tions: cosmological interpretation. Accepted for publication in ApJS (2008); preprint at
arXiv:0803.0547v2 [astro-ph].
[2] Jungman, G., Kamionkowski, M. & Griest, K. Supersymmetric dark matter. Phys. Rept. 267,
195-373 (1996).
[3] Cheng, H. C., Feng, J. L. & Matchev, K. T. Kaluza-Klein dark matter. Phys. Rev. Lett. 89,
211301-211304 (2002).
17
[4] Buchmuller, W., Covi, L., Hamaguchi, K., Ibarra, A. & Yanagida, T. Gravitino dark matter
in R-parity breaking vacua. JHEP 0703, 037 (2007).
[5] Tylka, A. J. Cosmic ray positrons from annihilation of weakly interacting massive particles in
the galaxy. Phys. Rev. Lett. 63, 840-843 (1989). [Erratum-ibid. 63, 1658 (1989)]
[6] Turner, M. S. & Wilczek, F. Positron line radiation from halo WIMP annihilations as a dark
matter signature. Phys. Rev. D 42, 1001-1007 (1990).
[7] Kamionkowski, M. & Turner, E. M. Distinctive positrons feature from particle dark-matter
annihilations in the galactic halo. Phys. Rev. D 43, 1774-1780 (1991).
[8] Kane, G. L., Wang, L. L. & Wells, J. D. Supersymmetry and the positron excess in cosmic
rays. Phys. Rev. D 65, 057701-057704 (2002).
[9] Baltz, E. A., Edsjo, J., Freese, K. & Gondolo, P. The cosmic ray positron excess and neutralino
dark matter. Phys. Rev. D 65, 063511-063520 (2002)
[10] Baltz, E. A. & Bergstrom, L. Detection of leptonic dark matter. Phys. Rev. D 67, 043516-
043522 (2003).
[11] Bertone, G., Hooper, D. & Silk, J. Particle dark matter: Evidence, candidates and constraints.
Phys. Rept. 405, 279-390 (2005).
[12] Hooper, D. & Profumo, S. Dark matter and collider phenomenology of universal extra dimen-
sions. Phys. Rept. 453, 29-115 (2007).
[13] Ibarra, A. & Tran, D. Antimatter Signatures of Gravitino Dark Matter Decay. JCAP 0807,
002 (2008).
[14] Bottino, A., Donato, F., Fornengo, N. & Scopel, S. Indirect signals from light neutralinos in
supersymmetric models without gaugino mass unification. Phys. Rev. D 70, 015005-0150019
(2004).
[15] Adriani, O. et al. A new measurement of the antiproton-to-proton flux ratio up to 100 GeV
in the cosmic radiation. submitted to Phys. Rev. Lett. (2008).
[16] Harding, A. K. & Ramaty, R. The pulsar contribution to galactic cosmic-ray positrons. Proc.
20th ICRC, Moscow 2, 92-95 (1987).
[17] Atoian, A. M., Aharonian, F. A., & Volk, H. J. Electrons and positrons in the galactic cosmic-
rays. Phys. Rev. D 52, 3265-3275 (1995).
[18] Chi, X., Cheng, K. S. & Young, E. C. M. Pulsar-wind origin of cosmic-ray positrons. Astrophys.
J. 459, L83-L86 (1996).
18
[19] Grimani, C. Pulsar birthrate set by cosmic-ray positron observations. Astron. Astrophys. 418,
649-653 (2004).
[20] Busching, I., de Jager, O. C., Potgieter, M. S. & Venter, C. A cosmic-ray positron anisotropy
due to two middle-aged, nearby pulsars? Astrophys. J. 78, L39-L42 (2008).
[21] Muller, D. Cosmic-ray electrons and positrons. Adv. in Space Res. 27, 659-668 (2001).
[22] Barwick, S. W. et al. Cosmic-ray positrons at high energies: A new measurement. Phys. Rev.
Lett. 75, 390-393 (1995).
[23] Golden, R. L. et al. Measurement of the positron to electron ratio in the cosmic rays above 5
GeV. Astrophys. J. 457, L103-L106 (1996).
[24] Gast, H., Olzem, J.& Schael, S. Indirect dark matter search: Cosmic positron fraction measure-
ment from 1 GeV to 50 GeV with AMS-01. Proc. XLIst Rencontres de Moriond, Electroweak
Interactions and Unified Theories, 421-428 (2006).
[25] Picozza, P. et al. PAMELA - A payload for antimatter matter exploration and light-nuclei
astrophysics. Astropart. Phys. 27, 296-315 (2007).
[26] Boezio, M. et al. The electron-hadron separation performance of the PAMELA electromagnetic
calorimeter. Astropart. Phys. 26, 111-118 (2006).
[27] Boezio, M. et al. The cosmic-ray antiproton flux between 3 and 49 GeV. Astrophys. J. 561,
787-799 (2001).
[28] Hopper, V. D. Cosmic radiation and high energy interactions (Academic Press, London, 1964).
[29] Muller, D. & K. K. Tang, K. K. Cosmic-ray positrons from 10 to 20 GeV - A balloon-borne
measurement using the geomagnetic east-west asymmetry. Astrophys. J. 312, 183-194 (1987).
[30] Golden, R. L. et al. Observations of cosmic-ray electrons and positrons using an imaging
calorimeter. Astrophys. J. 436, 769-775 (1994).
[31] Barwick, S. W. et al. Measurements of the cosmic-ray positron fraction from 1 to 50 GeV.
Astrophys. J. 482, L191-194 (1997).
[32] Boezio, M. et al. The cosmic-ray electron and positron spectra measured at 1 AU during solar
minimum activity. Astrophys. J. 532, 653-669 (2000).
[33] Alcaraz, J. et al. Leptons in near earth orbit. Phys. Lett. B 484, 10-22 (2000).
[34] Beatty, J. J. et al. New measurement of the cosmic-ray positron fraction from 5 to 15GeV.
Phys. Rev. Lett. 93, 241102-241105 (2004);
[35] Clem, J. & Evenson, P. Cosmic ray positron fraction observations during the A-magnetic solar
19
minimum. Proc. 30th ICRC, Merida (2007).
[36] Asaoka, Y. et al., Measurements of cosmic-ray low-energy antiproton and proton spectra in a
transient period of the solar field reversal. Phys. Rev. Lett. 88, 051101-051104 (2002).
[37] Potgieter, M. S., Burger, R. A. & Ferreira, S. E. S. Modulation of cosmic rays in the heliosphere
from solar minimum to maximum: a theoretical perspective. Space Sci. Rev. 97, 295-307
(2001).
[38] Coutu, S. et al. Cosmic-ray positrons: are there primary sources? Astropart. Phys. 11, 429-435
(1999).
[39] Moskalenko, I. V. & Strong, A. W. Production and propagation of cosmic-ray positrons and
electrons. Astrophys. J. 493, 694-707 (1998).
[40] Aharonian, F. et al. First detection of a VHE gamma-ray spectral maximum from a cosmic
source: HESS discovery of the Vela X nebula. Astron. Astrophys. 448, L43-L47 (2006).
[41] Berezhko, E. G., Ksenofontov, L. T. & Volk, H. J. Emission of SN 1006 produced by acceler-
ated cosmic rays. Astron. Astrophys. 395, 943-953 (2002).
[42] Zhang, L. & Cheng, K. S. Cosmic-ray positrons from mature gamma-ray pulsars. Astron.
Astrophys. 368, 1063-1070 (2001).
[43] Everit, B.S. and Hand, D.J. Finite Mixture Distributions. Chapman and Hall (1981).
[44] Efron, B. Bootstrap methods: another look at the jacknife. Ann. Stat. 7, 1-26 (1979).
[45] Rolke, W. A., Lopez, A. M. & Conrad, J. Limits and confidence intervals in the presence of
nuisance parameters. Nucl. Instrum. Meth. A 551, 493-503 (2005)
20
Top Related
Copyright © 2022 FDOKUMEN

