


Bahasa
Halaman
Hukum


Nestlé – A
nnu
al Review
2018
Good Food, Good Life
Nestlé. Enhancing quality of life
and contributing to a healthier future.
Annual Review 2018

We are dedicated to advancing nutrition, health, and wellness in a way that is sustainable and responsible. Through our portfolio of products and services, we offer people and their pets, tastier, healthier and convenient choices for all life stages and all times of the day.
2 Letter to our shareholders
6 Pursuing our value-creating strategy
10 Innovating for a changing world
14 Connecting through our brands
30 Creating Shared Value
42 Financial review
57 Corporate Governance and Compliance
65 Shareholder information
Nestlé. Enhancing quality of life and contributing to a healthier future.
Our purpose
Contents Accompanying reports
Corporate Governance Report 2018Compensation Report 2018Financial Statements 2018
You can find more informationabout the Nestlé Group at www.nestle.com
Find out more about Creating Shared Value at www.nestle.com/csv
Online
Front cover
Milo: Energy with purposeMilo is an integral part of Nestlé’s efforts to promote healthier lifestyles by encouraging sports and healthy eating habits amongst kids. Each year the brand supports grassroots programs, working with different partners to make a positive difference in the lives of more than 22 million children.

Nestlé Annual Review 2018 1
Our performance
* Financial performance measures not defined by IFRS. For further details see Financial review on page 44.
Our performance is driven by our Nutrition, Health and Wellness strategy, the engine of our value creation model.
Our 2018 organic sales growth was 3.0%. Our cost-reduction initiatives delivered 50 bps margin improvement, ahead of expectations.
Trading operating profit margin *
+30 basis points
Constant currency
Trading operating profit * (in CHF)
13.8 billion
Trading operating profit margin *
15.1%
Underlying trading operating profit margin *
17.0%Constant currency
Underlying trading operating profit margin *
+50 basis points
Constant currency
Underlying trading operating profit * (in CHF)
15.5 billion
Underlying earnings per share *
+13.9%Constant currency
Earnings per share
+45.5%
Earnings per share (in CHF)
3.36
Free cash flow * (in CHF)
10.8 billion
Operating cash flow (in CHF)
15.4 billion50.8% of net financial debt
Proposed dividend increase
+4.3%
Proposed dividend (in CHF)
2.45
Group sales (in CHF)
91.4 billion
Organic growth *
3.0%
Real internal growth *
2.5%
Performance evolution is based on 2017 restated figures as described in the Foreword on page 44.

Our businessFor over 150 years, Nestlé has been producing food and beverages that enhance quality of life and contribute to a healthier future.
Nestlé is the world’s largest food and beverages company. We are a global company, combining global strategies with local engagement. Our success is built on trust, innovation and relevance. Across each of our categories, we earn our place in people’s lives through our brands and dedication to improving nutrition, health and wellness. We win the right to stay there by offering life-enhancing products, services and experiences. We focus on capturing premiumization opportunities, offering affordable, high-quality nutrition and adding value to our brands and products through meaningful differenciation and innovation.
What we sell (in CHF billion)
Where we sell (in CHF billion)
Number of employees
308 000
Total group salaries and social welfare expenses (in CHF)
16 billion
Number of countries we sell in
190
Corporate taxes paid in 2018 (in CHF)
3.6 billion
Powdered and Liquid Beverages
Milk products and Ice cream
Nutrition and Health Science
Confectionery Water
21.6 16.2 13.2
Prepared dishes and cooking aids
12.1 8.1 7.4
PetCare
12.8
AMS
41.0
EMENA
26.9
AOA
23.5

Our commitmentsOur 36 commitments featured in the Creating Shared Value chapter guide our collective efforts to meet specific objectives.
Every day, we touch the lives of billions of people: from the farmers who grow our ingredients and the families who enjoy our products, through the communities where we live and work, to the natural environment upon which we all depend.
Over 1300new products were launched in 2018 addressing specific nutritional needs and gaps of babies, children, expecting women or new mothers
2.6%decrease in indirect greenhouse gas emissions per tonne of product
293factories achieved zero waste for disposal
29.6%reduction in direct water withdrawals per tonne of product across every category since 2010
34%of our electricity comes from renewable sources
63%of the volume of our 14 priority categories of raw materials are responsibly sourced
440 000farmers trained through capacity-building programs
181.8 millioncoffee plantlets distributed (cumulative since 2010) to farmers, against a target of 220 million by 2020
Over 26 000job opportunities, traineeships or apprenticeships were offered to people under the age of 30 through our Nestlé needs YOUth initiative
13.2%decrease in artificial colors
170 millionportions of vegetables added to our foods and beverages
106 millionchildren and families reached with fortified foods and beverages
For individuals and families
For our communities
For the planet

Nestlé Annual Review 20182
steps to sharpen our strategic focus on food, beverages and nutritional health products. Consistent with this, we continued to invest in advancing the high-growth categories of coffee, petcare, nutrition, water, as well as Nestlé Health Science. We manage the other categories for a balance of growth and value. Due to changing industry dynamics and following detailed analysis, the Board determined that future growth opportunities for Nestlé Skin Health lie increasingly outside the Group’s strategic scope. It therefore decided to explore strategic options for Nestlé Skin Health in the best long-term interest of this business and Nestlé shareholders. The review is expected to be completed by mid-2019.
We further accelerated our portfolio management through targeted acquisitions that come with high growth potential, deliver attractive returns and build on our leadership positions. We acquired the perpetual global license of Starbucks consumer packaged goods and foodservice products. With Starbucks, Nescafé and Nespresso we have brought together the world’s most iconic coffee brands. We acquired Atrium Innovations, a global leader in natural, non-GMO vitamins and supplements. In addition, we completed the divestiture of our U.S. confectionery business, where our low market share constrained our ability to win in that market. We also completed the sale of the Gerber Life Insurance, which was non-core to our business.
Dear fellow shareholders,For more than 150 years, Nestlé has consistently delivered sustainable, industry‑leading results by offering healthy, delicious, convenient food and beverage products and services. In a rapidly‑changing environment, the key to our success has been our ability to balance continuity with change. It has required discipline and decisive actions to build sustainable value for the long term. We continue on our Nutrition, Health and Wellness journey, while we stay true to our purpose and values. We change by adapting our portfolio to meet evolving consumer demands, pushing the boundaries of science, accelerating innovation, as well as driving greater agility and efficiencies. Our people are embracing these changes with passion and dedication. This gives us confidence that Nestlé is well positioned for the future.
On track to meet our 2020 goalsOur value creation model is based on a balance of top-line growth and bottom-line performance, as well as improved capital efficiency. We plan to reach mid single-digit organic growth by 2020. We also aim to increase our underlying trading operating profit margin to between 17.5% and 18.5% (from 16.0% in 2016). Our 2018 results demonstrate that we are on track to meet these targets: – Organic growth was 3.0%, with continued
strong real internal growth (RIG) of 2.5% and pricing of 0.5%. Growth was supported by stronger momentum in the United States and China, as well as in infant nutrition.
– Total reported sales increased by 2.1% to CHF 91.4 billion (2017: CHF 89.6 billion). Net acquisitions had a positive impact of 0.7% and foreign exchange reduced sales by 1.6%.
– Underlying trading operating profit (UTOP) margin reached 17.0%, up of 50 basis points. Trading operating profit (TOP) margin increased by 30 basis points to 15.1%, reflecting higher restructuring- related expenses.
Based on these results, the Board of Directors has proposed a 24th consecutive increase of the yearly dividend to CHF 2.45, to be paid in 2019.
Sharpening our strategic focusDuring 2018, our Board reaffirmed the Nutrition, Health and Wellness strategy and took decisive

Nestlé Annual Review 2018 3
“We are executing on our Nutrition, Health and Wellness strategy and creating sustained value for shareholders and society over the short and long term.”
Paul Bulcke, Chairman (left), and U. Mark Schneider, Chief Executive Officer (right)

Nestlé Annual Review 20184
Letter to our shareholders
Accelerating growth through innovation in a fast-changing environmentIn 2018, we delivered improved revenue growth and profitability. We achieved this in the context of a volatile economic environment and significant disruption in both our industry and the retail sector.
Consumer tastes, preferences and expectations are changing at an unprecedented rate. Trends towards more natural and organic foods, plant-based proteins, as well as simpler and healthier ingredients, are redefining the pace at which we need to innovate. Our growth was supported by disciplined execution and short innovation cycles. In order to launch new products quickly, we use rapid prototyping and leverage our industry-leading R&D network for quick in-market testing. Examples of fast product innovation include KitKat Ruby, the Yes! snack bar, Perrier & Juice, and Garden Gourmet, an authentic vegan meat analogue offering.
Moreover, the rise of digital and online shopping is fundamentally changing the retail industry. We are embracing the opportunities offered by the digital transformation across marketing, social media and e-commerce. In doing so, we are delivering more personalized products, messages and services directly to our consumers. In 2018, our e-commerce sales grew organically by +18% (+25% excluding Nespresso) and reached 7.4% of total Nestlé sales. There were also strong contributions from other fast-growing channels, such as Direct-to-Consumer, Convenience, Club, Value, Natural, Specialty stores, as well as Out-of-Home. We are constantly adapting our business models to wherever people look for our brands and products.
Our consumers do not just care about what they eat, but they also care about how products are made and their impact on the environment and society. We have placed packaging and plastics at the top of our agenda by announcing our goal to make 100% of our packaging recyclable or reusable by 2025. We are also pursuing collective action at an industry level in collaboration with our retail partners and governments.
As we look to 2019, we see that input costs are rising, particularly in energy, distribution and packaging. As parts of the world are beginning to see reinflation, notably emerging markets and the United States, the strength of our brands and our ability to differentiate and innovate will continue to be key to our success.
Improving operational efficiencyTo fuel our growth and improve returns, we have intensified our drive to find operational efficiencies and reduce structural costs. This reflects our belief that consumers should not pay for our inefficiencies. We have made good progress on our significant cost-reduction programs across the areas of administration, procurement and manufacturing.
We continued to strengthen our business focus through simplified and standardized processes. We increased the penetration of our shared service centers from 17% to 35%, and are on track to reach 50% by 2020. In procurement, we realized significant savings by leveraging our size and scale through three global purchasing hubs. We now source 55% of our requirements through these hubs and this will reach 60% by 2020. In manufacturing we have further simplified our factory footprint and increased capacity utilization.
The savings that we have generated so far have made a significant contribution to the improvement in our underlying trading operating profit margin. In 2018, it increased by 50 basis points to 17.0%.
We also continued to deliver efficiencies in the area of R&D and marketing. The primary focus of these efficiencies is to free up resources to reinvest in growth opportunities and innovation.
We continue to simplify our organizational structure to speed up decision-making and responsiveness to new consumer trends. In 2018, infant nutrition successfully moved from a globally-managed to a regionally-managed business reported within the three Zones. Zone EMENA also continued its transformation to a category-focused organization, while maintaining the connection to local consumers through our Nestlé Markets. In parallel, we have tailored compensation to increase focus on pricing and capital efficiency.

Nestlé Annual Review 2018 5
Increasing cash returns to shareholdersIn 2018, we returned CHF 13.9 billion to shareholders through dividends and share repurchases. Share buybacks amounted to CHF 6.8 billion, as part of the three-year buyback program started in July 2017. Over the last ten years, Nestlé has returned CHF 104 billion to shareholders, of which CHF 40 billion has been in the form of share repurchases.
Board of Directors engagementOur Board of Directors is fully engaged and takes an active role in providing guidance on our long-term Nutrition, Health and Wellness strategy and Creating Shared Value. We benefit from the perspectives of seven new independent directors who have been added since 2015. This includes three directors added in 2018, who bring highly-relevant expertise and experience as leaders of consumer-facing companies.
In 2018, the Board conducted a strategic review that included an analysis of recent trends in the food and beverages industry, as well as our responses to them. During the year, the Board also carried out an analysis of the company’s financial structure. It evaluated the M&A approach and track record. It also decided to explore strategic options for Nestlé Skin Health. In addition, the Board also continuously monitors the returns and strategic options of our financial investment in L’Oréal.
The Board reviewed the progress of Nestlé Business Excellence. It assessed the company’s talent pool, supporting actions to improve gender balance and increase cultural diversity. It examined how the company’s talent acquisition, retention and development strategies are being
adapted to cope with the demands of a changing work force.
The Board also visited Nestlé in the United States on its annual visit to a major market.
During 2018, the Board continued its ongoing review of the company’s governance policies and compensation to ensure best practices. The Audit Committee and the Chairman’s and Corporate Governance Committee provided thorough risk oversight. The Sustainability Committee reviewed our environmental, social and governance commitments to support our goal of enhancing quality of life and contributing to a healthier future for individuals and families, our communities and the planet.
Value for all stakeholdersWe believe that our Creating Shared Value approach enables us to optimize value for our shareholders and have a long-term positive impact on all stakeholders connected to our business. This includes: employees, consumers, business partners, as well as the communities in which we operate. We recognize that we need to continually earn the trust of all of our stakeholders. This must be done through the way we manage our businesses, create products and pursue profitable growth. We emphasize a balanced approach by taking an inclusive view of these stakeholders, placing Nutrition, Health and Wellness at the core of our strategy.
We take this opportunity to thank all our associates for their dedication, initiative and energy in driving our results. We also express our gratitude to the communities in which we live and work. Finally, we thank you, our shareholders, for your continued support, trust and confidence.
Paul BulckeChairman
U. Mark SchneiderChief Executive Officer

Nestlé Annual Review 20186
Pursuing our value-creating strategy
Purina ONE: Nestlé’s fastest growing billionaire brand
Purina One’s success is driven by the superior nutrition profile of its products which
deliver visibly enhanced health throughout the life of the pet.

Nestlé Annual Review 2018 7
knowledge from the first 1000 days of life through to healthy aging, and benefit from increased interest in nutrition to support good health.
How do we create long-term value?Our long-term value creation model is based on the balanced pursuit of resource efficient top- and bottom-line growth. We create value by: – Increasing growth through innovation,
differentiation and by being relevant to our consumers. We have committed to reach mid single-digit organic growth by 2020.
– Improving operational efficiency with the goal to increase our underlying trading operating profit margin to between 17.5% and 18.5% (from 16.0% in 2016), and
– Allocating our resources and capital with discipline and clear priorities, including through acquisitions and divestitures.
Increasing growthOur portfolio is well positioned for growth. In the past, we have consistently delivered organic growth at the high end of the industry. We have a clear path to achieving mid single-digit organic growth by 2020.
Investing in high-growth categories and regions. We have identified five high-growth food and beverages categories with attractive growth rates: coffee, petcare, nutrition, water and Nestlé Health Science. Together, they represent 57% of sales and 61% of underlying trading operating profit *. In 2018, organic growth was +4.0%. In these key categories, we have strong market positions and highly-differentiated offerings. They receive particular emphasis from a capital allocation standpoint, with significant investments in R&D, marketing, capital expenditure and external growth whenever appropriate. The other categories continue to be important contributors and had 1.9% organic growth in 2018. These businesses are managed for a combination of growth and value.
We are also focused on expanding our presence in high-growth regions. Emerging markets represent 42% of sales. In 2018, they
As the ‘Good Food, Good Life’ company, we enhance quality of life and contribute to a healthier future. Winning with consumers is the source of our sustainable financial performance and our way to earning trust and maintain our market leadership. Based on a compelling Nutrition, Health and Wellness strategy, our company delivers sustainable value over the short term and the long term.
Nestlé has many distinctive strengths that keep us at the top of our industry. Our people are our greatest strength. We have an attractive product portfolio in growing categories with leading market positions. We are a global company with deep local roots, which gives us a unique ability to understand local consumers and adapt fast to their preferences. We have powerful, valuable brands, which consumers trust. Our products reach more than 1 billion consumers every day across the world. We also have industry-leading R&D capabilities that support our Nutrition, Health and Wellness strategy and our innovation initiatives.
Our Nutrition, Health and Wellness strategyOur success is built on our Nutrition, Health and Wellness strategy. Food and beverages are core to Nestlé. We aim to provide the tastiest and healthiest choices, for all times of the day and for all stages of life, delivered in a convenient manner. We aim to capture premiumization opportunities and, at the other end of the spectrum, offer affordable, high-quality nutrition. We add value to our brands and products through meaningful differentiation and innovation. We do this by continually improving the taste, convenience and nutritional qualities of our products. We are also well-positioned to build and share nutrition * Before unallocated items.

Nestlé Annual Review 20188
Pursuing our value-creating strategy
grew organically by +4.9%, three times faster than developed markets and with a higher underlying trading operating profit margin. In most of these emerging markets, Nestlé has been present for many decades and our brands enjoy a high level of trust and are rightly viewed as local.
Fixing underperforming businesses. We have taken decisive actions to improve underperforming businesses through innovation, better consumer understanding and, when needed, management changes and restructuring. In 2018, turnaround examples included Nestlé Skin Health and Yinlu in China.
Innovating products and business models. Rapid innovation and bringing products to market faster are key dimensions of our growth agenda. At the same time, we continue to invest in cutting-edge science and technology to address evolving consumer expectations through new offerings and product reformulations. Innovation also helps us to premiumize our offering and contributes to margin improvement. In 2018, 22% of our sales came from premium products. We are not just innovating with new products but also new business models. In particular, we have a strong focus on personalized and Direct-to-Consumer offerings. In 2018, 8.2% of our sales came from Direct-to-Consumer business models.
Embracing digital opportunities. Our digital transformation focuses on delivering personalized messaging, services and products to consumers at scale. Powered by data and technology, we are modernizing our existing brands and business operations while developing new, digitally-centric business models. Already 10% of all consumer contacts are personalized. In addition, in 2018, our e-commerce sales grew five times faster than the Group average and reached 7.4% of total Nestlé sales.
Managing our portfolio. We continue to actively evolve our portfolio towards attractive, high-growth businesses. In 2018, we strengthened our position in coffee through the acquisition of the perpetual global license of Starbucks consumer packaged goods and foodservice products. We also divested our U.S confectionery and Gerber Life Insurance businesses. While much work
has been done, we are not yet finished. We recognize that acquisitions can provide access to new technologies, brands, categories and geographies. Similarly, small to medium-sized acquisitions can offer a fast and cost-effective way to embrace new capabilities or business models. We are also actively divesting businesses that are non-core and where we have limited ability to win. We do this in a disciplined way with an aim to minimize potential disruption and maximize the value of existing businesses.
Improving operational efficiencyIn addition to our growth agenda, we have committed to increase our underlying trading operating profit margin from 16.0% in 2016 to between 17.5% and 18.5% by 2020.
Reducing costs. We are actively executing several cost-saving initiatives to reduce non-consumer facing structural costs by between CHF 2.0 and 2.5 billion. These are primarily focused on the areas of administration, procurement and manufacturing.
We continued to strengthen our business focus through our Nestlé Business Excellence program to simplify and standardize processes, which helped reduce administrative costs. We have increased the penetration of our shared service centers from 17% to 35% and are on track to reach 50% by 2020. We have also generated efficiencies in facility management, and real estate through site closure and consolidations.
In procurement we have realized significant savings by leveraging our size and scale through three global purchasing hubs. We now source 55% of our requirements through these hubs, and this will reach 60% by 2020.
In manufacturing we have further simplified our factory footprint and increased capacity utilization.
The savings generated in these three areas so far have made a significant contribution to the improvement in our underlying trading operating profit margin by 50 basis points to 17.0% in 2018, and there is more to come.
Freeing up resources. We have also continued to deliver efficiencies in R&D and marketing. The primary focus of these programs is to free up resources to provide fuel for growth and innovation. As an example, in the last three years,

Nestlé Annual Review 2018 9
more than CHF 500 million in marketing savings have been reinvested in building our brands.
Adjusting management structures and systems. We have continued to adapt our organization to be simpler and faster. We are empowering our market and regional teams to drive growth. To support them, we have implemented initiatives to delayer our organization and speed up decision making at a local level. In parallel, we have tailored compensation to prioritize profitable growth and improved capital efficiency.
Allocating capital with discipline and clear prioritiesWe follow prudent financial policies designed to strike the right balance between capital allocation and flexible access to financial markets. We have well-defined priorities in this regard.
Investing in organic growth. We invest in our business through R&D, brand support and capital expenditure to support top-line growth. Our approach is rigorous and discerning. We are allocating more resources behind those businesses with the highest potential to create economic profit. We have also continued to focus on reducing working capital. The five-quarter average working capital in % of sales reached 1.4% at the end of 2018, –20 bps versus the restated figure for 2017.
Paying dividends. For 2019, the Board of Directors has proposed a 24th consecutive dividend increase amounting to CHF 2.45. This underlines our commitment to continually return capital to shareholders.
Disciplined approach to acquisitions. This is based on strategic and cultural fit, as well as financial returns. We pursue a disciplined acquisition policy, particularly in terms of the price that we are prepared to pay. We prioritize our high-growth categories and regions, particularly coffee, nutrition, petcare, water and Nestlé Health Science. For the companies we acquire, we have solid integration plans with clear accountability and precise targets.
Share buybacks. We have returned CHF 6.8 billion of capital to shareholders in 2018 through share repurchases. This is part of the three-year CHF 20 billion share buyback program announced in July 2017. This brings the total returned to shareholders over the last ten years to 104 billion.
We also regularly review our capital structure to ensure it is appropriate in the context of market conditions and our strategic priorities.
Creating Shared ValueCreating Shared Value (CSV) is fundamental to how we do business. We believe that our company will only be successful for the long term by creating value for both our shareholders and for society.
Business benefits and positive societal impact are mutually reinforcing. In practical terms, our products must provide a nutritional benefit to the consumer. They must also contribute to the development of the local communities where we operate and protect the environment for future generations through the practice of resource stewardship.
A balanced value creation modelAt Nestlé, we believe the best way to guarantee long-term sustainable value creation is through a balanced pursuit of growth, profitability and capital efficiency. Growth is the primary driver of value creation. At the same time, we pursue efficiency and profitable growth because we recognize that our competitiveness is what ensures our sustainability. We are disciplined in our capital allocation and committed to increasing shareholder returns, while investing for the long-term and Creating Shared Value.

Nestlé Annual Review 201810
Innovating for a changing world
NAN Supreme: Breakthrough science creates new competitive advantage
Nestlé continues to lead the way in developing innovative and scientifically‑proven infant formulas. NAN Supreme
contains a Human Milk Oligosaccharide (HMOs) blend which promotes a healthy baby gut bacteria and reduces the risk
of infections by stimulating the immune system.

Nestlé Annual Review 2018 11
Science-based innovationNestlé operates the world’s largest science and innovation network in the food and beverages industry. In 2018, we invested CHF 1.7 billion into R&D. This investment enables us to strengthen our solid scientific foundation, leading to new breakthrough science and technologies.
We continue to invest in long-term innovation projects with the potential for high returns. Examples include infant and maternal nutrition, healthy aging, personalized nutrition, and understanding the microbiome. We are committed to delivering on our Nutrition, Health and Wellness strategy by further reducing sugar, salt and fat. We are also eliminating food additives, while fortifying existing products with added nutritional benefits.
At the same time, we have increased the pace of innovation to be even more responsive to consumer trends. We are encouraging our researchers to think like entrepreneurs, to explore and rapidly test new ideas. In order to stay on top of emerging science and technology trends, we collaborate closely with academic institutions, start-ups and innovation partners across the world.
Rapidly-evolving consumer preferencesThe food and beverages industry is transforming rapidly. Smaller, agile and fast-moving start-ups are challenging larger companies by increasing the rate of change. Consumer needs and expectations are also evolving. There is greater demand for healthier and more authentic products, including those that are locally inspired. These reflect a desire for greater transparency and new product experiences. There is also a growing global trend toward healthier lifestyles, including specific dietary requirements such as vegetarian, lactose-free or gluten-free.
Increasing our speedHaving great ideas is important, but the real opportunity lies in how fast we translate these into attractive and relevant products. We want to win in the marketplace by creating more new and impactful products, services and experiences. To launch new products quickly we use fast prototyping and leverage our size and scale for quick in-market testing. Our R&D and commercial functions join forces from the start to determine what is desirable to the consumer, feasible for the business and creates value for Nestlé. We combine this with a pragmatic approach to market entry. We are leveraging our existing industrial footprint, R&D facilities and co-manufacturing partners to support faster launches. This allows us to lower or defer capital expenditure commitments until we have evidence from the market place that an innovation can gain traction.
Addressing local consumer trendsWhen it comes to understanding consumers we remain at the forefront of our industry. We are a largely decentralized organization, which means that our teams are close to the consumer. We want to take greater advantage of this strength. To do so, we are simplifying our innovation processes, and empowering our local teams to move earlier on trends. We encourage these teams to take greater initiative and create products relevant to local consumers. Our ambition is to create a steady stream of innovative stand-out products.
At Nestlé, continuous innovation is part of our DNA. It is a cornerstone of our success and key to our strategy. For over 150 years, we have built unique competitive advantages. We have unmatched expertise in understanding the relationship between nutrition and health. Our ability to identify local and global trends and translate these into meaningful innovations that meet consumer demand is what drives our growth.
Nestlé Annual Review 201812
Innovating for a changing world
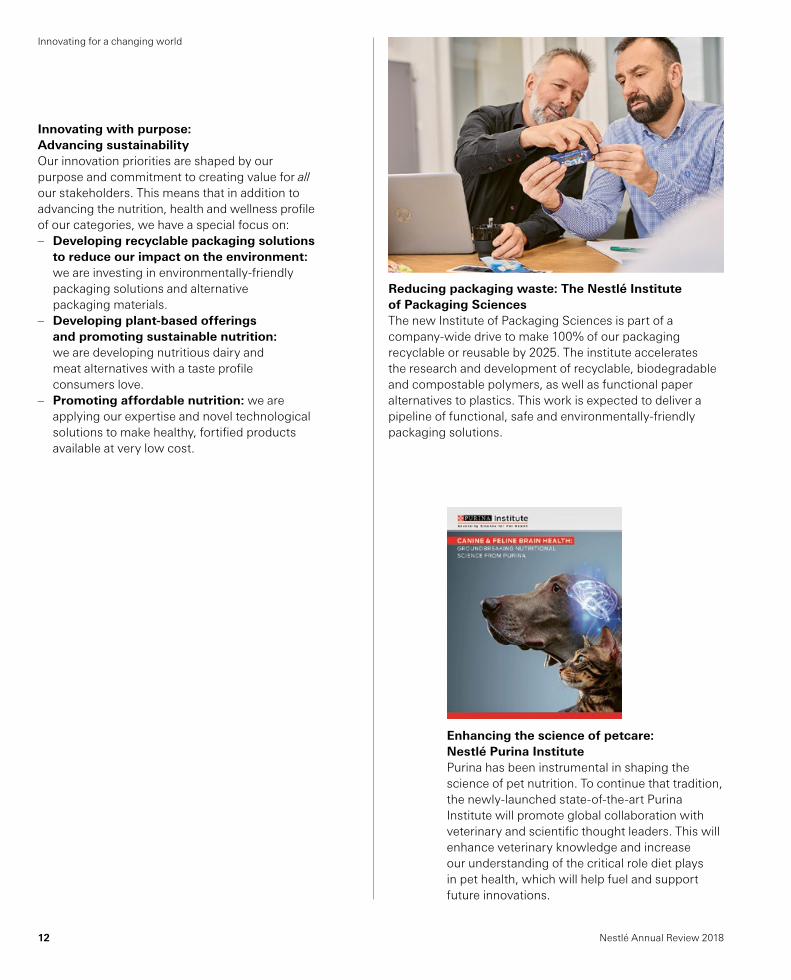
Innovating with purpose: Advancing sustainabilityOur innovation priorities are shaped by our purpose and commitment to creating value for all our stakeholders. This means that in addition to advancing the nutrition, health and wellness profile of our categories, we have a special focus on: – Developing recyclable packaging solutions
to reduce our impact on the environment: we are investing in environmentally-friendly packaging solutions and alternative packaging materials.
– Developing plant-based offerings and promoting sustainable nutrition: we are developing nutritious dairy and meat alternatives with a taste profile consumers love.
– Promoting affordable nutrition: we are applying our expertise and novel technological solutions to make healthy, fortified products available at very low cost.
Enhancing the science of petcare: Nestlé Purina InstitutePurina has been instrumental in shaping the science of pet nutrition. To continue that tradition, the newly-launched state-of-the-art Purina Institute will promote global collaboration with veterinary and scientific thought leaders. This will enhance veterinary knowledge and increase our understanding of the critical role diet plays in pet health, which will help fuel and support future innovations.
Reducing packaging waste: The Nestlé Institute of Packaging SciencesThe new Institute of Packaging Sciences is part of a company-wide drive to make 100% of our packaging recyclable or reusable by 2025. The institute accelerates the research and development of recyclable, biodegradable and compostable polymers, as well as functional paper alternatives to plastics. This work is expected to deliver a pipeline of functional, safe and environmentally-friendly packaging solutions.

Nestlé Annual Review 2018 13
A unique solution to capture vegan trends: Häagen-DazsConsumer appetite for vegan alternatives is shaping a new segment in ice cream. By creating a unique recipe that uses cocoa, peanut butter or coconut cream instead of less sustainable non-dairy alternatives such as almond milk, the Häagen‑Dazs team was able to quickly leverage the trend across the Trio platform. With its signature thin chocolate layers, Trio offers an indulgent experience strongly differentiated from competitors.
Leveraging our plant-based protein platform to capture food industry trends: Garden GourmetAlternative proteins are a new growth platform that capture cross-category opportunities by expanding our flexitarian and vegan product portfolios. The continued expansion of the Garden Gourmet range also reflects how we are encouraging consumers to participate in a more sustainable future by shifting to more plant-based diets.
Internal incubator enables rapid product launch: OutsidersOutsiders pizza is an example of how Nestlé teams are embracing a start-up mentality. These locally inspired pizzas were created by one of our internal incubators, with the product brought on-shelf within nine months of concept.

®
I N FA N T C E R E A L S
Nestlé Annual Review 201814
Nutrition and Health Science
Through our products and brands, we connect with people and their pets millions of times a day and throughout their lives. Our brands are our vehicles for creating experiences beyond products.
Connecting through our brands
Powdered and Liquid Beverages

PANTONE 361CPANTONE 151C
ITEM Dreyer’s + Scooping Since 1928: 5 Color Version DATE 11.19.2015
Please be sure to scale trademarks to minimums depending on your usage.When scaling this logo more than +/- 10%, you must manually scale the ai Drop Shadow effect that is under the Arch and “Scooping Since 1928”. Use the same percentage of scaling. Your Document Raster Effects must be set to 300dpi as well.
ARCH prints Dreyer’s Brown. ARCH INLINE prints 30M 100Y. ARCH LOGOTYPE k/o to white. ICE CREAM CONE k/o to white scoop with Dreyer’s Brown outline and process match pms 7509 cone. BANNER field prints Dreyer’s Brown.
“Scooping Since 1928” prints 30M 100Y with Dreyer’s Brown outline.
Dreyers Brown PROCESS MATCHPANTONE®7509 C
CMYK
®
E N L I G H T E N E D F O O D S
®
®
Nestlé Annual Review 2018 15
Confectionery
Water
PetCare
Milk products and Ice cream
Prepared dishes and cooking aids

Nestlé Annual Review 201816
Powdered and Liquid Beverages
At a glance
1 Sales: CHF 21.6 billion
2 UTOP: 22.7%
3 23.6% of Nestlé’s sales
Premiumizing through organic offerings: Nescafé Dolce GustoDolce Gusto launched Absolute Origin, a fully organic, sustainably-sourced range of single origin coffees that offer consumers a premium, authentic coffee experience.
Accelerating an international rollout through a coordinated campaign: NescaféThe relaunch of Nescafé Gold, our premium soluble coffee range, was rolled out across multiple markets in EMENA and ASEAN during 2018. A single advertising campaign was adapted globally to improve speed, scale and efficiency.
Powdered and Liquid Beverages covers our coffee, cocoa and malt beverages and tea categories. This business features some of our most iconic brands, such as: Nescafé, the world’s favorite coffee brand; Nespresso, our premium coffee experience; and Milo, the world’s most popular chocolate malt drink.

Nestlé Annual Review 2018 17
Novel offering to seed new trends: NescaféAzera’s nitrogen-infused coffee broadens the appeal of Nescafé’s premium offering in both Ready-to-Drink and Out-of-Home. With coffee textures that create an exciting experience, Nitro provides coffee-shop generation consumers with an experience designed to delight and differentiate.
Reinforcing premium credentials through craftmanship: NespressoMaster Origin Indonesia is the latest in a range of crafted coffees that reinforce Nespresso’s premium positioning. It is fully Fairtrade-certified, underlining the brand’s commitment to authenticity and sustainability.
Expanding portfolios to include zero added and lower sugar offerings: MiloMilo’s Gao Kosong is a prime example of Nestlé’s continued efforts to reduce sugar content. This new product, created for our Singapore market, relies on a recipe that provides a better carbohydrate profile by using only natural sugars from malt and milk, with no added sucrose.
Blending a new brand into our coffee portfolio: StarbucksThe Starbucks license agreement significantly strengthens our position in roast & ground coffee, particularly in the United States. In 2019, we will launch Starbucks products in retail internationally and in a range of formats, including capsules compatible with Nespresso and Nescafé Dolce Gusto systems.
Nestlé Annual Review 201818
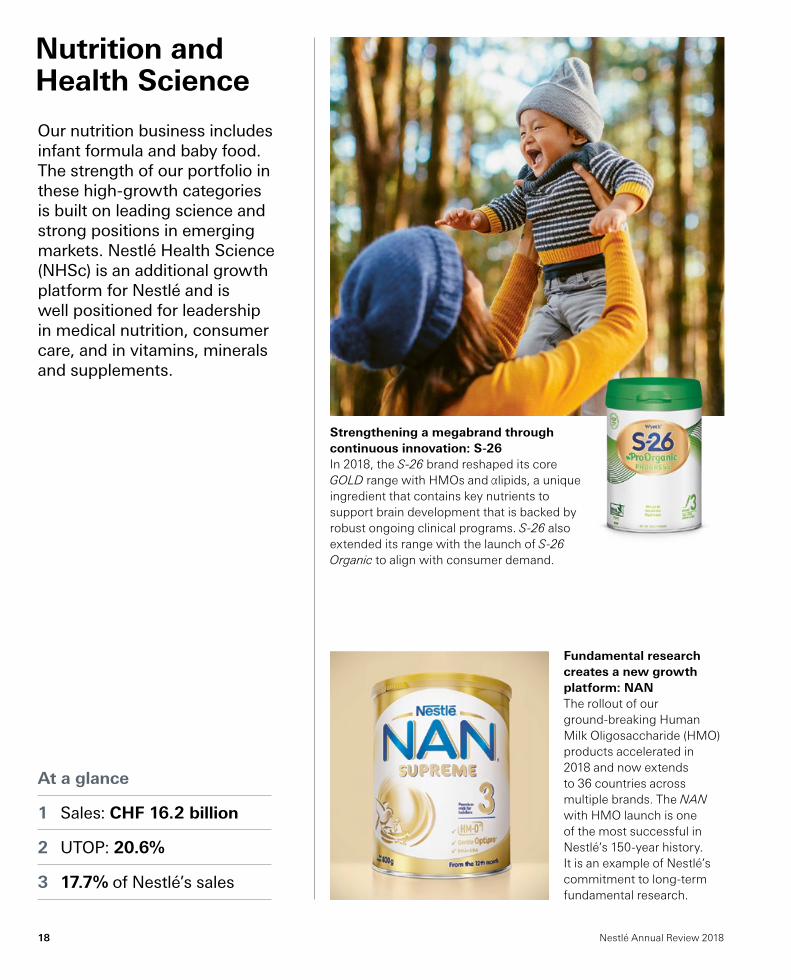
Our nutrition business includes infant formula and baby food. The strength of our portfolio in these high‑growth categories is built on leading science and strong positions in emerging markets. Nestlé Health Science (NHSc) is an additional growth platform for Nestlé and is well positioned for leadership in medical nutrition, consumer care, and in vitamins, minerals and supplements.
Nutrition and Health Science
Strengthening a megabrand through continuous innovation: S-26In 2018, the S‑26 brand reshaped its core GOLD range with HMOs and lipids, a unique ingredient that contains key nutrients to support brain development that is backed by robust ongoing clinical programs. S‑26 also extended its range with the launch of S‑26 Organic to align with consumer demand.
Fundamental research creates a new growth platform: NANThe rollout of our ground-breaking Human Milk Oligosaccharide (HMO) products accelerated in 2018 and now extends to 36 countries across multiple brands. The NAN with HMO launch is one of the most successful in Nestlé’s 150-year history. It is an example of Nestlé’s commitment to long-term fundamental research.
At a glance
1 Sales: CHF 16.2 billion
2 UTOP: 20.6%
3 17.7% of Nestlé’s sales

Nestlé Annual Review 2018 19
Expanding our portfolio with on-trend organic and natural offerings: illumaFollowing the launch of organic varieties in 2017, illuma continued to meet demand for naturality with the launch of illuma Atwo. The new product made with A2 milk, was brought to market within seven months. The success of these launches reflects our ability to source the right ingredients and ensure the integrity of our value chain from farm to bottle.
A pure born brand that continually differentiates: Garden of LifeAtrium’s Garden of Life is a pure-born brand that enjoys strong consumer appeal. The brand’s latest line of herbal supplements is fully traceable and sustainably farmed. It is also certified organic and non-GMO, and is gluten-free and vegan. The new line makes use of ingredients with known health benefits, such as turmeric.
Building trust through transparency: GerberGerber’s organic range has helped open new growth avenues for this iconic brand. These products are GMO-free, made with natural ingredients and come in pouches and glass jars. The combination of transparent packaging and clear messaging around Clean-Field Farming™ strongly resonates with consumers in a category where quality food credentials are fundamental.
Resonating with local preferences: OptiFibre and FibermaisNestlé Health Science’s OptiFibre powder continued its successful rollout in 2018, helped by its credentials as a clean label, 100% vegetal origin fiber product that is safe, effective and free of side effects. In Brazil, Fibermais with collagen also enjoyed a successful launch by resonating with consumer interest in the link between gut health and skin beauty.
Nestlé Annual Review 201820
Milk products and Ice cream
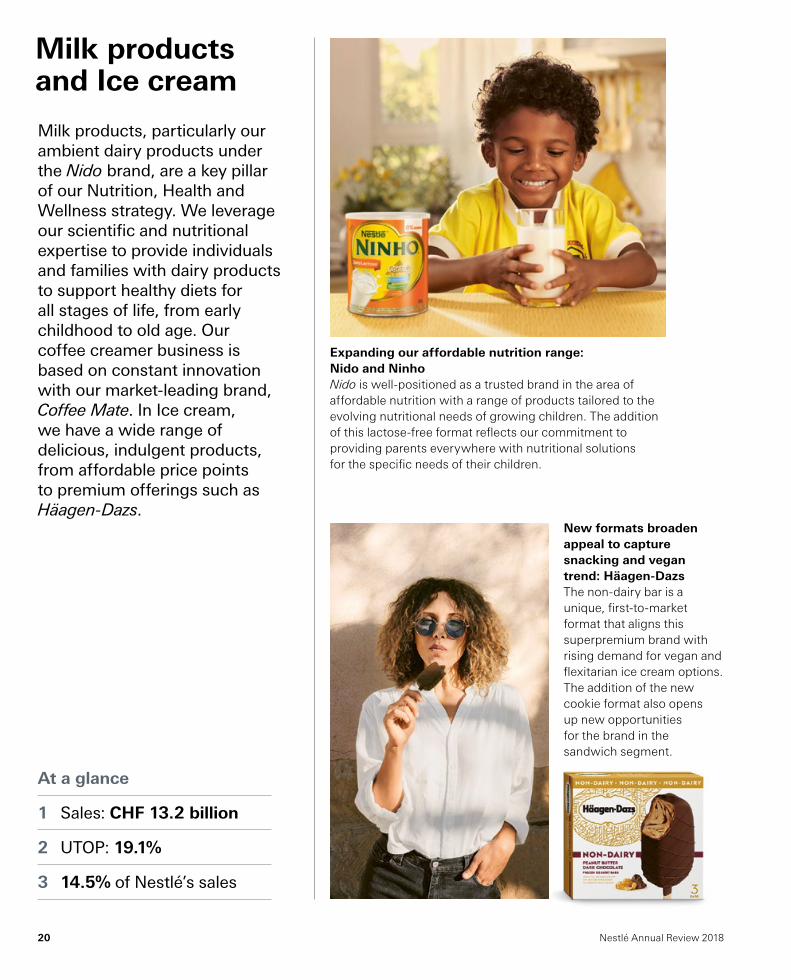
Milk products, particularly our ambient dairy products under the Nido brand, are a key pillar of our Nutrition, Health and Wellness strategy. We leverage our scientific and nutritional expertise to provide individuals and families with dairy products to support healthy diets for all stages of life, from early childhood to old age. Our coffee creamer business is based on constant innovation with our market‑leading brand, Coffee Mate. In Ice cream, we have a wide range of delicious, indulgent products, from affordable price points to premium offerings such as Häagen‑Dazs.
New formats broaden appeal to capture snacking and vegan trend: Häagen-DazsThe non-dairy bar is a unique, first-to-market format that aligns this superpremium brand with rising demand for vegan and flexitarian ice cream options. The addition of the new cookie format also opens up new opportunities for the brand in the sandwich segment.
Expanding our affordable nutrition range: Nido and NinhoNido is well-positioned as a trusted brand in the area of affordable nutrition with a range of products tailored to the evolving nutritional needs of growing children. The addition of this lactose-free format reflects our commitment to providing parents everywhere with nutritional solutions for the specific needs of their children.
At a glance
1 Sales: CHF 13.2 billion
2 UTOP: 19.1%
3 14.5% of Nestlé’s sales

Nestlé Annual Review 2018 21
Reshaping the premium snack market: OutshineOutshine’s new formulation leverages on-trend flavors and the brand’s fruit-first approach to ingredients to create a range of refreshing, “snack brighter” offerings. This latest launch reinforces its role in pioneering a new snacking segment. Reflecting consumer appetite for natural, wholesome indulgence, the range is free from corn syrup, artificial colors, fat and gluten. This product is also non-GMO and vegan.
Expanding our plant-based non-dairy options: Nesfit and CarnationNew offerings from Nesfit and Carnation reflect portfolio-wide efforts to expand our range of non-dairy alternatives. Nesfit products are made from wholesome wholegrains while Carnation’s new range offers a non-dairy cooking solution that does not compromise on rich, creamy flavors.
Capturing gaps in the market: DrumstickDrumstick Mini Drums mini cones are the latest addition to our portfolio of snack-sized treats. We were first to market with a format that meets growing demand for convenience and portion-control. At less than 140 calories per treat, the product has proven a big hit with both parents and those looking for permissible indulgence.
Extending into superpremium: Coffee MateThe launch of Natural Bliss Artisan Café creamer reinforces Coffee Mate’s growing reputation for clean label, healthier creamers. By using rapid prototyping and exotic premium ingredients, the development team were able to fast-track Natural Bliss’s entry into the super premium segment.

Nestlé Annual Review 201822
PetCare
Nestlé Purina’s leading portfolio of brands include Pro Plan, Purina ONE, Gourmet and Merrick, among others. We continue to improve our core products, address consumer preferences for natural pet food, advance our e‑commerce capabilities and offer new personalized Direct‑to‑Consumer experiences. To support global demand for our brands in both developed and emerging markets, we continue to invest in our worldwide manufacturing footprint. Our focus on developing nutritional breakthroughs based on proven science will also allow us to deliver on our commitment to help pets live better, longer lives.
Increased manufacturing capacity set to boost growth: Purina CatTo support robust growth in the cat food segment, Purina’s production capacity has been expanded with new plants coming online in Hungary, Poland, Chile, Mexico, Brazil and the United States. Nestlé’s lead in the segment reflects how our investment in science and taste create competitive advantage and robust brand loyalty.
Offering probiotic solutions: Pro PlanPro Plan is the flagship nutrition brand for Purina and select Pro Plan Savor dry formulas offer live probiotics to support digestive health in cats and dogs.
At a glance
1 Sales: CHF 12.8 billion
2 UTOP: 21.6%
3 14.0% of Nestlé’s sales

Nestlé Annual Review 2018 23
New format, same dedication to taste experience: Gourmet GoldThis year’s launch of the Gourmet Gold Melting Heart range is an example of successful premiumization based on superior taste experience.
Strengthening Nestlé’s move into personalized petcare: Tails.comWith its proprietary nutritional algorithm, convenient subscription service and home delivery model, the acquisition of a majority stake in Tails.com offers Nestlé the opportunity to further expand into the field of personalized petcare. The platform comes with a new digital business model that fits strongly with our petcare drive into e-commerce.
Growing opportunities in specialty and veterinarian channels through nutritional solutions: Pro PlanPro Plan Veterinary Diets NC NeuroCare is the world’s first and only pet food diet developed to help nutritionally manage epilepsy in dogs as an adjunct to veterinary therapy. NeuroCare can also be used to manage cognitive dysfunction in dogs. The product is an example of how leading research can support growth in the veterinary segment.
Opening up healthy growth opportunities in snacks: DentaLifeDentaLife daily oral treats provide pet owners with a pioneering aerated chew that reduces tartar buildup in pets. The product is part of Purina’s drive to capture rising demand for healthy pet snacks with functional benefits.

Nestlé Annual Review 201824
Prepared dishesand cooking aids
Meeting local consumer taste: MaggiNaija Pot reflects Maggi’s ability to localize through consumer insight and recipe adaptation. By combining rapid prototyping with local flavors, we were able to capture the ‘bottom of the pot’ taste that consumers craved. The product reflects Maggi’s ‘partner to everyday cooking’ approach by using local raw materials.
Our Prepared dishes and cooking aids category contains a wide range of daily staples, from bouillons, soups, ambient and chilled culinary products, to frozen food and pizzas. We have a number of iconic brands, including Maggi, Stouffer’s and Buitoni that cater to regional and local tastes. We are committed to renovating our product portfolio with more natural, tasty and healthy ingredients.
The authentic taste of italian pizza: BuitoniBuitoni has leveraged pizzeria chef expertise to create an authentic Italian pizza experience inspired by neapolitan know-how. Buitoni Bella Napoli combines the unique taste and texture of 22-hour fermented dough with ingredients sourced from regions known for traditional and quality-focused food culture. The product is also available under the Wagner brand as Ernst Wagners “Original”.
At a glance
1 Sales: CHF 12.1 billion
2 UTOP: 18.0%
3 13.2% of Nestlé’s sales

Nestlé Annual Review 2018 25
Repositioning the core to adapt to new trends: Hot PocketsHot Pockets’ successful relaunch has been achieved by adjusting both its target consumer and value proposition. By adding high-protein variants and investing in its core sandwich segment, the new offering appeals to consumers looking for convenient ‘on the go’ solutions.
Enhancing flavor in top family meals: MaggiMagic Sarap and Masala Ae Magic are examples of Maggi’s strategy to be the partner to every main meal. The ‘All-in-one’ seasonings use simple, natural ingredients and a digital recipe service to inspire parents to cook delicious, balanced meals. Reflecting Nestlé’s core purpose, the products help provide affordable nutrition for the whole family.
Scaling up our plant-based portfolio: Sweet EarthThe launch of the Sweet Earth plant-based pizza illustrates our efforts to enable the shift to more balanced and sustainable food systems by offering consumers vegan choices for top dishes.
Adding exotic ingredients to excite and surprise: ThomyThomy has introduced ethnically-inspired flavors and natural ingredients to meet growing consumer appetite for convenient world cuisine. The brand has also extended its offering in vegan-friendly products.

Nestlé Annual Review 201826
Confectionery
Our Confectionery category includes the iconic global brand KitKat and a large portfolio of much‑loved local brands. We have continued to focus on innovation and premiumization in the category. In line with our aim to provide consumers with healthier options, we launched MilkyBar Wowsomes, a new chocolate bar with 30% less sugar based on Nestlé’s breakthrough technology of micro‑aerated sugar.
A world first in chocolate: KitKatKitKat Ruby is the world’s first naturally ruby-colored chocolate bar, offering consumers a completely new and innovative chocolate experience. What makes the ruby chocolate special is the intense taste it achieves without the addition of any flavor or color.
Creating new brand experiences beyond the moment of consumption: KitKat ChocolatoryThe KitKat Chocolatory temporary pop-up format has continued to expand across new markets. The approach is a showcase for brand building through immersive, personalized experience that goes beyond the moment of consumption.
At a glance
1 Sales: CHF 8.1 billion
2 UTOP: 17.3%
3 8.9% of Nestlé’s sales

Nestlé Annual Review 2018 27
Innovating with local hero brands: Rossiya and TalentoRossiya (Russia) and Garoto’s Talento (Brazil) latest product innovations match local favorites with a new, layered fruit, nut and dark chocolate format that is strongly visually-differentiated. Talento is also the first mainstream, clean label organic chocolate in Brazil giving it specific appeal to millennials.
Premiumization through personalization: Quality StreetQuality Street now allows consumers to customize their own sweet mix and personalize each tin. By collaborating with select retailers, the brand has generated significant consumer excitement and social media buzz. This approach has opened up new growth opportunities for a traditionally seasonal product.
A new all-natural brand created by an internal start-up: Yes!Yes!, Nestlé’s new brand of vegetarian, gluten-free snack bars, was developed from concept to launch in nine months. The brand is positioned to capture the rapid growth in healthy snacking. Using tasty combinations of wholesome ingredients, Yes! delivers great texture and novel flavors such as lemon and quinoa to create meaningful product differentiation.
Reducing sugar content through our breakthrough facets technology: MilkybarMilkybar Wowsomes is our first product to market to leverage our breakthrough micro-aeration technology to reduce sugar content by 30%. This innovation opens up new opportunities in indulgence by providing a natural alternative to artificial sweeteners.

Nestlé Annual Review 201828
Water
Accelerating leadership in premium sparkling and flavored: S.Pellegrino and PerrierOur flagship brands S.Pellegrino and Perrier have added new natural, fruit-flavored offerings and aluminum can formats to capture surging consumer demand for flavored water. Trading on heritage, premium sourcing and naturality these brands appeal strongly to millennials. The new S.Pellegrino Essenza range showcases how the brands continue to refresh their premium differentiation by offering novel flavor combinations and linking consumption to specific occasions.
Nestlé Waters is leading in a fast‑growing category where consumers are increasingly seeking healthier alternatives to sugary drinks and juices, and hydration options with functional benefits. Our Waters business includes Nestlé Pure Life, the world’s biggest bottled water brand, which provides affordable healthy hydration in many markets worldwide. Meanwhile, our international sparkling water brands, S.Pellegrino and Perrier, continue to enjoy strong growth in the premium segment.
Breakthrough cold brew technology creates bio-infused water: VittelVittel’s bio-infusion range is made by slowly brewing fruit at ambient temperature to preserve their natural taste. All products are 100% organic, with no preservatives, no added aromas and no sweeteners satisfying consumer appetites for natural, healthy hydration with authentic taste.
At a glance
1 Sales: CHF 7.4 billion
2 UTOP: 10.5%
3 8.1% of Nestlé’s sales

Nestlé Annual Review 2018 29
Expanding into sparkling and flavored water growth spaces: U.S regional spring water brandsIn the United States, we have introduced sparkling and flavored variants made with natural flavors to our leading local spring water brands. The move is in response to a significant shift in consumer habits away from sugary drinks. The range is free from calories, sugars, sweeteners and colors.
Expanding a premium still icon: Acqua PannaAcqua Panna has begun a major transformation that will see production capacity significantly increased and the brand image refreshed to emphasize its Tuscan origins. These actions offer timely support to the brand’s international expansion.
Expanding our kid-friendly formats to encourage healthy-hydration habits: Nestlé Pure LifeNestlé Pure Life has expanded its product portfolio by introducing new iconic formats and bottle shapes. Launched in more than 15 countries, the new range of ‘Water buddies’ aims to make pure water a go-to for kids, breaking sugary drink habits.
Opening up functional water opportunities: Levissima+Levissima+ not only quenches thirst but also replenishes through the addition of mineral salts, providing functional benefits such as improved muscle function and reduced tiredness.

Nestlé Annual Review 201830
Creating Shared Value
Maggi Naija Pot: A seasoning cube with a social impact
Produced at our Flowergate factory in Nigeria, Maggi’s new Naija Pot seasoning responds to local tastes and the preferences
of today’s consumer for simple and familiar ingredients, while offering an improved nutritional profile that contains less salt.

Nestlé Annual Review 2018 31
Further information Find details of our management approach and governance structure, as well as performance data, case studies and additional content, in our annual Nestlé in society – Creating Shared Value online report and the Nestlé in society section of our corporate website (www.nestle.com/csv).
Creating Shared Value (CSV) is fundamental to how we do business at Nestlé. We believe that our company will be successful in the long term by creating value for both our shareholders and for society. Our activities and products should make a positive difference to society while contributing to Nestlé’s ongoing success.
Focus on key areasLong‑term value creation requires focus. In consultation with experts, we chose to prioritize the three areas where our business intersects the most with society: nutrition, rural development and water. Value creation is only possible with a solid foundation of compliance and a culture of respect, as well as a firm commitment to environmental and social sustainability. Our impact on these focus areas is measured by progress against publicly stated commitments, which are informed by our materiality assessment (see p. 41) and regular feedback from external groups.
The business case for Creating Shared ValueWe cannot maximize long‑term sustainable value creation for shareholders at the expense of other stakeholders. We believe that societies will not support a business that harms our communities and overall sense of well‑being. Creating Shared Value helps ensure that we remain relevant with consumers.
To better connect financial with non‑financial value creation and reporting, we worked with Ernst & Young (EY) and Valuing Nature to conduct an impact assessment to calculate the societal and business value generated by our Global Youth Initiative (GYI). Launched in 2017, the GYI is expected to create 10 million economic opportunities for young people over the next decade. The study revealed that the initiative generated a positive business return on
investment, and an even higher societal return. More detail on the results and methodology have been published on our website.
This impact valuation methodology has been peer‑reviewed by FSG and continues to be refined through application to other projects. We are currently conducting an impact valuation of our Caring for Water initiative.
We also participated in the work of the Embankment Project for Inclusive Capitalism (EPIC), which aims at shaping the broader conversation on long‑term value creation.
Nestlé CEO U. Mark Schneider with students of the Kouadiolangokro bridge school in rural Côte d’Ivoire. Built in partnership with the Jacobs Foundation, bridge schools provide access to education and help prevent child labor.

Nestlé Annual Review 201832
Nestlé. Enhancing quality of life and contributing to a healthier future.
At Nestlé, we touch billions of lives worldwide: from the individuals and families who enjoy our products, to the communities in which we live, work and source our ingredients, and the natural environment upon which we all depend. Having identified three core areas where we make an impact, we have made public commitments against our most material issues, which help us achieve our ambitions and ultimately support the UN Sustainable Development Goals (SDG) for 2030.
Driven by our company purpose —enhancing quality of life and contributing to a healthier future— our 2030 ambitions align with those of the United Nations 2030 Agenda for Sustainable Development.
New In progress Achieved
Status of our commitments
Our 2030 ambition is to help 50 million children lead healthier lives
Enabling healthier and happier lives
Offering tastier and healthier choices
Inspiring people to lead healthier lives
Building, sharing and applying nutrition knowledge
Launch more foods and beverages that are nutritious, especially for mothers‑to‑be, new mothers, and infants and children
Further decrease sugars, sodium and saturated fat
Increase vegetables, fiber‑rich grains, pulses, nuts and seeds in our foods and beverages
Simplify our ingredient lists and remove artificial colors
Address undernutrition through micronutrient fortification
Apply and explain nutrition information on packs, at point of sale and online
Offer guidance on portions for our products
Leverage our marketing efforts to promote healthy cooking, eating and lifestyles
Empower parents, caregivers and teachers to foster healthy behaviors in children
Support breastfeeding and protect it by continuing to implement an industry‑leading policy to market breast‑milk substitutes responsibly
Inspire people to choose water to lead healthier lives
Partner for promoting healthy food environments
Build and share nutrition knowledge from the first 1000 days through to healthy aging
Build biomedical science leading to health‑promoting products, personalized nutrition and digital solutions
For individuals and families

Nestlé Annual Review 2018 33
Our 2030 ambition is to improve 30 million livelihoods in communities directly connected to our business activities
Our 2030 ambition is to strive for zero environmental impact in our operations
Caring for water Acting on climate change
Respecting and promoting human rights
Safeguarding the environment
Promoting decent employment and diversity
Work to achieve water efficiency and sustainability across all our operations
Advocate for effective water policies and stewardship
Engage with suppliers, especially those in agriculture
Raise awareness on water conservation and improve access to water and sanitation across our value chain
Improve farm economics among the farmers who supply us
Improve food availability and dietary diversity among the farmers who supply us
Implement responsible sourcing in our supply chain and promote animal welfare
Continuously improve our green coffee supply chain
Roll out the Nestlé Cocoa Plan with cocoa farmers
Provide climate change leadership
Promote transparency and proactive, long‑term engagement in climate policy
Assess and address human rights impacts across our business activities
Improve workers’ livelihoods and protect children in our agricultural supply chain
Enhance a culture of integrity across the organization
Provide effectivegrievance mechanisms to employees and stakeholders
Improve the environmental performance of our packaging
Reduce food loss and waste
Provide meaningful and accurate environmental information and dialogue
Preserve natural capital
Roll out our Nestlé needs YOUth initiative across all our operations
Enhance gender balance in our workforce and empower women across the entire value chain
Advocate for healthy workplaces and healthier employees
For our communities
Enhancing rural development and livelihoods
Helping develop thriving, resilient communities
Stewarding resources for future generations
For the planet

Nestlé Annual Review 201834
Enabling healthier and happier lives
At a glance
1 29 million children reached through Nestlé for Healthier Kids
2 Over 1300 new nutritious products launched for babies, children, expecting women or new mothers
3 CHF 1.7 billion invested in research and development
Inspiring people to lead healthier livesWe make sure our brands provide healthy recipes, clear nutrition information and portion guidance to raise awareness and help consumers adopt healthier lifestyles.
Good nutrition in the early years lays the foundation for lifelong health and well‑being. Our flagship initiative Nestlé for Healthier Kids aims to educate and inspire parents and caregivers of children during the crucial period from conception to adolescence.
Consumer food habits are changing. In line with these evolving needs, we are transforming our products, making them more nutritious and natural. We also help parents everyday through supportive services. The driving force is Nestlé for Healthier Kids, our flagship initiative to help 50 million children lead healthier lives by 2030.
NesquikMaking healthy choices easier with a range of reduced sugar options of iconic brands.

Nestlé Annual Review 2018 35
Offering tastier and healthier choicesMalnutrition comes in many forms: undernutrition, obesity or being overweight, and micronutrient deficiencies. Combating malnutrition remains one of the greatest global health challenges.
With particular attention to children, we are committed to launching more nutritious foods and drinks, increasing vegetable and whole grain content, simplifying ingredient lists and removing artificial colors. We also fortify products where needed and are reducing sugar, sodium and saturated fat.
Sweet EarthFlexitarian, vegetarian, these plant‑based meal options help to support a healthy diet without compromising on nutrition, taste or convenience.
Building, sharing and applying nutrition knowledgeOur scientists and researchers work to discover how different aspects of nutrition impact us at every stage of life. Our studies of infants’ and children’s eating habits for instance, which include dietary intake information from over 55 000 infants, toddlers and school‑aged children worldwide, help us to improve products and services. The learnings are also shared with medical and nutrition communities to address various global health challenges.
VitafloOur cutting edge research allows us to help people with food‑related medical conditions.

Nestlé Annual Review 201836
Helping develop thriving, resilient communities
Enhancing rural development and livelihoodsBy understanding the challenges farmers face, we aim to improve productivity and incomes, make agriculture more attractive and secure long‑term supplies.
Our Child Labour Monitoring and Remediation System continues to grow in our cocoa supply countries, Côte d’Ivoire and Ghana, and has now helped 11 130 children.
In 2018, we launched Grown Respectfully to communicate the work of our Nescafé Plan by conveying real, inspiring experiences from coffee growers.At a glance
1 63% of our 14 priority categories of ingredients are responsibly sourced
2 43.2% of Nestlé’s leadership roles are held by women
3 Over 400 000 young people reached through Nestlé needs YOUth
We aim to develop thriving, resilient communities as part of a secure, long‑term value chain, empowering our employees, supporting rural development, ensuring responsible sourcing and promoting human rights. Initiatives such as our Nespresso AAA Sustainable Quality Program, Nescafé Plan, Nestlé Cocoa Plan and Farmer Connect help ensure the resilience of thousands of suppliers and farmers around the world.
NescaféGrown Respectfully brings to life the work that Nescafé has been doing for over 80 years to help our farmers grow better coffee, sustainably.

Nestlé Annual Review 2018 37
Respecting and promoting human rightsWe are committed to respecting and promoting human rights across our activities. We work with experts to identify risks and implement action plans.
We have further promoted human rights at country operation level, a key step toward governance structures to oversee human rights risks and opportunities. We also launched an updated training tool, which will help us achieve our objective to train all Nestlé employees on human rights.
KitKatNestlé is committed to supporting sustainable cocoa farming and teamed up with ethical ad platform Good‑Loop to allow viewers to donate part of the KitKat brand’s media budget to the Nestlé Cocoa Plan.
Promoting decent employment and diversityEnsuring decent employment, diversity and inclusion is a key aspect of Nestlé’s culture. In 2018, we pledged to accelerate achieving equal pay. We implemented a new maternity policy across our markets and publicly committed to the UN’s Standards of Conduct for Business to tackle LGBTI discrimination. Furthermore, we worked on tackling conscious and unconscious biases in our organization through trainings and communications.
NespressoThe role of women in coffee smallholder farming is very important to the sustainable development of their local communities and the sector. This is why Nespresso emphasizes gender equality in coffee‑sourcing regions.

Nestlé Annual Review 201838
Stewarding resources for future generations
At a glance
1 We have 18 zero water factories
2 38.2% reduction in GHG emissions per tonne of product since 2008
3 118 710 tonnes of packaging avoided since 2015
Caring for waterCaring for water is a key part of achieving our ambition of zero environmental impact in our operations. We continue to reduce withdrawals per tonne of product and reuse water. We also work with others, such as the Alliance for Water Stewardship, on water stewardship initiatives and increasing access to safe water, sanitation and hygiene, a fundamental right for everyone.
NidoNestlé dairy processing factories are progressing toward becoming zero water facilities by reusing the water recovered from the milk evaporation process.
We are dependent upon forests, soils, the oceans and the climate to deliver a sustainable supply of resources for our operations. We have set commitments and objectives to use and manage resources sustainably, by operating more efficiently, responding to climate change, reducing food loss and waste, and caring for water. Our ambition is to strive for zero environmental impact in our operations.

Nestlé Annual Review 2018 39
Acting on climate changeAs an industry, we are impacted by climate change. Changing weather influences crop yields and the livelihoods of farmers. We are determined to help our farmers build resilience to climate change, and are playing our part in reducing our impact upon the climate by reducing greenhouse gas (GHG) emissions in line with science‑based targets throughout the value chain.
Safeguarding the environmentAcross Nestlé, we reduce, reuse and recycle to move our sites toward zero waste for disposal. We want no Nestlé packaging to end up in landfills or as litter, on land or at sea.
In 2018, we announced the creation of the Nestlé Institute of Packaging Sciences, dedicated to the discovery and development of functional, safe and environmentally‑friendly packaging solutions. This is a step toward our ambition to make 100% of our packaging recyclable or reusable by 2025.
We rely on healthy forests, soils and oceans for the ingredients we use. We aim to improve our environmental performance while growing our business: from working with farmers to manage soils and avoid excess run‑off, to investing in waste infrastructure to stop plastic leakage, to supporting global efforts, like the Global Ghost Gear Initiative.
Pure LifeNestlé Pure Life water bottles, already made from recyclable plastic, are an example of our global packaging ambition to make 100% of our packaging recyclable or reusable by 2025.
ExtrafinoWe work closely with local dairy farmers, collecting fresh milk and supporting energy‑efficient projects.

Nestlé Annual Review 201840
Stakeholder engagement and materiality mapping
Our stakeholders include: investors, multilateral organizations, governments, NGOs, academia, local communities, suppliers, consumers and business‑to‑business customers.
Every two years, we ask an independent third party to carry out a formal materiality assessment, to help us identify the most important issues for our business and our stakeholders.
Our stakeholder convenings and other events provide further opportunities for dialogue. In March 2018, our Creating Shared Value Forum —attended by Nestlé Chairman Paul Bulcke and CEO U. Mark Schneider—was held in conjunction with the eighth Global World Water Forum in Brasilia, Brazil. In 2018, as part of our investor outreach we met with 660 firms and 1148 investors across 23 cities.
Our performance in leading indicesWe are not driven by awards and recognition, but we’re proud to have our sustainability efforts and achievements acknowledged by world‑leading ratings and rankings agencies:
Engaging with others on important issues strengthens our business. We seek the advice of experts, advocates and challengers to develop our corporate policies and commitments, inform strategy and prioritize investments.
Nestlé Chairman Paul Bulcke speaks at the 2018 Creating Shared Value Forum in Brasilia, Brazil, where the topic was “Water as a driver for the Sustainable Development Goals.”
Nestlé has been consistently listed in the FTSE4Good Responsible Investment Index since 2011.
Ranked first out of 22 global food and beverage manufacturers in the 2018 Access to Nutrition Index™ (ATNI).
Ranked second in the Food Products industry of the 2018 Dow Jones Sustainability Index (DJSI), scored 100 for Health and Nutrition performance, and hold the leadership scores in the Environmental and Social Dimensions.
Retained our place in CDP’s Climate A list.

Nestlé Annual Review 2018 41
P Over and undernutritionP Responsible marketing
and influenceP Product qualityP Food and product safetyP Changing consumer
demographics and trendsP Food and nutrition securityP Data privacy and cyber security
P Supply chain stewardshipP Women’s empowermentP Product regulation and taxationP Human rightsP Animal welfareP Business ethicsP Employee Safety,
Health and WellnessP Geopolitical uncertaintyP Fair employment
and equal opportunitiesP Natural disastersP Responsible use of technologyP Community relationsP Rural development
and poverty alleviation
P Natural resource and water stewardship
P Resource Efficiency, (Food) Waste and the Circular Economy
P Land management in the supply chain
P Climate changeP Product packaging and plastic
Imp
ort
ance
to s
takeh
old
ers
MajorSignificantModerate
Impact on Nestlé’s success
Mo
der
ate
Sig
nifi
can
tM
ajo
r
Women’s empowerment
Community relations
Animal Welfare
Employee Safety, Health and Wellness
Fair employment and equal opportunities
Product regulation and taxation
Geopolitical uncertainty
Responsible use of technology
Data privacy and cyber security
Over and undernutrition
Supply chain stewardship
Food and product safety
Changing consumer demographics and trends
Product packaging and plastic
Rural development and poverty alleviation
Human rights
Business ethics
Responsible marketing and influence
Product quality
Food and nutrition security
Resource Efficiency, (Food) Waste and the Circular EconomyLand management in the supply chain
Climate change
Natural resource and water stewardship
For individuals and families For our communities For the planet
Nestlé materiality matrix 2018

Nestlé Annual Review 201842 Nestlé Annual Review 201842
Financial review

Nestlé Annual Review 2018 43
Key figures (consolidated)
In millions of CHF (except for data per share and employees)
2017 * 2018
Results Sales 89 590 91 439
Underlying Trading operating profit (a) 14 771 15 521
as % of sales 16.5% 17.0%
Trading operating profit (a) 13 277 13 789
as % of sales 14.8% 15.1%
Profit for the year attributable to shareholders of the parent (Net profit) 7 156 10 135
as % of sales 8.0% 11.1%
Balance sheet and Cash flow statementEquity attributable to shareholders of the parent 60 956 57 363
Net financial debt (a) 21 369 30 330
Ratio of net financial debt to equity (gearing) 35.1% 52.9%
Operating cash flow 14 199 15 398
as % of net financial debt 66.4% 50.8%
Free cash flow (a) 9 358 10 765
Capital additions 6 569 14 711
as % of sales 7.3% 16.1%
Data per shareWeighted average number of shares outstanding (in millions of units) 3 092 3 014
Basic earnings per share CHF 2.31 3.36
Underlying earnings per share (a) CHF 3.55 4.02
Dividend as proposed by the Board of Directors of Nestlé S.A. CHF 2.35 2.45
Market capitalization, end December 256 223 237 363
Number of employees (in thousands) 323 308
Principal key figures (b) (illustrative) in CHF, USD, EUR
In millions (except for data per share) Total CHF Total CHF Total USD Total USD Total EUR Total EUR
2017 2018 2017 2018 2017 2018
Sales 89 590 91 439 91 032 93 366 80 509 79 208
Underlying Trading operating profit (a) 14 771 15 521 15 009 15 848 13 274 13 445
Trading operating profit (a) 13 277 13 789 13 490 14 080 11 931 11 945
Profit for the year attributable to shareholders of the parent (Net profit) 7 156 10 135 7 271 10 348 6 430 8 779
Equity attributable to shareholders of the parent 60 956 57 363 62 404 58 177 52 205 50 855
Market capitalization, end December 256 223 237 363 262 309 240 733 219 440 210 432
Data per share
Basic earnings per share 2.31 3.36 2.35 3.43 2.08 2.91
* 2017 figures have been restated, see Foreword on page 44.(a) Certain financial performance measures are not defined by IFRS. For further details, see Foreword on page 44.(b) Income statement figures translated at weighted average annual rate; Balance sheet figures at year‑end rate.

Nestlé Annual Review 201844
Group overview
Foreword2017 figures disclosed in the Financial review have been restated to reflect: – modifications as described in Note 1
Accounting policies of the Consolidated Financial Statements of the Nestlé Group 2018; and
– the changes of business structure, effective as from January 1, 2018, mainly Nestlé Nutrition from a Globally-Managed to a Regionally-Managed Business transferred to the Zones and Other businesses.
In addition, the Financial review contains certain financial performance measures, that are not defined by IFRS, that are used by management to assess the financial and operational performance of the Group. They include among others: – Organic growth, Real internal growth
and Pricing; – Underlying Trading operating profit margin
and Trading operating profit margin; – Net financial debt; – Free cash flow; and – Underlying earnings per share (EPS) and EPS
in constant currency.Management believes that these non-IFRS financial performance measures provide useful information regarding the Group’s financial and operating performance.
The Alternative Performance Measures document published under www.nestle.com/investors/publications defines these non-IFRS financial performance measures.
IntroductionWe are pleased with our progress in 2018. All financial performance metrics improved significantly and we saw revived growth in our two largest markets, the United States and China, as well as in our infant nutrition business. Nestlé keeps investing in future growth and—at the same time—has increased the amount of cash returned to shareholders through our dividend and share buyback program.
We made significant progress with our portfolio transformation and sharpened our Group’s strategic focus, strengthening key growth categories and geographies in the process. Our unique Nutrition, Health and Wellness strategy,
with food, beverages and nutritional health products at its core, has become much clearer as we completed a sizeable number of transactions and announced strategic reviews for Nestlé Skin Health and Herta.
In 2018, we upgraded our innovation engine notably to ensure continued technology leadership and a shorter time to market. In the fast-changing food and beverages space Nestlé has what it takes to truly excite consumers with meaningful innovation and must-have products.
We reaffirmed our sustainability leadership at a time when consumers and regulators around the world are increasingly looking for solutions to today’s environmental and societal problems. Our decisive action and strong commitments to tackle the global packaging waste problem are a case in point.
Sales by geographic areas
Differences 2018/2017 (in %)
in CHFin local
currencyin CHF
millions
By principal markets 2018
United States + 4.1% + 4.6% 27 618
Greater China Region + 6.5% + 5.2% 7 004
France + 3.1% – 0.7% 4 561
Brazil – 14.7% – 1.5% 3 683
United Kingdom + 8.4% + 5.8% 2 930
Mexico + 3.4% + 6.0% 2 813
Germany + 2.6% – 1.1% 2 752
Philippines – 3.7% + 1.3% 2 476
Canada + 6.2% + 6.9% 2 064
Italy + 2.1% – 1.6% 1 819
Japan + 1.8% + 0.9% 1 782
Russia – 1.6% + 6.9% 1 595
Spain + 1.7% – 2.0% 1 552
Australia – 1.1% + 2.1% 1 552
India + 4.9% + 10.9% 1 529
Switzerland – 1.8% – 1.8% 1 241
Rest of the world + 1.3% (a) 24 468
Total + 2.1% (a) 91 439
(a) Not applicable.

Nestlé Annual Review 2018 45
We are on our way to meeting our 2020 targets and positioning Nestlé for sustained and sustainable growth in the years beyond.
Group salesOrganic growth (OG) reached 3.0%, fully in line with the February 2018 guidance. Group real internal growth (RIG) increased to 2.5% for the full year and remained at the high end of the food and beverages industry. This was supported by disciplined execution, faster innovation and successful new product launches. Pricing was 0.5%, with some improvement from 0.3% in the first half to 0.9% in the second half of the year. Net acquisitions increased sales by 0.7%. This was largely related to the acquisitions of the Starbucks license and Atrium Innovations, which more than offset divestments, mainly U.S. confectionery. Foreign exchange reduced sales by 1.6% as several emerging market currencies devalued against the Swiss franc. Total reported sales increased by 2.1% to CHF 91.4 billion.
2018 organic growth was supported by stronger momentum in the United States and China, Nestlé’s two largest markets. There was also a step up in organic growth for the infant nutrition and confectionery businesses. PetCare, coffee and Nestlé Health Science continued to make significant contributions with sustained high growth. Organic growth for the Group was 1.6% in developed markets and 4.9% in emerging markets.
Underlying Trading operating profitUnderlying Trading operating profit increased by 5.1% to CHF 15.5 billion. The Underlying Trading operating profit margin increased by 50 basis points in constant currency and on a reported basis to 17.0%.
Margin expansion was supported by operational efficiencies, structural cost reductions and improved mix, which more than offset higher distribution expenses. Overall, the impact of commodity costs was broadly neutral, as increases in Zone AMS and Nestlé Waters were compensated by decreases in the other geographies and categories. Consumer-facing marketing expenses increased by 1.3% in constant currency.
15 521
17.0%13 789
15.1%
Underlying Trading operating profit by operating segmentIn % of sales
Trading operating profitby operating segmentIn % of sales
Underlying Trading operating profit and Trading operating profitIn millions of CHF In % of sales
P Zone AMSP Zone EMENAP Zone AOAP Nestlé WatersP Other businesses (a)
(a) Mainly Nespresso, Nestlé Health Science, Nestlé Skin Health and Gerber Life Insurance.
P Underlying Trading operating profitP Trading operating profit
* 2017 figures have been restated, see Foreword on page 44.
2017 * 2017 *2018 2018
14 771
13 277 16.5%14.8%
16.5
%
11.0
%
22
.8%
19.0
%
21.1
%
14.6
%
8.7
%
21.2
%
17.2
%
19.6
%

Nestlé Annual Review 201846
Restructuring expenses and net other trading items increased by CHF 238 million to CHF 1.7 billion. This was mainly due to higher impairments and other restructuring-related expenses. Trading operating profit increased by 3.9% to CHF 13.8 billion. The Trading operating profit margin increased by 30 basis points on a reported basis to 15.1%.
Net financial expenses and Income taxNet financial expenses grew by 9.3% to CHF 761 million, largely reflecting an increase in net debt.
The Group tax rate decreased by 280 basis points to 26.5%. The underlying tax rate declined by 320 basis points to 23.8%, mainly as a result of the United States tax reform.
Net profit and Earnings per shareNet profit grew by 41.6% to CHF 10.1 billion, and Earnings per share increased by 45.5% to CHF 3.36. Net profit benefited from several large one-off items, including income from the disposal of businesses. The increase was also supported by the improved operating performance.
Underlying earnings per share increased by 13.9% in constant currency and by 13.1% on a reported basis to CHF 4.02. Nestlé’s share buyback program contributed 2.0% to the underlying earnings per share increase, net of finance costs.
Cash flowFree cash flow grew by 15% and reached CHF 10.8 billion. The increase resulted mainly from higher operating profit, improved working capital and disciplined capital expenditure.
Share buyback programDuring 2018, the Group repurchased CHF 6.8 billion of Nestlé shares. As of December 31, 2018, the Group had implemented CHF 10.3 billion (52%) of Nestlé’s CHF 20 billion share buyback program announced in 2017. In light of strong free cash flow generation, Nestlé intends to complete its current program six months ahead of schedule by the end of December 2019.
Group overview
85.00
80.00
75.00
70.00
| | | | | | | | | | | |
J F M A M J J A S O N D
Evolution of the Nestlé S.A. share in 2018
In CHF
P Nestlé S.A. shareP Nestlé relative to Swiss Market Index
100.0%
95.0%
90.0%
85.0%
Dividend per sharein CHF
2.202.25
2.352.30
2.45
2.31
15.4
2017 * 2017 *2018 2018
3.3614.2
Earnings per sharein CHF
Operating cash flowin billions of CHF
* 2017 figures have been restated, see Foreword on page 44.
2014 2015 2016 2017 2018

Nestlé Annual Review 2018 47
Net debtNet debt increased to CHF 30.3 billion as at December 31, 2018, compared to CHF 21.4 billion at the end of 2017. The increase largely reflected share buybacks of CHF 6.8 billion completed during 2018, and a net cash outflow of CHF 5.2 billion on acquisitions and divestments.
Return on invested capitalThe Group’s return on invested capital increased to 12.1%. The improvement was the result of lower goodwill impairment, improved operating performance and disciplined capital allocation.
DividendThe Board of Directors is proposing a dividend of CHF 2.45 per share, up from CHF 2.35 last year.
OutlookContinued improvement in organic sales growth and Underlying Trading operating profit margin toward our 2020 targets. Restructuring costs (1) are expected at around CHF 700 million. Underlying earnings per share in constant currency and capital efficiency are expected to increase.
(1) Not including impairment of fixed assets, litigation and onerous contracts.
Sales, employees and factories by geographic area
Sales Employees Factories
2017 * 2018 2017 2018 2017 2018
AMS 45.3% 44.9% 33.5% 33.9% 158 159
EMENA (a) 29.1% 29.4% 33.9% 34.1% 146 146
AOA 25.6% 25.7% 32.6% 32.0% 109 108
* 2017 figures have been restated, see Foreword on page 44.(a) 9666 employees in Switzerland in 2018.
Employees by activity
In thousands
2017 2018
Factories 164 152
Administration and sales 159 156
Total 323 308

Nestlé Annual Review 201848
Product category and operating segment review
In millions of CHF
2017 * 2018 Proportion of total sales (%) RIG (%) OG (%)
Powdered and Liquid BeveragesSoluble coffee/coffee systems 9 265 9 314 43.1%
Other 11 123 12 306 56.9%
Total sales 20 388 21 620 + 2.5% + 3.3%
Underlying Trading operating profit 4 478 4 898 22.7%
Trading operating profit 4 319 4 572 21.1%
WaterTotal sales 7 382 7 409 – 0.6% + 2.3%
Underlying Trading operating profit 978 775 10.5%
Trading operating profit 915 603 8.1%
Milk products and Ice creamMilk products 10 751 10 507 79.5%
Ice cream 2 679 2 710 20.5%
Total sales 13 430 13 217 + 1.3% + 1.8%
Underlying Trading operating profit 2 515 2 521 19.1%
Trading operating profit 2 333 2 412 18.2%
Nutrition and Health ScienceTotal sales 15 247 16 188 + 4.5% + 4.6%
Underlying Trading operating profit 3 063 3 337 20.6%
Trading operating profit 2 539 2 826 17.5%
Prepared dishes and cooking aidsFrozen and chilled 6 130 6 105 50.6%
Culinary and other 5 808 5 960 49.4%
Total sales 11 938 12 065 + 1.2% + 1.2%
Underlying Trading operating profit 2 108 2 176 18.0%
Trading operating profit 1 938 2 044 16.9%
ConfectioneryChocolate 6 362 6 031 74.2%
Sugar confectionery 1 098 812 10.0%
Biscuits 1 339 1 280 15.8%
Total sales 8 799 8 123 + 3.2% + 2.7%
Underlying Trading operating profit 1 393 1 403 17.3%
Trading operating profit 1 243 1 291 15.9%
PetCareTotal sales 12 406 12 817 + 3.5% + 4.5%
Underlying Trading operating profit 2 673 2 768 21.6%
Trading operating profit 2 621 2 572 20.1%
* 2017 figures have been restated, see Foreword on page 44.

Nestlé Annual Review 2018 49
Zone Americas (AMS)
– 2.0% organic growth: 1.3% RIG; 0.7% pricing. – North America saw positive organic growth,
with positive RIG and pricing. – Latin America reported positive organic growth,
comprised of a balance of RIG and pricing. – The Underlying Trading operating profit margin
increased by 50 basis points to 21.1%.
Organic growth increased to 2.0%, supported by higher RIG of 1.3% following an acceleration in North America. Pricing remained soft at 0.7% but showed improved momentum in the second half of the year. Net acquisitions increased sales by 0.3%. Foreign exchange had a negative impact of 3.2%. Reported sales in Zone AMS decreased by 0.9% to CHF 31.0 billion.
North America returned to positive growth in 2018, with strong momentum in the fourth quarter. This was supported
by continued solid growth in Purina petcare, particularly with Pro Plan, Fancy Feast and Tidycat, and the e-commerce channel. Coffee Mate creamers and Nestlé Professional also maintained high growth. The infant nutrition business returned to positive growth in the fourth quarter. The licensed Starbucks business was smoothly integrated and saw strong demand for its coffee products. Growth in frozen food, including pizza, was flat.
Latin America posted positive organic growth with broad-based contributions from most categories. Momentum improved sequentially in each quarter of the year, with mid single-digit growth in the fourth quarter, helped by increased pricing. In Brazil the trading environment remained challenging. The market returned to positive organic growth in the second half of the year, with stronger pricing and an acceleration across most categories, especially in confectionery and infant nutrition. Mexico maintained consistent mid single-digit organic growth, with a strong contribution from Nescafé and NAN infant formula. Purina petcare, with sales in excess of CHF 1 billion in Latin America, reported another year of double-digit growth.
The Zone’s Underlying Trading operating profit margin improved by 50 basis points as ongoing restructuring projects reduced structural costs. Operational efficiencies and pricing helped to offset significant cost increases from commodity and freight inflation, as well as foreign exchange.
Sales CHF 31.0 billion
Organic growth + 2.0%
Real internal growth + 1.3%
Underlying Trading operating profit margin 21.1%
Underlying Trading operating profit margin + 50 basis points
Trading operating profit margin 19.6%
Trading operating profit margin + 20 basis points
Zone AMS
In millions of CHF
2017 * 2018 Proportion of total sales (%) RIG (%) OG (%)
United States and Canada 20 217 20 540 66.3%
Latin America and Caribbean 11 038 10 435 33.7%
Powdered and Liquid Beverages 3 356 4 057 13.1%
Milk products and Ice cream 7 166 6 991 22.5%
Prepared dishes and cooking aids 5 606 5 541 17.9%
Confectionery 3 501 2 718 8.8%
PetCare 8 641 8 783 28.4%
Nutrition and Health Science 2 985 2 885 9.3%
Total sales 31 255 30 975 + 1.3% + 2.0%
Underlying Trading operating profit 6 425 6 521 21.1%
Trading operating profit 6 062 6 078 19.6%
Capital additions 1 941 7 356 23.7%
* 2017 figures have been restated, see Foreword on page 44.

Nestlé Annual Review 201850
Zone Europe, Middle East and North Africa (EMENA)
– 1.9% organic growth: 2.6% RIG; –0.7% pricing. – Western Europe posted positive RIG. Pricing declined
resulting in negative organic growth. – Central and Eastern Europe maintained mid single-digit
organic growth, mainly driven by RIG. Pricing was also positive.
– Middle East and North Africa saw continued mid single-digit organic growth. RIG and pricing were positive.
– The Underlying Trading operating profit margin grew by 80 basis points to 19.0%.
Organic growth was 1.9%, supported by solid RIG at 2.6%. Pricing declined by 0.7% as deflationary trends continued to affect the food and retail sectors across most markets in Western Europe. Net acquisitions increased sales by 0.1%. Foreign exchange increased sales by 0.5%. Reported sales in Zone EMENA increased by 2.5% to CHF 18.9 billion.
Zone EMENA maintained solid organic growth in 2018. RIG was resilient and positive across all subregions. The trading environment in Western Europe remained deflationary, resulting in negative pricing. The Zone’s growth was mainly driven by Purina petcare, infant nutrition and Nestlé Professional. Premium products, representing 22% of the Zone’s sales, saw strong growth of around 10%. This strong momentum came from products such as Felix and Gourmet cat food, as well as NAN infant formula with Human Milk Oligosaccharides (HMOs). Nescafé posted positive growth in spite of lower coffee commodity prices and a challenging competitive environment. Confectionery had positive growth supported by innovation. The new all-natural, vegetarian and gluten-free snack bar Yes! was launched in September.
The Zone’s Underlying Trading operating profit margin increased by 80 basis points. This improvement was supported by product mix, structural cost savings, operational efficiencies and lower commodity costs.
Zone EMENA
In millions of CHF
2017 * 2018 Proportion of total sales (%) RIG (%) OG (%)
Western 11 448 11 791 62.3%
Eastern and Central 3 486 3 570 18.8%
Middle East and North Africa 3 544 3 571 18.9%
Powdered and Liquid Beverages 5 108 5 154 27.2%
Milk products and Ice cream 1 061 1 067 5.7%
Prepared dishes and cooking aids 3 885 3 923 20.7%
Confectionery 3 226 3 293 17.4%
PetCare 3 227 3 466 18.3%
Nutrition and Health Science 1 971 2 029 10.7%
Total sales 18 478 18 932 + 2.6% + 1.9%
Underlying Trading operating profit 3 354 3 590 19.0%
Trading operating profit 3 111 3 251 17.2%
Capital additions 1 021 1 422 7.5%
* 2017 figures have been restated, see Foreword on page 44.
Sales CHF 18.9 billion
Organic growth + 1.9%
Real internal growth + 2.6%
Underlying Trading operating profit margin 19.0%
Underlying Trading operating profit margin + 80 basis points
Trading operating profit margin 17.2%
Trading operating profit margin + 40 basis points

Nestlé Annual Review 2018 51
Zone Asia, Oceania and sub‑Saharan Africa (AOA)
– 4.3% organic growth: 3.6% RIG; 0.7% pricing. – China posted mid single-digit organic growth,
significantly higher than the prior year. – South-East Asia reported mid single-digit organic growth,
with positive RIG and pricing. – South Asia saw mid single-digit organic growth,
with strong RIG and positive pricing. – Sub-Saharan Africa had mid single-digit organic growth
with a balance of positive RIG and pricing. – Japan and Oceania reported low single-digit growth.
Positive RIG was partially offset by negative pricing. – The Underlying Trading operating profit margin increased
by 60 basis points to 22.8%.
Organic growth was strong at 4.3%, comprised of 3.6% RIG and 0.7% pricing. Acquisitions and divestments had no impact on sales. Foreign exchange reduced sales by 2.1%.
Reported sales in Zone AOA increased by 2.2% to CHF 21.3 billion.
Zone AOA maintained consistent mid single-digit organic growth. China saw improved growth compared to 2017. This was supported by innovations in infant nutrition, coffee and culinary, as well as strong growth in e-commerce. South-East Asia posted solid growth underpinned by double-digit growth in Vietnam and Indonesia, led by Milo and Bear Brand in particular. Robust growth in South Asia was based on strong momentum for Maggi, Nescafé and KitKat, with several new product launches. Sub-Saharan Africa posted mid single-digit growth despite a lower contribution from pricing. Japan and Oceania reported positive growth with successful launches of Nescafé Gold and KitKat Gold in Australia. Overall for the Zone, infant nutrition, Purina petcare and Nestlé Professional grew mid single-digit, helped by a strong performance in the second half.
The Zone’s Underlying Trading operating profit margin improved by 60 basis points, supported by operational efficiencies, pricing and volume leverage.
Zone AOA
In millions of CHF
2017 * 2018 Proportion of total sales (%) RIG (%) OG (%)
ASEAN markets 6 423 6 563 30.8%
Oceania and Japan 3 036 3 036 14.2%
Other Asian markets 8 997 9 309 43.6%
Sub‑Saharan Africa 2 422 2 423 11.4%
Powdered and Liquid Beverages 5 953 6 086 28.5%
Milk products and Ice cream 5 192 5 149 24.1%
Prepared dishes and cooking aids 2 443 2 599 12.2%
Confectionery 2 014 2 056 9.6%
PetCare 539 568 2.7%
Nutrition and Health Science 4 737 4 873 22.9%
Total sales 20 878 21 331 + 3.6% + 4.3%
Underlying Trading operating profit 4 644 4 866 22.8%
Trading operating profit 4 468 4 514 21.2%
Capital additions 770 1 103 5.2%
* 2017 figures have been restated, see Foreword on page 44.
Sales CHF 21.3 billion
Organic growth + 4.3%
Real internal growth + 3.6%
Underlying Trading operating profit margin 22.8%
Underlying Trading operating profit margin + 60 basis points
Trading operating profit margin 21.2%
Trading operating profit margin – 20 basis points

Nestlé Annual Review 201852
Nestlé Waters
– 2.1% organic growth: –0.6% RIG; 2.7% pricing. – North America saw increased pricing and declining RIG. – Europe saw positive RIG and slightly negative pricing. – Emerging markets posted low single-digit organic
growth, driven by pricing. – The Underlying Trading operating profit margin
decreased by 200 basis points to 11.0%.
Organic growth was 2.1%. Pricing improved to 2.7%, mainly due to price increases in North America. This was partially offset by a RIG decline of 0.6%, also attributable to North America. Net acquisitions reduced sales by 1.0%. Foreign exchange had a negative impact on sales of 1.2%. Reported sales in Nestlé Waters were CHF 7.9 billion.
In North America growth was supported by price increases in the United States, reflecting significant cost inflation in packaging and distribution. There were strong
contributions to growth from the international premium brands S.Pellegrino and Perrier, the launch of sparkling spring waters such as Poland Spring and Zephyrhills, as well as the Direct-to-Consumer business, ReadyRefresh. Europe saw positive growth following a return to mid single-digit growth in the second half of the year, most notably in the UK and France. The international premium sparkling brands, S.Pellegrino and Perrier, maintained good growth.
The Underlying Trading operating profit margin decreased by 200 basis points. Profitability was impacted by higher PET packaging and distribution costs. These were only partly offset by operational efficiencies, structural cost reduction and price increases taken in June 2018.
Sales CHF 7.9 billion
Organic growth + 2.1%
Real internal growth – 0.6%
Underlying Trading operating profit margin 11.0%
Underlying Trading operating profit margin – 200 basis points
Trading operating profit margin 8.7%
Trading operating profit margin – 350 basis points
Nestlé Waters
In millions of CHF
2017 * 2018 Proportion of total sales (%) RIG (%) OG (%)
Europe 1 980 2 088 26.5%
United States and Canada 4 344 4 357 55.3%
Other regions 1 558 1 433 18.2%
Total sales 7 882 7 878 – 0.6% + 2.1%
Underlying Trading operating profit 1 022 865 11.0%
Trading operating profit 958 683 8.7%
Capital additions 702 884 11.2%
* 2017 figures have been restated, see Foreword on page 44.
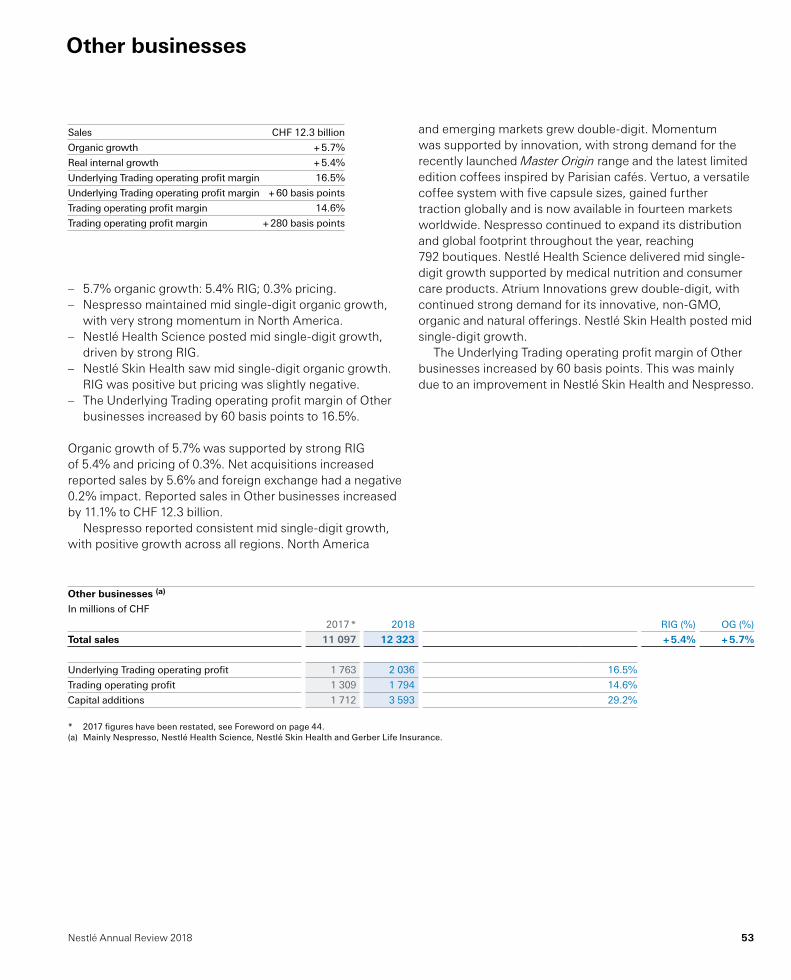
Nestlé Annual Review 2018 53
Other businesses
– 5.7% organic growth: 5.4% RIG; 0.3% pricing. – Nespresso maintained mid single-digit organic growth,
with very strong momentum in North America. – Nestlé Health Science posted mid single-digit growth,
driven by strong RIG. – Nestlé Skin Health saw mid single-digit organic growth.
RIG was positive but pricing was slightly negative. – The Underlying Trading operating profit margin of Other
businesses increased by 60 basis points to 16.5%.
Organic growth of 5.7% was supported by strong RIG of 5.4% and pricing of 0.3%. Net acquisitions increased reported sales by 5.6% and foreign exchange had a negative 0.2% impact. Reported sales in Other businesses increased by 11.1% to CHF 12.3 billion.
Nespresso reported consistent mid single-digit growth, with positive growth across all regions. North America
and emerging markets grew double-digit. Momentum was supported by innovation, with strong demand for the recently launched Master Origin range and the latest limited edition coffees inspired by Parisian cafés. Vertuo, a versatile coffee system with five capsule sizes, gained further traction globally and is now available in fourteen markets worldwide. Nespresso continued to expand its distribution and global footprint throughout the year, reaching 792 boutiques. Nestlé Health Science delivered mid single-digit growth supported by medical nutrition and consumer care products. Atrium Innovations grew double-digit, with continued strong demand for its innovative, non-GMO, organic and natural offerings. Nestlé Skin Health posted mid single-digit growth.
The Underlying Trading operating profit margin of Other businesses increased by 60 basis points. This was mainly due to an improvement in Nestlé Skin Health and Nespresso.
Sales CHF 12.3 billion
Organic growth + 5.7%
Real internal growth + 5.4%
Underlying Trading operating profit margin 16.5%
Underlying Trading operating profit margin + 60 basis points
Trading operating profit margin 14.6%
Trading operating profit margin + 280 basis points
Other businesses (a)
In millions of CHF
2017 * 2018 RIG (%) OG (%)
Total sales 11 097 12 323 + 5.4% + 5.7%
Underlying Trading operating profit 1 763 2 036 16.5%
Trading operating profit 1 309 1 794 14.6%
Capital additions 1 712 3 593 29.2%
* 2017 figures have been restated, see Foreword on page 44.(a) Mainly Nespresso, Nestlé Health Science, Nestlé Skin Health and Gerber Life Insurance.

Nestlé Annual Review 201854
Principal risks and uncertainties
Group Risk ManagementThe Group adopts a risk profile aligned to our purpose and business strategy. We aim to create long-term value through a balance of sustainable growth and resource efficiency. Our culture and values, rooted in respect for ourselves, for others, for diversity and for the future, guide our decisions and actions. Our creating shared value approach helps to prioritize those areas which maximize value creation for shareholders and cultivate positive societal and environmental impacts.
The Nestlé Group Enterprise Risk Management (ERM) framework is designed to assess and mitigate risks in order to minimize their potential impact on the Group and support the achievement of Nestlé’s long-term purpose and business strategy. A top-down assessment is performed at Group level once a year to create a good understanding of the company’s mega-risks, to allocate ownership to drive specific actions around them and take any relevant steps to address them. A bottom-up assessment occurs in parallel resulting in the aggregation of individual assessments by all Markets and Globally-Managed Businesses. Additionally, Nestlé engages with external stakeholders to better understand the issues that are of most concern to them. For each issue, the materiality matrix (included in the Nestlé in society report) rates the degree of stakeholder concern and potential business impact. These different risk mappings allow the Group to make sound decisions on the future operations of the company.
Risk assessments are the responsibility of line management; this applies equally to a business, a market or a function, and any mitigating actions identified in the assessments are the responsibility of the individual line management. If Group-level intervention is required, responsibility for mitigating actions will generally be determined by the Executive Board.
The results of the Group ERM are presented annually to the Executive Board, half-yearly to the Audit Committee, and reported annually to the Board of Directors.
The factors identified below are considered the most relevant for our business and performance. Many of the long-term mitigation strategies are expanded on in our Nestlé in society report.
Factors affecting resultsMaintaining high levels of trust with consumers is essential for Nestlé’s success. Any major event triggered by a serious food safety or other compliance issue could have a negative effect on Nestlé’s reputation or brand image. The Group has policies, processes, controls and regular monitoring to ensure high-quality products and prevention of health risks arising from handling, preparation and storage throughout the value chain.
The success of the Nestlé Group depends on its ability to anticipate consumer preferences and to offer high-quality, competitive, relevant and innovative products. Our Nutrition, Health and Wellness strategy aims to enhance people’s lives at all stages through industry-leading research and development to drive innovation and the continuous improvement of our portfolio.
Prolonged negative perceptions concerning health implications of processed food and beverages categories could lead to an increase in regulation of the industry and may also influence consumer preferences. The Group has long-term objectives in place to apply scientific and nutritional know-how to enhance nutrition, health and wellness, contributing to healthier eating, drinking and lifestyle habits, as well as improve the accessibility of safe and affordable food.
Changing customer relationships and channel landscape may inhibit our growth if we fail to maintain strong engagements or adapt to changing customer needs. Our strategy is to maintain and develop strong relationships with customers across the world to help them win in their respective prioritized categories where we operate.
Nestlé is dependent on the sustainable supply of a number of raw and packaging materials. Longer-term changes in weather patterns; water shortages; shifts in production patterns; economic and social inequality in supply chains, etc., could result in capacity constraints, as well as reputational damage. The Group has long-term commitments to promote better agricultural practices, support rural development in line with local priorities and address supply chain issues from gender inequality to deforestation. Progress against these commitments is monitored to

Nestlé Annual Review 2018 55
ensure positive social and environmental impacts along with delivering our own growth strategy.
Nestlé manages risks related to climate change and water resources. Our long-term commitments and strategies on climate change and water are available in Nestlé’s response to the CDP Climate Change report and Water questionnaires in the Nestlé in society report.
The Group is subject to environmental regimes applied in all countries where it operates and has controls in place to comply with legislation concerning the protection of the environment, including the use of natural resources, release of air emissions and waste water, and the generation, storage, handling, transportation, treatment and disposal of waste materials.
Nestlé is reliant on the procurement of materials, manufacturing and supply of finished goods for all product categories. A major event impacting input prices, or in one of Nestlé’s key plants, at a key supplier, contract manufacturer, co-packer, and/or warehouse facility could potentially lead to a supply disruption. Active price-risk management on key commodities and business continuity plans are established and regularly maintained in order to mitigate against such events.
The investment choices of the Group evolve over time and may include investments in emerging technologies; new business models; expansion into new geographies; and creation of, or entry into, new categories. This may result in broader exposures for the Group. The Group’s investment choices are aligned with our strategy and prioritized based on the potential to create value over the long term.
As part of the strategy, the Group undertakes business transformations such as large-scale change management projects, mergers and acquisitions. To ensure the realization of the anticipated benefits of them, these transformations receive executive sponsorship with aligned targets, as well as appropriate levels of resource to support successful execution of them.
The ability to attract and retain skilled, talented employees is critical to achieving our strategy. Our initiatives and processes aim to sustain a high-performance culture, supported by a total
awards approach and people development that emphasizes diversity, innovation and growth.
Nestlé is subject to health and safety regimes in all countries where it operates. Nestlé has procedures in place to comply with legislation concerning the protection of the health and welfare of employees and contractors, as well as long-term initiatives to promote safe and healthy employee behaviors.
Failure to act with integrity or behavior that is inconsistent with the expectations of our stakeholders may adversely impact our corporate reputation and brands. The Group’s Corporate Business Principles and Code of Conduct outline our commitment to integrity and the corporate compliance program defines the framework and coordinates assurance processes.
The Group depends on accurate, timely data along with increasing integration of digital solutions, services and models, both internal and external. The threat of cyber attacks disrupting the reliability, security and privacy of data, as well as the IT infrastructure, continues to increase. Contingency plans along with policies and controls are in place aiming to protect and ensure compliance on both infrastructure and data.
The Group’s liquidities/liabilities (currency, interest rate, hedging, cost of capital, pension obligations/retirement benefits, banking/commercial credit, etc.) could be impacted by any major event in the financial markets. Nestlé has the appropriate risk mitigation measures in place with strong governance to actively manage exposures and long-term asset and liability outlook.
Nestlé has factories in 85 countries and sales in 190 countries. Security, political instability, legal and regulatory, fiscal, macroeconomic, foreign trade, labor and/or infrastructure risks could potentially impact Nestlé’s ability to do business in a country or region. Major events caused by natural hazards (such as flood, drought, infectious disease, etc.) could also impact the Group’s ability to operate. Any of these events could lead to a supply disruption and impact Nestlé’s financial results. Regular monitoring and ad hoc business continuity plans are established in order to mitigate against such events. The Group-wide geographical and product category spread represents a tremendous natural hedge.
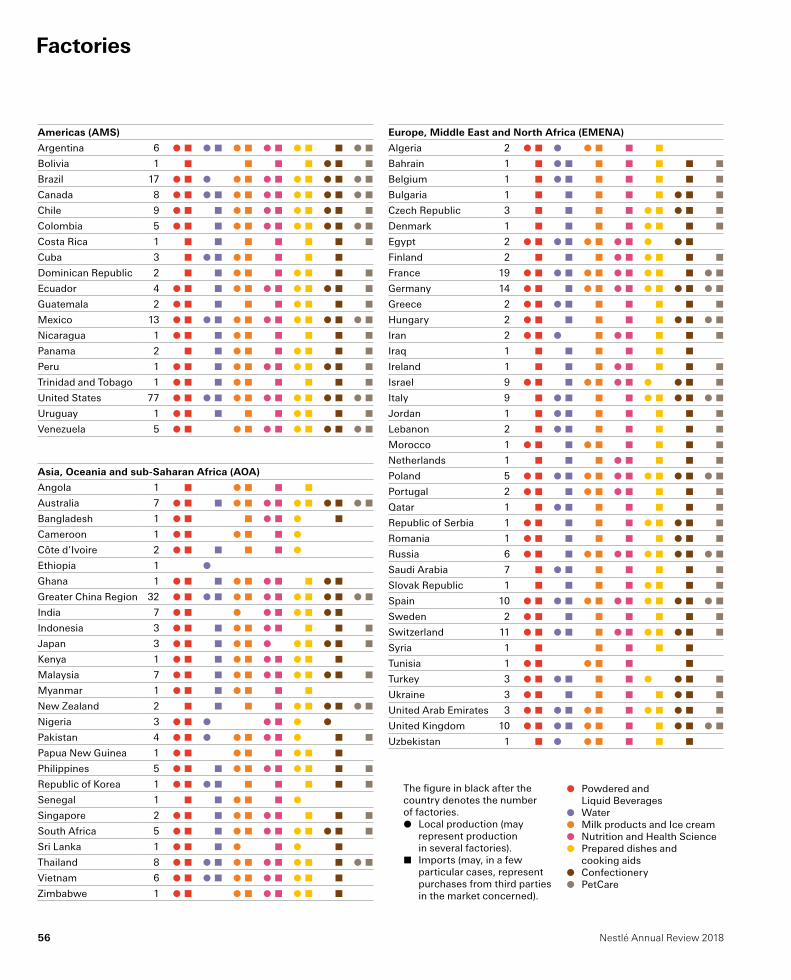
Nestlé Annual Review 201856
Americas (AMS)
Argentina 6 P L P L P L P L P L L P LBolivia 1 L L L L P L LBrazil 17 P L P P L P L P L P L P LCanada 8 P L P L P L P L P L P L P LChile 9 P L L P L P L P L P L LColombia 5 P L L P L P L P L P L P LCosta Rica 1 L L L L L L LCuba 3 L P L P L L L LDominican Republic 2 L L P L L P L L LEcuador 4 P L L P L P L P L P L LGuatemala 2 P L L L L P L L LMexico 13 P L P L P L P L P L P L P LNicaragua 1 P L L P L L L L LPanama 2 L L P L L P L L LPeru 1 P L L P L P L P L P L LTrinidad and Tobago 1 P L L P L L L L LUnited States 77 P L P L P L P L P L P L P LUruguay 1 P L L L L P L L LVenezuela 5 P L P L P L P L P L P L
The figure in black after the country denotes the number of factories.P Local production (may
represent production in several factories).
L Imports (may, in a few particular cases, represent purchases from third parties in the market concerned).
P Powdered and Liquid Beverages
P WaterP Milk products and Ice creamP Nutrition and Health ScienceP Prepared dishes and
cooking aidsP ConfectioneryP PetCare
Europe, Middle East and North Africa (EMENA)
Algeria 2 P L P P L L LBahrain 1 L P L L L L L LBelgium 1 L P L L L L L LBulgaria 1 L L L L L P L LCzech Republic 3 L L L L P L P L LDenmark 1 L L L L P L L LEgypt 2 P L P L P L P L P P LFinland 2 L L L P L P L L LFrance 19 P L P L P L P L P L L P LGermany 14 P L L P L P L P L P L P LGreece 2 P L P L L L L L LHungary 2 P L L L L L P L P LIran 2 P L P L P L L L LIraq 1 L L L L L LIreland 1 L L L P L L L LIsrael 9 P L L P L P L P P L LItaly 9 L P L L L P L P L P LJordan 1 L P L L L L L LLebanon 2 L P L L L L L LMorocco 1 P L L P L L L L LNetherlands 1 L L L P L L L LPoland 5 P L P L P L P L P L P L P LPortugal 2 P L L P L P L L L LQatar 1 L P L L L L L LRepublic of Serbia 1 P L L L L P L P L LRomania 1 P L L L L L P L LRussia 6 P L L P L P L P L P L P LSaudi Arabia 7 L P L L L L L LSlovak Republic 1 L L L L P L L LSpain 10 P L P L P L P L P L P L P LSweden 2 P L L L L L L LSwitzerland 11 P L P L L P L P L P L LSyria 1 L L L L LTunisia 1 P L P L L LTurkey 3 P L P L L L P P L LUkraine 3 P L L L L L P L LUnited Arab Emirates 3 P L P L P L L P L P L LUnited Kingdom 10 P L P L P L L L P L P LUzbekistan 1 L P P L L L L
Asia, Oceania and sub‑Saharan Africa (AOA)
Angola 1 L P L L LAustralia 7 P L L P L P L P L P L P LBangladesh 1 P L L P L P LCameroon 1 P L P L L PCôte d’Ivoire 2 P L L L L PEthiopia 1 PGhana 1 P L L P L P L L P LGreater China Region 32 P L P L P L P L P L P L P LIndia 7 P L P P L P L P LIndonesia 3 P L L P L P L L L LJapan 3 P L L P L P P L P L LKenya 1 P L L P L P L P L LMalaysia 7 P L L P L P L P L P L LMyanmar 1 P L L P L L LNew Zealand 2 L L L L P L P L P LNigeria 3 P L P P L P PPakistan 4 P L P P L P L P L LPapua New Guinea 1 P L P L L P L LPhilippines 5 P L L P L P L P L L LRepublic of Korea 1 P L P L L L L L LSenegal 1 L L P L L PSingapore 2 P L L P L P L L L LSouth Africa 5 P L L P L P L P L P L LSri Lanka 1 P L L P L P LThailand 8 P L P L P L P L P L L P LVietnam 6 P L P L P L P L P L LZimbabwe 1 P L P L P L P L L
Factories

Nestlé Annual Review 2018 57Nestlé Annual Review 2018 57
Corporate Governance and Compliance
Nestlé Annual Review 201858
the composition of the Board. As a truly global business, we have always felt that constructing a diverse board—including but not limited to diversity in background, geography, experience, ethnicity and gender—is critical to our ability to effectively oversee the direction of our company. In 2018, we nominated three new independent directors, each of whom was elected by our shareholders at our 2018 Annual Meeting. Since 2015, we have strengthened the Board through the addition of seven new independent directors with unique depth of experience and expertise that is directly relevant for Nestlé and aligned with our strategy. To this end, we will continue to maintain a long-term approach to board refreshment and succession planning to ensure that our Board has the right mix of backgrounds, skills and expertise to understand the trajectory of our business and drive a winning strategy that creates value for all of our shareholders.
Intense engagement with our shareholders through our roadshows, investor meetings and analyst calls has sharpened our focus on our core priorities and strategic vision. In 2018, we visited 23 cities and attended 488 meetings representing 1148 investors. Moreover, our shareholder engagement effort continues to be highlighted by our Chairman’s Roundtables that we held this past year in Hong Kong, Frankfurt, Paris, Zurich, London, New York and Tokyo. The Board and management will continue to seek and incorporate feedback to ensure we are acting in the best interests of our shareholders.
Our Chairman’s and Corporate Governance Committee acts as a consultant body to the Chairman and CEO, and regularly reviews aspects of our governance, as well as asset and liability management.
Our Nomination and Sustainability Committee, chaired by our Lead Independent Director, evaluates Board composition, structure and succession planning. The Committee regularly assesses potential candidates for nomination to the Board in the coming years. It also reviews all aspects of our environmental and social sustainability policies.
Our Compensation Committee sets our remuneration principles and submits the proposals for remuneration of the Board and
Our Board of Directors is highly engaged and dedicated to creating long-term, sustainable value based on strong principles of governance and an appropriate tone from the top. Our corporate governance framework is carefully constructed, and continually evaluated and updated, to ensure that it promotes accountability and supports our strategy to foster long-term value and sustainable growth for the benefit of all shareholders.
In 2018, our Board of Directors and management continued to evolve our strategy and governance to anticipate and reflect changing global consumer preferences and offer high-quality, competitive, relevant and innovative products. As part of this effort, we have been driving growth through innovation with significant investments in R&D. In addition to our organic growth strategy, our Board and management have taken an active role in streamlining Nestlé’s portfolio to focus on high-growth, high-margin businesses, and we will continue to rigorously review our business mix for further opportunities to drive profitable growth and shareholder value. To ensure that our incentive plans promote the execution of our strategy, we have updated our executive compensation plan to introduce Return on Invested Capital (ROIC) as a performance measure. Tying compensation to returns promotes the efficient use of capital and M&A discipline.
The Board also reconfirmed Nestlé’s value creation model delivering both top- and bottom- line growth, as well as capital efficiency to drive continuous long-term shareholder value creation. We continue to deliver on our commitments to execute the proven Nutrition, Health and Wellness (NHW) strategy and promoting a prudent approach toward capital allocation and M&A. We also remain focused on executing on our CHF 20 billion repurchase program and sustainable dividend policy. To date, our strategy has yielded strong, consistent results for our shareholders, as reflected in our short- and long-term outperformance of the STOXX 1800 Food & Beverage index. CHF 104 billion cash was returned to shareholders since 2009 including CHF 40 billion in share buybacks and CHF 64 billion in dividends.
Our Board’s recent actions to create sustained value also include continued efforts to enhance
Corporate Governance

Nestlé Annual Review 2018 59
the Executive Board to the Board and the AGM. It ensures the alignment of our values, strategies and performance management. Our compensation budgets and our compensation report are submitted to annual votes by our shareholders.
Our Audit Committee oversees internal and external audit, financial reporting, compliance and risk management. Our internal audit function was strengthened and our mandate for external audit was put up for tender.
We further integrated our public reporting on our financial and non-financial performance by including the highlights from our Nestlé in society report in our Annual Review. We recognize that for our company to be successful over time and create sustainable value for shareholders, we must also create value for society. We do this through our more than 2000 brands that enhance quality of life and contribute to a healthier future.
P United States 36.5% P Switzerland 34.9% P United Kingdom 4.8%P Germany 4.7%P Japan 2.5%P Canada 2.1%P Luxembourg 2.0%P Belgium 1.9%P Sweden 1.5%P China 1.1% P Others 8.0%
Share capital distribution by geography
Private Shareholders 20%
Institutions 80%
100%
75%
50%
25%
0%
Share capital by investor type, long‑term evolution (a)
2014 2018
(a) Percentage derived from total number of registered shares. Registered shares represent 57.6% of the total share capital. Statistics are rounded, as at 31.12.2018.
201020062002

Nestlé Annual Review 201860
Board of Directors of Nestlé S.A.
U. Mark Schneider
Paul Bulcke Beat Hess
Henri de CastriesPablo Isla
Board of Directors of Nestlé S.A. at December 31, 2018
Paul Bulcke (1, 2, 4)
ChairmanU. Mark Schneider (1, 2)
Chief Executive Officer
Henri de Castries (1, 2, 4, 5)
Vice ChairmanLead Independent DirectorFormer Chairman and CEO, AXABeat Hess (1, 2, 3)
Chairman, LafargeHolcim Ltd Former Group Legal Director,Royal Dutch Shell plc.
Renato Fassbind (1, 2, 5)
Vice Chairman, Swiss Re AGJean‑Pierre Roth (1, 3)
Former Chairman, Geneva Cantonal BankAnn M. Veneman (1, 4)
Former Secretary, U.S. Department of Agriculture, and Executive Director, UNICEF
Peter Brabeck‑LetmatheChairman EmeritusDavid P. Frick Secretary to the BoardKPMG SA Geneva branch (1)
Independent auditors
Kasper Rorsted

Nestlé Annual Review 2018 61
Kimberly A. RossRuth K. Oniang’oRenato Fassbind
Patrick AebischerAnn M. Veneman
Ursula M. Burns
Jean‑Pierre RothEva Cheng
Eva Cheng (1, 4, 5)
Former Chairwoman and CEO, Amway China & Southeast AsiaRuth K. Oniang’o (1)
Professor of Food Scienceand NutritionPatrick Aebischer (1, 3)
President Emeritus of the Swiss Federal Institute ofTechnology Lausanne (EPFL)
Ursula M. Burns (1, 3)
Former Chairwoman and CEO, Xerox CorporationKasper Rorsted (1)
CEO adidas AGPablo Isla (1)
Chairman and CEO, InditexKimberly A. Ross (1, 5)
Former CFO, Baker Hughes LLC, Avon Products Inc. and Royal Ahold N.V.
(1) Term expires on the date of the Annual General Meeting 2019.(2) Chairman’s and Corporate Governance Committee.(3) Compensation Committee.(4) Nomination and Sustainability Committee.(5) Audit Committee.
For further information on the Board of Directors, please refer to the Corporate Governance Report 2018.

Nestlé Annual Review 201862
Executive Board of Nestlé S.A.
5
8
2
3
1
1 U. Mark Schneider Chief Executive Officer
2 Laurent Freixe EVP, CEO Zone United States of America, Canada, Latin America, Caribbean
3 Chris Johnson EVP, Human Resources and Business Services
4 Patrice Bula EVP, Strategic Business Units, Marketing, Sales, Nespresso
5 Wan Ling Martello EVP, CEO Zone Asia, Oceania, sub‑Saharan Africa
6 Marco Settembri EVP, CEO Zone Europe, Middle East, North Africa
7 François‑Xavier Roger EVP, Chief Financial Officer
8 Magdi Batato EVP, Operations 9 Stefan Palzer
EVP, Innovation Technology, Research and Development
10 Maurizio Patarnello Deputy EVP, Nestlé Waters
11 Greg Behar CEO, Nestlé Health Science S.A.
Executive Board of Nestlé S.A. at December 31, 2018

Nestlé Annual Review 2018 63
7
6
11
9
12
10
4
12 David P. Frick SVP, Corporate Governance, Compliance and Corporate Services
EVP: Executive Vice PresidentSVP: Senior Vice PresidentCEO: Chief Executive Officer
For further information on the Executive Board, please refer to the Corporate Governance Report 2018.

Nestlé Annual Review 201864
Compliance
Compliance is the foundation of how we do business and a condition for creating shared value. Compliance at Nestlé not only refers to applicable laws but to Nestlé policies across all our Corporate Business Principles and our commitment to integrity as explained in our purpose and values and our Code of Business Conduct. Our clear commitments are fundamental to the success of our company.
Our Board of Directors and our Executive Board oversee and promote good practices throughout the company and oversee our corporate compliance program. Line management is supported by our dedicated corporate compliance function, which provides guidance and functional leadership, as well as by all other functions engaged in our holistic, risk- and principles-based compliance program. Our Corporate Compliance Committee defines the framework and coordinates assurance processes. Market Compliance Officers and Committees ensure a consistent approach across the Group and help identify local compliance priorities.
We monitor compliance though our corporate functions, our internal audit function and our external auditors. Through our CARE program, which relies on independent external auditors, we regularly assess specific aspects of our compliance. In 2018, 291 CARE audits were conducted and gaps addressed. The necessary training is provided in our internal Management School, at in-person trainings in the Markets, as well as through our e-learning tools. 48 741 employees performed our Code of Conduct training in 2018.
Our Integrity Reporting System and our ‘Tell Us’ system allow us to address complaints from employees and external stakeholders. 1837 complaints from employees and 699 complaints from suppliers and other third parties were investigated and remedial action taken this year. Markets were supported with investigative guidelines and best practices.
All Markets confirmed a mature ‘fit for purpose’ level in their local program (defined as more than 80% score in all categories), based on a self-assessment of the Market Compliance Programs by the local Compliance Committees. In 2019, the program will be updated and Markets
will perform a new assessment to ensure that their compliance program remain relevant to the business needs. During the last 3 years more than 160 000 employees have been trained on our compliance foundations. Special initiatives related to WHO Code compliance and the prevention of harassment and discrimination. An annual compliance risk assessment regarding third party risks was performed by the Corporate Compliance Committee.
Our Compliance commitments and progress are externally shared in the Nestlé in society report.

Nestlé Annual Review 2018 65
Shareholder information
Stock exchange listingAt December 31, 2018, Nestlé S.A. shares are listed on the SIX Swiss Exchange, Zurich (ISIN code: CH0038863350).American Depositary Receipts (ISIN code: US6410694060) representing Nestlé S.A. shares are offered in the USA by Citibank, N.A., New York.
Registered OfficesNestlé S.A.Avenue Nestlé 55CH-1800 Vevey (Switzerland)tel. +41 (0)21 924 21 11
Nestlé S.A. (Share Transfer Office)Zugerstrasse 8CH-6330 Cham (Switzerland)tel. +41 (0)41 785 20 20
For additional information, contact: Nestlé S.A. Investor RelationsAvenue Nestlé 55CH-1800 Vevey (Switzerland)tel. +41 (0)21 924 35 09e-mail: [email protected]
As to information concerning the share register (registrations, transfers, dividends, etc.), please contact:Nestlé S.A. (Share Transfer Office)Zugerstrasse 8CH-6330 Cham (Switzerland)tel. +41 (0)41 785 20 20fax +41 (0)41 785 20 24e-mail: [email protected]
The Annual Review is available online as a PDF in English, French and German. The consolidated income statement, balance sheet and cash flow statement are also available as Excel files.
www.nestle.com
April 11, 2019152nd Annual General Meeting, Beaulieu Lausanne, Lausanne (Switzerland)
April 12, 2019Last trading day with entitlement to dividend
April 15, 2019Ex-dividend date
April 17, 2019Payment of the dividend
April 18, 20192019 First quarter sales figures
July 26, 20192019 Half-yearly Results
October 17, 20192019 Nine months sales figures
February 13, 20202019 Full Year Results
April 23, 2020153rd Annual General Meeting, Beaulieu Lausanne,Lausanne (Switzerland)
© 2019, Nestlé S.A., Cham and Vevey (Switzerland)
The Annual Report contains forward looking statements which reflect Management’s current views and estimates. The forward looking statements involve certain risks and uncertainties that could cause actual results to differ materially from those contained in the forward looking statements. Potential risks and uncertainties include such factors as general economic conditions, foreign exchange fluctuations, competitive product and pricing pressures, and regulatory developments.
The Annual Report is published in English, German and French. The English version is binding for the content.
The brands in italics are registered trademarks of the Nestlé Group.
Visual concept and designNestec Ltd., Corporate Identity & Design, with Gavillet & Cie
PhotographySébastien Agnetti, Mareen Fischinger / Getty Images, Nestlé S.A.
PrepressImages3 S.A. (Switzerland)
PrintingGenoud S.A. (Switzerland)
PaperThis report is printed on Lessebo Smooth White, a paper produced from well-managed forests and other controlled sources certified by the Forest Stewardship Council (FSC).

FinancialStatements 2018Consolidated Financial Statements of the Nestlé Group 2018
152nd Financial Statementsof Nestlé S.A.


Consolidated Financial Statements of the Nestlé Group 2018 63
ConsolidatedFinancial Statementsof the Nestlé Group 2018

Consolidated Financial Statements of the Nestlé Group 201864
65
66
67
68
70
71
73
73
77
83
93
94
95
97
101
107
117
119
134
137
139
140
143
148
150
Principal exchange rates
Consolidated income statement for
the year ended December 31, 2018
Consolidated statement of
comprehensive income for the year
ended December 31, 2018
Consolidated balance sheet as at
December 31, 2018
Consolidated cash fl ow statement for
the year ended December 31, 2018
Consolidated statement
of changes in equity for the year ended
December 31, 2018
Notes
1. Accounting policies
2. Scope of consolidation, acquisitions
and disposals of businesses, assets
held for sale and acquisitions of
non-controlling interests
3. Analyses by segment
4. Net other trading and operating income/
(expenses)
5. Net fi nancial income/(expense)
6. Inventories
7. Trade and other receivables/payables
8. Property, plant and equipment
9. Goodwill and intangible assets
10. Employee benefi ts
11. Provisions and contingencies
12. Financial instruments
13. Taxes
14. Associates and joint ventures
15. Earnings per share
16. Cash fl ow statement
17. Equity
18. Transactions with related parties
19. Guarantees
20. Effects of hyperinfl ation
21. Events after the balance sheet date
22. Restatements of 2017 comparatives and
fi rst application of IFRS 9
Statutory Auditor’s Report –
Report on the Audit of the
Consolidated Financial Statements
Financial information – 5 year review
Companies of the Nestlé Group, joint
arrangements and associates
160
166
168

Consolidated Financial Statements of the Nestlé Group 2018 65
Principal exchange rates
CHF per
2018 2017 2018 2017
Year ending rates Weighted average annual rates
1 US Dollar USD 0.986 0.977 0.979 0.984
1 Euro EUR 1.128 1.168 1.154 1.113
100 Chinese Yuan Renminbi CNY 14.335 15.001 14.776 14.593
100 Brazilian Reais BRL 25.448 29.531 26.663 30.796
100 Philippine Pesos PHP 1.877 1.957 1.856 1.953
1 Pound Sterling GBP 1.256 1.316 1.302 1.271
100 Mexican Pesos MXN 5.015 4.957 5.082 5.212
1 Canadian Dollar CAD 0.724 0.778 0.755 0.759
100 Japanese Yen JPY 0.894 0.867 0.886 0.878
1 Australian Dollar AUD 0.697 0.761 0.731 0.754
100 Russian Rubles RUB 1.416 1.694 1.554 1.688

Consolidated Financial Statements of the Nestlé Group 201866
Consolidated income statementfor the year ended December 31, 2018
In millions of CHF
Notes 2018 2017 *
Sales 3 91 439 89 590
Other revenue 311 332
Cost of goods sold (46 070) (45 571)
Distribution expenses (8 469) (8 023)
Marketing and administration expenses (20 003) (19 818)
Research and development costs (1 687) (1 739)
Other trading income 4 37 112
Other trading expenses 4 (1 769) (1 606)
Trading operating profi t 3 13 789 13 277
Other operating income 4 2 535 379
Other operating expenses 4 (2 572) (3 500)
Operating profi t 13 752 10 156
Financial income 5 247 152
Financial expense 5 (1 008) (848)
Profi t before taxes, associates and joint ventures 12 991 9 460
Taxes 13 (3 439) (2 773)
Income from associates and joint ventures 14 916 824
Profi t for the year 10 468 7 511
of which attributable to non-controlling interests 333 355
of which attributable to shareholders of the parent (Net profi t) 10 135 7 156
As percentages of sales
Trading operating profi t 15.1% 14.8%
Profi t for the year attributable to shareholders of the parent (Net profi t) 11.1% 8.0%
Earnings per share (in CHF)
Basic earnings per share 15 3.36 2.31
Diluted earnings per share 15 3.36 2.31
* 2017 restated fi gures include modifi cations as described in Note 1 Accounting policies and related impacts in Note 22.

Consolidated Financial Statements of the Nestlé Group 2018 67
Consolidated statement of comprehensive incomefor the year ended December 31, 2018
In millions of CHF
Notes 2018 2017 *
Profi t for the year recognized in the income statement 10 468 7 511
Currency retranslations, net of taxes 17 (1 004) (561)
Fair value changes on available-for-sale fi nancial instruments, net of taxes 17 — (10)
Fair value changes on debt instruments, net of taxes 17 (39) —
Fair value changes on cash fl ow hedges, net of taxes 46 (55)
Share of other comprehensive income of associates and joint ventures 14/17 (21) (240)
Items that are or may be reclassifi ed subsequently to the income statement (1 018) (866)
Remeasurement of defi ned benefi t plans, net of taxes 10/17 600 1 063
Fair value changes on equity instruments, net of taxes 17 4 —
Share of other comprehensive income of associates and joint ventures 14/17 117 52
Items that will never be reclassifi ed to the income statement 721 1 115
Other comprehensive income for the year 17 (297) 249
Total comprehensive income for the year 10 171 7 760
of which attributable to non-controlling interests 218 328
of which attributable to shareholders of the parent 9 953 7 432
* 2017 restated fi gures include modifi cations as described in Note 1 Accounting policies and related impacts in Note 22.

Consolidated Financial Statements of the Nestlé Group 201868
Consolidated balance sheet as at December 31, 2018before appropriations
In millions of CHF
Notes 2018 2017 *
Assets
Current assets
Cash and cash equivalents 12/16 4 500 7 938
Short-term investments 12 5 801 655
Inventories 6 9 125 9 177
Trade and other receivables 7/12 11 167 12 036
Prepayments and accrued income 530 573
Derivative assets 12 183 231
Current income tax assets 869 917
Assets held for sale 2 8 828 357
Total current assets 41 003 31 884
Non-current assets
Property, plant and equipment 8 29 956 30 777
Goodwill 9 31 702 29 746
Intangible assets 9 18 634 20 615
Investments in associates and joint ventures 14 10 792 11 628
Financial assets 12 2 567 6 003
Employee benefi ts assets 10 487 392
Current income tax assets 58 62
Deferred tax assets 13 1 816 2 103
Total non-current assets 96 012 101 326
Total assets 137 015 133 210
* 2017 restated fi gures include modifi cations as described in Note 1 Accounting policies and related impacts in Note 22.

Consolidated Financial Statements of the Nestlé Group 2018 69
Consolidated balance sheet as at December 31, 2018
In millions of CHF
Notes 2018 2017 *
Liabilities and equity
Current liabilities
Financial debt 12 14 694 11 211
Trade and other payables 7/12 17 800 18 864
Accruals and deferred income 4 075 4 299
Provisions 11 780 819
Derivative liabilities 12 448 507
Current income tax liabilities 2 731 2 477
Liabilities directly associated with assets held for sale 2 2 502 12
Total current liabilities 43 030 38 189
Non-current liabilities
Financial debt 12 25 700 18 566
Employee benefi ts liabilities 10 5 919 7 111
Provisions 11 1 033 1 147
Deferred tax liabilities 13 2 540 3 492
Other payables 12 390 2 476
Total non-current liabilities 35 582 32 792
Total liabilities 78 612 70 981
Equity 17
Share capital 306 311
Treasury shares (6 948) (4 537)
Translation reserve (20 432) (19 436)
Other reserves (183) 989
Retained earnings 84 620 83 629
Total equity attributable to shareholders of the parent 57 363 60 956
Non-controlling interests 1 040 1 273
Total equity 58 403 62 229
Total liabilities and equity 137 015 133 210
* 2017 restated fi gures include modifi cations as described in Note 1 Accounting policies and related impacts in Note 22.

Consolidated Financial Statements of the Nestlé Group 201870
Consolidated cash fl ow statementfor the year ended December 31, 2018
In millions of CHF
Notes 2018 2017 *
Operating activities
Operating profi t 16 13 752 10 156
Depreciation and amortization 16 3 924 3 934
Impairment 1 248 3 582
Net result on disposal of businesses 4 (686) 132
Other non-cash items of income and expense 16 137 (186)
Cash fl ow before changes in operating assets and liabilities 18 375 17 618
Decrease/(increase) in working capital 16 472 (244)
Variation of other operating assets and liabilities 16 (37) 361
Cash generated from operations 18 810 17 735
Interest paid (684) (609)
Interest and dividend received 192 119
Taxes paid (3 623) (3 628)
Dividends and interest from associates and joint ventures 14 703 582
Operating cash fl ow 15 398 14 199
Investing activities
Capital expenditure 8 (3 869) (3 938)
Expenditure on intangible assets 9 (601) (769)
Acquisition of businesses 2 (9 512) (696)
Disposal of businesses 2 4 310 140
Investments (net of divestments) in associates and joint ventures 14 728 (140)
Infl ows/(outfl ows) from treasury investments (5 159) 587
Other investing activities (163) (134)
Investing cash fl ow (14 266) (4 950)
Financing activities
Dividend paid to shareholders of the parent 17 (7 124) (7 126)
Dividends paid to non-controlling interests (319) (342)
Acquisition (net of disposal) of non-controlling interests 2 (528) (526)
Purchase (net of sale) of treasury shares (a) (6 854) (3 295)
Infl ows from bonds and other non-current fi nancial debt 12 9 900 6 406
Outfl ows from bonds and other non-current fi nancial debt 12 (2 712) (3 190)
Infl ows/(outfl ows) from current fi nancial debt 12 3 520 (1 011)
Financing cash fl ow (4 117) (9 084)
Currency retranslations (313) (217)
Increase/(decrease) in cash and cash equivalents (3 298) (52)
Cash and cash equivalents at beginning of year 7 938 7 990
Cash and cash equivalents at end of year 16 4 640 7 938
* 2017 restated fi gures include modifi cations as described in Note 1 Accounting policies and related impacts in Note 22.
(a) Mostly relates to the Share Buy-Back Program launched in 2017.

Consolidated Financial Statements of the Nestlé Group 2018 71
Consolidated statement of changes in equityfor the year ended December 31, 2018
In millions of CHF
Sh
are
cap
ital
Trea
sury
shar
es
Tran
slat
ion
re
serv
e
Oth
erre
serv
es
Ret
ain
edea
rnin
gs
Tota
l eq
uit
yat
trib
uta
ble
to
shar
eho
lder
s o
f th
e p
aren
t
No
n-c
on
tro
llin
g
inte
rest
s
Tota
l eq
uit
y
Equity as at December 31, 2016
as originally published 311 (990) (18 799) 1 198 82 870 64 590 1 391 65 981
First application of IFRS 15 — — — — (268) (268) — (268)
First application of IFRS 16 — — — — (189) (189) — (189)
Other — — — — (61) (61) — (61)
Equity restated as at January 1, 2017 * 311 (990) (18 799) 1 198 82 352 64 072 1 391 65 463
Profi t for the year * — — — — 7 156 7 156 355 7 511
Other comprehensive income for the year * — — (637) (209) 1 122 276 (27) 249
Total comprehensive income for the year * — — (637) (209) 8 278 7 432 328 7 760
Dividends — — — — (7 126) (7 126) (342) (7 468)
Movement of treasury shares — (3 719) — — 113 (3 606) — (3 606)
Equity compensation plans — 172 — — (11) 161 — 161
Changes in non-controlling interests (a) — — — — 93 93 (104) (11)
Total transactions with owners — (3 547) — — (6 931) (10 478) (446) (10 924)
Other movements — — — — (70) (70) — (70)
Equity restated at December 31, 2017 311 (4 537) (19 436) 989 83 629 60 956 1 273 62 229
* 2017 restated fi gures include modifi cations as described in Note 1 Accounting policies and related impacts in Note 22.
(a) Movements reported under retained earnings include the impact of the acquisitions (see Note 2.5) as well as put options for
acquisitions of non-controlling interests.

Consolidated Financial Statements of the Nestlé Group 201872
In millions of CHF
Sh
are
cap
ital
Trea
sury
shar
es
Tran
slat
ion
re
serv
e
Oth
erre
serv
es
Ret
ain
edea
rnin
gs
Tota
l eq
uit
yat
trib
uta
ble
to
shar
eho
lder
s o
f th
e p
aren
t
No
n-c
on
tro
llin
g
inte
rest
s
Tota
l eq
uit
y
Equity as at January 1, 2018 311 (4 537) (19 436) 989 83 629 60 956 1 273 62 229
First application of IFRS 9 (a) — — (176) (1 170) 1 333 (13) (2) (15)
Equity as at January 1, 2018
after fi rst application of IFRS 9 311 (4 537) (19 612) (181) 84 962 60 943 1 271 62 214
Profi t for the year — — — — 10 135 10 135 333 10 468
Other comprehensive income for the year — — (893) (12) 723 (182) (115) (297)
Total comprehensive income for the year — — (893) (12) 10 858 9 953 218 10 171
Dividends — — — — (7 124) (7 124) (319) (7 443)
Movement of treasury shares — (6 677) — — (49) (6 726) — (6 726)
Equity compensation plans — 153 — — (3) 150 3 153
Changes in non-controlling interests (b) — — — — 181 181 (133) 48
Reduction in share capital (c) (5) 4 113 — — (4 108) — — —
Total transactions with owners (5) (2 411) — — (11 103) (13 519) (449) (13 968)
Other movements — — 73 10 (97) (14) — (14)
Equity as at December 31, 2018 306 (6 948) (20 432) (183) 84 620 57 363 1 040 58 403
(a) Mainly relates to Nestlé’s share in fair value changes of equity instruments held by associates.
(b) Movements reported under retained earnings include the impact of the acquisitions (see Note 2.5) as well as put options for
acquisitions of non-controlling interests.
(c) Reduction in share capital, see Note 17.1.
Consolidated statement of changes in equity for the year ended December 31, 2018
Consolidated Financial Statements of the Nestlé Group 2018 73
Notes
1. Accounting policies
Accounting convention and accounting standards
The Consolidated Financial Statements comply with
International Financial Reporting Standards (IFRS) issued
by the International Accounting Standards Board (IASB)
and with Swiss law.
They have been prepared on a historical cost basis, unless
stated otherwise. All signifi cant consolidated companies,
joint arrangements and associates have a December 31
accounting year-end.
The Consolidated Financial Statements 2018 were approved
for issue by the Board of Directors on February 13, 2019,
and are subject to approval by the Annual General Meeting
on April 11, 2019.
Accounting policies
Accounting policies are included in the relevant notes to
the Consolidated Financial Statements and are presented
as text highlighted with a grey background. The accounting
policies below are applied throughout the fi nancial
statements.
Key accounting judgements, estimates
and assumptions
The preparation of the Consolidated Financial Statements
requires Group Management to exercise judgement and to
make estimates and assumptions that affect the application
of policies, reported amounts of revenues, expenses, assets
and liabilities and disclosures. These estimates and associated
assumptions are based on historical experience and various
other factors that are believed to be reasonable under the
circumstances. Actual results may differ from these estimates.
The estimates and underlying assumptions are reviewed
on an ongoing basis. Revisions to accounting estimates are
recognized in the period in which the estimate is revised if
the revision affects only that period, or in the period of the
revision and future periods if the revision affects both current
and future periods. Those areas affect mainly revenue
recognition (see Note 3), allowance for doubtful receivables
(see Note 7), leases (see Note 8), impairment tests of
goodwill and intangible assets with indefi nite useful life
(see Note 9), employee benefi ts (see Note 10), provisions
and contingencies (see Note 11) and taxes (see Note 13).
Foreign currencies
The functional currency of the Group’s entities is the currency
of their primary economic environment.
In individual companies, transactions in foreign currencies
are recorded at the rate of exchange at the date of the
transaction. Monetary assets and liabilities in foreign
currencies are translated at year-end rates. Any resulting
exchange differences are taken to the income statement,
except when deferred in Other comprehensive income as
qualifying cash fl ow hedges.
On consolidation, assets and liabilities of foreign operations
reported in their functional currencies are translated into
Swiss Francs, the Group’s presentation currency, at year-end
exchange rates. Income and expense are translated into Swiss
Francs at the annual weighted average rates of exchange or
at the rate on the date of the transaction for signifi cant items.
Differences arising from the retranslation of opening net
assets of foreign operations, together with differences arising
from the translation of the net results for the year of foreign
operations, are recognized in Other comprehensive income.
When there is a change of control in a foreign operation,
exchange differences that were recorded in equity are
recognized in the income statement as part of the gain
or loss on disposal.
Hyperinfl ationary economies
Several factors are considered when evaluating whether
an economy is hyperinfl ationary, including the cumulative
three-year infl ation, and the degree to which the population’s
behaviors and government policies are consistent with such
a condition.
The balance sheet and results of subsidiaries operating
in hyperinfl ationary economies are restated for the changes
in the general purchasing power of the local currency, using
offi cial indices at the balance sheet date, before translation
into Swiss Francs and, as a result, are stated in terms of the
measuring unit current at the balance sheet date. The
hyperinfl ationary economies in which the Group operates
are Venezuela and, as from 2018, Argentina (see Note 20).

Consolidated Financial Statements of the Nestlé Group 201874
1. Accounting policies
Other revenue
Other revenue are primarily sales-based royalties and
license fees from third parties which have been earned
during the period.
Expenses
Cost of goods sold is determined on the basis of the cost
of production or of purchase, adjusted for the variation of
inventories. All other expenses, including those in respect
of advertising and promotions, are recognized when the
Group receives the risks and rewards of ownership of the
goods or when it receives the services. Government grants
that are not related to assets are credited to the income
statement as a deduction of the related expense when they
are received, if there is reasonable assurance that the terms
of the grant will be met. Additional details of specifi c
expenses are provided in the respective notes.
Changes in presentation – income statement
The following main changes have been applied:
– the costs of returned or damaged products, and
maintenance and other costs of trade assets (such as
coffee machines, water coolers and freezers) previously
reported under Marketing and administration expenses
have been reclassified to Cost of goods sold; and
– some costs previously reported under Marketing and
administration expenses have been reclassified to
Research and development expenses and Distribution
expenses.
The above changes have been made to better align with the
function of the expenditure.
2017 comparatives have been restated (see Note 22).
Changes in presentation – cash fl ow statement
There were insignificant changes in presentation between
operating cash flow, cash flow from financing activities and
cash flow from investing activities regarding cash flows of
treasury investments and current financial debt.
2017 comparatives have been restated (see Note 22).
Changes in accounting policies
The following main changes have been applied:
– some costs that were previously included in the carrying
value of inventory are now expensed as incurred, following
a reevaluation of the relevance of including these costs
(the major part of which relates to allocated information
technology costs) in inventory. For a like-for-like comparison
of the performance 2017 and onwards, the value of
inventory on hand at January 1, 2017, has been restated;
and
– some taxes and levies on revenue or receipts, reported
previously as Taxes, are considered now respectively as
a reduction of Sales and as Marketing and administration
expenses, in order to better align with the function of the
expenditure.
2017 comparatives have been restated (see Note 22).

Consolidated Financial Statements of the Nestlé Group 2018 75
Changes in accounting standards
The Group has applied as from January 1, 2018, the
following new accounting standards.
IFRS 9 – Financial Instruments
The standard addresses the accounting principles for the
fi nancial reporting of fi nancial assets and fi nancial liabilities,
including classifi cation, measurement, impairment,
derecognition and hedge accounting.
The Group has performed a review of the business
model corresponding to the different portfolios of fi nancial
assets and of the characteristics of these fi nancial assets.
Consequently, investments in debt instruments whose
cash fl ows are solely payments of principal and interest
(“SPPI”) were designated either at amortized cost or at fair
value through Other comprehensive Income depending
on the objectives of the business model. The existing
investments in equity instruments at the date of the initial
application were generally designated at fair value through
Other comprehensive Income by election. This election
generated a reclassifi cation between equity components
of CHF 1.2 billion, with no net impact on the Group’s total
equity.
The impact of the new impairment model has been
reviewed. This analysis required the identifi cation of the
credit risk associated with the counterparties and
– considering that the majority of the Group’s fi nancial assets
are trade receivables – integrates statistical data refl ecting
the actual past experience of incurred loss due to default.
The amount of additional impairment recognized on
January 1, 2018, was CHF 15 million.
Furthermore, the Group has updated the defi nitions of
its hedging relationships in line with the risk management
activities and policies, with a specifi c attention to the
identifi cation of the components in the pricing of the
commodities.
This standard was mandatory for the accounting period
beginning on January 1, 2018, and was applied retrospectively
as at January 1, 2018, but with no restatement of comparative
information for prior years. Consequently, the Group
recognized any difference between the carrying amount
of financial instruments under IAS 39 and the carrying
amount under IFRS 9 in the opening retained earnings
(or other equity components) as at January 1, 2018.
Changes to hedge accounting policies have been applied
prospectively. All hedging relationships designated under
IAS 39 at December 31, 2017, met the criteria for hedge
accounting under IFRS 9 at January 1, 2018, and are therefore
regarded as continuing hedging relationships.
See Note 22 for the impact of IFRS 9. The changes
on the fair value hierarchy of fi nancial instruments as
at January 1, 2018, are presented in Note 12. The new
accounting policies are also set out in Note 12.
IFRS 15 – Revenue from Contracts with Customers
This standard combines, enhances and replaces specifi c
guidance on recognizing revenue with a single standard.
It defi nes a new fi ve-step model to recognize revenue
from customer contracts. The Group undertook a review of
the main types of commercial arrangements used with
customers under this model and has concluded that the
application of IFRS 15 had the main following effects:
i) as a consequence of the change in revenue recognition
from transfer of risks and rewards to transfer of control,
a small proportion of sales (less than 0.5% of annual
sales) is recognized on average 2 days later under the
new standard;
ii) payments to customers currently treated as distribution
costs have been reclassifi ed as deductions from sales
under the new standard;
iii) the timing of accruals for certain amounts payable to
customers was reviewed and as a result the current
liability for these amounts at the beginning of 2017
was increased.
This standard was mandatory for the accounting period
beginning on January 1, 2018, and has been applied with
retrospective impact, utilizing the practical expedient to
not restate contracts that begin and end within the same
annual accounting period.
The new accounting policies are set out in Note 3.
2017 comparatives have been restated (see Note 22).
IFRS 16 – Leases
This standard replaces IAS 17 and sets out the principles for
the recognition, measurement, presentation and disclosure
of leases.
The main effect on the Group is that IFRS 16 introduces
a single lessee accounting model and requires a lessee to
recognize assets and liabilities for almost all leases and
therefore resulted in an increase of Property, plant and
equipment and total Financial debt at January 1, 2017.
This standard is mandatory for the accounting period
beginning on January 1, 2019, but the Group early adopted
it on January 1, 2018, under the full retrospective approach,
utilizing the practical expedient to not reassess whether
a contract contains a lease.
The new accounting policies are set out in Note 8.2.
2017 comparatives have been restated (see Note 22).
1. Accounting policies

Consolidated Financial Statements of the Nestlé Group 201876
IFRIC 23 – Uncertainty over Income Tax Treatments
IFRIC 23 specifi es how to refl ect uncertainty in accounting
for income taxes. IFRIC 23 is mandatory for the accounting
period beginning on January 1, 2019, but the Group early
adopted it with effect from January 1, 2018. There was no
impact on the measurement of taxes as a consequence of
this adoption. The uncertain tax liabilities formerly included
under Provisions have been reclassifi ed to Current income
tax liabilities.
2017 comparatives have been restated (see Note 22).
In addition, a number of other existing standards have
been modifi ed on miscellaneous points with effect from
January 1, 2018. Such changes include Classifi cation and
Measurement of Share-based Payment Transactions
(Amendments to IFRS 2), Annual Improvements to IFRSs
2014–2016 Cycle (Amendments to IFRS 1 and IAS 28), and
IFRIC 22 Foreign Currency Transactions and Advance
Consideration.
None of these other amendments had a material effect
on the Group’s Financial Statements.
Changes in IFRS that may affect the Group
after December 31, 2018
There are no standards that are not yet effective and that
would be expected to have a material impact on the Group
in the current or future reporting periods.
1. Accounting policies

Consolidated Financial Statements of the Nestlé Group 2018 77
2. Scope of consolidation, acquisitions and disposals of businesses, assets held for sale and acquisitions of non-controlling interests
Scope of consolidation
The Consolidated Financial Statements comprise those of Nestlé S.A. and of its
subsidiaries (the Group).
Companies which the Group controls are fully consolidated from the date at which
the Group obtains control. The Group controls a company when it is exposed to, or has
rights to, variable returns from its involvement with the company and has the ability to
affect those returns through its power over the company. Though the Group generally
holds a majority of voting rights in the companies which are controlled, this applies
irrespective of the percentage of interest in the share capital if control is obtained
through agreements with other shareholders.
The list of the principal subsidiaries is provided in the section Companies of the Nestlé
Group, joint arrangements and associates.
Business combinations
Where not all of the equity of a subsidiary is acquired the non-controlling interests are
recognized at the non-controlling interest’s share of the acquiree’s net identifi able assets.
Upon obtaining control in a business combination achieved in stages, the Group
remeasures its previously held equity interest at fair value and recognizes a gain or
a loss to the income statement.
2.1 Modifi cation of the scope of consolidation
Acquisitions
In 2018 , the signifi cant acquisitions were:
– perpetual global license of Starbucks Consumer Packaged Goods and Foodservice
products (“Starbucks Alliance”), worldwide – roast and ground coffee, whole beans
as well as instant and portioned coffee (Powdered and Liquid Beverages) – end of
August.
– Atrium Innovations, mainly North America – nutritional health products (Nutrition
and Health Science) – 100%, March.
None of the other acquisitions of 2018 were signifi cant.
In 2017, among others, the acquisitions included:
– Blue Bottle Coffee, USA – high-end specialty coffee roaster and retailer (Powdered
and Liquid Beverages) – 68%, November.
None of the acquisitions of 2017 were signifi cant.

Consolidated Financial Statements of the Nestlé Group 201878
2. Scope of consolidation, acquisitions and disposals of businesses, assets held for sale and acquisitions of non-controlling interests
Disposals
In 2018 , the disposals included:
– US Confectionery business, North America – chocolate and sugar products
(Confectionery) – 100%, end of March.
– Gerber Life Insurance, North America – insurance (Nutrition and Health Science) –
100%, end of December.
None of the other disposals of 2018 were signifi cant.
In 2017 , none of the disposals of the year were significant.
2.2 Acquisitions of businesses
The major classes of assets acquired and liabilities assumed at the acquisition date are:
In millions of CHF
2018 2017
StarbucksAlliance
AtriumInnovations Other Total Total
Property, plant and equipment 4 58 62 124 129
Intangible assets (a) 4 794 1 133 66 5 993 326
Inventories, prepaid inventories and other assets 176 301 59 536 72
Financial debt — (32) (36) (68) (94)
Employee benefi ts, deferred taxes and provisions — (167) — (167) (110)
Other liabilities — (109) (38) (147) (40)
Fair value of identifi able net assets 4 974 1 184 113 6 271 283
(a) Mainly intellectual property rights, operating rights, customer list, trademarks and trade names.
Since the valuation of the assets and liabilities of recently acquired businesses is still
in process, the values are determined provisionally.
The goodwill arising on acquisitions and the cash outfl ow are:
In millions of CHF
2018 2017
StarbucksAlliance
AtriumInnovations Other Total Total
Fair value of consideration transferred 7 068 2 193 341 9 602 729
Non-controlling interests (a) — 23 6 29 49
Subtotal 7 068 2 216 347 9 631 778
Fair value of identifi able net assets (4 974) (1 184) (113) (6 271) (283)
Goodwill 2 094 1 032 234 3 360 495
(a) Non-controlling interests have been measured based on their proportionate interest in the recognized amounts of net assets
of the entities acquired.

Consolidated Financial Statements of the Nestlé Group 2018 79
In millions of CHF
2018 2017
StarbucksAlliance
AtriumInnovations Other Total Total
Fair value of consideration transferred 7 068 2 193 341 9 602 729
Cash and cash equivalents acquired — (47) (12) (59) (18)
Consideration payable — — (31) (31) (78)
Payment of consideration payable on prior years acquisitions
and other — — — — 63
Cash outfl ow on acquisitions 7 068 2 146 298 9 512 696
The consideration transferred consists of payments made in cash with some consideration
remaining payable.
Starbucks Alliance
At the end of August 2018, the Group acquired the perpetual rights to market, sell and
distribute certain Starbucks’ consumer and foodservice products globally (“Starbucks
Alliance”), which transferred control over the existing businesses mainly in North America
and Europe. It excludes Ready-to-Drink products and all sales of any products within
Starbucks coffee shops. Consumer and foodservice products include Starbucks, Seattle’s
Best Coffee, Teavana, Starbucks VIA Instant, Torrefazione Italia coffee and Starbucks branded
K-Cup pods. Through the Starbucks Alliance, the Group and Starbucks will work closely
together on the existing Starbucks range of roast and ground coffee, whole beans as well
as instant and portioned coffee with also the goal of enhancing its product offerings
for coffee lovers globally. This partnership with Starbucks signifi cantly strengthens the
Group’s coffee portfolio in the North American premium roast and ground and portioned
coffee business. It also unlocks global expansion in grocery and foodservice for the
Starbucks brand, utilizing the global reach of Nestlé. This creates synergies that result
in goodwill being recognized, which is expected to be deductible for tax purposes.
Sales and profi t for the year of the Starbucks Alliance business included in the
2018 Consolidated Financial Statements amount respectively to CHF 809 million and
CHF 74 million. The Group’s total sales and profi t for the year would have amounted
to CHF 92 753 million and CHF 10 575 million respectively if the acquisition had been
effective January 1, 2018.
Atrium InnovationsAt the beginning of March 2018, the Group acquired Atrium Innovations, a global leader
in nutritional health products with sales mainly in North America and Europe. Atrium’s
brands are a natural complement to Nestlé Health Science’s Consumer Care portfolio
and its portfolio extends Nestlé’s product range with value-added solutions such as
probiotics, plant-based protein nutrition and multivitamins. Atrium’s largest brands are
Garden of Life, the number one brand in the natural products industry in the US; and
Pure Encapsulations, a full line of hypoallergenic, research-based dietary supplements and
the number one recommended brand in the US practitioner market. The goodwill arising
on this acquisition includes elements such as distribution synergies and strong growth
potential and is not expected to be deductible for tax purposes.
2. Scope of consolidation, acquisitions and disposals of businesses, assets held for sale and acquisitions of non-controlling interests

Consolidated Financial Statements of the Nestlé Group 201880
Sales and profi t for the year of the Atrium Innovations business included in the 2018
Consolidated Financial Statements amount respectively to CHF 653 million and
CHF 86 million. The Group’s total sales and profi t for the year would have amounted
to CHF 91 559 million and CHF 10 477 million respectively if the acquisition had been
effective January 1, 2018.
Acquisition-related costs
Acquisition-related costs have been recognized under other operating expenses in the
income statement (see Note 4.2) for an amount of CHF 35 million ( 2017 : CHF 27 million ).
2.3 Disposals of businesses
The gain on disposals of businesses is mainly composed of the disposal at end of
March 2018 of the US Confectionery business (part of the Zone AMS operating segment
and classifi ed as held for sale as of December 31, 2017). The loss on disposals is mainly
composed of the disposal at end of December 2018 of the Gerber Life Insurance
business (part of the Other businesses segment).
In millions of CHF
2018 2017
Gerber LifeInsurance
US Confectionery Other Total Total
Property, plant and equipment 8 201 73 282 85
Goodwill and intangible assets 1 441 — 257 1 698 89
Inventories — 127 29 156 16
Other assets 3 644 — 32 3 676 18
Financial liabilities (4) — (1) (5) —
Employee benefi ts, deferred taxes and provisions — — (11) (11) (13)
Other liabilities (2 449) — (28) (2 477) (13)
Net assets disposed of or impaired after classifi cation
as held for sale 2 640 328 351 3 319 182
Cumulative other comprehensive income items, net,
reclassifi ed to income statement 226 37 — 263 —
Profi t/(loss) on disposals, net of disposal costs
and impairments of assets held for sale (1 343) 2 241 (212) 686 (132)
Total disposal consideration, net of disposal costs 1 523 2 606 139 4 268 50
Cash and cash equivalents disposed of — — (8) (8) —
Disposal costs not yet paid — 52 — 52 —
Consideration receivable — — (4) (4) 13
Receipt of consideration receivable on prior years’ disposals — — 2 2 77
Cash infl ow on disposals, net of disposal costs 1 523 2 658 129 4 310 140
2. Scope of consolidation, acquisitions and disposals of businesses, assets held for sale and acquisitions of non-controlling interests

Consolidated Financial Statements of the Nestlé Group 2018 81
2.4 Assets held for sale
Assets held for sale and disposal groups
Non-current assets held for sale and disposal groups are presented separately in the
current section of the balance sheet when the following criteria are met: the Group is
committed to selling the asset or disposal group, an active plan of sale has commenced,
and in the judgement of Group Management it is highly probable that the sale will be
completed within 12 months. Immediately before the initial classifi cation of the assets
and disposal groups as held for sale, the carrying amounts of the assets (or all the assets
and liabilities in the disposal groups) are measured in accordance with the applicable
accounting policy. Assets held for sale and disposal groups are subsequently measured
at the lower of their carrying amount and fair value less cost to sell. Assets held for sale
are no longer amortized or depreciated.
As of December 31, 2018, assets held for sale and liabilities directly associated with assets
held for sale are mainly composed of the Nestlé Skin Health business, which is part of
the Other businesses segment. This business has been classifi ed as held for sale due
to future growth opportunities lying outside the Group’s strategic scope. The Group is
expecting to lose control of this business in the second half of 2019. The related cumulative
loss currently recognized in other comprehensive income has been estimated at about
CHF 90 million (mainly cumulative currency translation loss) and will be recognized in
the income statement at the date the control is lost.
As of December 31, 2017, assets held for sale were mainly composed of the US
Confectionery business.
2. Scope of consolidation, acquisitions and disposals of businesses, assets held for sale and acquisitions of non-controlling interests

Consolidated Financial Statements of the Nestlé Group 201882
The composition of assets held for sale and liabilities directly associated with assets held
for sale at the end of 2018 and of 2017 are the following:
In millions of CHF
2018 2017
NestléSkin Health Other Total Total
Cash, cash equivalents and short-term investments 140 — 140 —
Inventories 214 16 230 117
Trade and other receivables, prepayments and accrued income 686 91 777 4
Deferred taxes 298 16 314 —
Property, plant and equipment 395 100 495 235
Goodwill and intangible assets 6 787 15 6 802 —
Other assets 70 — 70 1
Assets held for sale 8 590 238 8 828 357
Financial liabilities (174) (25) (199) —
Trade and other payables, accruals and deferred income (1 026) (67) (1 093) (7)
Employee benefi ts and provisions (360) (2) (362) (3)
Deferred taxes (722) — (722) —
Other liabilities (126) — (126) (2)
Liabilities directly associated with assets held for sale (2 408) (94) (2 502) (12)
Net assets held for sale 6 182 144 6 326 345
2.5 Acquisitions of non-controlling interests
Acquisitions and disposals of non-controlling interests
The Group treats transactions with non-controlling interests that do not result in loss
of control as transactions with equity holders in their capacity as equity holders. For
purchases of shares from non-controlling interests, the difference between any
consideration paid and the relevant share acquired of the carrying amount of net
assets of the subsidiary is recorded in equity. The same principle is applied to disposals
of shares to non-controlling interests.
As in the previous year, the Group increased its ownership interests in certain subsidiaries,
the most signifi cant one was in China in 2018 as in 2017. For China and other countries,
the consideration paid to non-controlling interests in cash amounted to CHF 528 million
(2017: CHF 526 million) and the decrease of non-controlling interests amounted to
CHF 162 million (2017: CHF 152 million). Part of the consideration was recorded as
a liability in previous years for CHF 510 million (2017: CHF 518 million). The equity
attributable to shareholders of the parent was positively impacted by CHF 144 million
(2017: CHF 144 million).
2. Scope of consolidation, acquisitions and disposals of businesses, assets held for sale and acquisitions of non-controlling interests
Consolidated Financial Statements of the Nestlé Group 2018 83
3. Analyses by segment
Nestlé is organized into three geographic zones and several globally managed businesses.
The Company manufactures and distributes food and beverage products in the following
categories: powdered and liquid beverages, water, milk products and ice cream, prepared
dishes and cooking aids, confectionery and petcare. Nestlé also manufactures and
distributes nutritional science products through its globally managed business Nestlé
Health Science, and science-based solutions that contribute to the health of skin, hair
and nails through Nestlé Skin Health. The Group has factories in 85 countries and sales
in 190 countries and employs around 308 000 people.
Segment reporting
Operating segments refl ect the Group’s management structure and the way fi nancial
information is regularly reviewed by the Group’s chief operating decision maker (CODM),
which is defi ned as the Executive Board.
The CODM considers the business from both a geographic and product perspective,
through three geographic Zones and several Globally Managed Businesses (GMB).
Zones and GMB that meet the quantitative threshold of 10% of total sales or trading
operating profi t for all operating segments, are presented on a stand-alone basis as
reportable segments. Even though it does not meet the reporting threshold, Nestlé
Waters is reported separately for consistency with long-standing practice of the Group.
Therefore, the Group’s reportable operating segments are:
– Zone Europe, Middle East and North Africa (EMENA);
– Zone Americas (AMS);
– Zone Asia, Oceania and sub-Saharan Africa (AOA);
– Nestlé Waters.
Other business activities and operating segments, including GMB that do not meet the
threshold, like Nespresso, Nestlé Health Science and Nestlé Skin Health, are combined
and presented in Other businesses. Following a change of business structure, effective
as from January 1, 2018, Nestlé Nutrition has been managed as a Regionally Managed
Business instead of a Globally Managed Business and consequently reported as part
of Zone EMENA, Zone AMS and Zone AOA while Gerber Life Insurance is reported under
Other businesses. In addition, the presentation of invested capital by operating segment
has been modifi ed with the goodwill related to the PetCare business reclassifi ed from
Unallocated items to the Zones following a modifi cation on how it is reported to the
Executive Board. 2017 comparatives have been adjusted.
As some operating segments represent geographic Zones, information by product
is also disclosed. The seven product groups that are disclosed represent the highest
categories of products that are followed internally.
Segment results (Trading operating profi t) represent the contribution of the different
segments to central overheads, unallocated research and development costs and the
trading operating profi t of the Group. Specifi c corporate expenses as well as specifi c
research and development costs are allocated to the corresponding segments. In addition
to the Trading operating profi t, Underlying Trading operating profi t is shown on a voluntary
basis because it is one of the key metrics used by Group Management to monitor the
Group.
Depreciation and amortization includes depreciation of property, plant and equipment
(including right of use assets under leases) and amortization of intangible assets.

Consolidated Financial Statements of the Nestlé Group 201884
3. Analyses by segment
No segment assets and liabilities are regularly provided to the CODM to assess segment
performance or to allocate resources and therefore segment assets and liabilities are not
disclosed. However the Group discloses the invested capital, goodwill and intangible
assets by segment and by product on a voluntary basis.
Invested capital comprises property, plant and equipment, trade receivables and
some other receivables, assets held for sale, inventories, prepayments and accrued
income as well as specifi c fi nancial assets associated to the segments, less trade
payables and some other payables, liabilities directly associated with assets held for
sale, non-current other payables as well as accruals and deferred income.
Goodwill and intangible assets are not included in invested capital since the amounts
recognized are not comparable between segments due to differences in the intensity
of acquisition activity and changes in accounting standards which were applicable at
various points in time when the Group undertook signifi cant acquisitions. Nevertheless,
an allocation of goodwill and intangible assets by segment and product and the related
impairment expenses are provided.
Inter-segment eliminations represent inter-company balances between the different
segments.
Invested capital and goodwill and intangible assets by segment represent the situation
at the end of the year, while the fi gures by product represent the annual average, as this
provides a better indication of the level of invested capital.
Capital additions represent the total cost incurred to acquire property, plant and
equipment (including right of use assets under leases), intangible assets and goodwill,
including those arising from business combinations. Since 2018 and the introduction
of IFRS 16, capital expenditure representing the investment in property, plant and
equipment only are not disclosed anymore.
Unallocated items represent items whose allocation to a segment or product would
be arbitrary. They mainly comprise:
– corporate expenses and related assets/liabilities;
– research and development costs and related assets/liabilities; and
– some goodwill and intangible assets.
Revenue
Sales represent amounts received and receivable from third parties for goods supplied
to the customers and for services rendered. Sales are recognized when control of the
goods has transferred to the customer, which is mainly upon arrival at the customer.
Revenue is measured as the amount of consideration which the Group expects to
receive, based on the list price applicable to a given distribution channel after deduction
of returns, sales taxes, pricing allowances, other trade discounts and couponing and
price promotions to consumers. The level of discounts, allowances and promotional
rebates is recognized as a deduction from revenue at the time that the related sales are
recognized or when the rebate is offered to the customer (or consumer if applicable).
They are estimated using judgements based on historical experience and the specific
terms of the agreements with the customers. Payments made to customers for
commercial services received are expensed. The Group has a range of credit terms
which are typically short term, in line with market practice and without any fi nancing
component.

Consolidated Financial Statements of the Nestlé Group 2018 85
The Group does not generally accept sales returns, except in limited cases mainly
in the Infant Nutrition business. Historical experience is used to estimate such returns
at the time of sale. No asset is recognized for products to be recoverable from these
returns, as they are not anticipated to be resold.
Trade assets (mainly coffee machines, water coolers and freezers) may be sold or
leased separately to customers.
Arrangements where the Group transfers substantially all the risks and rewards
incidental to ownership to the customer are treated as finance lease arrangements.
Operating lease revenue for trade asset rentals is recognized on a straight-line basis
over the lease term.
Sales are disaggregated by product group and geography in Notes 3.2 and 3.4.
Other revenue is primarily sales-based royalties and license fees from third parties
which have been earned during the period.
3. Analyses by segment

Consolidated Financial Statements of the Nestlé Group 201886
3. Analyses by segment
3.1 Operating segments
Revenue and results
In millions of CHF
2018
Sal
es (a
)
Un
der
lyin
g T
rad
ing
op
erat
ing
pro
fi t
(b)
Trad
ing
op
erat
ing
pro
fi t
Net
oth
er t
rad
ing
inco
me/
(exp
ense
s) (c
)
of
wh
ich
imp
airm
ent
of
pro
per
ty, p
lan
t an
d
equ
ipm
ent
of
wh
ich
rest
ruct
uri
ng
co
sts
Dep
reci
atio
n
and
am
ort
izat
ion
Zone EMENA 18 932 3 590 3 251 (339) (41) (250) (769)
Zone AMS 30 975 6 521 6 078 (443) (117) (142) (1 033)
Zone AOA 21 331 4 866 4 514 (352) (215) (70) (771)
Nestlé Waters 7 878 865 683 (182) (54) (96) (435)
Other businesses (d) 12 323 2 036 1 794 (242) (59) (14) (716)
Unallocated items (e) — (2 357) (2 531) (174) (14) (79) (200)
Total 91 439 15 521 13 789 (1 732) (500) (651) (3 924)
In millions of CHF
2017 *
Sal
es (a
)
Un
der
lyin
g T
rad
ing
op
erat
ing
pro
fi t
(b)
Trad
ing
op
erat
ing
pro
fi t
Net
oth
er t
rad
ing
inco
me/
(exp
ense
s) (c
)
of
wh
ich
imp
airm
ent
of
pro
per
ty, p
lan
t an
d
equ
ipm
ent
of
wh
ich
rest
ruct
uri
ng
co
sts
Dep
reci
atio
n
and
am
ort
izat
ion
Zone EMENA 18 478 3 354 3 111 (243) (77) (118) (740)
Zone AMS 31 255 6 425 6 062 (363) (59) (181) (1 037)
Zone AOA 20 878 4 644 4 468 (176) (99) (33) (782)
Nestlé Waters 7 882 1 022 958 (64) (30) (21) (428)
Other businesses (d) 11 097 1 763 1 309 (454) (119) (286) (729)
Unallocated items (e) — (2 437) (2 631) (194) (7) (34) (218)
Total 89 590 14 771 13 277 (1 494) (391) (673) (3 934)
* 2017 adjusted following changes of business structure, effective as from January 1, 2018, mainly Nestlé Nutrition (NN)
from a Globally Managed to a Regionally Managed Business transferred to the Zones and Other businesses. 2017 restated
fi gures include also other modifi cations as described in Note 1 Accounting policies and related impacts in Note 22.
(a) Inter-segment sales are not signifi cant.
(b) Trading operating profi t before Net other trading income/(expenses).
(c) Included in Trading operating profi t.
(d) Mainly Nespresso, Nestlé Health Science, Nestlé Skin Health and Gerber Life Insurance.
(e) Refer to the Segment reporting accounting policies above for the defi nition of unallocated items.

Consolidated Financial Statements of the Nestlé Group 2018 87
3. Analyses by segment
Invested capital
and other information
In millions of CHF
2018
Inve
sted
cap
ital
Go
od
will
an
din
tan
gib
le a
sset
s
Imp
airm
ent
of
go
od
will
an
d
no
n-c
om
mer
cial
ized
in
tan
gib
le a
sset
s
Imp
airm
ent
of
inta
ng
ible
ass
ets
Cap
ital
ad
dit
ion
s (c
)
Zone EMENA 6 696 5 105 (138) (16) 1 422
Zone AMS 10 051 23 849 (43) (14) 7 356
Zone AOA 4 930 13 258 (297) — 1 103
Nestlé Waters 3 382 1 481 (59) (3) 884
Other businesses (a) 2 792 12 822 (89) (53) 3 593
Unallocated items (b) and inter-segment eliminations 1 572 623 — (36) 353
Total 29 423 57 138 (626) (122) 14 711
In millions of CHF
2017 *
Inve
sted
cap
ital
Go
od
will
an
din
tan
gib
le a
sset
s
Imp
airm
ent
of
go
od
will
an
d
no
n-c
om
mer
cial
ized
in
tan
gib
le a
sset
s
Imp
airm
ent
of
inta
ng
ible
ass
ets
Cap
ital
ad
dit
ion
s (c
)
Zone EMENA 7 376 4 834 — (30) 1 021
Zone AMS 9 957 18 067 — — 1 941
Zone AOA 5 702 13 588 (227) — 770
Nestlé Waters 3 026 1 475 (3) (2) 702
Other businesses (a) 4 431 11 886 (2 809) (2) 1 712
Unallocated items (b) and inter-segment eliminations 1 459 511 — (118) 423
Total 31 951 50 361 (3 039) (152) 6 569
* 2017 adjusted following changes of business structure, effective as from January 1, 2018, mainly Nestlé Nutrition (NN)
from a Globally Managed to a Regionally Managed Business transferred to the Zones and Other businesses. In addition, the
presentation of invested capital by operating segment has been modifi ed with the goodwill related to the PetCare business
reclassifi ed from Unallocated items to the Zones following a modifi cation on how it is reported to the Executive Board.
2017 restated fi gures include also other modifi cations as described in Note 1 Accounting policies and related impacts
in Note 22.
(a) Mainly Nespresso, Nestlé Health Science, Nestlé Skin Health and Gerber Life Insurance.
(b) Refer to the Segment reporting accounting policies above for the defi nition of unallocated items.
(c) Since 2018 and the introduction of IFRS 16, capital expenditure is not disclosed anymore.

Consolidated Financial Statements of the Nestlé Group 201888
3. Analyses by segment
3.2 Products
Revenue and results
In millions of CHF
2018
Sal
es
Un
der
lyin
g T
rad
ing
op
erat
ing
pro
fi t
(a)
Trad
ing
op
erat
ing
pro
fi t
Net
oth
er t
rad
ing
inco
me/
(exp
ense
s) (b
)
of
wh
ich
imp
airm
ent
of
pro
per
ty, p
lan
t an
d
equ
ipm
ent
of
wh
ich
rest
ruct
uri
ng
co
sts
Powdered and Liquid Beverages 21 620 4 898 4 572 (326) (108) (100)
Water 7 409 775 603 (172) (49) (92)
Milk products and Ice cream 13 217 2 521 2 412 (109) (21) (42)
Nutrition and Health Science 16 188 3 337 2 826 (511) (239) (79)
Prepared dishes and cooking aids 12 065 2 176 2 044 (132) (27) (83)
Confectionery 8 123 1 403 1 291 (112) (17) (50)
PetCare 12 817 2 768 2 572 (196) (25) (126)
Unallocated items (c) — (2 357) (2 531) (174) (14) (79)
Total 91 439 15 521 13 789 (1 732) (500) (651)
In millions of CHF
2017 *
Sal
es
Un
der
lyin
g T
rad
ing
op
erat
ing
pro
fi t
(a)
Trad
ing
op
erat
ing
pro
fi t
Net
oth
er t
rad
ing
inco
me/
(exp
ense
s) (b
)
of
wh
ich
imp
airm
ent
of
pro
per
ty, p
lan
t an
d
equ
ipm
ent
of
wh
ich
rest
ruct
uri
ng
co
sts
Powdered and Liquid Beverages 20 388 4 478 4 319 (159) (50) (56)
Water 7 382 978 915 (63) (30) (20)
Milk products and Ice cream 13 430 2 515 2 333 (182) (75) (77)
Nutrition and Health Science 15 247 3 063 2 539 (524) (134) (314)
Prepared dishes and cooking aids 11 938 2 108 1 938 (170) (47) (77)
Confectionery 8 799 1 393 1 243 (150) (39) (55)
PetCare 12 406 2 673 2 621 (52) (9) (40)
Unallocated items (c) — (2 437) (2 631) (194) (7) (34)
Total 89 590 14 771 13 277 (1 494) (391) (673)
* 2017 adjusted following changes of business structure, effective as from January 1, 2018, mainly Nestlé Nutrition (NN) from
a Globally Managed to a Regionally Managed Business transferred to the Zones and Other businesses. 2017 restated
fi gures include also other modifi cations as described in Note 1 Accounting policies and related impacts in Note 22.
(a) Trading operating profi t before Net other trading income/(expenses).
(b) Included in Trading operating profi t.
(c) Refer to the Segment reporting accounting policies above for the defi nition of unallocated items.

Consolidated Financial Statements of the Nestlé Group 2018 89
Invested capital
and other information
In millions of CHF
2018
Inve
sted
cap
ital
Go
od
will
an
din
tan
gib
le a
sset
s
Imp
airm
ent
of
go
od
will
an
d
no
n-c
om
mer
cial
ized
in
tan
gib
le a
sset
s
Imp
airm
ent
of
inta
ng
ible
ass
ets
Powdered and Liquid Beverages 6 745 4 224 (25) (21)
Water 3 199 1 461 (59) (3)
Milk products and Ice cream 3 585 2 886 (22) —
Nutrition and Health Science 6 732 25 762 (89) (39)
Prepared dishes and cooking aids 3 299 5 560 (134) (21)
Confectionery 2 449 1 623 (250) —
PetCare 4 349 10 172 — (2)
Unallocated items (a) and intra-group eliminations 1 916 1 968 (47) (36)
Total 32 274 53 656 (626) (122)
In millions of CHF
2017 *
Inve
sted
cap
ital
Go
od
will
an
din
tan
gib
le a
sset
s
Imp
airm
ent
of
go
od
will
an
d
no
n-c
om
mer
cial
ized
in
tan
gib
le a
sset
s
Imp
airm
ent
of
inta
ng
ible
ass
ets
Powdered and Liquid Beverages 6 411 831 (3) —
Water 2 900 1 502 (3) (2)
Milk products and Ice cream 3 715 3 073 (137) (1)
Nutrition and Health Science 7 352 27 191 (2 806) (2)
Prepared dishes and cooking aids 3 388 5 590 — (26)
Confectionery 3 207 1 749 (90) (3)
PetCare 4 094 10 095 — —
Unallocated items (a) and intra-group eliminations 1 587 1 900 — (118)
Total 32 654 51 931 (3 039) (152)
* 2017 adjusted following changes of business structure, effective as from January 1, 2018, mainly Nestlé Nutrition (NN) from
a Globally Managed to a Regionally Managed Business transferred to the Zones and Other businesses. 2017 restated
fi gures include also other modifi cations as described in Note 1 Accounting policies and related impacts in Note 22.
(a) Refer to the Segment reporting accounting policies above for the defi nition of unallocated items.
3. Analyses by segment

Consolidated Financial Statements of the Nestlé Group 201890
3.3a Reconciliation from Underlying Trading operating profi t to profi t before
taxes, associates and joint ventures
In millions of CHF
2018 2017
Underlying Trading operating profi t (a) 15 521 14 771
Net other trading income/(expenses) (1 732) (1 494)
Trading operating profi t 13 789 13 277
Impairment of goodwill and non-commercialized intangible assets (626) (3 039)
Net other operating income/(expenses) excluding impairment of goodwill
and non-commercialized intangible assets 589 (82)
Operating profi t 13 752 10 156
Net fi nancial income/(expense) (761) (696)
Profi t before taxes, associates and joint ventures 12 991 9 460
(a) Trading operating profi t before Net other trading income/(expenses).
3.3b Reconciliation from invested capital to total assets
In millions of CHF
2018 2017
Invested capital as per Note 3.1 29 423 31 951
Liabilities included in invested capital 24 230 24 329
Subtotal 53 653 56 280
Intangible assets and goodwill as per Note 3.1 (a) 57 138 50 361
Other assets 26 224 26 569
Total assets 137 015 133 210
(a) Including Intangible assets and goodwill classifi ed as assets held for sale of CHF 6802 million (2017: CHF nil), see Note 2.4.
3. Analyses by segment

Consolidated Financial Statements of the Nestlé Group 2018 91
3.4 Disaggregation of sales by geographic area (country and type of market)
The Group disaggregates revenue from the sale of goods by major product group as
shown in Note 3.2. Disaggregation of sales by geographic area is based on customer
location and is therefore not a view by management responsibility as disclosed by
operating segments in Note 3.1.
In millions of CHF
2018 2017
EMENA 26 890 26 095
France 4 561 4 426
United Kingdom 2 930 2 703
Germany 2 752 2 681
Italy 1 819 1 781
Russia 1 595 1 620
Spain 1 552 1 525
Switzerland 1 241 1 262
Rest of EMENA 10 440 10 097
AMS 41 063 40 541
United States 27 618 26 521
Brazil 3 683 4 317
Mexico 2 813 2 722
Canada 2 064 1 943
Rest of AMS 4 885 5 038
AOA 23 486 22 954
Greater China Region 7 004 6 578
Philippines 2 476 2 571
Japan 1 782 1 751
Australia 1 552 1 569
India 1 529 1 457
Rest of AOA 9 143 9 028
Total sales 91 439 89 590
of which developed markets 53 040 51 168
of which emerging markets 38 399 38 422
3. Analyses by segment
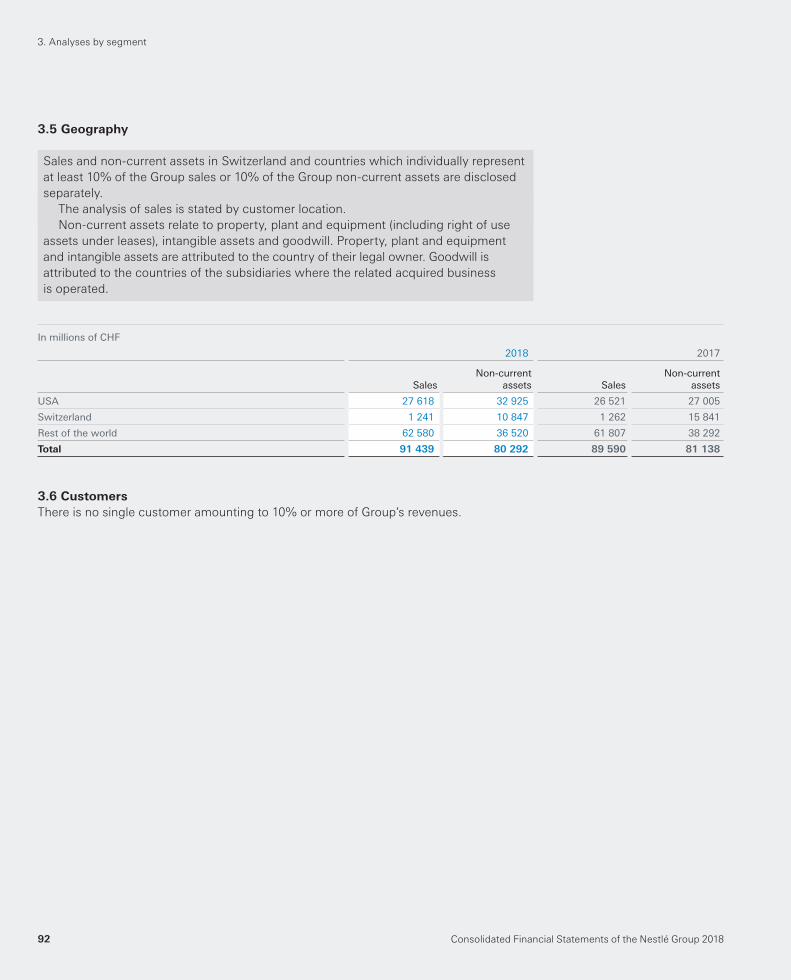
Consolidated Financial Statements of the Nestlé Group 201892
3.5 Geography
Sales and non-current assets in Switzerland and countries which individually represent
at least 10% of the Group sales or 10% of the Group non-current assets are disclosed
separately.
The analysis of sales is stated by customer location.
Non-current assets relate to property, plant and equipment (including right of use
assets under leases), intangible assets and goodwill. Property, plant and equipment
and intangible assets are attributed to the country of their legal owner. Goodwill is
attributed to the countries of the subsidiaries where the related acquired business
is operated.
In millions of CHF
2018 2017
SalesNon-current
assets SalesNon-current
assets
USA 27 618 32 925 26 521 27 005
Switzerland 1 241 10 847 1 262 15 841
Rest of the world 62 580 36 520 61 807 38 292
Total 91 439 80 292 89 590 81 138
3.6 Customers
There is no single customer amounting to 10% or more of Group’s revenues.
3. Analyses by segment

Consolidated Financial Statements of the Nestlé Group 2018 93
4. Net other trading and operating income/(expenses)
Other trading income/(expenses)
These comprise restructuring costs, impairment of property, plant and equipment
and intangible assets (other than goodwill and non-commercialized intangible assets),
litigations and onerous contracts, result on disposal of property, plant and equipment,
and specifi c other income and expenses that fall within the control of operating
segments.
Restructuring costs are restricted to dismissal indemnities and employee benefi ts
paid to terminated employees upon the reorganization of a business or function. It
does not include dismissal indemnities paid for normal attrition, poor performance,
professional misconduct, etc.
Other operating income/(expenses)
These comprise impairment of goodwill and non-commercialized intangible assets, results
on disposals of businesses (including impairment and subsequent remeasurement of
businesses classifi ed as held for sale, as well as other directly related disposal costs
like restructuring costs directly linked to businesses disposed of and legal, advisory
and other professional fees), acquisition-related costs, the effect of the hyperinfl ation
accounting, and income and expenses that fall beyond the control of operating
segments and relate to events such as natural disasters and expropriation of assets.
4.1 Net other trading income/(expenses)
In millions of CHF
Notes 2018 2017
Other trading income 37 112
Restructuring costs (651) (673)
Impairment of property, plant and equipment and intangible assets (a) 8/9 (622) (543)
Litigations and onerous contracts (438) (302)
Miscellaneous trading expenses (58) (88)
Other trading expenses (1 769) (1 606)
Total net other trading income/(expenses) (1 732) (1 494)
(a) Excluding non-commercialized intangible assets.

Consolidated Financial Statements of the Nestlé Group 201894
4.2 Net other operating income/(expenses)
In millions of CHF
Notes 2018 2017
Profi t on disposal of businesses 2 2 344 60
Miscellaneous operating income 191 319
Other operating income 2 535 379
Loss on disposal of businesses 2 (1 658) (192)
Impairment of goodwill and non-commercialized intangible assets 9 (626) (3 039)
Miscellaneous operating expenses (288) (269)
Other operating expenses (2 572) (3 500)
Total net other operating income/(expenses) (37) (3 121)
5. Net fi nancial income/(expense)
Net fi nancial income/(expense) includes net fi nancing cost of net fi nancial debt and net
interest income/(expense) on defi ned benefi t plans.
Net fi nancing cost comprises the interest income earned on cash and cash equivalents
and short-term investments, as well as the interest expense on fi nancial debt (including
leases), collectively termed “net fi nancial debt” (see Note 16.5). These headings also
include other income and expense such as exchange differences on net fi nancial debt
and results on related foreign currency and interest rate hedging instruments. Certain
borrowing costs are capitalized as explained under the section on Property, plant and
equipment.
In millions of CHF
Notes 2018 2017
Interest income 212 122
Interest expense (820) (612)
Net fi nancing cost of net fi nancial debt (608) (490)
Interest income on defi ned benefi t plans 35 30
Interest expense on defi ned benefi t plans (186) (231)
Net interest income/(expense) on defi ned benefi t plans 10 (151) (201)
Other (2) (5)
Net fi nancial income/(expense) (761) (696)
4. Net other trading and operating income/(expenses)

Consolidated Financial Statements of the Nestlé Group 2018 95
6. Inventories
Raw materials and purchased fi nished goods are valued at the lower of purchase cost
calculated using the FIFO (fi rst-in, fi rst-out) method and net realizable value. Work in
progress, sundry supplies and manufactured fi nished goods are valued at the lower
of their weighted average cost and net realizable value. The cost of inventories includes
the gains/losses on cash fl ow hedges for the purchase of raw materials and fi nished
goods.
In millions of CHF
2018 2017
Raw materials, work in progress and sundry supplies 3 889 3 864
Finished goods 5 435 5 531
Allowance for write-down to net realizable value (199) (218)
9 125 9 177
Inventories amounting to CHF 260 million ( 2017 : CHF 289 million ) are pledged as security
for fi nancial liabilities.
7. Trade and other receivables/payables
7.1 Trade and other receivables
Recognition and measurement
Trade and other receivables are recognized initially at their transaction price and
subsequently measured at amortized cost less loss allowances.
Expected credit losses
The Group applies the IFRS 9 simplifi ed approach to measuring expected credit losses
(ECLs) for trade receivables at an amount equal to lifetime ECLs. The ECLs on trade
receivables are calculated based on actual credit loss experience over the preceding
three to fi ve years on the total balance of non-credit impaired trade receivables. The
Group’s credit loss experience has shown that aging of receivable balances is primarily
due to negotiations about variable consideration.
The Group considers a trade receivable to be credit impaired when one or more
detrimental events have occurred such as:
– signifi cant fi nancial diffi culty of the customer; or
– it is becoming probable that the customer will enter bankruptcy or other fi nancial
reorganization.
Impairment losses related to trade and other receivables are not presented separately
in the consolidated income statement but are reported under the heading Marketing
and administration expenses.

Consolidated Financial Statements of the Nestlé Group 201896
In millions of CHF
2018 2017
Grosscarryingamount
Expectedcredit lossallowance Total
Grosscarryingamount
Expectedcredit lossallowance Total
Trade receivables (not credit impaired) 9 141 (50) 9 091 9 814 (87) 9 727
Other receivables (not credit impaired) 2 098 (41) 2 057 2 334 (34) 2 300
Credit impaired trade and other receivables 239 (220) 19 236 (227) 9
Total 11 478 (311) 11 167 12 384 (348) 12 036
The fi ve major customers represent 12% ( 2017 : 12% ) of trade and other receivables,
none of them individually exceeding 6% ( 2017 : 7% ).
Based on the historic trend and expected performance of the customers, the Group
believes that the above expected credit loss allowance suffi ciently covers the risk of
default.
7.2 Trade and other payables by type
In millions of CHF
2018 2017
Due within one year
Trade payables 13 045 12 890
Social security and sundry taxes and levies 1 934 2 282
Other payables 2 821 3 692
17 800 18 864
7. Trade and other receivables/payables

Consolidated Financial Statements of the Nestlé Group 2018 97
8. Property, plant and equipment
Property, plant and equipment comprises owned and leased assets.
In millions of CHF
Notes 2018 2017
Property, plant and equipment – owned 8.1 26 837 27 666
Right-of-use assets – leased 8.2b 3 119 3 111
29 956 30 777
8.1 Owned assets
Owned property, plant and equipment are shown on the balance sheet at their
historical cost.
Depreciation is assessed on components that have homogenous useful lives by
using the straight-line method so as to depreciate the initial cost down to the residual
value over the estimated useful lives. The residual values are 30% on head offi ces and
nil for all other asset types. The useful lives are as follows:
Buildings 20 – 40 years
Machinery and equipment 10 – 25 years
Tools, furniture, information technology
and sundry equipment 3 – 15 years
Vehicles 3 – 10 years
Land is not depreciated.
Useful lives, components and residual amounts are reviewed annually. Such a review
takes into consideration the nature of the assets, their intended use including but not
limited to the closure of facilities and the evolution of the technology and competitive
pressures that may lead to technical obsolescence.
Depreciation of property, plant and equipment is allocated to the appropriate headings
of expenses by function in the income statement.
Borrowing costs incurred during the course of construction are capitalized if the assets
under construction are signifi cant and if their construction requires a substantial period
to complete (typically more than one year). The capitalization rate is determined on the
basis of the short-term borrowing rate for the period of construction.
Government grants are recognized as deferred income which is released to the income
statement over the useful life of the related assets.

Consolidated Financial Statements of the Nestlé Group 201898
In millions of CHF
Land andbuildings
Machineryand
equipment
Tools,furniture
and otherequipment Vehicles Total
Gross value
At January 1, 2018 17 841 31 103 8 013 615 57 572
Currency retranslations (617) (980) (160) (5) (1 762)
Capital expenditure (a) 1 025 2 013 782 40 3 860
Disposals (135) (592) (466) (88) (1 281)
Reclassifi cation (to)/from held for sale (387) (260) (85) (2) (734)
Modifi cation of the scope of consolidation 20 9 (15) — 14
At December 31, 2018 17 747 31 293 8 069 560 57 669
Accumulated depreciation and impairments
At January 1, 2018 (6 124) (17 642) (5 721) (419) (29 906)
Currency retranslations 225 499 162 1 887
Depreciation (484) (1 581) (742) (51) (2 858)
Impairments (138) (269) (18) (7) (432)
Disposals 74 536 438 75 1 123
Reclassifi cation to/(from) held for sale 159 102 50 1 312
Modifi cation of the scope of consolidation 10 21 10 1 42
At December 31, 2018 (6 278) (18 334) (5 821) (399) (30 832)
Net at December 31, 2018 11 469 12 959 2 248 161 26 837
Gross value
At January 1, 2017 17 169 30 148 7 644 715 55 676
Currency retranslations (93) (16) 110 (26) (25)
Capital expenditure (a) 1 033 2 058 799 44 3 934
Disposals (95) (498) (494) (101) (1 188)
Reclassifi cation (to)/from held for sale (215) (568) (47) (17) (847)
Modifi cation of the scope of consolidation 42 (21) 1 — 22
At December 31, 2017 17 841 31 103 8 013 615 57 572
Accumulated depreciation and impairments
At January 1, 2017 (5 621) (16 704) (5 469) (461) (28 255)
Currency retranslations (45) (51) (23) 19 (100)
Depreciation (466) (1 581) (724) (65) (2 836)
Impairments (166) (177) (17) (6) (366)
Disposals 63 454 474 83 1 074
Reclassifi cation to/(from) held for sale 109 400 35 11 555
Modifi cation of the scope of consolidation 2 17 3 — 22
At December 31, 2017 (6 124) (17 642) (5 721) (419) (29 906)
Net at December 31, 2017 11 717 13 461 2 292 196 27 666
(a) Including borrowing costs.
8. Property, plant and equipment

Consolidated Financial Statements of the Nestlé Group 2018 99
At December 31, 2018 , property, plant and equipment include CHF 1528 million of assets
under construction ( 2017 : CHF 938 million ). Net property, plant and equipment of
CHF 208 million are pledged as security for fi nancial liabilities ( 2017 : CHF 291 million ).
At December 31, 2018 , the Group was committed to expenditure amounting to
CHF 797 million ( 2017 : CHF 527 million ).
Impairment of property, plant and equipment
Reviews of the carrying amount of the Group’s property, plant and equipment are
performed when there is an indication of impairment. An indicator could be unfavorable
development of a business under competitive pressures or severe economic slowdown
in a given market as well as reorganization of the operations to leverage their scale.
In assessing value in use, the estimated future cash fl ows are discounted to their
present value, based on the time value of money and the risks specifi c to the country
where the assets are located. The risks specifi c to the asset are included in the
determination of the cash fl ows.
Impairment of property, plant and equipment arises mainly from the plans to optimize
industrial manufacturing capacities by closing or selling ineffi cient production facilities.
8.2 Leases – Group as a lessee
The Group assesses whether a contract is or contains a lease at inception of the contract.
This assessment involves the exercise of judgement about whether it depends on
a specifi ed asset, whether the Group obtains substantially all the economic benefi ts from
the use of that asset, and whether the Group has the right to direct the use of the asset.
The Group recognizes a right-of-use (ROU) asset and a lease liability at the lease
commencement date, except for short-term leases of 12 months or less which are
expensed in the income statement on a straight-line basis over the lease term.
The lease liability is initially measured at the present value of the lease payments
that are not paid at the commencement date, discounted using the interest rate implicit
in the lease. If this rate cannot be readily determined, the Group uses an incremental
borrowing rate specifi c to the country, term and currency of the contract. Lease
payments can include fi xed payments; variable payments that depend on an index or
rate known at the commencement date; and extension option payments or purchase
options, if the Group is reasonably certain to exercise. The lease liability is subsequently
measured at amortized cost using the effective interest rate method and remeasured
(with a corresponding adjustment to the related ROU asset) when there is a change
in future lease payments in case of renegotiation, changes of an index or rate or in
case of reassessment of options.
At inception, the ROU asset comprises the initial lease liability, initial direct costs
and the obligations to refurbish the asset, less any incentives granted by the lessors.
The ROU asset is depreciated over the shorter of the lease term or the useful life of the
underlying asset. The ROU asset is subject to testing for impairment if there is an indicator
for impairment, as for owned assets.
ROU assets are included in the heading Property, plant and equipment, and the
lease liability is included in the headings current and non-current Financial debt.
8. Property, plant and equipment

Consolidated Financial Statements of the Nestlé Group 2018100
8.2a Description of lease activities
Real estate leasesThe Group leases land and buildings for its offi ce and warehouse space and retail stores.
Lease terms are negotiated on an individual basis and contain a wide range of different
terms and conditions. Leases are typically made for a fi xed period of 5–15 years and may
include extension options which provide operational fl exibility. If the Group exercised all
extension options not currently included in the lease liability, the additional payments
would amount to CHF 0.8 billion (undiscounted) at December 31, 2018.
Vehicles leasesThe Group leases trucks for distribution in specifi c businesses and cars for management
and sales functions. The average contract duration is 6 years for trucks and 3 years for
cars.
Other leasesThe Group also leases Machinery and equipment and Tools, furniture and other equipment
that combined are insignifi cant to the total leased asset portfolio.
8.2b Right-of-use assets
In millions of CHF
Land and buildings Vehicles Other Total
Net carrying amount
December 31, 2018 2 523 428 168 3 119
December 31, 2017 2 547 415 149 3 111
Depreciation expense for the year ended
December 31, 2018 (512) (156) (78) (746)
December 31, 2017 (512) (141) (71) (724)
Impairment for the year ended
December 31, 2018 (68) — — (68)
December 31, 2017 (25) — — (25)
Additions to right-of-use assets during 2018 were CHF 775 million (2017: CHF 916 million ).
8.2c Other lease disclosures
A maturity analysis of lease liabilities is shown in note 12.2b.
The Group incurred interest expense on lease liabilities of CHF 98 million
(2017: CHF 98 million ). The expense relating to short-term leases and variable lease
payments not included in the measurement of lease liabilities is not signifi cant. The total
cash outfl ow for leases amounted to CHF 994 million (2017: CHF 926 million ).
There are no signifi cant lease commitments for leases not commenced at year-end.
8. Property, plant and equipment

Consolidated Financial Statements of the Nestlé Group 2018 101
9. Goodwill and intangible assets
Goodwill
Goodwill is initially recognized during a business combination (see Note 2). Subsequently
it is measured at cost less impairment.
Intangible assets
This heading includes intangible assets that are internally generated or acquired, either
separately or in a business combination, when they are identifi able and can be reliably
measured. Internally generated intangible assets (essentially management information
system software) are capitalized provided that there is an identifi able asset that will
be useful in generating future benefi ts in terms of savings, economies of scale, etc.
Payments made to third parties in order to in-license or acquire intellectual property
rights, compounds and products are capitalized as non-commercialized intangible
assets, as they are separately identifi able and are expected to generate future benefi ts.
Non-commercialized intangible assets are not amortized, but tested for impairment
(see Impairment of goodwill and intangible assets below). Any impairment charge is
recorded in the consolidated income statement under Other operating expenses. They
are reclassifi ed as commercialized intangible assets once development is complete,
usually when approval for sales has been granted by the relevant regulatory authority.
Indefi nite life intangible assets mainly comprise certain brands, trade marks,
operating rights and intellectual property rights which can be renewed without
signifi cant cost and are supported by ongoing marketing activities. They are not
amortized but tested for impairment annually or more frequently if an impairment
indicator is triggered. The assessment of the classifi cation of intangible assets as
indefi nite is reviewed annually.
Finite life intangible assets are amortized over the shorter of their contractual or useful
economic lives. They comprise mainly management information systems, patents and
rights to carry on an activity (e.g. exclusive rights to sell products or to perform a supply
activity). Finite life intangible assets are amortized on a straight-line basis assuming
a zero residual value: management information systems over a period ranging from
3 to 8 years; other fi nite intangible assets over the estimated useful life or the related
contractual period, generally 5 to 20 years or longer, depending on specifi c circumstances.
Useful lives and residual values are reviewed annually. Amortization of fi nite life intangible
assets starts when they are available for use and is allocated to the appropriate headings
of expenses by function in the income statement.
Research and development
Internal research costs are charged to the income statement in the year in which they
are incurred. Development costs are only recognized as assets on the balance sheet if
all the recognition criteria set by IAS 38 – Intangible Assets are met before the products
are launched on the market. Development costs are generally charged to the income
statement in the year in which they are incurred due to uncertainties inherent in the
development of new products because the expected future economic benefi ts cannot
be reliably determined. As long as the products have not reached the market place,
there is no reliable evidence that positive future cash fl ows would be obtained.
Capitalized development costs are subsequently accounted for as described in the
section Intangible assets above.

Consolidated Financial Statements of the Nestlé Group 2018102
In millions of CHF
Go
od
will
Bra
nd
s an
din
telle
ctu
alp
rop
erty
rig
hts
Op
erat
ing
rig
hts
and
oth
ers
Man
agem
ent
info
rmat
ion
syst
ems
Tota
lin
tan
gib
leas
sets
of
wh
ich
inte
rnal
lyg
ener
ated
Gross value
At January 1, 2018 36 370 17 560 2 964 4 958 25 482 4 447
of which indefi nite useful life — 16 218 32 — 16 250 —
Currency retranslations (272) (228) (21) (81) (330) (79)
Expenditure — 8 220 373 601 301
Disposals — (11) (55) (9) (75) (2)
Reclassifi cation (to)/from held for sale (3 107) (5 926) (1 326) (108) (7 360) (2)
Modifi cation of the scope of consolidation (a) 3 030 917 3 911 (79) 4 749 (84)
At December 31, 2018 36 021 12 320 5 693 5 054 23 067 4 581
of which indefi nite useful life — 12 239 4 700 — 16 939 —
of which non-commercialized intangible assets — 24 219 — 243 —
Accumulated amortization and impairments
At January 1, 2018 (6 624) (435) (544) (3 888) (4 867) (3 561)
of which indefi nite useful life — (52) (10) — (62) —
Currency retranslations 105 5 4 76 85 74
Amortization — (76) (79) (165) (320) (122)
Impairments (b) (592) (56) (29) (71) (156) (61)
Disposals — 11 55 9 75 2
Reclassifi cation to/(from) held for sale 2 773 426 232 74 732 —
Modifi cation of the scope of consolidation 19 — 17 1 18 —
At December 31, 2018 (4 319) (125) (344) (3 964) (4 433) (3 668)
of which indefi nite useful life — (67) — — (67) —
of which non-commercialized intangible assets — (6) (29) — (35) —
Net at December 31, 2018 31 702 12 195 5 349 1 090 18 634 913
of which indefi nite useful life — 12 172 4 700 — 16 872 —
of which non-commercialized intangible assets — 18 190 — 208 —
(a) Goodwill: acquisition of businesses amounts to CHF 3360 million and disposal of businesses to CHF 330 million.
Operating rights and other: acquisition of businesses amounts to CHF 4930 million and disposal of businesses
to CHF 1019 million.
(b) Of which CHF 34 million of non-commercialized intangible assets.
9. Goodwill and intangible assets

Consolidated Financial Statements of the Nestlé Group 2018 103
In millions of CHF
Go
od
will
Bra
nd
s an
din
telle
ctu
alp
rop
erty
rig
hts
Op
erat
ing
rig
hts
and
oth
ers
Man
agem
ent
info
rmat
ion
syst
ems
Tota
lin
tan
gib
leas
sets
of
wh
ich
inte
rnal
lyg
ener
ated
Gross value
At January 1, 2017 36 654 17 447 2 848 4 486 24 781 4 049
of which indefi nite useful life — 16 200 33 — 16 233 —
Currency retranslations (769) (173) (85) 9 (249) 18
Expenditure — 86 214 469 769 384
Disposals — (9) (49) (5) (63) (2)
Reclassifi cation (to)/from held for sale — — — (2) (2) (2)
Modifi cation of the scope of consolidation (a) 485 209 36 1 246 —
At December 31, 2017 36 370 17 560 2 964 4 958 25 482 4 447
of which indefi nite useful life — 16 218 32 — 16 250 —
of which non-commercialized intangible assets — 34 194 — 228 —
Accumulated amortization and impairments
At January 1, 2017 (3 647) (315) (465) (3 604) (4 384) (3 307)
of which indefi nite useful life — (20) (10) — (30) —
Currency retranslations 56 (3) 3 (15) (15) (19)
Amortization — (88) (132) (154) (374) (120)
Impairments (b) (3 033) (37) (1) (120) (158) (118)
Disposals — 8 49 4 61 2
Reclassifi cation to/(from) held for sale — — — 1 1 1
Modifi cation of the scope of consolidation — — 2 — 2 —
At December 31, 2017 (6 624) (435) (544) (3 888) (4 867) (3 561)
of which indefi nite useful life — (52) (10) — (62) —
of which non-commercialized intangible assets — (6) — — (6) —
Net at December 31, 2017 29 746 17 125 2 420 1 070 20 615 886
of which indefi nite useful life — 16 166 22 — 16 188 —
of which non-commercialized intangible assets — 28 194 — 222 —
(a) Goodwill: acquisition of businesses amounts to CHF 495 million and disposal of businesses to CHF 10 million.
(b) Of which CHF 6 million of non-commercialized intangible assets.
In addition to the above, the Group has entered into long-term agreements to in-license
or acquire intellectual property or operating rights from some third parties or associates
(related parties). If agreed objectives or performance targets are achieved, these
agreements may require potential milestone payments and other payments by the Group,
which may be capitalized as non-commercialized intangible assets (see accounting policy
in Note 9 – Intangible assets).
9. Goodwill and intangible assets
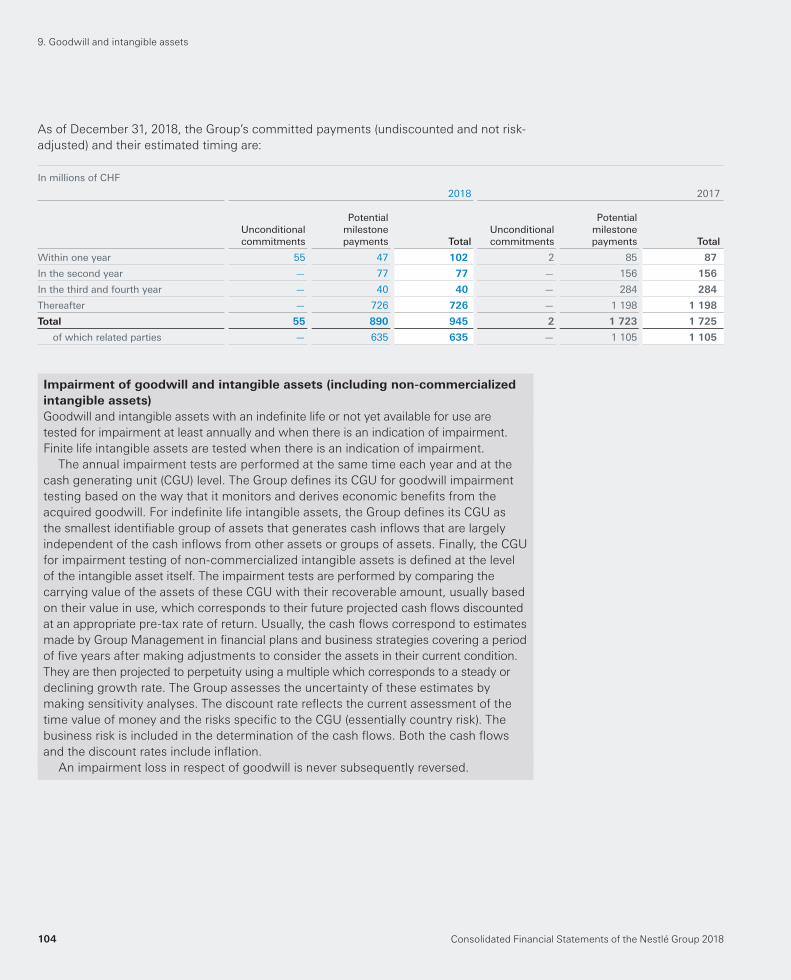
Consolidated Financial Statements of the Nestlé Group 2018104
As of December 31, 2018 , the Group’s committed payments (undiscounted and not risk-
adjusted) and their estimated timing are:
In millions of CHF
2018 2017
Unconditionalcommitments
Potentialmilestonepayments Total
Unconditionalcommitments
Potentialmilestonepayments Total
Within one year 55 47 102 2 85 87
In the second year — 77 77 — 156 156
In the third and fourth year — 40 40 — 284 284
Thereafter — 726 726 — 1 198 1 198
Total 55 890 945 2 1 723 1 725
of which related parties — 635 635 — 1 105 1 105
Impairment of goodwill and intangible assets (including non-commercialized
intangible assets)
Goodwill and intangible assets with an indefi nite life or not yet available for use are
tested for impairment at least annually and when there is an indication of impairment.
Finite life intangible assets are tested when there is an indication of impairment.
The annual impairment tests are performed at the same time each year and at the
cash generating unit (CGU) level. The Group defi nes its CGU for goodwill impairment
testing based on the way that it monitors and derives economic benefi ts from the
acquired goodwill. For indefi nite life intangible assets, the Group defi nes its CGU as
the smallest identifi able group of assets that generates cash infl ows that are largely
independent of the cash infl ows from other assets or groups of assets. Finally, the CGU
for impairment testing of non-commercialized intangible assets is defi ned at the level
of the intangible asset itself. The impairment tests are performed by comparing the
carrying value of the assets of these CGU with their recoverable amount, usually based
on their value in use, which corresponds to their future projected cash fl ows discounted
at an appropriate pre-tax rate of return. Usually, the cash fl ows correspond to estimates
made by Group Management in fi nancial plans and business strategies covering a period
of fi ve years after making adjustments to consider the assets in their current condition.
They are then projected to perpetuity using a multiple which corresponds to a steady or
declining growth rate. The Group assesses the uncertainty of these estimates by
making sensitivity analyses. The discount rate refl ects the current assessment of the
time value of money and the risks specifi c to the CGU (essentially country risk). The
business risk is included in the determination of the cash fl ows. Both the cash fl ows
and the discount rates include infl ation.
An impairment loss in respect of goodwill is never subsequently reversed.
9. Goodwill and intangible assets

Consolidated Financial Statements of the Nestlé Group 2018 105
9.1 Impairment
9.1.1 Impairment charge during the year
In 2018, there were various impairments of goodwill (predominantly in Zone AOA) and
intangible assets. None of them were individually signifi cant.
In 2017, the impairment charge mainly related to the Nestlé Skin Health goodwill CGU
and other various non-signifi cant impairments of goodwill (predominantly in Zone AOA)
and intangible assets (predominantly in Unallocated items). For the Nestlé Skin Health
CGU, a goodwill impairment charge of CHF 2799 million was recognized under the
heading Other operating expenses in the income statement. The Nestlé Skin Health CGU
goodwill is included in the Other businesses segment disclosed in Note 3.1.
9.1.2 Annual impairment tests
Impairment reviews have been conducted for more than 50 Cash Generating Units (CGU).
The following table sets out the key assumptions for those CGUs that have signifi cant
Goodwill or Intangible assets with an indefi nite useful life allocated to them.
2018
Carryingamount
Period ofcash fl ow
projections
Annualsales
growth
Annualmargin
evolution
Terminalgrowth
rate
Pre-taxdiscount
rate
Goodwill CGU
PetCare Zone AMS 7 887 5 years 5% to 7% Declining 2.7% 8.6%
Nutrition AOA (a) 5 964 5 years 2% to 5% Stable 3.7% 10.3%
DSD for Frozen Pizza and Ice Cream – USA 2 509 5 years 0% to 1% Improvement 1.7% 8.4%
Subtotal 16 360
Other CGUs 15 342
Total Goodwill 31 702
Intangible assets with indefi nite useful life CGU
Nestlé Nutrition Worldwide (a) 5 677 5 years 2% to 4% Improvement 3.4% 10.4%
Nestlé Starbucks North America 4 321 5 years 3% to 5% Improvement 2.5% 8.1%
Subtotal 9 998
Other CGUs 6 874
Total Intangible assets with indefi nite useful life 16 872
(a) Following the reorganization of the Nutrition business from a GMB to a RMB in the Zones (see Note 3), the goodwill has
been allocated to the respective operating segments. Only the goodwill in Zone AOA is signifi cant.
9. Goodwill and intangible assets
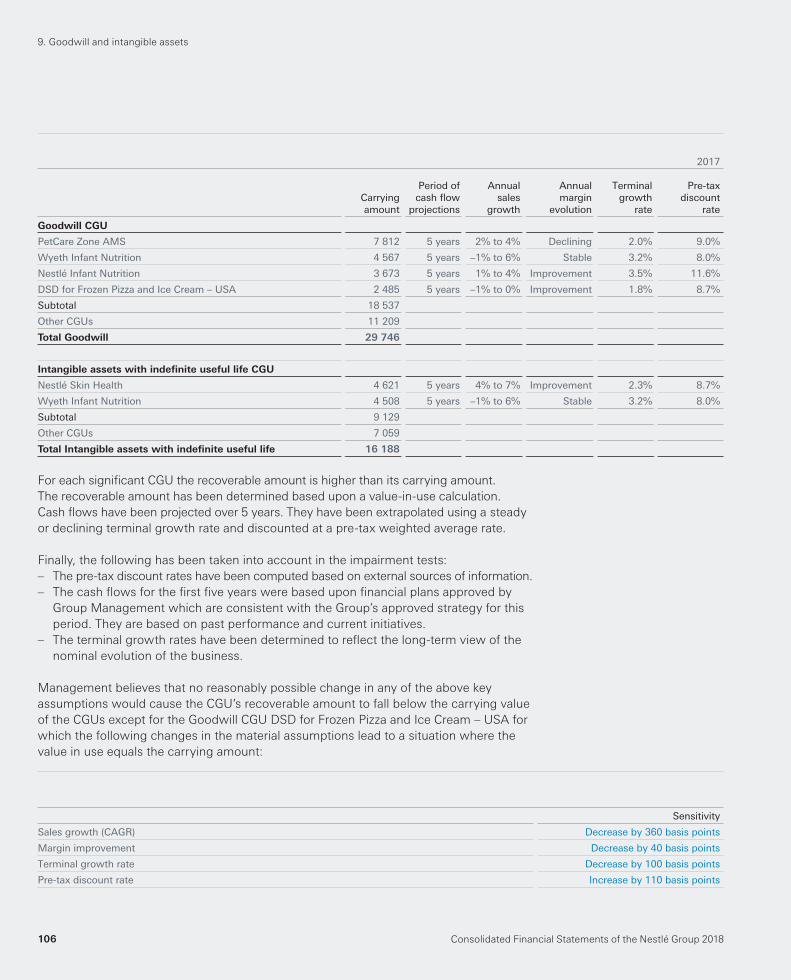
Consolidated Financial Statements of the Nestlé Group 2018106
2017
Carryingamount
Period ofcash fl ow
projections
Annualsales
growth
Annualmargin
evolution
Terminalgrowth
rate
Pre-taxdiscount
rate
Goodwill CGU
PetCare Zone AMS 7 812 5 years 2% to 4% Declining 2.0% 9.0%
Wyeth Infant Nutrition 4 567 5 years –1% to 6% Stable 3.2% 8.0%
Nestlé Infant Nutrition 3 673 5 years 1% to 4% Improvement 3.5% 11.6%
DSD for Frozen Pizza and Ice Cream – USA 2 485 5 years –1% to 0% Improvement 1.8% 8.7%
Subtotal 18 537
Other CGUs 11 209
Total Goodwill 29 746
Intangible assets with indefi nite useful life CGU
Nestlé Skin Health 4 621 5 years 4% to 7% Improvement 2.3% 8.7%
Wyeth Infant Nutrition 4 508 5 years –1% to 6% Stable 3.2% 8.0%
Subtotal 9 129
Other CGUs 7 059
Total Intangible assets with indefi nite useful life 16 188
For each signifi cant CGU the recoverable amount is higher than its carrying amount.
The recoverable amount has been determined based upon a value-in-use calculation.
Cash fl ows have been projected over 5 years. They have been extrapolated using a steady
or declining terminal growth rate and discounted at a pre-tax weighted average rate.
Finally, the following has been taken into account in the impairment tests:
– The pre-tax discount rates have been computed based on external sources of information.
– The cash fl ows for the fi rst fi ve years were based upon fi nancial plans approved by
Group Management which are consistent with the Group’s approved strategy for this
period. They are based on past performance and current initiatives.
– The terminal growth rates have been determined to refl ect the long-term view of the
nominal evolution of the business.
Management believes that no reasonably possible change in any of the above key
assumptions would cause the CGU’s recoverable amount to fall below the carrying value
of the CGUs except for the Goodwill CGU DSD for Frozen Pizza and Ice Cream – USA for
which the following changes in the material assumptions lead to a situation where the
value in use equals the carrying amount:
Sensitivity
Sales growth (CAGR) Decrease by 360 basis points
Margin improvement Decrease by 40 basis points
Terminal growth rate Decrease by 100 basis points
Pre-tax discount rate Increase by 110 basis points
9. Goodwill and intangible assets

Consolidated Financial Statements of the Nestlé Group 2018 107
10. Employee benefi ts
10.1 Employee remuneration
The Group’s salaries of CHF 12 196 million ( 2017 : CHF 12 350 million ) and welfare expenses
of CHF 4234 million ( 2017 : CHF 4221 million ) represent a total of CHF 16 430 million
( 2017 : CHF 16 571 million ). In addition, certain Group employees are eligible to long-term
incentives in the form of equity compensation plans, for which the cost amounts to
CHF 227 million ( 2017 : CHF 247 million ). Employee remuneration is allocated to the
appropriate headings of expenses by function.
10.2 Post-employment benefi ts
The liabilities of the Group arising from defi ned benefi t obligations, and the related
current service cost, are determined using the projected unit credit method. Actuarial
advice is provided both by external consultants and by actuaries employed by the Group.
The actuarial assumptions used to calculate the defi ned benefi t obligations vary according
to the economic conditions of the country in which the plan is located. Such plans are
either externally funded (in the form of independently administered funds) or unfunded.
The defi cit or excess of the fair value of plan assets over the present value of the defi ned
benefi t obligation is recognized as a liability or an asset on the balance sheet.
Pension cost charged to the income statement consists of service cost (current
and past service cost, gains and losses arising from curtailment and settlement) and
administration costs (other than costs of managing plan assets), which are allocated
to the appropriate heading by function, and net interest expense or income, which is
presented as part of net fi nancial income/(expense). The actual return less interest income
on plan assets, changes in actuarial assumptions, and differences between actuarial
assumptions and what has actually occurred are reported in other comprehensive income.
Some benefi ts are also provided by defi ned contribution plans. Contributions to such
plans are charged to the income statement as incurred.
Certain disclosures are presented by geographic area. The three regions disclosed are
Europe, Middle East and North Africa (EMENA), Americas (AMS) and Asia, Oceania
and sub-Saharan Africa (AOA). Each region includes the corresponding Zones as well
as the portion of the GMB activity in that region.
Pensions and retirement benefi ts
Apart from legally required social security arrangements, the majority of Group employees
are eligible for benefi ts through pension plans in case of retirement, death in service,
disability and in case of resignation. Those plans are either defi ned contribution plans
or defi ned benefi t plans based on pensionable remuneration and length of service. All
pension plans comply with local tax and legal restrictions in their respective country,
including funding obligations.
The Group manages its pension plans by geographic area and the major plans, classifi ed
as defi ned benefi t plans under IAS 19, are located in EMENA (Switzerland, United Kingdom
and Germany) and in AMS (USA). In accordance with applicable legal frameworks, these
plans have Boards of Trustees or General Assemblies which are generally independent
from the Group and are responsible for the management and governance of the plans.
Consolidated Financial Statements of the Nestlé Group 2018108
In Switzerland, Nestlé’s pension plan is a cash balance plan where contributions are
expressed as a percentage of the pensionable salary. The pension plan guarantees the
amount accrued on the members’ savings accounts, as well as a minimum interest on those
savings accounts. At retirement date, the savings accounts are converted into pensions.
However, members may opt to receive a part of the pension as a lump sum. Increases
of pensions in payment are granted on a discretionary basis by the Board of Trustees,
subject to the fi nancial situation of the plan. To be noted that there is also a defi ned benefi t
plan that has been closed to new entrants in 2013 and whose members below age 55 as of
that date were transferred to the cash balance plan. This heritage plan is a hybrid between
a cash balance plan and a plan based on a fi nal pensionable salary. Finally, the Group has
committed to make additional contributions up to a maximum of CHF 440 million, of which
CHF 115 million had been contributed as at December 31, 2018, in order to mitigate the
impact of changes in mortality and decrease in conversion rates applicable since
July 1, 2018.
In the United Kingdom, Nestlé’s pension plan is a hybrid arrangement combining
a defi ned benefi t career average section plus a defi ned contribution section. The defi ned
benefi t section was closed to new entrants during 2016. In the defi ned benefi t section,
from August 2017 onwards, members accrue a pension defi ned on their capped salary
each year, plus defi ned contribution provision above the capped salary. Accrued pensions
are automatically revalued according to infl ation, subject to caps. Similarly, pensions
in payment are increased annually in line with infl ation, subject to caps as applicable.
At retirement, there is a lump sum option. Finally, the funding of the shortfall of the
Nestlé UK Pension Fund is defi ned on the basis of a triennial independent actuarial
valuation in accordance with local regulations. As a result, an amount of GBP 86 million
has been paid by Nestlé UK Ltd during the year in accordance with the agreed schedule
of contributions. The undiscounted future payments after December 31, 2018, related
to the shortfall amount to GBP 407 million (GBP 172 million between 2019 to 2020,
GBP 86 million in 2021 and GBP 149 million in 2022).
Nestlé’s pension plan in Germany is a cash balance plan, where members benefi t
from a guarantee on their savings accounts. Contributions to the plan are expressed
as a percentage of the pensionable salary. Increases to pensions in payment are granted
in accor dance with legal requirements. There is also a heritage plan, based on fi nal
pensionable salary, which has been closed to new entrants in 2006.
In the USA, Nestlé’s primary pension plan is non-contributory for the employees. The plan
is a pension equity design, under which members earn pension credits each year based on
a schedule related to the sum of their age and service with Nestlé. A member’s benefi t is the
sum of the annual pension credits earned multiplied by an average earning payable as a lump
sum. However, in lieu of the lump sum, members have the option of converting the benefi t
to a monthly pension annuity. The plan does not provide for automatic pension increases.
This plan was closed to new entrants at the end of 2015. In 2018, Nestlé elected to
contribute in advance the anticipated contributions of the years 2019–2021 in addition
to 2018 for a total amount of USD 233 million to its US based defi ned benefi t plans.
Post-employment medical benefi ts and other employee benefi ts
Subsidiaries, principally in AMS, maintain medical benefi t plans, classifi ed as defi ned
benefi t plans under IAS 19, which cover eligible retired employees. The obligations for
other employee benefi ts consist mainly of end of service indemnities, which do not have
the character of pensions.
10. Employee benefi ts

Consolidated Financial Statements of the Nestlé Group 2018 109
Risks related to defi ned benefi t plans
The main risks to which the Group is exposed in relation to operating defi ned benefi t
plans are:
– mortality risk: the assumptions adopted by the Group make allowance for future
improvements in life expectancy. However, if life expectancy improves at a faster rate
than assumed, this would result in greater payments from the plans and consequently
increases in the plans’ liabilities. In order to minimize this risk, mortality assumptions
are reviewed on a regular basis.
– market and liquidity risks: these are the risks that the investments do not meet the
expected returns over the medium to long-term. This also encompasses the mismatch
between assets and liabilities. In order to minimize the risks, the structure of the portfolios
is reviewed and asset-liability matching analyses are performed on a regular basis.
As certain of the Group’s pension arrangements permit benefi ts to be adjusted in the case
that downside risks emerge, therefore the Group does not always have full exposure to
the risks described above.
Plan amendments and restructuring events
Plans within the Group are regularly reviewed as to whether they are aligned with market
practice in the local context. Should a review indicate that a plan needs to be changed,
prior agreement with the local Board of Trustees or the General Assembly, the regulator
and, if applicable, the members, is sought before implementing plan changes.
During the year, there were individually non-signifi cant plan amendments and restructuring
activities leading to curtailments and settlements. The related past service costs (income)
of CHF 78 million have been recognized in the income statement primarily under
Marketing and administration costs.
Asset-liability management and funding arrangement
Plan trustees or General Assemblies are responsible for determining the mix of asset
classes and target allocations of the Nestlé’s plans with the support of investment advisors.
Periodic reviews of the asset mix are made by mandating external consultants to perform
asset liability matching analyses. Such analyses aim at comparing dynamically the fair value
of assets and the liabilities in order to determine the most adequate strategic asset allocation.
The overall investment policy and strategy for the Group’s funded defi ned benefi t plans
is guided by the objective of achieving an investment return which, together with the
contri butions paid, is suffi cient to maintain reasonable control over the various funding
risks of the plans. As those risks evolve with the development of capital markets and
asset management activities, the Group addresses the assessment and control process
of the major investment pension risks. In order to protect the Group’s defi ned benefi t plans
funding ratio and to mitigate the fi nancial risks, protective measures on the investment
strategies are in force. To the extent possible, the risks are shared equally amongst the
different stakeholders.
10. Employee benefi ts

Consolidated Financial Statements of the Nestlé Group 2018110
10.2a Reconciliation of assets and liabilities recognized in the balance sheet
In millions of CHF
2018 2017
Defi
ned
ben
efi t
reti
rem
ent
pla
ns
Po
st-e
mp
loym
ent
med
ical
ben
efi t
s an
d o
ther
ben
efi t
s
Tota
l
Defi
ned
ben
efi t
reti
rem
ent
pla
ns
Po
st-e
mp
loym
ent
med
ical
ben
efi t
s an
d o
ther
ben
efi t
s
Tota
l
Present value of funded obligations 24 364 58 24 422 27 347 62 27 409
Fair value of plan assets (22 625) (33) (22 658) (24 656) (35) (24 691)
Excess of liabilities/(assets) over funded obligations 1 739 25 1 764 2 691 27 2 718
Present value of unfunded obligations 737 1 874 2 611 862 2 018 2 880
Unrecognized assets 29 — 29 23 — 23
Net defi ned benefi t liabilities/(assets) 2 505 1 899 4 404 3 576 2 045 5 621
Other employee benefi t liabilities 1 028 1 098
Net liabilities 5 432 6 719
Refl ected in the balance sheet as follows:
Employee benefi t assets (487) (392)
Employee benefi t liabilities 5 919 7 111
Net liabilities 5 432 6 719
10.2b Funding situation by geographic area of defi ned benefi t plans
In millions of CHF
2018 2017
EMENA AMS AOA Total EMENA AMS AOA Total
Present value of funded obligations 18 201 4 703 1 518 24 422 20 425 5 247 1 737 27 409
Fair value of plan assets (16 361) (4 968) (1 329) (22 658) (17 675) (5 341) (1 675) (24 691)
Excess of liabilities/(assets) over funded
obligations 1 840 (265) 189 1 764 2 750 (94) 62 2 718
Present value of unfunded obligations 377 1 920 314 2 611 472 2 082 326 2 880
10. Employee benefi ts

Consolidated Financial Statements of the Nestlé Group 2018 111
10.2c Movement in the present value of defi ned benefi t obligations
In millions of CHF
2018 2017
Defi
ned
ben
efi t
reti
rem
ent
pla
ns
Po
st-e
mp
loym
ent
med
ical
ben
efi t
s an
d o
ther
ben
efi t
s
Tota
l
Defi
ned
ben
efi t
reti
rem
ent
pla
ns
Po
st-e
mp
loym
ent
med
ical
ben
efi t
s an
d o
ther
ben
efi t
s
Tota
l
At January 1 28 209 2 080 30 289 27 976 2 073 30 049
of which funded defi ned benefi t plans 27 347 62 27 409 27 201 52 27 253
of which unfunded defi ned benefi t plans 862 2 018 2 880 775 2 021 2 796
Currency retranslations (572) (103) (675) 415 (76) 339
Service cost 680 30 710 689 52 741
of which current service cost 735 53 788 778 57 835
of which past service cost (55) (23) (78) (89) (5) (94)
Interest expense 595 99 694 649 111 760
Actuarial (gains)/losses (1 872) 26 (1 846) 144 56 200
Benefi ts paid on funded defi ned benefi t plans (1 432) (7) (1 439) (1 484) (5) (1 489)
Benefi ts paid on unfunded defi ned benefi t plans (58) (162) (220) (73) (129) (202)
Modifi cation of the scope of consolidation (3) (1) (4) (1) (2) (3)
Reclassifi cation to/(from) held for sale (211) (30) (241) — — —
Transfer from/(to) defi ned contribution plans (235) — (235) (106) — (106)
At December 31 25 101 1 932 27 033 28 209 2 080 30 289
of which funded defi ned benefi t plans 24 364 58 24 422 27 347 62 27 409
of which unfunded defi ned benefi t plans 737 1 874 2 611 862 2 018 2 880
10. Employee benefi ts

Consolidated Financial Statements of the Nestlé Group 2018112
10.2d Movement in fair value of defi ned benefi t plan assets
In millions of CHF
2018 2017
Defi
ned
ben
efi t
reti
rem
ent
pla
ns
Po
st-e
mp
loym
ent
med
ical
ben
efi t
s an
d o
ther
ben
efi t
s
Tota
l
Defi
ned
ben
efi t
reti
rem
ent
pla
ns
Po
st-e
mp
loym
ent
med
ical
ben
efi t
s an
d o
ther
ben
efi t
s
Tota
l
At January 1 (24 656) (35) (24 691) (23 013) (24) (23 037)
Currency retranslations 503 2 505 (326) (1) (327)
Interest income (544) (1) (545) (560) — (560)
Actual return on plan assets, excluding interest income 1 142 — 1 142 (1 685) (9) (1 694)
Employees’ contributions (127) — (127) (141) — (141)
Employer contributions (736) (6) (742) (547) (6) (553)
Benefi ts paid on funded defi ned benefi t plans 1 432 7 1 439 1 484 5 1 489
Administration expenses 24 — 24 21 — 21
Modifi cation of the scope of consolidation 1 — 1 5 — 5
Reclassifi cation to/(from) held for sale 125 — 125 — — —
Transfer (from)/to defi ned contribution plans 211 — 211 106 — 106
At December 31 (22 625) (33) (22 658) (24 656) (35) (24 691)
The major categories of plan assets as a percentage of total plan assets of the Group’s
defi ned benefi t plans are as follows:
2018 2017
Equities 27% 28%
of which US equities 6% 12%
of which European equities 16% 9%
of which other equities 5% 7%
Debts 49% 45%
of which government debts 35% 32%
of which corporate debts 14% 13%
Real estate 12% 11%
Alternative investments 10% 11%
of which hedge funds 6% 7%
of which private equities 4% 4%
Cash/Deposits 2% 5%
Equities and government debts represent 62% ( 2017 : 60% ) of the plan assets. Almost all of
them are quoted in an active market. Corporate debts, real estate, hedge funds and private
equities represent 36% ( 2017 : 35% ) of the plan assets. Almost all of them are either not
quoted or quoted in a market which is not active.
10. Employee benefi ts

Consolidated Financial Statements of the Nestlé Group 2018 113
The plan assets of funded defi ned benefi t plans include property occupied by subsidiaries
with a fair value of CHF 23 million ( 2017 : CHF 23 million ). Furthermore, funded defi ned
benefi t plans may invest in Nestlé S.A. (or related) shares. There was no direct investment
at end of 2018 ( 2017 : CHF 35 million ). The Group’s investment management principles
allow such investment only when the position in Nestlé S.A. (or related) shares is passive,
i.e. in line with the weighting in the underlying benchmark.
The Group expects to contribute CHF 464 million to its funded defi ned benefi t plans
in 2019 .
10.2e Expenses recognized in the income statement
In millions of CHF
2018 2017
Defi
ned
ben
efi t
reti
rem
ent
pla
ns
Po
st-e
mp
loym
ent
med
ical
ben
efi t
s an
d o
ther
ben
efi t
s
Tota
l
Defi
ned
ben
efi t
reti
rem
ent
pla
ns
Po
st-e
mp
loym
ent
med
ical
ben
efi t
s an
d o
ther
ben
efi t
s
Tota
l
Service cost 680 30 710 689 52 741
Employees’ contributions (127) — (127) (141) — (141)
Net interest (income)/expense 53 98 151 90 111 201
Administration expenses 24 — 24 21 — 21
Defi ned benefi t expenses 630 128 758 659 163 822
Defi ned contribution expenses 330 335
Total 1 088 1 157
The expenses for defi ned benefi t and defi ned contribution plans are allocated to the
appropriate headings of expenses by function.
10. Employee benefi ts

Consolidated Financial Statements of the Nestlé Group 2018114
10.2f Remeasurement of defi ned benefi t plans reported in other comprehensive
income
In millions of CHF
2018 2017
Defi
ned
ben
efi t
reti
rem
ent
pla
ns
Po
st-e
mp
loym
ent
med
ical
ben
efi t
s an
d o
ther
ben
efi t
s
Tota
l
Defi
ned
ben
efi t
reti
rem
ent
pla
ns
Po
st-e
mp
loym
ent
med
ical
ben
efi t
s an
d o
ther
ben
efi t
s
Tota
l
Actual return on plan assets, excluding interest income (1 142) — (1 142) 1 685 9 1 694
Experience adjustments on plan liabilities 331 (10) 321 (81) 10 (71)
Change in demographic assumptions on plan liabilities 526 (59) 467 55 (1) 54
Change in fi nancial assumptions on plan liabilities 1 015 43 1 058 (118) (65) (183)
Transfer from/(to) unrecognized assets and other (4) — (4) 19 — 19
Remeasurement of defi ned benefi t plans 726 (26) 700 1 560 (47) 1 513
10.2g Principal fi nancial actuarial assumptions
The principal fi nancial actuarial assumptions are presented by geographic area. Each item
is a weighted average in relation to the relevant underlying component.
2018 2017
EMENA AMS AOA Total EMENA AMS AOA Total
Discount rates 1.8% 5.1% 4.3% 2.9% 1.5% 4.5% 4.4% 2.5%
Expected rates of salary increases 1.8% 2.7% 5.0% 2.6% 1.7% 2.7% 4.6% 2.3%
Expected rates of pension adjustments 1.2% 0.4% 1.4% 1.0% 1.3% 0.4% 1.6% 1.1%
Medical cost trend rates 6.9% 6.9% 5.3% 5.3%
10. Employee benefi ts

Consolidated Financial Statements of the Nestlé Group 2018 115
10.2h Mortality tables and life expectancies by geographic area for Group’s
major defi ned benefi t pension plans
Expressed in years
2018 2017 2018 2017
Country Mortality table
Life expectancy at age 65 for a male member
currently aged 65
Life expectancy at age 65 for a female member
currently aged 65
EMENA
Switzerland LPP 2015 21.6 22.0 23.1 23.9
United Kingdom S2NA 21.8 21.8 23.1 23.1
Germany Heubeck Richttafeln 2018 G 20.6 20.1 24.1 23.6
AMS
USA RP-2014 with projection 20.9 20.9 23.0 23.0
Life expectancy is refl ected in the defi ned benefi t obligations by using mortality tables
of the country in which the plan is located. When those tables no longer refl ect recent
experience, they are adjusted by appropriate loadings.
10. Employee benefi ts

Consolidated Financial Statements of the Nestlé Group 2018116
10.2i Sensitivity analyses on present value of defi ned benefi t obligations
by geographic area
The table below gives the present value of the defi ned benefi t obligations when major
assumptions are changed.
In millions of CHF
2018 2017
EMENA AMS AOA Total EMENA AMS AOA Total
As reported 18 578 6 623 1 832 27 033 20 897 7 329 2 063 30 289
Discount rates
Increase of 50 basis points 17 294 6 265 1 731 25 290 19 308 6 901 1 966 28 175
Decrease of 50 basis points 20 036 7 023 1 947 29 006 22 724 7 815 2 172 32 711
Expected rates of salary increases
Increase of 50 basis points 18 705 6 672 1 863 27 240 21 064 7 390 2 094 30 548
Decrease of 50 basis points 18 461 6 574 1 802 26 837 20 742 7 268 2 035 30 045
Expected rates of pension adjustments
Increase of 50 basis points 19 569 6 650 1 898 28 117 22 074 7 384 2 124 31 582
Decrease of 50 basis points 17 633 6 614 1 814 26 061 20 264 7 291 2 044 29 599
Medical cost trend rates
Increase of 50 basis points 18 579 6 676 1 833 27 088 20 898 7 381 2 065 30 344
Decrease of 50 basis points 18 577 6 581 1 830 26 988 20 896 7 281 2 061 30 238
Mortality assumption
Setting forward the tables by 1 year 17 992 6 484 1 798 26 274 20 205 7 177 2 031 29 413
Setting back the tables by 1 year 19 171 6 758 1 866 27 795 21 600 7 479 2 095 31 174
All sensitivities are calculated using the same actuarial method as for the disclosed
present value of the defi ned benefi t obligations at year-end.
10.2j Weighted average duration of defi ned benefi t obligations
by geographic area
Expressed in years
2018 2017
EMENA AMS AOA Total EMENA AMS AOA Total
At December 31 14.8 12.1 12.2 14.0 16.5 13.0 10.3 15.3
10. Employee benefi ts

Consolidated Financial Statements of the Nestlé Group 2018 117
11. Provisions and contingencies
Provisions
Provisions comprise liabilities of uncertain timing or amount that arise from restructuring
plans, environmental, litigation and other risks. Provisions are recognized when a legal
or constructive obligation stemming from a past event exists and when the future cash
outfl ows can be reliably estimated. Provisions are measured at the present value of the
expenditures unless the impact of discounting is immaterial. Obligations arising from
restructuring plans are recognized when detailed formal plans have been established
and when there is a valid expectation that such plans will be carried out by either starting
to implement them or announcing their main features. Obligations under litigation refl ect
Group Management’s best estimate of the outcome based on the facts known at the
balance sheet date.
Contingent assets and liabilities
Contingent assets and liabilities are possible rights and obligations that arise from past
events and whose existence will be confi rmed only by the occurrence or non-occurrence
of one or more uncertain future events not fully within the control of the Group.
11.1 Provisions
In millions of CHF
Restructuring Environmental Legal and Tax Other Total
At January 1, 2018 929 25 544 468 1 966
Currency retranslations (19) 1 (53) (6) (77)
Provisions made during the year (a) 590 5 322 185 1 102
Amounts used (410) (1) (98) (87) (596)
Reversal of unused amounts (101) (1) (139) (134) (375)
Reclassifi cation (to)/from held for sale (154) — (3) (46) (203)
Modifi cation of the scope of consolidation — — — (4) (4)
At December 31, 2018 835 29 573 376 1 813
of which expected to be settled within 12 months 780
At January 1, 2017 583 27 590 519 1 719
Currency retranslations 19 (1) (13) 4 9
Provisions made during the year (a) 619 2 252 148 1 021
Amounts used (234) (2) (172) (99) (507)
Reversal of unused amounts (58) (1) (131) (103) (293)
Modifi cation of the scope of consolidation — — 18 (1) 17
At December 31, 2017 929 25 544 468 1 966
of which expected to be settled within 12 months 819
(a) Including discounting of provisions.

Consolidated Financial Statements of the Nestlé Group 2018118
Restructuring
Restructuring provisions arise from a number of projects across the Group. These include
plans to optimize production, sales and administration structures, mainly in the geographies
EMENA and AMS. Restructuring provisions are expected to result in future cash outfl ows
when implementing the plans (usually over the following two to three years).
Legal and tax
Legal provisions have been set up to cover legal and administrative proceedings that arise
in the ordinary course of the business. Tax provisions include disputes and uncertainties on
non-income taxes (mainly VAT and sales taxes). It covers numerous separate cases whose
detailed disclosure could be detrimental to the Group interests. The Group does not
believe that any of these cases will have a material adverse impact on its fi nancial position.
The timing of outfl ows is uncertain as it depends upon the outcome of the cases. Group
Management does not believe it is possible to make assumptions on the evolution of the
cases beyond the balance sheet date.
Other
Other provisions are mainly constituted by onerous contracts and various damage claims
having occurred during the year but not covered by insurance companies. Onerous
contracts result from termination of contracts or supply agreements above market prices
in which the unavoidable costs of meeting the obligations under the contracts exceed the
economic benefi ts expected to be received or for which no benefi ts are expected to be
received.
11.2 Contingencies
The Group is exposed to contingent liabilities amounting to a maximum potential
payment of CHF 1860 million ( 2017 : CHF 2024 million ) representing potential litigations
of CHF 1788 million ( 2017 : CHF 1979 million ) and other items of CHF 71 million
( 2017 : CHF 45 million ). Potential litigations relate mainly to labor, civil and tax litigations
in Latin America.
Contingent assets for litigation claims in favor of the Group amount to a maximum
potential recoverable amount of CHF 453 million ( 2017 : CHF 461 million ), mainly in
Latin America.
11. Provisions and contingencies
Consolidated Financial Statements of the Nestlé Group 2018 119
12. Financial instruments
Financial assets – Classes and categories
The classifi cation of fi nancial assets is generally based on the business model in which
a fi nancial asset is managed and its contractual cash fl ow characteristics. The Group
classifi es fi nancial assets in the following categories:
– measured at amortized cost;
– measured at fair value through Other comprehensive income (abbreviated as FVOCI);
and
– measured at fair value through the income statement (abbreviated as FVTPL,
fair value through profi t or loss).
For an equity investment that is not held for trading, the Group may irrevocably elect
to classify it as measured at FVOCI. This election is made at initial recognition on
an investment by investment basis.
Financial assets – Recognition and derecognition
The settlement date is used for initial recognition and derecognition of fi nancial assets
as these transactions are generally under contracts whose terms require delivery
within the time frame established by regulation or convention in the market place
(regular-way purchase or sale). Financial assets are derecognized when substantially
all the Group’s rights to cash fl ows from the fi nancial assets have expired or have been
transferred and the Group has transferred substantially all the risks and rewards of
ownership.
Financial assets – Measurement
Financial assets are initially recognized at fair value plus directly attributable transaction
costs. However when a fi nancial asset measured at FVTPL is recognized, the
transaction costs are expensed immediately. Subsequent remeasurement of fi nancial
assets is determined by their categorization, which is revisited at each reporting date.
Bonds are held in a separate portfolio governed and executed as a prudently managed
broad base of quality securities. The two principal objectives of the portfolio are to
maximize investment income and provide fi nancial stability, subject to a limited risk
tolerance, and to obtain relatively favorable risk adjusted investment returns to achieve
long-term growth of surplus. The Group considers that these securities are held within
a business model whose objective is achieved both by collecting contractual cash fl ows
and by selling securities. The contractual terms of these fi nancial assets give rise on
specifi ed dates to cash fl ows that are solely payments of principal and interest on the
principal amount outstanding. These assets have therefore been classifi ed as fi nancial
assets at FVOCI.
Equity securities represent investments that the Group intends to hold for the long
term for strategic purposes. The Group generally designates these investments at the
date of initial recognition as measured at FVOCI. The accumulated fair value reserve
related to these investments is never reclassifi ed to profi t or loss.

Consolidated Financial Statements of the Nestlé Group 2018120
12. Financial instruments
Commercial paper and time deposits are held by the Group’s treasury unit in a separate
portfolio in order to provide interest income and mitigate the credit risk exposure of the
Group. The Group considers that these investments are held within a business model
whose objective is achieved by collecting contractual cash fl ows. The contractual
terms of these fi nancial assets give rise on specifi ed dates to cash fl ows that are solely
payments of principal and interest on the principal amount outstanding. These assets
have therefore been classifi ed as measured at amortized cost.
Debt funds and equity funds are managed in a separate portfolio dedicated to
self-insurance activities. The shares of funds owned by the Group are puttable shares
which do not qualify for equity instruments as per IAS 32. As a consequence, these
investment funds are classifi ed as at FVTPL.
Financial assets – Impairment
The Group assesses whether its fi nancial assets carried at amortized cost and FVOCI
are impaired on the basis of expected credit losses (ECL). This analysis requires the
identifi cation of signifi cant increases in the credit risk of the counterparties. Considering
that the majority of the Group’s fi nancial assets are trade receivables, the analysis also
integrates statistical data refl ecting the past experience of losses incurred due to default.
See note 7.1 for impairments related to trade receivables.
The Group measures loss allowances for investments in debt securities and time
deposits that are determined to have low credit risk at the reporting date at an amount
equal to 12 month expected credit losses.
The Group considers a debt security to have low credit risk when its credit rating is
“investment grade”, i.e. equivalent to BBB- or higher per Standard & Poor’s rating scale.
To assess whether there is a signifi cant increase in credit risk since initial recognition,
the Group considers available reasonable and supportive information such as changes
in the credit rating of the counterparty. If there is a signifi cant increase in credit risk the
loss allowance is measured at an amount equal to lifetime expected losses.
ECLs are a probability-weighted estimate of credit losses. Credit losses are measured
as the present value of all cash shortfalls due to a credit default event of the counterparty
(i.e. the difference between the cash fl ows due to the entity in accordance with the
contract and the cash fl ows that the Group expects to receive).
Loss allowances for fi nancial assets measured at amortized cost are deducted from
the gross carrying amount of the assets. For debt securities at FVOCI, the loss
allowance is recognized in OCI, instead of reducing the carrying amount of the asset.
Impairment losses on other fi nancial assets related to treasury activities are
presented under Financial expense.
The model and some of the assumptions used in calculating these ECLs are key
sources of estimation uncertainty.

Consolidated Financial Statements of the Nestlé Group 2018 121
Financial liabilities at amortized cost
Financial liabilities are initially recognized at fair value, net of transaction costs incurred.
Subsequent to initial measurement, fi nancial liabilities are recognized at amortized
cost. The difference between the initial carrying amount of the fi nancial liabilities and
their redemption value is recognized in the income statement over the contractual
terms using the effective interest rate method. This category includes the following
classes of fi nancial liabilities: trade and other payables; commercial paper; bonds; lease
liabilities and other fi nancial liabilities.
Financial liabilities at amortized cost are classifi ed as current or non-current depending
whether these are due within 12 months after the balance sheet date or beyond.
Financial liabilities are derecognized (in full or partly) when either the Group is
discharged from its obligation, they expire, are cancelled or replaced by a new liability
with substantially modifi ed terms.
12. Financial instruments

Consolidated Financial Statements of the Nestlé Group 2018122
12. Financial instruments
12.1 Financial assets and liabilities
12.1a By class and by category
In millions of CHF
2018 2017 *
Classes At
amo
rtiz
ed c
ost
(a)
At
fair
val
ue
to in
com
e st
atem
ent
At
fair
val
ue
to
Oth
er c
om
pre
hen
sive
inco
me
Tota
lca
teg
ori
es
Loan
s, r
ecei
vab
les
and
liab
iliti
es a
tam
ort
ized
co
st (a
)
At
fair
val
ue
to in
com
e st
atem
ent
Ava
ilab
le f
or
sale
Tota
lca
teg
ori
es
Cash at bank and in hand 2 552 — — 2 552 2 202 — — 2 202
Commercial paper 4 777 — — 4 777 — — 4 600 4 600
Time deposits 1 426 — — 1 426 — — 1 331 1 331
Bonds and debt funds 128 2 084 3 2 215 — 396 3 778 4 174
Equity and equity funds — 439 50 489 — 428 114 542
Other fi nancial assets 604 805 — 1 409 723 29 995 1 747
Liquid assets (b) and non-current
fi nancial assets 9 487 3 328 53 12 868 2 925 853 10 818 14 596
Trade and other receivables 11 167 — — 11 167 12 036 — — 12 036
Derivative assets (c) — 183 — 183 — 231 — 231
Total fi nancial assets 20 654 3 511 53 24 218 14 961 1 084 10 818 26 863
Trade and other payables (18 190) — — (18 190) (21 340) — — (21 340)
Financial debt (40 394) — — (40 394) (29 777) — — (29 777)
Derivative liabilities (c) — (448) — (448) — (507) — (507)
Total fi nancial liabilities (58 584) (448) — (59 032) (51 117) (507) — (51 624)
Net fi nancial position (37 930) 3 063 53 (34 814) (36 156) 577 10 818 (24 761)
of which at fair value — 3 063 53 3 116 — 577 10 818 11 395
* For the impact of the fi rst application of IFRS 9 refer to Note 22.
(a) Carrying amount of these instruments is a reasonable approximation of their fair value. For bonds included in fi nancial debt,
see Note 12.1d.
(b) Liquid assets are composed of cash and cash equivalents and short-term investments.
(c) Include derivatives held in hedge relationships and those that are undesignated (categorized as held-for-trading),
see Note 12.2d.

Consolidated Financial Statements of the Nestlé Group 2018 123
12. Financial instruments
12.1b Fair value hierarchy of fi nancial instruments
The Group classifi es the fair value of its fi nancial instruments in the following hierarchy,
based on the inputs used in their valuation:
– Level 1: the fair value of fi nancial instruments quoted in active markets is based on
their quoted closing price at the balance sheet date. Examples include exchange-
traded commodity derivatives and fi nancial assets such as investments in equity
and debt securities.
– Level 2: the fair value of fi nancial instruments that are not traded in an active market
is determined by using valuation techniques using observable market data. Such
valuation techniques include discounted cash fl ows, standard valuation models based
on market parameters for interest rates, yield curves or foreign exchange rates, dealer
quotes for similar instruments and use of comparable arm’s length transactions. For
example, the fair value of forward exchange contracts, currency swaps and interest
rate swaps is determined by discounting estimated future cash fl ows.
– Level 3: the fair value of fi nancial instruments that are measured on the basis of entity
specifi c valuations using inputs that are not based on observable market data
(unobservable inputs). When the fair value of unquoted instruments cannot be
measured with suffi cient reliability, the Group carries such instruments at cost less
impairment, if applicable.
In millions of CHF
2018 2017
Derivative assets 36 11
Bonds and debt funds (a) 1 681 735
Equity and equity funds 211 227
Other fi nancial assets 9 42
Derivative liabilities (71) (65)
Prices quoted in active markets (Level 1) 1 866 950
Commercial paper (b) — 4 600
Time deposits (b) — 1 331
Derivative assets 147 220
Bonds and debt funds (c) 396 3 417
Equity and equity funds 224 278
Other fi nancial assets 695 783
Derivative liabilities (377) (442)
Valuation techniques based on observable market data (Level 2) 1 085 10 187
Valuation techniques based on unobservable input (Level 3) (a) 165 258
Total fi nancial instruments at fair value 3 116 11 395
(a) Following the fi rst application of IFRS 9, as at January 1, 2018, an amount of CHF 101 million in level 1 and
CHF 24 million in level 3 of Bonds and debt funds have been taken out from the fi nancial instruments carried
at fair value.
(b) Following the fi rst application of IFRS 9, Commercial paper and Time deposits are now carried at amortized cost.
(c) As at December 31, 2017 the fair value hierarchy included fi nancial assets of CHF 3381 million which were reclassifi ed
as assets held for sale and disposed of during the year. This relates mainly to bonds included in level 2.
There have been no signifi cant transfers between the different hierarchy levels in 2018 .

Consolidated Financial Statements of the Nestlé Group 2018124
12. Financial instruments
12.1c Changes in liabilities arising from fi nancing activities
In millions of CHF
2018 2017
At January 1 (29 962) (26 807)
Currency retranslations and exchange differences 692 (16)
Changes in fair values 132 128
Changes arising from acquisition and disposal of businesses (62) (94)
(Infl ows)/outfl ows on interest derivatives (159) (71)
Increase in lease liabilities (762) (897)
Infl ows from bonds and other non-current fi nancial debt (9 900) (6 406)
Outfl ows from bonds and other non-current fi nancial debt 2 712 3 190
(Infl ows)/outfl ows from current fi nancial debt (3 520) 1 011
Reclassifi cation to liabilities held for sale 199 —
At December 31 (40 630) (29 962)
of which current fi nancial debt (14 694) (11 211)
of which non-current fi nancial debt (25 700) (18 566)
of which derivatives hedging fi nancial debt (236) (185)

Consolidated Financial Statements of the Nestlé Group 2018 125
12. Financial instruments
12.1d Bonds
In millions of CHF
Issuer Face
val
ue
in m
illio
ns
Co
up
on
Eff
ecti
vein
tere
stra
te
Yea
r o
fis
sue/
mat
uri
ty
Co
mm
en
ts
2018 2017
Nestlé S.A., Switzerland CHF 600 0.75% 0.69% 2018–2028 603 —
CHF 900 0.25% 0.26% 2018–2024 899 —
Nestlé Holdings, Inc., USA CHF 250 2.63% 2.66% 2007–2018 — 251
USD 500 1.25% 1.32% 2012–2018 — 488
AUD 175 3.75% 3.84% 2013–2018 — 133
AUD 200 3.88% 4.08% 2013–2018 — 152
AUD 400 4.13% 4.33% 2013–2018 — 305
USD 400 1.38% 1.50% 2013–2018 — 390
USD 500 2.00% 2.17% 2013–2019 492 487
USD 500 2.25% 2.41% 2013–2019 493 487
USD 400 2.00% 2.06% 2014–2019 394 390
USD 650 2.13% 2.27% 2014–2020 640 633
AUD 250 4.25% 4.43% 2014–2020 (a) 177 196
AUD 175 3.63% 3.77% 2014–2020 (a) 125 138
NOK 1 000 2.75% 2.85% 2014–2020 (a) 115 122
GBP 500 1.75% 1.79% 2015–2020 (b) 628 660
USD 550 1.88% 2.03% 2016–2021 541 535
USD 600 1.38% 1.52% 2016–2021 589 583
GBP 500 1.00% 1.17% 2017–2021 (c) 625 654
USD 800 2.38% 2.55% 2017–2022 784 775
USD 650 2.38% 2.50% 2017–2022 639 632
USD 300 2.25% 2.35% 2017–2022 295 292
EUR 850 0.88% 0.92% 2017–2025 (c) 956 989
CHF 550 0.25% 0.24% 2017–2027 (c) 551 551
CHF 150 0.55% 0.54% 2017–2032 (c) 150 150
USD 600 3.13% 3.28% 2018–2023 588 —
USD 1 000 3.10% 3.17% 2018–2021 (d) 984 —
USD 1 500 3.35% 3.41% 2018–2023 (d) 1 475 —
USD 900 3.50% 3.59% 2018–2025 (d) 883 —
USD 1 250 3.63% 3.72% 2018–2028 (d) 1 223 —
USD 1 250 3.90% 4.01% 2018–2038 (d) 1 213 —
USD 2 100 4.00% 4.11% 2018–2048 (d) 2 031 —
Subtotal 18 093 9 993

Consolidated Financial Statements of the Nestlé Group 2018126
12. Financial instruments
In millions of CHF
Issuer Face
val
ue
in m
illio
ns
Co
up
on
Eff
ecti
vein
tere
stra
te
Yea
r o
fis
sue/
mat
uri
ty
Co
mm
en
ts
2018 2017
Subtotal from previous page 18 093 9 993
Nestlé Finance International Ltd., Luxembourg EUR 500 1.50% 1.61% 2012–2019 564 583
EUR 500 1.25% 1.30% 2013–2020 564 583
EUR 500 2.13% 2.20% 2013–2021 563 582
EUR 500 0.75% 0.90% 2014–2021 562 581
EUR 850 1.75% 1.89% 2012–2022 954 986
GBP 400 2.25% 2.34% 2012–2023 (e) 515 549
EUR 500 0.75% 0.92% 2015–2023 (f) 570 586
EUR 500 0.38% 0.54% 2017–2024 559 578
EUR 750 1.25% 1.32% 2017–2029 840 869
EUR 750 1.75% 1.83% 2017–2037 836 865
Other bonds 249 254
Total carrying amount (*) 24 869 17 009
of which due within one year 1 943 1 720
of which due after one year 22 926 15 289
Fair value (*) of bonds, based on prices quoted (level 2) 25 119 17 350
(*) Carrying amount and fair value of bonds exclude accrued interest.
(a) Subject to an interest rate and/or currency swap that creates a liability at fl oating rates in the currency of the issuer.
(b) This bond is composed of:
– GBP 400 million issued in 2015 and subject to an interest rate and currency swap that creates a liability at fi xed rates
in the currency of the issuer; and
– GBP 100 million issued in 2016 and subject to an interest rate and currency swap that creates a liability at fl oating rates
in the currency of the issuer.
(c) Subject to an interest rate and currency swap that creates a liability at fi xed rates in the currency of the issuer.
(d) Sold in the United States only to qualifi ed institutional buyers and outside the United States to non-US persons.
(e) Subject to an interest rate swap.
(f) Out of which EUR 375 million is subject to an interest rate swap.
Several bonds are hedged by currency and/or interest derivatives. The fair value of these
derivatives is shown under derivative assets for CHF 41 million ( 2017 : CHF 144 million ) and
under derivative liabilities for CHF 248 million ( 2017 : CHF 265 million ).

Consolidated Financial Statements of the Nestlé Group 2018 127
12. Financial instruments
12.2 Financial risks
In the course of its business, the Group is exposed to a number of fi nancial risks: credit
risk, liquidity risk, market risk (including foreign currency risk and interest rate risk,
commodity price risk and equity price risk). This note presents the Group’s objectives,
policies and processes for managing its fi nancial risk and capital.
Financial risk management is an integral part of the way the Group is managed. The
Board of Directors determines the fi nancial control principles as well as the principles
of fi nancial planning. The Chief Executive Offi cer organizes, manages and monitors all
fi nancial risks, including asset and liability matters.
The Asset and Liability Management Committee (ALMC), chaired by the Chief Financial
Offi cer, is the governing body for the establishment and subsequent execution of the
Nestlé Group’s Financial Asset and Liability Management Policy. It ensures implementation
of strategies and achievement of objectives of the Group’s fi nancial asset and liabilities
management, which are executed by the Center Treasury, the Regional Treasury Centers
and, in specifi c local circumstances, by the subsidiaries. Approved treasury management
guidelines defi ne and classify risks as well as determine, by category of transaction, specifi c
approval, execution and monitoring procedures. The activities of the Centre Treasury and
of the Regional Treasury Centers are monitored by an independent Middle Offi ce, which
verifi es the compliance of the strategies and/or operations with the approved guidelines
and decisions taken by the ALMC.
12.2a Credit risk
Credit risk managementCredit risk refers to the risk that a counterparty will default on its contractual obligations
resulting in fi nancial loss to the Group. Credit risk arises on fi nancial assets (liquid, non-
current and derivative) and on trade and other receivables.
The Group aims to minimize the credit risk of liquid assets, non-current fi nancial assets
and derivative assets through the application of risk manage ment policies. Credit limits
are set based on each counterparty’s size and risk of default. The methodology used to set
the credit limit considers the counterparty’s balance sheet, credit ratings, risk ratios and
default probabilities. Counterparties are monitored regularly, taking into consideration
the evolution of the above parameters, as well as their share prices and credit default
swaps. As a result of this review, changes on credit limits and risk allocation are carried
out. The Group avoids the concentration of credit risk on its liquid assets by spreading
them over several institutions and sectors.
Trade receivables are subject to credit limits, control and approval procedures in all
the subsidiaries. Due to its large geographic base and number of customers, the Group
is not exposed to material concentrations of credit risk on its trade receivables (see
Note 7.1). Nevertheless, commercial counterparties are constantly monitored following
the similar methodology used for fi nancial counterparties.
The maximum exposure to credit risk resulting from fi nancial activities, without
considering netting agreements and without taking into account any collateral held or
other credit enhancements, is equal to the carrying amount of the Group’s fi nancial assets.

Consolidated Financial Statements of the Nestlé Group 2018128
12. Financial instruments
Credit rating of fi nancial assetsThis includes liquid assets, non-current fi nancial assets and derivative assets. The source
of the credit ratings is Standard & Poor’s; if not available, the Group uses other credit rating
equivalents. The Group deals mainly with fi nancial institutions located in Switzerland, the
European Union and North America.
In millions of CHF
2018 2017
Investment grade A– and above 9 988 10 552
Investment grade BBB+, BBB and BBB– 1 095 2 047
Non-investment grade (BB+ and below) 805 967
Not rated (a) 1 163 1 261
13 051 14 827
(a) Mainly equity securities and other investments for which no credit rating is available.
12.2b Liquidity risk
Liquidity risk managementLiquidity risk is the risk that a company may encounter diffi culties in meeting its obligations
associated with fi nancial liabilities that are settled by delivering cash or other fi nancial assets.
Such risk may result from inadequate market depth or disruption or refi nancing problems.
The Group’s objective is to manage this risk by limiting exposures in fi nancial instruments
that may be affected by liquidity problems and by maintaining suffi cient back-up facilities.
The Group does not expect any refi nancing issues and in October 2018 successfully
extended the tenor of both its revolving credit facilities by around one year:
– A new USD 4.4 billion and EUR 2.7 billion revolving credit facility with an initial maturity
date of November 2019. The Group has the ability to convert the facility into a one year
term loan.
– A USD 3.0 billion and EUR 1.8 billion revolving credit facility with a new maturity date
of October 2023.
The facilities serve primarily as a backstop to the Group’s short-term debt.

Consolidated Financial Statements of the Nestlé Group 2018 129
Contractual maturities of fi nancial liabilities and derivatives (including interest)
In millions of CHF
In t
he
fi rs
t ye
ar
In t
he
seco
nd
yea
r
In t
he
thir
dto
th
e fi
fth
yea
r
Aft
er t
he
fi ft
h y
ear
Co
ntr
actu
al
amo
un
t
Car
ryin
g a
mo
un
t
Trade and other payables (17 800) (58) (303) (29) (18 190) (18 190)
Commercial paper (a) (9 193) — — — (9 193) (9 165)
Bonds (a) (2 510) (2 771) (11 099) (14 293) (30 673) (24 869)
Lease liabilities (788) (637) (1 146) (1 105) (3 676) (3 253)
Other fi nancial debt (3 013) (109) (80) (12) (3 214) (3 107)
Total fi nancial debt (15 504) (3 517) (12 325) (15 410) (46 756) (40 394)
Financial liabilities (excluding derivatives) (33 304) (3 575) (12 628) (15 439) (64 946) (58 584)
Non-currency derivative assets 45 6 12 — 63 62
Non-currency derivative liabilities (83) (6) (2) — (91) (90)
Gross amount receivable from currency derivatives 14 448 1 080 667 1 689 17 884 17 765
Gross amount payable from currency derivatives (14 501) (1 370) (812) (1 835) (18 518) (18 002)
Net derivatives (91) (290) (135) (146) (662) (265)
of which derivatives under cash fl ow hedges (b) (39) (6) (2) — (47) (46)
Trade and other payables (18 864) (135) (115) (2 226) (21 340) (21 340)
Commercial paper (a) (5 727) — — — (5 727) (5 716)
Bonds (a) (2 016) (2 212) (8 627) (5 613) (18 468) (17 009)
Lease liabilities (786) (635) (1 282) (1 155) (3 858) (3 460)
Other fi nancial debt (3 132) (394) (165) (10) (3 701) (3 592)
Total fi nancial debt (11 661) (3 241) (10 074) (6 778) (31 754) (29 777)
Financial liabilities (excluding derivatives) (30 525) (3 376) (10 189) (9 004) (53 094) (51 117)
Non-currency derivative assets 24 8 10 3 45 44
Non-currency derivative liabilities (98) (16) (11) — (125) (124)
Gross amount receivable from currency derivatives 10 497 46 1 831 1 734 14 108 13 983
Gross amount payable from currency derivatives (10 655) (97) (2 112) (1 867) (14 731) (14 179)
Net derivatives (232) (59) (282) (130) (703) (276)
of which derivatives under cash fl ow hedges (b) (111) (16) (11) — (138) (138)
(a) Commercial paper of CHF 7698 million (2017: CHF 4726 million) and bonds of CHF 720 million (2017: CHF 953 million)
have maturities of less than three months.
(b) The periods when the cash fl ow hedges affect the income statement do not differ signifi cantly from the maturities disclosed
above.
12.2c Market risk
The Group is exposed to risk from movements in foreign currency exchange rates, interest
rates and market prices that affect its assets, liabilities and future transactions.
12. Financial instruments
201
82
017

Consolidated Financial Statements of the Nestlé Group 2018130
Foreign currency riskThe Group is exposed to foreign currency risk from transactions and translation.
Transactional exposures arise from transactions in foreign currency. They are managed
within a prudent and systematic hedging policy in accordance with the Group’s specifi c
business needs through the use of currency forwards, futures, swaps and options.
Exchange differences recorded in the income statement represented a loss
of CHF 54 million in 2018 ( 2017 : loss of CHF 94 million ). They are allocated to the
appropriate headings of expenses by function.
Translation exposure arises from the consolidation of the fi nancial statements of foreign
operations in Swiss Francs, which is, in principle, not hedged.
Value at Risk (VaR) based on historic data for a 250-day period and a confi dence level
of 95% results in a potential one-day loss for currency risk of less than CHF 10 million
in 2018 and 2017.
The Group cannot predict the future movements in exchange rates, therefore the above
VaR number neither represents actual losses nor considers the effects of favorable
movements in underlying variables. Accordingly, the VaR number may only be considered
indicative of future movements to the extent the historic market patterns repeat in the
future.
Interest rate riskThe Group is exposed primarily to fl uctuation in USD and EUR interest rates. Interest rate
risk on fi nancial debt is managed based on duration and interest management targets set
by the ALMC through the use of fi xed rate debt and interest rate swaps.
Taking into account the impact of interest derivatives, the proportion of fi nancial debt
subject to fi xed interest rates for a period longer than one year represents 62% ( 2017 : 62% ).
Based on the structure of net debt at year end, an increase of interest rates of 100 basis
points would cause an additional expense in Net fi nancing cost of net debt of CHF 42 million
( 2017 : CHF 29 million ).
Price riskCommodity price riskCommodity price risk arises from transactions on the world commodity markets for
securing the supplies of green coffee, cocoa beans and other commodities necessary
for the manu facture of some of the Group’s products.
The Group’s objective is to minimize the impact of commodity price fl uctuations and
this exposure is hedged in accordance with the Nestlé Group policy on commodity price
risk management. The Global Procurement Organization is responsible for managing
commodity price risk based on internal directives and centrally determined limits,
generally using exchange-traded commodity derivatives. The commodity price risk
exposure of future purchases is managed using a combination of derivatives (mainly
futures and options) and executory contracts. This activity is monitored by an independent
Middle Offi ce. Given the short product business cycle of the Group, the majority of the
anticipated future raw material transactions outstanding at the balance sheet date are
expected to occur in the next year.
Equity price riskThe Group is exposed to equity price risk on investments. To manage the price risk
arising from these investments, the Group diversifi es its portfolios in accordance with
the Guidelines set by the Board of Directors.
12. Financial instruments

Consolidated Financial Statements of the Nestlé Group 2018 131
12.2d Derivative assets and liabilities and hedge accounting
Derivative fi nancial instrumentsThe Group’s derivatives mainly consist of currency forwards, options and swaps;
commodity futures and options; interest rate forwards, futures, options and swaps.
Derivatives are mainly used to manage exposures to foreign exchange, interest rate
and commodity price risk as described in section 12.2c Market risk.
Derivatives are initially recognized at fair value. They are subsequently remeasured
at fair value on a regular basis and at each reporting date as a minimum, with all their
gains and losses, realized and unrealized, recognized in the income statement unless
they are in a qualifying hedging relationship.
Hedge accountingThe Group designates and documents the use of certain derivatives and other fi nancial
assets or fi nancial liabilities as hedging instruments against changes in fair values of
recognized assets and liabilities (fair value hedges) and highly probable forecast
transactions (cash fl ow hedges). The effectiveness of such hedges is assessed at
inception and verifi ed at regular intervals and at least on a quarterly basis to ensure
that an economic relationship exists between the hedged item and hedging instrument.
The Group excludes from the designation of the hedging relationship the hedging
cost element. Subsequently, this cost element impacts the income statement at the
same time as the underlying hedged item.
For the designation of hedging relationships on commodities, the Group applies
the component hedging model when the hedged item is separately identifi able and
measurable in the contract to purchase the materials.
Fair value hedgesThe Group uses fair value hedges to mitigate foreign currency and interest rate risks
of its recognized assets and liabilities, being mostly fi nancial debt.
Changes in fair values of hedging instruments designated as fair value hedges and
the adjustments for the risks being hedged in the carrying amounts of the underlying
transactions are recognized in the income statement.
Cash fl ow hedgesThe Group uses cash fl ow hedges to mitigate a particular risk associated with
a recognized asset or liability or highly probable forecast transactions, such as
anticipated future export sales, purchases of equipment, and goods, as well as the
variability of expected interest payments and receipts.
The effective part of the changes in fair value of hedging instruments is recognized
in other comprehensive income, while any ineffective part is recognized immediately
in the income statement. Ineffectiveness for hedges of foreign currency and commodity
price risk may result from changes in the timing of the forecast transactions than was
originally foreseen. When the hedged item results in the recognition of a non-fi nancial
asset or liability, including acquired businesses, the gains or losses previously recognized
in other comprehensive income are included in the measurement of the cost of the
asset or of the liability. Otherwise the gains or losses previously recognized in other
comprehensive income are recognized in the income statement at the same time
as the hedged transaction.
12. Financial instruments

Consolidated Financial Statements of the Nestlé Group 2018132
Undesignated derivativesDerivatives which are not designated in a hedging relationship are classifi ed as
undesignated derivatives. They are acquired in the frame of approved risk management
policies.
Derivatives by hedged risks
In millions of CHF
2018 2017
Co
ntr
actu
alo
r n
oti
on
alam
ou
nts
Fair
val
ue
asse
ts
Fair
val
ue
liab
iliti
es
Co
ntr
actu
alo
r n
oti
on
alam
ou
nts
Fair
val
ue
asse
ts
Fair
val
ue
liab
iliti
es
Fair value hedges (a)
Foreign currency and interest rate risk on net fi nancial debt 9 435 56 273 7 631 152 292
Cash fl ow hedges
Foreign currency risk on future purchases or sales 7 284 85 78 6 647 62 89
Commodity price risk on future purchases 2 044 37 73 1 488 12 77
Interest rate risk on net fi nancial debt 1 380 — 17 1 368 — 46
Designated in a hedging relationship 20 143 178 441 17 134 226 504
Undesignated derivatives 5 7 5 3
183 448 231 507
Conditional offsets (b)
Derivative assets and liabilities (34) (34) (145) (145)
Use of cash collateral received or deposited (21) (124) (30) (210)
Balances after conditional offsets 128 290 56 152
(a) The carrying amount of the hedged item recognized in the statement of fi nancial position is approximately equal to the
notional of the hedging instruments.
(b) Represent amounts that would be offset in case of default, insolvency or bankruptcy of counterparties.
A description of the types of hedging instruments by risk category is included in
Note 12.2c Market risk.
The majority of hedge relationships are established to ensure a hedge ratio of 1:1.
12. Financial instruments

Consolidated Financial Statements of the Nestlé Group 2018 133
Impact on the income statement of fair value hedgesThe majority of fair value hedges are related to fi nancing activities and are presented in
Net fi nancing cost.
In millions of CHF
2018 2017
on hedged items (145) 377
on hedging instruments 138 (375)
Ineffective portion of gains/(losses) of cash fl ow hedges and net investment hedges is not
signifi cant.
12.2e Capital risk management
The Group’s capital management is driven by the impact on shareholders of the level of
total capital employed. It is the Group’s policy to maintain a sound capital base to support
the continued development of its business.
The Board of Directors seeks to maintain a prudent balance between different
components of the Group’s capital. The ALMC monitors the capital structure and the
net fi nancial debt by currency (see Note 16.5 for the defi nition of net fi nancial debt).
The operating cash fl ow-to-net fi nancial debt ratio highlights the ability of a business
to repay its debts. As at December 31, 2018 , the ratio was 50.8% ( 2017 : 66.4% ). The
Group’s subsidiaries have complied with local statutory capital requirements as
appropriate.
12. Financial instruments

Consolidated Financial Statements of the Nestlé Group 2018134
13. Taxes
The Group is subject to taxes in different countries all over the world. Taxes and fi scal
risks recognized in the Consolidated Financial Statements refl ect Group Management’s
best estimate of the outcome based on the facts known at the balance sheet date in
each individual country. These facts may include but are not limited to change in tax
laws and interpretation thereof in the various jurisdictions where the Group operates.
They may have an impact on the income tax as well as the resulting assets and
liabilities. Any differences between tax estimates and fi nal tax assessments are
charged to the income statement in the period in which they are incurred, unless
anticipated.
Taxes include current and deferred taxes on profi t as well as actual or potential
withholding taxes on current and expected transfers of income from subsidiaries and
tax adjustments relating to prior years. Income tax is recognized in the income
statement, except to the extent that it relates to items directly taken to equity or other
comprehensive income, in which case it is recognized against equity or other
comprehensive income.
Deferred taxes are based on the temporary differences that arise when taxation
authorities recognize and measure assets and liabilities with rules that differ from the
principles of the Consolidated Financial Statements. They also arise on temporary
differences stemming from tax losses carried forward.
Deferred taxes are calculated under the liability method at the rates of tax expected
to prevail when the temporary differences reverse subject to such rates being
substantially enacted at the balance sheet date. Any changes of the tax rates are
recognized in the income statement unless related to items directly recognized against
equity or other comprehensive income. Deferred tax liabilities are recognized on all
taxable temporary differences excluding non-deductible goodwill. Deferred tax assets
are recognized on all deductible temporary differences provided that it is probable that
future taxable income will be available.

Consolidated Financial Statements of the Nestlé Group 2018 135
13. Taxes
13.1 Taxes recognized in the income statement
In millions of CHF
2018 2017
Components of taxes
Current taxes (a) (4 003) (3 352)
Deferred taxes (b) 545 202
Taxes reclassifi ed to other comprehensive income 22 361
Taxes reclassifi ed to equity (3) 16
Total taxes (3 439) (2 773)
Reconciliation of taxes
Expected tax expense at weighted average applicable tax rate (2 925) (3 115)
Tax effect of non-deductible or non-taxable items (110) (94)
Prior years’ taxes 108 248
Transfers to unrecognized deferred tax assets (129) (131)
Transfers from unrecognized deferred tax assets 95 18
Changes in tax rates (b) (6) 792
Withholding taxes levied on transfers of income (472) (491)
Total taxes (3 439) (2 773)
(a) Current taxes related to prior years include a tax income of CHF 250 million (2017: tax income of CHF 212 million).
(b) In 2017, this item includes a one-time income of CHF 0.8 billion related to deferred tax, arising in the USA, in accordance
with the Federal tax reform.
The expected tax expense at weighted average applicable tax rate is the result from
applying the domestic statutory tax rates to profi ts before taxes of each entity in the country
it operates. For the Group, the weighted average applicable tax rate varies from one year
to the other depending on the relative weight of the profi t of each individual entity in the
Group’s profi t as well as the changes in the statutory tax rates.

Consolidated Financial Statements of the Nestlé Group 2018136
13.2 Reconciliation of deferred taxes by type of temporary differences
recognized on the balance sheet
In millions of CHF
Pro
pert
y, p
lan
t
an
d e
qu
ipm
en
t
Go
od
will an
d
inta
ng
ible
assets
Em
plo
yee
ben
efi ts
Inven
tori
es,
receiv
ab
les,
payab
les a
nd
pro
vis
ion
s
Un
used
tax lo
sses
an
d u
nu
sed
tax c
red
its
Oth
er
Tota
l
At January 1, 2018 (1 245) (2 895) 1 482 1 102 380 (213) (1 389)
Currency retranslations 37 4 (46) (42) (34) (38) (119)
Deferred tax (expense)/income (130) 431 (45) 78 103 108 545
Reclassifi cation (to)/from held for sale — 678 (19) (127) (141) 17 408
Modifi cation of the scope of consolidation (2) (169) — — 8 10 (153)
Other movements (22) — — — — 6 (16)
At December 31, 2018 (1 362) (1 951) 1 372 1 011 316 (110) (724)
At January 1, 2017 (1 635) (3 248) 2 049 1 189 340 (271) (1 576)
Currency retranslations 26 70 (19) (15) (10) 6 58
Deferred tax (expense)/income 352 384 (548) (80) 44 50 202
Modifi cation of the scope of consolidation 12 (101) — 8 6 2 (73)
At December 31, 2017 (1 245) (2 895) 1 482 1 102 380 (213) (1 389)
In millions of CHF
2018 2017
Refl ected in the balance sheet as follows:
Deferred tax assets 1 816 2 103
Deferred tax liabilities (2 540) (3 492)
Net assets/(liabilities) (724) (1 389)
13.3 Unrecognized deferred taxes
The deductible temporary differences as well as the unused tax losses and tax credits for
which no deferred tax assets are recognized expire as follows:
In millions of CHF
2018 2017
Within one year 69 177
Between one and fi ve years 381 431
More than fi ve years 2 383 2 602
2 833 3 210
At December 31, 2018 , the unrecognized deferred tax assets amount to CHF 579 million
( 2017 : CHF 655 million ). In addition, the Group has not recognized deferred tax liabilities
in respect of unremitted earnings that are considered indefi nitely reinvested in foreign
subsidiaries. At December 31, 2018 , these earnings amount to CHF 26.3 billion
( 2017 : CHF 25.2 billion ). They could be subject to withholding and other taxes on remittance.
13. Taxes

Consolidated Financial Statements of the Nestlé Group 2018 137
14. Associates and joint ventures
Associates are companies where the Group has the power to exercise a signifi cant
infl uence but does not exercise control. Signifi cant infl uence may be obtained when
the Group has 20% or more of the voting rights in the investee or has obtained a seat
on the Board of Directors or otherwise participates in the policy-making process of
the investee.
Joint ventures are contractual arrangements over which the Group exercises joint
control with partners and where the parties have rights to the net assets of the
arrangement.
Associates and joint ventures are accounted for using the equity method. The
interest in the associate or joint venture also includes long-term loans which are in
substance extensions of the Group’s investment in the associate or joint venture. The
net assets and results are adjusted to comply with the Group’s accounting policies.
The carrying amount of goodwill arising from the acquisition of associates and joint
ventures is included in the carrying amount of investments in associates and joint
ventures.
In millions of CHF
2018 2017
L’OréalOther
associatesJoint
ventures Total L’OréalOther
associatesJoint
ventures Total
At January 1 8 184 1 198 2 246 11 628 7 453 1 183 2 073 10 709
Currency retranslations (271) (32) (54) (357) 632 44 125 801
Investments — 204 46 250 — 148 45 193
Divestments — (3) (978) (981) — (5) (52) (57)
Share of results 1 044 (152) 27 919 927 (145) 46 828
Share of other comprehensive income 127 1 (32) 96 (298) — 110 (188)
Dividends and interest received (553) (33) (117) (703) (465) (27) (90) (582)
Other (72) — 12 (60) (65) — (11) (76)
At December 31 8 459 1 183 1 150 10 792 8 184 1 198 2 246 11 628
Investments in joint ventures mainly relate to Froneri (see Note 14.3).
As part of the investment, loans granted by the Group to joint ventures amount
to CHF 932 million at December 31, 2018 ( 2017 : CHF 1841 million ).
Income from associates and joint ventures
In millions of CHF
2018 2017
Share of results 919 828
Loss on disposals (3) (4)
916 824

Consolidated Financial Statements of the Nestlé Group 2018138
14.1 Associate – L’Oréal
The Group holds 129 881 021 shares in L’Oréal (whose ultimate parent company is
domiciled in France), the world leader in cosmetics, representing a 23.2% participation
in its equity after elimination of its treasury shares ( 2017 : 129 881 021 shares representing
a 23.2% participation).
At December 31, 2018 , the market value of the shares held amounts to CHF 29.5 billion
( 2017 : CHF 28.0 billion ).
Summarized fi nancial information of L’Oréal
In billions of CHF
2018 2017
Total current assets 14.0 12.9
Total non-current assets 29.3 28.4
Total assets 43.3 41.3
Total current liabilities 11.4 10.7
Total non-current liabilities 1.6 1.6
Total liabilities 13.0 12.3
Total equity 30.3 29.0
Total sales 31.1 29.0
Profi t from continuing operations 4.5 4.3
Profi t from discontinued operations – (0.3)
Other comprehensive income 0.5 (1.3)
Total comprehensive income 5.0 2.7
Reconciliation of the carrying amount
In billions of CHF
2018 2017
Share held by the Group in the equity of L’Oréal 7.1 6.7
Goodwill and other adjustments 1.4 1.5
Carrying amount of L’Oréal 8.5 8.2
14.2 Other associates
The Group holds a number of other associates that are individually not material.
14. Associates and joint ventures

Consolidated Financial Statements of the Nestlé Group 2018 139
14.3 Joint ventures
The Group holds a number of joint ventures operating in the food and beverage sectors.
These joint ventures are individually not signifi cant to the Group, the main ones being
Froneri and Cereal Partners Worldwide.
A list of the principal joint ventures and associates is provided in the section Companies
of the Nestlé Group, joint arrangements and associates.
15. Earnings per share
2018 2017
Basic earnings per share (in CHF) 3.36 2.31
Net profi t (in millions of CHF) 10 135 7 156
Weighted average number of shares outstanding (in millions of units) 3 014 3 092
Diluted earnings per share (in CHF) 3.36 2.31
Net profi t, net of effects of dilutive potential ordinary shares (in millions of CHF) 10 135 7 156
Weighted average number of shares outstanding, net of effects of dilutive potential ordinary shares
(in millions of units) 3 019 3 098
Reconciliation of weighted average number of shares outstanding (in millions of units)
Weighted average number of shares outstanding used to calculate basic earnings per share 3 014 3 092
Adjustment for share-based payment schemes, where dilutive 5 6
Weighted average number of shares outstanding used to calculate diluted earnings per share 3 019 3 098
14. Associates and joint ventures

Consolidated Financial Statements of the Nestlé Group 2018140
16. Cash fl ow statement
16.1 Operating profi t
In millions of CHF
2018 2017
Profi t for the year 10 468 7 511
Income from associates and joint ventures (916) (824)
Taxes 3 439 2 773
Financial income (247) (152)
Financial expense 1 008 848
13 752 10 156
16.2 Non-cash items of income and expense
In millions of CHF
2018 2017
Depreciation of property, plant and equipment 3 604 3 560
Impairment of property, plant and equipment 500 391
Impairment of goodwill 592 3 033
Amortization of intangible assets 320 374
Impairment of intangible assets 156 158
Net result on disposal of businesses (686) 132
Net result on disposal of assets 53 28
Non-cash items in fi nancial assets and liabilities (42) (380)
Equity compensation plans 140 146
Other (14) 20
4 623 7 462
16.3 Decrease/(increase) in working capital
In millions of CHF
2018 2017
Inventories (450) (839)
Trade and other receivables (547) (52)
Prepayments and accrued income 132 (55)
Trade and other payables 1 043 522
Accruals and deferred income 294 180
472 (244)

Consolidated Financial Statements of the Nestlé Group 2018 141
16.4 Variation of other operating assets and liabilities
In millions of CHF
2018 2017
Variation of employee benefi ts assets and liabilities (430) (71)
Variation of provisions 127 220
Other 266 212
(37) 361
16.5 Reconciliation of free cash fl ow and net fi nancial debt
In millions of CHF
2018 2017
Operating cash fl ow 15 398 14 199
Capital expenditure (3 869) (3 938)
Expenditure on intangible assets (601) (769)
Other investing activities (163) (134)
Free cash fl ow 10 765 9 358
Acquisition of businesses (9 512) (696)
Financial liabilities and short-term investments acquired in business combinations (67) (94)
Disposal of businesses 4 310 140
Financial liabilities and short-term investments transferred on disposal of businesses 5 —
Acquisition (net of disposal) of non-controlling interests (528) (526)
Investments (net of divestments) in associates and joint ventures 728 (140)
Dividend paid to shareholders of the parent (7 124) (7 126)
Dividends paid to non-controlling interests (319) (342)
Purchase (net of sale) of treasury shares (6 854) (3 295)
Increase in lease liabilities (762) (897)
Currency retranslations and exchange differences 389 (285)
Other movements 8 45
(Increase)/decrease of net fi nancial debt (8 961) (3 858)
Net fi nancial debt at beginning of year (21 369) (17 511)
Net fi nancial debt at end of year (30 330) (21 369)
of which
Current fi nancial debt (14 694) (11 211)
Non-current fi nancial debt (25 700) (18 566)
Cash and cash equivalents 4 500 7 938
Short-term investments 5 801 655
Derivatives (a) (237) (185)
(a) Related to Net debt and included in Derivative assets and Derivative liabilities balances of the Consolidated balance sheet.
16. Cash fl ow statement

Consolidated Financial Statements of the Nestlé Group 2018142
16.6 Cash and cash equivalents at end of year
Cash and cash equivalents include cash at bank and in hand and other short-term highly
liquid investments with maturities of three months or less from the initial recognition.
In millions of CHF
2018 2017
Cash at bank and in hand 2 552 2 202
Time deposits 1 408 1 330
Commercial paper 540 4 406
Cash and cash equivalents as per balance sheet 4 500 7 938
Cash and cash equivalents classifi ed as held for sale 140 —
Cash and cash equivalents as per cash fl ow statement 4 640 7 938
16. Cash fl ow statement

Consolidated Financial Statements of the Nestlé Group 2018 143
17. Equity
17.1 Share capital issued
The ordinary share capital of Nestlé S.A. issued and fully paid is composed of 3 063 000 000
registered shares with a nominal value of CHF 0.10 each ( 2017 : 3 112 160 000 registered
shares). Each share confers the right to one vote. No shareholder may be registered with
the right to vote for shares which it holds, directly or indirectly, in excess of 5% of the share
capital. Shareholders have the right to receive dividends.
In 2018 , the share capital changed as a consequence of the Share Buy-Back Program
launched in July 2017. The cancellation of shares was approved at the Annual General
Meeting of April 12, 2018. The share capital was reduced by 49 160 000 shares from
CHF 311 million to CHF 306 million .
Started in July 2017, a Share Buy-Back Program of up to CHF 20 billion to be completed
by the end of June 2020 was still on going at the date of issuance of the Consolidated
Financial Statements. It is subject to market conditions and strategic opportunities.
17.2 Conditional share capital
The conditional capital of Nestlé S.A. amounts to CHF 10 million as in the preceding year.
It confers the right to increase the ordinary share capital, through the exercise of conversion
or option rights granted in connection with convertible debentures or debentures with
option rights or other fi nancial market instruments, by the issue of a maximum
of 100 000 000 registered shares with a nominal value of CHF 0.10 each. Thus, the Board
of Directors has at its disposal a fl exible instrument enabling it, if necessary, to fi nance
the activities of the Company through convertible debentures.
17.3 Treasury shares
Number of shares in millions of units
2018 2017
Purpose of holding
Trading — 4.2
Share Buy-Back Program 78.7 41.6
Long-Term Incentive Plans 9.8 8.8
88.5 54.6
At December 31, 2018 , the treasury shares held by the Group represent 2.9% of the
share capital ( 2017 : 1.8% ). Their market value amounts to CHF 7064 million
( 2017 : CHF 4576 million ).

Consolidated Financial Statements of the Nestlé Group 2018144
17.4 Number of shares outstanding
Number of shares in millions of units
Sharesissued
Treasuryshares
Outstandingshares
At January 1, 2018 3 112.2 (54.6) 3 057.6
Purchase of treasury shares — (86.3) (86.3)
Treasury shares delivered in respect of options exercised — 1.2 1.2
Treasury shares delivered in respect of equity compensation plans — 2.0 2.0
Treasury shares cancelled (49.2) 49.2 —
At December 31, 2018 3 063.0 (88.5) 2 974.5
At January 1, 2017 3 112.2 (14.2) 3 098.0
Purchase of treasury shares — (43.6) (43.6)
Treasury shares delivered in respect of options exercised — 0.9 0.9
Treasury shares delivered in respect of equity compensation plans — 2.3 2.3
At December, 31 2017 3 112.2 (54.6) 3 057.6
17.5 Translation reserve and other reserves
The translation reserve and the other reserves represent the cumulative amount attributable
to shareholders of the parent of items that may be reclassifi ed subsequently to the income
statement.
The translation reserve comprises the cumulative gains and losses arising from
translating the fi nancial statements of foreign operations that use functional currencies
other than Swiss Francs. It also includes the changes in the fair value of hedging
instruments used for net investments in foreign operations.
The other reserves mainly comprise our share in the items that may be reclassifi ed
subsequently to the income statement by the associates and joint ventures (reserves
equity accounted for).
The other reserves also comprise the hedging reserve of the subsidiaries. The hedging
reserve consists of the effective portion of the gains and losses on hedging instruments
related to hedged transactions that have not yet occurred.
17.6 Retained earnings
Retained earnings represent the cumulative profi ts as well as remeasurement of defi ned
benefi t plans attributable to shareholders of the parent.
17. Equity

Consolidated Financial Statements of the Nestlé Group 2018 145
17.7 Non-controlling interests
The non-controlling interests comprise the portion of equity of subsidiaries that are not
owned, directly or indirectly, by Nestlé S.A. These non-controlling interests are individually
not material for the Group.
17.8 Other comprehensive income
In millions of CHF
Tran
sla
tio
n
reserv
e
Fair
valu
e
reserv
es
Hed
gin
g
reserv
es
Reserv
es
of
asso
cia
tes a
nd
join
t ven
ture
s
Reta
ined
earn
ing
s
Tota
l eq
uit
yat
trib
uta
ble
to
shar
eho
lder
s o
f th
e p
aren
t
No
n-c
on
tro
llin
g
inte
rests
Tota
l eq
uit
y
Currency retranslations
– Recognized (1 092) (1) 2 3 — (1 088) (115) (1 203)
– Reclassifi ed to income statement 108 — — — — 108 — 108
– Taxes 91 — — — — 91 — 91
(893) (1) 2 3 — (889) (115) (1 004)
Fair value changes on debt and equity instruments
– Recognized — (203) — — 4 (199) — (199)
– Reclassifi ed to income statement — 153 — — — 153 — 153
– Taxes — 11 — — — 11 — 11
— (39) — — 4 (35) — (35)
Fair value changes on cash fl ow hedges
– Recognized — — 26 — — 26 6 32
– Reclassifi ed to income statement — — 40 — — 40 (4) 36
– Taxes — — (22) — — (22) — (22)
— — 44 — — 44 2 46
Remeasurement of defi ned benefi t plans
– Recognized — — — — 703 703 (3) 700
– Taxes — — — — (101) (101) 1 (100)
— — — — 602 602 (2) 600
Share of other comprehensive income of associates
and joint ventures
– Recognized — — — (32) 117 85 — 85
– Reclassifi ed to income statement — — — 11 — 11 — 11
— — — (21) 117 96 — 96
Other comprehensive income for the year (893) (40) 46 (18) 723 (182) (115) (297)
17. Equity
201
8

Consolidated Financial Statements of the Nestlé Group 2018146
In millions of CHF
Tran
sla
tio
n
reserv
e
Fair
valu
e
reserv
es
Hed
gin
g
reserv
es
Reserv
es
of
asso
cia
tes a
nd
join
t ven
ture
s
Reta
ined
earn
ing
s
Tota
l eq
uit
yat
trib
uta
ble
to
shar
eho
lder
s o
f th
e p
aren
t
No
n-c
on
tro
llin
g
inte
rests
Tota
l eq
uit
y
Currency retranslations
– Recognized (729) — (1) 95 — (635) (18) (653)
– Reclassifi ed to income statement — — — — — — — —
– Taxes 92 — — — — 92 — 92
(637) — (1) 95 — (543) (18) (561)
Fair value changes on available-for-sale fi nancial
instruments
– Recognized — 135 — — — 135 — 135
– Reclassifi ed to income statement — (136) — — — (136) — (136)
– Taxes — (9) — — — (9) — (9)
— (10) — — — (10) — (10)
Fair value changes on cash fl ow hedges
– Recognized — — (225) — — (225) (5) (230)
– Reclassifi ed to income statement — — 166 — — 166 3 169
– Taxes — — 6 — — 6 — 6
— — (53) — — (53) (2) (55)
Remeasurement of defi ned benefi t plans
– Recognized — — — — 1 524 1 524 (11) 1 513
– Taxes — — — — (454) (454) 4 (450)
— — — — 1 070 1 070 (7) 1 063
Share of other comprehensive income of associates
and joint ventures
– Recognized — — — (240) 52 (188) — (188)
– Reclassifi ed to income statement — — — — — — — —
— — — (240) 52 (188) — (188)
Other comprehensive income for the year (637) (10) (54) (145) 1 122 276 (27) 249
17. Equity
201
7

Consolidated Financial Statements of the Nestlé Group 2018 147
17.9 Reconciliation of the other reserves
In millions of CHF
Fair
valu
e
reserv
es
Hed
gin
g
reserv
es
Reserv
es
of
asso
cia
tes a
nd
join
t ven
ture
s
Tota
l
At January 1, 2018 36 (69) 1 022 989
First application of IFRS 9 4 (4) (1 170) (1 170)
Other comprehensive income for the year (40) 46 (18) (12)
Other movements — 10 — 10
At December 31, 2018 — (17) (166) (183)
At January 1, 2017 46 (15) 1 167 1 198
Other comprehensive income for the year (10) (54) (145) (209)
At December 31, 2017 36 (69) 1 022 989
17.10 Dividend
In accordance with Swiss law, the dividend is treated as an appropriation of profi t in
the year in which it is ratifi ed at the Annual General Meeting and subsequently paid.
The dividend related to 2017 was paid on April 18, 2018, in accordance with the decision
taken at the Annual General Meeting on April 12, 2018. Shareholders approved the proposed
dividend of CHF 2.35 per share, resulting in a total dividend of CHF 7124 million .
Dividend payable is not accounted for until it has been ratifi ed at the Annual General
Meeting. At the Annual General Meeting on April 11, 2019, a dividend of CHF 2.45 per share
will be proposed, resulting in an estimated total dividend of CHF 7311 million . For further
details, refer to the Financial Statements of Nestlé S.A.
The Consolidated Financial Statements for the year ended December 31, 2018 , do not
refl ect this proposed distribution, which will be treated as an appropriation of profi t in
the year ending December 31, 2019 .
17. Equity

Consolidated Financial Statements of the Nestlé Group 2018148
18. Transactions with related parties
18.1 Compensation of the Board of Directors and the Executive Board
Board of Directors
Members of the Board of Directors receive an annual compensation that varies with
the Board and the Committee responsibilities as follows:
– Board members: CHF 280 000;
– members of the Chairman’s and Corporate Governance Committee: additional
CHF 200 000 (Chair CHF 300 000);
– members of the Compensation Committee as well as members of the Nomination
and Sustainability Committee: additional CHF 70 000 (Chair CHF 150 000); and
– members of the Audit Committee: additional CHF 100 000 (Chair CHF 150 000).
The Chairman and the CEO Committee fees are included in their total compensation.
Half of the compensation is paid through the granting of Nestlé S.A. shares at the
ex-dividend closing price. These shares are subject to a three-year blocking period.
With the exception of the Chairman and the CEO, members of the Board of Directors
also receive an annual expense allowance of CHF 15 000 each. This allowance covers
travel and hotel accommodation in Switzerland, as well as sundry out-of-pocket expenses.
For Board members from outside Europe, the Company reimburses additionally their
airline tickets. When the Board meets outside of Switzerland, all expenses are borne
and paid directly by the Company.
The Chairman is entitled to cash compensation, as well as Nestlé S.A. shares which
are blocked for three years.
In millions of CHF
2018 2017
Chairman's compensation 4 5
Other Board members
Remuneration – cash 3 3
Shares 2 2
Total (a) 9 10
(a) For the detailed disclosures regarding the remunerations of the Board of Directors that are required by Swiss law, refer to
the Compensation report of Nestlé S.A. with the audited sections highlighted with a blue bar.

Consolidated Financial Statements of the Nestlé Group 2018 149
Executive Board
The total annual remuneration of the members of the Executive Board comprises a salary,
a bonus (based on the individual’s performance and the achievement of the Group’s
objectives), equity compensation and other benefi ts. Members of the Executive Board can
choose to receive part or all of their bonus in Nestlé S.A. shares at the average closing
price of the last ten trading days of January of the year of the payment of the bonus. The
CEO has to take a minimum of 50% in shares. These shares are subject to a three-year
blocking period.
In millions of CHF
2018 2017
Remuneration – cash 15 15
Bonus – cash 9 8
Bonus – shares 7 5
Equity compensation plans (a) 15 14
Pension 4 3
Total (b) 50 45
(a) Equity compensation plans are equity-settled share-based payment transactions whose cost is recognized over the vesting
period as required by IFRS 2.
(b) For the detailed disclosures regarding the remunerations of the Executive Board that are required by Swiss law, refer to the
Compensation report of Nestlé S.A. with the audited sections highlighted with a blue bar.
18.2 Transactions with associates and joint ventures
The main transactions with associates and joint ventures are:
– royalties received on brand licensing;
– dividends and interest received as well as loans granted (see Note 14);
– research and development commitments (see Note 9); and
– in-licensing and intellectual property purchase (see Note 9).
18.3 Other transactions
Nestlé Capital Advisers S.A. (NCA), one of the Group’s subsidiaries, is an unregulated
investment and actuarial adviser based in Switzerland. As from end of June 2018, NCA
stopped servicing Group’s Pension Funds and has concentrated on implementing the
Pension Strategy for Nestlé. The fees received by NCA in 2018 amounted to CHF 1.7 million
( 2017 : CHF 9 million ).
As from May 1, 2018, Robusta Asset Management Ltd (RAML), a 100% subsidiary
of NCA, has stopped its operations and entered into a liquidation process. No fee income
was generated by RAML during 2018.
For information regarding the Group’s pension plans, which are considered as related
parties, please refer to Note 10 Employee benefi ts.
Furthermore, throughout 2018, no director of the Group had a personal interest in any
transaction of signifi cance for the business of the Group.
18. Transactions with related parties
Consolidated Financial Statements of the Nestlé Group 2018150
19. Guarantees
At December 31, 2018 and December 31, 2017 , the Group has no signifi cant guarantees
given to third parties.
20. Effects of hyperinfl ation
The Group considers that Argentina became a hyperinfl ationary economy on July 1, 2018,
when the cumulative three-year increase in the Consumer Price Index exceeded 100%.
Consequentially, the Group has applied for the fi rst time IAS 29 Financial Reporting in
Hyperinfl ationary Economies to its subsidiaries in Argentina as from January 1, 2018.
This resulted in a reduction of the 12-month sales by CHF 46 million, and a loss of
CHF 12 million due to the loss in purchasing power of the net monetary position which
was recognized in Other operating expenses. An initial impact of CHF 73 million due to
the restatement of the non-monetary assets and liabilities with the price index at the
beginning of the period was recorded in equity.
Venezuela continues to be considered a hyperinfl ationary economy. The impact of the
adjustment on the 2018 Group Consolidated Financial Statements was not signifi cant.
21. Events after the balance sheet date
The values of assets and liabilities at the balance sheet date are adjusted if there is
evidence that subsequent adjusting events warrant a modifi cation of these values.
These adjustments are made up to the date of approval of the Consolidated Financial
Statements by the Board of Directors.
At February 13, 2019, the date of approval for issue of the Consolidated Financial
Statements by the Board of Directors, the Group has no subsequent events which either
warrant a modification of the value of its assets and liabilities or any additional disclosure.
22. Restatements of 2017 comparatives and fi rst application
of IFRS 9
As described in Note 1 Accounting policies, comparative fi gures have been restated
following the application of IFRS 15, IFRS 16, IFRIC 23 as well as some other changes in
presentation and in accounting policies. Impacts on the income statement, statement of
comprehensive income, cash fl ow statement and balance sheet are presented thereafter.

Consolidated Financial Statements of the Nestlé Group 2018 151
Consolidated income statement for the year ended December 31, 2017
In millions of CHF
January–December
2017 as originally
published IFRS 15 IFRS 16 Other
January–
December
2017 restated
Sales 89 791 (169) – (32) 89 590
Other revenue 330 2 – – 332
Cost of goods sold (44 923) 1 9 (658) (45 571)
Distribution expenses (8 205) 159 44 (21) (8 023)
Marketing and administration expenses (20 540) 6 28 688 (19 818)
Research and development costs (1 724) – 1 (16) (1 739)
Other trading income 111 – 1 – 112
Other trading expenses (1 607) – 1 – (1 606)
Trading operating profi t 13 233 (1) 84 (39) 13 277
Other operating income 379 – – – 379
Other operating expenses (3 500) – – – (3 500)
Operating profi t 10 112 (1) 84 (39) 10 156
Financial income 152 – – – 152
Financial expense (771) – (77) – (848)
Profi t before taxes, associates and joint ventures 9 493 (1) 7 (39) 9 460
Taxes (2 779) (24) (9) 39 (2 773)
Income from associates and joint ventures 824 – – – 824
Profi t for the year 7 538 (25) (2) – 7 511
of which attributable to non-controlling interests 355 – – – 355
of which attributable to shareholders of the parent
(Net profi t) 7 183 (25) (2) – 7 156
As percentages of sales
Trading operating profi t 14.7% +3 bps +9 bps –4 bps 14.8%
Profi t for the year attributable to shareholders of the parent
(Net profi t) 8.0% –1 bps 0 bps 0 bps 8.0%
Earnings per share (in CHF)
Basic earnings per share 2.32 (0.01) – – 2.31
Diluted earnings per share 2.32 (0.01) – – 2.31
22. Restatements of 2017 comparatives and fi rst application of IFRS 9

Consolidated Financial Statements of the Nestlé Group 2018152
Consolidated statement of comprehensive income for the year ended December 31, 2017
In millions of CHF
January–December
2017 as originally
published IFRS 15 IFRS 16 Other
January–
December
2017 restated
Profi t for the year recognized in the income statement 7 538 (25) (2) – 7 511
Currency retranslations, net of taxes (558) (2) (1) – (561)
Fair value adjustments on available-for-sale fi nancial
instruments, net of taxes (10) – – – (10)
Fair value adjustments on cash fl ow hedges, net of taxes (55) – – – (55)
Share of other comprehensive income of associates
and joint ventures (240) – – – (240)
Items that are or may be reclassifi ed subsequently
to the income statement (863) (2) (1) – (866)
Remeasurement of defi ned benefi t plans, net of taxes 1 063 – – – 1 063
Share of other comprehensive income of associates
and joint ventures 52 – – – 52
Items that will never be reclassifi ed to the income statement 1 115 – – – 1 115
Other comprehensive income for the year 252 (2) (1) – 249
Total comprehensive income for the year 7 790 (27) (3) – 7 760
of which attributable to non-controlling interests 328 – – – 328
of which attributable to shareholders of the parent 7 462 (27) (3) – 7 432
22. Restatements of 2017 comparatives and fi rst application of IFRS 9

Consolidated Financial Statements of the Nestlé Group 2018 153
Consolidated cash fl ow statement for the year ended December 31, 2017
In millions of CHF
January–December
2017 as originally
published IFRS 15 IFRS 16 Other
January–
December
2017 restated
Operating activities
Operating profi t 10 112 (1) 84 (39) 10 156
Depreciation and amortization 3 227 – 707 – 3 934
Impairment 3 557 – 25 – 3 582
Net result on disposal of businesses 132 – – – 132
Other non-cash items of income and expense (185) – (1) – (186)
Cash fl ow before changes in operating assets and liabilities 16 843 (1) 815 (39) 17 618
Decrease/(increase) in working capital (243) 1 (3) 1 (244)
Variation of other operating assets and liabilities 393 – (32) – 361
Cash generated from operations 16 993 – 780 (38) 17 735
Net cash fl ows from treasury activities (423) – (75) 8 (490)
Taxes paid (3 666) – – 38 (3 628)
Dividends and interest from associates and joint ventures 582 – – – 582
Operating cash fl ow 13 486 – 705 8 14 199
Investing activities
Capital expenditure (3 934) – (4) – (3 938)
Expenditure on intangible assets (769) – – – (769)
Acquisition of businesses (696) – – – (696)
Disposal of businesses 140 – – – 140
Investments (net of divestments) in associates and joint
ventures (140) – – – (140)
Infl ows/(outfl ows) from treasury investments 593 – – (6) 587
Other investing activities (134) – – – (134)
Investing cash fl ow (4 940) – (4) (6) (4 950)
22. Restatements of 2017 comparatives and fi rst application of IFRS 9

Consolidated Financial Statements of the Nestlé Group 2018154
22. Restatements of 2017 comparatives and fi rst application of IFRS 9
Consolidated cash fl ow statement for the year ended December 31, 2017 (continued)
In millions of CHF
January–December
2017 as originally
published IFRS 15 IFRS 16 Other
January–
December
2017 restated
Financing activities
Dividend paid to shareholders of the parent (7 126) – – – (7 126)
Dividends paid to non-controlling interests (342) – – – (342)
Acquisition (net of disposal) of non-controlling interests (526) – – – (526)
Purchase (net of sale) of treasury shares (3 295) – – – (3 295)
Infl ows from bonds and other non-current fi nancial debt 6 406 – – – 6 406
Outfl ows from bonds and other non-current fi nancial debt (2 489) – (701) – (3 190)
Infl ows/(outfl ows) from current fi nancial debt (1 009) – – (2) (1 011)
Financing cash fl ow (8 381) – (701) (2) (9 084)
Currency retranslations (217) – – – (217)
Increase/(decrease) in cash and cash equivalents (52) – – – (52)
Cash and cash equivalents at beginning of year 7 990 – – – 7 990
Cash and cash equivalents at end of year 7 938 – – – 7 938

Consolidated Financial Statements of the Nestlé Group 2018 155
Consolidated balance sheet as at December 31, 2017
In millions of CHF
December 31,2017,
as originallypublished IFRS 15 IFRS 16 Other
December 31,
2017,
restated
Assets
Current assets
Cash and cash equivalents 7 938 – – – 7 938
Short-term investments 655 – – – 655
Inventories 9 061 203 – (87) 9 177
Trade and other receivables 12 422 (388) – 2 12 036
Prepayments and accrued income 607 – (34) – 573
Derivative assets 231 – – – 231
Current income tax assets 919 – – (2) 917
Assets held for sale 357 – – – 357
Total current assets 32 190 (185) (34) (87) 31 884
Non-current assets
Property, plant and equipment 27 775 – 3 002 – 30 777
Goodwill 29 748 – (2) – 29 746
Intangible assets 20 615 – – – 20 615
Investments in associates and joint ventures 11 628 – – – 11 628
Financial assets 6 003 – – – 6 003
Employee benefi ts assets 392 – – – 392
Current income tax assets 62 – – – 62
Deferred tax assets 1 967 71 39 26 2 103
Total non-current assets 98 190 71 3 039 26 101 326
Total assets 130 380 (114) 3 005 (61) 133 210
22. Restatements of 2017 comparatives and fi rst application of IFRS 9

Consolidated Financial Statements of the Nestlé Group 2018156
Consolidated balance sheet as at December 31, 2017 (continued)
In millions of CHF
December 31,2017,
as originallypublished IFRS 15 IFRS 16 Other
December 31,
2017,
restated
Liabilities and equity
Current liabilities
Financial debt 10 536 – 675 – 11 211
Trade and other payables 18 872 6 (14) – 18 864
Accruals and deferred income 4 094 210 (5) – 4 299
Provisions 863 – (6) (38) 819
Derivative liabilities 507 – – – 507
Current income tax liabilities 1 170 – – 1 307 2 477
Liabilities directly associated with assets held for sale 12 – – – 12
Total current liabilities 36 054 216 650 1 269 38 189
Non-current liabilities
Financial debt 15 932 – 2 634 – 18 566
Employee benefi ts liabilities 7 111 – – – 7 111
Provisions 2 445 – (29) (1 269) 1 147
Deferred tax liabilities 3 559 (35) (32) – 3 492
Other payables 2 502 – (26) – 2 476
Total non-current liabilities 31 549 (35) 2 547 (1 269) 32 792
Total liabilities 67 603 181 3 197 – 70 981
Equity
Share capital 311 – – – 311
Treasury shares (4 537) – – – (4 537)
Translation reserve (19 433) (2) (1) – (19 436)
Other reserves 989 – – – 989
Retained earnings 84 174 (293) (191) (61) 83 629
Total equity attributable to shareholders of the parent 61 504 (295) (192) (61) 60 956
Non-controlling interests 1 273 – – – 1 273
Total equity 62 777 (295) (192) (61) 62 229
Total liabilities and equity 130 380 (114) 3 005 (61) 133 210
22. Restatements of 2017 comparatives and fi rst application of IFRS 9

Consolidated Financial Statements of the Nestlé Group 2018 157
Consolidated balance sheet as at January 1, 2017
In millions of CHF
January 1,2017,
as originallypublished IFRS 15 IFRS 16 Other
January 1,
2017,
restated
Assets
Current assets
Cash and cash equivalents 7 990 – – – 7 990
Short-term investments 1 306 – – – 1 306
Inventories 8 401 206 – (87) 8 520
Trade and other receivables 12 411 (392) – 3 12 022
Prepayments and accrued income 573 – (38) – 535
Derivative assets 550 – – – 550
Current income tax assets 786 – – (3) 783
Assets held for sale 25 – – – 25
Total current assets 32 042 (186) (38) (87) 31 731
Non-current assets
Property, plant and equipment 27 554 – 2 743 – 30 297
Goodwill 33 007 – – – 33 007
Intangible assets 20 397 – – – 20 397
Investments in associates and joint ventures 10 709 – – – 10 709
Financial assets 5 719 – – – 5 719
Employee benefi ts assets 310 – – – 310
Current income tax assets 114 – – – 114
Deferred tax assets 2 049 81 34 26 2 190
Total non-current assets 99 859 81 2 777 26 102 743
Total assets 131 901 (105) 2 739 (61) 134 474
22. Restatements of 2017 comparatives and fi rst application of IFRS 9

Consolidated Financial Statements of the Nestlé Group 2018158
Consolidated balance sheet as at January 1, 2017 (continued)
In millions of CHF
January 1,2017,
as originallypublished IFRS 15 IFRS 16 Other
January 1,
2017,
restated
Liabilities and equity
Current liabilities
Financial debt 12 118 – 659 – 12 777
Trade and other payables 18 629 6 (16) – 18 619
Accruals and deferred income 3 855 215 (4) – 4 066
Provisions 620 – (8) (21) 591
Derivative liabilities 1 068 – – – 1 068
Current income tax liabilities 1 221 – – 1 528 2 749
Liabilities directly associated with assets held for sale 6 – – – 6
Total current liabilities 37 517 221 631 1 507 39 876
Non-current liabilities
Financial debt 11 091 – 2 361 – 13 452
Employee benefi ts liabilities 8 420 – – – 8 420
Provisions 2 640 – (5) (1 507) 1 128
Deferred tax liabilities 3 865 (58) (41) – 3 766
Other payables 2 387 – (18) – 2 369
Total non-current liabilities 28 403 (58) 2 297 (1 507) 29 135
Total liabilities 65 920 163 2 928 – 69 011
Equity
Share capital 311 – – – 311
Treasury shares (990) – – – (990)
Translation reserve (18 799) – – – (18 799)
Other reserves 1 198 – – – 1 198
Retained earnings 82 870 (268) (189) (61) 82 352
Total equity attributable to shareholders of the parent 64 590 (268) (189) (61) 64 072
Non-controlling interests 1 391 – – – 1 391
Total equity 65 981 (268) (189) (61) 65 463
Total liabilities and equity 131 901 (105) 2 739 (61) 134 474
22. Restatements of 2017 comparatives and fi rst application of IFRS 9

Consolidated Financial Statements of the Nestlé Group 2018 159
As described in Note 1 Accounting policies, IFRS 9 has been applied for the fi rst time
as at January 1, 2018. The following table explains the changes in measurement and
category under IFRS 9 for each class of Group’s fi nancial assets and the impact on net
fi nancial position as at January 1, 2018.
In millions of CHF
December 31, 2017,restated
January 1, 2018,after fi rst application of IFRS 9
Classes Lo
an
s,
receiv
ab
les
an
d lia
bilitie
s a
t
am
ort
ized
co
st
At
fair
valu
e
to in
co
me s
tate
men
t
Availab
le f
or
sale
Tota
lca
teg
ori
es
At
am
ort
ized
co
st
At
fair
valu
e
to in
co
me s
tate
men
t
At
fair
valu
e t
o
Oth
er
co
mp
reh
en
siv
e
inco
me
Tota
lca
teg
ori
es
Cash at bank and in hand 2 202 — — 2 202 2 202 — — 2 202
Commercial paper — — 4 600 4 600 4 601 — — 4 601
Time deposits — — 1 331 1 331 1 331 — — 1 331
Bonds and debt funds — 396 3 778 4 174 119 834 3 215 4 168
Equity and equity funds — 428 114 542 — 475 67 542
Other fi nancial assets 723 29 995 1 747 723 1 024 — 1 747
Liquid assets (a) and non-current
fi nancial assets 2 925 853 10 818 14 596 8 976 2 333 3 282 14 591
Trade and other receivables 12 036 — — 12 036 12 021 — — 12 021
Derivative assets (b) — 231 — 231 — 231 — 231
Total fi nancial assets 14 961 1 084 10 818 26 863 20 997 2 564 3 282 26 843
Trade and other payables (21 340) — — (21 340) (21 340) — — (21 340)
Financial debt (29 777) — — (29 777) (29 777) — — (29 777)
Derivative liabilities (b) — (507) — (507) — (507) — (507)
Total fi nancial liabilities (51 117) (507) — (51 624) (51 117) (507) — (51 624)
Net fi nancial position (36 156) 577 10 818 (24 761) (30 120) 2 057 3 282 (24 781)
of which at fair value — 577 10 818 11 395 — 2 057 3 282 5 339
(a) Liquid assets are composed of cash and cash equivalents as well as short-term investments.
(b) Include derivatives held in hedge relationships and those that are undesignated (categorized as held-for-trading).
Amounts highlighted with a grey background are those impacted by the fi rst application of IFRS 9.
22. Restatements of 2017 comparatives and fi rst application of IFRS 9

Consolidated Financial Statements of the Nestlé Group 2018160
Statutory Auditor’s ReportTo the General Meeting of Nestlé S.A., Cham & Vevey
Report on the Audit of the Consolidated Financial Statements
Opinion
We have audited the consolidated financial statements of Nestlé S.A. and its subsidiaries (the Group), which comprise the consolidated balance sheet as at December 31, 2018, the consolidated income statement, consolidated statement of comprehensive income, consolidated statement of changes in equity and consolidated statement of cash flows for the year then ended, and notes to the consolidated financial statements, including a summary of significant accounting policies.
In our opinion the consolidated financial statements (pages 66 to 159) give a true and fair view of the consolidated financial position of the Group as at December 31, 2018, and its consolidated financial performance and its consolidated cash flows for the year then ended in accordance with International Financial Reporting Standards (IFRS) and comply with Swiss law.
Basis for Opinion
We conducted our audit in accordance with Swiss law, International Standards on Auditing (ISAs) and Swiss Auditing Standards. Our responsibilities under those provisions and standards are further described in the Auditor’s Responsibilities for the Audit of the Consolidated Financial Statements section of our report. We are independent of the Group in accordance with the provisions of Swiss law and the requirements of the Swiss audit profession, as well as the IESBA Code of Ethics for Professional Accountants, and we have fulfilled our other ethical responsibilities in accordance with these requirements.
We believe that the audit evidence we have obtained is sufficient and appropriate to provide a basis for our opinion.
Key Audit Matters
Revenue recognition
Carrying value of goodwill and indefinite life intangible assets
Income taxes
Key audit matters are those matters that, in our professional judgment, were of most significance in our audit of the consolidated financial statements of the current period. These matters were addressed in the context of our audit of the consolidated financial statements as a whole, and in forming our opinion thereon, and we do not provide a separate opinion on these matters.

Consolidated Financial Statements of the Nestlé Group 2018 161
Key Audit Matter
Revenue from the sale of goods is recognized at the moment when control has been transferred to the buyer; and is measured net of pricing allowances, other trade discounts, and price promotions to customers (collectively ‘trade spend’).
The judgments required by management to estimate trade spend accruals are complex due to the diverse range of contractual agreements and commercial terms across the Group’s markets.
There is a risk that revenue may be overstated because of fraud, resulting from the pressure local management may feel to achieve performance targets. Revenue is also an important element of how the Group measures its performance, upon which management are incentivized.
The Group focuses on revenue as a key performance measure, which could create an incentive for revenue to be recognized before control has been transferred.
Key Audit Matter
The Group has goodwill of CHF 31,702 million and indefinite life intangible assets of CHF 16,872 million as at December 31, 2018, which are required to be tested for impairment at least on an annual basis. The recoverability of these assets is dependent on achieving sufficient level of future net cash flows.
Management apply judgment in allocating these assets to individual cash generating units (‘CGUs’) as well as in assessing the future performance and prospects of each CGU and determining the appropriate discount rates.
Our response
We considered the appropriateness of the Group’s revenue recognition accounting policies, including the recognition and classification criteria for trade spend.
Due to the high reliance of revenue recognition on IT, we evaluated the integrity of the general IT control environment and tested the operating effectiveness of key IT application controls. We performed detailed testing over the completeness and accuracy of the underlying customer master data, by assessing mandatory fields and critical segregation of duties.
Additionally we identified transactions that deviated from the standard process for further investigation and validated the existence and accuracy of this population. We also tested the operating effectiveness of controls over the calculation and monitoring of trade spend.
Furthermore, we performed a monthly trend analysis of revenue by market by considering both internal and external benchmarks, overlaying our understanding of each market, to compare the reported results with our expectation.
We also considered the accuracy of the Group’s description of the accounting policy related to revenue, and whether revenue is adequately disclosed throughout the consolidated financial statements.
Our response
We evaluated the accuracy of impairment tests applied to significant amounts of goodwill and indefinite life intangible assets, the appropriateness of the assumptions used, and the methodology used by management to prepare its cash flow forecasts. We also tested the design, implementation and operating effectiveness of controls over the preparation of impairment tests.
For a sample of CGUs, identified based on quantitative and qualitative factors, we assessed the historical accuracy of the plans and forecasts by comparing the forecasts used in the prior year model to the actual performance in the current year. We
Carrying value of goodwill and indefinite life intangible assets
For further information on revenue recognition refer to the following:– Note 1, “Accounting policies”– Note 3, “Analyses by segment”
Revenue recognition

Consolidated Financial Statements of the Nestlé Group 2018162
Key Audit Matter
The Group operates across multiple tax jurisdictions around the world, and is thus regularly subject to tax challenges and audits by local tax authorities on various matters including intragroup financing, pricing and royalty arrangements, different business models and other transaction-related matters.
Where the amount of tax liabilities or assets is uncertain, the Group recognizes management’s best estimate of the most likely outcome based on the facts known in the relevant jurisdiction.
Our response
We evaluated management’s judgment of tax risks, estimates of tax exposures and contingencies by involving our local country tax specialists and testing the design, implementation and operating effectiveness of related controls. Third party opinions, past and current experience with the tax authorities in the respective jurisdiction and our tax specialists‘ own expertise were used to assess the appropriateness of management’s best estimate of the most likely outcome of each uncertain tax position.
Our audit approach included additional reviews performed at Group level to consider the Group’s uncertain tax positions viewed from a worldwide perspective - in particular for transfer prices, intragroup financing and payments in relation to centralized business models where multiple jurisdictions and tax authorities are involved. We drew on our own tax expertise and knowledge gained with other similar groups to conclude on management’s best estimate of the outcome on the Group’s worldwide uncertain tax positions as they relate to more than one jurisdiction.
Income taxes
compared these against the latest plans and forecasts approved by management.
We then challenged the robustness of the key assumptions used to determine the recoverable amount, including identification of the CGU, forecast cash flows, long term growth rates and the discount rate based on our understanding of the commercial prospects of the related assets. In addition, we identified and analysed changes in assumptions from prior periods, made an assessment of the appropriateness of assumptions, and performed a comparison of assumptions with publicly available data.
For further information on the carrying value of goodwill and indefinite life intangible assets refer to the following:– Note 1, “Accounting policies”– Note 9, “Goodwill and intangible assets”
For further information on income taxes refer to the following:– Note 1, “Accounting policies”– Note 13, “Taxes”

Consolidated Financial Statements of the Nestlé Group 2018 163
Other Information in the Annual Report
The Board of Directors is responsible for the other information in the annual report. The other information comprises all information included in the annual report, but does not include the consolidated financial statements, the stand-alone financial statements of the Company, the compensation report and our auditor’s reports thereon.
Our opinion on the consolidated financial statements does not cover the other information in the annual report and we do not express any form of assurance conclusion thereon.
In connection with our audit of the consolidated financial statements, our responsibility is to read the other information in the annual report and, in doing so, consider whether the other information is materially inconsistent with the consolidated financial statements or our knowledge obtained in the audit, or otherwise appears to be materially misstated. If, based on the work we have performed, we conclude that there is a material misstatement of this other information, we are required to report that fact. We have nothing to report in this regard.
Responsibility of the Board of Directors for the Consolidated Financial Statements
The Board of Directors is responsible for the preparation of the consolidated financial statements that give a true and fair view in accordance with IFRS and the provisions of Swiss law, and for such internal control as the Board of Directors determines is necessary to enable the preparation of consolidated financial statements that are free from material misstatement, whether due to fraud or error.
In preparing the consolidated financial statements, the Board of Directors is responsible for assessing the Group’s ability to continue as a going concern, disclosing, as applicable, matters related to going concern and using the going concern basis of accounting unless the Board of Directors either intends to liquidate the Group or to cease operations, or has no realistic alternative but to do so.
Auditor’s Responsibilities for the Audit of the Consolidated Financial Statements
Our objectives are to obtain reasonable assurance about whether the consolidated financial statements as a whole are free from material misstatement, whether due to fraud or error, and to issue an auditor’s report that includes our opinion. Reasonable assurance is a high level of assurance, but is not a guarantee that an audit conducted in accordance with Swiss law, ISAs and Swiss Auditing Standards will always detect a material misstatement when it exists. Misstatements can arise from fraud or error and are considered material if, individually or in the aggregate, they could reasonably be expected to influence the economic decisions of users taken on the basis of these consolidated financial statements.
As part of an audit in accordance with Swiss law, ISAs and Swiss Auditing Standards, we exercise professional judgment and maintain professional scepticism throughout the audit. We also:
— Identify and assess the risks of material misstatement of the consolidated financial statements, whether due to fraud or error, design and perform audit procedures responsive to those risks, and obtain audit evidence that is sufficient and appropriate to provide a basis for our opinion. The risk of not detecting a material misstatement resulting from fraud is higher than for one resulting from error, as fraud may involve collusion, forgery, intentional omissions, misrepresentations, or the override of internal control.
— Obtain an understanding of internal control relevant to the audit in order to design audit procedures that are appropriate in the circumstances, but not for the purpose of expressing an opinion on the effectiveness of the Group’s internal control.
— Evaluate the appropriateness of accounting policies used and the reasonableness of accounting estimates and related disclosures made.
— Conclude on the appropriateness of the Board of Directors’ use of the going concern basis of accounting and, based on the audit evidence obtained, whether a material uncertainty exists related to events or conditions that may cast significant doubt on the Group’s ability to continue as a going concern. If we conclude that a material uncertainty exists, we are required to draw attention in our auditor’s report to the

Consolidated Financial Statements of the Nestlé Group 2018164
related disclosures in the consolidated financial statements or, if such disclosures are inadequate, to modify our opinion. Our conclusions are based on the audit evidence obtained up to the date of our auditor’s report. However, future events or conditions may cause the Group to cease to continue as a going concern.
— Evaluate the overall presentation, structure and content of the consolidated financial statements, including the disclosures, and whether the consolidated financial statements represent the underlying transactions and events in a manner that achieves fair presentation.
— Obtain sufficient appropriate audit evidence regarding the financial information of the entities or business activities within the Group to express an opinion on the consolidated financial statements. We are responsible for the direction, supervision and performance of the Group audit. We remain solely responsible for our audit opinion.
We communicate with the Board of Directors or its relevant committee regarding, among other matters, the planned scope and timing of the audit and significant audit findings, including any significant deficiencies in internal control that we identify during our audit.
We also provide the Board of Directors or its relevant committee with a statement that we have complied with relevant ethical requirements regarding independence, and to communicate with them all relationships and other matters that may reasonably be thought to bear on our independence, and where applicable, related safeguards.
From the matters communicated with the Board of Directors or its relevant committee, we determine those matters that were of most significance in the audit of the consolidated financial statements of the current period and are therefore the key audit matters. We describe these matters in our auditor’s report, unless law or regulation precludes public disclosure about the matter or when, in extremely rare circumstances, we determine that a matter should not be communicated in our report because the adverse consequences of doing so would reasonably be expected to outweigh the public interest benefits of such communication.
Report on Other Legal and Regulatory Requirements
In accordance with article 728a para. 1 item 3 CO and the Swiss Auditing Standard 890, we confirm that an internal control system exists, which has been designed for the preparation of consolidated financial statements according to the instructions of the Board of Directors.
We recommend that the consolidated financial statements submitted to you be approved.
KPMG SA
Scott Cormack Lukas MartyLicensed Audit Expert Licensed Audit ExpertAuditor in Charge
Geneva, February 13, 2019
KPMG SA, 111 Rue de Lyon, P.O. Box 347, CH-1211 Geneva 13
KPMG SA is a subsidiary of KPMG Holding AG, which is a member of the KPMG network of independent firms affiliated with KPMG International Cooperative (“KPMG International”), a Swiss legal entity. All rights reserved.

Consolidated Financial Statements of the Nestlé Group 2018 165

Consolidated Financial Statements of the Nestlé Group 2018166
Financial information – 5 year review
In millions of CHF (except for data per share and employees)
2018 2017 * 2016 2015 2014
Results Results
Sales 91 439 89 590 89 469 88 785 91 612 Sales
Underlying Trading operating profit (a) 15 521 14 771 14 307 14 032 14 816 Underlying Trading operating profit (a)
as % of sales 17.0% 16.5% 16.0% 15.8% 16.2% as % of sales
Trading operating profit (a) 13 789 13 277 13 693 13 382 14 019 Trading operating profit (a)
as % of sales 15.1% 14.8% 15.3% 15.1% 15.3% as % of sales
Taxes 3 439 2 773 4 413 3 305 3 367 Taxes
Profit for the year attributable to shareholders of the parent (Net profit) 10 135 7 156 8 531 9 066 14 456 Profit for the year attributable to shareholders of the parent (Net profit)
as % of sales 11.1% 8.0% 9.5% 10.2% 15.8% as % of sales
Total amount of dividend 7 311 (c) 7 124 7 126 6 937 6 950 Total amount of dividend
Depreciation of property, plant and equipment (d) 3 604 3 560 2 795 2 861 2 782 Depreciation of property, plant and equipment (d)
Balance sheet and Cash flow statement Balance sheet and Cash flow statement
Current assets 41 003 31 884 32 042 29 434 33 961 Current assets
Non-current assets 96 012 101 326 99 859 94 558 99 489 Non-current assets
Total assets 137 015 133 210 131 901 123 992 133 450 Total assets
Current liabilities 43 030 38 189 37 517 33 321 32 895 Current liabilities
Non-current liabilities 35 582 32 792 28 403 26 685 28 671 Non-current liabilities
Equity attributable to shareholders of the parent 57 363 60 956 64 590 62 338 70 130 Equity attributable to shareholders of the parent
Non-controlling interests 1 040 1 273 1 391 1 648 1 754 Non-controlling interests
Net financial debt (a) 30 330 21 369 13 913 15 425 12 325 Net financial debt (a)
Ratio of net financial debt to equity (gearing) 52.9% 35.1% 21.5% 24.7% 17.6% Ratio of net financial debt to equity (gearing)
Operating cash flow 15 398 14 199 15 582 14 302 14 700 Operating cash flow
as % of net financial debt 50.8% 66.4% 112.0% 92.7% 119.3% as % of net financial debt
Free cash flow (a) 10 765 9 358 10 108 9 945 14 137 Free cash flow (a)
Capital additions (d) 14 711 6 569 5 462 4 883 14 263 Capital additions (d)
as % of sales 16.1% 7.3% 6.1% 5.5% 15.6% as % of sales
Data per share Data per share
Weighted average number of shares outstanding (in millions of units) 3 014 3 092 3 091 3 129 3 188 Weighted average number of shares outstanding (in millions of units)
Basic earnings per share 3.36 2.31 2.76 2.90 4.54 Basic earnings per share
Underlying earnings per share (a) 4.02 3.55 3.40 3.31 3.44 Underlying earnings per share (a)
Dividend 2.45 (c) 2.35 2.30 2.25 2.20 Dividend
Pay-out ratio based on basic earnings per share 72.9% (c) 101.7% 83.3% 77.6% 48.5% Pay-out ratio based on basic earnings per share
Stock prices (high) 86.50 86.40 80.05 77.00 73.30 Stock prices (high)
Stock prices (low) 72.92 71.45 67.00 64.55 63.85 Stock prices (low)
Yield (b) 2.8/3.4 (c) 2.7/3.3 2.9/3.4 2.9/3.5 3.0/3.4 Yield (b)
Market capitalization 237 363 256 223 226 310 229 947 231 136 Market capitalization
Number of employees (in thousands) 308 323 328 335 339 Number of employees (in thousands)
* 2017restatedfiguresincludemodificationsasdescribedinNote1AccountingpoliciesandrelatedimpactsinNote22.
(a) Certainfinancialperformancemeasures,thatarenotdefinedbyIFRS,areusedbymanagementtoassessthefinancialand
operationalperformanceoftheGroup.The"AlternativePerformanceMeasures"documentpublishedunder
https://www.nestle.com/investors/publicationsprovidesthedefinitionofthesenon-IFRSfinancialperformancemeasures.
(b) Calculatedonthebasisofthedividendfortheyearconcerned,whichispaidinthefollowingyear,andonhigh/lowstockprices.
(c) AsproposedbytheBoardofDirectorsofNestléS.A.
(d) Includingright-of-useassets-leasedsince2017.

Consolidated Financial Statements of the Nestlé Group 2018 167
Financial information – 5 year review
In millions of CHF (except for data per share and employees)
2018 2017 * 2016 2015 2014
Results Results
Sales 91 439 89 590 89 469 88 785 91 612 Sales
Underlying Trading operating profit (a) 15 521 14 771 14 307 14 032 14 816 Underlying Trading operating profit (a)
as % of sales 17.0% 16.5% 16.0% 15.8% 16.2% as % of sales
Trading operating profit (a) 13 789 13 277 13 693 13 382 14 019 Trading operating profit (a)
as % of sales 15.1% 14.8% 15.3% 15.1% 15.3% as % of sales
Taxes 3 439 2 773 4 413 3 305 3 367 Taxes
Profit for the year attributable to shareholders of the parent (Net profit) 10 135 7 156 8 531 9 066 14 456 Profit for the year attributable to shareholders of the parent (Net profit)
as % of sales 11.1% 8.0% 9.5% 10.2% 15.8% as % of sales
Total amount of dividend 7 311 (c) 7 124 7 126 6 937 6 950 Total amount of dividend
Depreciation of property, plant and equipment (d) 3 604 3 560 2 795 2 861 2 782 Depreciation of property, plant and equipment (d)
Balance sheet and Cash flow statement Balance sheet and Cash flow statement
Current assets 41 003 31 884 32 042 29 434 33 961 Current assets
Non-current assets 96 012 101 326 99 859 94 558 99 489 Non-current assets
Total assets 137 015 133 210 131 901 123 992 133 450 Total assets
Current liabilities 43 030 38 189 37 517 33 321 32 895 Current liabilities
Non-current liabilities 35 582 32 792 28 403 26 685 28 671 Non-current liabilities
Equity attributable to shareholders of the parent 57 363 60 956 64 590 62 338 70 130 Equity attributable to shareholders of the parent
Non-controlling interests 1 040 1 273 1 391 1 648 1 754 Non-controlling interests
Net financial debt (a) 30 330 21 369 13 913 15 425 12 325 Net financial debt (a)
Ratio of net financial debt to equity (gearing) 52.9% 35.1% 21.5% 24.7% 17.6% Ratio of net financial debt to equity (gearing)
Operating cash flow 15 398 14 199 15 582 14 302 14 700 Operating cash flow
as % of net financial debt 50.8% 66.4% 112.0% 92.7% 119.3% as % of net financial debt
Free cash flow (a) 10 765 9 358 10 108 9 945 14 137 Free cash flow (a)
Capital additions (d) 14 711 6 569 5 462 4 883 14 263 Capital additions (d)
as % of sales 16.1% 7.3% 6.1% 5.5% 15.6% as % of sales
Data per share Data per share
Weighted average number of shares outstanding (in millions of units) 3 014 3 092 3 091 3 129 3 188 Weighted average number of shares outstanding (in millions of units)
Basic earnings per share 3.36 2.31 2.76 2.90 4.54 Basic earnings per share
Underlying earnings per share (a) 4.02 3.55 3.40 3.31 3.44 Underlying earnings per share (a)
Dividend 2.45 (c) 2.35 2.30 2.25 2.20 Dividend
Pay-out ratio based on basic earnings per share 72.9% (c) 101.7% 83.3% 77.6% 48.5% Pay-out ratio based on basic earnings per share
Stock prices (high) 86.50 86.40 80.05 77.00 73.30 Stock prices (high)
Stock prices (low) 72.92 71.45 67.00 64.55 63.85 Stock prices (low)
Yield (b) 2.8/3.4 (c) 2.7/3.3 2.9/3.4 2.9/3.5 3.0/3.4 Yield (b)
Market capitalization 237 363 256 223 226 310 229 947 231 136 Market capitalization
Number of employees (in thousands) 308 323 328 335 339 Number of employees (in thousands)
* 2017restatedfiguresincludemodificationsasdescribedinNote1AccountingpoliciesandrelatedimpactsinNote22.
(a) Certainfinancialperformancemeasures,thatarenotdefinedbyIFRS,areusedbymanagementtoassessthefinancialand
operationalperformanceoftheGroup.The"AlternativePerformanceMeasures"documentpublishedunder
https://www.nestle.com/investors/publicationsprovidesthedefinitionofthesenon-IFRSfinancialperformancemeasures.
(b) Calculatedonthebasisofthedividendfortheyearconcerned,whichispaidinthefollowingyear,andonhigh/lowstockprices.
(c) AsproposedbytheBoardofDirectorsofNestléS.A.
(d) Includingright-of-useassets-leasedsince2017.
Financialinformation–5yearreview
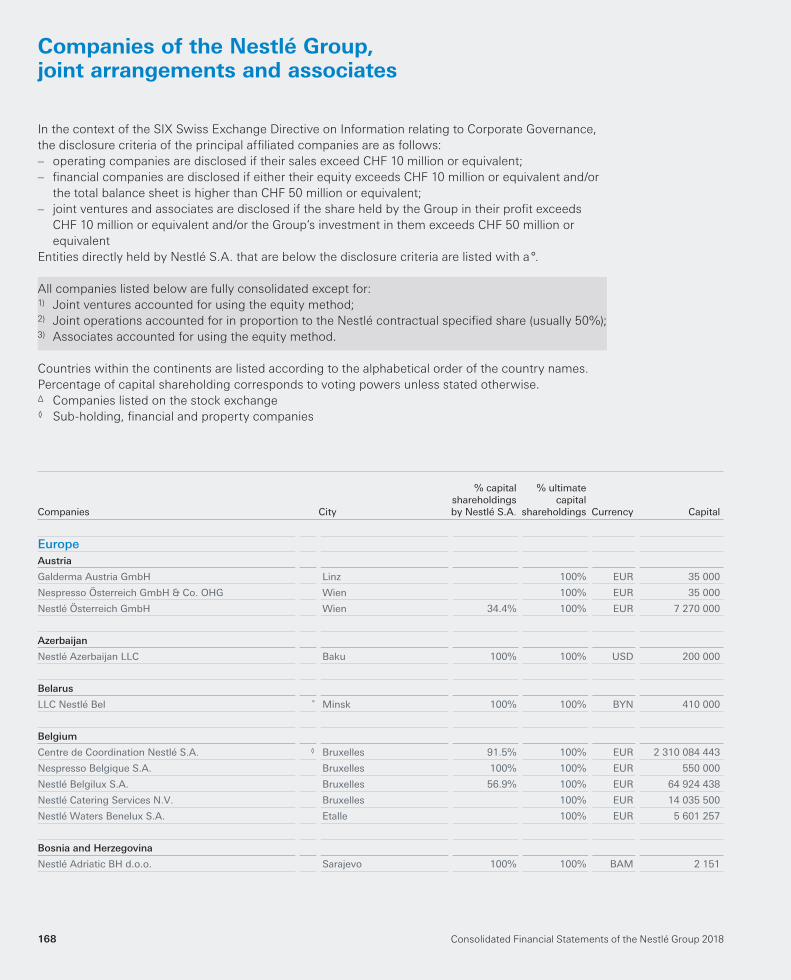
Companies of the Nestlé Group, joint arrangements and associates
In the context of the SIX Swiss Exchange Directive on Information relating to Corporate Governance,
the disclosure criteria of the principal affi liated companies are as follows:
– operating companies are disclosed if their sales exceed CHF 10 million or equivalent;
– fi nancial companies are disclosed if either their equity exceeds CHF 10 million or equivalent and/or
the total balance sheet is higher than CHF 50 million or equivalent;
– joint ventures and associates are disclosed if the share held by the Group in their profi t exceeds
CHF 10 million or equivalent and/or the Group’s investment in them exceeds CHF 50 million or
equivalent
Entities directly held by Nestlé S.A. that are below the disclosure criteria are listed with a °.
EuropeAustria
Galderma Austria GmbH Linz 100% EUR 35 000
Nespresso Österreich GmbH & Co. OHG Wien 100% EUR 35 000
Nestlé Österreich GmbH Wien 34.4% 100% EUR 7 270 000
Azerbaijan
Nestlé Azerbaijan LLC Baku 100% 100% USD 200 000
Belarus
LLC Nestlé Bel ° Minsk 100% 100% BYN 410 000
Belgium
Centre de Coordination Nestlé S.A. ◊ Bruxelles 91.5% 100% EUR 2 310 084 443
Nespresso Belgique S.A. Bruxelles 100% 100% EUR 550 000
Nestlé Belgilux S.A. Bruxelles 56.9% 100% EUR 64 924 438
Nestlé Catering Services N.V. Bruxelles 100% EUR 14 035 500
Nestlé Waters Benelux S.A. Etalle 100% EUR 5 601 257
Bosnia and Herzegovina
Nestlé Adriatic BH d.o.o. Sarajevo 100% 100% BAM 2 151
All companies listed below are fully consolidated except for:1) Joint ventures accounted for using the equity method;2) Joint operations accounted for in proportion to the Nestlé contractual specifi ed share (usually 50%);3) Associates accounted for using the equity method.
Countries within the continents are listed according to the alphabetical order of the country names.
Percentage of capital shareholding corresponds to voting powers unless stated otherwise.Δ Companies listed on the stock exchange◊ Sub-holding, fi nancial and property companies
Consolidated Financial Statements of the Nestlé Group 2018168
Companies City
% capitalshareholdingsby Nestlé S.A.
% ultimate capital
shareholdings Currency Capital

Bulgaria
Nestlé Bulgaria A.D. Sofi a 100% 100% BGN 10 234 933
Croatia
Nestlé Adriatic d.o.o. Zagreb 100% 100% HRK 14 685 500
Czech Republic
Mucos Pharma CZ, s.r.o. Pruhonice 100% CZK 160 000
Nestlé Cesko s.r.o. Praha 100% 100% CZK 300 000 000
Tivall CZ, s.r.o. Krupka 100% CZK 400 000 000
Denmark
Nestlé Danmark A/S Copenhagen 100% 100% DKK 44 000 000
Nestlé Professional Food A/S Faxe 100% DKK 12 000 000
Glycom A/S 3) Copenhagen 36.3% 36.3% DKK 1 508 925
Finland
Puljonki Oy Juuka 100% EUR 85 000
Suomen Nestlé Oy Espoo 100% 100% EUR 6 000 000
France
Centres de Recherche et Développement Nestlé S.A.S. Noisiel 100% EUR 3 138 230
Galderma International S.A.S. Courbevoie 100% EUR 940 020
Galderma Research and Development SNC Biot 100% EUR 30 322 851
Herta S.A.S. Noisiel 100% EUR 12 908 610
Laboratoires Galderma S.A.S. Alby-sur-Chéran 100% EUR 14 015 454
Nespresso France S.A.S. Paris 100% EUR 1 360 000
Nestlé Entreprises S.A.S. ◊ Noisiel 100% EUR 739 559 392
Nestlé France S.A.S. Noisiel 100% EUR 130 925 520
Nestlé France M.G. S.A.S. Noisiel 100% EUR 50 000
Nestlé Health Science France S.A.S. Noisiel 100% EUR 57 943 072
Nestlé Purina PetCare France S.A.S. Noisiel 100% EUR 21 091 872
Nestlé Waters S.A.S. ◊ Issy-les-Moulineaux 100% EUR 254 825 042
Nestlé Waters France S.A.S. ◊ Issy-les-Moulineaux 100% EUR 44 856 149
Nestlé Waters Management & Technology S.A.S. Issy-les-Moulineaux 100% EUR 38 113
Nestlé Waters Marketing & Distribution S.A.S. Issy-les-Moulineaux 100% EUR 26 740 940
Nestlé Waters Services S.A.S. Issy-les-Moulineaux 100% EUR 1 356 796
Nestlé Waters Supply Est S.A.S. Issy-les-Moulineaux 100% EUR 17 539 660
Nestlé Waters Supply Sud S.A.S. Issy-les-Moulineaux 100% EUR 7 309 106
Société des Produits Alimentaires de Caudry S.A.S. Noisiel 100% EUR 8 670 319
Société Immobilière de Noisiel S.A. ◊ Noisiel 100% EUR 22 753 550
Société Industrielle de Transformation
de Produits Agricoles S.A.S. Noisiel 100% EUR 9 718 000
Wamiz S.A.S. ° Paris 67% 67% EUR 31 182
Companies of the Nestlé Group, joint arrangements and associates
Consolidated Financial Statements of the Nestlé Group 2018 169
Companies City
% capitalshareholdingsby Nestlé S.A.
% ultimate capital
shareholdings Currency Capital

France (continued)
Cereal Partners France SNC 1) Noisiel 50% EUR 3 000 000
L’Oréal S.A. (a) Δ3) Paris 23.2% 23.2% EUR 112 079 330
Listed on the Paris stock exchange, market capitalization EUR 112.7 billion, quotation code (ISIN) FR0000120321
Lactalis Nestlé Produits Frais S.A.S. 3) Laval 40% 40% EUR 69 208 832
Georgia
Nestlé Georgia LLC ° Tbilisi 100% 100% CHF 700 000
Germany
Bübchen-Werk Ewald Hermes Pharmazeutische
Fabrik GmbH Soest 100% EUR 25 565
Galderma Laboratorium GmbH Düsseldorf 100% EUR 800 000
Mucos Pharma GmbH & Co. KG Berlin 100% EUR 127 823
Nestlé Deutschland AG Frankfurt am Main 100% EUR 214 266 628
Nestlé Product Technology Centre
Lebensmittelforschung GmbH Freiburg i. Br. 100% EUR 52 000
Nestlé Unternehmungen Deutschland GmbH ◊ Frankfurt am Main 100% EUR 60 000 000
Nestlé Waters Deutschland GmbH Frankfurt am Main 100% EUR 10 566 000
Terra Canis GmbH München 80% EUR 60 336
C.P.D. Cereal Partners Deutschland GmbH & Co. OHG 1) Frankfurt am Main 50% EUR 511 292
Trinks GmbH 3) Braunschweig 25% EUR 2 360 000
Trinks Süd GmbH 3) München 25% EUR 260 000
Greece
Nespresso Hellas S.A. Maroussi 100% 100% EUR 500 000
Nestlé Hellas S.A. Maroussi 100% 100% EUR 5 269 765
C.P.W. Hellas Breakfast Cereals S.A. 1) Maroussi 50% EUR 201 070
Hungary
Nestlé Hungária Kft. Budapest 100% 100% HUF 6 000 000 000
Cereal Partners Hungária Kft. 1) Budapest 50% HUF 22 000 000
Italy
Galderma Italia S.p.A. Milano 100% EUR 612 000
Nespresso Italiana S.p.A. Assago 100% EUR 250 000
Nestlé ltaliana S.p.A. Assago 100% 100% EUR 25 582 492
Sanpellegrino S.p.A. San Pellegrino Terme 100% EUR 58 742 145
Kazakhstan
Nestlé Food Kazakhstan LLP Almaty 100% 100% KZT 91 900
(a) Voting powers amount to 23.2%
Companies of the Nestlé Group, joint arrangements and associates
Companies City
% capitalshareholdingsby Nestlé S.A.
% ultimate capital
shareholdings Currency Capital
Consolidated Financial Statements of the Nestlé Group 2018170

Lithuania
UAB „Nestlé Baltics” Vilnius 100% 100% EUR 31 856
Luxembourg
Compagnie Financière du Haut-Rhin S.A. ◊ Luxembourg 100% EUR 105 200 000
Nespresso Luxembourg Sàrl Luxembourg 100% 100% EUR 12 525
Nestlé Finance International Ltd ◊ Luxembourg 100% 100% EUR 440 000
Nestlé Treasury International S.A. ◊ Luxembourg 100% 100% EUR 1 000 000
NTC-Europe S.A. ◊ Luxembourg 100% 100% EUR 3 565 000
Macedonia
Nestlé Adriatik Makedonija d.o.o.e.l. Skopje-Karpos 100% 100% MKD 31 065 780
Malta
Nestlé Malta Ltd Lija 99.9% 100% EUR 116 470
Moldova
LLC Nestlé ° Chisinau 100% 100% USD 1 000
Netherlands
Atrium Cooperatief U.A. ° Almere 100% 100% EUR —
East Springs International N.V. ◊ Amsterdam 100% EUR 25 370 000
Galderma BeNeLux B.V. Rotterdam 100% 100% EUR 18 002
MCO Health B.V. Almere 100% EUR 418 000
Nespresso Nederland B.V. Amsterdam 100% EUR 680 670
Nestlé Nederland B.V. Amsterdam 100% 100% EUR 11 346 000
Norway
A/S Nestlé Norge Bærum 100% NOK 81 250 000
Poland
Galderma Polska Z o.o. Warszawa 100% PLN 93 000
Nestlé Polska S.A. Warszawa 100% 100% PLN 48 378 300
Cereal Partners Poland Torun-Pacifi c Sp. Z o.o. 1) Torun 50% 50% PLN 14 572 838
Portugal
Nestlé Business Services Lisbon, S.A. ° Oeiras 100% 100% EUR 50 000
Nestlé Portugal, Unipessoal, Lda. Oeiras 100% EUR 30 000 000
Cereal Associados Portugal A.E.I.E. 1) Oeiras 50% EUR 99 760
Republic of Ireland
Nestlé (lreland) Ltd Dublin 100% EUR 1 270
Wyeth Nutritionals Ireland Ltd Askeaton 100% USD 10 000 000
WyNutri Ltd Dublin 100% USD 1
Companies of the Nestlé Group, joint arrangements and associates
Consolidated Financial Statements of the Nestlé Group 2018 171
Companies City
% capitalshareholdingsby Nestlé S.A.
% ultimate capital
shareholdings Currency Capital

Republic of Serbia
Nestlé Adriatic S d.o.o., Beograd-Surcin Beograd-Surcin 100% 100% RSD 12 222 327 814
Romania
Nestlé Romania S.R.L. Bucharest 100% 100% RON 132 906 800
Russia
LLC Atrium Innovations Rus Moscow 100% RUB 6 000 000
Nestlé Kuban LLC Timashevsk 67.4% 100% RUB 21 041 793
Nestlé Rossiya LLC Moscow 84.1% 100% RUB 880 154 115
ooo Galderma LLC Moscow 100% RUB 25 000 000
Cereal Partners Rus, LLC 1) Moscow 35% 50% RUB 39 730 860
Slovak Republic
Nestlé Slovensko s.r.o. Prievidza 100% 100% EUR 13 277 568
Slovenia
Nestlé Adriatic Trgovina d.o.o. ° Ljubljana 100% 100% EUR 8 763
Spain
Laboratorios Galderma, S.A. Madrid 100% EUR 432 480
Nestlé España S.A. Esplugues de Llobregat
(Barcelona) 100% 100% EUR 100 000 000
Nestlé Global Services Spain, S.L. ° Esplugues de Llobregat
(Barcelona) 100% 100% EUR 3 000
Nestlé Purina PetCare España S.A. Castellbisbal (Barcelona) 100% EUR 12 000 000
Productos del Café S.A. Reus (Tarragona) 100% EUR 6 600 000
Cereal Partners España A.E.I.E. 1) Esplugues de Llobregat
(Barcelona) 50% EUR 120 202
Sweden
Galderma Nordic AB Uppsala 100% SEK 100 000
Nestlé Sverige AB Helsingborg 100% SEK 20 000 000
Q-Med AB Uppsala 100% SEK 24 845 500
Switzerland
DPA (Holding) S.A. ◊° Vevey 100% 100% CHF 100 000
Entreprises Maggi S.A. ◊ Cham 100% 100% CHF 100 000
Galderma S.A. Cham 100% CHF 178 100
Galderma Pharma S.A. ◊ Lausanne 100% CHF 48 900 000
Intercona Re AG ◊ Châtel-St-Denis 100% CHF 35 000 000
Nespresso IS Services S.A. ° Lausanne 100% 100% CHF 100 000
Nestec S.A. Vevey 100% 100% CHF 5 000 000
Companies of the Nestlé Group, joint arrangements and associates
Companies City
% capitalshareholdingsby Nestlé S.A.
% ultimate capital
shareholdings Currency Capital
Consolidated Financial Statements of the Nestlé Group 2018172
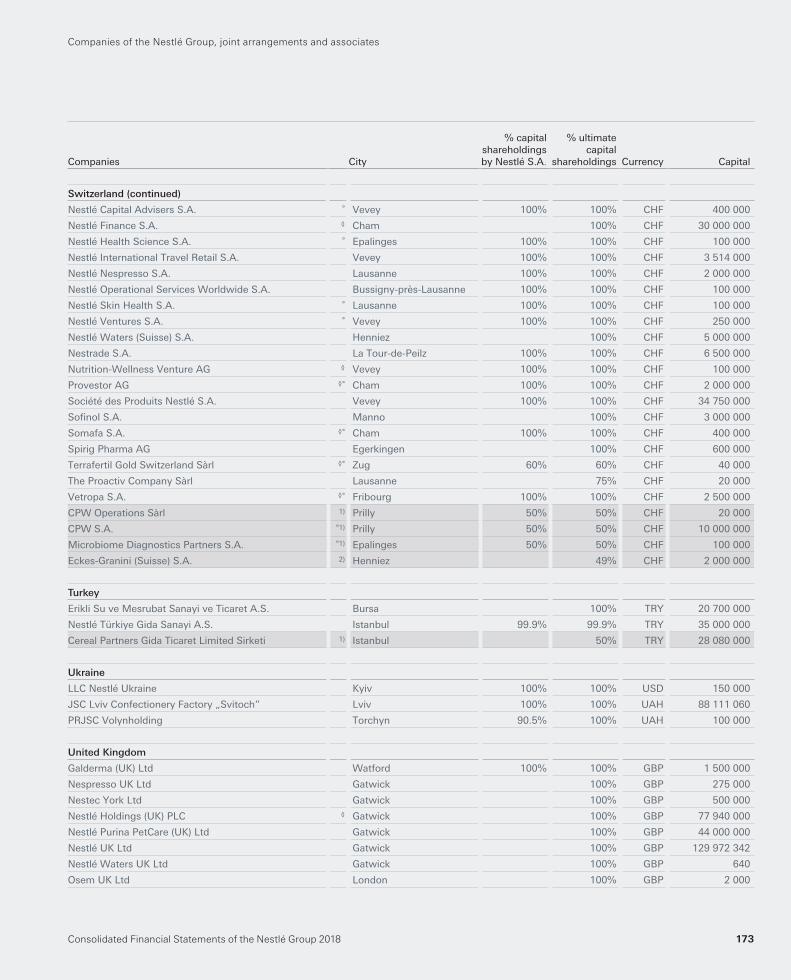
Switzerland (continued)
Nestlé Capital Advisers S.A. ° Vevey 100% 100% CHF 400 000
Nestlé Finance S.A. ◊ Cham 100% CHF 30 000 000
Nestlé Health Science S.A. ° Epalinges 100% 100% CHF 100 000
Nestlé International Travel Retail S.A. Vevey 100% 100% CHF 3 514 000
Nestlé Nespresso S.A. Lausanne 100% 100% CHF 2 000 000
Nestlé Operational Services Worldwide S.A. Bussigny-près-Lausanne 100% 100% CHF 100 000
Nestlé Skin Health S.A. ° Lausanne 100% 100% CHF 100 000
Nestlé Ventures S.A. ° Vevey 100% 100% CHF 250 000
Nestlé Waters (Suisse) S.A. Henniez 100% CHF 5 000 000
Nestrade S.A. La Tour-de-Peilz 100% 100% CHF 6 500 000
Nutrition-Wellness Venture AG ◊ Vevey 100% 100% CHF 100 000
Provestor AG ◊° Cham 100% 100% CHF 2 000 000
Société des Produits Nestlé S.A. Vevey 100% 100% CHF 34 750 000
Sofi nol S.A. Manno 100% CHF 3 000 000
Somafa S.A. ◊° Cham 100% 100% CHF 400 000
Spirig Pharma AG Egerkingen 100% CHF 600 000
Terrafertil Gold Switzerland Sàrl ◊° Zug 60% 60% CHF 40 000
The Proactiv Company Sàrl Lausanne 75% CHF 20 000
Vetropa S.A. ◊° Fribourg 100% 100% CHF 2 500 000
CPW Operations Sàrl 1) Prilly 50% 50% CHF 20 000
CPW S.A. °1) Prilly 50% 50% CHF 10 000 000
Microbiome Diagnostics Partners S.A. °1) Epalinges 50% 50% CHF 100 000
Eckes-Granini (Suisse) S.A. 2) Henniez 49% CHF 2 000 000
Turkey
Erikli Su ve Mesrubat Sanayi ve Ticaret A.S. Bursa 100% TRY 20 700 000
Nestlé Türkiye Gida Sanayi A.S. Istanbul 99.9% 99.9% TRY 35 000 000
Cereal Partners Gida Ticaret Limited Sirketi 1) Istanbul 50% TRY 28 080 000
Ukraine
LLC Nestlé Ukraine Kyiv 100% 100% USD 150 000
JSC Lviv Confectionery Factory „Svitoch” Lviv 100% 100% UAH 88 111 060
PRJSC Volynholding Torchyn 90.5% 100% UAH 100 000
United Kingdom
Galderma (UK) Ltd Watford 100% 100% GBP 1 500 000
Nespresso UK Ltd Gatwick 100% GBP 275 000
Nestec York Ltd Gatwick 100% GBP 500 000
Nestlé Holdings (UK) PLC ◊ Gatwick 100% GBP 77 940 000
Nestlé Purina PetCare (UK) Ltd Gatwick 100% GBP 44 000 000
Nestlé UK Ltd Gatwick 100% GBP 129 972 342
Nestlé Waters UK Ltd Gatwick 100% GBP 640
Osem UK Ltd London 100% GBP 2 000
Companies of the Nestlé Group, joint arrangements and associates
Consolidated Financial Statements of the Nestlé Group 2018 173
Companies City
% capitalshareholdingsby Nestlé S.A.
% ultimate capital
shareholdings Currency Capital

United Kingdom (continued)
Princes Gate Water Ltd Pembrokeshire 90% GBP 199 630
Proactiv Skin Health Ltd London 75% GBP 101
Tailsco Ltd ° London 82.9% 82.9% GBP 16
Vitafl o (International) Ltd Liverpool 100% GBP 625 379
Cereal Partners UK 1) Herts 50% GBP —
Froneri Ltd (b) 1) Northallerton 22% 44.5% EUR 14 304
Phagenesis Ltd °3) Manchester 29.2% 29.2% GBP 16 146
(b) Excluding non voting preference shares. Voting powers amount to 50%
Companies of the Nestlé Group, joint arrangements and associates
Companies City
% capitalshareholdingsby Nestlé S.A.
% ultimate capital
shareholdings Currency Capital
Consolidated Financial Statements of the Nestlé Group 2018174

AfricaAlgeria
Nestlé Algérie SpA Alger <0.1% 49% DZD 650 000 000
Nestlé Industrie Algérie SpA ° Alger 49% 49% DZD 1 100 000 000
Nestlé Waters Algérie SpA Blida 49% DZD 377 606 250
Angola
Nestlé Angola Lda Luanda 100% 100% AOA 1 791 870 000
Burkina Faso
Nestlé Burkina Faso S.A. Ouagadougou 100% XOF 50 000 000
Cameroon
Nestlé Cameroun S.A. Douala 100% 100% XAF 4 323 960 000
Côte d’Ivoire
Nestlé Côte d’Ivoire S.A. Δ Abidjan 79.6% 86.5% XOF 5 517 600 000
Listed on the Abidjan stock exchange, market capitalization XOF 22.3 billion, quotation code (ISIN) CI0009240728
Egypt
Caravan Marketing Company S.A.E. Giza 100% 100% EGP 33 000 000
Nestlé Egypt S.A.E. Giza 100% 100% EGP 80 722 000
Nestlé Waters Egypt S.A.E. Cairo 63.8% EGP 90 140 000
Ethiopia
Nestlé Waters Ethiopia Share Company Addis Ababa 51% ETB 223 450 770
Gabon
Nestlé Gabon, S.A. Libreville 90% 90% XAF 344 000 000
Ghana
Nestlé Central and West Africa Ltd Accra 100% 100% GHS 95 796 000
Nestlé Ghana Ltd Accra 76% 76% GHS 20 100 000
Kenya
Nestlé Equatorial African Region Ltd Nairobi 100% 100% KES 132 000 000
Nestlé Kenya Ltd Nairobi 100% 100% KES 226 100 400
Mauritius
Nestlé’s Products (Mauritius) Ltd Port Louis 100% 100% MUR 2 475 687 502
Morocco
Nestlé Maghreb S.A. ° Casablanca 100% 100% MAD 300 000
Nestlé Maroc S.A. El Jadida 94.5% 94.5% MAD 156 933 000
Companies of the Nestlé Group, joint arrangements and associates
Consolidated Financial Statements of the Nestlé Group 2018 175
Companies City
% capitalshareholdingsby Nestlé S.A.
% ultimate capital
shareholdings Currency Capital

Mozambique
Nestlé Moçambique Lda ° Maputo 100% 100% MZN 3 131 711 700
Nigeria
Nestlé Nigeria Plc Δ Ilupeju 66.2% 66.2% NGN 396 328 126
Listed on the Nigerian Stock Exchange, market capitalization NGN 1177.0 billion, quotation code (ISIN) NGNESTLE0006
Senegal
Nestlé Sénégal S.A. Dakar 100% 100% XOF 1 620 000 000
South Africa
Galderma Laboratories South Africa (Pty) Ltd Bryanston 100% ZAR 375 000
Nestlé (South Africa) (Pty) Ltd Johannesburg 100% 100% ZAR 759 735 000
Clover Waters Proprietary Limited 3) Johannesburg 30% ZAR 56 021 890
Tunisia
Nestlé Tunisie S.A. ° Tunis 99.5% 99.5% TND 8 438 280
Nestlé Tunisie Distribution S.A. Tunis <0.1% 99.5% TND 100 000
Zambia
Nestlé Zambia Trading Ltd Lusaka 99.8% 100% ZMW 2 317 500
Zimbabwe
Nestlé Zimbabwe (Private) Ltd Harare 100% 100% USD 2 100 000
Companies of the Nestlé Group, joint arrangements and associates
Companies City
% capitalshareholdingsby Nestlé S.A.
% ultimate capital
shareholdings Currency Capital
Consolidated Financial Statements of the Nestlé Group 2018176

AmericasArgentina
Eco de Los Andes S.A. Buenos Aires 50.9% ARS 92 524 285
Galderma Argentina S.A. Buenos Aires 100% ARS 9 900 000
Nestlé Argentina S.A. Buenos Aires 100% 100% ARS 233 316 000
Bolivia
Industrias Alimentícias Fagal S.R.L. Santa Cruz 98.5% 100% BOB 175 556 000
Nestlé Bolivia S.A. Santa Cruz 99% 100% BOB 191 900
Brazil
Chocolates Garoto S.A. Vila Velha 100% BRL 264 766 192
Dairy Partners Americas Manufacturing Brasil Ltda São Paulo 100% BRL 39 468 974
Galderma Brasil Ltda São Paulo 100% BRL 299 741 602
Nestlé Brasil Ltda São Paulo 100% 100% BRL 452 985 643
Nestlé Nordeste Alimentos e Bebidas Ltda Feira de Santana 100% BRL 259 547 969
Nestlé Sudeste Alimentos e Bebidas Ltda São Paulo 100% BRL 109 317 818
Nestlé Sul – Alimentos e Bebidas Ltda Carazinho 100% BRL 73 049 736
Nestlé Waters Brasil – Bebidas e Alimentos Ltda ° São Paulo 100% 100% BRL 87 248 341
Ralston Purina do Brasil Ltda ° Ribeirão Preto 100% 100% BRL 17 976 826
SOCOPAL – Sociedade Comercial de Corretagem
de Seguros e de Participações Ltda ° São Paulo 100% 100% BRL 2 155 600
CPW Brasil Ltda 1) Caçapava 50% BRL 7 885 520
Dairy Partners Americas Brasil Ltda 3) São Paulo 49% 49% BRL 300 806 368
Dairy Partners Americas Nordeste – Produtos
Alimentícios Ltda 3) Garanhuns 49% BRL 100 000
Canada
Atrium Innovations Inc. Westmount (Québec) 99.6% 99.6% CAD 488 907 443
G. Production Canada Inc. Baie D’Urfé (Québec) 100% CAD 5 100 000
Galderma Canada Inc.
Saint John
(New Brunswick) 100% CAD 1 000 000
Nestlé Canada Inc. Toronto (Ontario) 65.7% 100% CAD 47 165 540
Nestlé Capital Canada Ltd ◊ Toronto (Ontario) 100% CAD 1 010
Cayman Islands
Hsu Fu Chi International Limited ◊ Grand Cayman 60% 60% SGD 7 950 000
Chile
Galderma Chile Laboratorios Ltda Santiago de Chile 100% CLP 12 330 000
Nespresso Chile S.A. Santiago de Chile 99.7% CLP 1 000 000
Nestlé Chile S.A. Santiago de Chile 99.7% 99.7% CLP 11 832 926 000
Cereales CPW Chile Ltda 1) Santiago de Chile 50% CLP 3 026 156 114
Aguas CCU – Nestlé Chile S.A. 3) Santiago de Chile 49.8% CLP 49 799 375 321
Companies of the Nestlé Group, joint arrangements and associates
Consolidated Financial Statements of the Nestlé Group 2018 177
Companies City
% capitalshareholdingsby Nestlé S.A.
% ultimate capital
shareholdings Currency Capital

Colombia
Comestibles La Rosa S.A. Bogotá 52.4% 100% COP 126 397 400
Dairy Partners Americas Manufacturing Colombia Ltda Bogotá 99.8% 100% COP 200 000 000
Galderma de Colombia S.A. Bogotá 100% COP 2 250 000 000
Nestlé de Colombia S.A. Bogotá 100% 100% COP 1 291 305 400
Nestlé Purina PetCare de Colombia S.A. Bogotá <0.1% 100% COP 17 030 000 000
Costa Rica
Compañía Nestlé Costa Rica S.A. Heredia 100% 100% CRC 18 000 000
Cuba
Coralac S.A. La Habana 60% USD 6 350 000
Los Portales S.A. La Habana 50% USD 24 110 000
Nescor, S.A. ° Artemisa 50.9% 50.9% USD 32 200 000
Dominican Republic
Nestlé Dominicana S.A. Santo Domingo 98.7% 99.9% DOP 1 657 445 000
Silsa Dominicana S.A. Santo Domingo 99.9% USD 50 000
Ecuador
Ecuajugos S.A. Quito 100% 100% USD 521 583
Industrial Surindu S.A. Quito <0.1% 100% USD 3 000 000
Nestlé Ecuador S.A. Quito 100% 100% USD 1 776 760
Terrafertil S.A. Tabacundo 60% USD 525 800
El Salvador
Nestlé El Salvador, S.A. de C.V. San Salvador 100% 100% USD 4 457 200
Guatemala
Compañía de Servicios de Distribucion, S.A. ° Guatemala City 100% 100% GTQ 50 000
Genoveva, S.A. ° Guatemala City 100% 100% GTQ 4 598 400
Industrias Consolidadas de Occidente, S.A. ° Chimaltenango 100% 100% GTQ 300 000
Malher Export S.A. ° Guatemala City 100% 100% GTQ 5 000
Malher, S.A. Guatemala City 100% 100% GTQ 100 000 000
Nestlé Guatemala S.A. Guatemala City 35% 100% GTQ 23 460 600
SERESA, Contratación de Servicios Empresariales, S.A. Guatemala City 100% 100% GTQ 25 000
TESOCORP, S.A. ° Guatemala City 100% 100% GTQ 5 000
Honduras
Malher de Honduras, S.A. de C.V. ° Tegucigalpa 83.2% 100% HNL 25 000
Nestlé Hondureña S.A. Tegucigalpa 95% 100% PAB 200 000
Companies of the Nestlé Group, joint arrangements and associates
Companies City
% capitalshareholdingsby Nestlé S.A.
% ultimate capital
shareholdings Currency Capital
Consolidated Financial Statements of the Nestlé Group 2018178

Jamaica
Nestlé Jamaica Ltd Kingston 100% 100% JMD 49 200 000
Mexico
Galderma México, S.A. de C.V. México, D.F. 100% MXN 2 385 000
Malhemex, S.A. de C.V. ° México, D.F. 100% 100% MXN 50 000
Manantiales La Asunción, S.A.P.I. de C.V.(c) México, D.F. 40% MXN 1 035 827 492
Marcas Nestlé, S.A. de C.V. México, D.F. <0.1% 100% MXN 500 050 000
Nescalín, S.A. de C.V. ◊ México, D.F. 100% 100% MXN 445 826 740
Nespresso México, S.A. de C.V. México, D.F. <0.1% 100% MXN 10 050 000
Nestlé Holding México, S.A. de C.V. ◊° México, D.F. 100% 100% MXN 50 000
Nestlé México, S.A. de C.V. México, D.F. <0.1% 100% MXN 607 532 730
Nestlé Servicios Corporativos, S.A. de C.V. México, D.F. <0.1% 100% MXN 170 100 000
Nestlé Servicios Industriales, S.A. de C.V. México, D.F. 100% MXN 1 050 000
Productos Gerber, S.A. de C.V. Queretaro 100% MXN 5 252 440
Ralston Purina México, S.A. de C.V. México, D.F. <0.1% 100% MXN 9 257 112
Terrafertil México S.A.P.I. de C.V. Tultitlán 60% MXN 11 485 560
Waters Partners Services México, S.A.P.I. de C.V.(c) México, D.F. 40% MXN 620 000
CPW México, S. de R.L. de C.V. 1) México, D.F. 50% MXN 708 138 000
Nicaragua
Compañía Centroamericana de Productos Lácteos, S.A. Managua 66.1% 92.6% NIO 10 294 900
Nestlé Nicaragua, S.A. Managua 95% 100% USD 150 000
Panama
Nestlé Centroamérica, S.A. Panamá City 100% 100% USD 1 000 000
Nestlé Panamá, S.A. Panamá City 100% 100% PAB 17 500 000
Unilac, Inc. ◊ Panamá City 100% 100% USD 750 000
Paraguay
Nestlé Business Services Latam S.A. ° Asunción 99.9% 100% PYG 100 000 000
Nestlé Paraguay S.A. Asunción 100% 100% PYG 100 000 000
Peru
Nestlé Marcas Perú, S.A.C. Lima 50% 100% PEN 5 536 832
Nestlé Perú, S.A. Lima 99.5% 99.5% PEN 88 964 263
Puerto Rico
Nestlé Puerto Rico, Inc. San Juan 100% 100% USD 500 000
Payco Foods Corporation Bayamon 100% USD 890 000
(c) Voting powers amount to 51%
Companies of the Nestlé Group, joint arrangements and associates
Consolidated Financial Statements of the Nestlé Group 2018 179
Companies City
% capitalshareholdingsby Nestlé S.A.
% ultimate capital
shareholdings Currency Capital

Trinidad and Tobago
Nestlé Caribbean, Inc. Valsayn 95% 100% USD 100 000
Nestlé Trinidad and Tobago Ltd Valsayn 100% 100% TTD 35 540 000
United States
BBC New Holdings, LLC ◊ Wilmington (Delaware) 68.1% USD 0
Blue Bottle Coffee, Inc. Wilmington (Delaware) 68.1% USD 0
Chameleon Cold Brew, LLC Wilmington (Delaware) 100% USD 0
Checkerboard Holding Company, Inc. ◊ Wilmington (Delaware) 100% USD 1 001
Dreyer’s Grand Ice Cream Holdings, Inc. ◊ Wilmington (Delaware) 100% USD 10
Foundry Foods, Inc. Wilmington (Delaware) 100% USD 1
Galderma Research and Development, LLC Wilmington (Delaware) 100% USD 2 050 000
Garden of Life LLC Wilmington (Delaware) 100% USD —
Gerber Products Company Fremont (Michigan) 100% USD 1 000
HVL LLC Wilmington (Delaware) 100% USD —
Lieberman Productions LLC Sacramento (California) 75% USD —
Lifelong Nutrition Inc. Wilmington (Delaware) 50% USD 1 200
Malher, Inc. Stafford (Texas) 100% USD 1 000
Merrick Pet Care, Inc. Dallas (Texas) 100% USD 1 000 000
Merrick Pet Care Holdings Corporation ◊ Wilmington (Delaware) 100% USD 100
Nespresso USA, Inc. Wilmington (Delaware) 100% USD 1 000
Nestlé Capital Corporation ◊ Wilmington (Delaware) 100% USD 1 000 000
Nestlé Dreyer’s Ice Cream Company Wilmington (Delaware) 100% USD 1
Nestlé Health Science US Holdings, Inc. ◊ Wilmington (Delaware) 100% USD 1
Nestlé HealthCare Nutrition, Inc. Wilmington (Delaware) 100% USD 50 000
Nestlé Holdings, Inc. ◊ Wilmington (Delaware) 100% USD 100 000
Nestlé Insurance Holdings, Inc. ◊ Wilmington (Delaware) 100% USD 10
Nestlé Nutrition R&D Centers, Inc. Wilmington (Delaware) 100% USD 10 000
Nestlé Prepared Foods Company Philadelphia
(Pennsylvania) 100% USD 476 760
Nestlé Purina PetCare Company St. Louis (Missouri) 100% USD 1 000
Nestlé Purina PetCare Global Resources, Inc. Wilmington (Delaware) 100% USD 1 000
Nestlé R&D Center, Inc. Wilmington (Delaware) 100% USD 10 000
Nestlé Regional GLOBE Offi ce North America, Inc. Wilmington (Delaware) 100% USD 1 000
Nestlé Transportation Company Wilmington (Delaware) 100% USD 100
Nestlé US Holdco, Inc. ◊ Wilmington (Delaware) 100% USD 1
Nestlé USA, Inc. Wilmington (Delaware) 100% USD 1 000
Nestlé Waters North America Holdings, Inc. ◊ Wilmington (Delaware) 100% USD 10 000 000
Nestlé Waters North America, Inc. Wilmington (Delaware) 100% USD 10 700 000
NiMCo US, Inc. ◊ Wilmington (Delaware) 100% USD 10
NSH Services Inc. Fort Worth (Texas) 100% USD 981
Prometheus Laboratories Inc. San Diego (California) 100% USD 100
Pure Encapsulations, LLC Wilmington (Delaware) 100% USD —
Companies of the Nestlé Group, joint arrangements and associates
Companies City
% capitalshareholdingsby Nestlé S.A.
% ultimate capital
shareholdings Currency Capital
Consolidated Financial Statements of the Nestlé Group 2018180
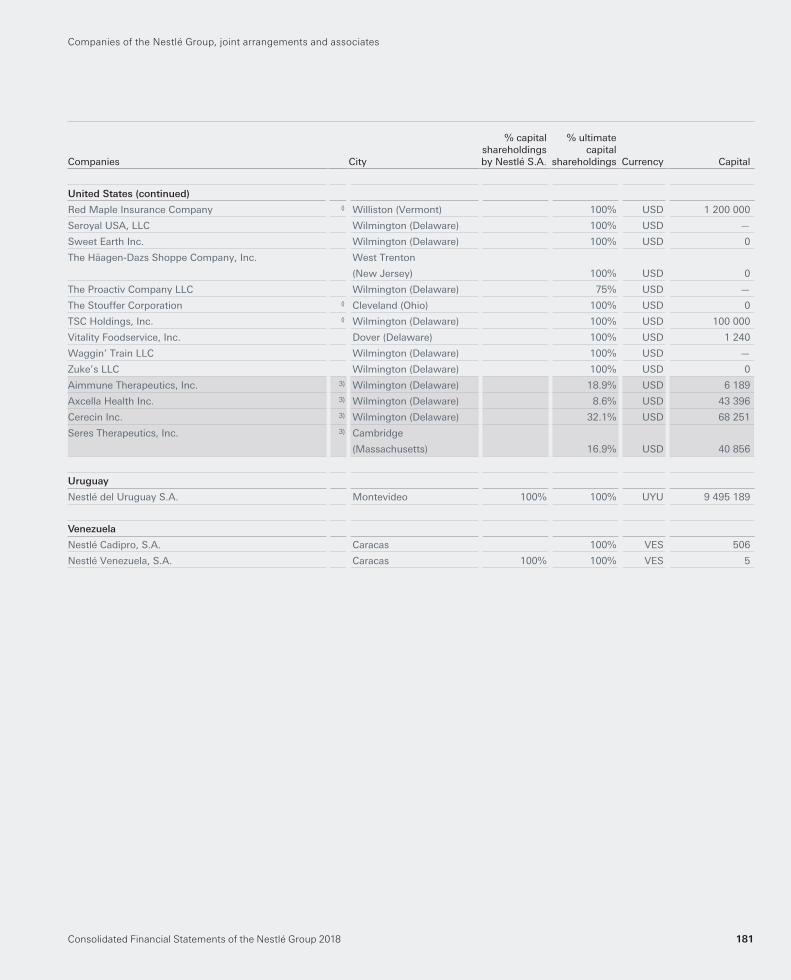
United States (continued)
Red Maple Insurance Company ◊ Williston (Vermont) 100% USD 1 200 000
Seroyal USA, LLC Wilmington (Delaware) 100% USD —
Sweet Earth Inc. Wilmington (Delaware) 100% USD 0
The Häagen-Dazs Shoppe Company, Inc. West Trenton
(New Jersey) 100% USD 0
The Proactiv Company LLC Wilmington (Delaware) 75% USD —
The Stouffer Corporation ◊ Cleveland (Ohio) 100% USD 0
TSC Holdings, Inc. ◊ Wilmington (Delaware) 100% USD 100 000
Vitality Foodservice, Inc. Dover (Delaware) 100% USD 1 240
Waggin’ Train LLC Wilmington (Delaware) 100% USD —
Zuke’s LLC Wilmington (Delaware) 100% USD 0
Aimmune Therapeutics, Inc. 3) Wilmington (Delaware) 18.9% USD 6 189
Axcella Health Inc. 3) Wilmington (Delaware) 8.6% USD 43 396
Cerecin Inc. 3) Wilmington (Delaware) 32.1% USD 68 251
Seres Therapeutics, Inc. 3) Cambridge
(Massachusetts) 16.9% USD 40 856
Uruguay
Nestlé del Uruguay S.A. Montevideo 100% 100% UYU 9 495 189
Venezuela
Nestlé Cadipro, S.A. Caracas 100% VES 506
Nestlé Venezuela, S.A. Caracas 100% 100% VES 5
Companies of the Nestlé Group, joint arrangements and associates
Consolidated Financial Statements of the Nestlé Group 2018 181
Companies City
% capitalshareholdingsby Nestlé S.A.
% ultimate capital
shareholdings Currency Capital
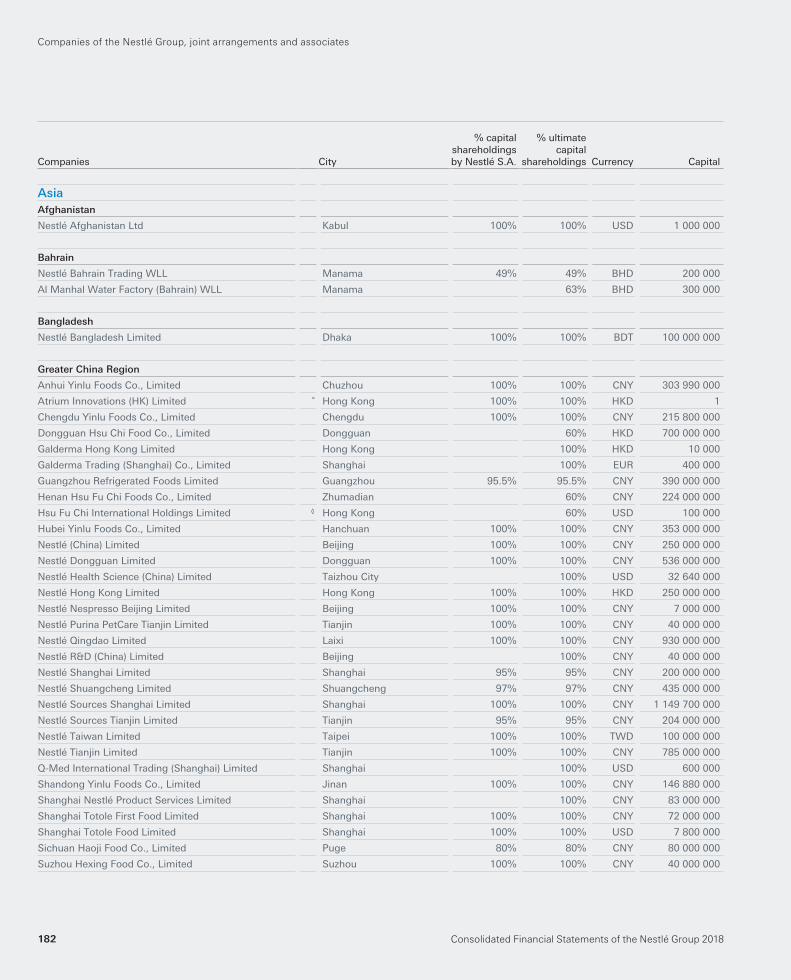
AsiaAfghanistan
Nestlé Afghanistan Ltd Kabul 100% 100% USD 1 000 000
Bahrain
Nestlé Bahrain Trading WLL Manama 49% 49% BHD 200 000
Al Manhal Water Factory (Bahrain) WLL Manama 63% BHD 300 000
Bangladesh
Nestlé Bangladesh Limited Dhaka 100% 100% BDT 100 000 000
Greater China Region
Anhui Yinlu Foods Co., Limited Chuzhou 100% 100% CNY 303 990 000
Atrium Innovations (HK) Limited ° Hong Kong 100% 100% HKD 1
Chengdu Yinlu Foods Co., Limited Chengdu 100% 100% CNY 215 800 000
Dongguan Hsu Chi Food Co., Limited Dongguan 60% HKD 700 000 000
Galderma Hong Kong Limited Hong Kong 100% HKD 10 000
Galderma Trading (Shanghai) Co., Limited Shanghai 100% EUR 400 000
Guangzhou Refrigerated Foods Limited Guangzhou 95.5% 95.5% CNY 390 000 000
Henan Hsu Fu Chi Foods Co., Limited Zhumadian 60% CNY 224 000 000
Hsu Fu Chi International Holdings Limited ◊ Hong Kong 60% USD 100 000
Hubei Yinlu Foods Co., Limited Hanchuan 100% 100% CNY 353 000 000
Nestlé (China) Limited Beijing 100% 100% CNY 250 000 000
Nestlé Dongguan Limited Dongguan 100% 100% CNY 536 000 000
Nestlé Health Science (China) Limited Taizhou City 100% USD 32 640 000
Nestlé Hong Kong Limited Hong Kong 100% 100% HKD 250 000 000
Nestlé Nespresso Beijing Limited Beijing 100% 100% CNY 7 000 000
Nestlé Purina PetCare Tianjin Limited Tianjin 100% 100% CNY 40 000 000
Nestlé Qingdao Limited Laixi 100% 100% CNY 930 000 000
Nestlé R&D (China) Limited Beijing 100% CNY 40 000 000
Nestlé Shanghai Limited Shanghai 95% 95% CNY 200 000 000
Nestlé Shuangcheng Limited Shuangcheng 97% 97% CNY 435 000 000
Nestlé Sources Shanghai Limited Shanghai 100% 100% CNY 1 149 700 000
Nestlé Sources Tianjin Limited Tianjin 95% 95% CNY 204 000 000
Nestlé Taiwan Limited Taipei 100% 100% TWD 100 000 000
Nestlé Tianjin Limited Tianjin 100% 100% CNY 785 000 000
Q-Med International Trading (Shanghai) Limited Shanghai 100% USD 600 000
Shandong Yinlu Foods Co., Limited Jinan 100% 100% CNY 146 880 000
Shanghai Nestlé Product Services Limited Shanghai 100% CNY 83 000 000
Shanghai Totole First Food Limited Shanghai 100% 100% CNY 72 000 000
Shanghai Totole Food Limited Shanghai 100% 100% USD 7 800 000
Sichuan Haoji Food Co., Limited Puge 80% 80% CNY 80 000 000
Suzhou Hexing Food Co., Limited Suzhou 100% 100% CNY 40 000 000
Companies of the Nestlé Group, joint arrangements and associates
Companies City
% capitalshareholdingsby Nestlé S.A.
% ultimate capital
shareholdings Currency Capital
Consolidated Financial Statements of the Nestlé Group 2018182

Greater China Region (continued)
Wyeth (Hong Kong) Holding Co., Limited ◊ Hong Kong 100% 100% HKD 3 554 107 000
Wyeth (Shanghai) Trading Co., Limited Shanghai 100% USD 1 000 000
Wyeth Nutritional (China) Co., Limited Suzhou 100% CNY 900 000 000
Xiamen Yinlu Foods Group Co., Limited Xiamen 100% 100% CNY 496 590 000
Yunnan Dashan Drinks Co., Limited Kunming 100% 100% CNY 35 000 000
India
Nestlé India Ltd Δ New Delhi 34.3% 62.8% INR 964 157 160
Listed on the Bombay Stock Exchange, market capitalization INR 1069.0 billion, quotation code (ISIN) INE239A01016
Nestlé R&D Centre India Private Ltd ° New Delhi 100% 100% INR 2 101 380 000
Nestlé Skin Health India Private Ltd Mumbai 100% INR 24 156 000
Purina Petcare India Private Ltd ° New Delhi 97% 100% INR 20 000 000
SMA Nutrition India Private Limited ° New Delhi 97% 100% INR 22 000 000
Indonesia
P.T. Nestlé Indonesia Jakarta 90.2% 90.2% IDR 152 753 440 000
P.T. Nestlé Trading Indonesia ° Jakarta 1% 90.3% IDR 60 000 000 000
P.T. Wyeth Nutrition Sduaenam Jakarta 90% IDR 2 000 000 000
Iran
Nestlé Parsian (Private Joint Stock Company) Tehran 60% 60% IRR 1 000 000 000
Nestlé Iran (Private Joint Stock Company) Tehran 95.9% 95.9% IRR 358 538 000 000
Nestlé Waters Iranian Tehran 100% IRR 35 300 000 000
Israel
Assamim Gift Parcels Ltd Shoam 73.8% ILS 103
Beit Hashita – Asis Limited Partnership Kibbutz Beit Hashita 100% ILS 11 771 000
Materna Industries Limited Partnership Kibbutz Maabarot 100% ILS 10 000
Migdanot Habait Ltd Shoam 100% ILS 4 014
Nespresso Israel Ltd Tel Aviv 100% 100% ILS 1 000
Noga Ice Cream Limited Partnership Shoam 100% ILS 1 000
OSEM Food Industries Ltd Shoam 100% ILS 176
OSEM Group Commerce Limited Partnership Shoam 100% ILS 100
OSEM Investments Ltd Shoam 100% 100% ILS 110 644 443
Tivall Food Industries Ltd Kiryat Gat 100% ILS 41 861 167
Japan
Blue Bottle Coffee Japan, G.K. Tokyo 68.1% JPY 10 000 000
Galderma K.K. Tokyo 100% JPY 10 000 000
Nestlé Japan Ltd Kobe 100% 100% JPY 10 000 000 000
Nestlé Nespresso K.K. Kobe 100% JPY 10 000 000
Nestlé Skin Health Y.K. Tokyo 75% JPY 3 000 000
The Proactiv Company K.K. Tokyo 75% JPY 10 000 000
Companies of the Nestlé Group, joint arrangements and associates
Consolidated Financial Statements of the Nestlé Group 2018 183
Companies City
% capitalshareholdingsby Nestlé S.A.
% ultimate capital
shareholdings Currency Capital

Jordan
Ghadeer Mineral Water Co. WLL Amman 75% JOD 1 785 000
Nestlé Jordan Trading Company Ltd Amman 50% 77.8% JOD 410 000
Kuwait
Nestlé Kuwait General Trading Company WLL Safat 49% 49% KWD 300 000
Lebanon
Société des Eaux Minérales Libanaises S.A.L. Hazmieh 100% LBP 1 610 000 000
Société pour l’Exportation des Produits Nestlé S.A. Baabda 100% 100% CHF 1 750 000
SOHAT Distribution S.A.L. Hazmieh 100% LBP 160 000 000
Malaysia
Nestlé (Malaysia) Bhd. Δ◊ Petaling Jaya 72.6% 72.6% MYR 267 500 000
Listed on the Kuala Lumpur stock exchange, market capitalization MYR 34.6 billion, quotation code (ISIN) MYL4707OO005
Nestlé Asean (Malaysia) Sdn. Bhd. Petaling Jaya 72.6% MYR 42 000 000
Nestlé Manufacturing (Malaysia) Sdn. Bhd. Petaling Jaya 72.6% MYR 132 500 000
Nestlé Products Sdn. Bhd. Petaling Jaya 72.6% MYR 28 500 000
Nestlé Regional Service Centre (Malaysia) Sdn. Bhd. ° Petaling Jaya 100% 100% MYR 1 000 000
Purina PetCare (Malaysia) Sdn. Bhd. Petaling Jaya 100% 100% MYR 1 100 000
Wyeth Nutrition (Malaysia) Sdn. Bhd. Petaling Jaya 100% MYR 1 969 505
Cereal Partners (Malaysia) Sdn. Bhd. 1) Petaling Jaya 50% 50% MYR 2 500 000
Myanmar
Nestlé Myanmar Limited ° Yangon 96% 96% USD 6 246 070
Oman
Nestlé Oman Trading LLC Muscat 49% 49% OMR 300 000
Pakistan
Nestlé Pakistan Ltd Δ Lahore 59% 59% PKR 453 495 840
Listed on the Pakistan Stock Exchange, market capitalization PKR 408.1 billion, quotation code (ISIN) PK0025101012
Palestinian Territories
Nestlé Trading Private Limited Company Bethlehem 97.5% 97.5% JOD 200 000
Philippines
Galderma Philippines, Inc. Manila 100% PHP 12 500 000
Nestlé Business Services AOA, Inc. Bulacan 100% 100% PHP 70 000 000
Nestlé Philippines, Inc. Cabuyao 55% 100% PHP 2 300 927 400
Penpro, Inc. (d) ◊ Makati City 88.5% PHP 630 000 000
Wyeth Philippines, Inc. Makati City 100% 100% PHP 610 418 100
CPW Philippines, Inc. 1) Makati City 50% 50% PHP 7 500 000
(d) Voting powers amount to 40%
Companies of the Nestlé Group, joint arrangements and associates
Companies City
% capitalshareholdingsby Nestlé S.A.
% ultimate capital
shareholdings Currency Capital
Consolidated Financial Statements of the Nestlé Group 2018184

Qatar
Al Manhal Water Factory Co. Ltd WLL Doha 51% QAR 5 500 000
Nestlé Qatar Trading LLC Doha 49% 49% QAR 1 680 000
Republic of Korea
Galderma Korea Ltd Seoul 100% KRW 500 000 000
Nestlé Korea Yuhan Chaegim Hoesa Seoul 100% 100% KRW 15 594 500 000
Pulmuone Waters Co., Ltd Gyeonggi-Do 51% KRW 6 778 760 000
LOTTE-Nestlé (Korea) Co., Ltd °1) Cheongju 50% 50% KRW 52 783 120 000
Saudi Arabia
Al Anhar Water Factory Co. Ltd Jeddah 64% SAR 7 500 000
Al Manhal Water Factory Co. Ltd Riyadh 64% SAR 7 000 000
Nestlé Saudi Arabia LLC Jeddah 75% SAR 27 000 000
Nestlé Water Factory Co. Ltd Riyadh 64% SAR 15 000 000
Pure Water Factory Co. Ltd Madinah 64% SAR 5 000 000
SHAS Company for Water Services Ltd Riyadh 64% SAR 13 500 000
Springs Water Factory Co. Ltd Dammam 64% SAR 5 000 000
Singapore
Galderma Singapore Private Ltd Singapore 100% SGD 1 387 000
Nestlé R&D Center (Pte) Ltd Singapore 100% SGD 20 000 000
Nestlé Singapore (Pte) Ltd Singapore 100% 100% SGD 1 000 000
Nestlé TC Asia Pacifi c Pte Ltd ◊ Singapore 100% 100% JPY
SGD
10 000 000 000
2
Wyeth Nutritionals (Singapore) Pte Ltd Singapore 100% 100% SGD 2 059 971 715
Sri Lanka
Nestlé Lanka PLC Δ Colombo 90.8% 90.8% LKR 537 254 630
Listed on the Colombo stock exchange, market capitalization LKR 91.3 billion, quotation code (ISIN) LK0128N00005
Syria
Nestlé Syria S.A. Damascus 99.9% 99.9% SYP 800 000 000
Thailand
Arun Saeng Ltd ° Bangkok 100% 100% THB 250 000
Galderma (Thailand) Ltd Bangkok 100% THB 100 000 000
Nestlé (Thai) Ltd Bangkok 100% 100% THB 880 000 000
Nestlé Trading (Thailand) Ltd ° Bangkok 100% 100% THB 3 000 000
Perrier Vittel (Thailand) Ltd Bangkok 100% THB 235 000 000
Quality Coffee Products Ltd Bangkok 49% 50% THB 500 000 000
Companies of the Nestlé Group, joint arrangements and associates
Consolidated Financial Statements of the Nestlé Group 2018 185
Companies City
% capitalshareholdingsby Nestlé S.A.
% ultimate capital
shareholdings Currency Capital

United Arab Emirates
Nestlé Dubai Manufacturing LLC Dubai 49% 49% AED 300 000
Nestlé Middle East FZE Dubai 100% 100% AED 3 000 000
Nestlé Middle East Manufacturing LLC ° Dubai 49% 49% AED 300 000
Nestlé Middle East Marketing FZE Dubai 100% AED 1 000 000
Nestlé Treasury Centre-Middle East & Africa Ltd ◊ Dubai 100% 100% USD 2 997 343 684
Nestlé UAE LLC Dubai 49% 49% AED 2 000 000
Nestlé Waters Factory H&O LLC Dubai 48% AED 22 300 000
CP Middle East FZCO 1) Dubai 50% 50% AED 600 000
Uzbekistan
Nestle Food MChJ ° Namangan 53.9% 100% UZS 46 227 969
Nestle Uzbekistan MChJ Namangan 96.4% 100% USD 38 715 463
Vietnam
La Vie Limited Liability Company Long An 65% USD 2 663 400
Nestlé Vietnam Ltd Bien Hoa 100% 100% KVND 1 261 151 498
Companies of the Nestlé Group, joint arrangements and associates
Companies City
% capitalshareholdingsby Nestlé S.A.
% ultimate capital
shareholdings Currency Capital
Consolidated Financial Statements of the Nestlé Group 2018186

OceaniaAustralia
Galderma Australia Pty Ltd Belrose 100% AUD 2 500 300
Nestlé Australia Ltd Sydney 100% 100% AUD 274 000 000
Cereal Partners Australia Pty Ltd 1) Sydney 50% AUD 107 800 000
Fiji
Nestlé (Fiji) Ltd Lami 33% 100% FJD 3 000 000
French Polynesia
Nestlé Polynésie S.A.S. Papeete 100% 100% XPF 5 000 000
New Caledonia
Nestlé Nouvelle-Calédonie S.A.S. Nouméa 100% 100% XPF 64 000 000
New Zealand
Nestlé New Zealand Limited Auckland 100% 100% NZD 300 000
CPW New Zealand 1) Auckland 50% NZD —
Papua New Guinea
Nestlé (PNG) Ltd Lae 100% 100% PGK 11 850 000
Companies of the Nestlé Group, joint arrangements and associates
Consolidated Financial Statements of the Nestlé Group 2018 187
Companies City
% capitalshareholdingsby Nestlé S.A.
% ultimate capital
shareholdings Currency Capital

Switzerland
Nestec S.A. Vevey TA
Nestlé Institute of Health Sciences Ecublens R
Nestlé Product Technology Centre Beverage Orbe PTC
Nestlé Product Technology Centre Dairy Konolfi ngen PTC
Nestlé Product Technology Centre Nestlé Nutrition Konolfi ngen PTC
Nestlé Product Technology Centre Nestlé Professional Orbe PTC
Nestlé Research Centre Lausanne R
Nestlé System Technology Centre Orbe R and
PTC
CPW R&D Centre 1) Orbe R&D
Australia
CPW R&D Centre 1) Wahgunyah R&D
Chile
Nestlé Development Centre Santiago de Chile D
Côte d’Ivoire
Nestlé R&D Centre Abidjan R&D
France
Galderma R&D Centre Biot R&D
Nestlé Development Centre Dairy Lisieux D
Nestlé Product Technology Centre Water Vittel PTC
Nestlé R&D Centre Aubigny R&D
Nestlé R&D Centre Tours R&D
Froneri Development Center Glaces S.A.S. 1) Beauvais PTC
Technical assistance, research and development units
All scientifi c research and technological development is undertaken in a number of dedicated
centres, specialized as follows:
Technical Assistance TA
Development centres D
Research centres R
Research & Development centres R&D
Product Technology centres PTC
The Technical Assistance centre is Nestec Ltd, a technical, scientifi c, commercial and business
assistance company. The units of Nestec Ltd, specialized in all areas of the business, supply
permanent know-how and assistance to operating companies in the Group within the framework
of licence and equivalent contracts. Nestec Ltd is also responsible for all scientifi c research and
technological development, which it undertakes itself or through affi liated companies.
The centres involved are listed below:
Companies of the Nestlé Group, joint arrangements and associates
Consolidated Financial Statements of the Nestlé Group 2018188
City of operations

Germany
Nestlé Product Technology Centre Food Singen PTC
Greater China Region
Nestlé R&D Centre Beijing R&D
India
Nestlé Development Centre Gurgaon D
Republic of Ireland
Nestlé Development Centre Askeaton D
Singapore
Nestlé Development Centre Singapore D
Sweden
Galderma R&D Centre Uppsala R&D
United Kingdom
Nestlé Product Technology Centre Confectionery York PTC
CPW R&D Centre 1) Staverton R&D
United States
Galderma R&D Centre Fort Worth (Texas) R&D
Nestlé Development Centre Fremont (Michigan) D
Nestlé Development Centre Marysville (Ohio) D
Nestlé Development Centre Solon (Ohio) D
Nestlé Product Technology Centre Health Science Bridgewater (New Jersey) PTC
Nestlé Product Technology Centre Ice Cream Bakersfi eld (California) PTC
Nestlé Product Technology Centre PetCare St. Louis (Missouri) PTC
Nestlé R&D Centre San Diego (California) R&D
Nestlé R&D Centre St. Joseph (Missouri) R&D
Companies of the Nestlé Group, joint arrangements and associates
Consolidated Financial Statements of the Nestlé Group 2018 189
City of operations

Consolidated Financial Statements of the Nestlé Group 2018190

152nd Financial Statementsof Nestlé S.A.
152nd Financial Statements of Nestlé S.A. 191

152nd Financial Statements of Nestlé S.A.192
Income statement for the year ended
December 31, 2018
Balance sheet as at December 31, 2018
Notes to the annual accounts
1. Accounting policies
2. Income from Group companies
3. Profi t on disposal of assets
4. Financial income
5. Expenses recharged from
Group companies
6. Write-downs and amortization
7. Financial expenses
8. Taxes
9. Cash and cash equivalents
10. Other current receivables
11. Financial assets
12. Shareholdings
13. Intangible assets
14. Interest-bearing liabilities
15. Other current liabilities
16. Provisions
17. Share capital
18. Changes in equity
19. Treasury shares
20. Contingencies
21. Performance Share Units and
shares for members of the Board
and employees granted during the year
22. Full-time equivalents
23. Events after the balance sheet date
24. Shares and stock options
Proposed appropriation of profi t
Statutory Auditor’s Report –
Report on the Audit of the
Financial Statements
193
194
195
195
196
197
198
199
200
201
202
204
206
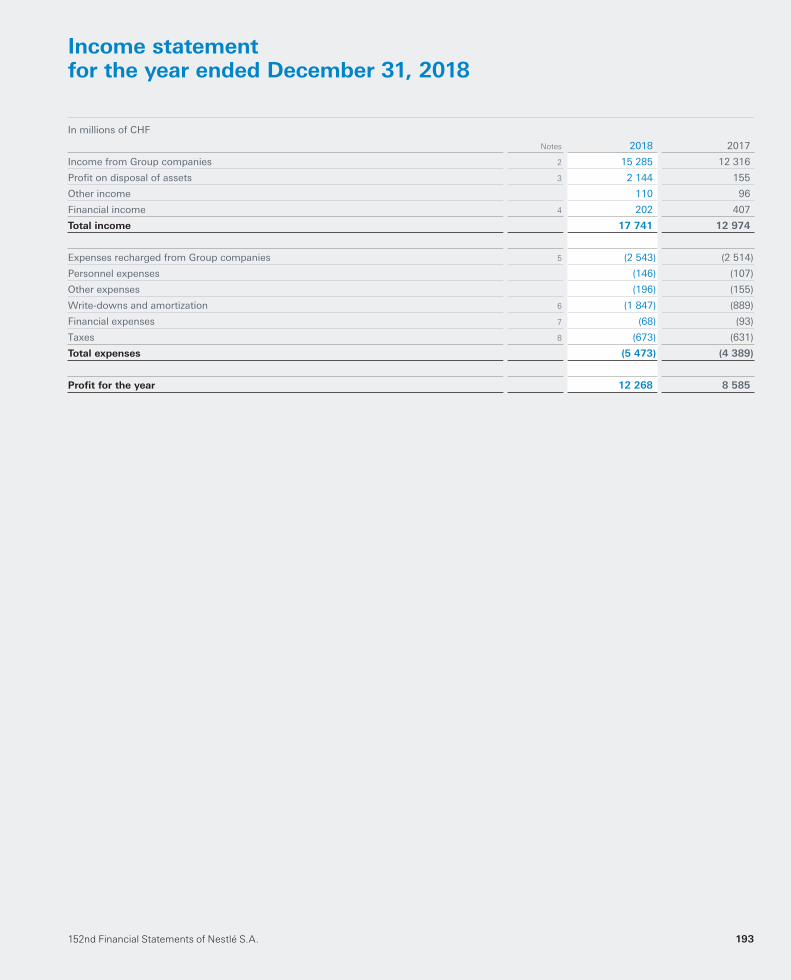
152nd Financial Statements of Nestlé S.A. 193
Income statementfor the year ended December 31, 2018
In millions of CHF
Notes 2018 2017
Income from Group companies 2 15 285 12 316
Profi t on disposal of assets 3 2 144 155
Other income 110 96
Financial income 4 202 407
Total income 17 741 12 974
Expenses recharged from Group companies 5 (2 543) (2 514)
Personnel expenses (146) (107)
Other expenses (196) (155)
Write-downs and amortization 6 (1 847) (889)
Financial expenses 7 (68) (93)
Taxes 8 (673) (631)
Total expenses (5 473) (4 389)
Profi t for the year 12 268 8 585

152nd Financial Statements of Nestlé S.A.194
Balance sheet as at December 31, 2018before appropriations
In millions of CHF
Notes 2018 2017
Assets
Current assets
Cash and cash equivalents 9 262 339
Other current receivables 10 942 724
Prepayments and accrued income 65 32
Total current assets 1 269 1 095
Non-current assets
Financial assets 11 7 857 7 761
Shareholdings 12 28 693 32 006
Property, plant and equipment 1 1
Intangible assets 13 2 518 95
Total non-current assets 39 069 39 863
Total assets 40 338 40 958
Liabilities and equity
Current liabilities
Interest-bearing liabilities 14 2 023 2 734
Other current liabilities 15 2 107 2 162
Accruals and deferred income 12 17
Provisions 16 596 514
Total current liabilities 4 738 5 427
Non-current liabilities
Interest-bearing liabilities 14 1 635 138
Provisions 16 496 507
Total non-current liabilities 2 131 645
Total liabilities 6 869 6 072
Equity
Share capital 17/18 306 311
Legal retained earnings
– General legal reserve 18 1 929 1 924
Voluntary retained earnings
– Special reserve 18 19 299 23 319
– Profi t brought forward 18 6 480 5 111
– Profi t for the year 18 12 268 8 585
Treasury shares 18/19 (6 813) (4 364)
Total equity 33 469 34 886
Total liabilities and equity 40 338 40 958

152nd Financial Statements of Nestlé S.A. 195
Notes to the annual accounts
1. Accounting policies
General
Nestlé S.A. (the Company) is the ultimate holding company
of the Nestlé Group, domiciled in Cham and Vevey which
comprises subsidiaries, associated companies and joint
ventures throughout the world.
The accounts are prepared in accordance with
accounting principles required by Swiss law (32nd title of
the Swiss Code of Obligations). They are prepared under the
historical cost convention and on an accrual basis. Where
not prescribed by law, the signifi cant accounting and
valuation principles applied are described below.
Foreign currency translation
Transactions in foreign currencies are recorded at the rate of
exchange at the date of the transaction or, if hedged
forward, at the rate of exchange under the related forward
contract. Non-monetary assets and liabilities are carried at
historical rates. Monetary assets and liabilities in foreign
currencies are translated at year-end rates. Any resulting
exchange differences are included in the respective income
statement captions depending upon the nature of the
underlying transactions. The aggregate unrealized exchange
difference is calculated by reference to original transaction
date exchange rates and includes hedging transactions.
Where this gives rise to a net loss, it is charged to the
income statement whilst a net gain is deferred.
Hedging
The Company uses forward foreign exchange contracts,
options, fi nancial futures and currency swaps to hedge
foreign currency fl ows and positions. Unrealized foreign
exchange differences on hedging instruments are matched
and accounted for with those on the underlying asset or
liability. Long-term loans, in foreign currencies, used to
fi nance investments in shareholdings are generally not
hedged.
The Company also uses interest rate swaps to manage
interest rate risk. The swaps are accounted for at fair value
at each balance sheet date and changes in the market price
are recorded in the income statement.
The positive fair values of forward exchange contracts
and interest rate swaps are included in prepayments and
accrued income. The negative fair values of forward
exchange contracts and interest rate swaps are included in
accruals and deferred income.
Income statement
In accordance with Swiss law dividends are treated as an
appropriation of profi t in the year in which they are ratifi ed
at the Annual General Meeting rather than as an
appropriation of profi t in the year to which they relate.
Taxes
This caption includes taxes on profi t, capital and
withholding taxes on transfers from Group companies.
Shareholdings and fi nancial assets
The carrying value of shareholdings and loans comprises
the cost of investment, excluding the incidental costs of
acquisition, less any write-downs.
Shareholdings located in countries where the political,
economic or monetary situation might be considered to
carry a greater than normal level of risk are carried at
a nominal value of one franc.
Shareholdings and loans are written down on
a conservative basis, taking into account the profi tability of
the company concerned.
Property, plant and equipment
The Company owns land and buildings which have been
depreciated in the past. Offi ce furniture and equipment are
fully depreciated on acquisition.
Intangible assets
Trademarks and other industrial property rights are written
off on acquisition or exceptionally over a longer period, not
exceeding their useful lives.
Provisions
Provisions include present obligations as well as
contingencies. A provision for uninsured risks is constituted
to cover general risks not insured with third parties, such as
consequential loss. Provisions for Swiss taxes are made on
the basis of the Company’s taxable capital, reserves and
profi t for the year. A general provision is maintained to cover
possible foreign tax liabilities.

152nd Financial Statements of Nestlé S.A.196
2. Income from Group companies
This represents dividends and other income from Group companies.
3. Profi t on disposal of assets
This represents mainly the net gains realized on the sale of fi nancial assets, trademarks
and other industrial property rights previously written down. In 2018, the net gain of
CHF 1431 million on the sale of the US confectionery business is included.
4. Financial income
In millions of CHF
2018 2017
Income on loans to Group companies 202 407
202 407
5. Expenses recharged from Group companies
Expenses of central service companies recharged to Nestlé S.A.
6. Write-downs and amortization
In millions of CHF
2018 2017
Shareholdings and loans 1 481 735
Trademarks and other industrial property rights 366 154
1 847 889

152nd Financial Statements of Nestlé S.A. 197
7. Financial expenses
In millions of CHF
2018 2017
Expenses related to loans from Group companies 51 6
Other fi nancial expenses 17 87
68 93
8. Taxes
In millions of CHF
2018 2017
Direct taxes 241 191
Withholding taxes on income from foreign sources 432 440
673 631
9. Cash and cash equivalents
Cash and cash equivalents include deposits with maturities of less than three months.
10. Other current receivables
In millions of CHF
2018 2017
Amounts owed by Group companies (current accounts) 903 693
Other receivables 39 31
942 724
11. Financial assets
In millions of CHF
2018 2017
Loans to Group companies 7 842 7 752
Other investments 15 9
7 857 7 761

152nd Financial Statements of Nestlé S.A.198
12. Shareholdings
In millions of CHF
2018 2017
At January 1 32 006 31 175
Net increase/(decrease) (2 621) 1 527
Write-downs (692) (696)
At December 31 28 693 32 006
A list of direct and signifi cant indirect Group companies held by Nestlé S.A. with the
percentage of the capital controlled is included in the Consolidated Financial Statements
of the Nestlé Group.
13. Intangible assets
This amount represents the unamortized balance of the trademarks and other industrial
property rights capitalized in relation with the acquisition of Atrium and of the acquired
perpetual rights to market, sell and distribute certain Starbucks’ consumer and
foodservice products globally, except the United States of America.
14. Interest-bearing liabilities
Current interest-bearing liabilities are amounts owed to Group companies.
In millions of CHF
Issuer Face
val
ue
in m
illio
ns
Co
up
on
Eff
ecti
vein
tere
stra
te
Yea
r o
fis
sue/
mat
uri
ty
2018 2017
Nestlé S.A., Switzerland CHF 600 0.75% 0.69% 2018–2028 603 –
CHF 900 0.25% 0.26% 2018–2024 899 –
Total carrying amount 1 502 –
Non-current interest-bearing liabilities concern two bonds issued by Nestlé S.A.
on June 28, 2018, and one amount owed to a Group company. As of December 31, 2017,
they concern one amount owed to a Group company.

152nd Financial Statements of Nestlé S.A. 199
15. Other current liabilities
In millions of CHF
2018 2017
Amounts owed to Group companies 1 897 1 847
Other liabilities 210 315
2 107 2 162
16. Provisions
In millions of CHF
2018 2017
Uninsured risks
Exchangerisks
Swiss andforeign
taxes Other Total Total
At January 1 475 207 203 136 1 021 1 261
Provisions made in the period — — 289 82 371 244
Amounts used — — (114) (62) (176) (240)
Unused amounts reversed — (73) (49) (2) (124) (244)
At December 31 475 134 329 154 1 092 1 021
of which expected to be settled within 12 months 596 514
17. Share capital
2018 2017
Number of registered shares of nominal value CHF 0.10 each 3 063 000 000 3 112 160 000
In millions of CHF 306 311
According to article 5 of the Company’s Articles of Association, no person or entity shall
be registered with voting rights for more than 5% of the share capital as recorded in the
commercial register. This limitation on registration also applies to persons who hold some
or all of their shares through nominees pursuant to this article. In addition, article 11
provides that no person may exercise, directly or indirectly, voting rights, with respect
to own shares or shares represented by proxy, in excess of 5% of the share capital as
recorded in the commercial register.
At December 31, 2018, the share register showed 157 457 registered shareholders. If
unprocessed applications for registration, the indirect holders of shares under American
Depositary Receipts and the benefi cial owners of shareholders registered as nominees
are also taken into account, the total number of shareholders probably exceeds 250 000.
The Company was not aware of any shareholder holding, directly or indirectly, 5% or
more of the share capital.

152nd Financial Statements of Nestlé S.A.200
18. Changes in equity
In millions of CHF
Sharecapital
Generallegal
reserve Specialreserve
Retainedearnings
Treasuryshares Total
At January 1, 2018 311 1 924 23 319 13 696 (4 364) 34 886
Cancellation of 49 160 000 shares (ex-Share Buy-Back Program) (5) 5 (4 112) — 4 112 —
Profi t for the year — — — 12 268 — 12 268
Dividend for 2017 — — — (7 124) — (7 124)
Movement of treasury shares — — — — (6 561) (6 561)
Dividend on treasury shares held on the payment date of 2017
dividend — — 92 (92) — —
At December 31, 2018 306 1 929 19 299 18 748 (6 813) 33 469
19. Treasury shares
In millions of CHF
2018 2017
Number Amount Number Amount
Share Buy-Back Program 78 741 659 6 173 41 578 764 3 487
Long-term incentive plans 9 778 854 640 8 789 045 567
For trading purposes - - 4 238 445 310
88 520 513 6 813 54 606 254 4 364
The share capital has been reduced by 49 160 000 shares from CHF 311 million to
CHF 306 million through the cancellation of shares purchased as part of the Share Buy-
Back Program. The purchase value of those cancelled shares amounts to
CHF 4112 million.
During the year 86 322 895 shares were purchased as part of the Share Buy-Back
Program for CHF 6799 million.
The Company held 9 778 854 shares to cover long-term incentive plans. During the
year 3 248 636 shares were delivered as part of the Nestlé Group remuneration plans for
a total value of CHF 237 million. All treasury shares are valued at acquisition cost.
The total of own shares of 88 520 513 held by Nestlé S.A. at December 31, 2018,
represents 2.9% of the Nestlé S.A. share capital (54 606 254 own shares held at
December 31, 2017, by Nestlé S.A. representing 1.8% of the Nestlé S.A. share capital).

152nd Financial Statements of Nestlé S.A. 201
20. Contingencies
At December 31, 2018, the total of the guarantees mainly for credit facilities granted to
Group companies and commercial paper programs, together with the buy-back
agreements relating to notes issued, amounted to a maximum of CHF 51 969 million
(2017: CHF 47 771 million).
21. Performance Share Units and shares for members
of the Board and employees granted during the year
In millions of CHF
2018 2017
Number Amount Number Amount
Performance Share Units granted to Nestlé S.A. employees (a) 225 780 14 272 418 15
Share plan for short-term bonus Executive Board (b) 54 641 4 112 515 7
Share plan for Board members (c) 81 040 5 85 919 5
361 461 23 470 852 27
(a) Performance Share Units are disclosed at fair value at grant which corresponds to CHF 59.96 in 2018 (2017: CHF 55.96). Includes 180 355 Performance Share Units granted to Executive Board (2017: 193 280).
(b) Shares are valued at the average closing price of the last ten trading days of January, discounted by 16.038% to account for the blocking period of three years.
(c) Shares are valued at the closing price on the ex-dividend date, discounted by 16.038% to account for the blocking period of three years.
22. Full-time equivalents
For Nestlé S.A., the annual average number of full-time equivalents for the reporting year, as
well as the previous year, did not exceed 250.
23. Events after the balance sheet date
There are no subsequent events which either warrant a modifi cation of the value of the
assets and liabilities or any additional disclosure.

152nd Financial Statements of Nestlé S.A.202
24. Shares and stock options
Shares and stock options ownership of the non-executive members
of the Board of Directors and closely related parties
2018 2017
Number of shares
held (a)
Number ofoptions held (b)
Number of shares held (a)
Number ofoptions held (b)
Paul Bulcke, Chairman 1 391 207 — 1 263 185 420 000
Henri de Castries, Vice Chairman, Lead Independent Director 23 829 — 18 940 —
Beat W. Hess 45 649 — 41 429 —
Renato Fassbind 27 141 — 22 921 —
Jean-Pierre Roth 13 875 — 14 531 —
Ann M. Veneman 19 305 — 16 961 —
Eva Cheng 15 783 — 12 769 —
Ruth K. Oniang’o 7 619 — 5 743 —
Patrick Aebischer 4 659 — 2 315 —
Ursula M. Burns 4 196 — 1 852 —
Kasper B. Rorsted 1 876 — — —
Pablo Isla 1 876 — — —
Kimberly A. Ross 2 545 — — —
Members who retired from the Board during 2018 — — 285 762 —
Total as at December 31 1 559 560 — 1 686 408 420 000
(a) Including shares subject to a three-year blocking period.(b) The ratio is one option for one Nestlé S.A. share.

152nd Financial Statements of Nestlé S.A. 203
Shares and stock options ownership of the members of the Executive Board
and closely related parties
2018 2017
Number ofsharesheld (a)
Number ofoptions held (b)
Number ofsharesheld (a)
Number ofoptions held (b)
Ulf Mark Schneider, Chief Executive Offi cer 23 234 — 7 795 —
Laurent Freixe 36 191 — 17 587 —
Chris Johnson 78 362 — 62 376 104 100
Patrice Bula 181 894 — 159 121 101 800
Wan Ling Martello 115 048 80 800 101 507 121 100
Marco Settembri 40 620 — 31 837 —
François-Xavier Roger 29 393 — 14 544 —
Magdi Batato 13 288 — 9 152 —
Stefan Palzer 2 616 — — —
Maurizio Patarnello 16 533 — 13 043 —
Grégory Behar 3 611 — 1 188 —
David P. Frick 52 731 — 53 199 —
Members who retired from the Executive Board during 2018 — — 60 307 —
Total as at December 31 593 521 80 800 531 656 327 000
(a) Including shares subject to a three-year blocking period.(b) The ratio is one option for one Nestlé S.A. share.
For the detailed disclosures regarding the remunerations of the Board of Directors and
the Executive Board that are required by Swiss law, refer to the Compensation report of
Nestlé S.A. with the audited sections highlighted with a blue bar.
24. Shares and stock options

152nd Financial Statements of Nestlé S.A.204
Proposed appropriation of profi t
In CHF
2018 2017
Retained earnings
Profi t brought forward 6 479 867 098 5 111 232 705
Profi t for the year 12 267 820 563 8 584 500 298
18 747 687 661 13 695 733 003
We propose the following appropriation:
Dividend for 2018, CHF 2.45 per share
on 2 984 258 341 shares (a)
(2017: CHF 2.35 on 3 070 581 236 shares) (b) 7 311 432 935 7 215 865 905
7 311 432 935 7 215 865 905
Profi t to be carried forward 11 436 254 726 6 479 867 098
(a) Depending on the number of shares issued as of the last trading day with entitlement to receive the dividend (April 12, 2019). No dividend is paid on own shares held by the Nestlé Group; the respective amount will be attributed to the special reserve.
(b) The amount of CHF 92 336 146 representing the dividend on 39 291 977 own shares held at the date of the dividend payment, has been transferred to the special reserve.
Provided that the proposal of the Board of Directors is approved by the Annual General
Meeting, the gross dividend will amount to CHF 2.45 per share, representing a net
amount of CHF 1.5925 per share after payment of the Swiss withholding tax of 35%.
The last trading day with entitlement to receive the dividend is April 12, 2019. The shares
will be traded ex-dividend as of April 15, 2019. The net dividend will be payable as from
April 17, 2019.
The Board of Directors
Cham and Vevey, February 13, 2019

152nd Financial Statements of Nestlé S.A. 205

152nd Financial Statements of Nestlé S.A.206
Statutory Auditor’s ReportTo the General Meeting of Nestlé S.A., Cham & Vevey
Report on the Audit of the Financial Statements
Opinion
We have audited the financial statements of Nestlé S.A., which comprise the balance sheet as at December 31, 2018, and the income statement for the year then ended, and notes to the financial statements, including a summary of significant accounting policies.
In our opinion the financial statements (pages 193 to 203) for the year ended December 31, 2018, comply with Swiss law and the Company’s Articles of Association.
Basis for Opinion
We conducted our audit in accordance with Swiss law and Swiss Auditing Standards. Our responsibilities under those provisions and standards are further described in the Auditor’s Responsibilities for the Audit of the Financial Statements section of our report. We are independent of the entity in accordance with the provisions of Swiss law and the requirements of the Swiss audit profession and we have fulfilled our other ethical responsibilities in accordance with these requirements.
We believe that the audit evidence we have obtained is sufficient and appropriate to provide a basis for our opinion.
Report on Key Audit Matters based on the circular 1/2015 of the Federal Audit Oversight Authority
Key audit matters are those matters that, in our professional judgment, were of most significance in our audit of the financial statements of the current period. We have determined that there are no key audit matters to communicate in our report.
Responsibility of the Board of Directors for the Financial Statements
The Board of Directors is responsible for the preparation of the financial statements in accordance with the provisions of Swiss law and the Company’s Articles of Association, and for such internal control as the Board of Directors determines is necessary to enable the preparation of financial statements that are free from material misstatement, whether due to fraud or error.
In preparing the financial statements, the Board of Directors is responsible for assessing the entity’s ability to continue as a going concern, disclosing, as applicable, matters related to going concern and using the going concern basis of accounting unless the Board of Directors either intends to liquidate the entity or to cease operations, or has no realistic alternative but to do so.
Auditor’s Responsibilities for the Audit of the Financial Statements
Our objectives are to obtain reasonable assurance about whether the financial statements as a whole are free from material misstatement, whether due to fraud or error, and to issue an auditor’s report that includes our opinion. Reasonable assurance is a high level of assurance, but is not a guarantee that an audit conducted in accordance with Swiss law and Swiss Auditing Standards will always detect a material misstatement when it exists. Misstatements can arise from fraud or error and are considered material if, individually or in the aggregate, they could reasonably be expected to influence the economic decisions of users taken on the basis of these financial statements.

152nd Financial Statements of Nestlé S.A. 207
As part of an audit in accordance with Swiss law and Swiss Auditing Standards, we exercise professional judgment and maintain professional skepticism throughout the audit. We also:
— Identify and assess the risks of material misstatement of the financial statements, whether due to fraud or error, design and perform audit procedures responsive to those risks, and obtain audit evidence that is sufficient and appropriate to provide a basis for our opinion. The risk of not detecting a material misstatement resulting from fraud is higher than for one resulting from error, as fraud may involve collusion, forgery, intentional omissions, misrepresentations, or the override of internal control.
— Obtain an understanding of internal control relevant to the audit in order to design audit procedures that are appropriate in the circumstances, but not for the purpose of expressing an opinion on the effectiveness of internal control.
— Evaluate the appropriateness of accounting policies used and the reasonableness of accounting estimates and related disclosures made.
— Conclude on the appropriateness of the Board of Directors’ use of the going concern basis of accounting and, based on the audit evidence obtained, whether a material uncertainty exists related to events or conditions that may cast significant doubt on the entity’s ability to continue as a going concern. If we conclude that a material uncertainty exists, we are required to draw attention in our auditor’s report to the related disclosures in the financial statements or, if such disclosures are inadequate, to modify our opinion. Our conclusions are based on the audit evidence obtained up to the date of our auditor’s report. However, future events or conditions may cause the entity to cease to continue as a going concern.
We communicate with the Board of Directors or its relevant committee regarding, among other matters, the planned scope and timing of the audit and significant audit findings, including any significant deficiencies in internal control that we identify during our audit.
We also provide the Board of Directors or its relevant committee with a statement that we have complied with relevant ethical requirements regarding independence, and to communicate with them all relationships and other matters that may reasonably be thought to bear on our independence, and where applicable, related safeguards.
From the matters communicated with the Board of Directors or its relevant committee, we determine those matters that were of most significance in the audit of the financial statements of the current period and are therefore the key audit matters. We describe these matters in our auditor’s report, unless law or regulation precludes public disclosure about the matter or when, in extremely rare circumstances, we determine that a matter should not be communicated in our report because the adverse consequences of doing so would reasonably be expected to outweigh the public interest benefits of such communication.
Report on Other Legal and Regulatory Requirements
In accordance with article 728a para. 1 item 3 CO and the Swiss Auditing Standard 890, we confirm that an internal control system exists, which has been designed for the preparation of financial statements according to the instructions of the Board of Directors.
We further confirm that the proposed appropriation of available earnings complies with Swiss law and the Company’s Articles of Association. We recommend that the financial statements submitted to you be approved.
KPMG SA
Scott Cormack Lukas MartyLicensed Audit Expert Licensed Audit ExpertAuditor in Charge
Geneva, February 13, 2019
KPMG SA, 111 Rue de Lyon, P.O. Box 347, CH-1211 Geneva 13
KPMG SA is a subsidiary of KPMG Holding AG, which is a member of the KPMG network of independent firms affiliated with KPMG International Cooperative (“KPMG International”), a Swiss legal entity. All rights reserved.

152nd Financial Statements of Nestlé S.A.208
Notes
Top Related
Copyright © 2022 FDOKUMEN

