


Bahasa
Halaman
Hukum


© 2019 Board of Trustees of the University of Illinois The text and ideas contained in this document are the original work of the Survey Research Laboratory at the
University of Illinois. Any reproduction, in part or whole, should not be done without permission from the University of Illinois and the authors.
Nashville Community Health + Well-being Survey
Analytical Report
Prepared by Timothy P. Johnson
Karen F. Retzer Tracy F. Buck
Celia O. Larson Raquel Qualls-Hampton
Molly H. Sudderth Caroline R. Young
June 2019
Study #1230
412 South Peoria Street, Sixth Floor Chicago, Illinois 60607
312.996.5300
1007 West Nevada Street Urbana, Illinois 61801
www.srl.uic.edu

Nashville Community Health + Well-being Survey
ii | P a g e Survey Research Laboratory, University of Illinois at Chicago © 2019 Board of Trustees of the University of Illinois
Contents
List of Tables iv
Acknowledgements vi
Introduction 1
Overview of Survey Methods 1
Overview of Questionnaire Design 3
Overview of Survey Analysis 4
Overview of Survey Findings 5
Overview of Survey Limitations 6
General Health 8
Chronic Health Conditions 8
Diabetes 8
High Blood Pressure 11
Heart Conditions 11
Respiratory Conditions 11
Subjective Health Assessments 12
General Health Ratings 12
Poor Health Days 15
Body Mass Index 15
Oral Health 16
Past Year Dental Care 16
Tooth Loss 19
Mental Health 19
Poor Mental Health Days 19
Depression 23
Life Satisfaction 23
Social Support 23
Mental Health Treatment 23
Attitudes Regarding Mental Health 27
Health Care Access & Utilization 28

Nashville Community Health + Well-being Survey
iii | P a g e Survey Research Laboratory, University of Illinois at Chicago © 2019 Board of Trustees of the University of Illinois
Health Insurance Coverage 28
Personal Physician 31
Past Year Routine Check-Up 31
Barriers to Health Care 31
Cost Barriers to Medical Care 31
Appointment Problems 34
Transportation Problems 34
Cost Barriers to Prescription Medications 34
Unpaid Health Bills 38
Financial Stress 38
Health Care and Transportation 39
Health Behaviors 42
Personal Nutrition 42
Tobacco Use 48
Vaping 51
Tennessee Quitline 54
Alcohol Use 57
Non-Medical Use of Prescription Use 60
Substance Use Treatment 64
HIV Risk 65
Firearms 68
Physical Activity 71
Additional Health Related Topics 78
Discrimination and Health 78
Electronic Health Literacy 81
Maternal and Child Health 85
Conclusions 88
References 89
Appendix A. Map of Zones in Davidson County A-1
Appendix B. Map of Combined Zones in Davidson County B-1
Appendix C. Detailed Unweighted Demographic Composition of Sample C-1

Nashville Community Health + Well-being Survey
iv | P a g e Survey Research Laboratory, University of Illinois at Chicago © 2019 Board of Trustees of the University of Illinois
Tables
Table 1: Comparisons of the Unweighted & Weighted Demographic Composition of the Nashville Health
+ Community Well-being Survey with the 2017 American Community Survey Findings for Davidson
County 5
Table 2: Chronic Health Conditions in Davidson County by Demographic Characteristics 9
Table 3: Subjective Health Assessments and Overweight Population in Davidson County by Demographic
Characteristics 13
Table 4: Oral Health in Davidson County by Demographic Characteristics 17
Table 5: General Mental Health Status in Davidson County by Demographic Characteristics 21
Table 6: Mental Health Treatment and Attitudes towards Mental Illness and Treatment in Davidson County
by Demographic Characteristics 25
Table 7: Health Care Access & Utilization in Davidson County by Demographic Characteristics 29
Table 8: Barriers to Seeing a Physician during Past 12 Months in Davidson County by Demographic
Characteristics 32
Table 9: Cost Barriers to Health Care in Davidson County by Demographic Characteristics 35
Table 10: Transportation Barriers to Health Care in Davidson County by Demographic Characteristics 40
Table 11: Consumption of Healthy Foods in Davidson County by Demographic Characteristics 43
Table 12: Other Nutrition Behaviors in Davidson County by Demographic Characteristics 46
Table 13: Current Tobacco Use Behaviors in Davidson County by Demographic Characteristics 49
Table 14: Current E-Cigarette or Vaping Use Behaviors in Davidson County by Demographic
Characteristics 52
Table 15: Awareness and Use of Tennessee Quitline in Davidson County by Demographic
Characteristics 55
Table 16: Current Alcohol Use Behaviors in Davidson County by Demographic Characteristics 58
Table 17: Non-Medical Prescription Drug Use and Substance Use Treatment in Davidson County by
Demographic Characteristics 62
Table 18: HIV Testing and Risks in Davidson County by Demographic Characteristics 66
Table 19: Firearm Ownership in Davidson County by Demographic Characteristics 69

Nashville Community Health + Well-being Survey
v | P a g e Survey Research Laboratory, University of Illinois at Chicago © 2019 Board of Trustees of the University of Illinois
Table 20: Physical Exercise in Davidson County by Demographic Characteristics 72
Table 21: Walking in Davidson County by Demographic Characteristics 75
Table 22: Experiences of Discrimination in Davidson County by Demographic Characteristics 79
Table 23: Online Health Literacy in Davidson County by Demographic Characteristics 83
Table 24: Negative Experiences of Women who are Currently or were Recently (in the last 18 months)
Pregnant 86
Table 25: Post-Pregnancy Checkup Experiences of Women who were Pregnant during the Last 18
Months 87

Nashville Community Health + Well-being Survey
vi | P a g e Survey Research Laboratory, University of Illinois at Chicago © 2019 Board of Trustees of the University of Illinois
Acknowledgements
This was a collaborative project among the Metro Public Health Department (Tracy Buck, Dr. Celia
Larson, Dr. Raquel Qualls-Hampton), NashvilleHealth (Molly Sudderth, Caroline Young), and the
University of Illinois Survey Research Laboratory (Dr. Timothy Johnson, Dr. Linda Owens, Karen Retzer).
The authors gratefully acknowledge Linda Owens, Jennifer Parsons, and Allyson Holbrook for their
careful review and editing of the questionnaire; Linda Owens for her work on the sample design;
Gabriella Avila for review, programming, and compilation of the Spanish versions of the questionnaire;
Geoff Parker for overseeing the coordination of the mail portions of the study and dataset cleaning and
compilation; and Isabel Farrar for assistance with Survey Gizmo programming and dataset compilation.
A special thanks to project funding partners.

Nashville Community Health + Well-being Survey
1 | P a g e Survey Research Laboratory, University of Illinois at Chicago © 2019 Board of Trustees of the University of Illinois
Introduction
In 2018, the non-profit organization NashvilleHealth partnered with the Metro Public Health
Department (MPHD) of Nashville, Davidson County and the University of Illinois at Chicago Survey
Research Laboratory (SRL) to better understand the health and well-being of the county’s 650,000
residents. Through the resulting foundational Nashville Health + Well-being Survey there is now
opportunity for better understanding of how health-related behaviors, chronic health conditions,
preventative health practices, and environments impact the well-being of our community. Survey
results will help Nashville government, business, and community leaders set strategic priorities for
health improvement in the city and implement projects and programs, as well as provide a baseline to
track progress over time. Basic findings from the survey, conducted in late 2018 and early 2019, are
presented in this report.
Survey findings include a broad range of health indicators that address the general health status of
adults in Davidson County, along with their access to and utilization of health care resources, health
behaviors, and related topics. For each, basic estimates—weighted to represent the adult population of
Davidson County—are provided. Separate estimates are also presented for a number of relevant
sociodemographic characteristics thought to be relevant for many health outcomes. These include
gender, age, race/ethnicity, education, employment status, household income, health insurance
coverage, sexual orientation, and geographic zones within Davidson County. Estimates for additional
characteristics of special relevance are also provided where appropriate.
Overview of Survey Methods
The Nashville Health + Well-being Survey was administered to a random, representative sample of
adults aged 18 and older residing in Davidson County between late-October 2018 and early-April 2019. A
sequential, mixed mode design that provided respondents with opportunities to complete the survey
first online, and then by mail, was developed. A sampling process was constructed that would permit
sub-county level estimates of demographic groups. The geography was stratified by health zones which
are a combination of Metro Council districts and practice-based processes for service delivery. The
Nashville Promise Zone (NPZ) was the initial area identified. The NPZ is a 46-square mile federally
designated area, where 10% of the population of the county live in extreme poverty and have limited
educational attainment. There is significant census data to support this designation (e.g., income level,
educational attainment, insurance status, family size, etc.), but health behavior data are lacking. A mix
of public health zones and existing environmental landmarks (natural and man-made) were used to
determine the remaining five zone boundaries, which are a combination of census tracts within the
drawn areas as shown in the map found in Appendix A. Using the 2016 American Communities Survey 5-
year estimates, we compared each of the six sampling zone populations by Gender, Race/Ethnicity, Age,
Educational Attainment, Income, and Total Population. During the survey analysis, it was determined
that two of the zones should be combined due to the response rate in those zones. Appendix B includes
a map that shows the resulting five geographic zones of Davidson County that are examined in this
report.

Nashville Community Health + Well-being Survey
2 | P a g e Survey Research Laboratory, University of Illinois at Chicago © 2019 Board of Trustees of the University of Illinois
Using the United States Post Office Delivery Sequence File – which provides very high coverage of all
households receiving mail in the county – a random sample of 12,283 households, based on racial-ethnic
composition and geographic zone within the county, was selected to receive the survey.
Between late-October and early-December 2018, these households received mailed invitations with
instructions to complete the Nashville Health + Well-being Survey online at www.healthynashville.org
using a personalized passcode. Included with these mailed invitations was a $1 bill and the promise of
an additional payment of $10 for completing the survey. All sampled households subsequently received
a reminder postcard, and those not completing the questionnaire later received a second reminder
postcard. Early in January 2019, all nonresponding households received a paper questionnaire and a pre-
addressed postage-paid return envelope. They were also offered the same $10 payment for returning
the questionnaire. To insure the sample was representative of the adult population of the county,
instructions were included with all survey materials asking that the adult in the household who would
next have a birthday be the person to complete the questionnaire.
During this time, NashvilleHealth and MPHD launched grassroots marketing and promotional activities
to raise awareness of the survey in the city. This included the design of a special logo to be included on
all survey materials and marketing pieces. Both MPHD and NashvilleHealth websites prominently
featured information about the survey, and messaging was shared with more than 300 organizations in
the city including non-profits, businesses, and local government. With their help, information about the
survey reached nearly 60,000 Nashvillians via email and 600,000+ on the web.
In addition, more than 100 posters were displayed in retail and community centers, and librarians across
the city were educated about the survey in order to help patrons who might want to use one of the
branch library’s computer labs to take the survey.
NashvilleHealth and MPHD also employed a number of traditional paid advertising methods to promote
the survey, including purchasing ads on an electronic billboard at an intersection which sees more than
50,000 daily commuters, targeting paid Facebook ads to Spanish and English speaking populations in the
survey zip codes, and geofencing which uses location-based technology to push messaging to mobile
devices belonging to residents in Davidson County. In addition, the National Hockey League Nashville
Predators aired a Public Service Announcement about the survey featuring NashvilleHealth Founder and
Chairman Sen. Bill Frist and Nashville Mayor David Briley during 3 sold-out NHL games, reaching 60,000
fans. The Predators also tweeted the PSA on gameday to their audience of 586,000 followers.
The survey was closed in early-April 2019. A total of 1,805 questionnaires were obtained (1,284 online
and 521 by mail). Twenty-six of the 116 Hispanic respondents answered using the Spanish language
questionnaire (25 online and 1 by mail). Using the Response Rate 1 formula (AAPOR RR1) provided by
the American Association for Public Opinion Research (2016), the overall response rate to the survey
was calculated to be 15.8%. This response rate is essentially the number of completed questionnaires
divided by the total number of households sampled (minus those addresses for which mail was returned
as undeliverable). It is useful to note that respondents completing questionnaires online indicated doing
so using a variety of technologies. Specifically, 35.1% reported using a laptop computer, 33.4% reported
using a phone, 24.5% used a desktop computer, and 7.0% used a tablet. Table C-1 in the Appendix C
provides a detailed profile of survey respondents.

Nashville Community Health + Well-being Survey
3 | P a g e Survey Research Laboratory, University of Illinois at Chicago © 2019 Board of Trustees of the University of Illinois
A more detailed documentation of the Nashville Health + Well-being Survey’s methodology and
procedures, along with copies of all questionnaire versions and other study materials, can be found in a
companion methodology report (Retzer and Johnson, 2019). Basic descriptive findings from the survey
are presented in the remainder of this report.
Overview of Questionnaire Design
The questionnaire design was a collaborative process among MPHD, SRL and NashvilleHealth staff. The
selection of questionnaire items for the survey used a multi-stage process that involved a review of
questions included in standardized national population health surveys, group and one-on-one
discussions with community partners, and identification of local data and data estimates routinely
collected by the local or state health department. Discussions were held with community partners to
identify health behavior themes that they felt would be important to be captured in the survey
questionnaire. This information provided a framework for the selection or development of
questionnaire items not currently being routinely collected.
Modules from the CDC Behavioral Risk Factor Surveillance Survey (BRFSS) national Core, Module (e.g.,
rotating) and State-added questions were reviewed. Based on this review, 110 modular topics and 2,500
items were identified as possibilities for inclusion. Other health surveillance systems such as the
Pregnancy Risk Assessment Monitoring System (PRAMS), National Immunization Survey (NIS) and
National Survey on Drug Use & Health (NSDUH) surveys were also evaluated for inclusion. Using this
information and materials gathered, a comprehensive list of 300+ items was compiled as potential
survey questions.
In April 2018, a facilitated meeting was held with community partners to prioritize the thematic modules and 300+ associated items based on each item’s usefulness to the partner organizations. Partners were asked to add to the list of questionnaire theme topics not already listed. The themes are shown in the list directly below.
Stakeholder Identified Themes – for Addition
Awareness/Use of Tennessee Tobacco Quitline
Caregiver
Cognitive Decline
Driving & Cell Phone Use
Firearms
Food Insecurity
Gender Identity & Sexual Orientation
Gentrification/Displacement
Health Literacy
Housing Insecurity
Interstate Speeding
Maternal Health
Money for Food
Spontaneous Physical Activity

Nashville Community Health + Well-being Survey
4 | P a g e Survey Research Laboratory, University of Illinois at Chicago © 2019 Board of Trustees of the University of Illinois
Transportation
Use of other Tobacco Products
The list of theme modules and their accompanying questions were fine-tuned based on the feedback
received from community partners and input from MPHD, NashvilleHealth and SRL.
In May 2018, MPHD and NashvilleHealth provided a list of themes to SRL. Key topics included general
health status, health care access and utilization, both positive and negative health behaviors, maternal
and child health, discrimination, and health literacy. For several topics unique to Nashville, additional
questions were developed. The final questionnaire was comprised of 133 questions. Of these 133
questions, 83 were asked of all respondents and 50 were asked to a subset depending on prior
responses. For example, selected questions were asked only of people who indicated that they had
diabetes, smoked, or had children.
Overview of Survey Analysis
Using information from the U.S. Census Bureau’s 2017 5-year American Community Survey, the final
sample was weighted to adjust the sample to represent the adult population of Davidson County. The
sample weights incorporated information regarding selection probabilities and the gender, age,
race/ethnic, education, and geographic distribution of the population.
Table 1 presents the distribution of the unweighted, or raw, sample (column 2) to the final weighted
sample (column 3) and the distribution of Davidson County’s population according to the 2017 5-year
American Community Survey (column 4) for several variables that can be compared. Comparisons of
columns 2 and 4 provide an assessment of which subpopulation groups responded to the survey above
and below average. For example, females responded at a higher rate, as they represent 65.8% of all
respondents, but only 52.4% of the population. In contrast, younger persons (aged 18-34) were less
likely to participate in the survey, as they represented only 28.3% of all respondents, whereas they
constitute 37.7% of the adult population in the county. Persons aged 55 and older participated in the
survey at a much higher rate, as they represented 41.0% of all respondents, even though they account
for only 29.2% of Davidson County’s adults.
Similar comparisons indicate that persons with college degrees were over-represented among
respondents (58.9%), relative to their proportion of the adult population (39.1%). Differences by
race/ethnicity and Davidson County zone can also be observed, although they are not as large as the
gender, age and education differences between respondents and nonrespondents.
Differences between the weighted Nashville Health + Community Well-being Survey (column 3) and the
benchmark data obtained from the 2017 American Community Survey (column 4) confirm that the
weighted sample, upon which all estimates provided in this report are based, closely parallels the basic
demographic composition of the county.

Nashville Community Health + Well-being Survey
5 | P a g e Survey Research Laboratory, University of Illinois at Chicago © 2019 Board of Trustees of the University of Illinois
Table 1: Comparisons of the Unweighted & Weighted Demographic Composition of the Nashville Health + Community Well-being Survey with the 2017 American Community Survey Findings for Davidson County
Nashville Health + Community Well-being Survey 2017 American Community
Survey %
Unweighted sample size (n)
Unweighted %
Weighted %
Gender
Female (1188) 65.8 52.5 52.4
Male (617) 34.2 47.5 47.6
Age
18-34 (491) 28.3 37.2 37.7
35-54 (531) 30.6 33.0 33.1
55 and older (711) 41.0 29.8 29.2
Race/Ethnicity
African American (407) 23.3 27.0 27.3
Hispanic/Latino (116) 6.7 9.9 10.1
White, non-Hispanic (1124) 64.4 56.9 56.4
Mixed/other (98) 6.6 6.2 6.3
Education
High school graduate or less (333) 19.1 34.6 34.9
Some college, no degree (384) 22.0 26.0 26.0
College graduate or higher (1025) 58.9 39.4 39.1
Davidson County Zone
East (341) 18.9 22.7 22.7
Nashville Promise Zone (361) 20.0 18.7 18.7
North West (252) 14.0 9.3 9.3
South East (480) 26.6 28.6 28.6
South West (371) 20.5 20.7 20.7
DATA SOURCE: Nashville Community Health + Well-being Survey, 2019; and the American Community Survey 2017.
Overview of Survey Findings
The findings presented in this report are organized by topic into four broad categories: (1) general
health status, (2) health care access and utilization, (3) health behaviors, and (4) other health-related
topics. With a few exceptions, tables are only used to present information reported by most
respondents. Information reported by smaller subsets of the population are generally reported in the
text only. These tables provide the unweighted sample sizes that each estimate is based on (n), along
with weighted estimates (either a % or a mean value) and the standard error (se) for each. In most
cases, an overall estimate representing adult residents of Davidson County is provided, followed by a
series of separate estimates for demographic subgroups.
The estimates for subgroups generally have larger standard errors, as they are based on smaller
numbers of respondents. Standard errors provide a measure of the variability, or accuracy, of survey
estimates (Lohr, 2010). All sampling errors in this report take into account the effect of weighting.
Sampling errors can be used to construct 95% confidence intervals around survey estimates.
To identify the confidence interval for an estimate, multiply the standard error by 1.96, and then both
subtract the resulting value from and add it to, the survey estimate. For example, in Table 2, the

Nashville Community Health + Well-being Survey
6 | P a g e Survey Research Laboratory, University of Illinois at Chicago © 2019 Board of Trustees of the University of Illinois
prevalence estimate of diabetes among adults in Davidson County is 11.6%, with a standard error of 1.3.
The lower boundary for the confidence interval is thus: [11.6 - (1.96 * 1.3)] = 9.1%; and the upper
boundary of the confidence interval for the estimate is: [11.6 + (1.96 * 1.3)] = 14.1%. Consequently, we
can say that our point estimate for adult diabetes prevalence in Davidson County is 11.6%, and we have
a good degree of confidence that, if we were to survey all adults in the county, we would find the actual
prevalence to be someplace between 9.1% and 14.1%.
Each table also identifies statistical comparisons of estimates across population subgroups that are
found to be sufficiently large to warrant acknowledgement that the differences are statistically
significant. These are based on the Wald Test, which is a corrected χ2 statistic, for comparisons of
proportions, and oneway Analysis of Variance (ANOVA) for comparisons of mean values (Lohr, 2010). In
this report, an exceptionally large number of statistical comparisons were calculated, which increases
the probability that some may be the result of chance. To minimize this risk, only statistical tests found
to be a conservative—as measured by a low p-value (p<.001)—are identified, using a ‘*’, in the tables.
For example, in Table 2, estimates of diabetes are found to vary significantly across age groups, as the
statistical test applied to these differences indicated these differences were p<.001. In the report’s
narrative, only those subgroup differences identified as such are discussed. Each table also provides the
exact question wording for the variable(s) used to produce each estimate.
It is also important to note that not all respondents answered all questions included in the survey. In
some instances, this was by design, as, for example, persons who have never smoked cigarettes were
not asked how often they smoke, and males were not asked about their pregnancy experiences. In other
cases, respondents choose not to answer questions they were eligible to answer, or stopped answering
questions before finishing the survey. Consequently, sample sizes across questions will vary, and it is for
this reason that unweighted samples (or n’s) are reported throughout the report, so that readers will
always know precisely how many respondents are contributing information to each estimate that is
provided. No attempts were made to impute missing data, although this is something that might be
considered for future analyses.
Overview of Survey Limitations
All surveys are vulnerable to multiple sources of error, including sampling, coverage, nonresponse,
measurement, and processing errors. The Nashville Community Health + Well-being Survey was
designed to minimize, as much as possible, each of these potential sources of error. Overall, we are
confident that sampling and coverage errors have been adequately addressed, as samples were selected
at random at each stage, and the address-based sample frame that was used insured that 96-98% of the
households in Davidson County had known probabilities of selection.
Potential measurement errors were addressed through careful questionnaire design, the use of existing
survey questions previously employed in national health surveys, and data collection using self-
administration modes (web and mail) that are known to minimize social desirability pressures on
respondents. Processing errors were also minimized via 100% double-keyed data entry of paper
questionnaires, and careful construction and review of the sample weights applied to the final data.

Nashville Community Health + Well-being Survey
7 | P a g e Survey Research Laboratory, University of Illinois at Chicago © 2019 Board of Trustees of the University of Illinois
Of greater concern are potential nonresponse errors associated with the survey’s response rate of
15.8% and the possibility of important differences between respondents and non-respondents in terms
of their health experiences. Based on the available research literature, we suspect that, if the Nashville
Community Health + Well-being Survey does suffer from nonresponse error, it is likely to take the form
of under-estimation of the prevalence of some health conditions and behaviors, although any such
effects are unlikely to be great. For more information regarding these potential sources of survey error,
see the study’s Methodology Report (Retzer & Johnson, 2019).

Nashville Community Health + Well-being Survey
8 | P a g e Survey Research Laboratory, University of Illinois at Chicago © 2019 Board of Trustees of the University of Illinois
General Health
Chronic Health Conditions
The questionnaire included several questions regarding common chronic health conditions, including
diabetes, high blood pressure, heart conditions (including heart attack, also known as myocardial
infarction, angina or coronary heart disease, and stroke) and respiratory conditions (including asthma,
Chronic Obstructive Pulmonary Disease, or COPD, and emphysema or chronic bronchitis). Table 2
presents these findings.
Diabetes
As Table 2 indicates, the general prevalence of a diabetes diagnosis – from a doctor, nurse or other
health professional – among adults in Davidson County was 11.6%. Diabetes was strongly associated
with several sociodemographics, including age, race/ethnicity and employment status. Specifically,
diabetes increased sharply with age, with small proportions of persons aged 18-29 (1.2%) and 30-49
(8.1%) reporting this condition, compared with 15.2% of persons aged 50-64 and 27.5% of those aged 65
and older. Important differences across race/ethnicity were also found, with the highest prevalence of
diabetes observed among African American adults (22.1%), and lower levels found among
Hispanic/Latino (7.1%), non-Hispanic white (8.3%), and adults of other race/ethnicities (6.4%).
Unemployed persons also reported greater prevalence of diabetes (19.3%), relative to those currently
employed (7.9%).
Among those adults reporting a diagnosis of diabetes, 6.8% (se = 2.9) indicated it was due to a
pregnancy. Among adults reporting no diagnosis of diabetes, 9.9% (se = 1.3) had been told by a doctor
or other health professional that they have pre-diabetes or borderline diabetes (data not included in
tables).
Among all adults in Davidson County, 45.5% (se = 2.1) indicated they had been tested for high blood
sugar or diabetes within the past three years. Of those tested who were also told they have diabetes,
44.0% (se = 4.8) indicated being told they have Type 2 diabetes, 8.7% (se = 2.3) reported being told they
have Type 1 diabetes, and a plurality (47.3%, se = 4.8) said they were not told what type of diabetes they
had tested positive for. On average, those with diabetes, pre-diabetes or gestational diabetes were first
told they had this condition at 44.0 years of age (se = 1.0; Range = 0-88). They further reported having
seen a doctor, nurse or other health professional for their diabetes or pre-diabetes an average of 1.7
times in the past 12 months (se = 0.1; Range = 0-15). Those diagnosed also reported checking their A1C
an average of 0.7 times daily (se = 0.1; Range = 0-10) during the past 12 months (data not included in
tables).

Nashville Community Health + Well-being Survey
9 | P a g e Survey Research Laboratory, University of Illinois at Chicago © 2019 Board of Trustees of the University of Illinois
Table 2: Chronic Health Conditions in Davidson County by Demographic Characteristics (cont. next page)
Diabetes High blood pressure Heart conditions:
Angina/heart attack/ coronary heart disease
Respiratory conditions: COPD, emphysema,
chronic bronchitis/Asthma
(n) % (se) (n) % (se) (n) % (se) (n) % (se)
Total Sample (1805) 11.6 (1.3) (1805) 30.5 (1.8) (1746) 7.4 (1.2) (1751) 18.7 (1.6)
Gender
Female (1188) 12.5 (2.0) (1188) 34.0 (2.4) (1140) 7.0 (1.8) (1150) 24.1 (2.5)
Male (617) 10.7 (1.8) (617) 26.7 (2.7) (606) 7.8 (1.4) (601) 12.8* (1.9)
Age
18-29 (280) 1.2 (0.8) (280) 5.5 (2.0) (277) 0.0 -- (279) 18.0 (3.9)
30-49 (617) 8.1 (1.7) (617) 18.6 (2.5) (606) 2.5 (0.9) (606) 16.1 (2.3)
50-64 (418) 15.2 (4.0) (418) 50.1 (4.2) (406) 9.9 (3.9) (409) 21.2 (4.2)
65 and older (418) 27.5* (3.5) (418) 60.8* (3.7) (389) 22.4* (3.4) (391) 23.3 (3.4)
Race/Ethnicity
African American (405) 22.1 (3.8) (407) 47.6 (4.3) (391) 10.5 (3.5) (393) 24.5 (4.3)
Hispanic/Latino (116) 7.1 (2.7) (116) 11.4 (3.5) (111) 6.4 (3.1) (112) 14.8 (4.3)
White, non-Hispanic (1124) 8.3 (1.2) (1124) 27.1 (2.1) (1094) 6.4 (1.0) (1094) 17.4 (1.8)
Mixed/other (98) 6.4* (4.4) (98) 21.2* (6.4) (95) 5.8 (4.1) (96) 14.8 (5.2)
Education
Less than high school (100) 15.3 (4.2) (100) 39.6 (6.6) (90) 18.0 (4.9) (90) 39.0 (7.4)
High school graduate/GED (233) 14.5 (3.8) (233) 29.1 (5.1) (223) 11.0 (3.7) (221) 21.2 (4.7)
Some college, no degree (384) 14.4 (2.7) (384) 34.4 (3.6) (368) 6.3 (1.7) (371) 16.0 (2.5)
College graduate (597) 6.5 (1.5) (597) 17.7 (2.2) (583) 4.3 (1.1) (587) 16.4 (2.3)
Graduate/professional degree (428) 7.6 (2.0) (428) 23.4* (2.9) (423) 2.8 (1.0) (422) 13.6 (2.6)
Employment Status
Employed (1097) 7.9 (1.6) (1097) 23.0 (2.2) (1079) 3.9 (1.4) (1087) 15.9 (2.1)
Unemployed (619) 19.3* (2.5) (619) 45.3* (3.2) (587) 13.8* (2.3) (584) 24.4 (2.8)
Annual Household Income
Less than $25,000 (372) 14.9 (2.6) (372) 37.6 (3.8) (350) 11.2 (2.4) (353) 25.2 (3.5)
$25,000 to less than $50,000 (426) 16.3 (4.2) (426) 36.1 (4.8) (413) 10.6 (4.1) (413) 24.6 (4.5)
$50,000 to less than $75,000 (321) 13.0 (3.1) (321) 25.1 (3.6) (313) 4.0 (1.4) (316) 10.7 (2.3)
$75,000 to less than $100,000 (187) 5.4 (1.9) (187) 21.4 (4.0) (186) 3.4 (1.5) (186) 11.1 (2.9)
$100,000 and greater (349) 5.2 (1.6) (349) 22.0 (3.5) (343) 3.7 (1.3) (343) 15.3 (4.0)

Nashville Community Health + Well-being Survey
10 | P a g e Survey Research Laboratory, University of Illinois at Chicago © 2019 Board of Trustees of the University of Illinois
Table 2: Chronic Health Conditions in Davidson County by Demographic Characteristics (cont.)
Diabetes High Blood Pressure Heart conditions:
Angina/heart attack/ Coronary Heart Disease
Respiratory conditions: COPD, emphysema,
chronic bronchitis/Asthma
(n) % (se) (n) % (se) (n) % (se) (n) % (se)
Health Insurance Coverage
Yes (1612) 11.7 (1.4) (1612) 31.3 (1.9) (1597) 7.4 (1.3) (1571) 19.0 (1.8)
No (137) 9.6 (4.2) (137) 15.3 (4.7) (132) 3.6 (2.3) (133) 15.6 (5.2)
Sexual Orientation
Heterosexual (1595) 12.2 (1.5) (1595) 30.9 (1.9) (1543) 7.7 (1.3) (1549) 18.7 (1.8)
Gay-lesbian-bisexual (105) 8.8 (3.8) (105) 26.2 (6.6) (105) 6.0 (3.7) (104) 21.1 (6.2)
Davidson County Zone
East (341) 12.9 (2.6) (341) 29.9 (3.7) (333) 5.9 (1.6) (337) 26.0 (3.6)
Nashville Promise Zone (361) 12.9 (3.0) (361) 38.8 (4.3) (344) 10.5 (3.0) (344) 19.2 (3.3)
North West (252) 21.1 (8.0) (252) 46.7 (7.4) (241) 18.1 (8.2) (246) 18.5 (7.8)
South East (480) 10.9 (2.0) (480) 26.8 (3.2) (462) 5.3 (1.3) (463) 17.0 (3.2)
South West (371) 6.0 (1.6) (371) 21.7 (2.9) (366) 4.6 (1.2) (361) 12.7 (1.6)
DATA SOURCE: Nashville Community Health + Well-being Survey, 2019 *p<.001
Note: Question wordings include the following: Diabetes – “Has a doctor, nurse, or other health professional ever told you that you have diabetes?” High blood pressure - “Have you ever been told by a doctor, nurse or other health professional that you have high blood pressure?” Heart conditions - “Has a doctor, nurse, or other health professional ever told you that you had any of the following? (1) a heart attack, also called a myocardial infarction? (2) Angina or coronary heart disease? (3) a stroke?” Respiratory conditions - “Has a doctor, nurse, or other health professional ever told you that you had any of the following? (1) Asthma? (2) Chronic Obstructive Pulmonary disease or COPD, emphysema or chronic bronchitis?”

Nashville Community Health + Well-being Survey
11 | P a g e Survey Research Laboratory, University of Illinois at Chicago © 2019 Board of Trustees of the University of Illinois
High Blood Pressure
As Table 2 indicates, a diagnosis of hypertension, also known as high blood pressure, by a doctor, nurse
or other health professional was reported by 30.5% of the adults in Davidson County (another 7.9%, se =
1.0, indicated they were told they were borderline high or pre-hypertensive). Several
sociodemographics were also strongly associated with high blood pressure. Prevalence increased from
5.5% for adults aged 18-29, to 60.8% for those 65 and older. African Americans were most likely to
report high blood pressure (47.6%), and Hispanic/Latino adults were least likely to indicate this
condition (11.4%). Education was also associated with high blood pressure. The highest prevalence was
among persons with less than a high school education (39.6%), and the lowest levels were among
college graduates (17.7%) and those with graduate or professional degrees (23.4%). Unemployed
persons also were more likely to report high blood pressure (45.3%), compared to currently employed
adults (23.0%).
Among those adults reporting a diagnosis of high blood pressure, 19.4% (se = 4.6) indicated it was
caused by a pregnancy. Also among those diagnosed with high blood pressure, 77.4% (se = 1.8) reported
they were currently taking medicine for it. Half of those persons with high blood pressure (50.3%, se =
2.1) indicated they did not need to check their blood pressure at home, and 18.8% (se = 1.5) reported
they did not have access to a device at home for checking their blood pressure. The remaining 30.9% (se
= 1.8) indicated they had taken their blood pressure at home during the past 12 months. Most patients
with high blood pressure had not been told to take their blood pressure at home (79.1%, se = 1.6; data
not included in tables).
Heart Conditions
Among all Davidson County adults, the prevalence of heart conditions was 7.4% (see Table 2). Age and
employment status were strongly associated with heart condition prevalence. No adults aged 18-29
reported a heart condition, whereas 22.4% of those aged 65 and older reported one or more of these
conditions. Among the unemployed, the prevalence of heart conditions was 13.8%. Among those
currently employed, the prevalence was 3.9%.
The adult prevalence of specific forms of heart conditions included 3.9% for angina (se = 0.7), 3.2% for
heart attacks (se = 0.9), and 2.1% (se = 0.5) for strokes (data not included in tables).
Respiratory Conditions
The prevalence of respiratory conditions among adults was 18.7% (Table 2). Females were more likely
than males to have reported a respiratory condition (24.1% vs. 12.8%, respectively).

Nashville Community Health + Well-being Survey
12 | P a g e Survey Research Laboratory, University of Illinois at Chicago © 2019 Board of Trustees of the University of Illinois
The prevalence of specific types of respiratory conditions were 15.1% for asthma (se = 1.4), and 6.2% for
Chronic Obstructive Pulmonary Disease (COPD), emphysema or chronic bronchitis (se = 1.2; data not
included in tables).
Subjective Health Assessments
Two items that focus on subjective health assessments were included in the survey. Findings for those
items, which assessed self-reported general health ratings and poor health days, are presented in Table
3.
General Health Ratings
One question asked respondents to rate their general health as being excellent, very good, good, fair or
poor. This is a common health perceptions question that is known to be predictive of both objective
health assessments and future mortality risk (Lee, 2015). In Davidson County, 13.2% of the adults
surveyed reported their general health to be fair or poor. Several indicators of socio-economic status
were found to have strong associations with this measure. One of these was education, with fair/poor
health ratings decreasing from 25.9% among persons with less than a high school education to 4.4%
among college graduates and 3.3% among those with graduate or professional degrees. A similar
relationship between fair/poor health ratings and household income was observed. The prevalence of
negative health ratings declined from 23.2% among those with household incomes less than $25,000 to
1.8% among those reporting incomes of $100,000 and above. In addition, unemployed persons were
more likely to report fair/poor health (20.5%) compared to the currently employed (9.6%).

Nashville Community Health + Well-being Survey
13 | P a g e Survey Research Laboratory, University of Illinois at Chicago © 2019 Board of Trustees of the University of Illinois
Table 3: Subjective Health Assessments and Overweight Population in Davidson County by Demographic Characteristics (cont. next page)
General Health Rated as Fair/Poor
Number of days (in past 30) that physical
health not good
Body Mass Index (BMI) classified as overweight
Body Mass Index (BMI) classified as obese
(n) % (se) (n) Mean (se) (n) % (se) (n) % (se)
Total Sample (1799) 13.2 (1.5) (1776) 4.4 (0.4) (1626) 33.1 (2.1) (1626) 30.5 (2.0)
Gender
Female (1183) 15.6 (2.2) (1165) 5.0 (0.4) (1073) 24.7 (2.0) (1073) 35.9 (2.6)
Male (616) 10.5 (2.1) (611) 3.7* (0.6) (553) 42.6* (3.6) (553) 24.3* (3.1)
Age
18-29 (279) 6.5 (3.2) (276) 4.1 (1.1) (259) 26.2 (5.2) (259) 21.3 (4.5)
30-49 (617) 10.1 (1.8) (611) 3.5 (0.4) (568) 31.8 (3.3) (568) 31.3 (3.3)
50-64 (417) 17.7 (4.2) (415) 5.4 (0.7) (381) 35.7 (4.2) (391) 41.0 (4.6)
65 and older (415) 20.9 (3.4) (406) 4.9* (0.7) (392) 41.3* (3.9) (392) 27.5* (3.5)
Race/Ethnicity
African American (404) 20.9 (3.8) (394) 4.7 (0.6) (371) 30.7 (4.1) (371) 47.8 (4.7)
Hispanic/Latino (116) 14.6 (6.9) (116) 6.8 (2.3) (98) 42.0 (10.2) (98) 31.8 (9.0)
White, non-Hispanic (1122) 9.8 (1.4) (1110) 3.9 (0.3) (1057) 31.3 (2.3) (1057) 24.1 (2.1)
Mixed/other (97) 10.5 (5.3) (96) 3.1 (1.1) (89) 48.1* (8.6) (89) 12.7* (5.2)
Education
Less than high school (99) 25.9 (5.6) (93) 8.2 (1.5) (86) 26.7 (7.6) (86) 33.3 (6.8)
High school graduate/GED (231) 22.4 (4.3) (225) 5.6 (1.1) (209) 32.9 (5.4) (209) 39.9 (5.6)
Some college, no degree (383) 14.5 (3.2) (379) 4.6 (0.6) (352) 30.8 (3.8) (352) 34.6 (4.1)
College graduate (596) 4.4 (1.1) (590) 3.1 (0.4) (553) 35.9 (3.3) (553) 20.3 (2.5)
Graduate/professional degree (427) 3.3* (1.4) (426) 2.2* (0.3) (407) 36.0 (3.6) (407) 22.0 (3.1)
Employment Status
Employed (1096) 9.6 (1.9) (1087) 3.2 (0.3) (1017) 32.4 (2.7) (1017) 30.9 (2.7)
Unemployed (614) 20.5* (2.6) (602) 6.6* (0.8) (579) 34.5 (3.0) (579) 29.9 (2.8)
Annual Household Income
Less than $25,000 (370) 23.2 (3.3) (358) 6.3 (0.8) (337) 29.6 (3.9) (337) 41.2 (4.4)
$25,000 to less than $50,000 (425) 17.4 (4.3) (422) 5.5 (1.1) (398) 27.9 (4.1) (398) 37.1 (5.0)
$50,000 to less than $75,000 (321) 7.6 (2.3) (321) 3.4 (0.6) (309) 32.2 (4.5) (309) 26.1 (4.0)
$75,000 to less than $100,000 (187) 9.7 (6.4) (185) 3.3 (0.7) (177) 33.9 (5.5) (177) 29.0 (6.7)
$100,000 and greater (349) 1.8* (0.8) (347) 2.2* (0.4) (332) 41.4 (4.3) (332) 18.5 (2.9)

Nashville Community Health + Well-being Survey
14 | P a g e Survey Research Laboratory, University of Illinois at Chicago © 2019 Board of Trustees of the University of Illinois
Table 3: Subjective Health Assessments and Overweight Population in Davidson County by Demographic Characteristics (cont.)
General Health Rated as Fair/Poor
Number of days (in past 30) that physical
health not good
Body Mass Index (BMI) classified as overweight
Body Mass Index (BMI) classified as obese
(n) % (se) (n) Mean (se) (n) % (se) (n) % (se)
Health Insurance Coverage
Yes (1606) 12.5 (1.6) (1589) 4.0 (0.3) (1467) 32.3 (2.2) (1467) 31.4 (2.2)
No (137) 16.4 (4.8) (136) 7.3* (2.2) (111) 36.0 (7.4) (111) 20.8 (5.7)
Sexual Orientation
Heterosexual (1590) 13.7 (1.7) (1570) 3.9 (0.3) (1487) 34.4 (2.2) (1487) 29.7 (2.1)
Gay-lesbian-bisexual (105) 10.3 (4.0) (103) 9.2* (2.6) (100) 16.1 (5.0) (100) 37.0 (7.4)
Davidson County Zone
East (341) 17.2 (3.7) (333) 4.0 (0.6) (309) 37.7 (5.1) (309) 33.9 (4.5)
Nashville Promise Zone (361) 20.0 (3.6) (355) 5.1 (0.7) (326) 33.0 (4.6) (326) 34.9 (4.3)
North West (248) 20.5 (7.9) (242) 5.5 (1.4) (233) 34.0 (6.7) (233) 38.5 (7.9)
South East (479) 11.0 (2.2) (475) 4.2 (0.9) (421) 29.0 (3.7) (421) 30.1 (3.7)
South West (370) 2.5 (1.2) (371) 3.9 (0.5) (337) 33.3 (3.4) (337) 18.7 (4.2)
DATA SOURCE: Nashville Community Health + Well-being Survey, 2019 *p<.001
Note: Question wordings include the following: Subjective Health rated as Fair/Poor – “Would you say that in general your health is: excellent, very good, good, fair, poor.” Number of days (in past 30) that physical health not good – “Now thinking about your physical health, which includes physical illness and injury, for how many days during the past 30 days was your physical health not good?” Body Mass Index (BMI) classified as overweight – BMI constructed using the questions “About how much do you weigh without shoes?” & “About how tall are you without shoes?” and the formula: BMI = [ (weight in pounds * 703) / (height in inches)2 ]. BMI values of 25.0 to 29.9 are classified as being overweight; BMI values of 30.0 and above are classified as being obese.

Nashville Community Health + Well-being Survey
15 | P a g e Survey Research Laboratory, University of Illinois at Chicago © 2019 Board of Trustees of the University of Illinois
Poor Health Days
Another commonly employed measure of health-related quality of life is concerned with self-reported
number of unhealthy days (Centers for Disease Control and Prevention, 2000). In response to one such
question, “Now thinking about your physical health, which includes physical illness and injury, for how
many days during the past 30 days was your physical health not good?”, adults in Davidson County
reported an average of 4.4 days of poor health (Range = 0-30). The average number of poor health days
varied across several sociodemographics. Females reported more poor health days on average (5.0
days), compared to males (3.7 days). Persons aged 50-64 years reported the most poor health days (5.4
days), and those aged 30-49 reported the fewest (3.5 days). Education was strongly associated with poor
health days. Those with less than a high school education reported 8.2 poor health days on average, and
those with graduate degrees reported the fewest average number of poor health days (2.2 days). A
similar relationship with household income was observed, with those in the lowest income category –
less than $25,000 – reporting an average of 6.3 poor health days, and those in the highest income
category – $100,000 and above – reporting an average of 2.2 days of poor health. Unemployed persons
also reported more poor health days (6.6 days) than did those who were currently employed (3.2 days).
Persons with gay-lesbian-bisexual orientations reported an average of 9.2 days of poor health,
compared to 3.9 poor health days for heterosexuals.
Body Mass Index
Survey respondents were also asked to report their weight and height. Using these two measures, a
standardized indicator of body fat known as the body mass index (BMI) was estimated.1 BMI standards
have been established by the Centers for Disease Control and Prevention for identifying adults who are
overweight (BMI values of 25.0-29.9) and obese (BMI values of 30.0 and above). Estimates for Davidson
County are provided in Table 3. About a third (33.1%) of all adults were classified as overweight and an
additional 30.5% were classified as being obese. The average BMI score for Davidson County adults was
27.9% (se = 0.3; Range = 10.1-62.7; data not included in tables).
Differences in risk for being overweight or obese varied by gender, age, and race/ethnicity. Compared to
females (24.7%), males were more likely to be overweight (42.6%). Females, though, were more likely to
be classified as obese (35.9%), compared to males (24.3%). When examined by age, persons 65 and
older were most likely to be overweight (41.3%) and those aged 50-64 years were most likely to be
obese (41.0%). Persons aged 18-29 years were least likely to be overweight (26.2%) or obese (21.3%).
Adults of mixed or other race/ethnicities were most likely to be overweight (48.1%) and African
Americans were most likely to be obese (47.8%). African Americans and non-Hispanic whites were least
likely to be overweight (30.7% and 31.3%, respectively). Persons of mixed or other race/ethnicities were
least likely to be obese (12.7%).
1 https://www.cdc.gov/healthyweight/assessing/bmi/index.html

Nashville Community Health + Well-being Survey
16 | P a g e Survey Research Laboratory, University of Illinois at Chicago © 2019 Board of Trustees of the University of Illinois
Oral Health
Two measures of oral health were also examined; results can be seen in Table 4.
Past Year Dental Care
The first of these was having visited a dentist or dental clinic within the past year. Overall, 57.4% of
Davidson County adults reported having done so. Past year dental visits were associated with both
education and household income, with dental care increasing with each. Specifically, 35.0% of those
with less than a high school education reported a past year dental visit, compared to 73.0% of college
graduates and 72.4% of persons with graduate degrees. Similarly, 41.8% of persons reporting household
incomes less than $25,000 had received dental care, compared to 75.5% of those with household
incomes of $100,000 or more.

Nashville Community Health + Well-being Survey
17 | P a g e Survey Research Laboratory, University of Illinois at Chicago © 2019 Board of Trustees of the University of Illinois
Table 4: Oral Health in Davidson County by Demographic Characteristics (cont. next page)
Visited dentist or dental clinic within past year
No permanent teeth removed due to tooth decay or gum
disease
(n) % (se) (n) % (se)
Total Sample (1792) 57.4 (2.1) (1797) 59.1 (2.1)
Gender
Female (1177) 60.8 (2.4) (1182) 54.8 (2.5)
Male (615) 53.8 (3.5) (615) 63.8 (3.3)
Age
18-29 (278) 55.2 (5.7) (280) 82.0 (5.0)
30-49 (613) 53.5 (3.4) (614) 71.5 (3.0)
50-64 (417) 63.2 (4.0) (415) 40.0 (3.9)
65 and older (413) 63.2 (3.8) (417) 28.8* (3.4)
Race/Ethnicity
African American (406) 45.3 (4.4) (405) 43.6 (4.5)
Hispanic/Latino (114) 61.4 (8.2) (115) 68.6 (7.0)
White, non-Hispanic (1119) 62.4 (2.6) (1121) 64.7 (2.5)
Mixed/other (94) 56.1 (8.3) (97) 57.4* (8.2)
Education
Less than high school (99) 35.0 (7.1) (99) 21.9 (5.7)
High school graduate/GED (232) 49.8 (5.5) (232) 46.6 (5.6)
Some college, no degree (380) 47.9 (4.0) (383) 55.8 (3.9)
College graduate (595) 73.0 (2.8) (596) 76.3 (2.5)
Graduate/professional degree (426) 72.4* (3.5) (426) 78.0* (3.0)
Employment Status
Employed (1093) 56.1 (2.8) (1093) 70.0 (2.7)
Unemployed (612) 60.0 (3.1) (617) 38.7* (3.3)
Annual Household Income
Less than $25,000 (366) 41.8 (4.1) (371) 43.4 (4.2)
$25,000 to less than $50,000 (423) 53.0 (5.1) (423) 47.5 (5.0)
$50,000 to less than $75,000 (321) 60.4 (4.9) (321) 63.3 (4.6)
$75,000 to less than $100,000 (186) 68.8 (6.5) (187) 74.5 (4.8)
$100,000 and greater (348) 75.5* (3.9) (348) 79.7* (3.0)

Nashville Community Health + Well-being Survey
18 | P a g e Survey Research Laboratory, University of Illinois at Chicago © 2019 Board of Trustees of the University of Illinois
Table 4: Oral Health in Davidson County by Demographic Characteristics (cont.)
Visited dentist or dental clinic within past year
No permanent teeth removed due to tooth decay or gum
disease
(n) % (se) (n) % (se)
Health Insurance Coverage
Yes (1605) 58.7 (2.2) (1607) 60.2 (2.2)
No (132) 43.7 (7.9) (135) 55.5 (7.4)
Sexual Orientation
Heterosexual (1585) 59.0 (2.3) (1588) 58.3 (2.4)
Gay-lesbian-bisexual (104) 43.0 (8.8) (105) 72.5 (6.7)
Davidson County Zone
East (340) 50.2 (4.6) (341) 55.9 (4.5)
Nashville Promise Zone (357) 47.8 (4.4) (361) 50.9 (4.4)
North West (250) 64.4 (6.6) (250) 45.2 (7.2)
South East (477) 56.6 (4.4) (475) 60.3 (4.2)
South West (368) 71.8 (4.1) (370) 74.3* (3.2)
DATA SOURCE: Nashville Community Health + Well-being Survey, 2019 *p<.001
Note: Question wordings include the following: Visited dentist or dental clinic within the past year: “Including all types of dentists, such as orthodontists, oral surgeons, and all other dental specialists, as well as dental hygienists, how long has it been since you last visited a dentist or a dental clinical for any reason?” No permanent teeth removed due to tooth decay or gum disease: “How many of your permanent teeth have been removed because of tooth decay or gum disease? Include teeth lost to infection, but do not include teeth lost for other reasons, such as injury or orthodontics.”
Nashville Community Health + Well-being Survey
19 | P a g e Survey Research Laboratory, University of Illinois at Chicago © 2019 Board of Trustees of the University of Illinois
Tooth Loss
A second useful indicator of oral health is whether or not any permanent teeth have been removed due
to tooth decay or gum disease. Among adults in Davidson County, 59.1% indicated no loss of permanent
teeth. This varied across multiple sociodemographic characteristics of the sample. Loss of one or more
permanent teeth increased with age, with 82.0% of persons 18-29 years reporting no tooth loss,
compared to 28.8% of persons aged 65 and older. Hispanic/Latinos were most likely (68.6%) and African
Americans were least likely (43.6%) to report having no tooth loss. In addition, no loss of teeth increased
with respondent education, increasing from 21.9% of persons with less than a high school education to
76.3% of those with a college degree and 78.0% of those with a graduate degree. A similar pattern was
found for household income, with no loss of teeth increasing from 43.4% of those in the lowest income
group (less than $25,000) to 79.7% in the highest income group ($100,000 and greater). Employed
persons were also more likely to report no loss of teeth (70.0% vs. 38.7% of unemployed persons).
Differences across Davidson County zones were also noted, with no loss of permanent teeth greatest in
the South West (74.3%) and lowest in the North West (45.2%).
Mental Health
Several indicators of general mental health conditions and correlates are reported in Table 5. These
include: (1) self-reports of number of days (in the past 30) that mental health was not good, (2) having
ever been diagnosed with depression, (3) currently reporting being dissatisfied with life, and (4) rarely or
never getting needed social support.
Poor Mental Health Days
Respondents were asked about unhealthy days due to mental health conditions: “Now thinking about
your mental health, which includes stress, depression, and problems with emotions, for how many days
during the past 30 days was your mental health not good?” Results for this question can be found in
Table 5. Overall, the number of poor mental health days reported by adults in Davidson County was 5.3
days (Range = 0-30). Females reported more poor mental health days (6.2 days) than did males (4.3
days). Less educated respondents also reported more poor mental health days. Those with less than a
high school education reported an average of 10.5 days of poor mental health, while those with a
graduate or professional degree reported an average of 3.4 days. Unemployed adults also reported
more poor mental health days (7.0 days) compared to those who were employed (4.4 days). Those with
lower household incomes also experienced greater numbers of poor mental health days. Persons in the
lowest income households (less than $25,000) indicated an average of 7.9 days of poor mental health,
compared to 3.1 poor mental health days among those reporting household incomes of $100,000 or
more. Those without health insurance additionally reported greater numbers of poor mental health
days (7.9 days), compared to those with health insurance (5.0 days). Sexual minorities reported 10.2

Nashville Community Health + Well-being Survey
20 | P a g e Survey Research Laboratory, University of Illinois at Chicago © 2019 Board of Trustees of the University of Illinois
poor mental health days, whereas heterosexual respondents reported 4.8 days. The average number of
poor mental health days also varied across sections of Davidson County, with persons residing in the
Nashville Promise Zone reporting a greater number of days (7.3 days), compared to other parts of the
county.

Nashville Community Health + Well-being Survey
21 | P a g e Survey Research Laboratory, University of Illinois at Chicago © 2019 Board of Trustees of the University of Illinois
Table 5: General Mental Health Status in Davidson County by Demographic Characteristics (cont. next page)
Number of days (in past 30) that mental
health not good
Ever diagnosed with Depression
Currently dissatisfied or very dissatisfied with life
Rarely or never get needed
social support
(n) Mean (se) (n) % (se) (n) % (se) (n) % (se)
Total Sample (1766) 5.3 (0.3) (1760) 22.1 (1.7) (1796) 8.1 (1.0) (1798) 11.6 (1.5)
Gender
Female (1157) 6.2 (0.4) (1160) 26.8 (2.1) (1180) 8.0 (1.3) (1182) 10.6 (1.5)
Male (609) 4.3* (0.5) (600) 16.9* (2.8) (616) 8.2 (1.6) (616) 12.6 (2.7)
Age
18-29 (273) 5.8 (0.7) (278) 20.7 (5.0) (279) 5.2 (1.7) (279) 10.1 (3.8)
30-49 (610) 5.2 (0.5) (606) 24.6 (2.7) (614) 9.8 (2.1) (616) 13.6 (2.8)
50-64 (408) 5.8 (0.7) (410) 22.1 (3.2) (416) 6.0 (1.4) (418) 8.0 (1.7)
65 and older (408) 4.3 (0.7) (398) 19.5 (3.2) (418) 11.7 (2.6) (416) 13.7 (2.9)
Race/Ethnicity
African American (390) 5.6 (0.7) (397) 17.1 (2.9) (406) 9.8 (2.3) (406) 15.0 (3.4)
Hispanic/Latino (115) 6.0 (1.2) (113) 17.6 (5.0) (116) 3.7 (2.0) (115) 23.1 (8.3)
White, non-Hispanic (1107) 5.2 (0.4) (1100) 26.3 (2.5) (1121) 8.8 (1.4) (1122) 7.8 (1.3)
Mixed/other (96) 3.3 (1.1) (94) 11.2* (5.1) (97) 3.5 (1.7) (98) 14.4 (6.3)
Education
Less than high school (97) 10.5 (1.7) (89) 36.0 (7.4) (100) 7.9 (3.3) (100) 26.2 (6.3)
High school graduate/GED (226) 5.0 (0.8) (225) 21.3 (4.8) (229) 7.9 (2.1) (232) 18.0 (4.5)
Some college, no degree (369) 5.6 (0.7) (373) 21.3 (3.0) (384) 11.6 (2.6) (382) 11.6 (2.4)
College graduate (591) 4.8 (0.4) (589) 22.9 (2.7) (595) 8.5 (1.9) (596) 5.7 (1.4)
Graduate/professional degree (423) 3.4* (0.4) (425) 17.6 (2.7) (428) 2.8 (0.9) (428) 2.6* (0.8)
Employment Status
Employed (1078) 4.4 (0.4) (1083) 19.4 (2.2) (1094) 5.9 (1.1) (1095) 7.0 (1.5)
Unemployed (602) 7.0* (0.6) (595) 27.1* (2.9) (616) 12.8 (2.1) (617) 18.7* (3.1)
Annual Household Income
Less than $25,000 (359) 7.9 (0.9) (359) 30.2 (3.8) (369) 15.1 (2.7) (372) 21.9 (3.8)
$25,000 to less than $50,000 (412) 5.6 (0.7) (414) 25.3 (5.0) (424) 10.8 (2.8) (425) 11.7 (4.0)
$50,000 to less than $75,000 (319) 4.4 (0.6) (318) 17.2 (3.2) (321) 4.5 (1.7) (320) 8.0 (2.1)
$75,000 to less than $100,000 (184) 4.4 (0.7) (185) 19.6 (4.0) (187) 6.0 (2.3) (187) 8.5 (1.1)
$100,000 and greater (347) 3.1* (0.5) (346) 15.8* (2.8) (348) 1.8* (0.7) (349) 2.2* (1.5)

Nashville Community Health + Well-being Survey
22 | P a g e Survey Research Laboratory, University of Illinois at Chicago © 2019 Board of Trustees of the University of Illinois
Table 5: General Mental Health Status in Davidson County by Demographic Characteristics (cont.)
Number of days (in past 30) that mental
health not good
Ever Diagnosed with Depression
Currently dissatisfied or very dissatisfied with life
Rarely or never get needed
social support
(n) Mean (se) (n) % (se) (n) % (se) (n) % (se)
Health Insurance Coverage
Yes (1579) 5.0 (0.3) (1576) 21.6 (1.9) (1604) 7.0 (1.0) (1607) 9.8 (1.4)
No (134) 7.9* (1.3) (134) 27.6 (6.3) (136) 18.5 (5.6) (136) 27.3 (7.9)
Sexual Orientation
Heterosexual (1561) 4.8 (0.3) (1557) 20.6 (1.8) (1589) 7.3 (1.0) (1591) 9.9 (1.3)
Gay-lesbian-bisexual (102) 10.2* (1.3) (104) 38.7* (7.9) (105) 18.0 (6.1) (105) 22.3 (9.4)
Davidson County Zone
East (334) 5.0 (0.6) (335) 22.3 (3.3) (341) 9.6 (2.4) (339) 13.2 (2.6)
Nashville Promise Zone (352) 7.3 (0.9) (347) 25.5 (3.9) (358) 12.9 (3.0) (361) 18.5 (3.5)
North West (245) 4.7 (1.3) (244) 14.9 (4.7) (249) 5.1 (2.0) (250) 5.0 (2.1)
South East (468) 4.9 (0.6) (467) 23.1 (4.1) (478) 7.9 (2.0) (478) 11.4 (3.3)
South West (367) 4.5* (0.6) (367) 20.7 (2.9) (370) 3.6 (1.1) (370) 6.7 (3.6)
DATA SOURCE: Nashville Community Health + Well-being Survey, 2019 *p<.001
Note: Question wordings include the following: Number of days (in past 30) that mental health not good – “Now thinking about your physical health, which includes physical illness and injury, for how many days during the past 30 days was your physical health not good?” Ever Diagnosed with Depression – “Has a doctor, nurse, or other health professional ever told you that you had any of the following? A depressive disorder, including depression, major depression, dysthymia, or minor depression?” Currently dissatisfied with life: “In general, how satisfied or dissatisfied are you with your life?” Rarely or never get needed social support: “How often do you get the social and emotional support you need?”

Nashville Community Health + Well-being Survey
23 | P a g e Survey Research Laboratory, University of Illinois at Chicago © 2019 Board of Trustees of the University of Illinois
Depression
Another question asked if a doctor, nurse, or other health professional ever indicated that the
respondent had “a depressive disorder, including depression, major depression, dysthymia, or minor
depression.” Overall, 22.1% of the adults in Davidson County reported having ever been diagnosed with
any of these forms of depression. This diagnosis also varied across multiple sociodemographic measures,
including gender, race/ethnicity, employment status, annual household income, and sexual orientation.
Females reported higher prevalence of depression (26.8%) than did males (16.9%). Non-Hispanic whites
were most likely to report a diagnosis of depression (26.3%), whereas persons of mixed or other
race/ethnicities were least likely to report a depression diagnosis (11.2%). Unemployed persons also
reported higher prevalence of depression (27.1%) than did persons currently employed (19.4%).
Depression was also greater among persons within households with lower incomes. Those in households
with incomes of less than $25,000 had a depression prevalence of 30.2%, and those with incomes of
$100,000 and above had a prevalence of 15.8%. Sexual minorities also had a higher prevalence of
depression (38.7%) compared to heterosexual respondents (20.6%).
Life Satisfaction
General dissatisfaction with life was assessed using a question that asked “In general, how satisfied or
dissatisfied are you with your life?” In Davidson County, 8.1% of all adults indicated they were currently
either dissatisfied or very dissatisfied. Household income was strongly associated with this measure,
with 15.1% of those with household incomes below $25,000 reporting dissatisfaction with their life,
compared to 1.8% of those in households with incomes of $100,000 and above.
Social Support
Respondents were also asked to indicate whether or not they received social support: “How often do
you get the social and emotional support you need?” Among adults in Davidson County, 11.6% reported
that they rarely or never receive the social support they need. The degree of social support varied across
several socio-economic measures, including education, household income and employment status. Less
educated persons were generally more likely to report an absence of needed social support (26.2%),
relative to those with graduate degrees (2.6%). Similarly, those with less household income were more
likely to report an absence of needed social support (21.9%), compared to persons with household
incomes of $100,000 or more (2.2%).
Mental Health Treatment
The prevalence of current mental health treatment in Davidson County was 15.5% (see Table 6). There
was little variability in prevalence of treatment across sociodemographic subgroups. Perhaps not

Nashville Community Health + Well-being Survey
24 | P a g e Survey Research Laboratory, University of Illinois at Chicago © 2019 Board of Trustees of the University of Illinois
unexpectedly, there was a strong association between diagnoses of depression and current receipt of
mental health treatment, as 52.6% of those adults with a diagnosis reported currently receiving mental
health treatment, whereas only 5.3% without a diagnosis reporting treatment.

Nashville Community Health + Well-being Survey
25 | P a g e Survey Research Laboratory, University of Illinois at Chicago © 2019 Board of Trustees of the University of Illinois
Table 6: Mental Health Treatment and Attitudes towards Mental Illness and Treatment in Davidson County by Demographic Characteristics (cont. next page)
Currently receiving mental health treatment
Agree that treatment can help people with mental illness lead
normal lives
Agree that people are generally caring and sympathetic to people with mental illness
(n) % (se) (n) % (se) (n) % (se)
Total Sample (1797) 15.5 (1.3) (1781) 85.6 (1.6) (1650) 40.2 (2.1)
Gender
Female (1182) 18.4 (1.8) (1169) 85.3 (2.2) (1072) 37.7 (2.5)
Male (615) 12.3 (1.9) (612) 85.8 (2.3) (578) 42.8 (3.5)
Age
18-29 (279) 12.9 (2.8) (279) 89.1 (3.4) (259) 32.7 (5.3)
30-49 (615) 16.2 (2.3) (613) 85.1 (2.6) (561) 39.2 (3.5)
50-64 (418) 15.7 (2.6) (415) 82.3 (4.2) (386) 40.0 (4.3)
65 and older (417) 18.0 (3.1) (410) 86.7 (2.7) (392) 51.3 (3.9)
Race/Ethnicity
African American (405) 12.8 (2.5) (400) 77.1 (4.3) (357) 45.8 (4.9)
Hispanic/Latino (115) 9.1 (3.2) (113) 80.0 (5.7) (94) 30.3 (7.4)
White, non-Hispanic (1123) 19.1 (1.8) (1116) 90.6 (1.4) (1065) 37.4 (2.4)
Mixed/other (98) 5.3 (3.1) (97) 87.9 (5.2) (89) 30.3 (7.4)
Education
Less than high school (99) 22.5 (5.5) (97) 68.8 (6.7) (71) 46.2 (8.6)
High school graduate/GED (233) 15.1 (3.1) (227) 80.4 (4.1) (204) 39.6 (5.7)
Some college, no degree (384) 13.2 (2.5) (381) 83.8 (3.5) (351) 44.0 (4.3)
College graduate (595) 18.0 (2.4) (595) 94.0 (1.7) (568) 36.7 (3.0)
Graduate/professional degree (427) 13.2 (2.2) (425) 93.6* (2.1) (412) 36.8 (3.5)
Employment Status
Employed (1096) 12.7 (1.5) (1087) 86.0 (2.2) (1018) 39.4 (2.8)
Unemployed (616) 21.0 (2.5) (610) 86.1 (2.2) (563) 40.4 (3.3)
Annual Household Income
Less than $25,000 (370) 20.1 (3.1) (367) 78.3 (3.5) (310) 40.6 (4.6)
$25,000 to less than $50,000 (426) 10.5 (2.2) (421) 85.2 (4.0) (391) 34.7 (4.6)
$50,000 to less than $75,000 (321) 20.6 (3.7) (320) 87.6 (3.9) (307) 49.7 (4.7)
$75,000 to less than $100,000 (187) 11.3 (3.2) (186) 88.3 (4.6) (180) 38.0 (5.9)
$100,000 and greater (347) 13.7 (2.4) (347) 93.1 (2.0) (334) 36.3 (4.3)

Nashville Community Health + Well-being Survey
26 | P a g e Survey Research Laboratory, University of Illinois at Chicago © 2019 Board of Trustees of the University of Illinois
Table 6: Mental Health Treatment and Attitudes towards Mental Illness and Treatment in Davidson County by Demographic Characteristics (cont.)
Currently receiving mental health treatment
Agree that treatment can help people with mental illness lead
normal lives
Agree that people are generally caring and sympathetic to people with mental illness
(n) % (se) (n) % (se) (n) % (se)
Health Insurance Coverage
Yes (1606) 15.5 (1.4) (1597) 85.8 (1.7) (1494) 39.7 (2.2)
No (136) 15.0 (5.1) (133) 81.7 (5.1) (107) 44.3 (8.6)
Sexual Orientation
Heterosexual (1590) 14.3 (1.3) (1579) 86.3 (1.7) (1471) 41.4 (2.3)
Gay-lesbian-bisexual (105) 31.6 (7.5) (105) 87.7 (5.5) (101) 21.6 (6.6)
Davidson County Zone
East (341) 14.0 (2.6) (336) 89.6 (2.3) (307) 39.4 (4.5)
Nashville Promise Zone (359) 19.5 (3.5) (359) 75.9 (4.0) (327) 37.7 (4.6)
North West (250) 15.9 (4.9) (247) 76.6 (8.1) (226) 38.1 (7.1)
South East (478) 13.4 (2.3) (473) 85.4 (3.2) (436) 42.4 (4.4)
South West (369) 16.4 (2.5) (366) 94.3 (1.5) (354) 41.0 (4.0)
Ever Diagnosed with Depression
Yes (425) 52.6 (4.5) (423) 89.2 (2.9) (392) 23.7 (3.4)
No (1328) 5.3* (0.9) (1314) 85.2 (1.9) (1228) 49.1* (2.5)
DATA SOURCE: Nashville Community Health + Well-being Survey, 2019 *p<.001
Note: Question wordings include the following: Currently receiving mental health treatment: “Are you now taking medicine or receiving treatment from a doctor or other health professional for any type of mental health condition or emotional problem?” Agree that treatment can help people with mental illness lead normal lives: “These next statements concern peoples’ attitudes toward mental illness and its treatment. (a) Treatment can help people with mental illness lead normal lives.” Agree that people are generally caring and sympathetic to people with mental illness: “(b) People are generally caring and sympathetic to people with mental illness.” (agree strongly/agree slightly/neither agree nor disagree/disagree slightly/disagree strongly)

Nashville Community Health + Well-being Survey
27 | P a g e Survey Research Laboratory, University of Illinois at Chicago © 2019 Board of Trustees of the University of Illinois
Attitudes Regarding Mental Health
Two items developed for use in the Behavioral Risk Factor Surveillance System (BRFSS) to assess public
attitudes towards persons with mental illness (Centers for Disease Control and Prevention, 2012) were
included in the survey and are reported in Table 6. Respondents were asked to agree or disagree with
two statements. The first statement said “Treatment can help people with mental illness lead normal
lives.” In Davidson County, 85.6% of adults indicated they either agree strongly or agree slightly with this
statement. The extent to which respondents agreed with this statement varied by education. Among
those with less than a high school education, 68.8% agreed that treatment can help people with mental
illness lead normal lives. Among those with college or graduate degrees, 93.9% and 93.6%, respectively,
were in agreement.
A second statement said that “People are generally caring and sympathetic to people with mental
illness.” In contrast to the first statement regarding treatment efficacy, less than half of all adults
(40.2%) agreed either strongly or slightly that people are generally caring and sympathetic to those with
mental illness. Persons having ever been diagnosed with depression were less likely to agree with this
statement (23.7%) than those having never received such a diagnosis (49.1%).

Nashville Community Health + Well-being Survey
28 | P a g e Survey Research Laboratory, University of Illinois at Chicago © 2019 Board of Trustees of the University of Illinois
Health Care Access & Utilization
Access to health care is essential to good health. Multiple dimensions of health care access were
covered in the Nashville Community Health + Well-being Survey. Key findings are presented in this
section.
Health Insurance Coverage
An important indicator of health care access is having health insurance coverage. Among Davidson
County adults, 90.1% reported currently having health insurance (Table 7). Those with health insurance
reported coverage through a variety of programs, including employer or union plans (48.4%, se=2.1),
purchased plans (8.2%, se=1.5), Medicare (26.8%, se=1.7), Medicaid (6.5%, se=1.2), TRICARE, BA or
military plans (2.1, se=0.5), and other sources (3.0, se=0.5); data not included in tables. Health insurance
coverage varied by race/ethnicity, with Hispanic/Latinos reporting lower coverage (67.0%), compared to
all other groups, each of which enjoyed insurance coverage rates above 90%. Health insurance coverage
also increased with educational achievement, varying from 78.4% among adults with less than a high
school degree, to 98.8% among persons with a graduate or professional degree. A large difference in
health insurance coverage was also found by sexual orientation, with minority groups (70.3%) and
heterosexuals (92.5%). Of those currently with health insurance, 6.7% (se = 1.2) reported that there had
been a time in the past 12 months when they did not have health insurance coverage (data not included
in tables).

Nashville Community Health + Well-being Survey
29 | P a g e Survey Research Laboratory, University of Illinois at Chicago © 2019 Board of Trustees of the University of Illinois
Table 7: Health Care Access & Utilization in Davidson County by Demographic Characteristics (cont. next page)
Health Insurance Coverage Have personal doctor or
health care provider Visited doctor for routine checkup within past year
(n) % (se) (n) Mean (se) (n) % (se)
Total Sample (1749) 90.1 (1.4) (1799) 67.5 (2.1) (1798) 64.7 (2.1)
Gender
Female (1145) 90.9 (1.5) (1183) 72.0 (2.3) (1183) 72.0 (2.2)
Male (604) 89.4 (2.5) (616) 62.5 (3.6) (615) 56.7 (3.6)
Age
18-29 (280) 88.6 (4.1) (280) 38.0 (5.3) (280) 40.6 (5.2)
30-49 (611) 86.4 (2.5) (616) 64.3 (3.2) (617) 63.8 (3.1)
50-64 (415) 90.5 (2.4) (417) 82.0 (3.3) (416) 72.8 (3.7)
65 and older (376) 99.7 (0.3) (414) 94.6* (1.5) (415) 86.2* (2.7)
Race/Ethnicity
African American (387) 94.2 (1.8) (407) 70.4 (4.5) (407) 79.7 (3.5)
Hispanic/Latino (114) 67.0 (5.5) (116) 47.7 (8.9) (116) 46.1 (8.5)
White, non-Hispanic (1096) 92.1 (1.6) (1118) 71.6 (2.5) (1118) 61.6 (2.6)
Mixed/other (95) 91.9* (4.7) (98) 49.6 (8.3) (98) 56.7* (8.1)
Education
Less than high school (89) 78.4 (5.7) (99) 67.8 (6.5) (98) 67.5 (6.5)
High school graduate/GED (219) 86.3 (4.0) (229) 68.1 (5.8) (232) 67.3 (5.7)
Some college, no degree (375) 86.2 (3.1) (383) 65.8 (4.2) (382) 59.2 (4.2)
College graduate (587) 96.8 (0.9) (597) 63.3 (3.2) (596) 59.9 (3.1)
Graduate/professional degree (421) 98.8* (0.6) (428) 76.4 (3.1) (428) 74.5 (3.1)
Employment Status
Employed (1092) 91.0 (1.6) (1096) 62.0 (2.8) (1096) 59.7 (2.8)
Unemployed (578) 88.4 (3.0) (615) 79.1* (3.1) (615) 73.4 (3.2)
Annual Household Income
Less than $25,000 (353) 81.7 (3.2) (371) 67.8 (4.0) (371) 68.4 (3.7)
$25,000 to less than $50,000 (410) 87.3 (4.3) (426) 60.0 (5.3) (425) 59.3 (5.3)
$50,000 to less than $75,000 (317) 93.2 (2.7) (320) 67.1 (4.6) (319) 59.7 (4.7)
$75,000 to less than $100,000 (184) 97.3 (1.3) (187) 68.3 (6.4) (186) 61.4 (6.3)
$100,000 and greater (346) 96.3 (2.0) (349) 74.6 (4.3) (349) 73.9 (3.4)

Nashville Community Health + Well-being Survey
30 | P a g e Survey Research Laboratory, University of Illinois at Chicago © 2019 Board of Trustees of the University of Illinois
Table 7: Health Care Access & Utilization in Davidson County by Demographic Characteristics (cont.)
Health Insurance Coverage Have personal doctor or
health care provider Visited doctor for routine checkup within past year
(n) % (se) (n) Mean (se) (n) % (se)
Sexual Orientation
Heterosexual (1548) 92.5 (1.1) (1590) 69.1 (2.2) (1592) 65.9 (2.2)
Gay-lesbian-bisexual (104) 70.3* (9.7) (105) 60.4 (8.9) (103) 45.6 (8.3)
Davidson County Zone
East (323) 92.3 (2.3) (339) 70.5 (4.2) (371) 65.0 (4.9)
Nashville Promise Zone (350) 83.7 (3.7) (361) 62.3 (4.2) (425) 55.3 (4.4)
North West (242) 86.9 (5.4) (250) 79.5 (5.6) (319) 75.9 (5.8)
South East (469) 90.1 (3.1) (479) 63.0 (4.7) (186) 63.6 (4.6)
South West (365) 94.4 (2.0) (370) 69.7 (4.1) (349) 69.5 (3.4)
Health Insurance Coverage
Yes -- -- -- (1608) 71.6 (2.2) (1592) 68.9 (2.2)
No -- -- -- (137) 24.0* (6.1) (103) 21.4* (5.0)
DATA SOURCE: Nashville Community Health + Well-being Survey, 2019 *p<.001
Note: Question wordings include the following: Health Insurance Coverage: “What it the primary source of your health care coverage? Is it … a plan purchased through an employer or union, a plan that you or another family member buys on your own, Medicare, Medicaid or other state program, TRICARE (formerly CHAMPUS), VA, or military, Alaska Native, Indian Health Service, Tribal Health Services, Some other source, none (no coverage).” Have personal doctor or health care provider: “Do you have one person you think of as your personal doctor or health care provider?” Visited doctor for routine checkup within past year: “About how long has it been since you last visited a doctor for a routine checkup? A routine checkup is a general physical exam, not an exam for a specific injury, illness, or condition.”

Nashville Community Health + Well-being Survey
31 | P a g e Survey Research Laboratory, University of Illinois at Chicago © 2019 Board of Trustees of the University of Illinois
Personal Physician
Among adults in Davidson County, 67.5% indicating having a personal doctor or health care provider
(Table 7). Having a personal provider increased with age, from 38.0% among adults aged 18-29 years, to
94.6% among those aged 65 and older. Unexpectedly, unemployed adults were more likely to report
having a personal doctor or health care provider (79.1%) than were employed persons (62.0%). The
relationship between health insurance coverage and having a personal doctor or other health care
provider was also examined in Table 7. Those with insurance coverage were much more likely to report
having a personal health care provider (71.6%), in contrast to those not covered by health insurance
(24.0%).
Past Year Routine Check-Up
Just under two-thirds of Davidson County adults (64.7%) reported having visited a physician for a routine
check-up within the past year. Routine check-ups increased with age, ranging from 40.6% of adults aged
18-29 years, to 86.2% of those aged 65 and older. Routine check-ups varied also by race/ethnicity.
African Americans were most likely to have had a routine check-up in the past year (79.7%) and
Hispanic/Latinos were least likely to have had a routine check-up in the past year (46.1%). Health
insurance coverage was again strongly associated with this measure, as 68.9% of those with insurance
reported a past year routine check-up, compared to only 21.4% of those adults who did not enjoy health
insurance coverage.
Barriers to Health Care
Several common barriers to receipt of health care were explored. These included cost, and obtaining
appointments and transportation. Findings are provided in Table 8.
Cost Barriers to Medical Care
Respondents were asked “Was there a time in the past 12 months when you needed to see a doctor but
could not because of cost?” In Davidson County, 16.4% of adults indicated that cost kept them from
seeing a doctor during the past 12 months. Cost barriers were primarily concentrated among persons
without health insurance. About sixty-one percent of adults without current health coverage reported
not seeing a doctor due to cost (60.9%). Almost twelve percent of those with health insurance also
reported not seeing a doctor during the past 12 months due to cost (11.8%). Additional questions
concerning cost and financial barriers can be found in Table 9.

Nashville Community Health + Well-being Survey
32 | P a g e Survey Research Laboratory, University of Illinois at Chicago © 2019 Board of Trustees of the University of Illinois
Table 8: Barriers to Seeing a Physician during Past 12 Months in Davidson County by Demographic Characteristics (cont. next page)
Cost Appointment Problems Transportation Problems
(n) Mean (se) (n) % (se) (n) % (se)
Total Sample (1788) 16.4 (1.5) (1760) 13.3 (1.3) (1760) 2.9 (0.7)
Gender
Female (1177) 17.3 (1.9) (1152) 17.1 (2.1) (1152) 3.6 (0.9)
Male (611) 15.4 (2.5) (608) 9.2 (1.5) (608) 2.2 (1.0)
Age
18-29 (280) 19.3 (4.1) (278) 16.8 (3.1) (278) 3.1 (1.3)
30-49 (614) 21.1 (2.7) (608) 14.9 (2.0) (608) 2.5 (1.3)
50-64 (414) 16.6 (3.1) (403) 14.8 (4.1) (403) 0.7 (0.3)
65 and older (410) 4.5 (1.5) (401) 4.9 (1.5) (401) 4.7 (1.8)
Race/Ethnicity
African American (400) 15.8 (2.7) (391) 14.6 (3.6) (391) 4.7 (1.3)
Hispanic/Latino (116) 27.4 (7.6) (114) 19.3 (5.0) (114) 6.0 (4.1)
White, non-Hispanic (1118) 14.7 (1.9) (1100) 11.3 (1.3) (1100) 1.9 (0.7)
Mixed/other (96) 18.1 (6.2) (97) 18.1 (5.6) (97) 0.4 (0.4)
Education
Less than high school (100) 20.2 (6.0) (93) 16.3 (4.6) (93) 11.7 (5.5)
High school graduate/GED (228) 13.9 (3.1) (225) 10.3 (3.5) (225) 4.6 (1.6)
Some college, no degree (380) 25.7 (3.9) (373) 11.9 (2.4) (373) 2.0 (0.7)
College graduate (594) 13.2 (2.1) (586) 15.3 (2.2) (586) 0.8 (0.6)
Graduate/professional degree (424) 8.8 (2.1) (423) 16.4 (2.9) (423) 0.5* (0.4)
Employment Status
Employed (1090) 18.6 (2.1) (1077) 14.9 (1.9) (1077) 0.9 (0.4)
Unemployed (613) 11.8 (2.1) (600) 11.0 (1.8) (600) 6.0* (1.6)
Annual Household Income
Less than $25,000 (370) 23.2 (3.4) (356) 19.2 (3.0) (356) 8.4 (2.3)
$25,000 to less than $50,000 (418) 22.1 (3.7) (416) 13.3 (3.9) (416) 1.3 (0.7)
$50,000 to less than $75,000 (319) 16.8 (3.7) (316) 10.7 (2.3) (316) 0.0 --
$75,000 to less than $100,000 (186) 15.7 (6.4) (185) 13.7 (3.9) (185) 0.5 (0.5)
$100,000 and greater (348) 4.0 (1.4) (345) 11.4 (2.4) (345) 0.3* (0.3)
Health Insurance Coverage
Yes (1600) 11.8 (1.4) (1579) 13.1 (1.4) (1579) 3.2 (0.8)
No (135) 60.9* (7.8) (135) 14.3 (4.4) (135) 0.8 (0.5)

Nashville Community Health + Well-being Survey
33 | P a g e Survey Research Laboratory, University of Illinois at Chicago © 2019 Board of Trustees of the University of Illinois
Table 8: Barriers to Seeing a Physician during Past 12 Months in Davidson County by Demographic Characteristics (cont.)
Cost Appointment Problems Transportation Problems
(n) Mean (se) (n) % (se) (n) % (se)
Sexual Orientation
Heterosexual (1580) 14.8 (1.6) (1561) 13.1 (1.5) (1561) 2.5 (0.6)
Gay-lesbian-bisexual (105) 28.5 (7.4) (101) 17.8 (5.4) (101 3.3 (2.8)
Davidson County Zone
East (337) 18.2 (3.9) (331) 90.8 (2.0) (331) 2.8 (1.2)
Nashville Promise Zone (358) 25.4 (4.1) (348) 84.3 (2.9) (348) 8.0 (2.8)
North West (251) 14.2 (4.9) (248) 83.4 (7.8) (248) 2.0 (0.9)
South East (475) 13.9 (2.4) (467) 87.5 (2.2) (467) 2.1 (0.0)
South West (367) 10.6 (2.1) (366) 84.9 (2.6) (366) 0.2* (0.2)
DATA SOURCE: Nashville Community Health + Well-being Survey, 2019 *p<.001
Note: Question wordings include the following: Cost – “Was there a time in the past 12 months when you needed to see a doctor but could not because of cost?” Appointment Problems – “(Other than cost), have you delayed getting needed medical care for any of the following reasons in the past 12 months? (1) you couldn’t get through on the telephone, (2) You couldn’t get an appointment soon enough, (3) once you got there, you had to wait too long to see the doctor, (4) the (clinic/doctor’s) office wasn’t open when you go there.” Transportation Difficulties – “(5) you didn’t have transportation.”

Nashville Community Health + Well-being Survey
34 | P a g e Survey Research Laboratory, University of Illinois at Chicago © 2019 Board of Trustees of the University of Illinois
Appointment Problems
Among all adults, 13.3% also reported having some form of difficulty obtaining an appointment as a
reason for not seeing a doctor (other than cost). These included not being able to “get through on the
telephone,” not being able to “get an appointment soon enough,” “having to wait too long to see the
doctor,” and the clinic or doctor’s office “wasn’t open” when they arrived.
Transportation Problems
A smaller proportion of adults in Davidson County (2.9%) reported lack of transportation as a reason
(other than cost) for not seeing a doctor when needed during the past 12 months. Transportation
problems were concentrated in several population subgroups. Those with less education were more
likely to report this problem: 11.7% of those without a high school diplomas, compared to 0.8% and
0.5%, respectively, of adults with college or graduate degrees. Transportation problems were also
greater among the unemployed (6.0%), compared to those who were employed (0.9%). Persons with
low household income were also more likely to report difficulty with transportation, as 8.4% of those
with incomes below $25,000 reported this problem, compared to less than 1.0% of those with
household incomes of $50,000 and above. Persons residing in the Nashville Promise Zone were more
likely to report transportation problems (8.0%), compared to adults living elsewhere. Additional
transportation questions are provided in Table 10.
Cost Barriers to Prescription Medications
Access to needed prescription medicines is an essential element to health maintenance. Cost-related
barriers to obtaining needed medications were assessed with a question that asked: “Not including over
the counter (OTC) medications, was there a time in the past 12 months when you did not take your
medication as prescribed because of cost?” As shown on Table 9, within Davidson County, 11.9% of all
adults indicated that costs were a reason they had not taken prescription medications at some point
during the past year. Younger persons were more likely to report this problem (20.3%), with persons 65
and older least likely (4.4%) to have seen cost as a barrier to needed medications. Persons without
health insurance were also much more likely to report cost barriers to obtaining medications (54.6%),
relative to those with health insurance (8.9%). Persons residing in the Nashville Promise Zone were also
at greater risk of encountering cost barriers to prescription medications (24.2%), compared to persons
living in other parts of Davidson County.

Nashville Community Health + Well-being Survey
35 | P a g e Survey Research Laboratory, University of Illinois at Chicago © 2019 Board of Trustees of the University of Illinois
Table 9: Cost Barriers to Health Care in Davidson County by Demographic Characteristics (cont. next page)
Did not take prescription medications because of cost
during past 12 months (among those with
prescriptions)
Currently have health care bills being paid off over
time
Always/usually worried or stressed about money for rent/mortgage during past
12 months
Always/usually worried or stressed about money for
nutritious meals during past 12 months
(n) % (se) (n) % (se) (n) % (se) (n) % (se)
Total Sample (1454) 11.9 (1.4) (1798) 22.0 (1.9) (1795) 18.0 (1.7) (1792) 13.9 (1.7)
Gender
Female (999) 13.2 (1.8) (1182) 23.4 (2.3) (1191) 18.1 (2.0) (1179) 14.4 (1.8)
Male (455) 10.3 (2.2) (616) 20.5 (3.0) (614) 17.9 (2.9) (613) 13.4 (3.1)
Age
18-29 (191) 20.3 (4.4) (280) 17.5 (4.3) (280) 20.3 (4.4) (279) 17.2 (5.3)
30-49 (465) 15.0 (2.7) (614) 24.9 (3.0) (614) 21.1 (3.0) (616) 17.5 (2.8)
50-64 (353) 7.3 (2.4) (417) 28.8 (4.4) (417) 15.6 (2.9) (414) 10.8 (3.2)
65 and older (387) 4.4* (1.3) (415) 14.5 (2.8) (415) 12.8 (3.0) (414) 6.6 (2.0)
Race/Ethnicity
African American (341) 11.5 (2.5) (405) 28.9 (4.3) (403) 22.6 (3.6) (402) 14.2 (2.6)
Hispanic/Latino (80) 20.5 (6.8) (115) 19.0 (5.4) (115) 20.4 (7.3) (100) 20.6 (7.4)
White, non-Hispanic (919) 10.4 (1.8) (1120) 19.8 (2.2) (1121) 16.6 (2.1) (1121) 13.0 (2.5)
Mixed/other (65) 19.6 (8.7) (98) 19.2 (6.7) (98) 8.6 (3.6) (96) 11.0 (4.8)
Education
Less than high school (83) 14.8 (5.5) (99) 22.5 (6.7) (99) 40.6 (7.8) (99) 30.3 (8.0)
High school graduate/GED (193) 11.9 (3.1) (231) 24.3 (4.6) (230) 16.4 (3.5) (231) 14.6 (4.5)
Some college, no degree (307) 16.3 (3.4) (382) 28.7 (4.1) (382) 25.0 (4.0) (380) 18.6 (3.5)
College graduate (462) 11.7 (2.3) (596) 18.6 (2.5) (597) 12.6 (2.0) (594) 10.3 (2.1)
Graduate/professional degree (357) 4.3 (1.2) (428) 13.2 (2.4) (427) 6.7* (1.5) (428) 3.2* (1.0)
Employment Status
Employed (844) 13.2 (2.0) (1096) 23.7 (2.6) (1092) 17.4 (2.2) (1094) 15.0 (2.4)
Unemployed (541) 10.1 (1.9) (614) 19.7 (2.6) (616) 19.0 (2.7) (612) 11.4 (2.2)

Nashville Community Health + Well-being Survey
36 | P a g e Survey Research Laboratory, University of Illinois at Chicago © 2019 Board of Trustees of the University of Illinois
Table 9: Cost Barriers to Health Care in Davidson County by Demographic Characteristics (cont.)
Did not take prescription medications because of cost
during past 12 months (among those with
prescriptions)
Currently have health care bills being paid off over
time
Always/usually worried or stressed about money for rent/mortgage during past
12 months
Always/usually worried or stressed about money for
nutritious meals during past 12 months
(n) % (se) (n) % (se) (n) % (se) (n) % (se)
Annual Household Income
Less than $25,000 (294) 18.5 (3.2) (368) 21.8 (3.2) (369) 29.3 (3.8) (370) 19.6 (3.2)
$25,000 to less than $50,000 (359) 18.2 (3.8) (425) 27.5 (4.6) (424) 23.1 (3.8) (422) 26.2 (5.2)
$50,000 to less than $75,000 (234) 12.4 (3.9) (321) 29.9 (4.9) (321) 16.3 (4.5) (321) 9.7 (3.4)
$75,000 to less than $100,000 (156) 2.8 (1.0) (187) 23.2 (6.5) (187) 12.9 (6.4) (187) 11.0 (6.4)
$100,000 and greater (287) 1.9* (0.7) (349) 12.6 (3.1) (348) 4.0* (2.5) (347) 0.9* (0.5)
Health Insurance Coverage
Yes (1319) 8.9 (1.2) (1609) 21.6 (2.0) (1605) 17.2 (1.8) (1601) 13.3 (1.9)
No (80) 54.6* (9.3) (136) 27.9 (6.8) (134) 27.6 (6.5) (136) 20.5 (5.8)
Sexual Orientation
Heterosexual (1283) 10.9 (1.4) (1591) 21.8 (2.0) (1582) 17.6 (1.8) (1585) 13.2 (1.9)
Gay-lesbian-bisexual (84) 23.7 (7.4) (105) 29.4 (7.4) (105) 22.7 (6.5) (105) 20.6 (6.3)
Davidson County Zone
East (257) 11.5 (3.0) (339) 27.1 (4.4) (338) 21.1 (4.3) (341) 17.1 (4.1)
Nashville Promise Zone (287) 24.2 (4.4) (358) 29.7 (4.4) (360) 27.3 (4.2) (358) 18.3 (3.6)
North West (216) 9.4 (4.0) (251) 19.8 (7.6) (251) 15.7 (5.1) (250) 15.7 (6.2)
South East (394) 10.3 (2.4) (479) 22.0 (3.4) (475) 15.8 (3.1) (473) 13.6 (4.0)
South West (300) 4.8* (1.6) (371) 10.8* (2.1) (371) 10.3 (2.1) (370) 6.1 (1.7)
DATA SOURCE: Nashville Community Health + Well-being Survey, 2019 *p<.001
Note: Question wordings include the following: Did not take prescription medications because of cost during past 12 months: “Not including over the counter (OTC) medications, was there a time in the past 12 months when you did not take your medication as prescribed because of cost?” [among persons with prescriptions only] Currently have health care bills being paid off over time: “Do you currently have any health care bills that are being paid off over time?” Always/usually worried or stressed about money for rent/mortgage during past 12 months: “How often in the past 12 months would you say you were worried or stressed about having enough money to pay your rent/mortgage? Would you say you were worried or stress always, usually, sometimes, rarely or never?”

Nashville Community Health + Well-being Survey
37 | P a g e Survey Research Laboratory, University of Illinois at Chicago © 2019 Board of Trustees of the University of Illinois
Always/usually worried or stressed about money for nutritious meals during past 12 months: “How often in the past 2 months would you say you were worried or stressed about having enough money to buy nutritious meals? Would you say you were worried or stress always, usually, sometimes, rarely or never?”

Nashville Community Health + Well-being Survey
38 | P a g e Survey Research Laboratory, University of Illinois at Chicago © 2019 Board of Trustees of the University of Illinois
Unpaid Health Bills
More than one-in-five adults in Davidson County (22.0%) indicated that they currently have “health care
bills that are being paid off over time.” This varied by zone within the county, with more than one-
quarter of Nashville Promise Zone (29.7%) and East Zone (27.1%) residents reporting currently having
unpaid medical bills. In South West Davidson County, the proportion of adults having unpaid bills was
much lower (10.8%).
Financial Stress
Several questions asked about important aspects of economic stress (Table 9). The first asked “How
often in the past 12 months would you say you were worried or stressed about having enough money to
pay your rent/mortgage? Would you say you were worried or stressed always, usually, sometimes,
rarely, never?” Within Davidson County, 18.0% reported being always or usually worried or stressed
about their mortgage or rent. The degree of stress varied across education and income groups, as might
be expected. Persons with less than a high school degree were most likely to report considerable worry
or stress (40.6%), with persons with graduate or professional degrees least likely (6.7%). Similarly, those
in the lowest household income group (under $25,000) were most likely to report always or usually
worrying or stressed regarding mortgage or rent (29.3%), compared to persons in the highest income
category ($100,000 and above), few of whom indicated high levels of stress/worry (4.0%).
A similar question asked about stress associated with having sufficient financial resources to insure a
healthy diet: “How often in the past 12 months would you say you were worried or stressed about having
enough money to buy nutritious meals?” Among adults in Davidson County, 13.9% indicated being
always or usually worried or stressed about this. Similar to the previous question about rent/mortgage-
related financial stress, the stress related to having the finances to support a healthy diet was greater
among persons with lower incomes and less education. The least educated (less than high school) were
most likely to be stressed or worried (30.3%), compared to persons with a graduate/professional degree
(3.2%). Persons with household incomes below $50,000 were also likely to be stressed or worried about
money for nutritious meals (19.6% of those with incomes below $25,000 and 26.2% of those with
incomes from $25,000 to less than $50,000). In contrast, very few persons with household incomes of
$100,000 or greater reported always or usually being worried or stressed over this (0.9%).
Another question (not shown in tables) asked respondents “Have you moved in with someone, or has
someone moved in with you in the last 12 months to share household expenses?” Among adults in
Davidson County, 14.4% (se = 1.6, n = 1,758) did report having to alter their living arrangements in order
to reduce/share household expenses. Young adults were most likely to report having to move to share
household expenses (29.6%) and persons 65 and above were least likely (3.9%). The unemployed were
also more likely to report having to share household expenses (17.5%), compared to persons currently
employed (7.8%). Though there is not a consensus on the issue (Schuetz 2019), home ownership has
also been associated with more financial security. This study shows that 53.8% of respondents own their

Nashville Community Health + Well-being Survey
39 | P a g e Survey Research Laboratory, University of Illinois at Chicago © 2019 Board of Trustees of the University of Illinois
home (se = 2.2), 43.3% rent (se = 2.2), and 3.0% (se = 0.6) report having other living arrangements.
Finally, 19.1% of the adults in Davidson County reported having moved at least once during the past 12
months (se=1.6).
Health Care and Transportation
Additional questions regarding transportation are presented in Table 10. A small proportion of adults in
Davidson County (2.3%) reported that they found it extremely or very difficult to get transportation for
health care. These difficulties were most commonly reported by persons within the lowest education
group (13.1% of persons without a high school diploma) and those living in households with income of
less than $25,000 (7.9%).
Respondents were also asked “Does lack of money for transportation expenses, such as parking, cab or
bus fare, make it difficult to get to the doctor or dentist?” Among all Davidson County adults, 8.6%
indicated this to be a problem. Persons in the lowest education group (less than high school) were again
most likely to report this problem (30.3%). Similarly, persons in the lowest household income group (less
than $25,000) also were most likely to report lack of money for health care-related transportation
(21.6%). Unemployed persons additionally reported higher risk of having insufficient money for health
care transportation (15.0% vs. 4.5% of employed persons). Persons residing in the Nashville Promise
Zone were also more likely to report lack of transportation money for this purpose (21.2%), compared to
those living in other parts of Davidson County.
A related question asked respondents if they ever “put off or neglect going to the doctor or dentist
because of distance or transportation.” Among all Davidson County adults, 6.6% indicated they did
neglect receiving health care due to distance or transportation. This was again found to be a problem
primarily concentrated among persons with less education (14.4% of those with less than a high school
degree vs. 1.3% of those with a graduate or professional degree), less household income (14.2% of those
earning less than $25,000 vs. 0.5% of those earning $100,000 or more), and the unemployed (11.4% vs.
3.5% of those who were employed).
A final question asked “Do you put off or neglect going to the pharmacy or doctor to pick up your
medication because of distance or transportation?” Approximately five percent of the sample (4.8%)
reported having avoiding accessing needed medications due to distance or transportation concerns. This
problem was found to be greatest among persons in households reporting income of less than $25,000
(12.1%).

Nashville Community Health + Well-being Survey
40 | P a g e Survey Research Laboratory, University of Illinois at Chicago © 2019 Board of Trustees of the University of Illinois
Table 10: Transportation Barriers to Health Care in Davidson County by Demographic Characteristics (cont. next page)
Extremely/very difficult to get transportation for any
health care
Lack of transportation money makes
physician/dentist visit difficult
Neglect physician/dentist visit because of distance or
transportation
Neglect getting medication because of distance or
transportation
(n) % (se) (n) % (se) (n) % (se) (n) % (se)
Total Sample (1766) 2.3 (0.6) (1765) 8.6 (1.1) (1760) 6.6 (1.0) (1764) 4.8 (0.9)
Gender
Female (1160) 2.5 (0.8) (1159) 11.1 (1.5) (1154) 7.4 (1.2) (1159) 6.0 (1.2)
Male (606) 2.1 (1.0) (606) 5.8 (1.5) (606) 5.8 (1.5) (605) 3.6 (1.3)
Age
18-29 (280) 2.2 (1.1) (280) 10.3 (2.7) (278) 8.5 (2.4) (279) 9.5 (2.6)
30-49 (616) 2.2 (1.2) (617) 9.0 (1.9) (613) 6.4 (1.6) (616) 4.3 (1.4)
50-64 (417) 1.4 (1.0) (416) 6.1 (1.7) (416) 4.7 (1.5) (417) 1.4 (0.7)
65 and older (415) 2.6 (1.2) (415) 8.5 (2.4) (415) 7.5 (2.4) (414) 4.4 (1.7)
Race/Ethnicity
African American (403) 3.9 (1.4) (402) 13.8 (2.6) (403) 9.4 (2.1) (403) 6.2 (1.7)
Hispanic/Latino (116) 5.5 (3.8) (116) 11.3 (4.6) (116) 5.9 (3.7) (116) 6.6 (3.9)
White, non-Hispanic (1121) 0.5 (0.3) (1122) 6.0 (1.2) (1119) 5.4 (1.2) (1121) 4.0 (1.1)
Mixed/other (98) 7.3 (3.9) (98) 4.3 (2.2) (98) 7.8 (3.9) (98) 3.3 (2.1)
Education
Less than high school (99) 13.1 (5.7) (99) 30.3 (6.8) (99) 14.4 (5.4) (99) 11.3 (5.2)
High school graduate/GED (229) 2.5 (1.1) (230) 10.7 (2.5) (229) 7.3 (2.0) (231) 6.4 (1.9)
Some college, no degree (384) 2.1 (0.9) (383) 8.8 (2.2) (382) 8.7 (2.2) (383) 4.6 (1.8)
College graduate (597) 0.1 (0.1) (597) 2.9 (0.9) (595) 4.8 (1.4) (595) 3.9 (1.2)
Graduate/professional degree (427) 0.4* (0.3) (428) 2.4* (0.9) (427) 1.3* (0.5) (428) 1.0 (0.6)
Employment Status
Employed (1094) 1.4 (0.6) (1095) 4.5 (1.0) (1092) 3.5 (0.9) (1095) 2.6 (0.8)
Unemployed (615) 3.3 (1.0) (616) 15.0* (2.3) (613) 11.4* (2.1) (614) 8.4 (1.8)
Annual Household Income
Less than $25,000 (369) 7.9 (2.3) (370) 21.6 (3.2) (367) 14.2 (2.7) (369) 12.1 (2.6)
$25,000 to less than $50,000 (424) 1.1 (0.9) (424) 8.2 (2.5) (422) 8.4 (2.5) (424) 4.7 (1.9)
$50,000 to less than $75,000 (320) 0.0 -- (321) 1.0 (0.6) (321) 1.1 (0.6) (321) 2.5 (1.3)
$75,000 to less than $100,000 (187) 0.4 (0.4) (187) 1.1 (0.6) (187) 0.7 (0.5) (187) 0.1 (0.1)
$100,000 and greater (349) 0.0* -- (349) 0.3* (0.3) (348) 0.5* (0.4) (349) 0.3* (0.3)

Nashville Community Health + Well-being Survey
41 | P a g e Survey Research Laboratory, University of Illinois at Chicago © 2019 Board of Trustees of the University of Illinois
Table 10: Transportation Barriers to Health Care in Davidson County by Demographic Characteristics (cont.)
Extremely/very difficult to get transportation for any
health care
Lack of transportation money makes
physician/dentist visit difficult
Neglect physician/dentist visit because of distance or
transportation
Neglect getting medication because of distance or
transportation
(n) % (se) (n) % (se) (n) % (se) (n) % (se)
Health Insurance Coverage
Yes (1579) 2.1 (0.6) (1578) 6.8 (1.0) (1574) 6.1 (1.0) (1578) 4.4 (0.9)
No (131) 4.1 (2.9) (131) 21.2 (5.8) (130) 8.3 (3.8) (131) 8.5 (3.9)
Sexual Orientation
Heterosexual (1588) 1.9 (0.5) (1589) 8.1 (1.1) (1585) 5.7 (0.9) (1589) 4.5 (0.8)
Gay-lesbian-bisexual (105) 0.1 (0.1) (105) 9.6 (4.7) (105) 10.0 (5.0) (105) 6.0 (4.1)
Davidson County Zone
East (334) 1.2 (0.7) (335) 7.6 (2.0) (332) 4.9 (1.6) (335) 4.4 (1.4)
Nashville Promise Zone (353) 10.4 (3.0) (353) 21.2 (3.7) (350) 15.3 (3.4) (353) 11.8 (3.0)
North West (246) 0.4 (0.4) (245) 8.2 (4.5) (246) 5.2 (3.5) (245) 4.7 (3.5)
South East (468) 0.3 (0.2) (467) 5.3 (1.4) (468) 5.8 (1.5) (467) 2.7 (1.1)
South West (365) 0.0 -- (365) 3.0* (1.5) (364) 2.6 (1.4) (364) 2.1 (1.3)
DATA SOURCE: Nashville Community Health + Well-being Survey, 2019. *p<.001
Note: Question wordings include the following: Extremely/very difficult to get transportation for any health care: “How difficult is it for you to get transportation to your medical care, including doctor, dentist, or pharmacy?” (extremely difficult, very difficult, somewhat difficult, not very difficult, not at all difficult) Lack of transportation money makes physician/dentist visit difficult: “Does lack of money for transportation expenses, such as parking, cab or bus fair, make it difficult to get to the doctor or dentist?” Neglect physician/dentist visit because of distance or transportation: “Do you put off or neglect going to the doctor or dentist because of distance or transportation?” Neglect getting medication because of distance or transportation: “Do you put off or neglect going to the pharmacy or doctor to pick up your medication because of distance or transportation?”

Nashville Community Health + Well-being Survey
42 | P a g e Survey Research Laboratory, University of Illinois at Chicago © 2019 Board of Trustees of the University of Illinois
Health Behaviors
The Nashville Community Health + Well-being Survey also carefully examined a number of important
personal behaviors that are known to be strongly associated with various health outcomes. These
included personal nutrition, the use of tobacco products, alcohol, prescription pain
relievers/tranquilizers, alcohol and drug use treatment, HIV testing and risk factors, firearm ownership,
and physical exercise.
Personal Nutrition
Respondents were asked to estimate their weekly consumption of fruit, canned beans, and dark green
vegetables. These estimates are provided in Table 11. On average, Davidson County adults reported
consuming fresh, frozen or canned fruit 4.7 times per week. Fruit consumption varied across several
sociodemographic measures, including race/ethnicity. Overall, non-Hispanic whites reported the highest
weekly average fruit consumption (5.3 times per week) and Hispanic/Latinos reported the lowest
average consumption levels (3.5 times per week). Fruit consumption also varied by education and
household income levels. Consumption was greatest among persons with graduate/professional degrees
(6.4 times per week); and it was lowest among those with a high school education or with some college,
but no degree who reported fruit consumption an average of 4.0 and 4.1 times per week, respectively.
Persons in high income households (earning $100,000 or greater) reported consuming fruit 5.5 times per
week, while those in households earning less than $25,000 reported fruit consumption 4.0 times per
week. In addition, fruit consumption was higher among residents in South West Davidson County (6.3
times per week) and lowest in the East zone (3.7 times per week).

Nashville Community Health + Well-being Survey
43 | P a g e Survey Research Laboratory, University of Illinois at Chicago © 2019 Board of Trustees of the University of Illinois
Table 11: Consumption of Healthy Foods in Davidson County by Demographic Characteristics (cont. next page)
Number of times consumed fresh, frozen or canned fruit
during the past week
Number of times consumed cooked or canned beans
during the past week
Number of times consumed dark green vegetables during
the past week
(n) Mean (se) (n) Mean (se) (n) Mean (se)
Total Sample (1784) 4.7 (0.2) (1775) 2.5 (0.1) (1782) 3.7 (0.1)
Gender
Female (1172) 5.0 (0.2) (1167) 2.5 (0.2) (1171) 3.9 (0.2)
Male (612) 4.4 (0.2) (608) 2.5 (0.2) (611) 3.4 (0.2)
Age
18-29 (279) 4.4 (0.3) (277) 2.1 (0.2) (278) 3.6 (0.3)
30-49 (616) 4.8 (0.3) (610) 2.6 (0.3) (611) 4.1 (0.3)
50-64 (414) 4.6 (0.3) (414) 2.6 (0.2) (414) 3.4 (0.2)
65 and older (408) 5.0 (0.3) (408) 2.6 (0.2) (413) 3.2* (0.2)
Race/Ethnicity
African American (402) 3.9 (0.4) (396) 2.2 (0.3) (402) 3.5 (0.3)
Hispanic/Latino (116) 3.5 (0.4) (114) 2.4 (0.3) (113) 2.7 (0.3)
White, non-Hispanic (1112) 5.3 (0.2) (111) 2.7 (0.1) (1115) 4.0 (0.2)
Mixed/other (98) 4.9* (0.4) (95) 2.6 (0.3) (97) 3.3* (0.4)
Education
Less than high school (97) 4.5 (1.0) (93) 3.4 (1.0) (95) 3.4 (1.0)
High school graduate/GED (226) 4.0 (0.3) (227) 2.4 (0.2) (226) 3.0 (0.2)
Some college, no degree (379) 4.1 (0.3) (380) 2.4 (0.2) (381) 3.3 (0.2)
College graduate (596) 5.0 (0.3) (593) 2.2 (0.2) (594) 4.3 (0.2)
Graduate/professional degree (426) 6.4* (0.3) (424) 2.8* (0.2) (428) 4.8* (0.2)
Employment Status
Employed (1091) 4.8 (0.2) (1091) 2.5 (0.2) (1091) 3.9 (0.2)
Unemployed (607) 4.5 (0.2) (602) 2.5 (0.1) (607) 3.2* (0.2)
Annual Household Income
Less than $25,000 (368) 4.0 (0.4) (364) 2.9 (0.4) (363) 3.4 (0.4)
$25,000 to less than $50,000 (420) 4.5 (0.2) (422) 2.1 (0.1) (423) 3.1 (0.2)
$50,000 to less than $75,000 (319) 5.0 (0.4) (318) 2.5 (0.2) (321) 4.1 (0.3)
$75,000 to less than $100,000 (186) 5.1 (0.5) (186) 2.2 (0.2) (186) 3.9 (0.4)
$100,000 and greater (347) 5.5* (0.3) (345) 2.8* (0.1) (346) 4.4* (0.2)

Nashville Community Health + Well-being Survey
44 | P a g e Survey Research Laboratory, University of Illinois at Chicago © 2019 Board of Trustees of the University of Illinois
Table 11: Consumption of Healthy Foods in Davidson County by Demographic Characteristics (cont.)
Number of times consumed fresh, frozen or canned fruit
during the past week
Number of times consumed cooked or canned beans
during the past week
Number of times consumed dark green vegetables during
the past week
(n) Mean (se) (n) Mean (se) (n) mean (se)
Health Insurance Coverage
Yes (1595) 4.8 (0.1) (1588) 2.4 (0.9) (1595) 3.7 (0.1)
No (135) 4.8 (0.8) (135) 3.8* (0.8) (133) 3.5 (0.9)
Sexual Orientation
Heterosexual (1578) 4.8 (0.2) (1576) 2.5 (0.1) (1578) 3.8 (0.2)
Gay-lesbian-bisexual (105) 3.8 (0.3) (105) 2.6 (0.4) (105) 3.3 (0.5)
Davidson County Zone
East (337) 3.7 (0.2) (339) 2.4 (0.2) (338) 3.2 (0.2)
Nashville Promise Zone (359) 4.4 (0.4) (352) 3.0 (0.5) (359) 3.9 (0.4)
North West (246) 4.7 (0.5) (249) 2.4 (0.3) (247) 3.5 (0.3)
South East (475) 4.6 (0.3) (470) 2.2 (0.2) (471) 3.3 (0.2)
South West (367) 6.3* (0.3) (365) 2.8* (0.2) (367) 4.6* (0.3)
DATA SOURCE: Nashville Community Health + Well-being Survey, 2019 *p<.001
Note: Question wordings include the following: Number of times consumed fresh, frozen or canned fruit during the past week – “During the past week, how many times did you eat fruit? Count fresh, frozen or canned.” Number of times consumed cooked or canned beans during the past week – “During the past week, how many times did you eat cooked or canned beans, such as refried, baked, black, garbanzo beans, beans in soup, soybeans, edamame, tofu or lentils?” Number of times consumed dark green vegetables during the past week – “During the past week, how many times did you eat dark green vegetables for example broccoli or dark leafy greens including romaine, chard, collard greens or spinach?”

Nashville Community Health + Well-being Survey
45 | P a g e Survey Research Laboratory, University of Illinois at Chicago © 2019 Board of Trustees of the University of Illinois
Davidson County adult residents reported consumption of cooked or canned beans an average of 2.5
times per week (Table 11). Consumption was greater among the least educated (less than high school)
residents (3.4 times per week) and lowest among persons with a college degree (2.2 times per week). In
terms of household income, those in the lowest and highest income groups reported the most bean
consumption (2.9 and 2.8 times per week among those with household incomes below $25,000 and
$100,000 and above, respectively). Persons lacking health insurance also reported greater average
consumption of cooked or canned beans (3.8 times per week), compared to those with health insurance
(2.4 times per week). Those residing in the Nashville Promise Zone reported a higher average weekly
consumption of beans (3.0 times per week) than did those living elsewhere in the county.
When asked about weekly consumption of dark green vegetables, Davidson County adults reported
consuming them an average of 3.7 times per week (Table 11). Those most likely to consume these
types of vegetables included persons aged 30-49 years (4.1 times per week), non-Hispanic whites (4.0
times), persons with graduate or professional degrees (4.8 times), those currently employed (3.9
times), persons with household incomes exceeding $100,000 per year (4.4 times), and persons living in
the South West zone of Davidson County (4.6 times per week).
Forty-four percent of adult residents in Davidson County indicated they were currently watching or
reducing their intake of sodium or salt (Table 12). African Americans were most likely to report
watching/reducing their salt intake (63.8%), and non-Hispanic whites were least likely (35.3%). Concern
with salt/sodium intake was greater among persons with less education. Of those without a high school
degree, 61.1% reported watching/reducing their salt intake, whereas only 35.6% of those with graduate
or professional training indicated doing so. Unemployed persons were also more likely (55.6%) than
those employed (37.6%) to be currently watching or reducing their salt/sodium intake. Those with less
household income were additionally more likely (56.8%) than those with high income levels (30.7%) to
express concern with their salt consumption.

Nashville Community Health + Well-being Survey
46 | P a g e Survey Research Laboratory, University of Illinois at Chicago © 2019 Board of Trustees of the University of Illinois
Table 12: Other Nutrition Behaviors in Davidson County by Demographic Characteristics (cont. next page)
Currently watching or reducing sodium or salt intake
Extremely/very difficult to get transportation to store that
sells healthy food
Number of times drank regular soda or pop that contains sugar
during the past week
(n) % (se) (n) % (se) (n) Mean (se)
Total Sample (1798) 44.0 (2.1) (1792) 2.5 (0.6) (1779) 1.9 (0.2)
Gender
Female (1184) 44.1 (2.5) (1180) 2.8 (0.8) (1169) 1.8 (0.1)
Male (614) 43.9 (3.4) (612) 2.3 (0.8) (610) 2.0 (0.3)
Age
18-29 (279) 25.5 (4.7) (280) 1.1 (0.7) (279) 2.5 (0.6)
30-49 (616) 37.1 (3.3) (613) 2.0 (0.8) (615) 1.8 (0.2)
50-64 (418) 56.3 (4.1) (417) 2.6 (1.2) (416) 1.9 (0.2)
65 and older (416) 65.5 (3.6) (418) 4.6 (1.7) (407) 1.4* (0.2)
Race/Ethnicity
African American (407) 63.8 (4.3) (406) 2.5 (0.9) (400) 2.0 (0.2)
Hispanic/Latino (115) 43.0 (8.7) (111) 2.1 (1.8) (115) 2.6 (0.7)
White, non-Hispanic (1123) 35.3 (2.3) (1123) 2.3 (0.7) (1115) 1.8 (0.2)
Mixed/other (98) 41.0* (8.2) (98) 5.8 (3.7) (97) 1.1* (0.3)
Education
Less than high school (100) 61.1 (7.3) (97) 9.7 (3.6) (97) 3.0 (0.3)
High school graduate/GED (233) 49.2 (5.5) (231) 4.4 (1.6) (227) 3.1 (0.5)
Some college, no degree (384) 48.3 (4.0) (384) 1.5 (0.9) (379) 1.7 (0.2)
College graduate (596) 32.7 (2.9) (596) 0.6 (0.3) (593) 1.1 (0.1)
Graduate/professional degree (426) 35.6* (3.5) (427) 0.7* (0.5) (427) 1.1* (0.2)
Employment Status
Employed (1095) 37.6 (2.6) (1092) 0.9 (0.5) (1093) 1.9 (0.2)
Unemployed (617) 55.6* (3.2) (618) 4.9 (1.2) (605) 1.9 (0.3)
Annual Household Income
Less than $25,000 (371) 56.8 (4.0) (369) 7.6 (1.9) (363) 2.7 (0.3)
$25,000 to less than $50,000 (426) 50.3 (5.1) (422) 2.1 (1.1) (424) 2.5 (0.6)
$50,000 to less than $75,000 (320) 40.0 (4.3) (321) 0.0 -- (320) 1.5 (0.2)
$75,000 to less than $100,000 (187) 35.6 (5.4) (187) 0.0 -- (186) 0.9 (0.2)
$100,000 and greater (187) 30.7* (3.8) (349) 0.3* (0.3) (348) 1.0* (0.2)

Nashville Community Health + Well-being Survey
47 | P a g e Survey Research Laboratory, University of Illinois at Chicago © 2019 Board of Trustees of the University of Illinois
Table 12: Other Nutrition Behaviors in Davidson County by Demographic Characteristics (cont.)
Currently watching or reducing sodium or salt intake
Extremely/very difficult to get transportation to store that
sells healthy food
Number of times drank regular soda or pop that contains sugar
during the past week
(n) % (se) (n) % (se) (n) mean (se)
Health Insurance Coverage
Yes (1607) 42.9 (2.2) (1604) 2.5 (0.6) (1593) 1.8 (0.2)
No (135) 47.5 (7.7) (134) 2.4 (1.3) (134) 3.3* (0.7)
Sexual Orientation
Heterosexual (1591) 45.1 (2.2) (1591) 2.3 (0.5) (1578) 1.8 (0.2)
Gay-lesbian-bisexual (105) 27.6 (9.0) (105) 0.5* (0.1) (105) 3.2* (0.8)
Davidson County Zone
East (341) 36.8 (4.1) (338) 1.0 (0.6) (334) 2.5 (0.3)
Nashville Promise Zone (361) 47.6 (4.4) (360) 9.2 (2.6) (354) 2.1 (0.2)
North West (250) 65.9 (6.3) (251) 1.3 (0.7) (249) 1.6 (0.2)
South East (478) 43.9 (4.2) (474) 1.3 (0.6) (474) 2.2 (0.5)
South West (368) 39.1 (3.9) (369) 0.5 (0.4) (368) 0.8* (0.1)
DATA SOURCE: Nashville Community Health + Well-being Survey, 2019 *p<.001
Note: Question wordings include the following: Currently watching or reducing sodium or salt intake – “Are you currently watching or reducing your sodium or salt intake?” Extremely/very difficult to get transportation to store that sells healthy food – “How difficult is it for you to get transportation to a store that sells healthy food, such as fresh fruits and vegetables?” (Extremely difficult, very difficult, somewhat difficult, not very difficult, not at all difficult) Number of times drank regular soda or pop that contains sugar during the past week – “During the past week, how many times did you drink regular soda or pop that contains sugar? Do not include diet soda or diet pop.”

Nashville Community Health + Well-being Survey
48 | P a g e Survey Research Laboratory, University of Illinois at Chicago © 2019 Board of Trustees of the University of Illinois
Adults in Davidson County reported consuming regular soda or pop that contains sugar, on average, 1.9
times during the past week. Several population subgroups reported drinking greater amounts of sugar-
containing soft drinks. These included persons aged 18-29 (2.5 times), Hispanic/Latino (2.6 times), those
with no more than a high school education (3.0-3.1 times), those with household incomes below
$50,000 (2.5-2.7 times), those without health insurance coverage (3.3 times), sexual minority groups
(3.2 times), and persons living in the East zone of Davidson County (2.5 times).
When asked how difficult it is to get transportation to a store that sells healthy food, such as fresh fruits
and vegetables, a small proportion of the adults in Davidson County (2.5%) indicated that it was
extremely or very difficult to do so. Low education and low household income were both associated
with increased likelihood of having difficulty getting transportation to stores that sell healthy food.
Specifically, 9.7% of those with less than a high school degree (compared to 0.7% of those with
graduate/professional degrees) and 7.6% of those in households with incomes below $25,000
(compared to 0.3% of those in households with incomes exceeding $100,000) were more likely to report
such difficulties. Persons belonging to sexual minority groups were less likely (0.5%) than heterosexuals
(2.3%) to report high levels of difficulty obtaining transportation for the purchase of healthy food.
Tobacco Use
In Davidson County, 66.5% (se = 2.0) of adults reported lifetime cigarette use (of at least 100 cigarettes;
data not shown in tables). Current (every day) cigarette smokers represented 7.8% of all adults in the
county (Table 13). Current smoking varied by level of education, as 23.6% of persons not completing
high school reported every day cigarette use. The prevalence dropped with increasing education, with
only 1.5% of persons with graduate/professional degrees currently smoking. Current cigarette use also
varied across areas of Davidson County, ranging from 17.3% in the East zone to 2.9% in the South West.
Table 13 additionally provides estimates of persons who currently smoke, but not every day. These
“some days” smokers represent 5.4% of the adults in Davidson County. When combined with “every
day” smokers, it can be estimated that 13.2% of all adults in the County currently smoke every day or
some days.

Nashville Community Health + Well-being Survey
49 | P a g e Survey Research Laboratory, University of Illinois at Chicago © 2019 Board of Trustees of the University of Illinois
Table 13: Current Tobacco Use Behaviors in Davidson County by Demographic Characteristics (cont. next page)
Current (every day) cigarette smoker
Current (some days) cigarette smoker
Current user (every day or some days) of chewing tobacco, snuff
or snus
(n) % (se) (n) % (se)
Total Sample (1791) 7.8 (1.1) (1790) 5.4 (1.4) (1786) 2.3 (0.6)
Gender
Female (1177) 7.3 (1.3) (1177) 2.5 (0.6) (1175) 0.1 (0.1)
Male (614) 8.3 (1.8) (613) 8.6 (2.8) (611) 4.7* (1.3)
Age
18-29 (280) 3.1 (1.3) (280) 9.1 (5.3) (280) 0.8 (0.7)
30-49 (615) 8.2 (2.1) (615) 4.9 (1.4) (616) 3.8 (1.3)
50-64 (417) 13.4 (2.7) (416) 4.5 (1.9) (415) 2.4 (1.8)
65 and older (414) 7.2 (2.3) (414) 3.6 (1.4) (412) 1.5 (1.0)
Race/Ethnicity
African American (405) 7.4 (2.0) (404) 4.4 (1.6) (403) 0.5 (0.5)
Hispanic/Latino (114) 4.3 (4.3) (114) 7.7 (6.5) (113) 3.6 (3.5)
White, non-Hispanic (1121) 8.9 (1.6) (1121) 5.8 (2.1) (1120) 2.9 (0.9)
Mixed/other (98) 4.3 (3.0) (98) 3.9 (2.8) (98) 1.7 (1.7)
Education
Less than high school (98) 23.6 (7.7) (98) 9.0 (3.4) (96) 6.3 (4.6)
High school graduate/GED (231) 11.2 (2.7) (230) 5.4 (4.0) (231) 2.2 (1.6)
Some college, no degree (384) 8.2 (1.9) (384) 7.9 (3.2) (382) 0.7 (0.7)
College graduate (594) 2.3 (0.7) (594) 3.5 (1.1) (596) 3.4 (1.2)
Graduate/professional degree (428) 1.5* (0.7) (428) 2.8 (1.2) (426) 1.5 (0.8)
Employment Status
Employed (1095) 6.8 (1.1) (1095) 6.8 (2.1) (1094) 2.6 (0.8)
Unemployed (614) 9.3 (1.9) (613) 3.3 (0.9) (612) 0.7 (0.6)
Annual Household Income
Less than $25,000 (368) 15.3 (3.0) (368) 4.9 (1.4) (366) 2.4 (1.6)
$25,000 to less than $50,000 (425) 6.2 (2.0) (424) 8.0 (4.8) (423) 1.7 (0.9)
$50,000 to less than $75,000 (321) 8.5 (3.2) (321) 4.1 (2.1) (321) 2.8 (2.1)
$75,000 to less than $100,000 (187) 4.1 (1.9) (187) 6.9 (6.4) (187) 1.5 (1.0)
$100,000 and greater (349) 1.1* (0.6) (349) 4.8 (2.2) (349) 2.9 (1.2)

Nashville Community Health + Well-being Survey
50 | P a g e Survey Research Laboratory, University of Illinois at Chicago © 2019 Board of Trustees of the University of Illinois
Table 13: Current Tobacco Use Behaviors in Davidson County by Demographic Characteristics (cont.)
Current (every day) cigarette smoker
Current (some days) cigarette smoker
Current user (every day or some days) of chewing tobacco, snuff
or snus
(n) % (se) (n) % (se)
Health Insurance Coverage
Yes (1602) 6.7 (1.1) (1601) 5.3 (1.5) (1596) 2.5 (0.7)
No (134) 16.4 (5.1) (134) 7.6 (4.0) (135) 0.4 (0.3)
Sexual Orientation
Heterosexual (1588) 7.7 (1.2) (1587) 5.5 (1.6) (1585) 2.2 (0.6)
Gay-lesbian-bisexual (105) 8.0 (3.5) (105) 7.8 (4.7) (105) 0.0 --
Davidson County Zone
East (338) 17.3 (3.6) (338) 9.0 (3.4) (338) 1.8 (0.9)
Nashville Promise Zone (359) 8.3 (2.6) (358) 5.1 (2.2) (359) 3.7 (2.1)
North West (250) 6.1 (3.2) (250) 3.0 (1.6) (248) 1.8 (1.3)
South East (475) 4.0 (1.2) (475) 4.9 (3.7) (474) 1.6 (1.3)
South West (369) 2.9* (1.1) (369) 3.6 (1.2) (367) 2.7 (1.1)
DATA SOURCE: Nashville Community Health + Well-being Survey, 2019 *p<.001
Note: Question wordings include the following: Current cigarette smoker – “Do you now smoke cigarettes every day, some days, or not at all?” Current user of chewing tobacco, snuff or snus – “Do you currently use chewing tobacco, snuff, or snus every day, some days, or not at all?”

Nashville Community Health + Well-being Survey
51 | P a g e Survey Research Laboratory, University of Illinois at Chicago © 2019 Board of Trustees of the University of Illinois
Current use of chewing tobacco, snuff, or snus (Swedish for snuff, a moist smokeless tobacco that is
usually sold in small pouches that are placed under the lip or against the gum), either every day or some
days, was reported by 2.3% of the adults in Davidson County. Males were more likely to use these
products (4.7%) than were females (0.1%).
Vaping
Electronic cigarettes, also known as e-cigarettes, and other electronic vaping products have increased in
popularity in recent years (Kuehn, 2019). In Davidson County, 25.3% (se = 2.0) of all adults reported
lifetime use, defined as even once, of vaping product (data not shown in tables). The every day
prevalence of current e-cigarette and other vaping product use was 1.9% (Table 14). Although use of
these products was not strongly associated with any sociodemographic measures, we nonetheless note
that young adults aged 18-29 were found to report higher levels (9.5%) of current use, as were those
currently without health insurance (17.0%) and persons considered to be sexual minorities (13.8%).
Most current users of these products do not use them every day. As Table 14 also demonstrates, a
majority of e-cigarette (and related products) users indicate using them some days, rather than on a
daily basis.

Nashville Community Health + Well-being Survey
52 | P a g e Survey Research Laboratory, University of Illinois at Chicago © 2019 Board of Trustees of the University of Illinois
Table 14: Current E-Cigarette or Vaping Use Behaviors in Davidson County by Demographic Characteristics (cont. next page)
Current (every day) user of e-cigarettes or electronic vaping products
Current (some days) user of e-cigarettes or electronic vaping products
(n) % (se)
Total Sample (1792) 1.9 (0.5) (1792) 4.7 (1.3)
Gender
Female (1180) 0.6 (0.4) (1180) 3.9 (1.0)
Male (612) 3.4 (1.0) (612) 5.6 (2.5)
Age
18-29 (279) 4.2 (1.8) (279) 9.5 (4.9)
30-49 (616) 0.8 (0.4) (616) 5.2 (1.5)
50-64 (418) 1.9 (0.8) (418) 1.6 (1.0)
65 and older (416) 1.7 (1.7) (416) 1.7 (1.3)
Race/Ethnicity
African American (406) 2.0 (0.6) (406) 2.5 (1.1)
Hispanic/Latino (115) 2.3 (2.3) (115) 0.7 (0.6)
White, non-Hispanic (1121) 2.0 (0.6) (1121) 6.8 (2.2)
Mixed/other (98) 2.0 (1.9) (98) 2.1 (2.0)
Education
Less than high school (99) 0.0 -- (99) 2.6 (1.5)
High school graduate/GED (232) 0.4 (0.4) (232) 7.5 (4.2)
Some college, no degree (383) 3.8 (1.6) (383) 7.6 (2.5)
College graduate (595) 3.4 (1.4) (595) 1.4 (0.5)
Graduate/professional degree (428) 0.2 (0.2) (428) 1.4 (0.8)
Employment Status
Employed (1094) 2.1 (0.7) (1094) 5.1 (1.9)
Unemployed (617) 1.8 (1.0) (617) 4.3 (1.5)
Annual Household Income
Less than $25,000 (370) 0.7 (0.5) (370) 4.4 (1.5)
$25,000 to less than $50,000 (423) 2.1 (1.1) (423) 11.2 (5.0)
$50,000 to less than $75,000 (321) 4.2 (2.0) (321) 3.9 (2.2)
$75,000 to less than $100,000 (187) 3.4 (2.5) (187) 1.9 (1.1)
$100,000 and greater (349) 0.9 (0.7) (349) 1.2 (0.8)

Nashville Community Health + Well-being Survey
53 | P a g e Survey Research Laboratory, University of Illinois at Chicago © 2019 Board of Trustees of the University of Illinois
Table 14: Current E-Cigarette or Vaping Use Behaviors in Davidson County by Demographic Characteristics (cont.)
Current (every day) user of e-cigarettes or electronic vaping products
Current (some days) user of e-cigarettes or electronic vaping products
(n) % (se)
Health Insurance Coverage
Yes (1601) 2.1 (0.6) (1601) 3.5 (1.3)
No (135) 0.8 (0.6) (135) 17.0 (6.0)
Sexual Orientation
Heterosexual (1590) 2.1 (0.6) (1590) 4.1 (1.4)
Gay-lesbian-bisexual (105) 0.7 (0.5) (105) 13.8 (6.1)
Davidson County Zone
East (338) 2.1 (1.0) (338) 5.0 (1.8)
Nashville Promise Zone (361) 2.3 (1.3) (361) 6.6 (2.6)
North West (250) 3.2 (3.1) (250) 4.0 (3.4)
South East (476) 0.7 (0.4) (476) 5.8 (3.7)
South West (367) 2.5 (1.3) (367) 1.4 (0.8)
DATA SOURCE: Nashville Community Health + Well-being Survey, 2019 *p<.001
Note: Question wording includes the following: Current user of e-cigarettes of electronic vaping products – “Have you ever used an e-cigarettes or other electronic vaping products every day, some days, or not at all?”

Nashville Community Health + Well-being Survey
54 | P a g e Survey Research
Laboratory, University of Illinois at Chicago © 2019 Board of Trustees of the University of Illinois
Tennessee Quitline
The Tennessee Quitline2, is a toll-free telephone service that provides personalized support for
Tennesseans who want to quit smoking or chewing tobacco. In Davidson County, 15.4% of the adults
surveyed indicates awareness of it (Table 15). Persons with household incomes below $25,000 were
most likely to have heard of the Quitline (23.7%), while those with incomes $75,000 to less than
$100,000 had the lowest rate of awareness (5.8%). Among persons aware of the Tennessee Quitline (n =
280), 6.2% reported ever having used it for help with smoking cessation for themselves or for someone
else. Of persons aware of the Tennessee Quitline but having never used it (n = 263), 16.7% reported
having considered using it to assist with smoking cessation for themselves or someone else.
2 https://www.tnquitline.org/

Nashville Community Health + Well-being Survey
55 | P a g e Survey Research Laboratory, University of Illinois at Chicago © 2019 Board of Trustees of the University of Illinois
Table 15: Awareness and Use of Tennessee Quitline in Davidson County by Demographic Characteristics (cont. next page)
Aware of Tennessee Quitline Have used Tennessee Quitline
(among those aware of it)
Have considered using Tennessee Quitline (among those aware but having not
used)
(n) % (se) (n) % (se) (n) % (se)
Total Sample (1769) 15.4 (1.5) (280) 6.2 (2.4) (263) 16.7 (3.8)
Gender
Female (1164) 20.4 (2.2) (204) 6.7 (3.1) (192) 15.1 (4.4)
Male (605) 10.0* (1.6) (76) 5.2 (3.7) (71) 19.9 (7.0)
Age
18-29 (280) 15.0 (3.0) (48) 13.7 (8.3) (45) 9.2 (5.9)
30-49 (616) 14.7 (2.1) (97) 4.3 (2.6) (93) 23.9 (7.4)
50-64 (414) 18.1 (4.1) (65) 1.7 (1.3) (61) 23.6 (8.8)
65 and older (399) 12.1 (2.7) (59) 8.6 (7.4) (53) 5.1 (3.3)
Race/Ethnicity
African American (399) 21.9 (3.8) (79) 0.6 (0.4) (100) 23.4 (7.1)
Hispanic/Latino (112) 8.8 (3.3) (16) 0.0 -- (15) 10.0 (6.5)
White, non-Hispanic (1113) 13.9 (1.6) (165) 10.7 (4.5) (153) 13.8 (5.0)
Mixed/other (96) 12.2 (4.5) (13) 13.0 (12.2) (12) 0.0 --
Education
Less than high school (92) 19.4 (5.4) (18) 0.0 -- (17) 5.2 (5.2)
High school graduate/GED (227) 18.9 (4.1) (50) 3.7 (3.4) (47) 26.6 (8.8)
Some college, no degree (378) 15.4 (2.6) (70) 11.1 (7.4) (65) 18.2 (7.4)
College graduate (594) 9.6 (1.5) (74) 6.7 (4.1) (70) 6.9 (4.2)
Graduate/professional degree (426) 17.3 (2.9) (63) 7.5 (4.3) (59) 13.6 (8.5)
Employment Status
Employed (1089) 14.4 (1.9) (164) 7.4 (3.6) (154) 19.0 (5.3)
Unemployed (601) 17.9 (2.5) (105) 4.8 (3.1) (98) 12.0 (5.3)
Annual Household Income
Less than $25,000 (360) 23.7 (3.4) (87) 11.9 (5.8) (80) 22.1 (7.4)
$25,000 to less than $50,000 (421) 14.9 (3.9) (63) 0.0 -- (62) 11.5 (5.3)
$50,000 to less than $75,000 (319) 14.6 (2.9) (57) 3.6 (2.5) (52) 16.4 (8.6)
$75,000 to less than $100,000 (187) 5.8 (2.1) (14) 0.0 -- (14) 0.0 --
$100,000 and greater (349) 10.6* (2.3) (39) 8.6 (5.3) (36) 12.5 (10.0)

Nashville Community Health + Well-being Survey
56 | P a g e Survey Research Laboratory, University of Illinois at Chicago © 2019 Board of Trustees of the University of Illinois
Table 15: Awareness and use of Tennessee Quitline in Davidson County by Demographic Characteristics (cont.)
Aware of Tennessee Quitline Have used Tennessee Quitline
(among those aware of it)
Have considered using Tennessee Quitline (among those aware but having not
used)
(n) % (se) (n) % (se) (n) % (se)
Health Insurance Coverage
Yes (1587) 15.5 (1.5) (248) 3.9 (0.7) (248) 3.9 (1.7)
No (132) 15.5 (4.8) (23) 26.0 (15.8) (23) 26.0 (15.8)
Sexual Orientation
Heterosexual (1573) 15.9 (1.6) (246) 6.9 (2.7) (229) 17.8 (4.3)
Gay-lesbian-bisexual (105) 10.1 (3.8) (15) 0.0 -- (15) 11.0 (10.1)
Davidson County Zone
East (331) 16.2 (2.9) (60) 0.6 (0.6) (58) 27.2 (8.8)
Nashville Promise Zone (359) 22.0 (3.5) (70) 11.4 (7.3) (66) 16.7 (7.2)
North West (244) 22.5 (8.1) (37) 7.3 (5.9) (32) 2.4 (2.5)
South East (471) 10.8 (2.0) (67) 1.3 (1.0) (65) 11.4 (6.4)
South West (364) 11.9 (2.2) (46) 11.2 (6.1) (42) 14.8 (8.6)
DATA SOURCE: Nashville Community Health + Well-being Survey, 2019 *p<.001
Note: Question wordings include the following: Aware of Tennessee Quitline – “Are you aware of the Tennessee Quitline?” Have used Tennessee Quitline (among those aware of it) – “Have you used the Tennessee Quitline to assist with smoking cessation for yourself or someone else?” Have considered using Tennessee Quitline (among those aware but having not used) – “Have you considered using the Tennessee Quitline to assist with smoking cessation for yourself or someone else?”

Nashville Community Health + Well-being Survey
57 | P a g e Survey Research Laboratory, University of Illinois at Chicago © 2019 Board of Trustees of the University of Illinois
Alcohol Use
Current alcohol use (defined as having consumed alcohol in the past 30 days) in Davidson County was
reported by 63.4% of all adults (Table 16). Persons aged 30-49 were most likely to have drunk alcohol in
the past 30 days (72.9%), with those 65 and older least likely, although a slim majority nonetheless
reported current alcohol use (51.1%). Current use of alcohol was most common among college
graduates (77.3%) and least common among high school grads (43.6%) and those with less than a high
school education (44.3%). Employed persons were more likely than those not working to have
consumed alcohol in the past 30 days (69.8% vs. 49.2%, respectively). Household income was also
associated with current alcohol use. Approximately three-quarters of those in households with incomes
above $75,000 reported past 30 day alcohol use (77.4% within households with incomes between $75-
$100,000 and 74.5% within households with incomes of $100,000 and greater). Slightly less than half of
those residing in households with incomes below $25,000 reported current alcohol use (48.6%). Persons
residing in the South West zone of Davidson County were most likely to indicate current alcohol
consumption (78.2%); current use was lowest (54.9%) in South East Davidson County.

Nashville Community Health + Well-being Survey
58 | P a g e Survey Research Laboratory, University of Illinois at Chicago © 2019 Board of Trustees of the University of Illinois
Table 16: Current Alcohol Use Behaviors in Davidson County by Demographic Characteristics (cont. next page)
Drank alcohol in past 30 days
Average number of alcohol drinks on days drank during past 30 days (among past 30
day drinkers)
Largest number of alcohol drinks on one occasion
during past 30 days (among past 30 day drinkers)
Any binge drinking days during past 30 days (among past 30 day
drinkers)
(n) % (se) (n) Mean (se) (n) Mean (se) (n) % (se)
Total Sample (1767) 63.4 (2.0) (1148) 2.7 (0.3) (1140) 3.9 (0.2) (1143) 41.9 (2.6)
Gender
Female (1159) 58.1 (2.5) (718) 2.0 (0.6) (708) 3.1 (0.1) (714) 34.5 (2.9)
Male (608) 69.2 (3.3) (430) 3.4* (0.1) (432) 4.6* (0.4) (429) 48.7 (4.1)
Age
18-29 (280) 63.4 (5.8) (204) 3.8 (1.3) (204) 5.0 (0.5) (205) 61.6 (6.0)
30-49 (614) 72.9 (2.8) (448) 2.8 (0.3) (447) 4.1 (0.4) (443) 42.9 (3.9)
50-64 (414) 59.0 (4.2) (255) 2.2 (0.2) (254) 3.3 (0.3) (256) 29.8 (4.9)
65 and older (400) 51.1* (3.9) (205) 1.9* (0.1) (202) 2.6* (0.3) (205) 24.4* (4.8)
Race/Ethnicity
African American (400) 62.7 (4.1) (233) 1.9 (0.1) (229) 2.9 (0.3) (234) 33.3 (5.2)
Hispanic/Latino (115) 52.3 (9.1) (64) 1.9 (0.5) (64) 4.6 (0.6) (65) 58.7 (9.2)
White, non-Hispanic (1108) 66.5 (2.3) (767) 2.9 (0.5) (765) 4.3 (0.3) (763) 43.4 (3.2)
Mixed/other (97) 52.3 (8.4) (51) 3.4* (1.8) (51) 3.8* (0.7) (50) 45.0 (10.6)
Education
Less than high school (95) 44.3 (7.6) (34) 2.5 (0.5) (35) 3.3 (0.4) (34) 43.1 (12.6)
High school graduate/GED (226) 43.6 (5.5) (102) 4.5 (1.6) (100) 3.6 (0.7) (104) 54.9 (8.6)
Some college, no degree (377) 70.5 (3.5) (235) 2.5 (0.3) (230) 4.0 (0.6) (232) 63.1 (5.2)
College graduate (594) 77.3 (2.6) (439) 2.2 (0.1) (438) 4.2 (0.2) (435) 54.9 (3.6)
Graduate/professional degree (424) 72.8* (3.4) (307) 2.3* (0.2) (308) 3.6 (0.2) (308) 62.9 (4.0)
Employment Status
Employed (1090) 69.8 (2.5) (786) 2.9 (0.5) (784) 4.2 (0.3) (783) 46.7 (3.3)
Unemployed (602) 49.2* (3.3) (309) 2.0* (0.1) (305) 3.0* (0.2) (309) 29.1* (4.0)
Annual Household Income
Less than $25,000 (362) 48.6 (4.0) (168) 2.4 (0.2) (167) 3.0 (0.2) (170) 41.2 (6.0)
$25,000 to less than $50,000 (420) 62.9 (4.8) (256) 3.8 (1.4) (256) 4.2 (0.6) (257) 43.5 (6.9)
$50,000 to less than $75,000 (320) 68.6 (4.3) (224) 2.3 (0.2) (222) 4.1 (0.4) (222) 43.4 (5.5)
$75,000 to less than $100,000 (184) 77.4 (4.6) (143) 3.2 (0.7) (144) 5.1 (1.1) (141) 48.0 (7.5)
$100,000 and greater (347) 74.5* (4.3) (278) 2.0* (0.1) (275) 3.8* (0.2) (277) 41.9 (4.5)

Nashville Community Health + Well-being Survey
59 | P a g e Survey Research Laboratory, University of Illinois at Chicago © 2019 Board of Trustees of the University of Illinois
Table 16: Current Alcohol Use Behaviors in Davidson County by Demographic Characteristics (cont.)
Drank alcohol in past 30 days
Number of alcohol drinks on average on days drank
during past 30 days (among past 30 day
drinkers)
Largest number of alcohol drinks on one occasion
during past 30 days (among past 30 day drinkers)
Any binge drinking days during past 30 days
(among past 30 day drinkers)
(n) % (se) (n) Mean (se) (n) Mean (se) (n) % (se)
Health Insurance Coverage
Yes (1580) 64.5 (2.1) (1054) 2.8 (0.4) (1011) 3.9 (0.2) (1049) 39.5 (2.7)
No (135) 59.0 (7.9) (75) 2.8 (0.2) (96) 4.4 (0.4) (75) 69.1 (7.6)
Sexual Orientation
Heterosexual (1573) 62.9 (2.1) (1010) 2.7 (0.4) (985) 4.0 (0.2) (1006) 42.3 (2.8)
Gay-lesbian-bisexual (104) 68.6 (9.2) (82) 2.4 (0.3) (97) 3.8 (0.4) (82) 43.9 (8.7)
Davidson County Zone
East (330) 63.9 (4.7) (208) 2.4 (0.2) (209) 4.1 (0.3) (204) 48.4 (5.6)
Nashville Promise Zone (356) 62.0 (4.3) (227) 2.6 (0.2) (222) 4.4 (0.3) (227) 60.8 (5.1)
North West (249) 59.2 (6.9) (157) 1.9 (0.2) (156) 3.0 (0.7) (157) 23.7 (7.4)
South East (470) 54.9 (4.3) (258) 4.2 (1.2) (254) 3.9 (0.7) (257) 34.9 (6.3)
South West (362) 78.2* (3.2) (298) 2.1* (0.1) (299) 3.7 (0.2) (298) 35.9* (3.8)
DATA SOURCE: Nashville Community Health + Well-being Survey, 2019 *p<.001
Note: Question wordings include the following: Drank alcohol in past 30 days – “During the past 30 days, how many days per week or per month did you have at least one drink of any alcoholic beverage such as beer, wine, a malt beverage or liquor?” Number of alcohol drinks on average on days drank (during past 30 days) – “During the past 30 days, on the days when you drank, about how many drinks did you drink on average?” Any binge drinking days (during past 30 days) – [FOR MALES]:“Considering all types of alcoholic beverages, how many times during the past 30 days did you have 5 or more drinks at one time?” / [FOR FEMALES]:“Considering all types of alcoholic beverages, how many times during the past 30 days did you have 4 or more drinks at one time?” Largest number of alcohol drinks on one occasion (during past 30 days) – “During the past 30 days, what is the largest number of drinks you had on any occasion?”

Nashville Community Health + Well-being Survey
60 | P a g e Survey Research Laboratory, University of Illinois at Chicago © 2019 Board of Trustees of the University of Illinois
Among those currently consuming alcohol, an average of 2.7 drinks per day (on days consuming alcohol)
were reported (range=1-30 days). Males consumed more alcohol per drinking day (3.4 drinks vs. 2.0
drinks for females). Younger persons (those aged 18-29 years) also drank more on average (3.8 drinks vs.
1.9 drinks for persons aged 65 and older). Persons of mixed or other races reported on average
consuming 3.4 drinks, and African American and Hispanic/Latino respondents indicated on average
having 1.9 drinks per day. Consumption also varied by education, with high school graduates reporting
the highest average levels of daily alcohol use (4.5 drinks), and all other education groups similar to one
another in consuming between 2.2-2.5 drinks of alcohol per day. Employed persons drank more than
those unemployed (2.9 drinks vs. 2.0 drinks, respectively). Persons earning between $25-$50,000
reported more alcohol consumption (3.8 drinks) compared to those in other households. Persons
residing in South East Davidson County consumed an average of 4.2 drinks on the days when they did
drink. The lowest average number of drinks was reported by residents in the North West zone of
Davidson County.
Respondents who were current drinkers were also asked to estimate the largest number of alcohol
drinks they had consumed on one occasion during the past 30 days. Overall, they estimated 3.9 drinks
on a single occasion (range=1-30 days). Similar to the pattern found regarding average number of drinks
on one occasion, the largest number of drinks reported was found to be associated in a similar manner
with several sociodemographic measures. Specifically, males, persons aged 18-29, and those currently
employed reported the largest average number of drinks consumed on one occasion (4.6, 5.0, and 4.2
drinks, respectively). Among race/ethnic groups, Hispanic/Latino respondents reported the
largest number (4.6 drinks) and African Americans the lowest number (2.9 drinks).
Binge drinking was also examined. This behavior is commonly defined as consumption of four or more
drinks by females and five or more drinks by makes on a single occasion (Kanny et al., 2018). Using these
criteria, 41.9% of adults in Davidson County (who drank in the previous 30 days) indicated having had at
least one binge drinking episode during the past 30 days. Younger persons were more likely to report
recent binge drinking (61.6%) in comparison to older persons. Among those aged 65 and older, 24.4%
indicated at least one recent binge drinking episode. Currently employed persons were more likely to
report a recent binge drinking episode (46.7%) than were those not employed (29.1%). Binge drinking
was reported among a majority of those residents of the Nashville Promise Zone (60.8%) and less
frequently among persons living elsewhere in the county. It was least common among residents of the
North West zone of Davidson County (23.7%).
Non-Medical Use of Prescription Drugs
The use of prescription drugs for non-medical purposes is examined in Table 17. Specifically,
respondents were asked “In the last 12 months, have you taken any prescription pain relievers or
tranquilizers (including Codeine, morphine, Lortab, Vicodin, Tylenol #3, Percocet, OxyContin) when it was
not prescribed to you by a doctor, dentist, nurse practitioner, or other healthcare provider? We only want
to know about prescription medication not medication that is available over the counter.” Overall, 5.6%
of adults in Davidson County reported they had used one or more of these prescription drugs for non-
medical purposes during the past 12 months. Use of these medications was strongly associated with
education, as 11.8% and 10.7% of persons with less than a high school degree and those completing

Nashville Community Health + Well-being Survey
61 | P a g e Survey Research Laboratory, University of Illinois at Chicago © 2019 Board of Trustees of the University of Illinois
high school, respectively, had used prescription drugs for non-medical purposes. In contrast, less than
one percent (0.6%) of persons with a graduate or professional degree reported such use. Non-medical
use of these medications was also more common in the Nashville Promise Zone (9.6%) and in East
Davidson County (8.5%), with less use reported elsewhere (0.1% reported non-medical prescription drug
use in South West Davidson County).

Nashville Community Health + Well-being Survey
62 | P a g e Survey Research Laboratory, University of Illinois at Chicago © 2019 Board of Trustees of the University of Illinois
Table 17: Non-Medical Prescription Drug Use and Substance Use Treatment in Davidson County by Demographic Characteristics (cont. next page)
Past 12 month non-medical use of prescription pain relievers or
tranquilizers
Past 12 month family member receipt of treatment/counseling
for alcohol or any drug
Past 12 month unmet need for treatment/counseling for alcohol or drug use
(n) % (se) (n) % (se) (n) % (se)
Total Sample (1780) 5.6 (1.0) (1779) 2.5 (0.5) (1777) 4.0 (1.0)
Gender
Female (1171) 6.3 (1.4) (1172) 3.0 (0.8) (1170) 4.8 (1.0)
Male (609) 4.8 (1.4) (607) 1.8 (0.7) (607) 3.1 (1.7)
Age
18-29 (280) 2.1 (1.4) (280) 4.1 (1.8) (279) 7.5 (3.8)
30-49 (617) 6.1 (1.8) (617) 2.4 (0.8) (615) 2.5 (0.8)
50-64 (414) 9.1 (2.7) (415) 2.0 (0.9) (416) 3.8 (1.2)
65 and older (413) 5.0 (1.7) (413) 1.3 (0.6) (413) 3.4 (1.3)
Race/Ethnicity
African American (406) 7.9 (2.1) (407) 0.5 (0.2) (405) 3.0 (1.0)
Hispanic/Latino (115) 8.0 (3.7) (116) 2.5 (1.8) (115) 12.2 (7.9)
White, non-Hispanic (1117) 4.2 (1.3) (1117) 3.5 (0.9) (1117) 3.4 (0.8)
Mixed/other (97) 4.9 (3.4) (97) 2.5 (1.8) (97) 0.7 (0.5)
Education
Less than high school (96) 11.8 (5.3) (99) 1.4 (1.4) (98) 3.4 (2.4)
High school graduate/GED (232) 10.7 (2.8) (232) 1.7 (1.0) (232) 6.2 (3.2)
Some college, no degree (382) 4.7 (1.7) (381) 3.3 (1.3) (382) 4.1 (1.4)
College graduate (597) 2.2 (1.1) (596) 2.1 (0.8) (595) 2.3 (0.8)
Graduate/professional degree (425) 0.6* (0.3) (426) 3.5 (1.4) (424) 3.3 (1.1)
Employment Status
Employed (1094) 4.4 (1.1) (1095) 3.2 (0.8) (1093) 2.8 (0.7)
Unemployed (612) 8.2 (2.1) (614) 1.3 (0.6) (612) 6.7 (2.7)
Annual Household Income
Less than $25,000 (368) 12.4 (2.9) (370) 4.2 (1.6) (367) 5.5 (1.8)
$25,000 to less than $50,000 (424) 4.5 (2.1) (425) 1.9 (0.8) (424) 5.8 (3.3)
$50,000 to less than $75,000 (320) 3.4 (1.6) (321) 1.6 (0.8) (320) 3.8 (1.4)
$75,000 to less than $100,000 (187) 5.6 (2.7) (187) 1.2 (0.8) (187) 2.2 (1.1)
$100,000 and greater (348) 1.1 (0.7) (346) 3.2 (1.3) (346) 1.9 (0.8)

Nashville Community Health + Well-being Survey
63 | P a g e Survey Research Laboratory, University of Illinois at Chicago © 2019 Board of Trustees of the University of Illinois
Table 17: Non-Medical Prescription Drug Use and Substance Use Treatment in Davidson County by Demographic Characteristics (cont.)
Past 12 month non-medical use of prescription pain relievers or
tranquilizers
Past 12 month family member receipt of treatment/counseling
for alcohol or any drug
Past 12 month unmet need for treatment/counseling for alcohol or drug use
(n) % (se) (n) % (se) (n) % (se)
Health Insurance Coverage
Yes (1592) 3.8 (0.8) (1590) 2.1 (0.5) (1587) 2.6 (0.5)
No (135) 18.3 (6.1) (134) 5.9 (3.3) (134) 17.0 (8.0)
Sexual Orientation
Heterosexual (1586) 5.5 (1.0) (1588) 2.7 (0.6) (1586) 3.5 (0.7)
Gay-lesbian-bisexual (105) 9.2 (5.1) (105) 1.4 (1.3) (104) 12.4 (9.4)
Davidson County Zone
East (336) 8.5 (2.8) (336) 1.6 (0.8) (335) 1.5 (0.6)
Nashville Promise Zone (357) 9.6 (9.6) (359) 4.1 (2.0) (355) 7.1 (2.3)
North West (249) 4.1 (4.1) (249) 1.1 (0.6) (250) 1.6 (0.9)
South East (473) 5.1 (5.1) (472) 1.9 (0.8) (474) 4.2 (4.2)
South West (365) 0.1* (0.1) (363) 3.4 (1.1) (363) 4.7 (4.7)
DATA SOURCE: Nashville Community Health + Well-being Survey, 2019 *p<.001
Note: Question wordings include the following: Past 12 month non-medical use of prescription pain relievers or tranquilizers – “In the last 12 months, have you taken any prescription pain relievers or tranquilizers (including Codeine, morphine, Lortab, Vicodin, Tylenol #3, Percocet, OxyContin) when it was not prescribed by a doctor, dentist, nurse practitioner, or other healthcare provider? We only want to know about prescription medication not medication that is available over the counter.” Past 12 month family member receipt of treatment/counseling for alcohol or any drug – “During the past 12 months, have you or a member of your immediate family (parent, child, spouse, sibling) received treatment or counseling for use of alcohol or any drug, not counting cigarettes?” Past 12 month need for treatment/counseling for alcohol or drug use – “During the past 12 months, did you or your family member need treatment or counseling for alcohol or drug use that was not received?”

Nashville Community Health + Well-being Survey
64 | P a g e Survey Research Laboratory, University of Illinois at Chicago © 2019 Board of Trustees of the University of Illinois
Persons reporting non-medical use of prescription pain medications indicated obtaining them from a
variety of sources, including friends or relatives (25.8%, se = 7.4), other acquaintances (1.3%, se = 0.9),
street dealers (0.8%, se = 0.8), and from other–undefined–sources (56.1%, se = 7.9; data not included in
tables). No one reported obtaining prescription pain medications online. Approximately eleven percent
indicated having “traveled either locally or out of state, to more than one health care provider for the
primary reason of obtaining prescription pain medications or tranquilizers such as Codeine, morphine,
Lortab, Vicodin, Tylenol #3, Percocet, or OxyContin” within the previous 12 months (10.8%, se = 6.4).
Substance Use Treatment
Receipt of substance use treatment was assessed using a question that asked “During the past 12
months, have you or a member of your immediate family (parent, child, spouse, sibling) received
treatment or counseling for use of alcohol or any drug, not counting cigarettes?” In Davidson County,
2.5% of respondents indicated they or an immediate family member had received some form of
treatment. This estimate did not vary across any of the sociodemographics examined in Table 17. Of
those reporting receipt of treatment, 30.9% (se = 9.4) indicated it was for alcohol use only; 55.8% (se =
1.5%) received treatment for drug use only; and 13.3% (se = 6.0) received treatment for both alcohol
and drug use (data not included in tables). About a third had received treatment in a residential
rehabilitation facility where they stayed overnight (35.5%, se = 10.2), and 38.7% (se = 10.8) had received
treatment in a drug or alcohol rehabilitation facility as an outpatient.
Respondents were also asked if, during the past 12 months, they or a family member had needed
treatment or counseling for alcohol or drug use that was not received. Four percent of all adults
reported a past year unmet treatment need. This estimate also did not vary across any
sociodemographics. A variety of reasons were expressed for not receiving needed treatment. The most
common reasons were that the person in need of treatment was not ready to stop using (63.1%, se =
11.0; data not included in tables), did not have health care coverage and could not afford the cost
(33.8%, se = 10.5), and concern that getting treatment or counseling might cause neighbors or the
community to have a negative opinion (25.7%, se = 15.9). All reasons for not receiving treatment,
beginning with the most common reason, include the following:
Not ready to stop using [alcohol, drug use, or both] (63.1%, se = 11.0)
No health care coverage, and couldn’t afford the cost (33.8%, se = 10.5)
Concerned that getting treatment or counseling might cause neighbors or community to have a
negative opinion (25.7%, se = 15.90
No transportation to a program, or the programs were too far away, or the hours were not
convenient (19.4%, se = 8.6)
No openings in the programs (12.9%. se = 7.9)
Did not know where to go to get treatment (12.2%, se = 5.1)
Didn’t find a program that offered the type of treatment or counseling wanted (7.9%. se = 4.3)
Had health care coverage, but it didn’t cover treatment for [alcohol, drug use, or both], or didn’t
cover the full cost (2.7%, se = 2.3)

Nashville Community Health + Well-being Survey
65 | P a g e Survey Research Laboratory, University of Illinois at Chicago © 2019 Board of Trustees of the University of Illinois
HIV Risk
Risk for HIV and HIV testing are examined in Table 18. Many HIV risk behaviors are considered to be
stigmatizing by the general public, and concerns that survey respondents might not be candid in
reporting these behaviors are thus not uncommon (Tourangeau, Rips and Rasinski, 2000). To address
this concern, a general question regarding these behaviors was asked, rather than specific questions
that might have been more difficult for respondents to answer honestly. The general question asked “Do
any of these situations apply to you?” followed by a list of four statements: “You have used intravenous
drugs in the past year. You have been treated for a sexually transmitted or venereal disease in the past
year. You have given or received money or drugs in exchange for sex in the past year. You had anal sex
without a condom in the past year.” In Davidson County, 5.8% of adults reported having one or more of
these risk factors. Persons aged 30-49 were most likely to indicate having one of these risks during the
past 12 months (9.1%) and, perhaps not surprisingly, those aged 65 and older were least likely (0.4%).
Sexual minority respondents were at greater risk, as 30.1% indicated at least one of these behaviors,
compared to 3.5% of heterosexual respondents.

Nashville Community Health + Well-being Survey
66 | P a g e Survey Research Laboratory, University of Illinois at Chicago © 2019 Board of Trustees of the University of Illinois
Table 18: HIV Testing and Risks in Davidson County by Demographic Characteristics (cont. next page)
Ever tested for HIV Reports any past year HIV risk
factors
(n) % (se) (n) % (se)
Total Sample (1773) 40.7 (2.1) (1774) 5.8 (1.0)
Gender
Female (1169) 45.5 (2.5) (1165) 5.1 (1.2)
Male (604) 35.3 (3.2) (609) 6.6 (1.6)
Age
18-29 (280) 28.7 (5.4) (279) 6.8 (2.2)
30-49 (615) 50.7 (3.3) (614) 9.1 (2.1)
50-64 (413) 46.2 (4.4) (417) 4.1 (1.7)
65 and older (411) 19.4* (3.2) (413) 0.4* (0.2)
Race/Ethnicity
African American (404) 55.2 (4.4) (402) 7.4 (2.0)
Hispanic/Latino (116) 37.3 (8.1) (113) 9.6 (4.8)
White, non-Hispanic (1113) 36.4 (2.3) (1120) 5.0 (1.2)
Mixed/other (97) 23.4* (6.1) (98) 0.9 (0.9)
Education
Less than high school (99) 34.0 (6.5) (98) 4.8 (4.2)
High school graduate/GED (227) 33.8 (5.1) (228) 5.0 (2.0)
Some college, no degree (381) 49.6 (4.1) (382) 7.9 (2.4)
College graduate (595) 38.5 (3.0) (596) 5.6 (1.3)
Graduate/professional degree (425) 45.1 (3.6) (428) 4.7 (1.6)
Employment Status
Employed (1090) 44.0 (2.7) (1093) 6.6 (1.3)
Unemployed (611) 35.5 (3.1) (612) 3.7 (1.4)
Annual Household Income
Less than $25,000 (366) 45.9 (4.1) (366) 9.6 (2.8)
$25,000 to less than $50,000 (422) 36.6 (4.7) (423) 5.9 (1.9)
$50,000 to less than $75,000 (320) 38.6 (4.6) (320) 5.4 (2.2)
$75,000 to less than $100,000 (187) 46.5 (6.2) (187) 2.8 (1.4)
$100,000 and greater (346) 44.5 (4.3) (348) 4.5 (1.6)

Nashville Community Health + Well-being Survey
67 | P a g e Survey Research Laboratory, University of Illinois at Chicago © 2019 Board of Trustees of the University of Illinois
Table 18: HIV Testing and Risks in Davidson County by Demographic Characteristics (cont.)
Ever tested for HIV Reports any past year HIV risk
factors
(n) % (se) (n) % (se)
Health Insurance Coverage
Yes (1589) 39.5 (2.1) (1591) 4.9 (0.9)
No (133) 52.2 (7.8) (130) 15.7 (6.1)
Sexual Orientation
Heterosexual (1584) 38.9 (2.2) (1586) 3.5 (0.7)
Gay-lesbian-bisexual (104) 62.7 (7.8) (105) 30.1* (7.6)
Davidson County Zone
East (335) 42.3 (4.5) (336) 5.2 (1.8)
Nashville Promise Zone (357) 55.9 (4.4) (355) 11.9 (3.4)
North West (248) 38.7 (7.6) (248) 6.0 (6.0)
South East (470) 36.6 (4.7) (471) 3.7 (3.7)
South West (363) 31.6* (3.2) (364) 3.8 (1.5)
DATA SOURCE: Nashville Community Health + Well-being Survey, 2019 *p<.001
Note: Question wordings include the following: Ever tested for HIV – “Have you ever been tested for HIV? Do not count tests you may have had as part of a blood donation. Include testing fluid from your mouth.” Reports any HIV risk factors – “Do any of these situations apply to you?
You have used intravenous drugs in the past year.
You have been treated for a sexually transmitted or venereal disease in the past year.
You have given or received money or drugs in exchange for sex in the past year.
You had anal sex without a condom in the past year.”

Nashville Community Health + Well-being Survey
68 | P a g e Survey Research Laboratory, University of Illinois at Chicago © 2019 Board of Trustees of the University of Illinois
When asked if they had ever been tested for HIV, not including tests done as part of a blood donation,
but including testing mouth fluid, 40.7% of all adults indicated they had ever been tested. Persons aged
30-49 were most likely to have been tested (50.7%), and those 65 and older least likely (19.4%). African
Americans were also more likely to have been tested (55.2%), and those of mixed or other race groups
least likely (23.4%). Those residing in the Nashville Promise Zone were more likely to have ever been
tested for HIV (55.9%), and those in South West Davidson County were least likely to have been tested
(31.6%).
Firearms
A set of questions were also included to learn about firearm ownership and safety. These questions
were preceded by a statement designed to introduce the topic, which reads: “The next questions are
about safety and firearms. Some people keep guns for recreational purposes such as hunting or sport
shooting. People also keep guns in the home for protection. Please include firearms such as pistols,
revolvers, shotguns, and rifles; but do not include BB guns or guns that cannot fire. Include those also
kept in a garage or outdoor storage area.” Respondents were first asked if they currently kept any
firearms in or around their home. Across Davidson County, 30.5% reported current firearms in or around
their homes (Table 19). Males were more likely (38.5%) than females (23.3%) to indicate that they now
had firearms. Non-Hispanic white respondents were also more likely (38.4%) than persons of other
race/ethnicities to have firearms. Firearm ownership was also most common among persons in the
highest household income group of $100,000 and greater (42.0%), and least common among those with
household incomes of less than $25,000 (11.4%). The distribution of home firearms also varied
considerably across Davidson County. They were most commonly reported in the North West zone of
the county (50.8%) and least common in the Nashville Promise Zone (15.7%).

Nashville Community Health + Well-being Survey
69 | P a g e Survey Research Laboratory, University of Illinois at Chicago © 2019 Board of Trustees of the University of Illinois
Table 19: Firearm Ownership in Davidson County by Demographic Characteristics (cont. next page)
Firearms now kept in or around home
Firearms now kept in car, van, or truck usually drive
Firearms kept in or around home OR in car, van, or
truck usually drive
Firearms are loaded and unlocked
(n) % (se) (n) % (se) (n) % (se) (n) % (se)
Total Sample (1750) 30.5 (2.1) (1754) 5.0 (0.9) (1744) 30.9 (2.12) (1736) 6.0 (1.0)
Gender
Female (1151) 23.3 (2.2) (1153) 3.0 (0.9) (1145) 24.0 (2.3) (1142) 3.7 (0.9)
Male (599) 38.5* (3.5) (601) 7.1 (1.6) (599) 38.5* (3.5) (594) 8.5 (1.8)
Age
18-29 (279) 27.3 (5.8) (279) 5.3 (2.2) (279) 27.3 (5.8) (279) 5.4 (2.3)
30-49 (605) 27.5 (2.9) (605) 4.3 (1.2) (603) 27.7 (3.0) (602) 5.9 (1.7)
50-64 (414) 35.0 (4.4) (414) 4.4 (1.6) (413) 36.1 (4.4) (411) 5.1 (1.5)
65 and older (405) 36.5 (3.7) (410) 6.0 (2.2) (405) 36.5 (3.7) (399) 8.6 (2.0)
Race/Ethnicity
African American (398) 23.0 (4.4) (399) 3.9 (1.4) (395) 24.1 (4.4) (394) 2.8 (1.1)
Hispanic/Latino (114) 16.1 (7.0) (113) 3.8 (2.8) (113) 16.4 (7.1) (113) 3.8 (2.8)
White, non-Hispanic (1104) 38.4 (2.6) (1107) 6.3 (1.3) (1102) 38.6 (2.6) (1095) 8.4 (1.5)
Mixed/other (97) 17.0* (5.9) (97) 0.3 (0.2) (97) 17.0* (5.9) (97) 2.3 (2.1)
Education
Less than high school (94) 17.6 (6.7) (96) 0.0 -- (93) 18.0 (6.8) (94) 2.9 (1.9)
High school graduate/GED (230) 28.1 (6.2) (227) 4.7 (1.8) (227) 28.4 (5.3) (226) 4.6 (1.6)
Some college, no degree (378) 34.0 (3.6) (381) 6.6 (2.2) (378) 34.9 (4.3) (376) 7.9 (2.5)
College graduate (585) 35.5 (3.1) (587) 6.1 (1.8) (585) 35.5 (3.1) (580) 7.9 (2.0)
Graduate/professional degree (424) 28.5 (3.2) (424) 3.7* (1.3) (423) 28.6 (3.2) (423) 4.3 (1.4)
Employment Status
Employed (1082) 33.2 (2.8) (1081) 5.4 (1.2) (1079) 33.7 (2.8) (1078) 6.1 (1.3)
Unemployed (602) 26.7 (2.8) (607) 4.4 (1.5) (600) 27.0 (2.8) (594) 6.1 (1.4)
Annual Household Income
Less than $25,000 (366) 11.4 (2.6) (365) 2.8 (1.5) (364) 12.4 (2.7) (364) 2.1 (1.2)
$25,000 to less than $50,000 (420) 34.4 (5.5) (420) 6.6 (2.4) (420) 34.4 (5.5) (417) 7.0 (2.3)
$50,000 to less than $75,000 (318) 39.4 (4.8) (318) 4.8 (1.7) (317) 39.5 (4.8) (313) 6.2 (1.8)
$75,000 to less than $100,000 (185) 37.3 (6.6) (186) 9.0 (3.3) (185) 37.3 (6.6) (185) 10.7 (4.7)
$100,000 and greater (344) 42.0* (4.0) (344) 4.2 (1.7) (343) 42.1* (4.0) (343) 8.4 (2.4)

Nashville Community Health + Well-being Survey
70 | P a g e Survey Research Laboratory, University of Illinois at Chicago © 2019 Board of Trustees of the University of Illinois
Table 19: Firearm Ownership in Davidson County by Demographic Characteristics (cont.)
Firearms now kept in or around home
Firearms now kept in car, van, or truck usually drive
Firearms kept in or around home OR in car, van, or truck
usually drive
Firearms are loaded and unlocked
(n) % (se) (n) % (se) (n) % (se) (n) % (se)
Health Insurance Coverage
Yes (1569) 31.3 (2.2) (1573) 4.6 (0.9) (1565) 31.7 (2.2) (1557) 5.6 (0.9)
No (130) 22.3 (6.3) (131) 7.2 (4.3) (130) 22.3 (6.3) (130) 10.9 (4.7)
Sexual Orientation
Heterosexual (1569) 33.2 (2.2) (1570) 5.7 (1.0) (1565) 33.6 (2.2) (1556) 6.4 (1.1)
Gay-lesbian-bisexual (105) 15.1 (4.8) (105) 0.0* -- (105) 15.1 (4.8) (105) 3.2 (2.5)
Davidson County Zone
East (333) 37.5 (4.6) (333) 6.1 (2.1) (332) 38.8 (4.6) (330) 6.3 (2.0)
Nashville Promise Zone (350) 15.7 (3.0) (350) 3.3 (1.5) (348) 15.8 (3.1) (349) 5.6 (2.2)
North West (238) 50.8 (7.4) (242) 15.4 (5.3) (237) 51.1 (7.4) (235) 9.1 (4.1)
South East (469) 30.1 (4.4) (469) 2.9 (1.1) (467) 30.2 (4.5) (466) 6.1 (1.9)
South West (360) 27.7* (3.1) (360) 3.2 (1.4) (360) 27.7* (3.1) (356) 4.5 (1.3)
DATA SOURCE: Nashville Community Health + Well-being Survey, 2019 *p<.001
Note: Question wordings include the following: Firearms now kept in or around home – The next questions are about safety and firearms. Some people keep guns for recreational purposes such as hunting or sport shooting. People also keep guns in the home for protection. Please include firearms such as pistols, revolvers, shotguns, and rifles; but do not include BB guns or guns that cannot fire. Include those also kept in a garage or outdoor storage area. Are any firearms now kept in or around your home?” Firearms now kept in car, can, or truck usually drive – “Are any firearms now kept in the car, van, or truck that you usually drive?” Firearms kept in or around home OR in car, van, or truck usually drive – RESPONDED ‘YES’ TO EITHER: “Are any firearms now kept in or around your home?” OR Are any firearms now kept in or around your home?” Firearms are loaded and unlocked – RESPONDED ‘YES’ TO EITHER: “Are any of these firearms now loaded?” AND “Are any of these loaded firearms also unlocked?”

Nashville Community Health + Well-being Survey
71 | P a g e Survey Research Laboratory, University of Illinois at Chicago © 2019 Board of Trustees of the University of Illinois
Firearms now kept in motor vehicles, including cars, vans, or trucks, were reported by 5.0% of all adults.
This was most common among persons with some college education (6.6%), and least common among
those with less than a high school education (0.0%). Heterosexuals (5.7%), but not sexual minorities,
indicated keeping firearms in their motor vehicles. Overall, 30.9% of adults reported having firearms in
their home or motor vehicle. Patterns were similar to what was observed for firearms currently kept in
or around the home, with males, non-Hispanic whites, those with higher incomes, and those residing in
North West Davidson County most likely to report having firearms in either their homes or motor
vehicles.
Additional questions asked those with firearms if they were now loaded. A total of 40.2% (se = 4.0)
indicated their firearms were loaded (data not included in tables). Of these, 48.7% (se = 6.1) reported
the loaded firearms to be unlocked. Overall, 6.0% of the adults in Davidson County reported having
loaded/unlocked firearms in their homes or vehicles (Table 19). This estimate did not vary across any
of the sociodemographic measures examined. When asked “Do you feel safer or less safe when there
are firearms in your home or vehicle (car, van or truck)?”, most with firearms reported feeling safer
(63.5%, se = 4.4), 1.8% (se = 0.9) reported feeling less safe, and 34.7% (se = 4.4) reported feeling
neither (data not included in tables). Persons not owning firearms were not asked about safety
perceptions.
Physical Activity
Several aspects of physical activity were also evaluated. Respondents were asked if they ever wear a
fitness device, such as a Fitbit, Nike Sports watch, Apple Watch, etc., to measure their level of physical
activity. As indicated in Table 20, 18.5% of the adults in Davidson County reported wearing a fitness
device on a nearly daily basis. Three-quarters of the adults surveyed (75.3%, se = 1.7) reported not ever
wearing a fitness device, 3.9% (se = 1.0) indicated wearing one 2-3 days per week, and 2.3% (se = 0.4)
wear one only when exercising (data not included in tables). Young adults were most likely to report
daily use of a fitness device (22.3%), and persons 65 and older were least likely (8.2%). Persons with
graduate or professional degrees were also most likely to use a fitness device (34.1%), and persons with
less than a high school degree were least likely (1.0%). In addition, employed persons were twice as
likely as the unemployed to use such a device (22.7% vs. 11.0%, respectively), and persons in the highest
household income category ($100,000 and greater) were most likely (28.8%) and persons in the lowest
income category were least likely (5.6%) to report use of a fitness device. Persons who currently had
health insurance were also more likely (20.4%) than those without insurance (4.4%) to report daily use.

Nashville Community Health + Well-being Survey
72 | P a g e Survey Research Laboratory, University of Illinois at Chicago © 2019 Board of Trustees of the University of Illinois
Table 20: Physical Exercise in Davidson County by Demographic Characteristics (cont. next page)
Wear fitness device daily Non-job physical activity
during past month Number days physically exercise in typical week
Number of minutes typically exercise per day
(n) % (se) (n) % (se) (n) Mean (se) (n) Mean (se)
Total Sample (1765) 18.5 (1.4) (1774) 67.9 (2.0) (1738) 2.7 (0.1) (1685) 46.6 (2.4)
Gender
Female (1158) 19.9 (1.7) (1166) 63.8 (2.4) (1141) 2.7 (0.1) (875) 45.8 (3.6)
Male (607) 16.9 (2.4) (608) 72.5 (3.4) (597) 2.8 (0.1) (820) 47.5 (3.1)
Age
18-29 (279) 22.3 (4.1) (280) 79.2 (5.6) (404) 2.8 (0.2) (272) 60.6 (8.3)
30-49 (612) 20.7 (2.2) (615) 72.2 (3.0) (648) 2.8 (0.2) (601) 46.5 (2.6)
50-64 (416) 19.7 (3.0) (418) 66.8 (4.0) (369) 2.7 (0.2) (394) 44.0 (4.3)
65 and older (410) 8.2* (2.3) (412) 60.6 (3.7) (299) 2.6 (0.2) (379) 33.0* (2.7)
Race/Ethnicity
African American (400) 13.9 (3.1) (404) 62.3 (4.0) (389) 2.3 (0.2) (369) 46.9 (5.2)
Hispanic/Latino (114) 9.0 (2.8) (115) 53.4 (8.9) (115) 2.6 (0.3) (110) 52.3 (14.0)
White, non-Hispanic (1114) 22.2 (1.8) (1119) 73.0 (2.5) (1101) 3.0 (0.1) (1078) 46.1 (2.3)
Mixed/other (98) 19.2 (7.0) (98) 67.7 (8.2) (96) 2.9* (0.3) (92) 44.2 (7.7)
Education
Less than high school (96) 1.0 (0.7) (98) 43.0 (7.3) (87) 2.6 (0.3) (82) 37.3 (7.0)
High school graduate/GED (227) 9.1 (2.7) (230) 47.5 (5.6) (223) 2.0 (0.2) (212) 41.1 (7.4)
Some college, no degree (380) 16.0 (3.1) (383) 72.2 (3.4) (380) 2.8 (0.2) (365) 50.5 (4.2)
College graduate (594) 26.8 (2.7) (595) 82.2 (2.3) (589) 3.1 (0.1) (577) 49.4 (2.1)
Graduate/professional degree (428) 34.1* (3.4) (428) 86.6 (2.5) (423) 3.3* (0.2) (414) 49.8 (3.0)
Employment Status
Employed (1090) 22.7 (2.0) (1096) 74.8 (2.5) (1079) 2.8 (0.1) (1055) 50.4 (3.2)
Unemployed (608) 11.0* (2.0) (611) 56.0* (3.3) (597) 2.5 (0.1) (571) 39.0* (3.1)
Annual Household Income
Less than $25,000 (365) 5.6 (2.0) (368) 48.2 (4.2) (358) 2.3 (0.2) (336) 46.8 (7.4)
$25,000 to less than $50,000 (416) 16.7 (3.1) (424) 60.7 (5.3) (412) 2.3 (0.2) (401) 39.6 (4.1)
$50,000 to less than $75,000 (320) 24.2 (4.1) (320) 75.3 (3.9) (319) 2.8 (0.2) (310) 48.4 (4.3)
$75,000 to less than $100,000 (187) 30.1 (4.8) (187) 84.9 (3.9) (183) 3.0 (0.2) (184) 45.8 (4.0)
$100,000 and greater (349) 28.8* (3.4) (349) 88.5* (2.5) (347) 3.5* (0.1) (340) 51.5 (2.9)

Nashville Community Health + Well-being Survey
73 | P a g e Survey Research Laboratory, University of Illinois at Chicago © 2019 Board of Trustees of the University of Illinois
Table 20: Physical Exercise in Davidson County by Demographic Characteristics (cont.)
Wear fitness device daily Non-job physical activity
during past month Number days physically exercise in typical week
Number of minutes typically exercise per day
(n) % (se) (n) % (se) (n) Mean (se) (n) Mean (se)
Health Insurance Coverage
Yes (1581) 20.4 (1.6) (1590) 70.4 (2.1) (1562) 2.8 (0.1) (1521) 48.0 (2.6)
No (132) 4.4* (1.8) (132) 50.8 (7.7) (130) 2.1* (0.3) (122) 37.8 (5.9)
Sexual Orientation
Heterosexual (1580) 19.3 (1.6) (1586) 70.5 (2.0) (1554) 2.8 (0.1) (1510) 47.6 (2.6)
Gay-lesbian-bisexual (104) 18.8 (5.4) (105) 50.7 (8.6) (105) 2.3 (0.3) (102) 37.6 (6.3)
Davidson County Zone
East (334) 14.9 (2.5) (337) 62.2 (4.3) (327) 2.7 (0.1) (315) 52.3 (5.0)
Nashville Promise Zone (351) 12.7 (2.5) (357) 60.5 (4.4) (344) 2.7 (0.2) (332) 36.0 (3.4)
North West (248) 13.1 (3.8) (246) 66.6 (6.3) (242) 2.4 (0.3) (231) 43.4 (6.1)
South East (470) 22.0 (3.4) (470) 62.4 (4.5) (463) 2.4 (0.2) (452) 44.8 (6.2)
South West (362) 25.2 (3.0) (364) 89.2* (2.3) (362) 3.4* (0.2) (355) 53.6* (3.1)
DATA SOURCE: Nashville Community Health + Well-being Survey, 2019 *p<.001
Note: Question wordings include the following: Wear fitness device daily – “Do you ever wear a fitness device (e.g., Fitbit, Nike Sports watch, Apple watch, etc.) to measure your daily physical activity level?” [IF YES]: “How often do you wear a fitness device?” Non-job physical activity during past month – “During the past month, other than your regular job, did you participate in any physical activities or exercises such as running, calisthenics, golf, gardening, or walking for exercise?” Number days physically exercise in typical week – “In a typical week, how many days do you physically exercise?” Number of minutes typically exercise – “On the days you exercise, how many minutes or hours do you physically exercise?”

Nashville Community Health + Well-being Survey
74 | P a g e Survey Research Laboratory, University of Illinois at Chicago © 2019 Board of Trustees of the University of Illinois
Physical activity was also measured with the question “During the past month, other than your regular
job, did you participate in any physical activities or exercises such as running, calisthenics, golf,
gardening, or walking for exercise?” Overall, two-thirds of the adults in Davidson County (67.9%)
reported non-job related physical activity in the past month. Employed persons were more likely to
report physical activity that was not work-related (74.8%), compared to those unemployed (56.0%).
Annual household income was also strongly associated with physical activity, with a large majority of
persons having incomes in excess of $100,000 reporting high levels (88.5%), compared to less than half
of all persons in households with less than $25,000 in annual income (48.2%). Non-work related
physical activity was also found to be exceptionally above average in the South West portion of
Davidson County (89.2%), with little variation noted across the remainder of the county (ranging from
60.5% in the Nashville Promise Zone to 66.6% in North West Davidson County).
The mean number of days adults report physically exercising in a typical week in Davidson County was
2.7 days (range=0-7 days). Non-Hispanic whites and persons of mixed and other race/ethnicities
reported the highest mean days exercising (3.0 days and 2.9 days, respectively), and African Americans
reported the lowest average number of exercise days (2.3 days). Those with a graduate or professional
degree reported the highest average number of exercise days (3.3 days), and persons with a high school
degree reported the lowest average (2.0 days). Days of exercise also increased with household income,
with persons with household incomes of $100,000 and above reporting an average of 3.5 exercise days
per week, and those with incomes below $50,000 reporting 2.3 days of exercise. Exercise days were
highest in South West Davidson County (average=3.4 days), compared to other areas in the county.
Respondents were also asked to estimate the number of minutes they typically exercise on the days
they do exercise. For all adults in Davidson County, including those reporting no exercise, the average
was 46.6 minutes per day (range=0-480 minutes per day). The amount of time exercising declined with
age, with persons aged 18-29 averaging 60.6 minutes of exercise, and those 65 and older reporting 33.0
minutes of time exercising. Employed persons reported more time exercising (50.4 minutes) compared
to those unemployed (39.0 minutes). Average time exercising was highest in South West (53.6 minutes)
and East (52.3 minutes) Davidson County.
Additional questions concerned with physical activity are presented in Table 21. One question asked
respondents if they sit, stand or walk most of the day. Just over half (52.2%) indicated they sit during
most of the day. About one-third reported they walk around most of the day (36.2, se = 2.1), and 11.6%
reported they stand during most of the day (se = 1.6, data not reported in tables). Only one
sociodemographic measure, education, was associated with sitting most of the day. Specifically, sitting
most of the day increased with education. Two-thirds of those with a graduate or professional degree
reported sitting most of the day (67.9%), while about one-third of those with less than a high school
education (32.9%) reported doing so.
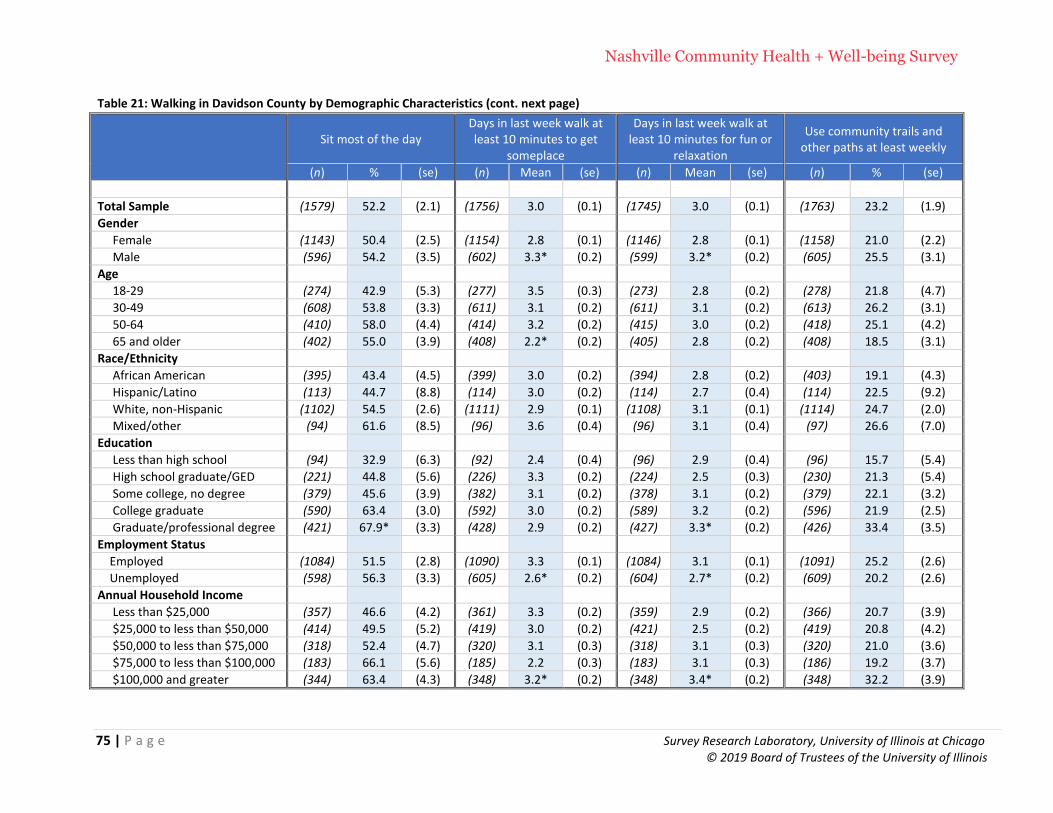
Nashville Community Health + Well-being Survey
75 | P a g e Survey Research Laboratory, University of Illinois at Chicago © 2019 Board of Trustees of the University of Illinois
Table 21: Walking in Davidson County by Demographic Characteristics (cont. next page)
Sit most of the day Days in last week walk at least 10 minutes to get
someplace
Days in last week walk at least 10 minutes for fun or
relaxation
Use community trails and other paths at least weekly
(n) % (se) (n) Mean (se) (n) Mean (se) (n) % (se)
Total Sample (1579) 52.2 (2.1) (1756) 3.0 (0.1) (1745) 3.0 (0.1) (1763) 23.2 (1.9)
Gender
Female (1143) 50.4 (2.5) (1154) 2.8 (0.1) (1146) 2.8 (0.1) (1158) 21.0 (2.2)
Male (596) 54.2 (3.5) (602) 3.3* (0.2) (599) 3.2* (0.2) (605) 25.5 (3.1)
Age
18-29 (274) 42.9 (5.3) (277) 3.5 (0.3) (273) 2.8 (0.2) (278) 21.8 (4.7)
30-49 (608) 53.8 (3.3) (611) 3.1 (0.2) (611) 3.1 (0.2) (613) 26.2 (3.1)
50-64 (410) 58.0 (4.4) (414) 3.2 (0.2) (415) 3.0 (0.2) (418) 25.1 (4.2)
65 and older (402) 55.0 (3.9) (408) 2.2* (0.2) (405) 2.8 (0.2) (408) 18.5 (3.1)
Race/Ethnicity
African American (395) 43.4 (4.5) (399) 3.0 (0.2) (394) 2.8 (0.2) (403) 19.1 (4.3)
Hispanic/Latino (113) 44.7 (8.8) (114) 3.0 (0.2) (114) 2.7 (0.4) (114) 22.5 (9.2)
White, non-Hispanic (1102) 54.5 (2.6) (1111) 2.9 (0.1) (1108) 3.1 (0.1) (1114) 24.7 (2.0)
Mixed/other (94) 61.6 (8.5) (96) 3.6 (0.4) (96) 3.1 (0.4) (97) 26.6 (7.0)
Education
Less than high school (94) 32.9 (6.3) (92) 2.4 (0.4) (96) 2.9 (0.4) (96) 15.7 (5.4)
High school graduate/GED (221) 44.8 (5.6) (226) 3.3 (0.2) (224) 2.5 (0.3) (230) 21.3 (5.4)
Some college, no degree (379) 45.6 (3.9) (382) 3.1 (0.2) (378) 3.1 (0.2) (379) 22.1 (3.2)
College graduate (590) 63.4 (3.0) (592) 3.0 (0.2) (589) 3.2 (0.2) (596) 21.9 (2.5)
Graduate/professional degree (421) 67.9* (3.3) (428) 2.9 (0.2) (427) 3.3* (0.2) (426) 33.4 (3.5)
Employment Status
Employed (1084) 51.5 (2.8) (1090) 3.3 (0.1) (1084) 3.1 (0.1) (1091) 25.2 (2.6)
Unemployed (598) 56.3 (3.3) (605) 2.6* (0.2) (604) 2.7* (0.2) (609) 20.2 (2.6)
Annual Household Income
Less than $25,000 (357) 46.6 (4.2) (361) 3.3 (0.2) (359) 2.9 (0.2) (366) 20.7 (3.9)
$25,000 to less than $50,000 (414) 49.5 (5.2) (419) 3.0 (0.2) (421) 2.5 (0.2) (419) 20.8 (4.2)
$50,000 to less than $75,000 (318) 52.4 (4.7) (320) 3.1 (0.3) (318) 3.1 (0.3) (320) 21.0 (3.6)
$75,000 to less than $100,000 (183) 66.1 (5.6) (185) 2.2 (0.3) (183) 3.1 (0.3) (186) 19.2 (3.7)
$100,000 and greater (344) 63.4 (4.3) (348) 3.2* (0.2) (348) 3.4* (0.2) (348) 32.2 (3.9)

Nashville Community Health + Well-being Survey
76 | P a g e Survey Research Laboratory, University of Illinois at Chicago © 2019 Board of Trustees of the University of Illinois
Table 21: Walking in Davidson County by Demographic Characteristics (cont.)
Sit most of the day Days in last week walk at least 10 minutes to get
someplace
Days in last week walk at least 10 minutes for fun or
relaxation
Use community trails and other paths at least weekly
(n) % (se) (n) Mean (se) (n) Mean (se) (n) % (se)
Health Insurance Coverage
Yes (1564) 54.2 (2.3) (1564) 3.0 (0.1) (1568) 3.0 (0.1) (1582) 23.6 (2.1)
No (127) 33.9 (8.2) (129) 3.8* (0.4) (129) 2.6 (0.4) (129) 17.6 (5.2)
Sexual Orientation
Heterosexual (1557) 54.0 (2.3) (1572) 3.0 (0.1) (1566) 3.0 (0.1) (1580) 24.3 (2.1)
Gay-lesbian-bisexual (105) 44.7 (8.5) (105) 2.9 (0.4) (105) 2.8 (0.5) (105) 20.1 (6.2)
Davidson County Zone
East (321) 47.3 (4.5) (330) 2.7 (0.2) (328) 3.0 (0.2) (331) 22.4 (4.4)
Nashville Promise Zone (351) 53.5 (4.4) (352) 3.5 (0.2) (347) 3.0 (0.2) (356) 22.9 (3.9)
North West (242) 43.2 (7.2) (246) 3.1 (0.4) (242) 2.8 (0.4) (245) 22.8 (8.3)
South East (464) 52.7 (4.4) (464) 2.9 (0.2) (462) 2.5 (0.2) (468) 14.7 (2.7)
South West (361) 59.3 (3.7) (364) 3.3* (0.2) (366) 3.6* (0.2) (363) 36.2* (3.9)
DATA SOURCE: Nashville Community Health + Well-being Survey, 2019 *p<.001
Note: Question wordings include the following: Sit most of the day – “On a typical day, do you sit during most of the day, stand during most of the day, or walk around most of the day?” Days in last week walk at least 10 minutes to get someplace – During the past seven days, on how many days did you walk for at least ten minutes at a time to get to some place such as work, school, a store, or restaurant?” Days in last week walk at least 10 minutes for fun or relaxation – “During the past seven days, on how many days did you walk for at least ten minutes at a time for fun, relaxation, exercise or to walk the dog?” Use community trails and other paths at least weekly – “Does your community have trails, greenways, bike paths, or sidewalks for biking, walking or other activities?” [IF YES]: “How often do you use these for biking, walking or other activities? Would you say at least once a week, at least once a month, a few times per year, never?”

Nashville Community Health + Well-being Survey
77 | P a g e Survey Research Laboratory, University of Illinois at Chicago © 2019 Board of Trustees of the University of Illinois
Another physical activity question asked respondents “During the past seven days, on how many days
did you walk for at least ten minutes at a time to get to some place such as work, school, a store, or
restaurant?” Adults in Davidson Country reported walking for at least ten minutes an average of 3.0
days per week (range=0-7). Males were more likely to do so (3.3 days vs. 2.8 days for females), and
younger persons aged 18-29 years were more likely to walk for one of these purposes (3.5 days) than
were persons aged 65 and older (2.2 days per week). Employed persons also walked more often (3.3
days) compared to the unemployed (2.6 days). Interestingly, there was little variation in walking time
across household income groups, with the exception that those earning between $75-$100,000
reported walking less frequently (2.2 days per week, compared to 3.0-3.3 days per week for all other
income groups). Those without health insurance walked more days per week (3.8 days) than did those
with insurance (3.0 days). Differences in walking days were also found across the county, with mean
number of days ranging from 2.7 in East Davidson County to 3.5 in the Nashville Promise Zone.
A related question asked respondents “During the past seven days, on how may days did you walk for at
least ten minutes at a time for fun, relaxation, exercise or to walk the dog?” An average of 3.0 days per
week were also reported for these activities (range=0-7), which varied across several sociodemographic
measures, including gender, education, employment status, annual household income, and zone within
Davidson County. Males (3.2 days), persons with graduate/professional degrees (3.3 days), employed
persons (3.1 days), those with household incomes of $100,000 or more (3.4 days), and persons living in
South West Davidson County (3.6 days) reported, on average, more days of walking as part of leisure
activities.
A final question regarding physical activity asked respondents if they use community trails, greenways,
bike paths, or sidewalks for biking, walking or other activities. Of the full sample (including persons
responding that their community does not have any of these types of trails – 26.5% of the sample, se =
1.7, data not shown in tables), 23.2% reported using these community trails for biking, walking or
other activities at least weekly. Use of these trails was greater among residents of South West
Davidson County (36.2% were weekly users), and least common among persons in the South East part
of the County (14.7%).

Nashville Community Health + Well-being Survey
78 | P a g e Survey Research Laboratory, University of Illinois at Chicago © 2019 Board of Trustees of the University of Illinois
Additional Health Related Topics
Several important topics not covered in previous sections of this report are considered here. These
include the health effects of racial discrimination, electronic health literacy, and issues related to
maternal and child health.
Discrimination and Health
Table 22 presents four previously developed BRFSS survey items concerned with perceptions of
discrimination and health status (Purnell et al., 2012). The first item asked “Within the past 12 months at
work, do you feel you were treated worse than, the same as, or better than people of other races?”
Among persons employed in the past 12 months (n = 1,280), 13.9% reported feeling they had been
treated worse than people of some other races at work. The only sociodemographic measure associated
with this question was race/ethnicity. In particular, 31.5% of African Americans reported feelings of
workplace discrimination. Non-Hispanic whites were least likely to report perceptions of work-related
racial discrimination.

Nashville Community Health + Well-being Survey
79 | P a g e Survey Research Laboratory, University of Illinois at Chicago © 2019 Board of Trustees of the University of Illinois
Table 22: Experiences of Discrimination in Davidson County by Demographic Characteristics (cont. next page)
Perceived work place discrimination (among
persons employed during past 12 months)
Perceived health care discrimination (among
persons receiving health care in past 12 months)
Emotional effects of discrimination
Physical effects of discrimination
(n) % (se) (n) % (se) (n) % (se) (n) % (se)
Total Sample (1280) 13.9 (1.8) (1582) 8.3 (1.4) (1726) 16.1 (1.9) (1699) 8.3 (1.3)
Gender
Female (813) 17.4 (2.7) (1048) 8.6 (2.5) (1133) 15.6 (2.1) (1117) 10.1 (2.0)
Male (467) 10.7 (2.2) (534) 8.1 (1.4) (593) 16.7 (3.2) (582) 6.3 (1.6)
Age
18-29 (260) 7.9 (2.0) (253) 10.1 (4.7) (277) 18.8 (5.6) (273) 4.1 (1.4)
30-49 (551) 13.3 (2.2) (566) 8.7 (1.8) (613) 14.6 (2.1) (604) 9.7 (2.1)
50-64 (309) 22.9 (5.6) (375) 8.7 (2.3) (405) 20.0 (4.5) (400) 13.0 (4.2)
65 and older (146) 16.1 (5.3) (368) 5.4 (1.9) (404) 11.6 (2.5) (395) 5.0 (1.5)
Race/Ethnicity
African American (276) 31.5 (5.2) (358) 14.6 (3.4) (395) 30.6 (4.3) (386) 17.8 (3.8)
Hispanic/Latino (92) 17.0 (5.9) (102) 19.8 (8.2) (116) 31.1 (10.0) (114) 15.2 (5.1)
White, non-Hispanic (820) 6.0 (1.3) (1026) 3.1 (0.9) (1101) 7.1 (1.2) (1088) 3.1 (0.9)
Mixed/other (81) 7.7* (2.7) (84) 11.4* (4.5) (97) 13.1* (4.0) (94) 5.5* (2.0)
Education
Less than high school (35) 32.3 (12.5) (84) 13.7 (5.3) (97) 12.7 (4.8) (93) 18.0 (6.2)
High school graduate/GED (123) 12.4 (5.2) (197) 6.8 (2.2) (222) 19.3 (5.5) (216) 9.4 (3.6)
Some college, no degree (264) 17.1 (3.3) (331) 12.6 (4.1) (369) 17.1 (3.4) (364) 8.8 (2.1)
College graduate (489) 9.2 (2.0) (553) 4.3 (1.2) (591) 12.5 (2.0) (585) 5.0 (1.3)
Graduate/professional degree (358) 14.4 (3.0) (399) 7.7 (2.3) (424) 15.9 (2.9) (418) 6.0 (2.2)
Employment Status
Employed (1061) 12.7 (1.9) (1009) 9.2 (1.9) (1088) 16.9 (2.5) (1070) 7.7 (1.7)
Unemployed (192) 18.2 (4.5) (542) 5.9 (1.5) (602) 15.0 (2.9) (596) 8.6 (1.6)
Annual Household Income
Less than $25,000 (198) 17.1 (4.0) (323) 11.1 (2.5) (367) 14.7 (2.5) (358) 13.8 (2.7)
$25,000 to less than $50,000 (317) 17.3 (5.0) (383) 6.9 (2.0) (421) 17.5 (4.9) (413) 10.5 (3.9)
$50,000 to less than $75,000 (254) 14.8 (3.7) (298) 10.3 (4.0) (318) 18.2 (4.4) (312) 5.7 (2.3)
$75,000 to less than $100,000 (166) 6.8 (2.6) (172) 9.4 (6.9) (185) 9.8 (2.6) (183) 2.2 (1.0)
$100,000 and greater (293) 11.0 (3.1) (333) 4.8 (1.8) (346) 13.9 (3.1) (343) 4.8 (1.9)

Nashville Community Health + Well-being Survey
80 | P a g e Survey Research Laboratory, University of Illinois at Chicago © 2019 Board of Trustees of the University of Illinois
Table 22: Experiences of Discrimination in Davidson County by Demographic Characteristics (cont.)
Perceived work place discrimination (among
persons employed during past 12 months)
Perceived health care discrimination (among
persons receiving health care in past 12 months)
Emotional effects of discrimination
Physical effects of discrimination
(n) % (se) (n) % (se) (n) % (se) (n) % (se)
Health Insurance Coverage
Yes (1172) 13.5 (1.9) (1454) 7.7 (1.4) (1547) 15.5 (1.9) (1524) 7.6 (1.3)
No (96) 17.3 (5.8) (88) 19.1 (6.8) (129) 23.4 (8.3) (125) 14.1 (5.2)
Sexual Orientation
Heterosexual (1151) 13.4 (1.9) (1447) 8.5 (1.5) (1573) 15.1 (1.9) (1551) 7.1 (1.3)
Gay-lesbian-bisexual (100) 14.1 (5.4) (97) 4.7 (3.1) (105) 31.6 (9.2) (103) 17.2 (6.1)
Davidson County Zone
East (228) 13.4 (3.5) (297) 6.9 (3.5) (328) 18.8 (4.6) (319) 5.8 (1.7)
Nashville Promise Zone (260) 17.8 (4.3) (318) 11.8 (3.2) (351) 17.6 (3.4) (343) 16.3 (3.6)
North West (163) 26.3 (11.6) (209) 10.8 (3.2) (235) 22.3 (7.8) (235) 14.0 (8.0)
South East (348) 13.2 (2.8) (419) 11.0 (3.1) (453) 17.3 (3.9) (448) 7.1 (1.7)
South West (281) 8.0 (2.0) (339) 2.4 (1.0) (359) 7.4 (1.7) (354) 2.8 (1.2)
DATA SOURCE: Nashville Community Health + Well-being Survey, 2019 *p<.001
Note: Question wordings include the following: Perceived work place discrimination – “Within the past 12 months at work, do you feel you were treated worse than, the same as, or better than people of other races?” [TABLE REPORTS % INDICATING “Worse than other races” or “Worse than some races, better than others]. Perceived health care discrimination – “Within the past 12 months when seeking health care, do you feel your experiences were worse than, the same as, or better than for people of other races?” [TABLE REPORTS % INDICATING “Worse than other races” or “Worse than some races, better than others]. Emotional effects of discrimination – “Within the past 30 days, have you felt emotionally upset, for example angry, sad, or frustrated, as a result of how you were treated based on your race?” Physical effects of discrimination – “Within the past 30 days, have you experienced any physical symptoms, for example, a headache, an upset stomach, tensing of your muscles, or a pounding heart, as a result of how you were treated based on your race?”

Nashville Community Health + Well-being Survey
81 | P a g e Survey Research Laboratory, University of Illinois at Chicago © 2019 Board of Trustees of the University of Illinois
A similar item asked about perceived discrimination when seeking health care: “Within the past 12
months when seeking health care, do you feel your experiences were worse than, the same as, or better
than for people of other races?” Among those seeking health care in the past 12 months (n = 1,582),
Hispanic/Latinos were most likely to report perceptions of discrimination in seeking health care (19.8%),
followed by African Americans (14.6%). Non-Hispanic whites were least likely to indicate feelings of
racial discrimination when obtaining health care (3.1%).
A third question asked “Within the past 30 days, have you felt emotionally upset, for example angry, sad,
or frustrated, as a result of how you were treated based on your race?” In Davidson County, 16.1% of all
adults reported emotional upset over perceptions of discrimination. Both Hispanic/Latinos and African
Americans were most likely to report discrimination-based emotional upset (31.1% and 30.6%,
respectively). Non-Hispanic whites were least likely to report being emotionally upset as a consequence
of racial discrimination (7.1%).
Another question investigated potential physical effects of perceived discrimination: “Within the past 30
days, have you experienced any physical symptoms, for example, a headache, an upset stomach, tensing
of your muscles, or a pounding heart, as a result of how you were treated based on your race?” In
Davidson County, 8.3% of all adults indicated physical symptoms stemming from how they felt they
were treated as a consequence of their race. Again, responses to this question varied considerably
based on race/ethnicity. African American respondents (17.8%) and Hispanic/Latinos (15.2%) were more
likely than non-Hispanic whites (3.1%) and persons of mixed or other race/ethnicities (5.5%) to
experience physical symptoms as a result of how they were treated based on their race.
One final question, not presented in tabular form, asked respondents “How often do you think about
your race? Would you say never, once a year, once a month, once a week, once a day, once an hour, or
constantly?” A plurality indicated they never think about their race (40.9%, se=2.1, n=1,720), while 9.4%
(se=1.3) reported thinking about it constantly. Other responses included thinking about race yearly
(7.8%, se=1.3), once a month (14.4%, se=1.8), once a week (13.5%, se=1.2), once a day (12.7%, se=1.4),
and once an hour (1.2%, se=0.5). In terms of race/ethnicity, the proportions indicating they never think
about their race included 45.8% of non-Hispanic whites, 40.0% of African Americans, 36.5% of persons
of mixed or other races, and 18.6% of Hispanic/Latinos. African Americans were most likely to indicate
constantly thinking about their race (21.7%), followed by persons of mixed/other races (16.1%),
Hispanic/Latinos (15.6%), and non-Hispanic whites (2.0%).
Electronic Health Literacy
Four questions previously used by health services researchers (Chung and Nahm, 2015) asked
respondents about their level of confidence in being able to find and effectively use health information
on the internet. The four items included the following:
“How confident are you that you can find helpful health resources on the Internet?”
“How confident are you that you can use the Internet to answer your health questions?”
“How confident are you that you can tell high quality from low quality health resources on the
Internet?”
“How confident are you in using information from the Internet to make health decisions?”

Nashville Community Health + Well-being Survey
82 | P a g e Survey Research Laboratory, University of Illinois at Chicago © 2019 Board of Trustees of the University of Illinois
Responses to each question ranged from (0) not at all confident, to (4) extremely confident. When
summed to form an online health literacy index, the score ranged from 0-16, with higher values
representing greater levels of electronic health literacy. The coefficient alpha for this 4-item scale was
0.91, a value indicating the measure has a very high degree of internal consistency.
As shown in Table 23, in Davidson County, the mean electronic health literacy score was 9.4 (on a scale
ranging from 0-16). Persons aged 30-49 rated themselves higher in electronic health literacy (10.1) and
those 65 and older gave themselves the lowest ratings (7.5). Education was also strongly associated with
electronic health literacy, ranging from 5.6 among persons with less than a high school degree to 10.9
among persons with graduate or professional degrees. Employed persons also self-rated their health
literacy more highly (10.0) than did those who were unemployed (8.2). Electronic health literacy also
increased with annual household income. Persons in the lowest income group (less than $25,000)
scored an average of 8.3 on the literacy index, with scores increasing to 10.2 for those in households
earning $75,000 and above. Persons living in South West Davidson County were also self-rated as having
higher electronic health literacy scores (10.4), while those in North West Davidson County scored the
lowest (8.2).

Nashville Community Health + Well-being Survey
83 | P a g e Survey Research Laboratory, University of Illinois at Chicago © 2019 Board of Trustees of the University of Illinois
Table 23: Online Health Literacy in Davidson County by Demographic Characteristics (cont. next page)
Online Health Literacy Index
(n) Mean (se)
Total Sample (1601) 9.4 (0.2)
Gender
Female (1029) 9.1 (0.3)
Male (572) 9.6 (0.2)
Age
18-29 (260) 9.6 (0.5)
30-49 (553) 10.1 (0.3)
50-64 (381) 9.4 (0.4)
65 and older (380) 7.5* (0.4)
Race/Ethnicity
African American (363) 8.8 (0.4)
Hispanic/Latino (97) 10.0 (0.5)
White, non-Hispanic (1034) 9.5 (0.2)
Mixed/other (89) 9.1 (0.9)
Education
Less than high school (74) 5.6 (0.9)
High school graduate/GED (194) 8.6 (0.5)
Some college, no degree (345) 9.4 (0.3)
College graduate (567) 10.2 (0.2)
Graduate/professional degree (403) 10.9* (0.3)
Employment Status
Employed (1011) 10.0 (0.3)
Unemployed (550) 8.2* (0.3)
Annual Household Income
Less than $25,000 (307) 8.3 (0.4)
$25,000 to less than $50,000 (387) 9.3 (0.5)
$50,000 to less than $75,000 (303) 9.6 (0.3)
$75,000 to less than $100,000 (177) 10.2 (0.5)
$100,000 and greater (331) 10.2* (0.3)

Nashville Community Health + Well-being Survey
84 | P a g e Survey Research Laboratory, University of Illinois at Chicago © 2019 Board of Trustees of the University of Illinois
Table 23: Online Health Literacy in Davidson County by Demographic Characteristics (cont.)
Online Health Literacy Index
(n) Mean (se)
Health Insurance Coverage
Yes (1450) 9.5 (0.2)
No (105) 8.6 (0.7)
Sexual Orientation
Heterosexual (1430) 9.3 (0.2)
Gay-lesbian-bisexual (138) 10.2 (0.6)
Davidson County Zone
East (297) 9.4 (0.3)
Nashville Promise Zone (327) 9.4 (0.4)
North West (220) 8.2 (0.7)
South East (416) 9.0 (0.4)
South West (341) 10.4* (0.2)
DATA SOURCE: Nashville Community Health + Well-being Survey, 2019 *p<.001 Note: Question wordings include the following: Health Literacy Index – this index ranges from values of 0 to 16, with higher values indicating greater self-reported levels of health literacy. The four questions used to construct this index are as follows: “How confident are you that you can find helpful health resources on the internet?”; “How confident are you that you can use the internet to answer your health questions?”; “How confident are you that you can tell high quality from low quality health resources on the internet?”; and “How confident are you in using information from the internet to make health decisions?” Responses to each item are coded as follows: “not at all confident” (coded as 0); “not very confident” (coded as 1); “somewhat confident” (coded as 2); “very confident” (coded as 3); and “extremely confident” (coded as 4).

Nashville Community Health + Well-being Survey
85 | P a g e Survey Research Laboratory, University of Illinois at Chicago © 2019 Board of Trustees of the University of Illinois
An additional analysis—not shown—confirmed that those persons responding by mail questionnaire
who reported no recent experience using the Internet (within the past 30 days) had by far the lowest
self-rated electronic health literacy scores (literacy index = 4.7, n = 68 respondents), compared to
persons who completed online and use the web on a regular basis (literacy index = 9.6, n = 1,089
respondents), those who completed online but have otherwise not used the web in the past 30 days
(literacy index = 8.5, n = 23 respondents), and those who completed paper questionnaires and use the
web on a regular basis (literacy index = 9.6, n = 386 respondents).
Maternal and Child Health
The health of mothers and children was another important topic covered by this survey; however, due
to relatively small sample sizes, most data reported in this section do not appear in statistical tables.
The average number of children under age 18 found to be living in the households participating in the
survey was 0.9 (se = 0.1, range = 0-8). Respondents with children were asked to randomly select one (if
more than one was living in the household), and answer several questions about that child. These
children had an average age of 8.3 years (se = 0.4, range = 0-17, n = 398). Of these children, 8.9% (se =
2.1) had ever been diagnosed with asthma by a doctor, nurse or other health professional. For those
children 10 years and older, 46.0% (se = 6.3, n = 191) had ever had the HPV vaccination (also known as
the cervical cancer vaccine, HPV shot, or GARDASIL®), which is designed to prevent the human papilloma
virus or HPV infection.
Female respondents were asked if they were currently pregnant; 2.3% (se = 0.7, n = 23) indicated they
were. An additional 6.9% of women reported having been pregnant sometime in the last 18 months (se
= 1.3, n = 61). Among these, 81.1% (se = 6.6) reported having given birth. The average age of the
newborns was 8.2 months (se = 1.3). One fetal death was reported.
Among women who were currently pregnant or who had been pregnant in the last 18 months, 78.8%
(se = 7.1, n = 78) indicated having a regular checkup in a family doctor’s office at some point during the
12 months before their pregnancy. Less than half (44.4%, se = 8.5) reported a visit for family planning or
birth control during the 12 months during this time interval. These women were also asked to report
whether or not they had various types of negative experiences during their pregnancy or during the 3
months before their pregnancy. Most commonly reported were loss of employment by either the
woman (19.5%) or her partner (21.9%), and a husband/partner indicating not wanting her to be
pregnant (18.3%). Responses to these and all other experiences are summarized in Table 24. Overall,
48.1% of these women reported having at least one of these experiences during or within the months
immediately before their pregnancy (mean = 1.2 experiences, se = 0.2).

Nashville Community Health + Well-being Survey
86 | P a g e Survey Research Laboratory, University of Illinois at Chicago © 2019 Board of Trustees of the University of Illinois
Table 24: Negative Experiences of Women who are Currently or were Recently (in the last 18 months) Pregnant (n = 78)
Experience % (se) My husband or partner lost his job 21.9 (8.2)
I lost my job even though I wanted to go on working 19.5 (8.0)
My husband or partner said he didn’t want me to be pregnant 18.3 (7.3)
A close family member was very sick and had to go into the hospital 16.4 (5.4)
Someone very close to me had a problem with drinking or drugs 12.3 (6.4)
My husband, partner, or I went to jail 9.8 (6.4)
Someone very close to me died 8.2 (4.4)
I got separated or divorced from my husband or partner 6.4 (5.3)
I was homeless or had to sleep outside, in a car, or in a shelter 3.0 (3.0)
I was apart from my husband or partner due to military deployment or extended work-related travel
0.3 (0.3)
These women were also asked how many alcoholic drinks they had consumed in an average week during
the three months before they became pregnant. A majority reported not drinking during that time
(27.1%, se = 7.4) or consuming less than one drink per week (27.5%, se = 6.8). Some reported heavy
drinking, 14 or more drinks per week, during this time period (12.2%, se = 7.8%).
Women who had been pregnant in the past 18 months, but who were not currently pregnant, were also
asked follow-up questions about their post-pregnancy checkup (Table 25). About three-quarters of
these women (78.0%) reported talking with a doctor, nurse or other health care worker about birth
control methods during this checkup. A majority (57.7%) also indicated they had been given or
prescribed a contraceptive method. These included the pill, patch, shot (Depo Provera®), NuvaRing®, or
condoms, an IUD (Mirena®, ParaGard®, Liletta®, or Skyla®) or a contraceptive implant (Nexplanon® or
Implanon®). More than half additionally reported talking about good nutrition (56.2%, se=9.6), and how
long to wait before getting pregnant again (51.8%). A few reported not having a post-pregnancy checkup
(7.2%).
Most women who had given birth to a live infant in the past 18 months reported having breastfed their
babies or having pumped breast milk to feed them (89.5%, se = 6.4). Of these, a majority were currently
breastfeeding or feeding pumped milk to their new baby (58.4%, se = 13.8), and reported having done
so for an average of 7.0 months (se = 1.7, range = 0.5-18 months). When asked in which position they
most often laid their baby down to sleep, about half (49.9%, se = 13.1) reported laying them on their
back, and about one-quarter indicated laying the infant on their stomach (25.4%, se = 12.3) and on their
side (24.7%, se = 13.9). These new mothers were also asked how many times their new baby had been
to a doctor, nurse, or other health care worker for a well-baby checkup. The average number of visits
was 4.8, se = 0.4, range=0-9 times).

Nashville Community Health + Well-being Survey
87 | P a g e Survey Research Laboratory, University of Illinois at Chicago © 2019 Board of Trustees of the University of Illinois
Table 25: Post-Pregnancy Checkup Experiences of Women who were Pregnant during the Last 18 Months (n = 60)
Did a doctor, nurse, or other health care worker: % (se)
Talk about birth control methods 78.0 (7.0)
Give or prescribe a contraceptive method such as the pill, patch, shot(Depo Provera®), NuvaRing®, or condoms, an IUD (Mirena®,ParaGard®, Liletta®, or Skyla®) or a contraceptive implant(Nexplanon® or Implanon®)
57.7 (8.9)
Talk about good nutrition 56.2 (9.6)
Talk about how long to wait before getting pregnant 51.8 (9.6)
Did not have a post-pregnancy checkup 7.2 (4.1)

Nashville Community Health + Well-being Survey
88 | P a g e Survey Research Laboratory, University of Illinois at Chicago © 2019 Board of Trustees of the University of Illinois
Conclusions
This report provides basic estimates for a variety of essential health conditions, behaviors and health
care access and utilization patterns in Davidson County, Tennessee. We are hopeful that this report will
assist policy makers in designing and implementing new initiatives that lead to improved health for all
citizens in the county. We also hope these findings are useful to the general public for better
understanding the health risks confronting their community and some of the health-related resources
now available to them.

Nashville Community Health + Well-being Survey
89 | P a g e Survey Research Laboratory, University of Illinois at Chicago © 2019 Board of Trustees of the University of Illinois
References
American Association for Public Opinion Research. (2016). Standard Definitions: Final Dispositions of
Case Codes and Outcomes Rates for Surveys, 9th Edition. AAPOR. Accessed at:
https://www.aapor.org/AAPOR_Main/media/publications/Standard-Definitions20169theditionfinal.pdf
Centers for Disease Control and Prevention. (2000). Measuring Health Days. Atlanta, GA: CDC. Accessed at: https://www.cdc.gov/hrqol/pdfs/mhd.pdf
Centers for Disease Control and Prevention. (2012). Attitudes toward Mental Illness: Results from the Behavioral Risk Factor Surveillance System. Atlanta, GA: CDC. Accessed at: https://www.cdc.gov/hrqol/Mental_Health_Reports/pdf/BRFSS_Full%20Report.pdf
Chung, S.-Y., and Nahm, E.-S. (2015). Testing reliability and validity of the eHealth Literacy Scale
(eHEALS) for older adults recruited online. Computers, Informatics, Nursing: CIN 33(4): 150-156.
Accessed at: https://www.ncbi.nlm.nih.gov/pmc/articles/PMC4442634/
Kanny, D., Naimi, T.S., Liu, Y., Lu, H., and Brewer, R.D. (2018). Annual total binge drinks consumed by
U.S. adults, 2015. American Journal of Preventive Medicine 54(4): 486-496. Accessed at:
https://www.ncbi.nlm.nih.gov/pmc/articles/PMC6075714/pdf/nihms-954087.pdf
Kuehn, B. (2019). Youth e-cigarette use. JAMA 321(2): 138. Accessed at:
https://jamanetwork.com/journals/jama/fullarticle/2720740
Lee, S. (2015). Self-rated health in health surveys. Pp. 193-216 in T.P. Johnson (Ed.) Handbook of Health Survey Methods. Hoboken, NJ: John Wiley & Sons.
Lohr, S.L. (2010). Sampling: Design and Analysis, Second Edition. Boston, MA: Brooks/Cole.
Purnell, J.Q., Peppone, L.J., Alcaraz, K., McQueen, A., Guido, J.J., Carroll, J.K., Shcham, E., and Morrow,
G.R. (2012). Perceived discrimination, psychological distress, and current smoking status: Results from
the Behavioral Risk Factor Surveillance System reactions to race module, 2004-2008. American Journal
of Public health 102(5): 844-851. Accessed at:
https://www.ncbi.nlm.nih.gov/pmc/articles/PMC3483933/
Retzer, K.F. and Johnson, T.P. (2019). Nashville Community Health + Well-being Survey: Methodology
Report. Chicago: University of Illinois at Chicago Survey Research Laboratory.
Schuetz, J. (2019). Renting the American Dream: Why homeownership shouldn’t be a prerequisite for middle-class financial security. Up Front. Access at: https://www.brookings.edu/blog/up-front/2019/02/13/renting-the-american-dream-why-
homeownership-shouldnt-be-a-pre-requisite-for-middle-class-financial-security/
Tourangeau, R., Rips, L.J., and Rasinski, K. (2000). The Psychology of Survey Response. Cambridge, UK:
Cambridge University Press.

Nashville Community Health + Well-being Survey
A-1 | P a g e Survey Research Laboratory, University of Illinois at Chicago © 2019 Board of Trustees of the University of Illinois
Appendix A
Map of Zones in Davidson County

Nashville Community Health + Well-being Survey
B-1 | P a g e Survey Research Laboratory, University of Illinois at Chicago © 2019 Board of Trustees of the University of Illinois
Appendix B
Map of Combined Zones in Davidson County

Nashville Community Health + Well-being Survey
C-1 | P a g e Survey Research Laboratory, University of Illinois at Chicago © 2019 Board of Trustees of the University of Illinois
Appendix C
Detailed Unweighted Demographic Composition of Sample
Table B-1. Detailed Unweighted Demographic Composition of Nashville Community Health + Well-being Survey Sample (n = 1,805)
(n) % (n) %
Gender Annual Household Income
Female (1188) 65.8 Less than $10,000 (118) 7.1
Male (617) 34.2 $10,000 to less than $15,000 (85) 5.1
Age $15,000 to less than $20,000 (68) 4.1
18-29 (280) 16.2 $20,000 to less than $25,000 (101) 6.1
30-49 (617) 35.6 $25,000 to less than $35,000 (175) 10.6
50-64 (418) 24.1 $35,000 to less than $50,000 (251) 15.2
65 and older (418) 24.1 $50,000 to less than $60,000 (142) 8.6
Race/Ethnicity $60,000 to less than $75,000 (19) 10.8
African American, Non-Hispanic (407) 23.3 $75,000 to less than $100,000 (187) 11.3
White, Non-Hispanic (1124) 64.4 $100,000 to less than $125,000 (111) 6.7
Hispanic/Latino (116) 6.7 $125,000 to less than $150,000 (78) 4.7
Mexican [47] 2.7 $150,000 to less than $200,000 (83) 5.0
Puerto Rican [15] 0.9 $200,000 and greater (77) 4.7
Cuban [7] 0.4 Health Insurance Coverage
Central America & Caribbean [17] 1.0 Yes-insured (905) 50.6
South America [15] 0.9 Employer/union plan (117) 6.5
Other [15] 0.9 Purchased plan (401) 22.4
Asian (46) 2.6 Medicare (77) 4.3
Pacific Islander (7) 0.4 Medicare or other state program (42) 2.4
American Indian/Alaska Native (17) 1.0 TRICARE, VA, or military (70) 3.9
Mixed/other (28) 1.6 Some other source (137) 7.7
Education No-not insured (40) 2.2
Never attended (4) 0.3 Household Size
Grades 1-8 (16) 1.2 One (718) 41.9 Grades 9-11 (80) 6.1 Two (815) 47.6 High school graduate/GED (233) 17.8 Three (121) 7.1 Some college, no degree (384) 29.4 Four (46) 2.7
College degree (483) 3.7 Five (10) 0.6 Some graduate education (114) 8.7 Six (2) 0.1 Graduate/professional degree (428) 32.8 Children in Household
Employment Status None (922) 52.5
Employed for wages (947) 57.2 One (563) 32.1
Self-employed (150) 9.1 Two (153) 8.7
Out-of-work for 1 year or more (24) 1.5 Three (81) 4.6
Out-of-work for less than 1 year (34) 2.1 Four (29) 1.7
Homemaker (77) 4.7 Five or more (8) 0.5
Student (49) 3.0 Sexual Orientation
Retired (348) 21.0 Heterosexual (1595) 92.7

Nashville Community Health + Well-being Survey
C-2 | P a g e Survey Research Laboratory, University of Illinois at Chicago © 2019 Board of Trustees of the University of Illinois
Unable to work (26) 1.6 Gay-Lesbian (59) 3.4
Marital Status Bisexual (41) 2.4
Married (707) 40.3 Other (25) 1.5
Divorced (292) 16.7 Consider Self Transgender*
Widowed (113) 6.4 Yes-transgender (male to female) (2) 0.1
Separated (32) 1.8 Yes-transgender (female to male) (1) 0.1
Single/never married (488) 27.8 No (1728) 99.8
Member of an unmarried couple (122) 7.0 Davidson County Zone
Personally has a cell/smart phone East (341) 18.9
Yes (1670) 97.8 Nashville Promise Zone (361) 20.0
No (38) 2.2 North West (252) 14.0
Used Internet in past 30 days South East (480) 26.6 Yes (1568) 93.5 South West (371) 20.6 No (109) 6.5
DATA SOURCE: Nashville Community Health + Well-being Survey, 2019
*All respondents who self-identified as transgendered also self-identified as heterosexual and are reported assuch in the tables within the report.
Top Related
Copyright © 2022 FDOKUMEN

