


Bahasa
Halaman
Hukum


Multilocus tests of Pleistocene refugia and ancientdivergence in a pair of Atlantic Forest antbirds(Myrmeciza)
F �ABIO RAPOSO DO AMARAL,*1 PATRICK K. ALBERS,† 2 SCOTT V. EDWARDS† and
CRISTINA Y. MIYAKI*
*Departamento de Gen�etica e Biologia Evolutiva, Universidade de Sao Paulo, Rua do Matao, 277, Cidade Universit�aria, Sao
Paulo, SP CEP 05508-090, Brazil, †Department of Organismic and Evolutionary Biology and Museum of Comparative Zoology,
Harvard University, 26 Oxford Street, Cambridge, MA 02138, USA
Abstract
The Atlantic Forest (AF) harbours one of the most diverse vertebrate faunas of the
world, including 199 endemic species of birds. Understanding the evolutionary pro-
cesses behind such diversity has become the focus of many recent, primarily single
locus, phylogeographic studies. These studies suggest that isolation in forest refugia
may have been a major mechanism promoting diversification, although there is also
support for a role of riverine and geotectonic barriers, two sets of hypotheses that can
best be tested with multilocus data. Here we combined multilocus data (one mtDNA
marker and eight anonymous nuclear loci) from two species of parapatric antbirds,
Myrmeciza loricata and M. squamosa, and Approximate Bayesian Computation to
determine whether isolation in refugia explains current patterns of genetic variation
and their status as independent evolutionary units. Patterns of population structure,
differences in intraspecific levels of divergence and coalescent estimates of historical
demography fit the predictions of a recently proposed model of refuge isolation in
which climatic stability in the northern AF sustains higher diversity and demographic
stability than in the southern AF. However, a pre-Pleistocene divergence associated
with their abutting range limits in a region of past tectonic activity also suggests a role
for rivers or geotectonic barriers. Little or no gene flow between these species suggests
the development of reproductive barriers or competitive exclusion. Our results sug-
gests that limited marker sampling in recent AF studies may compromise estimates of
divergence times and historical demography, and we discuss the effects of such sam-
pling on this and other studies.
Keywords: anonymous loci, Atlantic Forest, multilocus phylogeography, refugia theory
Received 4 January 2013; revision received 24 March 2013; accepted 28 March 2013
Introduction
Neotropical forests are well known for their astonishing
diversity, and defining which evolutionary processes
originated such diversity has been the goal of evolu-
tionary biologists for more than a century. Several early
naturalists and modern biologists have sought to iden-
tify patterns and processes, such as the presence of
rivers, cycles of climate variation or geologic events,
that may have contributed to the build-up of Neotropi-
cal diversity (e.g. Wallace 1852; Haffer 1969, 1993, 1997;
Bush 1994; Moritz et al. 2000; Bates et al. 2008; Rull
2008; Carnaval et al. 2009; Hoorn et al. 2010; Thom�e
et al. 2010). However, complexity seems to be the rule
in the Neotropics, and it has become clear that a single
model alone or a specific geological period cannot
Correspondence: F�abio Raposo do Amaral, Fax: +55 11
33196428; E-mail: [email protected] Current address: Departamento de Ciencias Biol�ogicas, Uni-
versidade Federal de Sao Paulo, Campus Diadema. Rua Prof.
Artur Riedel, 275, Jardim Eldorado, Diadema, SP CEP 09972-
270, Brazil2 Current address: Wellcome Trust Centre for Human Genetics,
Roosevelt Drive, Oxford, OX3 7BN, UK
© 2013 John Wiley & Sons Ltd
Molecular Ecology (2013) doi: 10.1111/mec.12361

explain the origin of the entire Neotropical biota (Bush
1994; Bates et al. 2008; Rull 2008; Thom�e et al. 2010;
D’Horta et al. 2011; Brumfield 2012).
One of the most diverse—but least studied—areas of
the Neotropics is the Atlantic Forest (henceforth referred
to as AF). Originally distributed mostly throughout east-
ern Brazil, Paraguay and Argentina (Rizzini 1997; Silva
et al. 2004), the AF harbours between two and three per
cent of all known vertebrate species and stands as one
of the five most diverse areas in the world (Myers et al.
2000). Currently reduced to 11.4–16% of its preclearing
distribution (Ribeiro et al. 2009), the AF historically (i.e.
500 years ago) stretched across 25° of latitude and from
sea level to 1700 m of altitude and was isolated from
other forest biomes in South America by open vegeta-
tion (Silva et al. 2004). The evolutionary processes
involved in the generation of such diversity, however,
are still poorly known. Avian phylogenies suggest a
complex evolutionary history of species endemic to the
AF. Both local diversification (e.g. Tangara tanagers,
Burns & Naoki 2004) and diversification involving
faunal connections with other Neotropical areas have
been identified (e.g. Amazon forest, Xiphorhynchus
woodcreepers, Cabanne et al. 2008; Andes, Amazon
parrots, Russello & Amato 2004; South American
savannahs, buteonine hawks, Amaral et al. 2009). Even a
single avian radiation may present contrasting
histories of AF endemics in space and time (ovenbirds,
Furnariidae, Derryberry et al. 2011). At the micro-evolu-
tionary level, avian phylogeography in the AF has just
began to be explored (e.g. Cabanne et al. 2007, 2008,
2011; Mata et al. 2009; D’Horta et al. 2011; Batalha-Filho
et al. 2012; Maldonado-Coelho 2012). The high diversity
(199) of endemic avian species (Stotz et al. 1996) makes
birds an excellent group to explore the recent history of
the AF.
Refuge isolation has been recently proposed as one of
the most powerful forces shaping intraspecific diversity
in the AF (Carnaval et al. 2009; Carnaval & Moritz 2008;
henceforth referred to as the stability-extinction model).
Classical refuge theory hypothesizes that forest organ-
isms are isolated in forest patches during periods of
pronounced climatic changes that affected life on Earth
since the onset of the Quaternary (Haffer 1969; Vanzolini
& Williams 1970) and perhaps even earlier (Haffer 1993;
Hewitt 1999). Isolation in forest patches surrounded by
unsuitable habitat would lead to differentiation, and in
some cases, speciation. The stability-extinction model
uses present and past models of the distribution of the
AF to suggest that current patterns of intraspecific
genetic variation are the result of periodic isolation in
areas of forest stability (i.e. refuges) and extinction in
areas outside refuges during glacial periods, in particular
the Last Glacial Maximum (LGM) around 21 000 years
ago. Two main refuges are predicted to have existed in
the AF during the LGM (Fig. 1); one between the rivers
Doce and S~ao Francisco (i.e. the Bahia refuge) and a sec-
ond one north of the S~ao Francisco River (the Pernam-
buco refuge). Areas south of the Doce River would have
been environmentally less stable during glaciations.
Thus, organisms widespread in the AF should have
higher genetic diversity, more population structure and
increasingly stable historical demographies as one moves
north of the Doce River, while populations south of that
river should present lower levels of diversity, less popu-
lation structure and traces of recent recolonization events
from northern populations (Carnaval & Moritz 2008;
Carnaval et al. 2009).
In addition to refuges, it has been suggested that the
development of rivers (Pellegrino et al. 2005) and other
physiographic barriers (Silva & Straube 1996; Brunes
et al. 2010; Thom�e et al. 2010) have been important
factors shaping diversity in the AF. Those barrier
hypotheses differ in expectations from the refuge
hypothesis both spatially (breaks should coincide with
barriers, not refuges) and temporally (splits could be
much older than those caused by refuges). More
importantly, in contrast to the expectations under the
refuge hypothesis (Moritz et al. 2000), major demo-
graphic fluctuations should not occur under the barrier
hypotheses, because cycles of extinction and expansion
are not expected.
The foundations of AF phylogeography were laid by
recent studies on AF endemics from several taxonomic
groups. Those studies were mostly based on mitochon-
drial DNA alone or up to two unlinked markers (e.g.
Pellegrino et al. 2005; Grazziotin et al. 2006; Cabanne
et al. 2007, 2008; Carnaval et al. 2009; Fitzpatrick et al.
2009; D’Horta et al. 2011; Batalha-Filho et al. 2012;
Maldonado-Coelho 2012), with a few exceptions using
three or four independent loci (Tchaicka et al. 2007;
Martins et al. 2009; Brunes et al. 2010; Thom�e et al. 2010;
Amaro et al. 2012). Theory predicts that inferences
based on one or few independent markers may be sub-
ject to several locus-specific shortcomings, especially
locus-specific stochastic error (see Discussion), which in
turn may influence estimates of demographic history,
divergence times and population structure (Edwards &
Beerli 2000; Hickerson et al. 2005, 2006, 2010; Carling &
Brumfield 2007; Heled & Drummond 2008; Brito &
Edwards 2009). The extent to which those issues affect
our current knowledge of AF phylogeography, how-
ever, is unknown.
Study system
The Squamate Antbird (Myrmeciza squamosa, henceforth
referred to as SA) and the White-bibbed Antbird
© 2013 John Wiley & Sons Ltd
2 F . RAPOSO DO AMARAL ET AL.

(Myrmeciza loricata, WBA) are sister species (F. R. Ama-
ral & C. Y. Miyaki, in preparation, G. Bravo & R. T.
Brumfield, in preparation) of suboscine birds endemic
to the Brazilian AF, where they inhabit both lowland
and montane humid forests from sea level to 1000 m or
higher (Ridgely & Tudor 2009). They occur in parapa-
try, and their combined distributions cover the central
and southern portions of the AF, including most of the
humid forest south of the S~ao Francisco River (Fig. 1).
Under the stability-extinction model, WBA’s range
includes both predicted areas of stability in the AF (the
Bahia refugium, Fig. 1) as well as unstable areas south
of the Doce River. However, SA’s range lies entirely
outside major refuges, in putatively unstable areas
(Fig. 1). Thus, these two species are excellent models to
test the effects of refuge isolation in the AF predicted
by the stability-extinction model, as contrasting demo-
graphic histories would be expected for each species. In
addition, many geologic faults and rivers not only dis-
sect both species’ distributions, but also roughly coin-
cide with the area of their abutting ranges (Fig. 1), thus
offering an opportunity to evaluate alternative pro-
cesses of diversification (i.e. barrier hypotheses).
In addition to their utility as models for diversifica-
tion processes in the AF, the WBA/SA species pair
represents an interesting opportunity to study speciation
of suboscine birds. Vocalizations are thought to be innate
and very important in maintaining species integrity
among antbirds (Isler et al. 1998), and for this reason,
vocalizations have been used to help establish species
limits—including in Myrmeciza antbirds (e.g. Chaves
et al. 2010). However, WBA and SA are not only similar
1
2
3
23
4
6
7
5
89
10
11
4
57
961011
12
13
M. loricata
M. squamosa
Paraguaçu
de Contas
Pardo
Doce*
Paraíba do Sul
Tietê
Iguaçú
Jequitinhonha
Uruguai*
São Francisco*
CAF
BA
SEAL
PE
MG
ES
RJSP
PR
SC
RS
Chapada Diamantina
12
Paranapanema
13
18
500 km
SAFRPSV
2
3
11
12
13
1
50 km
Doce*
Uruguai*
São Francisco*
Chapada Diamantina
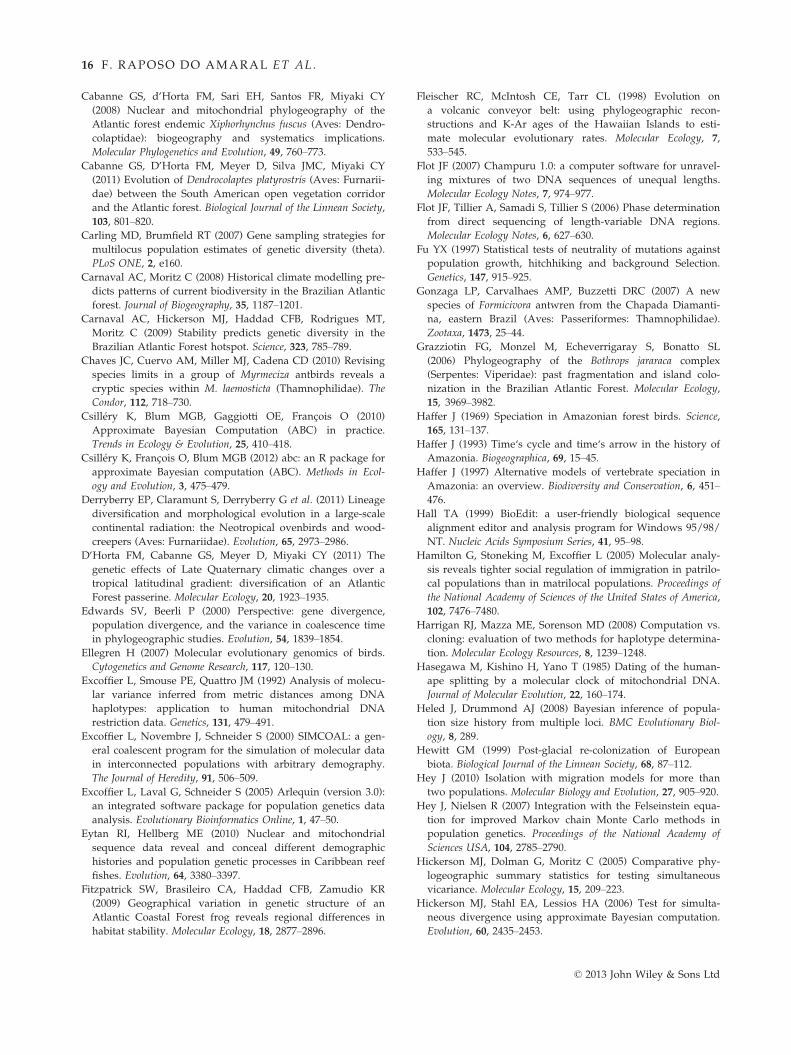
Fig. 1 Localities sampled in the present study (see also Fig. S2, Supporting information). Squares represent White-bibbed Antbird
(WBA) and circles Squamate Antbird (SA). Coloured records represent genetic samples used, while historical (grey) show species dis-
tributions. The original, preclearing distribution of the Atlantic Forest (AF) is indicated in light grey, state borders in dark grey and
major rivers in black. The main rivers in the area (Paraguac�u, de Contas, Pardo, Jequitinhonha, Doce, Para�ıba do Sul, Tiete, Paranap-
anema, and Iguac��u) are indicated. The upper inset shows the forest modelled after a recent stability-extinction model for the AF
(Fig. 3b from Carnaval & Moritz 2008; AF broader definition—see original reference for additional details and also a more specific
definition of the AF), indicating both Central Atlantic Forest (CAF) and Southern Atlantic Forest (SAF). Areas in black and orange
show regions of most probable predicted stability, while areas in yellow and green show regions of lesser and least probable
predicted stability. Acronyms of states originally covered by the AF are indicated in red. Dashed lines indicate areas of putative
geographic barriers contained in WBA/SA distribution, according to Thom�e et al. (2010). The lower inset indicates the area of the
mutual distribution limit of WBA and SA, as well as the River of Para�ıba do Sul Valley. Light blue squares represent WBA localities
identified in the STRUCTURE runs as the ‘CD cluster’ (see text).
© 2013 John Wiley & Sons Ltd
MULTILOCUS PHYLOGEOGRAPHY OF MYRMECIZA ANTBIRDS 3

in behaviour and plumage (males being especially alike,
with females differing in throat and mask colour), but
more remarkably, in vocalizations (Zimmer & Isler
2003). Their very similar songs associated with their
parapatric distributions may raise questions concerning
the strength of their reproductive isolation (see Fig. S1,
Supporting information for sonograms).
Here we explore patterns of intra- and interspecific
variation of WBA and SA using one of the largest
sequence-based multilocus data sets used so far in a
study of Neotropical phylogeography (nine putatively
unlinked regions). We address the question whether pat-
terns of divergence and historical demography fit the
expectations of refuge isolation and/or the barrier
hypotheses in the case of WBA and SA. In addition, due
to their phenotypic similarities—vocalization in particu-
lar—and parapatry, we further ask whether multilocus
data support recognition of WBA and SA as distinct
evolutionary units.
Methods
Population and marker sampling
We obtained 89 antbird samples (48 WBA and 41 SA)
from 26 localities (13 for each species), comprising one
to nine individuals per locality (Fig. 1 and Table S1,
Supporting information). Fieldwork in Brazilian
National Parks and private land (2008–2010) provided
most of the specimens, but additional samples were
obtained from tissue collections. Birds were collected
using the method described in Amaral et al. (2012a).
Most individuals were represented by vouchered speci-
mens (86 of 89). Species identification followed Ridgely
& Tudor (2009).
We obtained sequences from nine markers, including
eight anonymous nuclear loci designed specifically for
SA (Amaral et al. 2012b, 268–422 bp), as well as com-
plete sequences of the mitochondrial gene NADH sub-
unit 2 (ND2, 1041 bp) using primers described
elsewhere (for mitochondrial primer sequences and
references see Table S2, Supporting information).
Sequences were deposited in GenBank under the acces-
sion numbers KC714092–KC715586.
DNA extraction and sequencing
DNA was extracted using a modified version of the
phenol–chloroform method of Bruford et al. (1992) as
described by Tavares et al. (2006), or the DNeasy kit
(Qiagen Inc.) according to the manufacturer’s protocol.
PCR was performed in 25 lL reactions, containing
2.5 lL of buffer 109 (Pharmacia), 1 lL of dNTP mix
(2 lM each), 0.5 U of Taq-polymerase (Pharmacia), 1 lL
of each primer (10 lM, Table 1) and 25–50 ng of DNA.
Thermal cycling conditions for all markers were an ini-
tial denaturation step of 95 °C for 5 min, followed by
40 cycles of 95 °C (30 s), 60 °C (30 s) and 72 °C (40 s),
and a final extension step of 72 °C of 10 min. Single-
band products were purified using polyethylene glycol
(PEG) precipitation or EXO-SAP enzymatic purification
and sequenced using Big Dye terminator 3.1 cycle
sequencing kit (Life Technologies), according to the
manufacturer’s protocol. The primers used for initial
PCR and occasional allele-specific PCR (AS-PCR) were
used for sequencing (Tables S2 and S3, Supporting
information). Sequences were obtained using an ABI
3100, 3130 or 3730 automated sequencer (Life Technolo-
gies).
Both strands were assembled in contigs, and
sequences were inspected and corrected by eye using
Codoncode Aligner 3.7.1 (Codoncode Inc.). Heterozy-
gous positions were first coded according to the IUPAC
code. Individuals exhibiting alleles with indels had their
heterozygous positions resolved with the method of
Flot et al. (2006) as implemented in Champuru (Flot
2007) or using AS-PCR. Sequences were aligned in
Clustal X 2.1 (Larkin et al. 2007) using default parame-
ters and had their edges trimmed to equal sequence
lengths in Bioedit 7.0.8 (Hall 1999).
Haplotype estimation, recombination, descriptivestatistics and neutrality tests
Phased haplotypes were initially estimated computa-
tionally using Bayesian methods as implemented in
PHASE (Stephens & Donnelly 2003). Gametic phases
inferred with posterior probabilities equal or higher
than 0.6 were considered resolved (Harrigan et al.
2008), and gametic phases with lower posterior proba-
bilities were resolved using AS-PCR.
We tested for signs of past recombination using a
PHI Test (Bruen et al. 2006) as implemented in Splits-
Tree4 (Huson & Bryant 2006). In case of a significant
signal of recombination, the marker was reduced to the
largest nonrecombining block based on the four-gamete
test (Hudson & Kaplan 1985) performed in DNAsp 5.1
(Librado & Rozas 2009).
Nucleotide diversity (p), haplotype diversity (Hd),
number of haplotypes (h) and number of segregating
sites (S) were calculated for each marker and species.
We tested for statistically significant differences in
diversity estimators between species for each estimator
using Mann–Whitney two-tailed tests using R 2.13.1
(R Development Core Team 2013). To detect significant
deviations from the null hypothesis of neutral evolution
and constant population size, we performed Tajima’ D
tests (Tajima 1989), Fu’s Fs (Fu 1997) and R2 tests
© 2013 John Wiley & Sons Ltd
4 F . RAPOSO DO AMARAL ET AL.

Table 1 Descriptive statistics and neutrality tests for each marker separated by species and STRUCTURE cluster. Bold numbers with
asterisks indicate statistically significant results based on coalescent simulations. WBA non-CD does not include locality 9 (see
STRUCTURE results for explanation)
N Length (bp) p Hd S h Tajima’ D Fu’s Fs
Ramos &
Rozas’s R2
ND2
WBA 47 1041 0.00317 0.946 26 21 �1.455 �10.829* 0.058*
WBA/CD cluster 6 1041 0.00211 0.867 6 4 �0.932 �0.326 0.248
WBA/non-CD cluster 36 1041 0.00302 0.927 21 16 �1.282 �6.467* 0.070
SA 40 1041 0.00072 0.571 7 9 �1.509 �6.181* 0.057*
Mysq-AL2
WBA 96 72 0.01387 0.687 6 8 �0.328 �2.111 0.083
WBA/CD cluster 12 72 0.01178 0.667 2 3 0.822 0.360 0.212
WBA/non-CD cluster 74 72 0.01409 0.673 6 8 �0.415 �2.373 0.085
SA 82 72 0.00161 0.116 1 2 �0.505 �0.271 0.058
Mysq-AL8
WBA 94 382 0.00151 0.490 7 8 �1.369 �4.523* 0.043
WBA/CD cluster 12 382 0.00206 0.667 2 3 0.554 0.217 0.197
WBA/non-CD cluster 74 382 0.00127 0.416 6 7 �1.435 �4.284* 0.047
SA 82 368–382 0.00362 0.701 8 8 �0.430 �1.213 0.082
Mysq-AL16
WBA 96 68 0.00092 0.041 3 3 �1.614 �3.211 0.075
WBA/CD cluster 12 68 0.00000 0 0 1 — — —WBA/non-CD cluster 74 68 0.00119 0.054 3 3 �1.650 �2.836 0.086
SA 82 68 0.00202 0.137 1 2 �0.378 �0.049 0.069
Mysq-AL17
WBA 94 412 0.00440 0.744 12 13 �0.607 �3.619 0.074
WBA/CD cluster 12 412 0.00338 0.439 4 3 0.184 1.403 0.168
WBA/non-CD cluster 72 412 0.00374 0.691 12 13 �1.054 �5.370* 0.063
SA 82 412 0.00141 0.529 5 6 �0.932 �2.258 0.065
Mysq-AL18
WBA 96 350 0.00234 0.604 11 11 �1.622 �6.527* 0.038*
WBA/CD cluster 12 350 0.00429 0.742 4 5 0.466 �0.903 0.180
WBA/non-CD cluster 74 350 0.00209 0.575 8 8 �1.409 �3.752* 0.046
SA 82 351 0.00060 0.205 3 4 �1.208 �2.543* 0.048
Mysq-AL22
WBA 92 267–268 0.00587 0.768 8 8 �0.014 �0.495 0.097
WBA/CD cluster 12 268 0.00384 0.667 2 3 1.624 0.747 0.258
WBA/non-CD cluster 70 267–268 0.00631 0.777 7 7 0.385 0.167 0.119
SA 80 267–268 0.00393 0.518 4 5 0.621 0.447 0.131
Mysq-AL23
WBA 92 302 0.00483 0.822 10 12 �0.667 �4.061* 0.072
WBA/CD cluster 12 302 0.00492 0.788 5 5 �0.380 �0.927 0.137
WBA/non-CD cluster 70 302 0.00468 0.815 9 11 �0.643 �3.837* 0.078
SA 82 299–302 0.00000 0.000 0 1 — — —Mysq-AL25
WBA 94 309–311 0.01610 0.942 24 28 0.045 �8.502* 0.101
WBA/CD cluster 12 311 0.01540 0.879 13 7 0.475 �0.130 0.171
WBA/non-CD cluster 72 309–311 0.01592 0.937 21 24 0.246 �6.605* 0.114
SA 82 311 0.00328 0.590 10 9 �1.296 �3.183 0.058
Mean polymorphism
WBA 0.00589 0.672 12 12
WBA/CD cluster 0.00531 0.635 4 4
WBA/non-CD cluster 0.00581 0.652 10 11
SA 0.00191 0.374 4 5
Mean nuclear polymorphism
WBA 0.00623 0.637 10 11
WBA/CD cluster 0.00571 0.606 4 4
© 2013 John Wiley & Sons Ltd
MULTILOCUS PHYLOGEOGRAPHY OF MYRMECIZA ANTBIRDS 5

(Ramos-Onsins & Rozas 2002). Significance was
obtained based on 1000 coalescent simulations. All tests
and simulations were conducted with DNAsp 5.1.
Population structure
Median-joining networks were inferred using the soft-
ware NETWORK (Fluxus-Engineering) to explore
general patterns of variation for each marker. Popula-
tion structure was assessed with STRUCTURE 2.3.1
(Pritchard et al. 2000) using nuclear markers only, with
alleles used instead of individual SNPs. Three data sets
were examined: one with all samples from both species,
and each species separately. We adopted the admixture
model, using both models of independent and
correlated allele frequencies. Twenty independent runs
were performed for 10 values of K, using 500 000 gener-
ations burn-in and 5 000 000 total generations. To detect
subtle substructure, the single species runs were also
analysed using the LOCPRIOR model (Hubisz et al.
2009) and locality information (Table S1, Supporting
information). A posteriori choice of the best K was per-
formed with the ad hoc method proposed by Pritchard
et al. (2000). Each set of runs per K was averaged using
CLUMPP (Jakobsson & Rosenberg 2007). In order to
evaluate concordance between the population structure
found in STRUCTURE and mtDNA variation, we
performed analyses of molecular variance—AMOVA
(Excoffier et al. 1992), as implemented in Arlequin 3.5
(Excoffier et al. 2005), with the groupings found in
STRUCTURE assumed as populations. Significance was
estimated based on 50 000 permutations. Localities
represented by only one individual were excluded from
AMOVA tests.
Inferences of demographic history
We explored the speciation history of both species by
fitting the data set to a model of isolation with migration
as implemented in IMa2 (Nielsen & Wakeley 2001; Hey
& Nielsen 2007; Hey 2010). The HKY (Hasegawa et al.
1985) model was applied for all markers. Several runs
were performed in order to establish the best priors for
effective population size, time of divergence and migra-
tion parameters. The final run was performed using
2 000 000 generations of burn-in, 100 000 trees sampled
during 1 000 000 generations, and use of 20 chains
(command line: -q10.0 -t8.0 -m1.0 -b2000000 -l100000 -d10
-p234567 -hfg -hn20 -ha0.96 -hb0.9). The estimated
parameters were converted to demographic units assum-
ing substitution rate ranges for ND2 from 0.8 9 10�8 sub-
stitutions/site/year (Fleischer et al. 1998), and for
anonymous loci from the mean of 0.135 9 10�8 substitu-
tions/site/year (Ellegren 2007). Conversions were also
performed using several additional substitution rates, in
order to evaluate the impact of rate choice on estimates
(Table S4, Supporting information). We assumed a gener-
ation time of 1 year. Sensitivity of results to marker sam-
pling was evaluated by performing runs using the total
data set, as well as mtDNA-only and nDNA-only data
sets.
Increasing effective population size through time is
one of the strongest expectations of the refuge model,
but not of the barrier hypothesis. We performed GMRF
Skyride Plots (GSP, Minin et al. 2008) for mtDNA-only
data sets and Extended Bayesian Skyline Plots (EBSP)
for the nuclear multilocus data (Heled & Drummond
2008), which provide historical estimates of population
size fluctuations. We fitted a HKY model for all mark-
ers and performed runs based on groups found in
STRUCTURE. Invariant markers were excluded. We
adopted a strict molecular clock and uniform priors on
substitution rates ranging from 0.8 to 1 9 10�8 substitu-
tions/site/year for ND2 (Fleischer et al. 1998; Lovette
2004) and 0.12–0.256 9 10�8 substitutions/site/year for
nuclear markers (Ellegren 2007; Lee & Edwards 2008).
Chains were run for 500 million generations, with sam-
pling performed at each of 25 000 steps.
Approximate Bayesian Computation
Because some results from the IMa2 analyses were
equivocal (i.e. we were not able to estimate divergence
times in WBA-only runs, and very small migration rates
were inferred between WBA and SA), we also used
Approximate Bayesian Computation (ABC) as a method
for demographic inference to estimate the age of diver-
gence within WBA and to test potential gene flow
Table 1 Continued
N Length (bp) p Hd S h Tajima’ D Fu’s Fs
Ramos &
Rozas’s R2
WBA/non-CD cluster 0.00616 0.617 9 10
SA 0.00206 0.350 4 5
CD, Chapada Diamantina; h, number of haplotypes; Hd, haplotype diversity; p, nucleotide diversity; S, number of segregating sites;
SA, Squamate Antbird; WBA, White-bibbed Antbird.
© 2013 John Wiley & Sons Ltd
6 F . RAPOSO DO AMARAL ET AL.

between SA and WBA (for review, see Beaumont et al.
2002; Beaumont 2010; Csill�ery et al. 2010; Tsai &
Carstens 2013). We focused on nuclear variation in the
ABC analyses to avoid analytical difficulties related to
the divergent rates of evolution of mitochondrial and
nuclear sequences. Two demographic scenarios were
considered: a reproductive isolation model and a post-
divergence migration model, both representing poten-
tial outcomes of vicariance followed by secondary
contact. In both models, the times of divergence within
the WBA complex were estimated under a uniform
prior distribution (0–2 million years ago). Scenarios
only differed in an additional parameter in the migra-
tion model, included as postdivergence, bidirectional
migration between SA and the adjacent WBA cluster
under a uniform prior (0–1 diploid individuals per
generation), occurring after divergence within the WBA
complex. Between-species gene flow was excluded in
the isolation model. Remaining demographic parame-
ters were set to values inferred using IMa2 for nuclear
data. Four diversity estimators (nucleotide diversity,
haplotype diversity, number of haplotypes and number
of segregating sites) served as summary statistics for
the ABC analysis. These measures were obtained for SA
and each WBA cluster as well as the combined popula-
tion total. In addition, we calculated pairwise FST(Hud-
son et al. 2002) between each pair of SA and WBA
clusters. For each summary statistic, we used the mean
of single-marker measures obtained for the nuclear data
set. Both speciation scenarios were simulated under the
coalescent process using the programme Bayesian Serial
SimCoal (BayeSSC; Anderson et al. 2005), which is a
modification of SimCoal 1.0 (Excoffier et al. 2000), and
the analysis was performed using the abc package in R
(Csill�ery et al. 2012).
Before estimating demographic parameters, we used
ABC for model selection, using half a million simula-
tions per model. Posterior probabilities for each model
were obtained using the logistic regression method
(Beaumont 2008) as well as the simpler rejection-sam-
pling method (Tavar�e et al. 1997), whereas support for
each model was compared by calculating Bayes factors
from obtained probabilities (Kass & Raftery 1995;
Robert 2007). The subsequent ABC parameter estimation
step was carried out for the better supported demo-
graphic model (the isolation model), for which we
obtained one million simulations. We used the
weighted local-linear regression algorithm (Beaumont
et al. 2002) and applied a correction for heteroscedastici-
ty as implemented in the abc package. Because the
regression adjustment can potentially result in posterior
distributions that exceed the bounds of the correspond-
ing prior distributions, it is sometimes recommended to
transform parameters (Beaumont et al. 2002; Blum &
Franc�ois 2009). Therefore, following Hamilton et al.
(2005), we applied a log-tangent transformation of
parameters before regression. The resulting posterior
distribution was back-transformed to record point
estimates and the corresponding 95% highest posterior
density (HPD) interval. Inferred demographic
parameters were eventually confirmed by conducting
back simulations.
Results
Genetic diversity
From a potential total of 801 sequences (89 individu-
als 9 9 markers), all but six were successfully obtained
and, if nuclear, had gametic phases resolved. Statisti-
cally significant PHI tests indicated signs of recombina-
tion in two markers, Mysq-AL2 and Mysq-AL16, which
were reduced to 72 and 68 bp from alignments of 346
and 422 bp, respectively.
Descriptive statistics (Table 1) indicated that ND2 var-
iation was higher than the mean nuclear polymorphism
in most measures, except for nucleotide diversity. Varia-
tion of two nuclear markers (SA: Mysq-AL8 and Mysq-
AL 25) was also higher than that of ND2 in number of
segregating sites and haplotype diversity. No marker
showed significant deviation from the null hypothesis of
neutrality and constant population size according to Taj-
ima’s D test. Significant values of R2 and/or Fu’s Fs tests,
however, were obtained in some cases (ND2: WBA and
SA; Mysq-AL8: WBA; Mysq-AL17: WBA; Mysq-AL18:
WBA and SA; Mysq-AL23: WBA; and Mysq-AL25:
WBA; see Table. 1). Levels of genetic diversity were sig-
nificantly higher in WBA than in SA in all variables mea-
sured, namely nucleotide diversity (W = 64, P = 0.04),
haplotype diversity (W = 66, P = 0.02), number of haplo-
types (W = 67.5, P = 0.02) and number of segregating
sites (W = 68, P = 0.02).
Population structure
Median-joining networks suggest very limited shared
variation between WBA and SA (Fig. 2). In five mark-
ers, the species share no variation (ND2, Mysq-AL8,
Mysq-AL18, Mysq-AL22 and Mysq-AL23), while in the
remaining markers (Mysq-AL2, Mysq-AL16, Mysq-
AL17 and Mysq-AL25), they share a maximum of two
alleles. ND2 haplotypes of WBA and SA are separated
by 46 substitutions (or a Kimura 2-Parameter net diver-
gence of 4.8%). A minimum of one to four substitutions
separate WBA from SA alleles of nuclear markers lack-
ing shared variation. The reciprocal monophyly of most
of the markers (6 of 9) underscores the substantial
divergence of this species pair.
© 2013 John Wiley & Sons Ltd
MULTILOCUS PHYLOGEOGRAPHY OF MYRMECIZA ANTBIRDS 7

STRUCTURE analyses based on all individuals
recovered two clusters that match allocation of individ-
uals to WBA and SA, irrespective of number of K or
model used (Fig. 3 and Fig. S2, Supporting informa-
tion). Admixture appears to be very limited or nonexis-
tent, and no individual presented ancestry coefficients
of less than 96.2% to its respective cluster when K = 2
is considered, independently of the model adopted.
Based on the ad hoc method of Pritchard et al. (2000),
K = 2 is the best choice under the model of admixture
with independent allele frequencies, while K = 5 is
favoured under the model of admixture with corre-
lated allele frequencies. When species were analysed
separately, all runs had K = 1 as best choice for SA.
The best number of clusters for WBA varied among
from K = 1 (admixture with correlated allele frequen-
cies), K = 2 (LOCPRIOR + admixture with independent
or correlated allele frequencies) and K = 3 (admixture
with independent allele frequencies). Runs for WBA
based on LOCPRIOR and independent allele frequen-
cies identified a cluster composed of individuals 43–48,
corresponding to the region of Chapada Diamantina
(henceforth referred to as CD), that is, localities 12 and
13 (Figs 1 and 3 and Fig. S2, Supporting information).
The same clustering appeared when LOCPRIOR with a
model of correlated allele frequencies was used, but in
this case, the cluster also included individuals 34–38
(from locality 9). Given the discordance across models,
which could result from introgression between CD and
non-CD clusters or simply lack of statistical power to
establish the boundaries between those two clusters,
we focused on the cluster of individuals that was pres-
ent in most STRUCTURE runs, namely the CD cluster
(individuals 43–48; Fig. 3 and Fig. S2, Supporting infor-
mation) and excluded WBA locality 9 from most
downstream analyses (except in ABC). AMOVA combin-
ing SA and WBA indicate that 95.3% of mtDNA varia-
tion is explained by interspecific differences (P < 0.01).
Intraspecific AMOVA performed between WBA’s CD and
non-CD clusters (excluding locality 9) indicates that
Fig. 2 Median-joining networks inferred
for data sets of combined White-bibbed
Antbird and Squamate Antbird samples.
Squares represent inferred haplotypes/
alleles.
© 2013 John Wiley & Sons Ltd
8 F . RAPOSO DO AMARAL ET AL.

24.0% of mtDNA variation is due to among-cluster dif-
ferences (P > 0.05).
Divergence population genetics
Isolation-with-migration (IMa2) analyses using the total
data set (Fig. 4 and Table S4, Supporting information)
suggest that divergence between species occurred at 3.8
million years ago (mya) and a 95% Highest Posterior
Density (HPD) interval ranging from 2.2 to 5.4 mya.
Estimates of effective population size of WBA
(1.9 9 106 individuals, 95% HPD: 1.4 9 106–2.4 9 106)
are more than four times larger than for SA (0.4 9 106
individuals, 95% HPD: 0.3 9 106–0.6 9 106). The
estimated 95% HPD interval for ancestral effective pop-
ulation size is large (8400–1.3 9 106 individuals) and
encompasses the 95% HPD interval of SA, but is lower
and does not overlap with the 95% HPD interval esti-
mated for WBA. Population migration rates are nonzero
in both directions, being almost 10 times larger from SA
to WBA (2NM maximum-likelihood = 0.104, 95% HPD:
0.026–0.261) than from WBA to SA (2NM maximum-
likelihood = 0.017, 95% HPD: 0.001–0.079). Both rates
are significantly different from zero according to the
likelihood ratio test of Nielsen & Wakeley (2001), imple-
mented in IMa2. In comparison with runs based on the
(a)
(b)
(d)
(c)
Fig. 3 STRUCTURE plots depicting pop-
ulation structure between samples of
White-bibbed Antbird (WBA) and Squa-
mate Antbird (a and b), and substructure
within WBA (c and d). Plots shown rep-
resent the best K according to the ad hoc
method after Pritchard et al. (2000). Pan-
els (a) and (b) result from runs under the
models of admixture with independent
allele frequencies and admixture with
correlated allele frequencies, respectively.
Panels (c) and (d) result from runs under
the models of LOCPRIOR plus admixture
with independent allele frequencies and
LOCPRIOR plus admixture with corre-
lated allele frequencies, respectively. The
red dashed line in (c) and (d) marks
WBA’s Chapada Diamantina cluster. See
Fig. S2 (Supporting information) for
additional plots.
© 2013 John Wiley & Sons Ltd
MULTILOCUS PHYLOGEOGRAPHY OF MYRMECIZA ANTBIRDS 9

total data set, IMa2 analyses based on nuclear markers
only resulted in very similar point estimates and 95%
HPD ranges of effective population sizes and Popula-
tion migration rates (Fig. 4 and Table S4, Supporting
information). However, divergence times were approxi-
mately 1 million years younger in the nDNA-only data
set compared to results from the total data set (2.6 mya,
95% HPD: 1.5–4.4 mya). Runs based on mtDNA alone
did not contain sufficient information to estimate
parameters in the full model and were not considered.
Historical fluctuations of population size
Three clusters were analysed in separate runs to infer
Bayesian Skyline and GMRF Skyride Plots: SA, WBA/
CD and WBA/non-CD (Fig. 5). Given the requirement
for panmixis to perform those inferences, individuals of
WBA from locality 9 were not considered because their
uncertain placement in the STRUCTURE runs could
result from gene flow between CD and non-CD popula-
tions. Invariant markers were excluded for SA EBSP
runs (Mysq-C23) and CD cluster EBSP runs (Mysq-
C16). Based on medians of runs using the total data set
(Fig. 5), there were no signs of historical population
fluctuations in the WBA/CD cluster, while population
size increase was inferred for both WBA/non-CD and
SA. A gradual increase in the non-CD WBA may have
begun at approximately 2 million years ago, while a
sharp increase in population size for SA was inferred to
have begun approximately 20 000 years ago. Nuclear-
only EBSPs were similar to those obtained using the
total data set. The mtDNA-only GSPs for the CD cluster
and SA were similar to those obtained with multilocus
data, but with much shorter observation windows. The
mtDNA-only estimates for non-CD WBA contrast with
the long-term stability inferred using the total and
nDNA-only data sets, although 95% HPD intervals
are large and could accommodate a scenario of stability
(i.e. a flat line). All mtDNA-only estimates presented
an observation window of less than 500 000 years,
compared to millions of years in the nDNA and
mtDNA + nDNA estimates.
Intraspecific divergence and interspecific gene flow
Based on the clustering inferred using STRUCTURE,
we included CD and non-CD WBA as demographic
units besides SA in our ABC analysis. Here, we
included WBA non-CD locality 9, because it could
provide insights into gene flow estimates. With the esti-
mates of diversity for each marker, the observed vector
of summary statistics contained 19 mean values of
single-locus statistics (four measures for each of the
three groups and the population total, and one between
each group). We evaluated two scenarios that differed
in the level of cross-species gene flow as demographic
parameter, that is, presence or absence of migration in
a reproductive isolation model and postdivergence
migration model, respectively. In the latter, bidirec-
tional migration was included between SA and WBA/
non-CD as adjacent cluster, after it diverged from the
CD cluster. Under the logistic regression method for
model selection in ABC, Bayes factors (BF) substantially
supported the reproductive isolation model (BF = 4.92)
over the postdivergence migration model (BF = 0.20,
see Fig. 6a). This result was further emphasized when
the analysis was carried out using the rejection-sam-
pling method (BF = 8.86 and 0.11, for isolation and
migration, respectively). Under the isolation model, the
time of divergence of CD and non-CD WBA was esti-
Fig. 4 Isolation-with-migration plots. Solid lines represent runs based on the total data set, while dashed lines correspond to nuclear-
only runs. Assumed rates were 0.008 substitutions/site/lineage/million years for mtDNA and 0.00135 substitutions/site/lineage/
million years for nDNA, but see Table S4 (Supporting information) for alternative conversions.
© 2013 John Wiley & Sons Ltd
10 F . RAPOSO DO AMARAL ET AL.

mated at around 135 000 YBP (95% HPD: 42 000–
1 388 000) when taking the mode as point estimate, or
even earlier when considering the median (249 000
YBP) or mean (359 000 YBP) of the posterior distribu-
tion (Fig. 6b). As the migration model was not
supported, no gene flow between SA and the adjacent
WBA/non-CD cluster was found to be present after the
divergence of the CD/non-CD divergence.
After parameter estimation, we assessed these results
in a model checking procedure, whereas the inferred
divergence time was fixed in the isolation model, and
replicate simulations were performed under the coales-
cent process to obtain posterior predictive distributions
for each summary statistic. Observations falling outside
or in the far end of tails (e.g., P � 0.025) of the predictive
distributions suggest that parameters could not be appro-
priately estimated, most likely due to an insufficient
choice of summary statistics and/or an inappropriate
demographic model (Beaumont 2010). However, none of
the observed summary statistics appeared outside of its
posterior predictive distribution (Fig. S3, Supporting
information), and the probabilities of observations to fall-
ing in either tail of the distribution were all P � 0.1
(mean P-value: 0.32). Thus, our results indicate that both
the demographic model used and the divergence time
inferred were adequate to approximate the underlying
evolutionary history of the WBA/SA species pair.
Discussion
Myrmeciza antbirds: evidence of refugia, barriers orboth?
In our study of two species of endemic antbirds, we
tested alternative scenarios of diversification in the
hyper-diverse Atlantic Forest (AF) biome based on the
largest sequence-based data set of an AF endemic organ-
ism thus far. Our results fulfil expectations of the refuge
theory as elaborated in the stability-extinction scenario
for the recent history of the AF biota as recently pro-
posed by Carnaval & Moritz (2008) and Carnaval et al.
(2009). In support of this model, we found: (i) strong
demographic fluctuations coinciding with the LGM in
the Squamate Antbird (SA), which occurs entirely in
portion of the AF with least forest stability (Southern
AF); (ii) long-term population growth not coinciding
with LGM or stability (CD cluster and non-CD cluster,
respectively) in the White-bibbed Antbird (WBA), which
has most of its distribution in a large putative refuge
(Bahia); (iii) higher genetic diversity in WBA compared
to the SA, reflecting expected differences in persistence
in species occupying northern and southern portions of
the AF; (iv) persistence in areas of predicted refuges, as
indicated by population structure in WBA; and (v)
evidence of secondary contact, based on parapatric
Fig. 5 Extended Bayesian Skyline and GMRF Skyride Plots. Color lines represent EBSPs based on mtDNA + nDNA data, light grey
lines represent nuclear-only EBSPs and black lines represent mtDNA GSPs. The same runs are presented side by side using different
scales for a detailed view of the last 100 000 years. The map colours represent White-bibbed Antbird (WBA)/Chapada Diamantina
(CD) cluster (light blue), WBA/non-CD cluster (dark blue) and Squamate Antbird (red). WBA’s locality 9, which has been excluded
from those analyses (see text for reasons), is represented in black. Nucleotide diversity is also illustrated.
© 2013 John Wiley & Sons Ltd
MULTILOCUS PHYLOGEOGRAPHY OF MYRMECIZA ANTBIRDS 11

distributions of WBA and SA associated with signs of
population expansion. One aspect of our data, however,
does not completely fit the stability-extinction scenario.
According to that model, species currently inhabiting
the Southern AF should represent recent offshoots from
expansion of northern populations. Instead, our data
suggest that SA is a divergent evolutionary unit
endemic to the Southern AFs, echoing similar findings
with other organisms (e.g. Grazziotin et al. 2006; Cab-
anne et al. 2007; Fitzpatrick et al. 2009; Thom�e et al. 2010;
D’Horta et al. 2011; Amaro et al. 2012; Maldonado-Coel-
ho 2012). Because avian distributions are labile and may
change at timescales as short as a human lifespan
(Brumfield 2012), we cannot rule out a scenario in which
SA survived by shifting its distribution to northern lati-
tudes during glacial periods. However, if major range
shifts did not occur, it is possible that SA may have been
persisting in Southern AF for millions of years since
their initial divergence from WBA. Conceivably the
original stability-extinction model lacks predictive
power for the southern portions of the biome (Amaro
et al. 2012), as exemplified by inference of many taxon-
specific refuges in southeastern and Southern Brazil
(Porto et al. 2013). Additionally, persistence in Southern
(a)
(b)
Fig. 6 Results of the model selection and
parameter estimation procedures in
Approximate Bayesian Computation
(ABC). (a) Schematic representation of
the reproductive isolation model, which
had more explanatory power than the
postdivergence migration model, as
revealed by model selection in ABC. The
model is represented as phylogenetic tree
(thick black lines), whereas each branch
is labelled with the effective population
size (Npop), in units of a million diploid
individuals, and the width of each
branch (shaded area) is proportional to
the indicated size. Adjacent vertical lines
illustrate the time to divergence (τpop)with labels in units of a million years
ago, whereas the splitting time between
Chapada Diamantina (CD) and non-CD
White-bibbed Antbird (WBA) (circled)
was included as a prior distribution in
the model, and its value was estimated
in the subsequent parameter estimation
step. (b) Posterior distribution found
when estimating the divergence time of
CD and non-CD WBA under the repro-
ductive isolation model, with rejection
sampling of the prior distribution (thin
grey line) and the posterior distribution
achieved by local-linear regression (thick
black line). The prior distribution itself is
indicated (dashed line) as reference.
© 2013 John Wiley & Sons Ltd
12 F . RAPOSO DO AMARAL ET AL.

AF refuges has been hypothesized to be strongest in
species capable of surviving in montane forest (as WBA
and SA), because their tolerance to colder climates could
shield them from the effects of the LGM (Amaro et al.
2012). Thus, although not originally predicted by the
original stability-extinction model, recent evidence
suggests that lineage persistence in the Southern AF—as
may have happened with the SA—may also be
consistent with a scenario of refuge isolation.
Our results also suggest that a small region west of
the large Bahia refuge, the Chapada Diamantina
uplands, harbours a population of WBA with signs of
differentiation from the rest of the species’ range. This
area contains a small patch of AF harbouring popula-
tions of otherwise typically AF-inhabiting species as
well as endemic organisms (e.g. Gonzaga et al. 2007),
is mostly surrounded by open Caatinga vegetation, and
still remains little explored in phylogeographic studies.
A role for the Chapada Diamantina uplands as a small
putative refuge in the stability-extinction model (Fig. 1)
is consistent with the inferred stability and differentia-
tion of the Chapada Diamantina (CD) cluster found in
the present study. However, the localities sampled
here are also separated from the rest of WBA’s range
by a potential riverine barrier, the Paraguac�u River
(Fig. 1). Thus, the hypothesis of this river acting as a
barrier cannot be rejected here, and further sampling
in the CD area south of the Paraguac�u River will be
necessary to discriminate between these hypotheses.
Additional sampling of individuals in CD and neigh-
bouring areas would also improve estimates of popula-
tion structure, which in turn would provide more
precise boundaries between CD and non-CD cluster
(e.g. resolving the status of individuals of WBA local-
ity 9).
Besides the unresolved role of the Paraguac�u River,
on recent timescales our results do not support riverine
or physiographic barriers as drivers of population struc-
ture, despite the many other rivers and topographic
features that currently dissect the ranges of WBA and
SA (Fig. 1). However, barriers may have acted on older
timescales, namely during the initial divergence between
SA and WBA. The antbirds studied here appear to have
diverged well before the Pleistocene (2–4 mya), and
their shared distribution boundary matches an area of
high tectonic activity during the Miocene and Pliocene
namely the River of Para�ıba do Sul Valley (Petri &
F�ulfaro 1983; Fig. 1). Alternatively, refuge isolation may
have been responsible for both initial divergence and
evolution of intraspecific patterns of variation, because
climatic fluctuations may have been important even
prior to the Pleistocene (Haffer 1993; Hewitt 1999). Thus,
although intraspecific patterns of variation of WBA and
SA strongly support the effect of refuge isolation in the
AF, we cannot yet reject a role of the barrier hypothesis
entirely, particularly during the initial divergence of
WBA/SA on a larger timescale.
Vicariance, dynamic history or stochastic error? WhyAtlantic Forest phylogeography demands multilocusdata?
Taking at face value recent studies inferring divergence
times and demographic histories of AF organisms
performed using mtDNA or small (2–4) numbers of
independent markers, what would the multilocus esti-
mates of WBA/SA divergence suggest about assembly
wide historical processes? Their pre-Pleistocene diver-
gence is among the oldest reported, especially when
compared to other AF avian sister species or mtDNA
phylogroups. It is, for example much older than most
of the divergences inferred for codistributed mtDNA
lineages of suboscine songbirds, which usually diverged
less than 1 mya (Cabanne et al. 2007, 2008; D’Horta
et al. 2011; Maldonado-Coelho 2012). Our estimates are
rivalled so far only by divergences estimated for species
of Eleoscytalopus tapaculos (Mata et al. 2009). Our timing
is in line with divergences found among codistributed
clades of other vertebrates, such as frogs (Fitzpatrick
et al. 2009; Brunes et al. 2010; Amaro et al. 2012) and
pitvipers (Grazziotin et al. 2006). Thus, it is possible that
temporally distinct vicariant events may have shaped
AF vertebrate diversity, sometimes leading to pulses of
diversification that may have affected distantly related
organisms in similar ways.
Besides the apparent periodicity of large-scale events,
sister lineages resulting from temporally independent
events appear to accumulate in selected areas of the
AF. The River of Para�ıba do Sul Valley is a clear exam-
ple, by roughly demarcating the shared range limits of
phylogroups/species pairs that appear to have
diverged very recently (<1 mya, Cabanne et al. 2007;
D’Horta et al. 2011) or even before the Pleistocene (e.g.
WBA vs. SA). Consequently, these areas should be
investigated not only for their roles as primary genera-
tors of diversity, but also as suture zones, because
many of those lineages may have not have diverged,
but expanded simultaneously (Moritz et al. 2009;
Martins 2011). Finally, our results are consistent with a
number of recent studies suggesting that refuge isola-
tion may have been an important mechanism of diver-
sification in the recent history of the AF (Grazziotin
et al. 2006; Cabanne et al. 2007; Carnaval et al. 2009;
Fitzpatrick et al. 2009; Martins et al. 2009; Brunes et al.
2010; D’Horta et al. 2011; Maldonado-Coelho 2012).
However, our findings do not reject the idea that barri-
ers may have played an important role in the AF diver-
sification, in particular, before the Pleistocene
© 2013 John Wiley & Sons Ltd
MULTILOCUS PHYLOGEOGRAPHY OF MYRMECIZA ANTBIRDS 13

(Pellegrino et al. 2005; Brunes et al. 2010; Thom�e et al.
2010; Amaro et al. 2012).
Biases of single and multilocus demographic estimatesin AF studies
Here, we address the impact of limited marker sam-
pling, including possibilities of bias in this study,
on estimates of demographic parameters in AF stud-
ies. In particular, we ask: Do available molecular
studies—mostly based on mtDNA alone or a few
markers—already provide a general framework to
understand processes of AF diversification?
Divergence times. Theory predicts that comparison of
divergence times across different studies based on one
or few markers may not be straightforward, because
gene divergence may largely pre-date population diver-
gence (Edwards & Beerli 2000). Our results, for exam-
ple, match previous empirical inferences (Lee &
Edwards 2008) suggesting that estimation of divergence
times may be affected not only by the number of loci,
but also by whether or not mtDNA is included. In addi-
tion, recent studies suggest that natural selection may
reduce mutation rates with increasing effective popula-
tion sizes in selected prokaryotes and unicellular
eukaryotes (Sung et al. 2012). If this process also affects
birds, comparisons between species/populations with
considerably distinct effective population sizes—as in
our case—may be subject to this additional source of
error when constant substitution rates are assumed to
estimate divergence times.
Demography. Another essential aspect to be considered
in comparisons across AF studies is the key role that
historical demography plays in the AF, and more gen-
erally, Neotropical phylogeography. The statistical
power of methods we have used, such as Extended
Bayesian Skyline Plots (EBSP; Heled & Drummond
2008), as well as their ‘observation window’ depends
on the number of loci used (Heled & Drummond
2008). Our results are in line with those predictions:
on the one hand, the longest observation windows
(spanning millions of years) and the most narrow 95%
HPD intervals in effective population size estimations
were obtained in multilocus comparisons (Fig. 5),
which were much more informative than the single-
locus GMRF Skyride Plot, whose observation windows
were limited to much less than 500 000 years. Further,
our data suggests that the medians of the combined
data sets do not necessarily reflect the patterns found
in mtDNA-only GSP and nuclear EBSPs analysed
alone (e.g. non-CD WBA, Fig. 5). A possible explana-
tion is that combining fast and slow evolving markers
may be necessary to capture the greatest diversity of
events, because specific demographic events may be
concealed or revealed depending on which markers
capture them (Eytan & Hellberg 2010). However, com-
bining mtDNA and nuclear DNA is challenging
because of their strongly divergent substitution rates,
which are not well accommodated by some software.
Thus, accurate reconstructions of demographic oscilla-
tions predicted by the refuge hypothesis will likely
depend on the use of multilocus data sets and may
possibly improve by combining mtDNA and many
nDNA markers.
Divergence of WBA and SA, and implications for thespeciation process in antbirds
The WBA/SA species pair comprises an interesting
exception to most other closely related antbirds studied to
date. Vocalizations have been considered one of the most
important factors determining reproductive isolation
among thamnophilids (Isler et al. 1998). WBA and SA are
very similar in voice, and their parapatric distributions
present a sharp transition of phenotypes within a distance
of less than 20 km (Fig. 1). Considering that vocal differ-
ences are important to maintain species boundaries in
such a geographic setting, very similar vocalizations,
strong response to each other’s voice and plumage simi-
larities could lead to the prediction of little genetic diver-
gence and/or high levels of gene flow between those two
species. However, here, we found the opposite pattern,
namely deep genetic divergence associated with low or
nonexistent levels of gene flow. Thus, our results suggest
that conspicuous vocal differences may not be always nec-
essary to maintain species boundaries among antbirds,
and other kinds of cues may be especially important in
selected cases. Subtle vocal differences, which have been
shown to suffice both interspecific and individual recogni-
tion in Hypocnemis antbirds (Seddon & Tobias 2010), or
even visual cues (e.g. ochraceus-throated female WBA vs
white-throated female SA) or non-vocal behaviours could
be acting as strong prezygotic barriers. Alternatively,
genomic incompatibilities caused by millions of years of
divergence may have led to the development of mecha-
nisms of postzygotic isolation (Price 2007).
But how does the WBA/SA pair interact at its zone
of contact and what maintains their parapatry? Under a
scenario of complete reproductive isolation, very similar
ecological niches could be leading to competitive exclu-
sion, even after substantial genetic divergence (Rundell
& Price 2009; Weir & Price 2011). Alternatively, if repro-
ductive isolation is not yet complete, a very narrow and
still unidentified hybrid zone could exist, and strong
selective forces against hybrids could be preventing
substantial introgression and sympatry (Barton &
© 2013 John Wiley & Sons Ltd
14 F . RAPOSO DO AMARAL ET AL.

Hewitt 1985). Field and laboratory experiments, bioa-
coustic studies and genome-wide molecular surveys
with this species pair will provide exciting findings on
the development of reproductive isolation among
antbirds, and more generally, suboscine passerines.
Acknowledgements
We are especially thankful to D. Firme and C. Assis for their
outstanding help with key samples, unpublished data,
insightful discussions and field assistance. We are grateful to
A. C. Fazza, G. Mauricio, G. A. Silveira, H. Batalha, L. Lima,
T. Silva and V. Piacentini for their excellent field assistance.
We thank the following institutions for loaning samples:
Museu de Zoologia da Universidade de S~ao Paulo (L. F. Sil-
veira), Museu Nacional da UFRJ (M. Raposo), Colec�~ao de
tecidos da UFRJ (L. Gonzaga) and Universidade Federal de
Minas Gerais (Fabr�ıcio dos Santos). Special thanks to the
dozens of collectors that risked personal harm in the field to
obtain the tissue samples deposited in the later collections.
We acknowledge ICMBio for collection permits (14673, 15636,
18921) and logistics in the conservation units visited (P. N.
Serra dos �Org~aos, P. N. Capara�o, Rebio Mata Escura, P. N.
Chapada Diamantina, P. N. Serra da Bocaina), as well as the
private land owners for allowing collection in their properties
(in special RPPN Serra Bonita). G. Macedo generated the
sonograms and provided unpublished results on bioacoustics
of WBA and SA. Jeremy Minns and the Macaulay Library
provided WBA and SA recordings. G. Bravo provided unpub-
lished data on antbird relationships. J. Heled and J. Hey
helped with questions concerning BEAST and IMa2, respec-
tively. For helpful discussions and criticism, we thank M.
Manfrin, E. Borba, R. Brito, A. Wajntal, J. Y. Lee, K. C. M.
Pellegrino, S. Koehler, C. F. Schwertner, J. M. B. Alexandrino
and members of LGEMA/USP, in special M. M. Coelho and
F. D’Horta. I. Soltero and J. Y. Lee helped with laboratory
work. Special thanks to J. M. B. Alexandrino, three anony-
mous reviewers and editor P. Taberlet for excellent comments
and corrections on an earlier version of this manuscript.
Financial support was provided by FAPESP, CNPq, CAPES
(FRA and CYM) and NSF (SVE). This project benefited from
equipment donated to FRA by the ABA’s Birders’ Exchange
program. Part of this work was carried out using the
resources of the LCCA-Laboratory of Advanced Scientific
Computation of the University of S~ao Paulo. This study is
part of the NAP Bio Comp-USP.
References
Amaral FR, Sheldon FH, Gamauf A et al. (2009) Patterns and
processes of diversification in a widespread and ecologically
diverse avian group, the buteonine hawks (Aves, Accipitri-
dae). Molecular Phylogenetics and Evolution, 53, 703–715.Amaral FR, Piacentini VQ, Brito GRR, Curcio F (2012a) A sim-
ple and effective air shotgun for collecting small birds and
other vertebrates at close range. Journal of Field Ornithology,
83, 403–406.Amaral FR, Edwards SV, Miyaki CY (2012b) Eight anony-
mous nuclear loci for the squamate antbird (Myrmeciza
squamosa), cross-amplifiable in other species of typical ant-
birds (Aves, Thamnophilidae). Conservation Genetics
Resources, 4, 645–647.Amaro RC, Rodrigues MT, Yonenaga-Yassuda Y, Carnaval AC
(2012) Demographic processes in the montane Atlantic rain-
forest: molecular and cytogenetic evidence from the endemic
frog Proceratophrys boiei. Molecular Phylogenetics and Evolution,
62, 880–888.
Anderson CNK, Ramakrishnan U, Chan YL, Hadly EA (2005)
Serial SimCoal: a population genetics model for data from
multiple populations and points in time. Bioinformatics, 21,
1733–1734.
Barton NH, Hewitt GM (1985) Analysis of hybrid zones.
Annual Review of Ecology and Systematics, 16, 113–148.
Batalha-Filho H, Cabanne GS, Miaki CY (2012) Phylogeography
of an Atlantic Forest passerine reveals demographic stability
through the last glacial maximum. Molecular Phylogenetics
and Evolution, 65, 892–902.
Bates JM, Cadena CD, Tello JG, Brumfield RT (2008) Diversifi-
cation in the Neotropics: phylogenetic patterns and historical
processes. Ornitologia Neotropical, 19, 127–432.Beaumont MA (2008) Joint determination of topology, diver-
gence time, and immigration in population trees. In Simula-
tion, Genetics and Human Prehistory (eds Matsumura S,
Forster P, Renfrew C), pp. 134–154. McDonald Institute for
Archaeological Research, Cambridge.
Beaumont MA (2010) Approximate Bayesian Computation in
evolution and ecology. Annual Review of Ecology, Evolution,
and Systematics, 41, 379–406.
Beaumont MA, Zhang W, Balding DJ (2002) Approximate
Bayesian computation in population genetics. Genetics, 162,
2025–2035.Blum MGB, Franc�ois O (2009) Non-linear regression models
for Approximate Bayesian Computation. Statistics and Com-
puting, 20, 63–73.
Brito PH, Edwards SV (2009) Multilocus phylogeography and
phylogenetics using sequence-based markers. Genetica, 135,
439–455.Bruen TC, Philippe H, Bryant D (2006) A simple and robust
statistical test for detecting the presence of recombination.
Genetics, 172, 2665–2681.
Bruford MW, Hanotte O, Brookfield JFY, Burke T (1992) Multi
and single-locus DNA fingerprinting. In Molecular Genetic
Analysis of Populations: A Pratical Approach (eds Hoelzel AR),
pp. 225–269. IRL Press, Oxford.
Brumfield RT (2012) Inferring the origins of lowland neotropi-
cal birds. The Auk, 129, 367–376.
Brunes TO, Sequeira F, Haddad CF, Alexandrino J (2010) Gene
and species trees of a Neotropical group of treefrogs: Genetic
diversification in the Brazilian Atlantic Forest and the origin
of a polyploid species. Molecular Phylogenetics and Evolution,
57, 1120–1133.Burns KJ, Naoki K (2004) Molecular phylogenetics and bioge-
ography of Neotropical tanagers in the genus Tangara. Molec-
ular Phylogenetics and Evolution, 32, 838–854.
Bush MB (1994) Amazonian speciation: a necessarily complex
model. Journal of Biogeography, 21, 5–17.
Cabanne GS, Santos FS, Miyaki CY (2007) Phylogeography of
Xiphorhynchus fuscus (Passeriformes, Dendrocolaptidae):
vicariance and recent demographic expansion in southern
Atlantic forest. Biological Journal of the Linnean Society, 91, 73–
84.
© 2013 John Wiley & Sons Ltd
MULTILOCUS PHYLOGEOGRAPHY OF MYRMECIZA ANTBIRDS 15
Cabanne GS, d’Horta FM, Sari EH, Santos FR, Miyaki CY
(2008) Nuclear and mitochondrial phylogeography of the
Atlantic forest endemic Xiphorhynchus fuscus (Aves: Dendro-
colaptidae): biogeography and systematics implications.
Molecular Phylogenetics and Evolution, 49, 760–773.
Cabanne GS, D’Horta FM, Meyer D, Silva JMC, Miyaki CY
(2011) Evolution of Dendrocolaptes platyrostris (Aves: Furnarii-
dae) between the South American open vegetation corridor
and the Atlantic forest. Biological Journal of the Linnean Society,
103, 801–820.Carling MD, Brumfield RT (2007) Gene sampling strategies for
multilocus population estimates of genetic diversity (theta).
PLoS ONE, 2, e160.
Carnaval AC, Moritz C (2008) Historical climate modelling pre-
dicts patterns of current biodiversity in the Brazilian Atlantic
forest. Journal of Biogeography, 35, 1187–1201.Carnaval AC, Hickerson MJ, Haddad CFB, Rodrigues MT,
Moritz C (2009) Stability predicts genetic diversity in the
Brazilian Atlantic Forest hotspot. Science, 323, 785–789.
Chaves JC, Cuervo AM, Miller MJ, Cadena CD (2010) Revising
species limits in a group of Myrmeciza antbirds reveals a
cryptic species within M. laemosticta (Thamnophilidae). The
Condor, 112, 718–730.
Csill�ery K, Blum MGB, Gaggiotti OE, Franc�ois O (2010)
Approximate Bayesian Computation (ABC) in practice.
Trends in Ecology & Evolution, 25, 410–418.Csill�ery K, Franc�ois O, Blum MGB (2012) abc: an R package for
approximate Bayesian computation (ABC). Methods in Ecol-
ogy and Evolution, 3, 475–479.Derryberry EP, Claramunt S, Derryberry G et al. (2011) Lineage
diversification and morphological evolution in a large-scale
continental radiation: the Neotropical ovenbirds and wood-
creepers (Aves: Furnariidae). Evolution, 65, 2973–2986.D’Horta FM, Cabanne GS, Meyer D, Miyaki CY (2011) The
genetic effects of Late Quaternary climatic changes over a
tropical latitudinal gradient: diversification of an Atlantic
Forest passerine. Molecular Ecology, 20, 1923–1935.Edwards SV, Beerli P (2000) Perspective: gene divergence,
population divergence, and the variance in coalescence time
in phylogeographic studies. Evolution, 54, 1839–1854.
Ellegren H (2007) Molecular evolutionary genomics of birds.
Cytogenetics and Genome Research, 117, 120–130.
Excoffier L, Smouse PE, Quattro JM (1992) Analysis of molecu-
lar variance inferred from metric distances among DNA
haplotypes: application to human mitochondrial DNA
restriction data. Genetics, 131, 479–491.
Excoffier L, Novembre J, Schneider S (2000) SIMCOAL: a gen-
eral coalescent program for the simulation of molecular data
in interconnected populations with arbitrary demography.
The Journal of Heredity, 91, 506–509.
Excoffier L, Laval G, Schneider S (2005) Arlequin (version 3.0):
an integrated software package for population genetics data
analysis. Evolutionary Bioinformatics Online, 1, 47–50.Eytan RI, Hellberg ME (2010) Nuclear and mitochondrial
sequence data reveal and conceal different demographic
histories and population genetic processes in Caribbean reef
fishes. Evolution, 64, 3380–3397.Fitzpatrick SW, Brasileiro CA, Haddad CFB, Zamudio KR
(2009) Geographical variation in genetic structure of an
Atlantic Coastal Forest frog reveals regional differences in
habitat stability. Molecular Ecology, 18, 2877–2896.
Fleischer RC, McIntosh CE, Tarr CL (1998) Evolution on
a volcanic conveyor belt: using phylogeographic recon-
structions and K-Ar ages of the Hawaiian Islands to esti-
mate molecular evolutionary rates. Molecular Ecology, 7,
533–545.
Flot JF (2007) Champuru 1.0: a computer software for unravel-
ing mixtures of two DNA sequences of unequal lengths.
Molecular Ecology Notes, 7, 974–977.Flot JF, Tillier A, Samadi S, Tillier S (2006) Phase determination
from direct sequencing of length-variable DNA regions.
Molecular Ecology Notes, 6, 627–630.
Fu YX (1997) Statistical tests of neutrality of mutations against
population growth, hitchhiking and background Selection.
Genetics, 147, 915–925.Gonzaga LP, Carvalhaes AMP, Buzzetti DRC (2007) A new
species of Formicivora antwren from the Chapada Diamanti-
na, eastern Brazil (Aves: Passeriformes: Thamnophilidae).
Zootaxa, 1473, 25–44.Grazziotin FG, Monzel M, Echeverrigaray S, Bonatto SL
(2006) Phylogeography of the Bothrops jararaca complex
(Serpentes: Viperidae): past fragmentation and island colo-
nization in the Brazilian Atlantic Forest. Molecular Ecology,
15, 3969–3982.
Haffer J (1969) Speciation in Amazonian forest birds. Science,
165, 131–137.
Haffer J (1993) Time‘s cycle and time‘s arrow in the history of
Amazonia. Biogeographica, 69, 15–45.
Haffer J (1997) Alternative models of vertebrate speciation in
Amazonia: an overview. Biodiversity and Conservation, 6, 451–476.
Hall TA (1999) BioEdit: a user-friendly biological sequence
alignment editor and analysis program for Windows 95/98/
NT. Nucleic Acids Symposium Series, 41, 95–98.Hamilton G, Stoneking M, Excoffier L (2005) Molecular analy-
sis reveals tighter social regulation of immigration in patrilo-
cal populations than in matrilocal populations. Proceedings of
the National Academy of Sciences of the United States of America,
102, 7476–7480.
Harrigan RJ, Mazza ME, Sorenson MD (2008) Computation vs.
cloning: evaluation of two methods for haplotype determina-
tion. Molecular Ecology Resources, 8, 1239–1248.Hasegawa M, Kishino H, Yano T (1985) Dating of the human-
ape splitting by a molecular clock of mitochondrial DNA.
Journal of Molecular Evolution, 22, 160–174.
Heled J, Drummond AJ (2008) Bayesian inference of popula-
tion size history from multiple loci. BMC Evolutionary Biol-
ogy, 8, 289.
Hewitt GM (1999) Post-glacial re-colonization of European
biota. Biological Journal of the Linnean Society, 68, 87–112.Hey J (2010) Isolation with migration models for more than
two populations. Molecular Biology and Evolution, 27, 905–920.Hey J, Nielsen R (2007) Integration with the Felseinstein equa-
tion for improved Markov chain Monte Carlo methods in
population genetics. Proceedings of the National Academy of
Sciences USA, 104, 2785–2790.Hickerson MJ, Dolman G, Moritz C (2005) Comparative phy-
logeographic summary statistics for testing simultaneous
vicariance. Molecular Ecology, 15, 209–223.
Hickerson MJ, Stahl EA, Lessios HA (2006) Test for simulta-
neous divergence using approximate Bayesian computation.
Evolution, 60, 2435–2453.
© 2013 John Wiley & Sons Ltd
16 F . RAPOSO DO AMARAL ET AL.

Hickerson MJ, Carstens BC, Cavender-Bares J et al. (2010) Phy-
logeography’s past, present, and future: 10 years after.
Molecular Phylogenetics and Evolution, 54, 291–301.
Hoorn C, Wesselingh FP, ter Steege H et al. (2010) Amazonia
through time: Andean uplift, climate change, landscape evo-
lution, and biodiversity. Science, 330, 927–931.Hubisz MJ, Falush D, Stephens M, Pritchard JK (2009)
Inferring weak population structure with the assistance of
sample group information. Molecular Ecology Resources, 9,
1322–1332.Hudson RR, Kaplan NL (1985) Statistical properties of the
number of recombination events in the history of a sample
of DNA sequences. Genetics, 111, 147–164.
Hudson RR, Slatkin M, Maddison WP (2002) Estimation of
levels of gene flow from DNA sequence data. Genetics, 132,
583–589.Huson DH, Bryant D (2006) Application of phylogenetic net-
works in evolutionary studies. Molecular Biology and Evolu-
tion, 23, 254–267.
Isler ML, Isler PR, Whitney BM (1998) Use of vocalizations to
establish species limits in antbirds (Passeriformes : Thamno-
philidae). The Auk, 115, 577–590.Jakobsson M, Rosenberg NA (2007) CLUMPP: a cluster match-
ing and permutation program for dealing with label switch-
ing and multimodality in analysis of population structure.
Bioinformatics, 23, 1801–1806.Kass RE, Raftery AE (1995) Bayes factors. Journal of the Ameri-
can Statistical Association, 90, 773–795.
Larkin MA, Blackshields G, Brown NP et al. (2007) Clustal W
and Clustal X version 2.0. Bioinformatics, 23, 2947–2948.
Lee JY, Edwards SV (2008) Divergence across Australia’s
Carpentarian Barrier: statistical phylogeography of the red-
backed fairy wren (Malurus melanocephalus). Evolution, 62,
3117–3134.
Librado P, Rozas J (2009) DnaSP v5: a software for comprehen-
sive analysis of DNA polymorphism data. Bioinformatics, 25,
1451–1452.Lovette IJ (2004) Mitochondrial dating and mixed support for
the “2% rule” in birds. The Auk, 121, 1–6.Maldonado-Coelho M (2012) Climatic oscillations shape the
phylogeographical structure of Atlantic Forest fire-eye ant-
birds (Aves: Thamnophilidae). Biological Journal of the Linnean
Society, 105, 900–924.Martins FM (2011) Historical biogeography of the Brazilian
Atlantic forest and the stability-extinction model of Pleisto-
cene refuges: what do phylogeographical studies tell us?
Biological Journal of the Linnean Society, 104, 499–509.Martins FM, Templeton AR, Pavan AC, Kohlbach BC, Morgan-
te JS (2009) Phylogeography of the common vampire bat
(Desmodus rotundus): marked population structure, Neotropi-
cal Pleistocene vicariance and incongruence between nuclear
and mtDNA markers. BMC Evolutionary Biology, 9, 294.
Mata H, Fontana CS, Mauricio GN et al. (2009) Molecular phy-
logeny and biogeography of the eastern Tapaculos (Aves:
Rhinocryptidae: Scytalopus, Eleoscytalopus): cryptic diversifi-
cation in Brazilian Atlantic Forest. Molecular Phylogenetics and
Evolution, 53, 450–462.Minin VN, Bloomquist EW, Suchard MA (2008) Smooth sky-
ride through a rough skyline: Bayesian coalescent-based
inference of population dynamics. Molecular Biology and Evo-
lution, 25, 1459–1471.
Moritz C, Patton JL, Schneider CJ, Smith TB (2000) Diversifica-
tion of rainforest faunas: an Integrated Molecular Approach.
Annual Review of Ecology and Systematics, 31, 533–563.
Moritz C, Hoskin CJ, MacKenzie JB et al. (2009) Identification
and dynamics of a cryptic suture zone in tropical rainforest.
Proceedings of the Royal Society of London B, 276, 1235–1244.Myers N, Mittermeier RA, Mittermeier CG, da Fonseca GA,
Kent J (2000) Biodiversity hotspots for conservation priori-
ties. Nature, 403, 853–858.
Nielsen R, Wakeley J (2001) Distinguishing migration from iso-
lation: a Markov chain Monte Carlo approach. Genetics, 158,
885–896.Pellegrino KCM, Rodrigues MT, Waite AN et al. (2005) Phylog-
eography and species limits in the Gymnodactylus darwinii
complex (Gekkonidae, Squamata): genetic structure coincides
with river systems in the Brazilian Atlantic Forest. Biological
Journal of the Linnean Society, 85, 13–26.
Petri S, F�ulfaro VJ (1983) Geologia do Brasil – Faneroz�oico. Editora
da Universidade de S~ao Paulo, S~ao Paulo.
Porto TJ, Carnaval AC, da Rocha PLB (2013) Evaluating forest
refuges models using species distribution models, model fill-
ing and inclusion: a case study with 14 Brazilian species.
Diversity and Distributions, 19, 330–340.
Price T (2007) Speciation in Birds, Roberts and Company Pub-
lishers, Greenwood Village, Colorado.
Pritchard JK, Stephens M, Donnelly P (2000) Inference of popu-
lation structure using multilocus genotype data. Genetics,
155, 945–959.
R Development Core Team (2013) R: A Language and Environ-
ment for Statistical Computing, pp. ISBN 3-900051-900007-
900050. R Foundation for Statistical Computing, Vienna,
Austria. http://www.R-project.org/.
Ramos-Onsins SE, Rozas J (2002) Statistical properties of new
neutrality tests against population growth. Molecular Biology
and Evolution, 19, 2092–2100.Ribeiro MC, Metzger JP, Martensen AC, Ponzoni FJ, Hirota
MM (2009) The Brazilian Atlantic Forest: how much is
left, and how is the remaining forest distributed? Implica-
tions for conservation. Biological Conservation, 142, 1141–1153.
Ridgely RS, Tudor G (2009) Field Guide to the Songbirds of South
America, University of Texas Press, Austin.
Rizzini CT (1997) Tratado de fitogeografia do Brasil, Editora€Ambito Cultural, Rio de Janeiro.
Robert CP (2007) The Bayesian Choice, From Decision-Theoretic
Foundations to Computational Implementation, 2nd edn.
Springer, Berlin. 2001.
Rull V (2008) Speciation timing and neotropical biodiversity:
the Tertiary-Quaternary debate in the light of molecular phy-
logenetic evidence. Molecular Ecology, 17, 2722–2729.
Rundell RJ, Price TD (2009) Adaptive radiation, nonadaptive
radiation, ecological speciation and nonecological speciation.
Trends in Ecology & Evolution, 24, 394–399.Russello MA, Amato G (2004) A molecular phylogeny of Ama-
zona: implications for Neotropical parrot biogeography, tax-
onomy, and conservation. Molecular Phylogenetics and
Evolution, 30, 421–437.Seddon N, Tobias JA (2010) Character displacement from the
receiver’s perspective: species and mate recognition despite
convergent signals in suboscine birds. Proceedings of the Royal
Society of London B, 277, 2475–2483.
© 2013 John Wiley & Sons Ltd
MULTILOCUS PHYLOGEOGRAPHY OF MYRMECIZA ANTBIRDS 17

Silva JMC, Straube FC (1996) Systematics and biogeography of
scaled woodcreepers (Aves: Dendrocolaptidae). Studies on
Neotropical Fauna and Environment, 31, 3–10.
Silva JMC, Sousa MC, Castelletti CHM (2004) Areas of ende-
mism for passerine birds in the Atlantic forest, South Amer-
ica. Global Ecology and Biogeography, 13, 85–92.Stephens M, Donnelly P (2003) A comparison of Bayesian
methods for haplotype reconstruction from population
genotype data. American Journal of Human Genetics, 73,
1162–1169.Stotz DF, Fitzpatrick JW, Parker Iii TA, Moskovits DK (1996)
Neotropical Birds: Ecology and Conservation, University of
Chicago Press, Chicago, Illinois.
Sung W, Ackerman MS, Miller SF, Doak TG, Lynch M
(2012) Drift-barrier hypothesis and mutation-rate evolution.
Proceeding of the National Academy of Science, 109, 18488–18492.
Tajima F (1989) Statistical method for testing the neutral muta-
tion hypothesis by DNA polymorphism. Genetics, 123, 585–
595.
Tavar�e S, Balding DJ, Griffiths RC, Donnelly P (1997) Inferring
coalescence times from DNA sequence data. Genetics, 145,
505–518.
Tavares ES, Baker AJ, Pereira SL, Miyaki CY (2006) Phyloge-
netic relationships and historical biogeography of Neotropi-
cal parrots (Psittaciformes: Psittacidae: Arini) inferred from
mitochondrial and nuclear DNA sequences. Systematic Biol-
ogy, 55, 454–470.
Tchaicka L, Eizirik E, De Oliveira TG, Candido JF Jr, Freitas
TR (2007) Phylogeography and population history of the
crab-eating fox (Cerdocyon thous). Molecular Ecology, 16, 819–838.
Thom�e MT, Zamudio KR, Giovanelli JG et al. (2010) Phylogeog-
raphy of endemic toads and post-Pliocene persistence of the
Brazilian Atlantic Forest. Molecular Phylogenetics and Evolu-
tion, 55, 1018–1031.
Tsai YHE, Carstens BC (2013) Assessing model fit in phylogeo-
graphical investigations: an example from the North Ameri-
can sandbar willow Salix melanopsis. Journal of Biogeography,
40, 131–141.
Vanzolini PE, Williams EE (1970) South American anoles: the
geographic differentiation and evolution of the Anolis chrysol-
epis species group (Sauria, Iguanidae). Arquivos de Zoologia do
Estado de S~ao Paulo, 19, 1–298.
Wallace AR (1852) On the monkeys of the Amazon. Proceedings
of the Zoological Society of London, 20, 107–110.
Weir JT, Price TD (2011) Limits to speciation inferred from
times to secondary sympatry and ages of hybridizing species
along a latitudinal gradient. The American Naturalist, 177,
462–469.
Zimmer KJ, Isler ML (2003) Family Thamnophilidae. In: Hand-
book of the Birds of the World. Vol. 8: Broadbills to Tapaculos.
(eds. del Hoyo J, Elliot A, Christie DA). Lynx Editions,
Barcelona.
F.R.A., P.K.A., S.V.E. and C.Y.M. conceived and drafted
the manuscript. F.R.A. performed field and laboratory
work. F.R.A., P.K.A. and S.V.E. performed data analy-
ses. F.R.A., S.V.E. and C.Y.M. contributed with
reagents.
Data accessibility
DNA sequences: GenBank accessions KC714092-
KC715586
IMa2 and STRUCTURE input files: Dryad doi:10.
5061/dryad.86hf6
Supporting information
Additional supporting information may be found in the online ver-
sion of this article.
Fig. S1 Sonograms of loudsongs and calls of SA (a and b) and
WBA (c and d).
Fig. S2 Complete set of STRUCTURE runs.
Fig. S3 Model checking after model selection and parameter
estimation in Approximate Bayesian Computation (ABC).
Table S1 Samples used in the present study.
Table S2 Mitochondrial PCR primers used for amplification
and sequencing.
Table S3 PCR primers used for allele-specific PCR (AS-PCR).
Table S4 Conversion of Isolation-with-Migration parameters
(population size and divergence times) based on different sub-
stitution rates obtained from the literature.
Table S5 Observed summary statistics used for Approximate
Bayesian Computation (ABC).
Appendix S1 Details of ABC analysis.
© 2013 John Wiley & Sons Ltd
18 F . RAPOSO DO AMARAL ET AL.
Top Related
Copyright © 2022 FDOKUMEN

