


Bahasa
Halaman
Hukum

MEASURING THE PERFORMANCE OF ITALIAN REGIONS ON SOCIAL AND ECONOMIC DIMENSIONS
Miranda Cuffaro*1 Maria Francesca Cracolici*†2 and Peter Nijkamp†
*Department of National Accounting and Analysis of Social Processes University of Palermo Palermo Italy
[email protected] [email protected]
†Department of Spatial Economics Free University Amsterdam The Netherlands
[email protected] pn244mcmc
Abstract This paper presents a new analytical framework for assessing spatial disparities among
regions. On the premise that the analysis of a region’s performance cannot be limited solely to either economic or social aspects, the paper attempts to combine the material (i.e. economic) and immaterial (i.e. social) aspects of welfare and well-being in an integrated logical scheme.
In this scheme the economic aspects of living standards are represented by various categories of consumption expenditure, whilst the social aspects are represented by appropriate indicators of health, education, labour market conditions, etc. The framework proposed is also appealing for convergence analyses over time. From a time perspective, introducing this joint socio-economic concept into the analysis of differences among countries allows one to disentangle the notion of convergence into its economic and social dimensions.
An empirical analysis is conducted on the Italian regions for the period from 1980 to 2005. The empirical results obtained by Principal Component Analysis show that, on average, a high level of economic welfare may contrast with a high level of social well-being. Keywords: Socio-economic well-being, living standards, consumption JEL-classification code: P46 La valutazione della Performance delle Regioni Italiane attraverso dimensioni Sociali ed Economiche. Il presente contributo propone uno schema operazionale per l’analisi empirica delle disparità di sviluppo tra paesi e/o regioni. Lo schema si basa sull’ipotesi che nella valutazione della performance di un’area territoriale occorre riferirsi sia ad aspetti economici che sociali di una collettività residente. Lo schema si presta sia ad una lettura statica che dinamica e propone un set di indicatori specifici di ambedue le dimensioni Un’applicazione empirica è riportata relativamente alle regioni italiane per gli anni compresi fra il 1980 e il 2005. I risultati ottenuti mostrano che regioni con alto benessere economico e basso benessere sociale si contrappongono nettamente a quelle con basso benessere economico e alto benessere sociale.
1. Introduction Most international comparisons among the economic performances of countries or
regions assess their levels of development (or growth) in terms of gross domestic product (GDP). It is noteworthy that this approach has been strongly criticized. As the World Bank has written: ‘The basic objective of development is to create an enabling environment for people to enjoy long, healthy and creative lives. … But it is often forgotten in the immediate concern with the accumulation of commodities and financial wealth’. (World Bank, 2001, p. 9). This standard view has frequently prompted much criticism based on the observation that the standard GDP index is unable to capture the different – sometimes mutually contrasting – dimensions of well-being and welfare. GDP is at best only a partial measure (or proxy) of a multi-dimensional concept of human living standards (see Sen, 1985, 1987; Khan, 1991; Dasgupta, 1990).
In recent years, a new strand in the literature has paid specific attention to aspects of growth, convergence and well-being. An original and stimulating study has been that by Hobijn and Franses (2001), who direct the attention of economists to the need to extend the evaluation of a country’s performance to encompass measures of living standards. They have thus re-addressed the convergence issue so prominent in the economic growth literature and presented evidence that convergence in GDP does not necessarily imply convergence in living standards, the latter being defined by daily calorie supply, protein calorie supply, infant mortality, life expectancy at birth, and so forth.
The concept of ‘living standard’ should be interpreted in a broad sense, as justified inter alia by the following statement: ‘people derive utility or well-being not merely from the command over income alone’ (Neumayer, 2003, p. 276). This observation takes it for granted that living standards are composed of both economic and social well-being constituents. Indeed, an increase in per-capita GDP is a basic prerequisite for improvement in the living standards of a population; consequently, an increase in living standards implies enhancement of not only the economic but also the social aspects of living, viz.: better health services, more secure livelihoods, greater access to education, better working conditions, security against crime, more satisfying leisure time, etc.
In our view, and in accordance with the above considerations, the analysis of a country’s performance cannot be limited solely to either economic or social aspects. Both aspects must be considered simultaneously, and within a consistent framework.
Only a few, albeit remarkable, attempts in this regard are to be found in the literature. The first is the World Bank’s Human Development Index (HDI), a composite indicator based on the GDP per capita, life expectancy at birth, and the adult literacy rate (UNDP, 1990). These represent three main aspects of an individuals life: respectively, access to resources, health conditions, and the opportunity to enjoy a basic education.
1
Although the HDI is the most frequently used measure of development differentials among countries, it has been much criticised, and with particular regard to the simple weighting of each variable, and the high correlation between GDP and certain background variables.
In light of these considerations, in what follows we shall propose a scheme where a region’s performance is viewed as its ability to provide its citizens with proper opportunities to enjoy high living standards in terms of material and immaterial well-being. According to Osberg and Sharpe (2002), well-being may be described along at least three distinct dimensions: material, immaterial and emotional attributes. Here we refer only to the first two of these dimensions: the material and immaterial features of a society. We shall term the material dimension ‘economic well-being’ (EWB) and the immaterial dimension ‘social well-being’ (SWB). The development literature considers the former dimension to be ‘access to resources’, while SWB denotes social aspects of life such as health, education, labour market conditions, etc. (UNDP, 1997).
Our study proposes a new approach to measuring differences among regions which is based on simultaneous consideration of the economic and social aspects of welfare. More specifically, our approach seeks to assess a region’s ability to improve its EWB as a stepping stone to an increase in the level of its multi-faceted SWB as well. The combined assessment of EWB and SWB will then serve as a proxy for the socio-economic performance of this region. From a dynamic time perspective, analysis of a country’s socio-economic performance over time also makes it possible to address socio-economic convergence, instead of economic convergence alone.
The different aspects – social and economic – of regional performance, and the rationale followed here in evaluating the levels of socio-economic development of Italian regions will be synthesized into an operational scheme presented in Section 2. Section 3 describes some relevant economic and social variables included in our analysis. This description will be followed by presentation of the empirical results. Finally, some concluding remarks are made in Section 4. 2. Socio-economic Performance and Convergence: a Proposal 2.1 Economic and social performance
As said, GDP per capita is a very limited measure of the level of a region’s performance, for it does not consider the consequences of economic development on the lives of people (e.g. air, sea and water pollution, increases in certain rare diseases, congestion, cost of urbanization, etc.), and it does not capture the real conditions of well-being.
In 1973 Kuznets made this challenging assertion: “the most distinctive feature of modern economic growth is the combination of a high rate of aggregate growth with disrupting effects and new problems” (Kuznets, 1973, p.257). This statement implies that the
2
national accounting framework should be expanded so that it considers both certain costs (i.e. pollution, urban concentration, commuting, etc.) and positive returns (i.e., better health, greater longevity, more leisure, less income inequality, etc.).
In light of these suggestions, the economic literature has proposed different measures of a region’s or country’s performance. The one most widely used is the HDI based on a concept of human development involving both an economic dimension, measured by GDP per capita, and a dimension linked mainly to social aspects and measured by life expectancy and the literacy rate.
Yet, after the first Report on HDI (UNDP, 1990), many criticisms were made of the index. Indeed, it has sometimes even been considered a redundant indicator that provides little additional information on intercountry development levels with respect to traditional GDP (McGillivray, 1991; Desai, 1991; Dasgupta and Weale, 1992; Sagar and Najam, 1998). Nevertheless, the framework for calculating the index has remained substantially unchanged in the UNDP’s subsequent annual reports; only some corrections have been made to take account of gender differentials or income distribution.
The specific literature of the 1990s comprised a number of critical proposals for improvement of the HDI. For example, since the indicators of the three dimensions of HDI were closely correlated, a principal component method was proposed in order to deploy a linear combination of these indicators (Noorbakhsh, 1998; McGilivray, 1991). Moreover, Sagar and Najam (1998) proposed a more in-depth revision of HDI involving multiplication of the three component variables instead of the arithmetic average, a logarithmic treatment of GDP, and the incorporation of an inequity measure into the index. In fact, only the second Report calculated the distribution-adjusted HDI for 53 countries (UNDP, 1991, pp.17-18) and this was available until 1994; whilst since that year the distribution-adjusted HDI has been omitted.
Notwithstanding its limitations, the HDI is particularly relevant to developing countries, where the basic dimensions depicted by the three indicators have not yet been fully accomplished. In the developed countries, by contrast, a decent standard of living, longevity and primary education have been achieved by most people. Consequently, multiple significant indicators which take account of the different aspects of living appear necessary.
More recently, Marchante and Ortega (2006), in a study conducted to measure the quality of life and economic convergence across Spanish regions, have used an alternative augmented composite indicator (AHDI) in the context of HDI. When constructing this composite index, they considered alternatively three different per-capita income measures (total personal income minus grants, GVA, and total disposable income) and six quality of life indicators (life expectancy at birth, infant survival rate, the probability at birth of surviving to the age of 60, the adult literacy rate, the mean years of schooling of the working age population, and the long-term unemployment rate). Moreover, Marchante and Ortega applied
3
an averaged arithmetic mean scheme with (arbitrary) weights for the variables transformed by an achievement index.
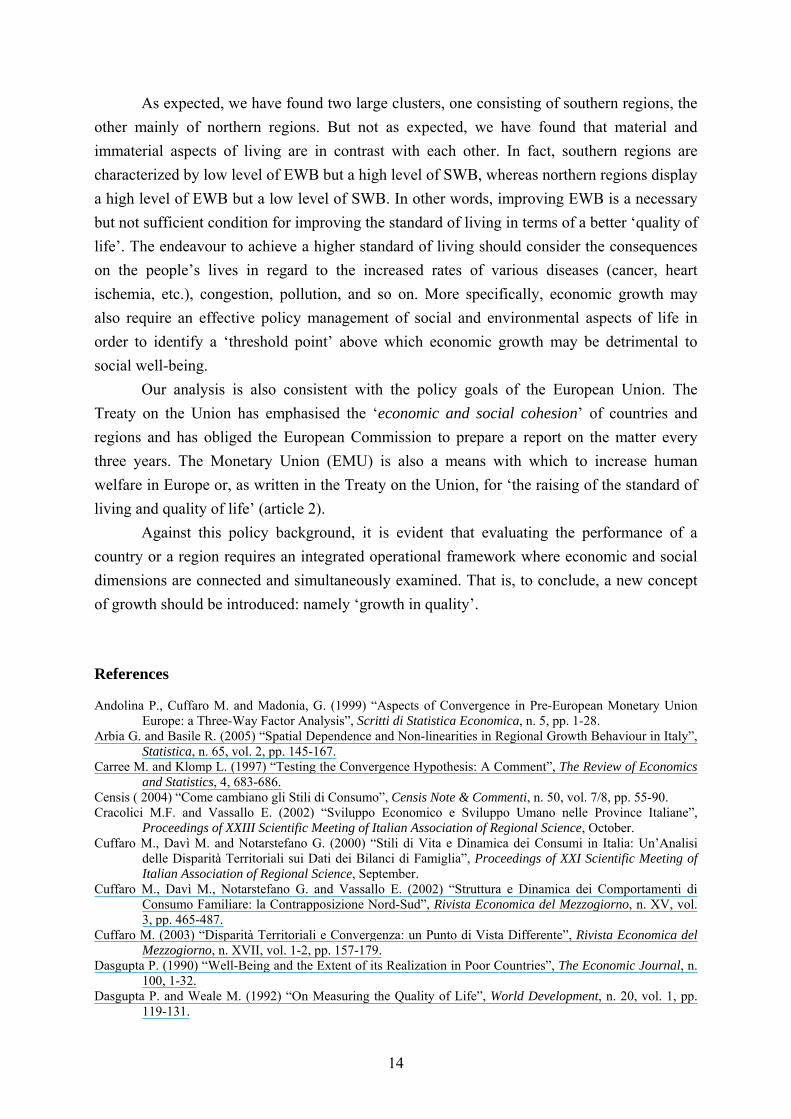
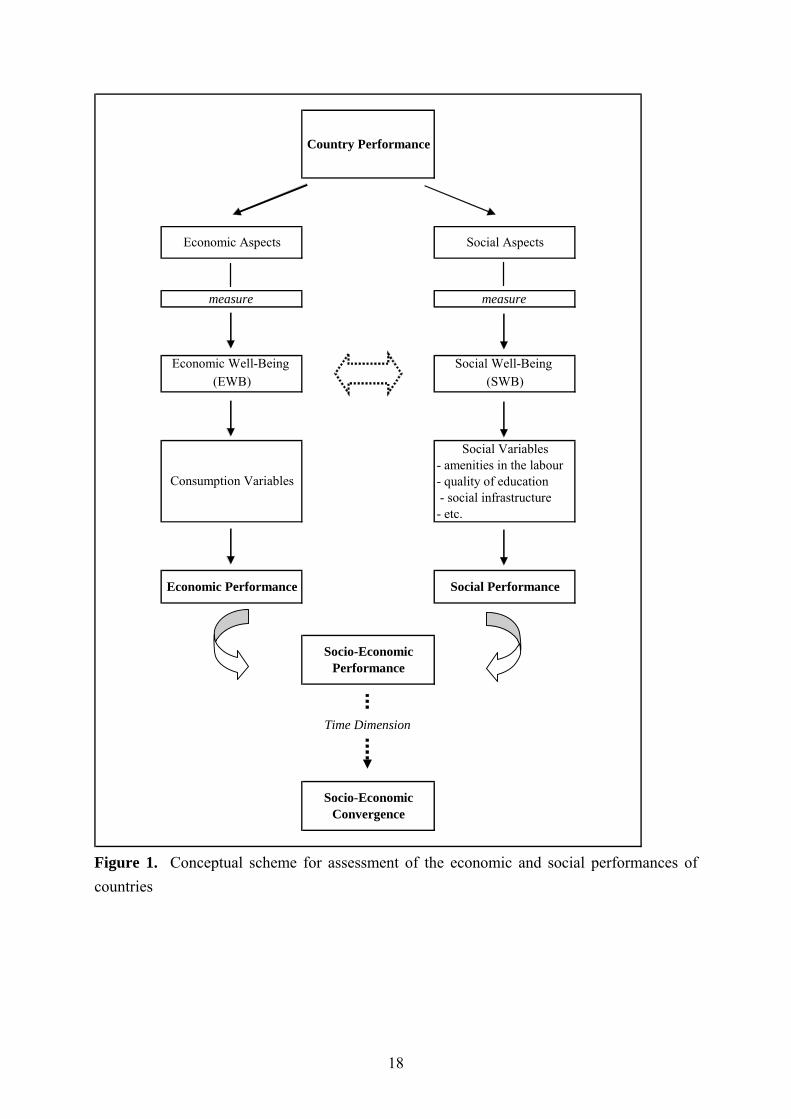
In our view, an endeavour to combine the economic and social aspects of a country’s performance and to link static and dynamic analysis requires a general framework like the one depicted in Figure 1. This has been inspired by Sen’s development theory, according to which a country’s development is a matter not only of long-run economic growth but also of opportunities for people, in both the high and low growth cycle (Sen, 1984).
<<Insert figure 1 about here>>
In this scheme the economic and social macro-aspects of a country’s (or region’s)
performance are measured by well-being, which is decomposed into economic (EWB) and social (SWB). The concept of well-being is intrinsically based on micro-economic utility theory and concerns the living conditions of persons. More specifically, in a developing economy, EWB represents the basic conditions for improvement in SWB; on the other hand, in a developed economy EWB and SWB may be two well-being indicators that run – and grow – in parallel.
Because our concern is with a developed economy, a combined assessment of EWB and SWB yields a proxy for the socio-economic performance of a region. For in the long run the direction of the causal relationship between EWB and SWB may reveal two paths. EWB contributes to SWB through households, firms and the public sector . It does so through households because they spend a higher proportion of their incomes on education, health and culture; through firms because they devote a higher proportion of their profits to a safer labour environment, R&D to control pollution, etc.; and through the government because it allocates a higher proportion of its resources to education, health, and the environment. Conversely, SWB contributes to EWB through various channels. For example, high levels of health and education raise the productivity of workers, facilitate the acquisition of skills, and promote technological progress and ICT usage. In their turn, these factors help significantly to increase the level of output (and also its composition), exports, and per capita disposable income.
More specifically, a high level of EWB should support the formation of a high level of such human capabilities as improved health or knowledge. Improving human capabilities means increasing the efficiency of the use made by people of their achieved capabilities for work or leisure (UNDP, 1997).
The framework depicted in Figure 1 was originally designed for the analysis of country performance differentials. But it can be straightforwardly adjusted to a lower spatial scale by using suitable regional indicators. Moreover, the scheme is suitable for both static and a dynamic analysis. In fact, from a dynamic perspective, analysis of a country’s socio-
4
economic performance over time makes it possible to address socio-economic convergence, instead of economic convergence alone.
2.2 Economic and social convergence
In economic theory, ‘economic convergence’ refers to the narrowing of the gap between rich and poor countries and is associated with indicators of a country’s well-being – traditionally, GDP or labour productivity. In this study we focus on consumption as an appropriate statistical measure and proxy for economic well-being. It is widely believed that advanced economies are characterized by a consumer culture in which what goods and services people consume and how they do so represent their identities and influence their interactions with others (i.e. demonstrative or conspicuous consumption).
Contemporary society is indeed more consumption-driven than production-led, and as a consequence social and economic changes can be identified through consumption patterns. The notion of ‘standard of living’ refers, in fact, to different aspects of a typical household’s everyday life that can be adequately approximated by spending on different categories of goods and services. We may thus state that total consumption, decomposed into different categories, mirrors – better than income – the real conditions of a population with regard to its basic needs (food, clothing and housing), services (health care, education, transport and communication), recreation, and luxury goods. Moreover, some expenditures, due to their high variability among countries, can be seen as statistical measures with which to map out differences.
The use of consumption variables to analyse spatial differences and time convergence is justified by our previous studies, which demonstrate, for the Italian regions, that convergence in GDP is not associated with convergence in consumption. For example, Cuffaro et al. (2000) used the share of luxury expenditure in total consumption as a proxy for economic well-being. The results, obtained from a panel of households over the period 1980-1996 by a panel unit-root test, indicated that convergence in well-being had occurred only for households in the northern regions. A different statistical analysis performed on macro data and on four broad categories of consumption – food, housing, clothes, and other items – indicated a weak convergence on housing and clothes over the period 1970-1981. The same was found for the period 1981-1995 in regard to other items – recreation, entertainment, luxury goods, and so on – but not for food, which exhibited strong divergence (Cuffaro et al., 2002; Cuffaro, 2003).
As far as we know, there is no generally accepted definition of ‘social convergence’. To be noted, however, is that the recent literature on growth often stresses social aspects of well-being and uses social well-being and quality of life as interchangeable concepts. There follow some examples from the literature.
Easterly (1999) found that a wide variety of indicators show that the quality of life across countries is positively associated with per-capita income. The indicators cover different
5
aspects, such as individual rights, political instability, education, health, transportation and communication, and inequality across class and gender.
Cracolici and Vassallo (2002) defined a quality of life index for 103 Italian regions using diverse indicators: the number of newspapers per 1000 inhabitants; per-capita average regional public spending on entertainment and cultural events; the ratio between the female and male activity rates: the youth unemployment rate; the ratio between banking investments and deposits; and social and economic infrastructures. Delhey et al. (2002) proposed a new instrument with which to monitor and systematically analyze the current state and changes in living conditions and the quality of life in Europe. They combined indicators of objective living conditions (e.g. income), subjective well-being (e.g. income satisfaction) and quality of society (e.g. income distribution).
Finally, in the convergence literature, Hobijn and Franses (2001) considered four social indicators: daily protein, calorie supply, infant mortality rate, and life expectancy at birth. Thereafter Neumayer (2003) tested for convergence in a wide range of basic aspects of living standards, namely life expectancy, infant survival, education enrolment, literacy, telephone and television availability. More recently, Giles and Feng (2005) have considered five measures of social well-being, namely life expectancy, the Gini index of income inequality, the poverty rate, the tertiary education participation rate, and CO2 emissions.
It is evident from the above studies that although the concept of social convergence is not used explicitly, it is implicit in many empirical frameworks and in the search for suitable indicators. This is confirmed by the following statement: ‘social convergence will occur if conditions in various aspects of social life (for example, amenities in the labour market, quality of education, leisure activities, social infrastructure, conditions in the labour market and in the wider society, etc.) tend to improve faster in the countries where they are below average’ (Andolina et al., 1999, pp. 5-6). Given that a higher standard of social life is usually associated with higher levels of economic well-being, social convergence may be conceived as a consequence of economic convergence. However, this is not necessarily the case, because a high level of, say, income, may be concentrated among a small proportion of the population and thus accompanied by high unemployment in the same country and/or a high proportion of the labour force in insecure and low-paid jobs. Moreover, high incomes notwithstanding, social infrastructures may still be insufficient for most of the population, or badly organized in some regions (or countries) compared to others. In other words, high levels of income may be a necessary condition for social convergence, but countries with high levels of income do not necessarily achieve a good performance in such convergence. In other words, high levels of income may support ‘growth in quality’ (see e.g. Cracolici and Vassallo 2002). One way to analyse the relevance of growth in quality is to assess the extent to which good economic performance contributes to a country’s social well-being; but this requires more in-depth analysis. In the next section, we present an empirical analysis of Italian regions for the period 1980-2002.
6
3. Data and Empirical Results In order to evaluate the socio-economic performance of regions, we initially measure
the two different aspects of well-being (EWB and SWB). Our aim is to verify whether or not the hypothesis of economic convergence embodies social convergence. We first conduct separate analysis of economic and social well-being over time in terms of σ-convergence. Then, in order to evaluate the performance of regions, we carry out an integrated analysis of economic and social aspects.
Subsections 3.1 and 3.2 present some separate and distinct indicators of economic and social regional performance. After that, a factor analysis will be used. 3.1 Economic indicators
With regard to EWB, the most common variable used in the literature is GDP. Clearly, GDP – as many scholars have convincingly demonstrated – is unable to capture the real economic performance of a country in terms of economic well-being. In fact, because well-being is a concept closely related to individual perceptions and feelings, it seems plausible that a measure focused on the demand side fits EWB better than one focused on the supply side. But which measure should one use? Here some measurable and relevant categories of total household consumption can be employed. Our view is that some categories of total consumption quite accurately mirror the increase in income, change in lifestyles, change in labour-market conditions and family organization, change in technology, etc. It should be stressed, however, that a rise in EWB implies both an increase in consumption levels (for specific categories) and a change in the consumption basket. In particular, according to Engel’s law, an increase in income normally implies a change in the composition of a consumption basket in favour of non-primary (e.g. luxury) goods.
For our empirical analysis with respect to economic aspects, we used the Svimez data on Italian household consumption for 1980 and 2002, relative to 20 regions. The numerous categories of expenditure were split into three groups. The first group (G1) comprised expenditures on food products such as beverages, meat, bread, cereals etc. The second group (G2) included such living expenses as housing, energy, transport and communication, clothing, and medical care. Finally, the third group (G3) consisted of ‘non-necessary’ (discretionary) expenses such as those for cultural, educational and entertainment activities.
3.2 Social indicators
In order to evaluate SWB, we had to assess indicators reflecting different aspects of the phenomenon, such as conditions in the labour market, quality of education, social infrastructure, health conditions, etc. This required extensive and comparable data bases.
7
Which indicators to choose was not immediately obvious at the outset, because the decision also depended on the main features of the countries analyzed: for instance, whether they were developed or developing. The above-mentioned studies do not devote much attention to this problem. For example, the indicators chosen by Hobijn and Franses (2001) – who analyse both developed and developing countries simultaneously – can well discriminate between the two groups of countries, but they fail to take account of different levels of well-being within developed countries. In fact, when measured on these indicators, developed countries are quite homogeneous.
Following the suggestions in the specialized literature (see e.g. Marchante and Ortega, 2006; Royuela and Artís, 2006) and the OECD guidelines on social indicators, we selected a systematic set of suitable regional indicators for our analysis. In particular, the OECD – in its inter-countries comparisons – lists eight broad categories of social indicators with which to represent well-being: health, education and learning, employment and quality of working life, time and leisure, command over goods and services, physical environment, social environment, and social safety1 (OECD, 1982). The indicators used in our empirical analysis were selected as the basis of the above broad categories, considering that Italy is a country with both a high level of development and a persistent disparity among regions.
In brief, our main criterion of choice was that we should be able to represent the differences among Italian regions by means of indicators with high levels of relative heterogeneity among regions, but avoiding possible redundant statistical information.
Based on the availability of data, here we consider some main components of SWB: health and nourishment, education, and work. Out empirical analysis of social aspects, in contrast to economic aspects, unfortunately covered a shorter and variable time period owing to a lack of data. In particular, we used on average 10 years running from 1989 to 2005 and employed the following ISTAT (2006) social indicators: the share of resident foreigners (X1); the cancer mortality rate (X2); the heart ischemia mortality rate (X3); the suicide rate (X4); the share of persons aged 3-14 consuming a suitable breakfast (X5); the share of persons aged 35-44 who eat fish on some occasions during the week (X6); the life expectancy of males at 15 and 45 years old (respectively, X7 and X8); life expectancy of females at 15 and 45 years old (respectively, X9 and X10); rate of health structures per 100,000 inhabitants (X11); share of high school diploma-holders in the total population (X12); and female labour force over the female population (X13). X1 is a proxy of regional attractiveness. Variables X2-X6 indirectly measure the physical and social environment in terms of pollution, diet and lifestyle, precautionary habits to prevent diseases, etc. Variables X7-X10 are proxies of overall health conditions (UNDP, 1997); they are the main dimensions of SWB, and as Ram and Schultz (1979) pointed out ‘the satisfaction (utility) that people derive from a longer life span must be substantial’(p. 402). 1 It is interesting to note that the last OECD report (2006) reduces these categories to five: general context, self-sufficiency, equity, health, and social cohesion.
8
More specifically, variables X2-X10 were chosen in order to take account of the overall living conditions of populations as represented not only by the traditional indicators of health (e.g., mortality rates) but also by variables reflecting the healthiness of the life and job environment, and a healthy diet. Specifically, X5 and X6, as proxies of nutrition styles, capture geo-cultural regional differences rather well and can be integrated with information on material well-being. By means of these indicators we took account of malnutrition effects related to obesity, and unbalanced dietary and lifestyle practices that result in chronic diseases such as diabetes, cancer, high cholesterol rates, etc. (WHO, 2005).
It is noteworthy that, as pointed out by Neumayer (2003), the inclusion of tailor-made variables (X5-X10) for specific age groups should enrich the empirical analysis of living standards – or socio-economic well-being in our case.
Finally, variables X12 and X13 represent the opportunities for young people, and particularly females, to enjoy higher education and to have a job, respectively.
On the basis these economic and social indicators, subsection 3.3. presents a σ-convergence analysis and a compound assessment of well-being.
3.3 Empirical findings
Table 1 shows the mean values and the coefficients of variation (CV) with respect to the shares of each group of goods in total consumption, namely SG1, SG2 and SG3
2, while the statistics are related to real total consumption expenditures per capita (RTCE). The mean of RTCE shows a sizeable increase, while the CV value appears to decrease, falling from 0.23 to 0.20 (Table 1).
More thorough analysis of consumption categories shows that the mean value of SG1 decreases over time, diminishing from 0.30 in 1980 to 0.17 in 2002. According to the Engel law, a decrease in SG1 indicates an improvement of living standards; that is to say, an increasing level of income leads to a lower share of food consumption (Table 1).
This is confirmed by the mean value of SG3 (which in fact increased from 0.20 to 0.27) and, in part, also by the consumption for living (SG2) (involving expenditures such as clothing).
<< Insert Table 1 about here>>
We may now evaluate the σ-convergence as concisely measured by the coefficient of
variation (CV) of expenditure shares; in particular, we noted that a group of regions is
2 SG1 is equal to food expenditure over total expenditure; SG2 is equal to living expenditure (housing, energy, transportation and communication, clothing, and medical care) over total expenditure; and SG3 is equal to non-necessary expenditure (i.e. cultural, educational and entertainment activities) over total expenditure.
9
converging with respect to a generic variable if the dispersion of this variable tends to decrease over time (i.e. CVt+T < CVt) (see Sala-i-Martin, 1996)3.
In detail, we observe with regard to SG1 an increase in the CV value from 0.13 to 0.18: although living standards improve, as indicated by the mean value, the differences among regions still remain wide (Table 1). Nevertheless, the CV value of SG3 has decreased by about 5%, which indicates a convergence process among regions whereby families pay increasing attention to both education expenses and discretionary consumption (e.g. recreation, personal care, leisure expenditures). This enables people to achieve different opportunities (e.g. on the labour market) and to live more comfortable lives (see also Censis, 2004). In other words, the lifestyle of Italian families appears to be slowly changing.
With regard to SG2, the CV value shows very low variability among regions, and it is stable over time. The constant and low value of CV connected to the high value of its mean exhibits a rather homogeneous regional behaviour. SG2 represents those expenditures that a household must undertake to live; the low variability of SG2 shows that the minimum threshold to live has been achieved by the majority of Italian regions (Table 1).
In light of this observation, we can say that the other two shares, SG1 and SG3, are better able to capture the disparities among the regions; the former allows us to evaluate the levels of deprivation, and the latter the achievement of a high standard of living.
In conclusion, we may argue that the living standards of Italians have improved, as is confirmed by the decreasing average value of SG1 and the increasing value of SG3.
Nevertheless, the high value of CV indicates that regional disparities still persist. It is now interesting to determine whether welfare criteria, connected to economic
aspects, show an improvement that has a positive impact on living standards related to social aspects. We therefore need to investigate whether living standards with respect to social aspects have improved.
Table 2 shows the mean and CV values of social indicators. Some of these indicators, like X1, X3, and X4, show a high and constant variability over time which is indicative of non-convergence. Other indicators present a low and constant variability which indicates that some social advantages have been achieved over time (e.g., life expectancy (X7-X10) and people that eat a proper breakfast (X5). Finally, we find that three indicators (X11, X12, and X13) with significant values of CV have strongly decreased over time. They highlight increasing female labour-force participation, a higher level of human capital investment (i.e., the increased number of people that achieve upper-secondary school diplomas), and an improvement in public and private health services. The decrease in the CV value over time indicates that there has been convergence in the opportunities available to people. In
3 It is a common practice in empirical research to test the σ-convergence hypothesis by means of CV or σ values of a specific variable over time. Even though more rigorous statistical tests have been proposed, there is no agreement among researchers on their robustness (see, e.g., Friedman, 1992; Lichtenberg, 1994; Carree and Klomp 1997).
10
particular, greater access to knowledge and better health services are elements essential for the formation of human capabilities, while increasing female labour-market participation is indicative that people are making better use of their acquired capabilities.
<< Insert Table 2 about here>>
Finally, in order to conduct composite analysis of both economic and social aspects,
we applied a multidimensional statistical technique, i.e. Principal Component Analysis (PCA)4, for the years 1990 and 2002. The choice of the years depended on the availability of the majority of variables.
Table 3 reports the correlation between variables and factors for 1990. The analysis suggests the existence of two latent factors which together account for 64.8% of the total variance. The first factor accounts for about 46% of the variance and shows positive and large factor loading with respect to SG1 and X6, whereas a negative and large factor loading appears to be associated with SG2, SG3, X2, X3, X4 and X13.
<< Insert Table 3 about here>>
Because the first factor involves economic and social aspects with both a positive and
a negative correlation, respectively, it sets regions with a high level of SG1 (or low level of SG3), healthy diet, low mortality rates, and low female labour participation against regions with a low SG1 (or a high level of SG3), unhealthy diet, high mortality rates and high female labour-market participation.5 We call this first factor ‘dual well-being’ because it incorporates both economic and social aspects of well-being. These two sets of aspects affect the first factor in opposite ways. The coexistence of social and economic aspects with negative and positive effects on the outcome of the first factor leads to the conclusion that, if a high level of EWB is not monitored, it may give rise to low SWB.
The second factor, which explains 18.6% of the variance, is positively correlated with all variables related to life expectancy (i.e. X7-X10). We therefore interpret the high values of this factor as indicating a favourable position of regions in terms of overall living conditions. We call this second factor ‘basic well-being’: it represents a pre-condition in the sense that it enables people to define their future life prospects, and it may be regarded as part of SWB.
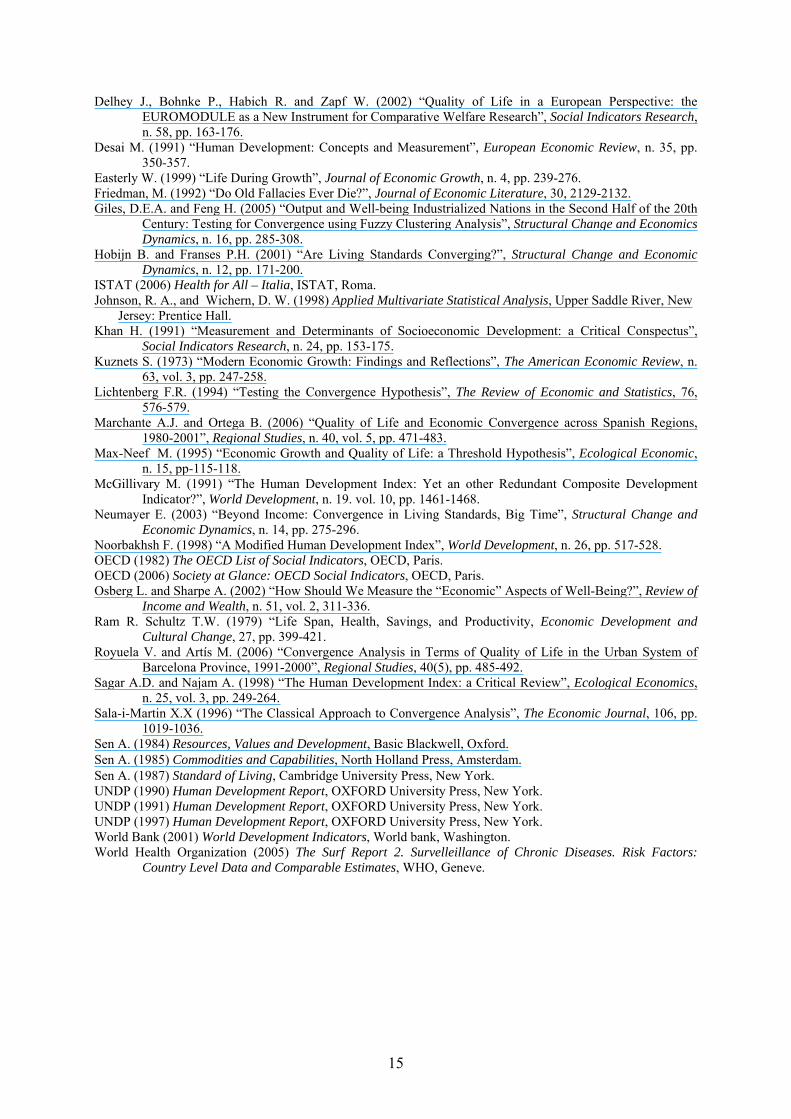
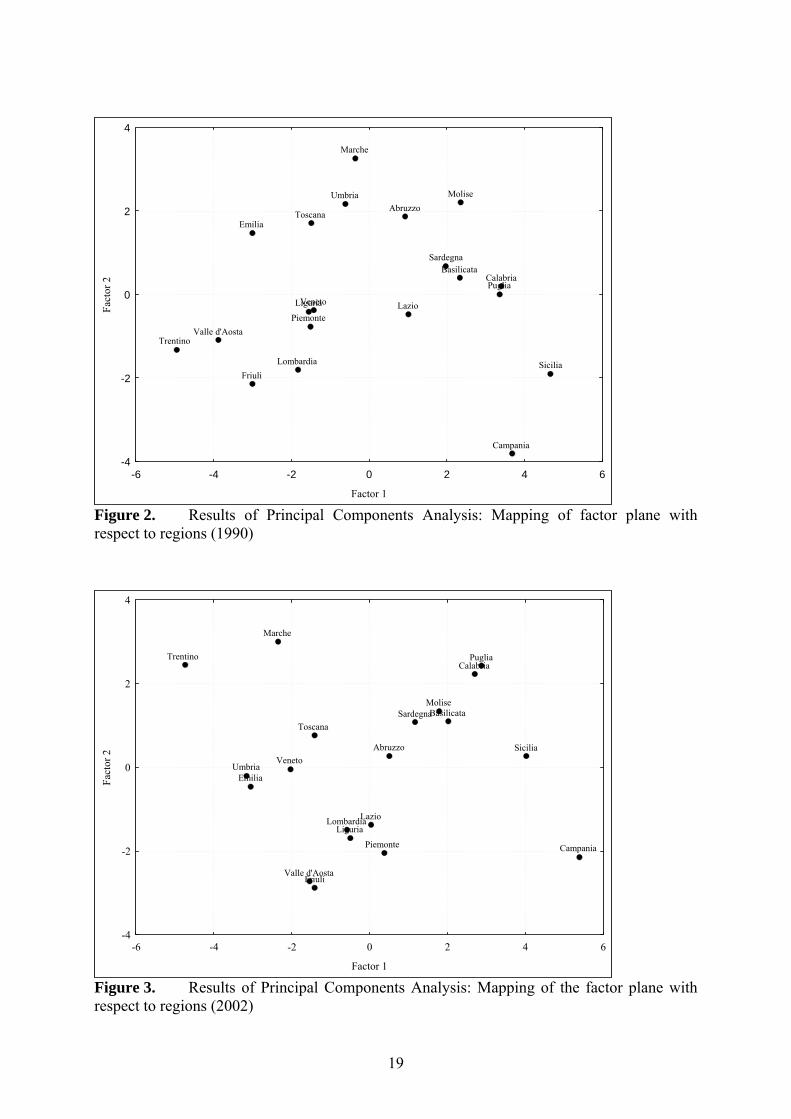
The position of regions on the factor plane highlights an opposition between the southern and central-northern regions (Figure 2). We can identify four different clusters. The first cluster, on the top right side, comprises the majority of southern Italian regions
4 Because the data had different unit scales and wide variability we used a standardized PCA, i.e. the factors were extracted by means of a correlation matrix (Johnson and Wichern, 1998). 5 The variable ‘female labour-market participation’ defines the first principal component coherently with the economic variables.
11
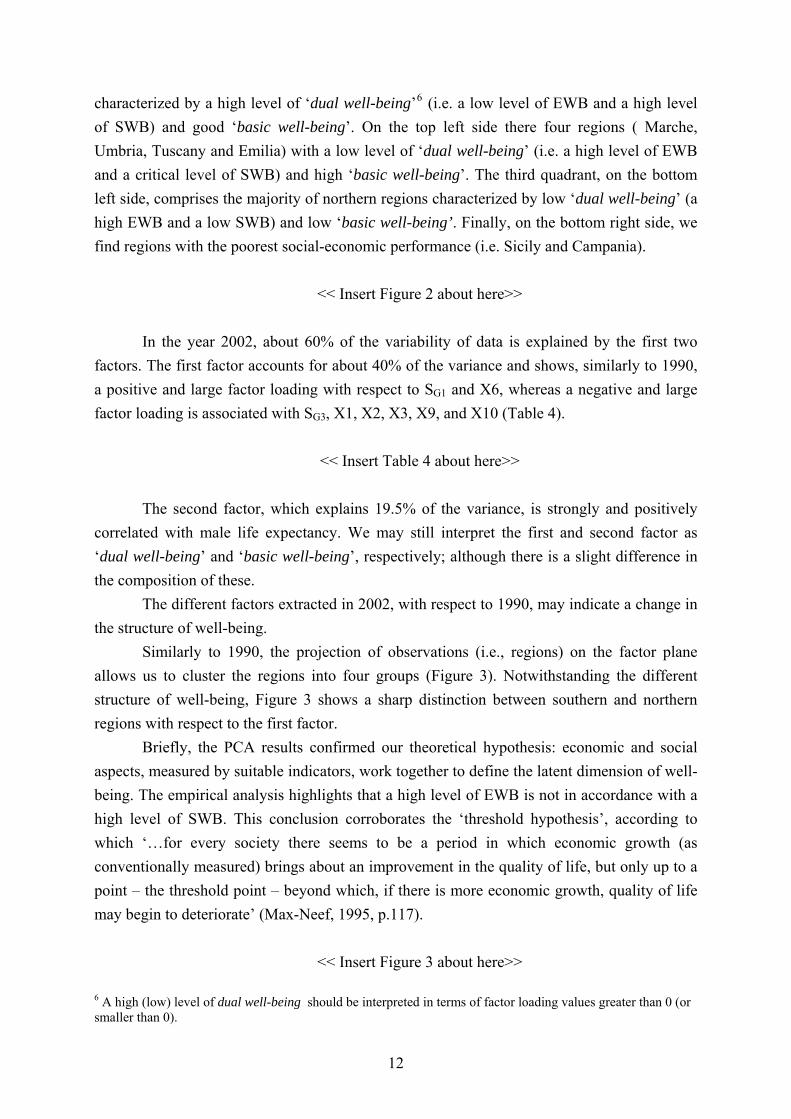
characterized by a high level of ‘dual well-being’6 (i.e. a low level of EWB and a high level of SWB) and good ‘basic well-being’. On the top left side there four regions ( Marche, Umbria, Tuscany and Emilia) with a low level of ‘dual well-being’ (i.e. a high level of EWB and a critical level of SWB) and high ‘basic well-being’. The third quadrant, on the bottom left side, comprises the majority of northern regions characterized by low ‘dual well-being’ (a high EWB and a low SWB) and low ‘basic well-being’. Finally, on the bottom right side, we find regions with the poorest social-economic performance (i.e. Sicily and Campania).
<< Insert Figure 2 about here>>
In the year 2002, about 60% of the variability of data is explained by the first two
factors. The first factor accounts for about 40% of the variance and shows, similarly to 1990, a positive and large factor loading with respect to SG1 and X6, whereas a negative and large factor loading is associated with SG3, X1, X2, X3, X9, and X10 (Table 4).
<< Insert Table 4 about here>>
The second factor, which explains 19.5% of the variance, is strongly and positively
correlated with male life expectancy. We may still interpret the first and second factor as ‘dual well-being’ and ‘basic well-being’, respectively; although there is a slight difference in the composition of these.
The different factors extracted in 2002, with respect to 1990, may indicate a change in the structure of well-being.
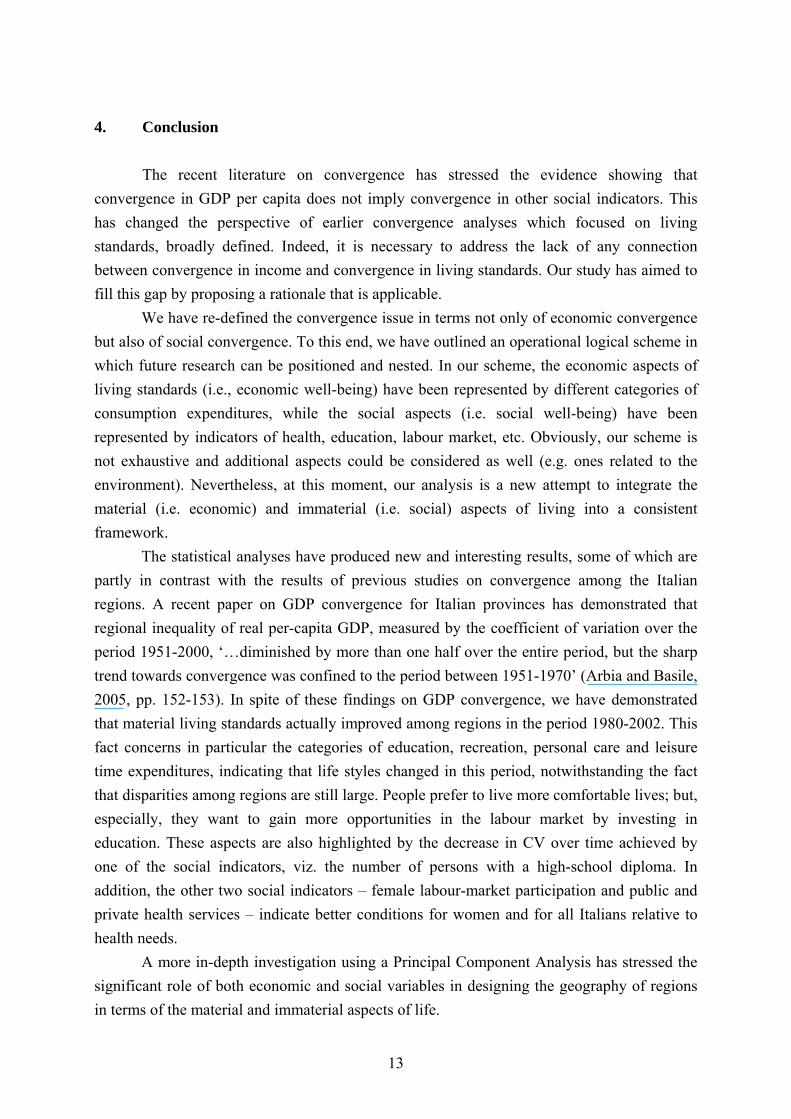
Similarly to 1990, the projection of observations (i.e., regions) on the factor plane allows us to cluster the regions into four groups (Figure 3). Notwithstanding the different structure of well-being, Figure 3 shows a sharp distinction between southern and northern regions with respect to the first factor.
Briefly, the PCA results confirmed our theoretical hypothesis: economic and social aspects, measured by suitable indicators, work together to define the latent dimension of well-being. The empirical analysis highlights that a high level of EWB is not in accordance with a high level of SWB. This conclusion corroborates the ‘threshold hypothesis’, according to which ‘…for every society there seems to be a period in which economic growth (as conventionally measured) brings about an improvement in the quality of life, but only up to a point – the threshold point – beyond which, if there is more economic growth, quality of life may begin to deteriorate’ (Max-Neef, 1995, p.117).
<< Insert Figure 3 about here>>
6 A high (low) level of dual well-being should be interpreted in terms of factor loading values greater than 0 (or smaller than 0).
12
4. Conclusion
The recent literature on convergence has stressed the evidence showing that convergence in GDP per capita does not imply convergence in other social indicators. This has changed the perspective of earlier convergence analyses which focused on living standards, broadly defined. Indeed, it is necessary to address the lack of any connection between convergence in income and convergence in living standards. Our study has aimed to fill this gap by proposing a rationale that is applicable.
We have re-defined the convergence issue in terms not only of economic convergence but also of social convergence. To this end, we have outlined an operational logical scheme in which future research can be positioned and nested. In our scheme, the economic aspects of living standards (i.e., economic well-being) have been represented by different categories of consumption expenditures, while the social aspects (i.e. social well-being) have been represented by indicators of health, education, labour market, etc. Obviously, our scheme is not exhaustive and additional aspects could be considered as well (e.g. ones related to the environment). Nevertheless, at this moment, our analysis is a new attempt to integrate the material (i.e. economic) and immaterial (i.e. social) aspects of living into a consistent framework.
The statistical analyses have produced new and interesting results, some of which are partly in contrast with the results of previous studies on convergence among the Italian regions. A recent paper on GDP convergence for Italian provinces has demonstrated that regional inequality of real per-capita GDP, measured by the coefficient of variation over the period 1951-2000, ‘…diminished by more than one half over the entire period, but the sharp trend towards convergence was confined to the period between 1951-1970’ (Arbia and Basile, 2005, pp. 152-153). In spite of these findings on GDP convergence, we have demonstrated that material living standards actually improved among regions in the period 1980-2002. This fact concerns in particular the categories of education, recreation, personal care and leisure time expenditures, indicating that life styles changed in this period, notwithstanding the fact that disparities among regions are still large. People prefer to live more comfortable lives; but, especially, they want to gain more opportunities in the labour market by investing in education. These aspects are also highlighted by the decrease in CV over time achieved by one of the social indicators, viz. the number of persons with a high-school diploma. In addition, the other two social indicators – female labour-market participation and public and private health services – indicate better conditions for women and for all Italians relative to health needs.
A more in-depth investigation using a Principal Component Analysis has stressed the significant role of both economic and social variables in designing the geography of regions in terms of the material and immaterial aspects of life.
13
As expected, we have found two large clusters, one consisting of southern regions, the other mainly of northern regions. But not as expected, we have found that material and immaterial aspects of living are in contrast with each other. In fact, southern regions are characterized by low level of EWB but a high level of SWB, whereas northern regions display a high level of EWB but a low level of SWB. In other words, improving EWB is a necessary but not sufficient condition for improving the standard of living in terms of a better ‘quality of life’. The endeavour to achieve a higher standard of living should consider the consequences on the people’s lives in regard to the increased rates of various diseases (cancer, heart ischemia, etc.), congestion, pollution, and so on. More specifically, economic growth may also require an effective policy management of social and environmental aspects of life in order to identify a ‘threshold point’ above which economic growth may be detrimental to social well-being.
Our analysis is also consistent with the policy goals of the European Union. The Treaty on the Union has emphasised the ‘economic and social cohesion’ of countries and regions and has obliged the European Commission to prepare a report on the matter every three years. The Monetary Union (EMU) is also a means with which to increase human welfare in Europe or, as written in the Treaty on the Union, for ‘the raising of the standard of living and quality of life’ (article 2).
Against this policy background, it is evident that evaluating the performance of a country or a region requires an integrated operational framework where economic and social dimensions are connected and simultaneously examined. That is, to conclude, a new concept of growth should be introduced: namely ‘growth in quality’.
References Andolina P., Cuffaro M. and Madonia, G. (1999) “Aspects of Convergence in Pre-European Monetary Union
Europe: a Three-Way Factor Analysis”, Scritti di Statistica Economica, n. 5, pp. 1-28. Arbia G. and Basile R. (2005) “Spatial Dependence and Non-linearities in Regional Growth Behaviour in Italy”,
Statistica, n. 65, vol. 2, pp. 145-167. Carree M. and Klomp L. (1997) “Testing the Convergence Hypothesis: A Comment”, The Review of Economics
and Statistics, 4, 683-686. Censis ( 2004) “Come cambiano gli Stili di Consumo”, Censis Note & Commenti, n. 50, vol. 7/8, pp. 55-90. Cracolici M.F. and Vassallo E. (2002) “Sviluppo Economico e Sviluppo Umano nelle Province Italiane”,
Proceedings of XXIII Scientific Meeting of Italian Association of Regional Science, October. Cuffaro M., Davì M. and Notarstefano G. (2000) “Stili di Vita e Dinamica dei Consumi in Italia: Un’Analisi
delle Disparità Territoriali sui Dati dei Bilanci di Famiglia”, Proceedings of XXI Scientific Meeting of Italian Association of Regional Science, September.
Cuffaro M., Davì M., Notarstefano G. and Vassallo E. (2002) “Struttura e Dinamica dei Comportamenti di Consumo Familiare: la Contrapposizione Nord-Sud”, Rivista Economica del Mezzogiorno, n. XV, vol. 3, pp. 465-487.
Cuffaro M. (2003) “Disparità Territoriali e Convergenza: un Punto di Vista Differente”, Rivista Economica del Mezzogiorno, n. XVII, vol. 1-2, pp. 157-179.
Dasgupta P. (1990) “Well-Being and the Extent of its Realization in Poor Countries”, The Economic Journal, n. 100, 1-32.
Dasgupta P. and Weale M. (1992) “On Measuring the Quality of Life”, World Development, n. 20, vol. 1, pp. 119-131.
14
Delhey J., Bohnke P., Habich R. and Zapf W. (2002) “Quality of Life in a European Perspective: the EUROMODULE as a New Instrument for Comparative Welfare Research”, Social Indicators Research, n. 58, pp. 163-176.
Desai M. (1991) “Human Development: Concepts and Measurement”, European Economic Review, n. 35, pp. 350-357.
Easterly W. (1999) “Life During Growth”, Journal of Economic Growth, n. 4, pp. 239-276. Friedman, M. (1992) “Do Old Fallacies Ever Die?”, Journal of Economic Literature, 30, 2129-2132. Giles, D.E.A. and Feng H. (2005) “Output and Well-being Industrialized Nations in the Second Half of the 20th
Century: Testing for Convergence using Fuzzy Clustering Analysis”, Structural Change and Economics Dynamics, n. 16, pp. 285-308.
Hobijn B. and Franses P.H. (2001) “Are Living Standards Converging?”, Structural Change and Economic Dynamics, n. 12, pp. 171-200.
ISTAT (2006) Health for All – Italia, ISTAT, Roma. Johnson, R. A., and Wichern, D. W. (1998) Applied Multivariate Statistical Analysis, Upper Saddle River, New
Jersey: Prentice Hall. Khan H. (1991) “Measurement and Determinants of Socioeconomic Development: a Critical Conspectus”,
Social Indicators Research, n. 24, pp. 153-175. Kuznets S. (1973) “Modern Economic Growth: Findings and Reflections”, The American Economic Review, n.
63, vol. 3, pp. 247-258. Lichtenberg F.R. (1994) “Testing the Convergence Hypothesis”, The Review of Economic and Statistics, 76,
576-579. Marchante A.J. and Ortega B. (2006) “Quality of Life and Economic Convergence across Spanish Regions,
1980-2001”, Regional Studies, n. 40, vol. 5, pp. 471-483. Max-Neef M. (1995) “Economic Growth and Quality of Life: a Threshold Hypothesis”, Ecological Economic,
n. 15, pp-115-118. McGillivary M. (1991) “The Human Development Index: Yet an other Redundant Composite Development
Indicator?”, World Development, n. 19. vol. 10, pp. 1461-1468. Neumayer E. (2003) “Beyond Income: Convergence in Living Standards, Big Time”, Structural Change and
Economic Dynamics, n. 14, pp. 275-296. Noorbakhsh F. (1998) “A Modified Human Development Index”, World Development, n. 26, pp. 517-528. OECD (1982) The OECD List of Social Indicators, OECD, Paris. OECD (2006) Society at Glance: OECD Social Indicators, OECD, Paris. Osberg L. and Sharpe A. (2002) “How Should We Measure the “Economic” Aspects of Well-Being?”, Review of
Income and Wealth, n. 51, vol. 2, 311-336. Ram R. Schultz T.W. (1979) “Life Span, Health, Savings, and Productivity, Economic Development and
Cultural Change, 27, pp. 399-421. Royuela V. and Artís M. (2006) “Convergence Analysis in Terms of Quality of Life in the Urban System of
Barcelona Province, 1991-2000”, Regional Studies, 40(5), pp. 485-492. Sagar A.D. and Najam A. (1998) “The Human Development Index: a Critical Review”, Ecological Economics,
n. 25, vol. 3, pp. 249-264. Sala-i-Martin X.X (1996) “The Classical Approach to Convergence Analysis”, The Economic Journal, 106, pp.
1019-1036. Sen A. (1984) Resources, Values and Development, Basic Blackwell, Oxford. Sen A. (1985) Commodities and Capabilities, North Holland Press, Amsterdam. Sen A. (1987) Standard of Living, Cambridge University Press, New York. UNDP (1990) Human Development Report, OXFORD University Press, New York. UNDP (1991) Human Development Report, OXFORD University Press, New York. UNDP (1997) Human Development Report, OXFORD University Press, New York. World Bank (2001) World Development Indicators, World bank, Washington. World Health Organization (2005) The Surf Report 2. Survelleillance of Chronic Diseases. Risk Factors:
Country Level Data and Comparable Estimates, WHO, Geneve.
15
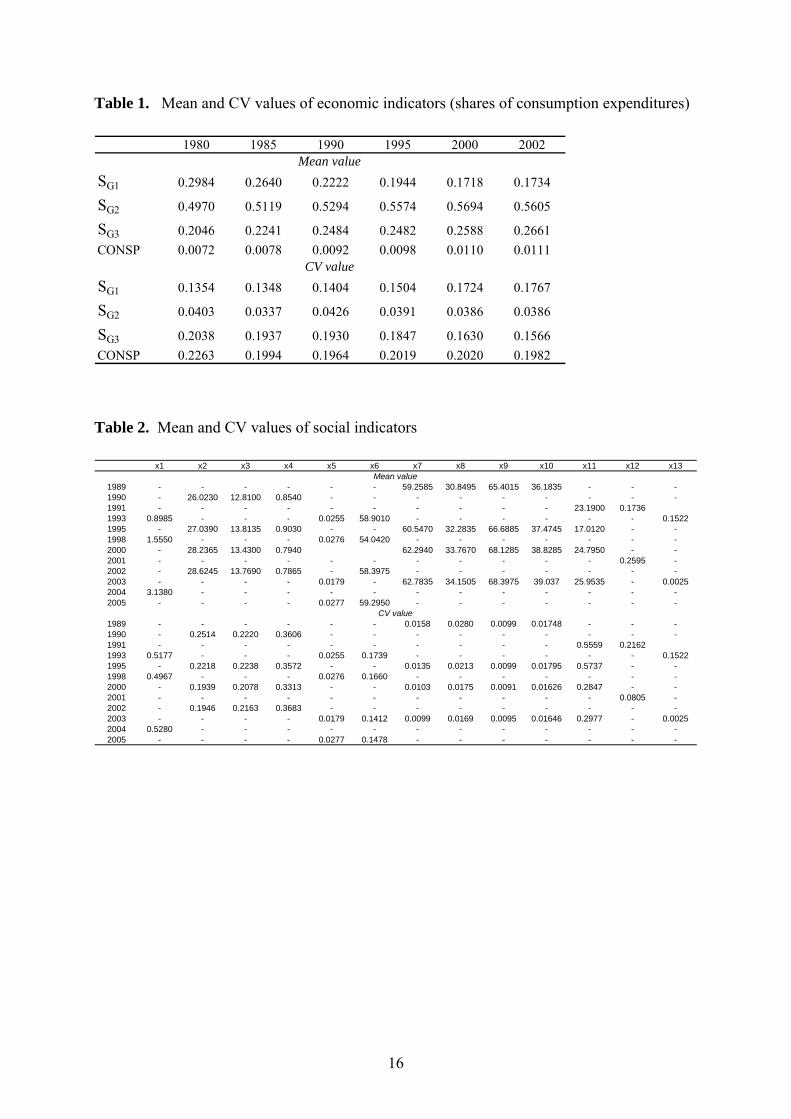
Table 1. Mean and CV values of economic indicators (shares of consumption expenditures)
1980 1985 1990 1995 2000 2002
SG1 0.2984 0.2640 0.2222 0.1944 0.1718 0.1734
SG2 0.4970 0.5119 0.5294 0.5574 0.5694 0.5605
SG3 0.2046 0.2241 0.2484 0.2482 0.2588 0.2661CONSP 0.0072 0.0078 0.0092 0.0098 0.0110 0.0111
SG1 0.1354 0.1348 0.1404 0.1504 0.1724 0.1767
SG2 0.0403 0.0337 0.0426 0.0391 0.0386 0.0386
SG3 0.2038 0.1937 0.1930 0.1847 0.1630 0.1566CONSP 0.2263 0.1994 0.1964 0.2019 0.2020 0.1982
Mean value
CV value
Table 2. Mean and CV values of social indicators
x1 x2 x3 x4 x5 x6 x7 x8 x9 x10 x11 x12 x13
1989 - - - - - - 59.2585 30.8495 65.4015 36.1835 - - -1990 - 26.0230 12.8100 0.8540 - - - - - - - - -1991 - - - - - - - - - - 23.1900 0.17361993 0.8985 - - - 0.0255 58.9010 - - - - - - 0.15221995 - 27.0390 13.8135 0.9030 - - 60.5470 32.2835 66.6885 37.4745 17.0120 - -1998 1.5550 - - - 0.0276 54.0420 - - - - - - -2000 - 28.2365 13.4300 0.7940 62.2940 33.7670 68.1285 38.8285 24.7950 - -2001 - - - - - - - - - - - 0.2595 -2002 - 28.6245 13.7690 0.7865 - 58.3975 - - - - - - -2003 - - - - 0.0179 - 62.7835 34.1505 68.3975 39.037 25.9535 - 0.00252004 3.1380 - - - - - - - - - - - -2005 - - - - 0.0277 59.2950 - - - - - - -
1989 - - - - - - 0.0158 0.0280 0.0099 0.01748 - - -1990 - 0.2514 0.2220 0.3606 - - - - - - - - -1991 - - - - - - - - - - 0.5559 0.21621993 0.5177 - - - 0.0255 0.1739 - - - - - - 0.15221995 - 0.2218 0.2238 0.3572 - - 0.0135 0.0213 0.0099 0.01795 0.5737 - -1998 0.4967 - - - 0.0276 0.1660 - - - - - - -2000 - 0.1939 0.2078 0.3313 - - 0.0103 0.0175 0.0091 0.01626 0.2847 - -2001 - - - - - - - - - - - 0.0805 -2002 - 0.1946 0.2163 0.3683 - - - - - - - - -2003 - - - - 0.0179 0.1412 0.0099 0.0169 0.0095 0.01646 0.2977 - 0.00252004 0.5280 - - - - - - - - - - - -2005 - - - - 0.0277 0.1478 - - - - - - -
Mean value
CV value
16
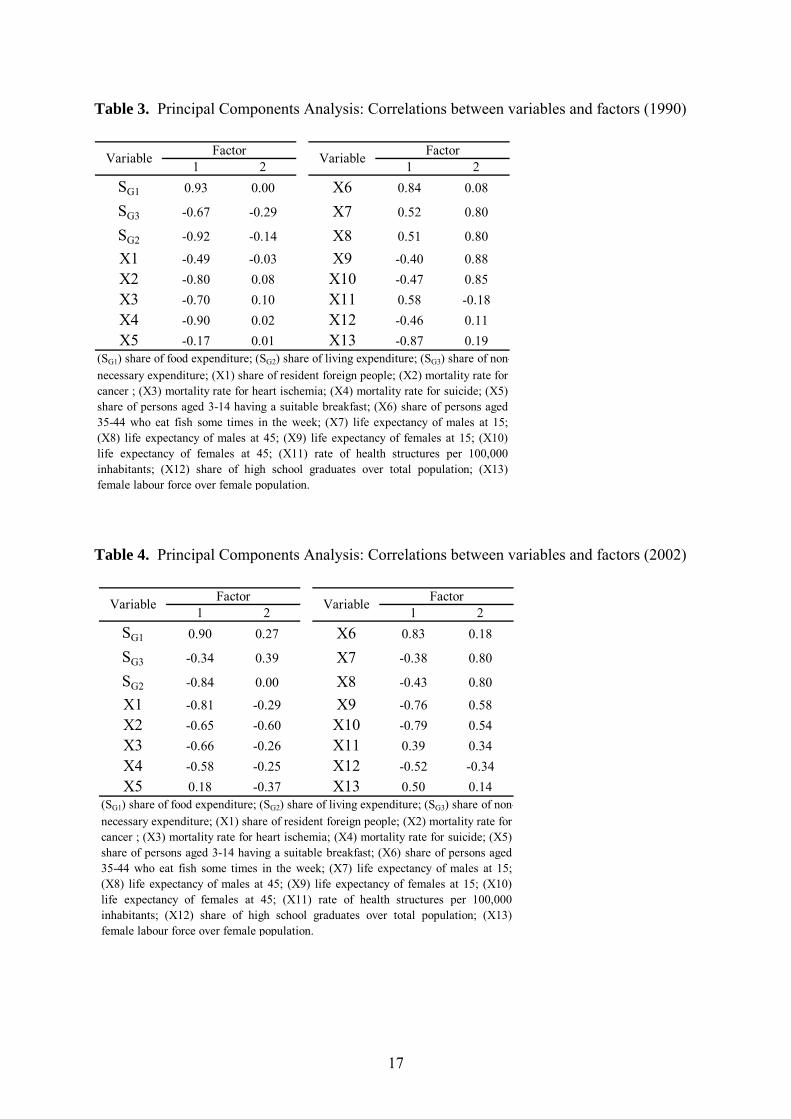
Table 3. Principal Components Analysis: Correlations between variables and factors (1990)
1 2 1 2SG1 0.93 0.00 X6 0.84 0.08
SG3 -0.67 -0.29 X7 0.52 0.80
SG2 -0.92 -0.14 X8 0.51 0.80
X1 -0.49 -0.03 X9 -0.40 0.88X2 -0.80 0.08 X10 -0.47 0.85X3 -0.70 0.10 X11 0.58 -0.18X4 -0.90 0.02 X12 -0.46 0.11X5 -0.17 0.01 X13 -0.87 0.19
Variable
(SG1) share of food expenditure; (SG2) share of living expenditure; (SG3) share of non-necessary expenditure; (X1) share of resident foreign people; (X2) mortality rate forcancer ; (X3) mortality rate for heart ischemia; (X4) mortality rate for suicide; (X5)share of persons aged 3-14 having a suitable breakfast; (X6) share of persons aged35-44 who eat fish some times in the week; (X7) life expectancy of males at 15;(X8) life expectancy of males at 45; (X9) life expectancy of females at 15; (X10)life expectancy of females at 45; (X11) rate of health structures per 100,000inhabitants; (X12) share of high school graduates over total population; (X13)female labour force over female population.
Variable Factor Factor
Table 4. Principal Components Analysis: Correlations between variables and factors (2002)
1 2 1 2SG1 0.90 0.27 X6 0.83 0.18
SG3 -0.34 0.39 X7 -0.38 0.80
SG2 -0.84 0.00 X8 -0.43 0.80
X1 -0.81 -0.29 X9 -0.76 0.58X2 -0.65 -0.60 X10 -0.79 0.54X3 -0.66 -0.26 X11 0.39 0.34X4 -0.58 -0.25 X12 -0.52 -0.34X5 0.18 -0.37 X13 0.50 0.14
Factor
(SG1) share of food expenditure; (SG2) share of living expenditure; (SG3) share of non-necessary expenditure; (X1) share of resident foreign people; (X2) mortality rate forcancer ; (X3) mortality rate for heart ischemia; (X4) mortality rate for suicide; (X5)share of persons aged 3-14 having a suitable breakfast; (X6) share of persons aged35-44 who eat fish some times in the week; (X7) life expectancy of males at 15;(X8) life expectancy of males at 45; (X9) life expectancy of females at 15; (X10)life expectancy of females at 45; (X11) rate of health structures per 100,000inhabitants; (X12) share of high school graduates over total population; (X13)female labour force over female population.
Variable Factor Variable
17
Economic Aspects Social Aspects
Country Performance
Socio-Economic Performance
measure
Social Well-Being
measure
(SWB)(EWB)
Consumption Variables
Social Variables
Time Dimension
Socio-Economic Convergence
Economic Well-Being
- social infrastructure- quality of education- amenities in the labour
- etc.
Economic Performance Social Performance
Figure 1. Conceptual scheme for assessment of the economic and social performances of countries
18
PiemonteValle d'Aosta
Lombardia
Trentino
Veneto
Friuli
Liguria
EmiliaToscana
Umbria
Marche
Lazio
AbruzzoMolise
Campania
Puglia
BasilicataCalabria
Sicilia
Sardegna
-6 -4 -2 0 2 4 6
Factor 1
-4
-2
0
2
4
Fact
or 2
Figure 2. Results of Principal Components Analysis: Mapping of factor plane with respect to regions (1990)
Piemonte
Valle d'Aosta
Lombardia
Trentino
Veneto
Friuli
Liguria
Emilia
Toscana
Umbria
Marche
Lazio
Abruzzo
Molise
Campania
Puglia
Basilicata
Calabria
Sicilia
Sardegna
-6 -4 -2 0 2 4
Factor 1
6-4
-2
0
2
4
Fact
or 2
Figure 3. Results of Principal Components Analysis: Mapping of the factor plane with respect to regions (2002)
19

20
Top Related
Copyright © 2022 FDOKUMEN

