


Bahasa
Halaman
Hukum

Global Journal of Management and Research July – September ISSN 2278-0955 Page 43
MEASURING THE IMPACT FACTOR OF “SENSE OF
SECURITY” BY A SPORTS FAN OR NON-SPORTS FAN WHEN
ATTENDING A SPORTING EVENT
Mr. Diptesh Andrew DeChoudhury
1658 Greenfield Avenue, Los Angeles, CA 90025/USA
Abstract
The primary goal of a sport organization is to nurture the relationship with the fan as
well continuing to build and strengthen the dichotic relationship between the sports fan
and sports organization. This is considered very crucial to the sport organization‟s
marketing effectiveness and efficiency. After the successful marketing of a sport‟s
organization attracting new fans, it makes great business sense to further strengthen and
build on that relationship through local, state, and national commercial sponsorships.
Moreover, this dynamic effect enables the fan to connect with more desire and passion.
This pilot study presents an overview of studies measuring the various impacts/factors on
why sports fans attend their chosen sporting events. This mission statement is to clearly
define the essential elements that enhance venue attractiveness. Studies from academic
and consultancy backgrounds are assessed, with a focus on the models and
methodologies used, the types of impact factors that vary which are investigated for their
effectiveness. The extensive study concludes with a discussion of key trends in the past,
present, and future along with research variables and inefficiencies.
Introduction
As the range of major sports events have grown over the past 100 years, along with their
economic values, the impacts and variable factors have increasingly come under the scrutiny of
funders, policy-makers, planners, and business owners. Therefore, the purpose of this research is
to examine studies and measure their impact on factors of sports events/venue attractiveness.
Sports fans and non-sports fans at major sports events have exhibited the fact that variety of
influences; which may include facility accessibility, trade area/drawing radius, parking (the
design layout), amenities, personnel, a solid sense of community service, security awareness,
winning teams, and environmental considerations. Furthermore, this research study will ask a
field of experts that can influence the list of factors by adding or deleting to it. Much of the
literature studying sports event and venue impact builds on the early work in the area of event
tourism and sports event management. A total of 25-50 publications will be identified and
consequently grouped according to the impact factors. The overall plan is to complete the
qualitative and quantitative research utilizing the Likert scale. This type of measurement
includes a one-dimensional scaling method (Babbie, 2007).
Global Journal of Management and Research July – September ISSN 2278-0955 Page 44
Literature Review
A. Deciphering the Important Elements That Enhance Sports Venue/Event
Attractiveness for the Spectator, Sports Fan, and Non-Sports Fan.
Important elements that enhance sports venue/event attractiveness studies are a major area of
research for many sports franchises and teams in order to increase revenue. For example, it is
very crucial for sport marketers to identify which factors influence people to attend major
sporting events. This clarity of focus would allow marketers to implement effective market
segmentation and targeting; which can then be utilized as a resource tool to help in determining
which important elements or factors are required by sports fans and spectators to enable them to
plan, strategize, and market events effectively. In time before, there has been evidence of where
examining spectators‟ decisions to attend sporting events; that includes facility accessibility,
sense of security, trade area/drawing radius, a winning team, parking and surroundings such as
design layout, amenities, personnel, and environmental awareness (See & Yusof, 2008).
B. Sense of Security
With the unknown uncertainty of terrorist actions and unruly or violent fan behavior what
has become a growing concern in the United States to retain and ensure a risk free environment
at our sporting venues (Hall, Marciani, & Cooper, 2008). Furthermore, major national sporting
events constitute potential terrorist targets which have become a major concern and create undue
stress for many sports fans, franchise owners, and facility managers (Hall, 2008).
For these reasons, a sport specific risk assessment model had been developed while
conducting research through a Homeland Security grant. For example, a study investigating
spectators‟ perceptions at a NASCAR event, via survey administered by the Center for Sports
Security Management collaborating with Turnkey Sports and Entertainment where 64%
indicated an opinion that professional sporting events are a prime target of terrorist attacks (Hall,
Marciani, & Cunningham, 2009). This “sense of security” factor is important in order to create
a positive game environment which is engrained in mission statements and good sportsmanship
initiatives at NCAA Division II Universities which can be seen as very important as stated by
Mr. Fran Reidy, an Athletic Director at a Division II University. (F. Reidy, personal
communication, September 10, 2009)
C. Methods/Research Plans: Methods/Design/Procedures/Results.
Assessments
Mr. Rensis Likert (Babbie, 2007) created a method by which this Likert questionnaire format
could be used to determine the relative intensity of different items. The questionnaire
item/format contains response categories such as strongly agree, agree, disagree, and strongly
Global Journal of Management and Research July – September ISSN 2278-0955 Page 45
disagree. This unique style of questionnaire is one of the most commonly used formats in
contemporary questionnaire design (Babbie, 2007).
Advantages
This method can determine the relative intensity of different factors. Likert scale goes
one step further and calculates the average index score for those agreeing with each of the
individual statements. As a result of item analysis, respondents can also be rescored to form a
comparative scale. This type of survey research is a mode of observation utilized primarily in the
social sciences. In a typical survey, the researcher selects a sample of respondents and
administers a standardized questionnaire to them. Many researchers agree that this method is
readily available to a social researcher who is interested in collecting reliable data for describing
a population too large to merely observe directly from a small sample size. The use of survey
results has become a valuable tool of survey research, and is especially useful for students and
others with limited research funds (Babbie, 2007).
In addition, surveys and their research questions may be used for descriptive,
explanatory, and exploratory purposes. They are chiefly utilized in studies that focus on
individual people as the units of analysis. The three major research question formats are open-
ended and close-ended questions, matrix questions, and contingency questions for which survey
research is an appropriate technique of observation (Babbie, 2007).
In comparison, open-ended questions are questions where the respondent is asked to
provide his or her own answers and this method usually provides for in-depth qualitative
interviewing. For contrasting purposes, close-ended questions is when the respondent is asked to
select an answer from a list provided by the researcher. Close-ended type questions are popular
in research because they provide for a greater uniformity of responses and are easily processed
than open-ended questions (Babbie, 2007).
Another type of question that is applicable to this type for research is the contingency
question where the survey question is intended for a narrow range of respondents, as determined
by their responses to another question. For example, all respondents might be asked whether
they have a season ski pass to Vail Resorts, and only those who said yes would be asked how
often they go skiing at Keystone (1 of the 6 Vail Ski Resorts). The latter would be a contingency
question (Babbie, 2007).
F. Methods Continued
Participants
The participants were taken from a volunteer sample of Saint Leo University and
Global Journal of Management and Research July – September ISSN 2278-0955 Page 46
University of South Florida undergraduate students, and Saint Leo University graduate students
through Saint Leo University college classrooms and the Saint Leo University library.
Furthermore, a volunteer sample of working professionals from Vail Resorts in Colorado, Team
In Training Suncoast Chapter affiliated with the Leukemia & Lymphoma Society, faculty and
staff at Saint Leo University during office meetings were also taken. These samples were taken
through college classrooms, email, library study, and office meetings spanning a one month
period. A demographic questionnaire assessed the age, gender, and occupation or working role
of the participants. The respondents were asked to complete a “Measuring the Impact Factors a
Sports Fan and Non-Sports Fan Considers Important When Attending a Sporting Event: A Likert
Survey.”
Design
Participants are split into two conditions and given a Likert questionnaire. In condition 1, the
participants are defined as major sports fans and are asked to fill out/complete the Likert
questionnaire to the best of his or her ability. In condition 2, the participants are defined as non-
sports fans and are asked to fill out/complete the Likert questionnaire to the best of his or her
ability. The dependent measures will be identifying which are the most important factors on why
sports fans and non-sports fans attend sporting events.
A.The Basic Structure of the experiment. A Likert Questionnaire.
B.The details of each condition (levels of the independent variable). Sports Fans vs. Non-Sports
fans.
C.The dependent variable. Questions detailing with each factor.
Controls for this experiment should be outlined: Non-sports fans would be my control
group while Sports fans would be my experimental group.
Materials and Stimuli
This section will list the materials and stimuli utilized within in this experiment. The
stimuli used in this experiment would be the Likert Questionnaire. Paper and pen will also be
provided for this survey. A Likert Questionnaire that could be completed on-line for participants
that live in far away states and foreign countries.
Procedures
The procedures ready and set for the college classroom, office settings, library, stadium
fans at the gate before a game, or an online questionnaire. I was hoping that I could provide this
Likert Questionnaire in a variety of settings to get the maximum amount of responses from a
variety of demographic groups.
Other procedures include:
Global Journal of Management and Research July – September ISSN 2278-0955 Page 47
1. Defining the focus.
2. Generating the items.
3. Rating the items.
4. Selecting the items.
5. Administering the scale
Results
This section contains the experimental findings of the experimental group and control group
provided by my assessments and statistical data taken from the Likert Questionnaires. Reporting
of the results will start with reporting the descriptive statistics, Pearson‟s correlations analysis,
regression analysis, top rank order, and then moves forward to the results utilizing the Likert
questionnaire and how it should be reported and analyzed.
Descriptive Statistics
Geometric Means, Medians, Modes, Averages, Standard Deviations, Variances, and
Demographics.
Groups:
A. Undergraduate Students 80 Total Research Participants/52.6%.
1. Sports Business Majors 50 Total Research Participants.
2. Non-Sports Business Majors 30 Total Research Participants.
B. Graduate Students.
1. MBA students and other Master Degree students: 48 MBA Students/2 MA Students:
50 Total Research Participants/32.9%.
C. Working Professionals: 22 Total Research Participants/14.5%.
Participants
The sample consisted of 152 participants. The data was collected through college
classrooms, email, library study, and office meetings spanning one month. In total, 152 usable
Likert surveys were collected. Respondent ages ranged from 18 to 68 [18-21=38.2%, 22-
39=40.8%,40-68=21.1%] and 80 undergraduate students (52.6%), 50 graduate students (32.9%),
and 22 working professionals (14.5 %) . To expand and enrich the quantitative findings of the
Likert a ranking of highest order topic was utilized immediately following the Likert Survey.
The topics to rank from this Likert Survey list included “Team Quality/Winning Team”,
Global Journal of Management and Research July – September ISSN 2278-0955 Page 48
“Facility Accessibility”, “Sense of Security”, “Amenities”, and “Corporate Social
Responsibility.” Furthermore, five on-site administration of questionnaires to active sports
administrators were given to provide their opinions and facts on the subject of Measuring the
Impact Factors A Sports Fan and Non-Sports Fan Considers Important When Attending A
Sporting Event: A Likert Survey.
Data Analysis
Five-Point Likert Rating Scale and Credibility
Data credibility was achieved in three ways (Lincoln & Guba, 1985) through the
independent coding of data, checking of the categorization process by researchers experienced in
qualitative and quantitative methods, and careful examination of the researchers‟ scripts for each
participant.
The reasons for the five point Likert scale for my research study, “Measuring the Impact
Factors a Sports Fan and Non-Sports Fan Considers Important When Attending a Sporting
Event: A Likert Survey”, is based on past research studies that have indicated that the 4-point
scale was less reliable than Likert scales with 5, 6, or 7 options. The same research found that in
examining the reliability of the data, 5, 6, or 7 provided similar data quality and suggested five-
point rating scales should be used in situations where moderate responses are expected such as
my Likert Survey. When examining reliability and preference, a five-point was optimum for the
respondents in this study (McDonald, 2004). In addition to this, two recent research studies have
found that more than three responses are necessary to achieve stable responses from respondents
(Preston and Coleman, 2000; Weng, 2004). Furthermore, reliability estimates with 4 point rating
scales or less fluctuated from sample size to sample size, and recommended that 5 or more points
be utilized for designing a rating scale (Weng, 2004).
Likert Questionnaire and Investigation of the Highest to Lowest Topic Rank Order
Sample Size
The statistical data for this research study was collected from 152 participants [80
undergraduate students (52.6%), 50 graduate students (32.9%), and 22 working
professionals(14.5%)].
Instrument and Procedure
There were no previous available Likert questionnaires in the research literature
combining the research question into one set of impact factors into one “Measuring the Impact
Factors a Sports Fan and Non-Sports Fan Considers Important When Attending a Sporting
Event: Likert Survey”. The scales related to these constructs were specifically developed during
Global Journal of Management and Research July – September ISSN 2278-0955 Page 49
this time for this new and improved research study. Following the analysis of sports
administrator interviews and previous research studies on “impact factors” associated with sports
fans and non-sports fans were identified and included in this Likert questionnaire and “Impact
Factor” topic order. The purpose of the questionnaire was to perform relevant exploratory
descriptive statistical analyses, correlation and regression analysis to determine which “impact
factor” was the highest priority for the sports fan and non-sports fan when attending a sports
event which can be further utilized in the future by security advisors, sports administrators and
sports marketers.
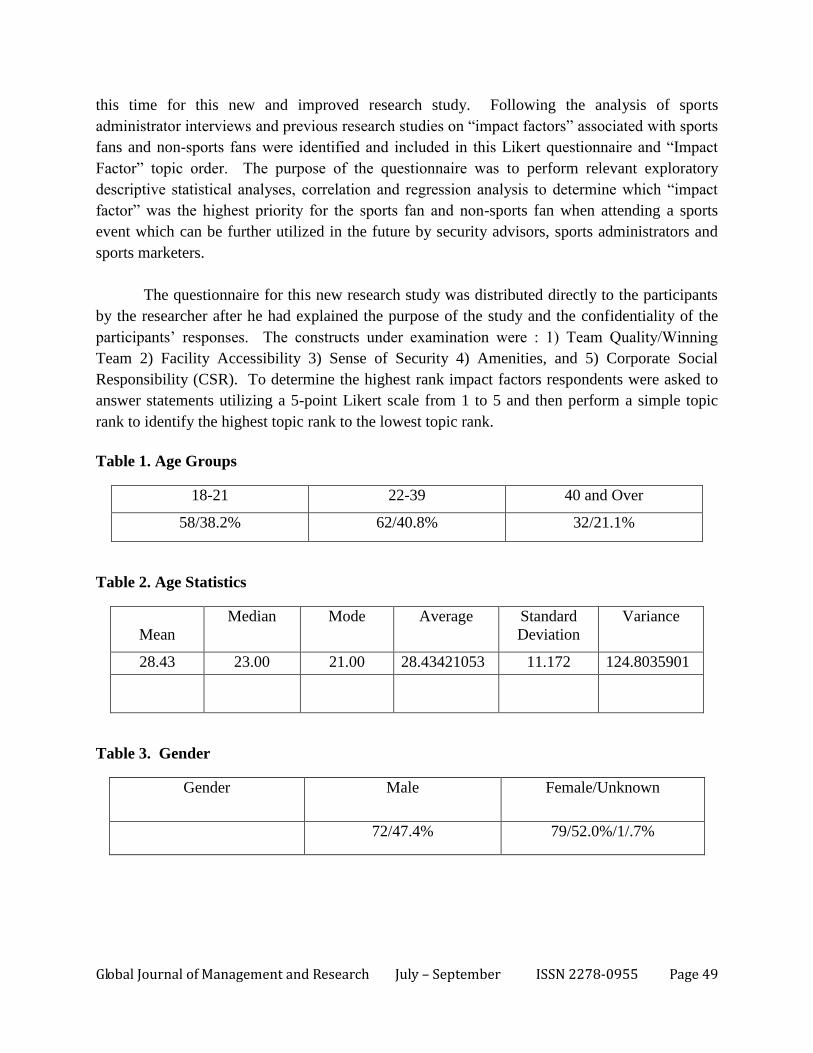
The questionnaire for this new research study was distributed directly to the participants
by the researcher after he had explained the purpose of the study and the confidentiality of the
participants‟ responses. The constructs under examination were : 1) Team Quality/Winning
Team 2) Facility Accessibility 3) Sense of Security 4) Amenities, and 5) Corporate Social
Responsibility (CSR). To determine the highest rank impact factors respondents were asked to
answer statements utilizing a 5-point Likert scale from 1 to 5 and then perform a simple topic
rank to identify the highest topic rank to the lowest topic rank.
Table 1. Age Groups
18-21 22-39 40 and Over
58/38.2% 62/40.8% 32/21.1%
Table 2. Age Statistics
Mean
Median Mode Average Standard
Deviation
Variance
28.43 23.00 21.00 28.43421053 11.172 124.8035901
Table 3. Gender
Gender Male Female/Unknown
72/47.4% 79/52.0%/1/.7%
Global Journal of Management and Research July – September ISSN 2278-0955 Page 50
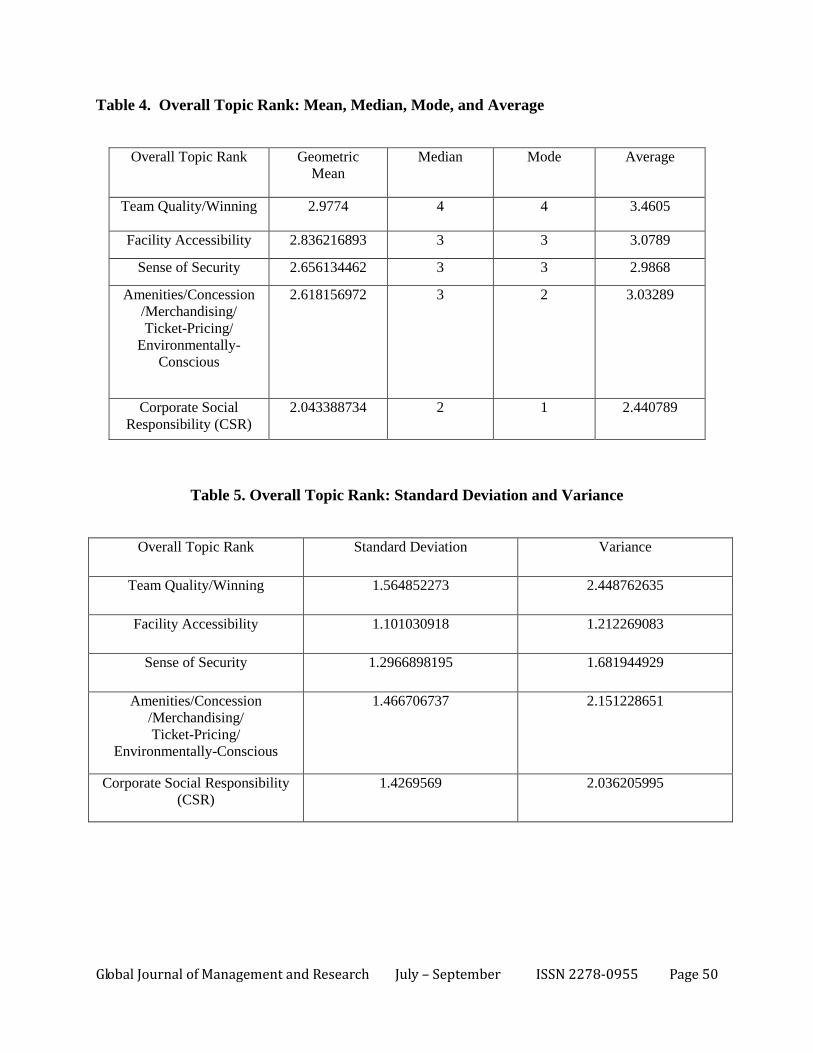
Table 4. Overall Topic Rank: Mean, Median, Mode, and Average
Overall Topic Rank Geometric
Mean
Median Mode Average
Team Quality/Winning 2.9774 4 4 3.4605
Facility Accessibility 2.836216893 3 3 3.0789
Sense of Security 2.656134462 3 3 2.9868
Amenities/Concession
/Merchandising/
Ticket-Pricing/
Environmentally-
Conscious
2.618156972 3 2 3.03289
Corporate Social
Responsibility (CSR)
2.043388734 2 1 2.440789
Table 5. Overall Topic Rank: Standard Deviation and Variance
Overall Topic Rank Standard Deviation Variance
Team Quality/Winning 1.564852273 2.448762635
Facility Accessibility 1.101030918 1.212269083
Sense of Security 1.2966898195 1.681944929
Amenities/Concession
/Merchandising/
Ticket-Pricing/
Environmentally-Conscious
1.466706737 2.151228651
Corporate Social Responsibility
(CSR)
1.4269569 2.036205995
Global Journal of Management and Research July – September ISSN 2278-0955 Page 51
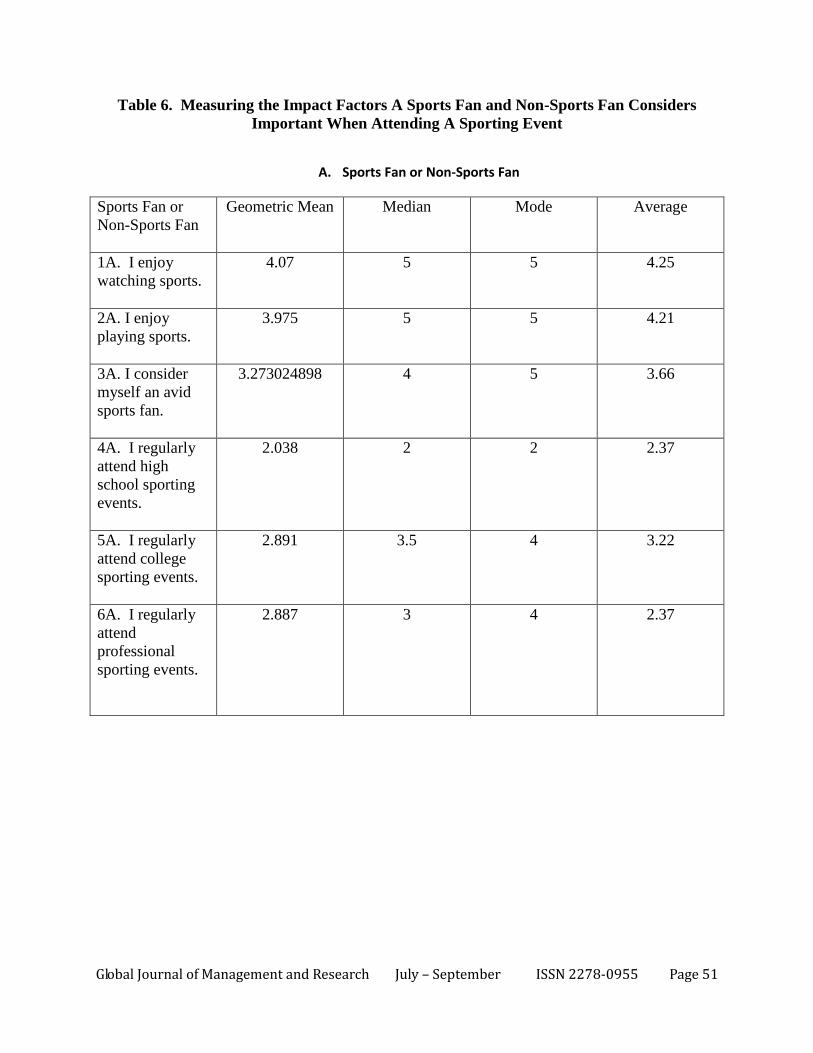
Table 6. Measuring the Impact Factors A Sports Fan and Non-Sports Fan Considers
Important When Attending A Sporting Event
A. Sports Fan or Non-Sports Fan
Sports Fan or
Non-Sports Fan
Geometric Mean Median Mode Average
1A. I enjoy
watching sports.
4.07 5 5 4.25
2A. I enjoy
playing sports.
3.975 5 5 4.21
3A. I consider
myself an avid
sports fan.
3.273024898 4 5 3.66
4A. I regularly
attend high
school sporting
events.
2.038 2 2 2.37
5A. I regularly
attend college
sporting events.
2.891 3.5 4 3.22
6A. I regularly
attend
professional
sporting events.
2.887 3 4 2.37
Global Journal of Management and Research July – September ISSN 2278-0955 Page 52
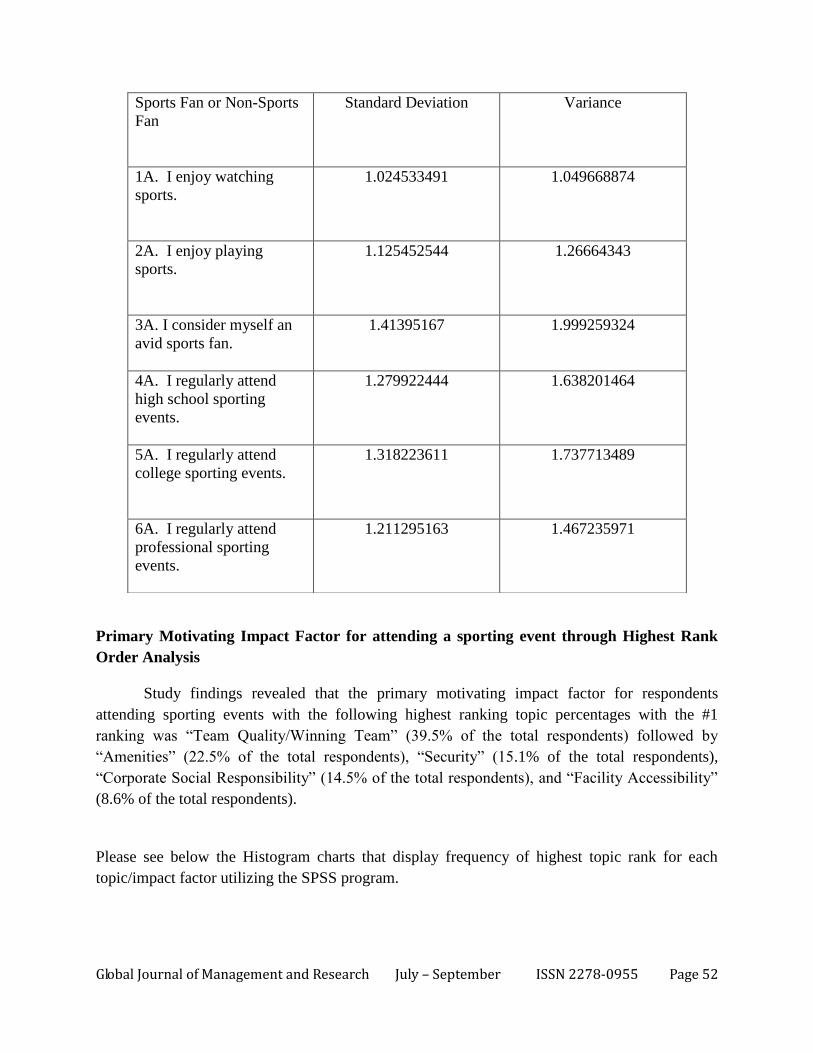
Primary Motivating Impact Factor for attending a sporting event through Highest Rank
Order Analysis
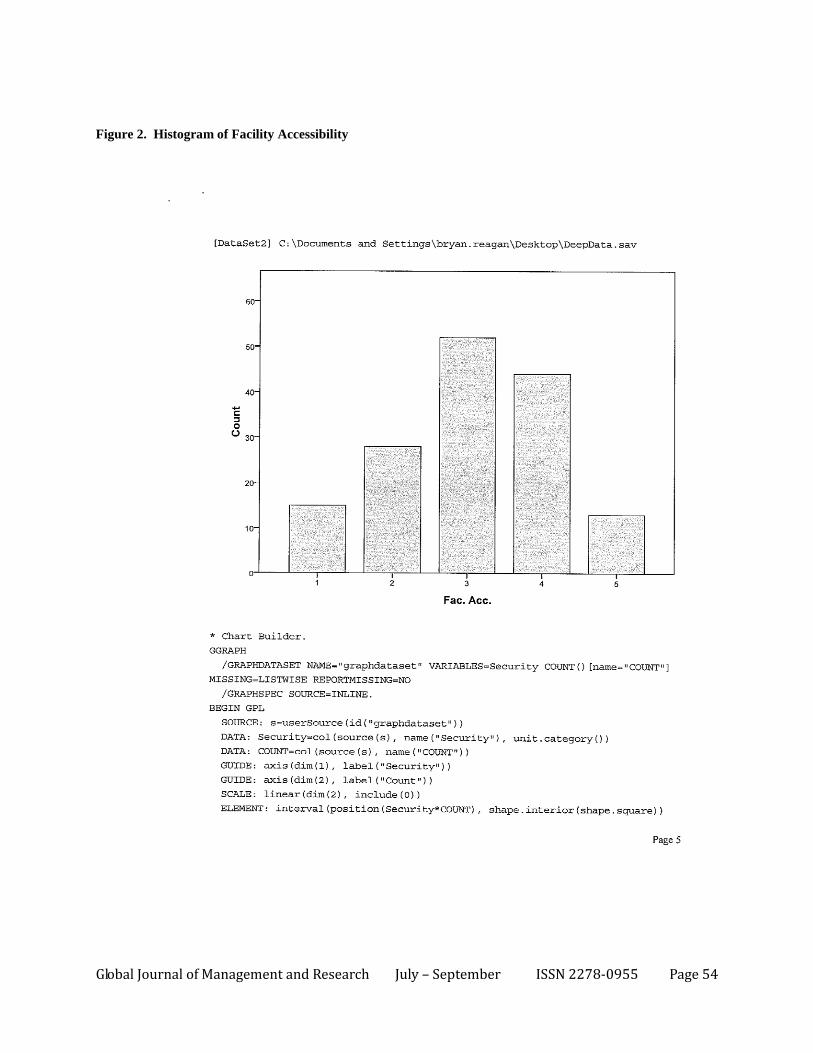
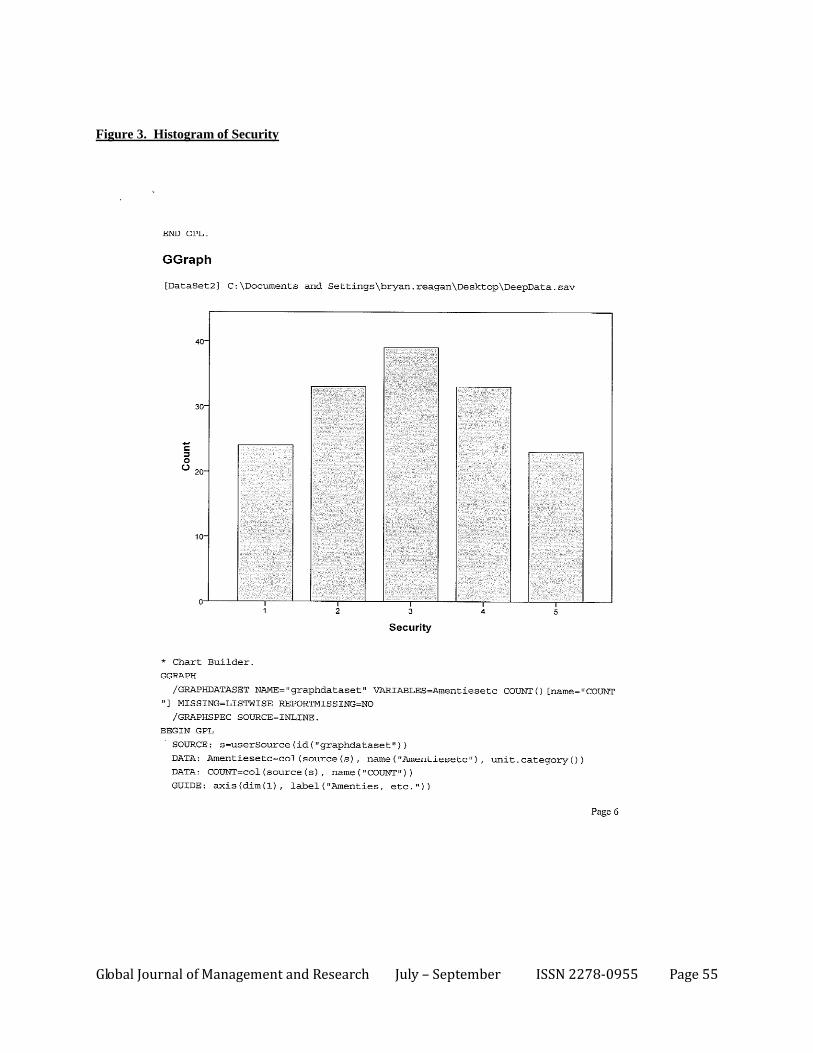
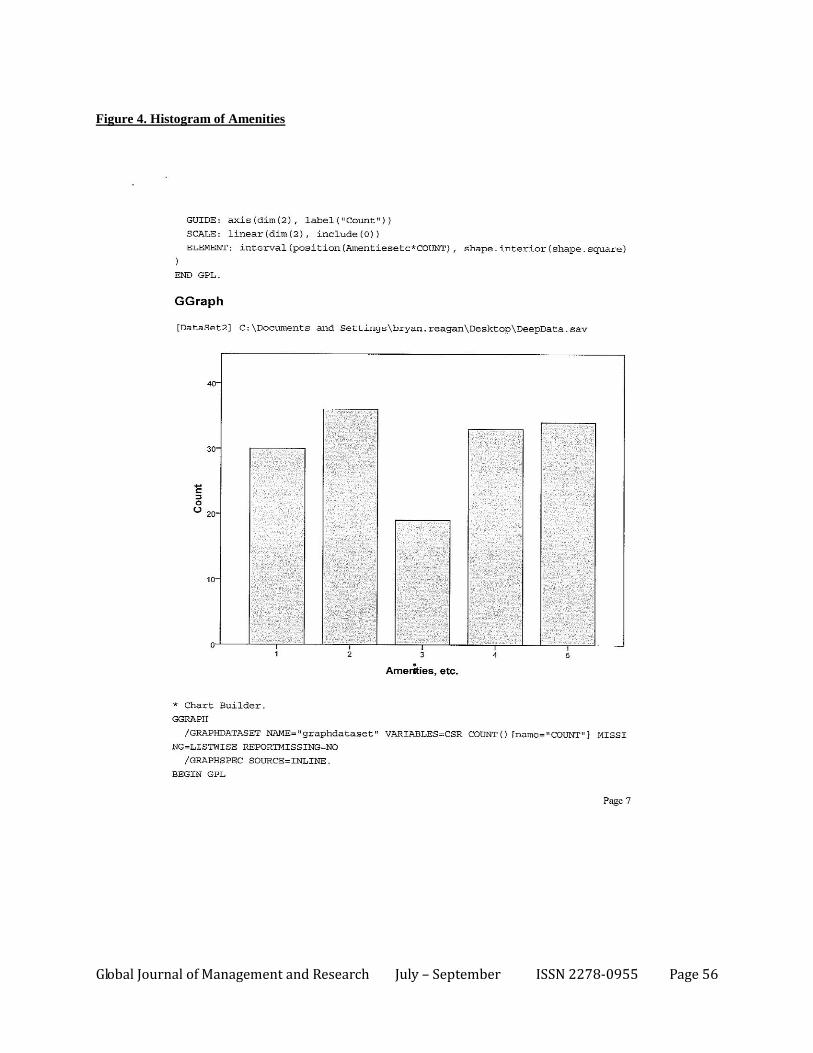
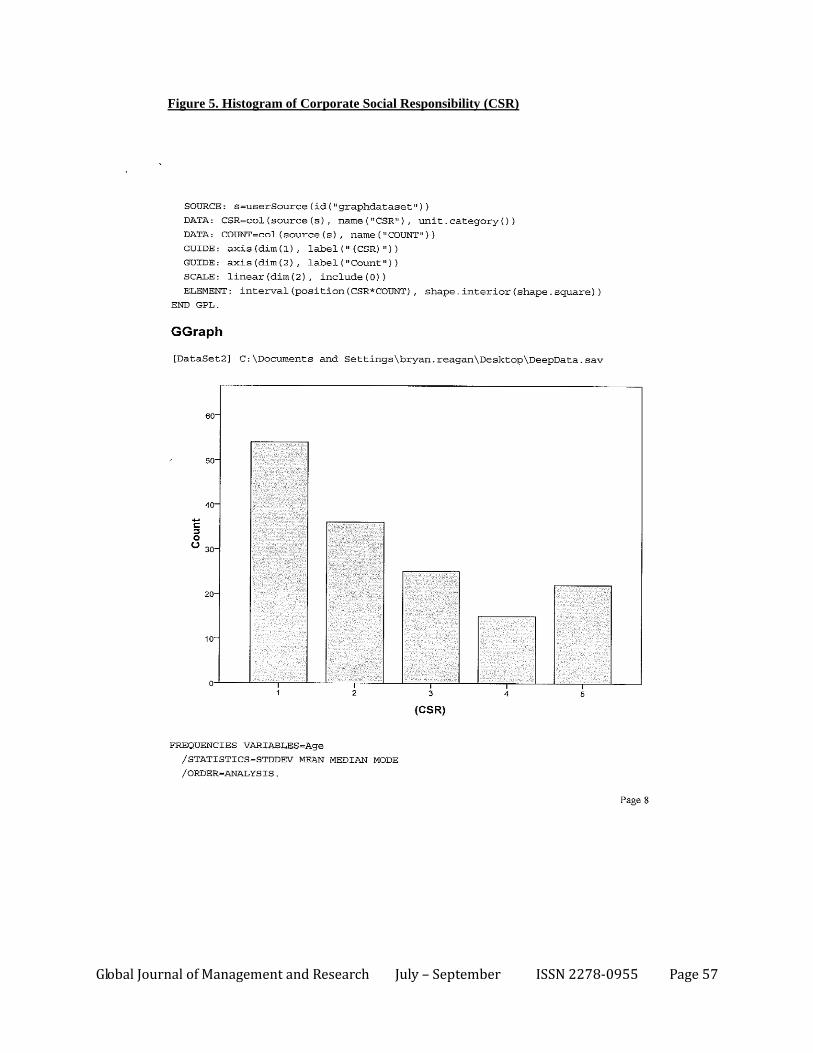
Study findings revealed that the primary motivating impact factor for respondents
attending sporting events with the following highest ranking topic percentages with the #1
ranking was “Team Quality/Winning Team” (39.5% of the total respondents) followed by
“Amenities” (22.5% of the total respondents), “Security” (15.1% of the total respondents),
“Corporate Social Responsibility” (14.5% of the total respondents), and “Facility Accessibility”
(8.6% of the total respondents).
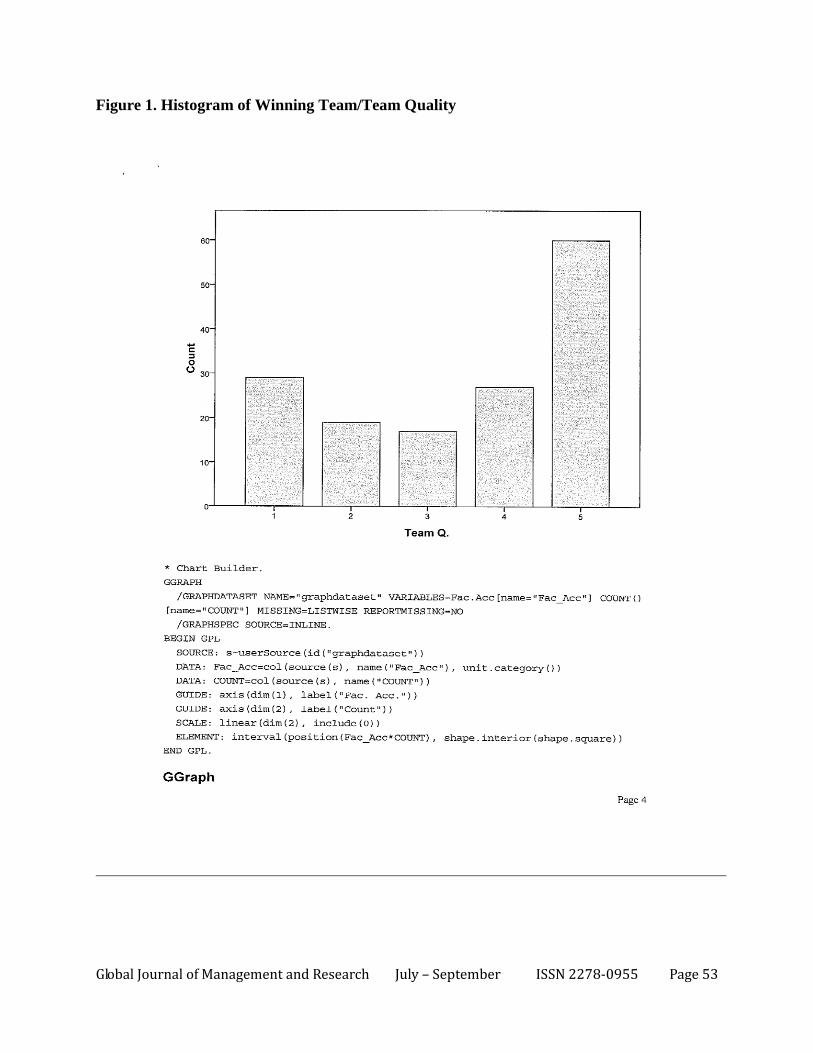
Please see below the Histogram charts that display frequency of highest topic rank for each
topic/impact factor utilizing the SPSS program.
Sports Fan or Non-Sports
Fan
Standard Deviation Variance
1A. I enjoy watching
sports.
1.024533491 1.049668874
2A. I enjoy playing
sports.
1.125452544 1.26664343
3A. I consider myself an
avid sports fan.
1.41395167 1.999259324
4A. I regularly attend
high school sporting
events.
1.279922444 1.638201464
5A. I regularly attend
college sporting events.
1.318223611 1.737713489
6A. I regularly attend
professional sporting
events.
1.211295163 1.467235971
Global Journal of Management and Research July – September ISSN 2278-0955 Page 53
Figure 1. Histogram of Winning Team/Team Quality
Global Journal of Management and Research July – September ISSN 2278-0955 Page 54
Figure 2. Histogram of Facility Accessibility
Global Journal of Management and Research July – September ISSN 2278-0955 Page 55
Figure 3. Histogram of Security
Global Journal of Management and Research July – September ISSN 2278-0955 Page 56
Figure 4. Histogram of Amenities
Global Journal of Management and Research July – September ISSN 2278-0955 Page 57
Figure 5. Histogram of Corporate Social Responsibility (CSR)
Global Journal of Management and Research July – September ISSN 2278-0955 Page 58
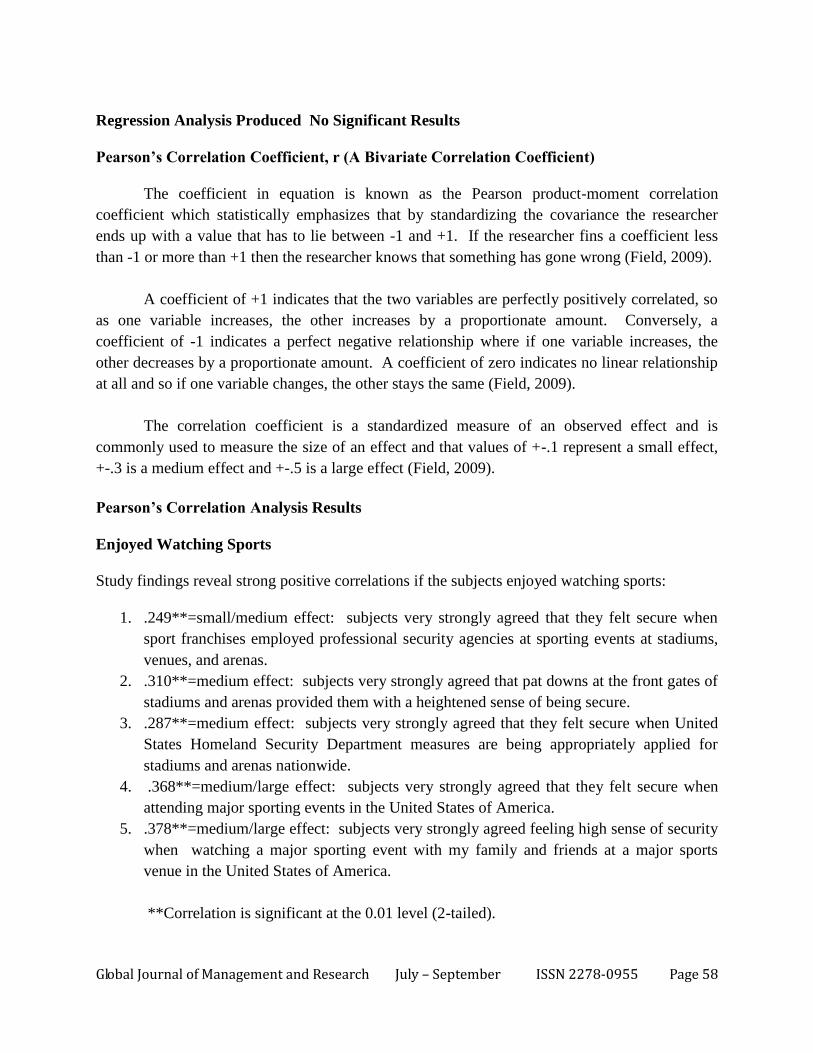
Regression Analysis Produced No Significant Results
Pearson’s Correlation Coefficient, r (A Bivariate Correlation Coefficient)
The coefficient in equation is known as the Pearson product-moment correlation
coefficient which statistically emphasizes that by standardizing the covariance the researcher
ends up with a value that has to lie between -1 and +1. If the researcher fins a coefficient less
than -1 or more than +1 then the researcher knows that something has gone wrong (Field, 2009).
A coefficient of +1 indicates that the two variables are perfectly positively correlated, so
as one variable increases, the other increases by a proportionate amount. Conversely, a
coefficient of -1 indicates a perfect negative relationship where if one variable increases, the
other decreases by a proportionate amount. A coefficient of zero indicates no linear relationship
at all and so if one variable changes, the other stays the same (Field, 2009).
The correlation coefficient is a standardized measure of an observed effect and is
commonly used to measure the size of an effect and that values of +-.1 represent a small effect,
+-.3 is a medium effect and +-.5 is a large effect (Field, 2009).
Pearson’s Correlation Analysis Results
Enjoyed Watching Sports
Study findings reveal strong positive correlations if the subjects enjoyed watching sports:
1. .249**=small/medium effect: subjects very strongly agreed that they felt secure when
sport franchises employed professional security agencies at sporting events at stadiums,
venues, and arenas.
2. .310**=medium effect: subjects very strongly agreed that pat downs at the front gates of
stadiums and arenas provided them with a heightened sense of being secure.
3. .287**=medium effect: subjects very strongly agreed that they felt secure when United
States Homeland Security Department measures are being appropriately applied for
stadiums and arenas nationwide.
4. .368**=medium/large effect: subjects very strongly agreed that they felt secure when
attending major sporting events in the United States of America.
5. .378**=medium/large effect: subjects very strongly agreed feeling high sense of security
when watching a major sporting event with my family and friends at a major sports
venue in the United States of America.
**Correlation is significant at the 0.01 level (2-tailed).
Global Journal of Management and Research July – September ISSN 2278-0955 Page 59
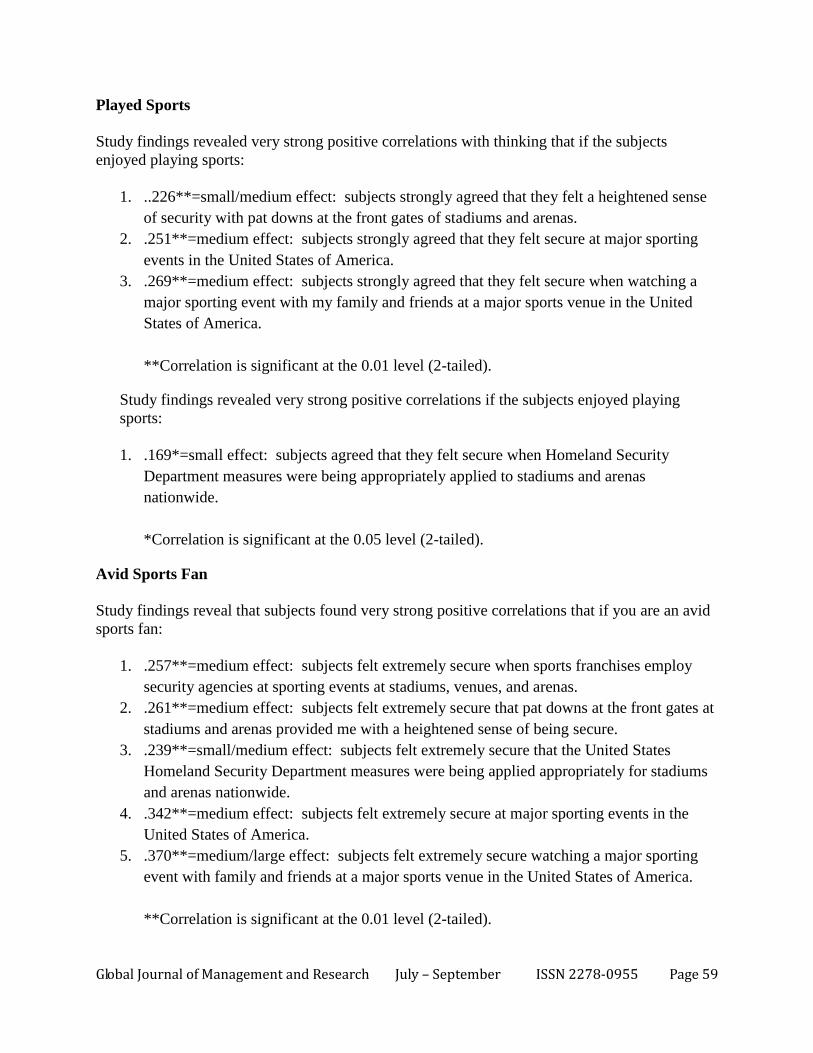
Played Sports
Study findings revealed very strong positive correlations with thinking that if the subjects
enjoyed playing sports:
1. ..226**=small/medium effect: subjects strongly agreed that they felt a heightened sense
of security with pat downs at the front gates of stadiums and arenas.
2. .251**=medium effect: subjects strongly agreed that they felt secure at major sporting
events in the United States of America.
3. .269**=medium effect: subjects strongly agreed that they felt secure when watching a
major sporting event with my family and friends at a major sports venue in the United
States of America.
**Correlation is significant at the 0.01 level (2-tailed).
Study findings revealed very strong positive correlations if the subjects enjoyed playing
sports:
1. .169*=small effect: subjects agreed that they felt secure when Homeland Security
Department measures were being appropriately applied to stadiums and arenas
nationwide.
*Correlation is significant at the 0.05 level (2-tailed).
Avid Sports Fan
Study findings reveal that subjects found very strong positive correlations that if you are an avid
sports fan:
1. .257**=medium effect: subjects felt extremely secure when sports franchises employ
security agencies at sporting events at stadiums, venues, and arenas.
2. .261**=medium effect: subjects felt extremely secure that pat downs at the front gates at
stadiums and arenas provided me with a heightened sense of being secure.
3. .239**=small/medium effect: subjects felt extremely secure that the United States
Homeland Security Department measures were being applied appropriately for stadiums
and arenas nationwide.
4. .342**=medium effect: subjects felt extremely secure at major sporting events in the
United States of America.
5. .370**=medium/large effect: subjects felt extremely secure watching a major sporting
event with family and friends at a major sports venue in the United States of America.
**Correlation is significant at the 0.01 level (2-tailed).
Global Journal of Management and Research July – September ISSN 2278-0955 Page 60
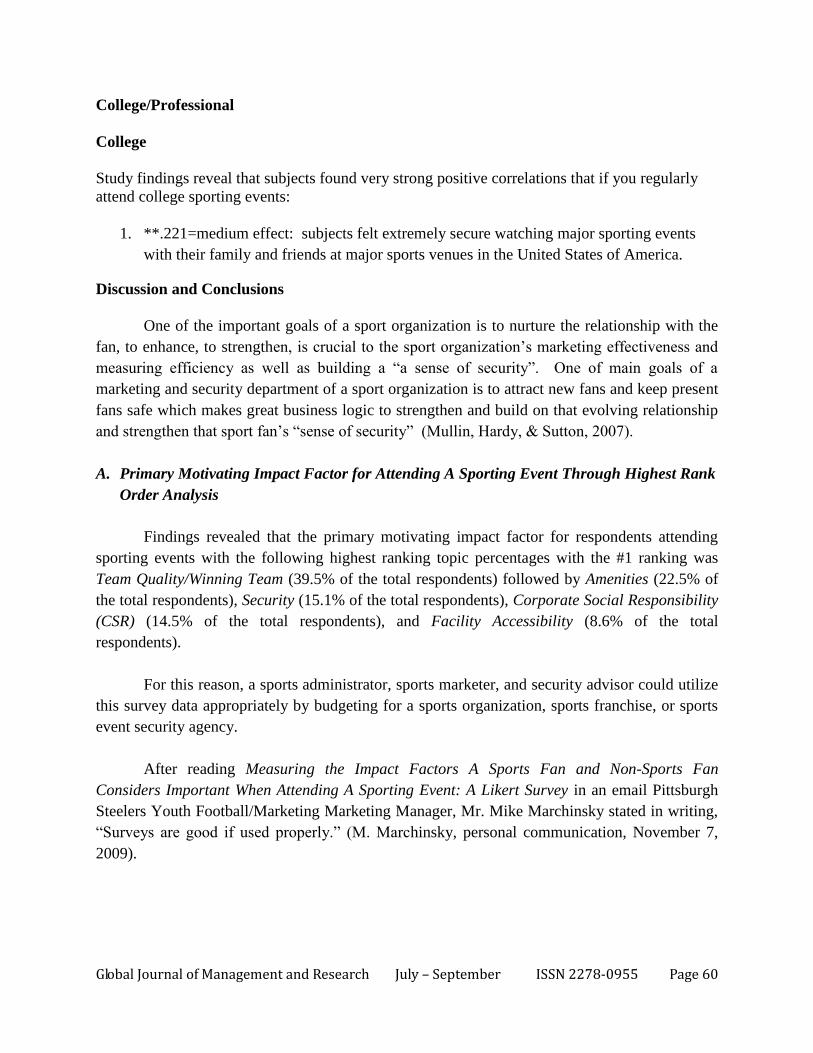
College/Professional
College
Study findings reveal that subjects found very strong positive correlations that if you regularly
attend college sporting events:
1. **.221=medium effect: subjects felt extremely secure watching major sporting events
with their family and friends at major sports venues in the United States of America.
Discussion and Conclusions
One of the important goals of a sport organization is to nurture the relationship with the
fan, to enhance, to strengthen, is crucial to the sport organization‟s marketing effectiveness and
measuring efficiency as well as building a “a sense of security”. One of main goals of a
marketing and security department of a sport organization is to attract new fans and keep present
fans safe which makes great business logic to strengthen and build on that evolving relationship
and strengthen that sport fan‟s “sense of security” (Mullin, Hardy, & Sutton, 2007).
A. Primary Motivating Impact Factor for Attending A Sporting Event Through Highest Rank
Order Analysis
Findings revealed that the primary motivating impact factor for respondents attending
sporting events with the following highest ranking topic percentages with the #1 ranking was
Team Quality/Winning Team (39.5% of the total respondents) followed by Amenities (22.5% of
the total respondents), Security (15.1% of the total respondents), Corporate Social Responsibility
(CSR) (14.5% of the total respondents), and Facility Accessibility (8.6% of the total
respondents).
For this reason, a sports administrator, sports marketer, and security advisor could utilize
this survey data appropriately by budgeting for a sports organization, sports franchise, or sports
event security agency.
After reading Measuring the Impact Factors A Sports Fan and Non-Sports Fan
Considers Important When Attending A Sporting Event: A Likert Survey in an email Pittsburgh
Steelers Youth Football/Marketing Marketing Manager, Mr. Mike Marchinsky stated in writing,
“Surveys are good if used properly.” (M. Marchinsky, personal communication, November 7,
2009).
Global Journal of Management and Research July – September ISSN 2278-0955 Page 61
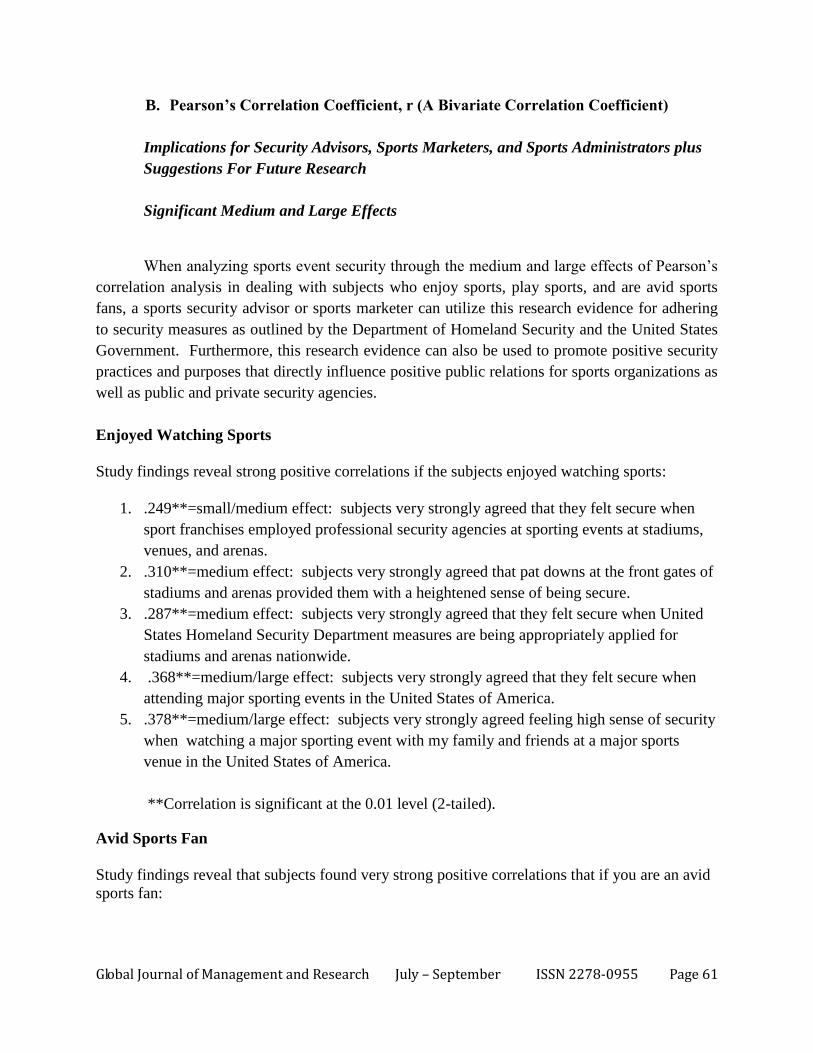
B. Pearson’s Correlation Coefficient, r (A Bivariate Correlation Coefficient)
Implications for Security Advisors, Sports Marketers, and Sports Administrators plus
Suggestions For Future Research
Significant Medium and Large Effects
When analyzing sports event security through the medium and large effects of Pearson‟s
correlation analysis in dealing with subjects who enjoy sports, play sports, and are avid sports
fans, a sports security advisor or sports marketer can utilize this research evidence for adhering
to security measures as outlined by the Department of Homeland Security and the United States
Government. Furthermore, this research evidence can also be used to promote positive security
practices and purposes that directly influence positive public relations for sports organizations as
well as public and private security agencies.
Enjoyed Watching Sports
Study findings reveal strong positive correlations if the subjects enjoyed watching sports:
1. .249**=small/medium effect: subjects very strongly agreed that they felt secure when
sport franchises employed professional security agencies at sporting events at stadiums,
venues, and arenas.
2. .310**=medium effect: subjects very strongly agreed that pat downs at the front gates of
stadiums and arenas provided them with a heightened sense of being secure.
3. .287**=medium effect: subjects very strongly agreed that they felt secure when United
States Homeland Security Department measures are being appropriately applied for
stadiums and arenas nationwide.
4. .368**=medium/large effect: subjects very strongly agreed that they felt secure when
attending major sporting events in the United States of America.
5. .378**=medium/large effect: subjects very strongly agreed feeling high sense of security
when watching a major sporting event with my family and friends at a major sports
venue in the United States of America.
**Correlation is significant at the 0.01 level (2-tailed).
Avid Sports Fan
Study findings reveal that subjects found very strong positive correlations that if you are an avid
sports fan:
Global Journal of Management and Research July – September ISSN 2278-0955 Page 62
1. .257**=medium effect: subjects felt extremely secure when sports franchises employ
security agencies at sporting events at stadiums, venues, and arenas.
2. .261**=medium effect: subjects felt extremely secure that pat downs at the front gates at
stadiums and arenas provided me with a heightened sense of being secure.
3. .239**=small/medium effect: subjects felt extremely secure that the United States
Homeland Security Department measures were being applied appropriately for stadiums
and arenas nationwide.
4. .342**=medium effect: subjects felt extremely secure at major sporting events in the
United States of America.
5. .370**=medium/large effect: subjects felt extremely secure watching a major sporting
event with family and friends at a major sports venue in the United States of America.
**Correlation is significant at the 0.01 level (2-tailed).
Played Sports
Study findings revealed very strong positive correlations with thinking that if the subjects
enjoyed playing sports:
4. ..226**=small/medium effect: subjects strongly agreed that they felt a heightened sense
of security with pat downs at the front gates of stadiums and arenas.
5. .251**=medium effect: subjects strongly agreed that they felt secure at major sporting
events in the United States of America.
6. .269**=medium effect: subjects strongly agreed that they felt secure when watching a
major sporting event with my family and friends at a major sports venue in the United
States of America.
**Correlation is significant at the 0.01 level (2-tailed).
Study findings revealed very strong positive correlations if the subjects enjoyed playing
sports:
2. .169*=small effect: subjects agreed that they felt secure when Homeland Security
Department measures were being appropriately applied to stadiums and arenas
nationwide.
*Correlation is significant at the 0.05 level (2-tailed).
For instance, by examining these medium and large effects of Pearson‟s correlation
analysis, a researcher can see that the Department of Homeland Security policies and procedures
are efficient and effective. The general “sense” by sports fans and non-sports is that Homeland
Global Journal of Management and Research July – September ISSN 2278-0955 Page 63
Department of Security presents security measures that are being appropriately applied for
stadiums and arenas nationwide. Subjects who enjoyed watching sports and were avid sports
fans measured “medium effects”. Subjects felt strongly secure when pat downs occurred at
stadiums and arenas, thus providing a greater “sense of security”, and “large effects” when
attending major sporting events and sports venues with friends and family. Subjects who played
sports felt secure but the statistical strength only reached small and medium effects. Meaning
that sports fans who enjoyed watching sports and were avid sports fans felt more secure at
sporting events than the subjects who enjoyed playing sports themselves.
Moreover, Measuring the Impact Factors A Sports Fan and Non-Sports Fan Considers
Important When Attending A Sporting Event: A Likert Survey should be utilized as reinforcement
to tough Department of Homeland Security measures where September 11th
and noted sports
related terrorism in the past such as the 1972 Summer Olympics in Munich, Germany, and the
1996 Atlanta Olympic Games made clear that stadium and arena operators must operate and
incorporate security safeguards and measures at America‟s great sporting venues (Hall,
Marciani, Cooper, & Rolen, 2008).
This research pinpoints and illustrates that it is critical to continue to develop and
improve current security measures so that in the future “large effects” in the realm of “sense of
security” is felt by subjects who enjoy sports, play sports and are avid sports fans. As Former
Secretary Tom Ridge, Department of Homeland Security stated, “The homeland is secure when
the home town is secure.” This homeland includes sporting events because they are strongly
connected to the American Economy and culture, thus have become prime targets of terrorism
(Miller, Veltri, and Gillentine, 2008). Furthermore, this research provides positive evidence and
validation that the Department of Homeland Security in conjunction with the Mississippi
Emergency Management agency, was appropriate in awarding the University of Southern
Mississippi a $568,000 research grant to create and continue to develop and fine tune a research
based model for the security management of university sport venues such as the The Sports
Event Security Assessment Model (SESAM) and develop “basic steps to event security” and
Sports Event Security Aware Systems (Hall, Marciani, Cooper, & Rolen, 2008).
References:
Babbie, E. (2007). The practice of social research. California: Thomson Wadsworth.
Field, A. (2009). Discovering statistics using spss. London: SAGE Publications Ltd.
Female and Male Sports fans: A comparison of sport consumption motives.
Journal of Sport Behavior (2009). Retrieved September 10, 2009 from http://goliath.ecnext.com.
Hall, S. (2008). Effective security management of university sport venues. The Sport
Journal. Retrieved August 31, 2009 from http://www.thesportsjournal.org.
Hall, S., Marciani, L., Cooper, W. E., & Rolen, R. (2008). Introducing a risk assessment model for
sport venues. The Sport Journal. Retrieved September 8, 2009 from
http://www.thesportsbusinessjournal.org.
Global Journal of Management and Research July – September ISSN 2278-0955 Page 64
Hall, S., Marciani, L., Phillips, D., & Cunningham, T. (2009). Spectator perceptions of
security management at a NASCAR event. The Sports Journal. Retrieved
September 9, 2009, from http://thesportsjournal.org.
Howard, D. R., & Crompton, J. L. (2005). Financing Sport (2nd ed., pp. 351-382).
Morgantown, WV: Fitness Information Technology.
Lee, J. (2001). Colleges work up an appetite for pro service.
Sports Business Journal. Retrieved August 30, 2009 from
http://www.sportsbusinessjournal.com/article/5006.
Lee, N., & Lings, I. (2008). Doing business research, a guide to theory and practice.
London:Sage.
Lemke, T. (2008). Yankees, cowboys make concessions. The Washington Times,
Retrieved August 28, 2009 from
http://www.washingtontimes.com/news/2008/oct/21/yankeescowboys-make-concessions
Lincoln, Y., & Guba, E. (1985). Naturalistic inquiry. Newbury Park, CA:Sage.
Miller, J., Veltri, F. & Gillentine, A. (2008). Spectator perception of security at the super
bowl after 9/11: implications for sport facility managers.
The SMART Journal, 4(2), 16-25.
McDonald, J. L. (2004). The optimal number of categories for numerical rating scales (Doctoral
Dissertation, University of Denver, 2004). Dissertation Abstracts International. 65 (05),
1664. (UMIN.3134422.
Mullin, B., Hardy, S., & Sutton, W. (2007). Sport marketing. Human Kinetics Publishers.
Nyeck, S., & Pons, F. (2006). Consumer orientation toward sporting events.
Journal of Service Research, 8(3), 276-287.
Official Site of the Pittsburgh Steelers (2009). Retrieved on October 11, 2009
from http://news.steelers.com/fanzone.
Official Site of the Tampa Bay Rays (2008). Retrieved on July 16, 2009
from http://tampabay.rays.mlb.com/index.jsp?c_id=tb.
Preston, C. C., & Coleman, M. (2000). Optimal number of response categories in rating
scales: reliability, validity, discriminating power, and respondent preferences.
Acta Psychologica 104, 1-15.
Rosner, S., & Shropshire, K. (2004). The Business of Sports. Sudbury , MA :
Jones and Bartlett Publishers, Inc.
See, L. H., & Yusof, A. (2008). Spectator perceptions of physical facility and team
quality: A Study of a Malayasian super league soccer match. Research Journal
of International Studies, 8, 132-140.
Stoldt, Dittmore, & Branvold, Sport Public Relations. (2006).
**************************
.
Copyright © 2022 FDOKUMEN

