


Bahasa
Halaman
Hukum


Eastern Kentucky UniversityEncompass
Online Theses and Dissertations Student Scholarship
January 2012
Math Intervention Teachers' Pedagogical ContentKnowledge And Student AchievementLisa Ivey WallerEastern Kentucky University
Follow this and additional works at: https://encompass.eku.edu/etd
Part of the Educational Administration and Supervision Commons
This Open Access Dissertation is brought to you for free and open access by the Student Scholarship at Encompass. It has been accepted for inclusionin Online Theses and Dissertations by an authorized administrator of Encompass. For more information, please contact [email protected].
Recommended CitationWaller, Lisa Ivey, "Math Intervention Teachers' Pedagogical Content Knowledge And Student Achievement" (2012). Online Theses andDissertations. 57.https://encompass.eku.edu/etd/57


MATH INTERVENTION TEACHERS’ PEDAGOGICAL CONTENT KNOWLEDGE
AND STUDENT ACHIEVEMENT
By
Lisa Ivey Waller
Education Leadership and Policy Studies Eastern Kentucky University
Richmond, Kentucky 2012
Submitted to the Faculty of the Graduate School of Eastern Kentucky University
in partial fulfillment of the requirements for the degree of
DOCTOR OF EDUCATION May, 2012

ii
Copyright © Lisa Ivey Waller, 2012 All rights reserved

iii
DEDICATION
This dissertation is dedicated to my Lord Jesus Christ, who has blessed me with a supportive family and a joyous career in education. It is also dedicated to my husband, James Waller; our sons, Matt, Nathan, Clay, and Blake; our daughter, Sara; my mother,
Barbara Ivey; and the memory of my father, Bill Ivey.

iv
ACKNOWLEDGMENTS
First, I wish to express appreciation to those who have challenged and equipped
me for this endeavor. My dissertation committee chair, Dr. Charles Hausman, has been
an encouragement, invested his time generously, and helped to transform the questions of
this study into sound quantitative analyses. Dr. Karen Frohoff, Dr. Jessica Hearn, Dr.
Deborah West, and Dr. Rita Davis have provided invaluable feedback and moral support
as advisory committee members. Alice Gabbard at KCM has made data readily available
and generously responded to my questions. I am grateful to have enjoyed the leadership
of educators that embody excellence.
Second, I want to thank the teachers and students who have blessed my
professional life with meaning. The best teachers I know are always students. In their
thoughtful classrooms, everyone is both learner and teacher. I hope this study will
contribute to the understanding of this important relationship.
Third, on a personal level, I would like to express my gratitude to Jimmy Waller,
my husband. His unfailing encouragement and excellent care of our home and family
have allowed me to pursue this goal. I want to thank our children; Matt, Nathan, and Sara
Hutson; Clay and Blake Waller, who have looked out for one another and grown into
responsible young adults. Finally, I must express my deepest appreciation to my mother,
Barbara Ivey, because she and my father, the late Bill Ivey, taught me to enjoy learning
and love learners.

v
Abstract
This research investigated the relationship of math intervention teachers’ (MITs)
pedagogical content knowledge (PCK) and students’ math achievement gains in primary
math interventions. The Kentucky Center for Mathematics gathered data on the MITs and
primary math intervention students included in this study. Longitudinal data were
analyzed for a sample of 65 teachers with one to four years of experience as math
interventionists. Analyzed student data were from an 889 student sample (kindergarten to
grade three) from the fourth year of Kentucky’s math interventions. The students in the
sample were taught by the teachers in the sample, using Mathematics Recovery,
Add+Vantage Math Recovery, and Number Worlds math intervention programs.
The study examined how achievement gains were affected by teachers’ years of
math intervention experience; hours of training, collegial support, and contact with
students for instruction; and scores on the Learning Mathematics for Teaching test as a
measure of pedagogical content knowledge. The investigation also considered the impact
of students’ grade, gender, history of retention, prior math achievement, and whether they
received services through special education. The dependent variable in all analyses was
student math achievement score gains: the difference in students’ scaled scores on pre
and post-intervention administrations of Terra Nova Math achievement tests.
A significant positive correlation was identified between students’ math
achievement gains with their contact hours with the MIT for math instruction (r = .23, p <
.00). PCK had significant positive correlations with teachers’ hours of training and years
of MIT experience (r = .07, p < .00 and r = .12, p < .00, respectively). Regression

vi
analysis identified contact hours for instruction, lower grade level, teachers’ PCK, and
students’ IEP status as significant predictors of math achievement gains. Students with
more contact hours and students in lower grades made greater math achievement gains.
Teachers’ PCK had as much influence on student achievement as disability status.
Analysis of Covariance and post hoc analyses determined that when entry math
achievement scores were used to rank intervention students in quartiles, students in the
lower quartiles made greater gains compared to peers in higher performing quartiles.

vii
TABLE OF CONTENTS
CHAPTER PAGE I. CHAPTER ONE: INTRODUCTION ............................................................................ 1
Purpose ...................................................................................................................... 2
Problem Statement .................................................................................................. 2
Research Questions ................................................................................................... 3
Rationale for Early Mathematics Intervention .......................................................... 3
Math Difficulties Are a National Concern ....................................................... 4
Early Math Achievement Predicts Future Achievement ................................. 5
Deficits Persist Despite Core Math Instruction ............................................... 7
Underachievement Contributes to Achievement Gaps and Math Difficulties ..8
Early Intervention in Primary Grades ............................................................ 10
Rationale for the Study of Teachers’ Pedagogical Content Knowledge ................ 12
Definition of Terms ........................................................................................ 16
Rationale for Study of Kentucky’s Mathematics Interventions ............................... 17
Logic Model .............................................................................................................19
Variable One: Professional Training ............................................................. 20
Math Recovery training .........................................................................21
Ongoing assessment in Math Recovery ............................................... 22
Classroom Instructional Framework for Early Numeracy ......................24
Number Worlds training ........................................................................25
Variable Two: Collegial Support ....................................................................25
Variable Three: Experience as a Mathematics Intervention Teacher .............26
Variable Four: Pedagogical Content Knowledge ...........................................27
Variable Five: Contact Hours for Intervention Instruction .............................27
Dependent Variable: Student Math Achievement Gains ................................28

viii
II. CHAPTER TWO: LITERATURE REVIEW ..............................................................29
Early Intervention in Mathematics .......................................................................... 29
Pedagogical Content Knowledge .............................................................................33
Training the Mathematics Intervention Teachers ................................................... 34
Knowledge of Content ....................................................................................39
Knowledge of Students .................................................................................. 42
Zone of Proximal Development ................................................................45
Prior achievement .................................................................................... 47
Knowledge of Pedagogy and Pedagogical Content Knowledge................... 49
Collegial Support .................................................................................................... 51
Teacher Experience ..................................................................................................55
Contact Hours for Instruction ..................................................................................58
Summary ..................................................................................................................59
III. CHAPTER THREE: METHDOLOGY ......................................................................60
Method .....................................................................................................................61
Research Design ..............................................................................................61
Research Questions ........................................................................................ 62
Context of the Study .................................................................................... 65
Student math achievement in Kentucky .................................................. 65
Math Achievement Fund grant program ...................................................66
Students Receiving Early Math Intervention ..................................................67
Teachers Providing Math Intervention Instruction .........................................68
Student and Teacher Samples for Study .........................................................68
Data Collection .............................................................................................. 69
Teacher Variables ...........................................................................................71
Training for math intervention ..................................................................71

ix
Collegial support ........................................................................................71
Experience as an MIT ................................................................................72
Pedagogical content knowledge .................................................................73
Contact hours for instruction .....................................................................74
Math intervention program ........................................................................74
Student Variables .............................................................................................79
Grade .........................................................................................................79
Retention and IEP status ............................................................................79
Gender ........................................................................................................80
Prior math achievement .............................................................................80
Dependent Variable .........................................................................................81
Student math achievement gains ................................................................81
Relationships between Variables with Math Achievement Gains ............................81
Assessments Included in Data Analyses ..................................................................84
Measure of student achievement: Terra Nova Math tests. .......................84
Measure of teachers’ PCK: Learning Mathematics for Teaching tests .....85
LMT item design............................................................................... 85
LMT administration ............................................................................86
LMT use in this analysis .....................................................................88
Summary ................................................................................................................. 88
IV. CHAPTER FOUR: RESULTS ................................................................................... 89
Overview of the Study .............................................................................................89
Student Sample .............................................................................................. 90
Mean math achievement gains ................................................................. 91
Gains by grade ........................................................................................ 91
Gains by retention status ......................................................................... 92
Gains by gender ........................................................................................93

x
Gains by IEP status ................................................................................. 94
Math Intervention Teacher Sample ............................................................... 95
Student gains by MITs’ year of experience ............................................ 95
Descriptive statistics for teacher variables .............................................. 96
Research Question One ................................................................................ 97
Correlations between Student and Teacher Variables with Math Achievement
Gains .............................................................................................................. 98
Correlations between Teacher Variables ................................................... 100 Correlations between Student Variables .................................................... 100
Regression ............................................................................................ 101
Research Question Two ................................................................................. 102
Prior Math Achievement ........................................................................................ 102 Summary ................................................................................................................113
V. CHAPTER FIVE: DISCUSSION AND RECOMMENDATIONS...........................114
Discussion of Results ..............................................................................................114 Purpose of the Study ......................................................................................114 Summary of Findings .....................................................................................115 Question One .................................................................................................117 Pedagogical Content Knowledge ...................................................................117 Early Math Intervention .................................................................................119
Math achievement gains as the dependent variable .................................119 Explanation of Results ............................................................................................121
Building Pedagogical Content Knowledge ....................................................121 Hours of collegial support variable ..........................................................122 Years of experience as an MIT variable ..................................................124
Applying Pedagogical Content Knowledge to Instruction ...........................126 Instruction contact hours variable ............................................................126 Math achievement gains dependent variable ...........................................127

xi
Question Two .................................................................................................129 Prior Math Achievement Levels ....................................................................129 Effect of Prior Math Achievement Levels on Students’ Gains......................131
Limitations of the Study.......................................................................................133 Implications for Future Research .........................................................................135
Early Math Intervention .................................................................................135 Teacher Training and Support .......................................................................136 Longitudinal Study of PCK ...........................................................................138 Math Intervention and Special Education ......................................................139
Implications for Policy and Practice ....................................................................141 Elementary Math Teacher Training Programs ...............................................141 Math Intervention Programs ..........................................................................142 Federal and State Policies ..............................................................................144
Conclusion ...........................................................................................................146
LIST OF REFERENCES .................................................................................................148
Appendices .......................................................................................................................176
A. Kentucky Revised Statutes...........................................................................176
B. Learning Mathematics for Teaching (LMT) Released Items .......................192
C. Kentucky Center for Mathematics MIT Handbook .....................................199
D. Parental Permission for Intervention and Terra Nova Assessment .............227
E. Institutional Review Board Certificate .........................................................230
VITA ................................................................................................................................232
xii
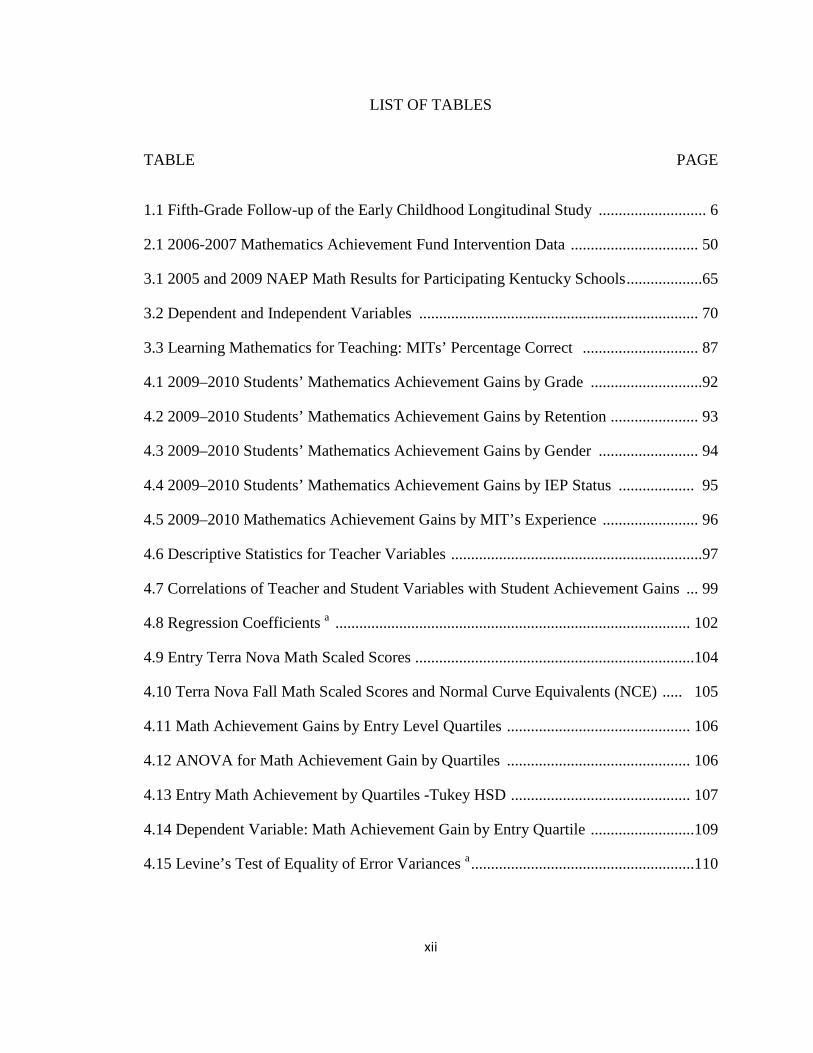
LIST OF TABLES
TABLE PAGE
1.1 Fifth-Grade Follow-up of the Early Childhood Longitudinal Study ........................... 6
2.1 2006-2007 Mathematics Achievement Fund Intervention Data ................................ 50
3.1 2005 and 2009 NAEP Math Results for Participating Kentucky Schools ...................65
3.2 Dependent and Independent Variables ...................................................................... 70
3.3 Learning Mathematics for Teaching: MITs’ Percentage Correct ............................. 87
4.1 2009–2010 Students’ Mathematics Achievement Gains by Grade ............................92
4.2 2009–2010 Students’ Mathematics Achievement Gains by Retention ...................... 93
4.3 2009–2010 Students’ Mathematics Achievement Gains by Gender ......................... 94
4.4 2009–2010 Students’ Mathematics Achievement Gains by IEP Status ................... 95
4.5 2009–2010 Mathematics Achievement Gains by MIT’s Experience ........................ 96
4.6 Descriptive Statistics for Teacher Variables ...............................................................97
4.7 Correlations of Teacher and Student Variables with Student Achievement Gains ... 99
4.8 Regression Coefficients a ......................................................................................... 102
4.9 Entry Terra Nova Math Scaled Scores ......................................................................104
4.10 Terra Nova Fall Math Scaled Scores and Normal Curve Equivalents (NCE) ..... 105
4.11 Math Achievement Gains by Entry Level Quartiles .............................................. 106
4.12 ANOVA for Math Achievement Gain by Quartiles .............................................. 106
4.13 Entry Math Achievement by Quartiles -Tukey HSD ............................................. 107
4.14 Dependent Variable: Math Achievement Gain by Entry Quartile ..........................109
4.15 Levine’s Test of Equality of Error Variances a ........................................................110

xiii
4.16 Tests of Between-Subjects Effects a b .....................................................................111
4.17 Estimated Marginal Means: Entry Math Achievement Quartile ........................... 112
4.18 Pair Wise Comparisons of Math Achievement Gains by Entry Quartile ................113
5.1 Percent of Special Education Enrollment by Disability: Kentucky and Surrounding
States ..........................................................................................................................139
5.2 2005, 2009, and 2011 NAEP Math Results for Participating Kentucky Schools ......144

xiv
LIST OF FIGURES
FIGURE PAGE
1.1 Kentucky’s 2005–2006 Graduation Gaps: Estimated Four Year Graduation Rate .... 9
1.2 Perspectives on Pedagogical Content Knowledge (PCK) ...........................................15
1.3 Logic Model: Teachers’ Pedagogical Content Knowledge and Student Math
Achievement Gains ......................................................................................................19
3.1 Teachers’ Pedagogical Content Knowledge and Student Math Achievement Gains ..64
3.2 First Grade Math Achievement Gains through Spring of Second Grade ....................76
3.3 Second Grade Math Achievement Gains through Spring of Third Grade ................. 77
3.4 Third Grade Math Achievement Gains through Spring of Fourth Grade ...................78
3.5 Possible Relationships between Teacher and Student Variables with Primary
Intervention Students’ Math Achievement Gains ........................................................83
3.6 MITs’ 2009–2010 Learning Mathematics for Teaching Test Scores: Compared to
Normal Curve for MITs’ first LMT Scores .................................................................87
4.1 Students’ Entry Math Achievement Quartiles, Gains, and Grades .......................... 108
5.1 Statistically Significant Relationships with Math Achievement Gains .....................116

1
CHAPTER ONE: INTRODUCTION
“What is math?” Miss Deborah asked the primary students gathered about her feet.
“I don’t know what math is,” confessed one wide-eyed child. “I thought you knew.”
Miss Deborah and educators around the world are re-examining early
mathematics teaching and learning (Tapp, 2010). Together, teachers and students are
discovering answers to the question, “What is math?” Schools are asking how early
mathematics should be learned and what to do when young students struggle with
mathematics. Although preschool children begin to use mathematics to tell their age, ask
for quantities of things they want, play games, and describe the shapes and sizes of
objects; they do not all come to kindergarten with the same math and numeracy
experiences. They certainly do not all leave school with the same levels of mathematical
understanding. Will students come to see themselves as mathematicians? Will they
graduate with the ability to make correct change as cashiers, manage their personal
finances, engineer magnificent buildings, or compete in a global economy? It depends.
Students’ math achievement outcomes are influenced by the characteristics of individual
students and teachers who orchestrate their learning experiences. The term pedagogical
content knowledge denotes teachers’ specialized knowledge of math content, students,
and instructional strategies that best suit students and the content. The purpose of this
chapter is to discuss the importance of early math intervention for struggling students and
the potential influence of teachers’ pedagogical content knowledge.

2
Purpose
Math proficiency empowers students in everyday functioning and future careers,
while math deficiencies may adversely affect many aspects of their lives. When schools
provide high-quality instruction for struggling math students, their goals are to accelerate
students’ learning, close achievement gaps for disadvantaged populations, and reduce the
number of young people who require special education services for Math Disabilities
(National Association of State Directors of Special Education, 2005). Successful
intervention depends on the teacher’s ability to assess student understanding and respond
with instruction that communicates sound mathematics content to the learner (Ellmore-
Collins & Wright, 2008). The integrated knowledge set that a teacher employs is
pedagogical content knowledge (Shulman, 1989). This study will investigate the
relationship of Mathematics Intervention Teachers’ pedagogical content knowledge
(PCK) to primary students’ achievement gains; hypothesizing that teacher training,
support, and experience affect teachers’ PCK and that teachers’ PCK affects student
achievement through math instruction fitted to the learner and the content.
Problem Statement
The purpose of this study is to contribute to math intervention research by
analyzing the effect of teachers’ pedagogical content knowledge on students’ math
achievement gains. Early math interventions may accelerate primary students’ learning,
close achievement gaps for disadvantaged populations, and reduce the number of students
requiring special education services for Math Disabilities. Pedagogical content
3
knowledge includes competence to assess student understanding and the ability to
respond with instruction that effectively communicates mathematics to the learner. This
study examines the relationship of Kentucky’s grant-funded Math Intervention Teachers’
pedagogical content knowledge (PCK) with primary students’ achievement gains. It is
hypothesized that professional training, the support of colleagues, experience, and self-
reflection develop a teacher’s PCK. It is anticipated that PCK impacts the quality of a
teacher’s decision-making and instruction to affect students’ math achievement gains.
Research Questions
(1) What is the relationship between a Mathematics Intervention Teacher's pedagogical
content knowledge, training hours, collegial support hours, years of intervention
experience, and intervention contact hours with students’ math achievement gains?
(2) Do math achievement gains differ between primary intervention students in each
quartile of prior math achievement?
Rationale for Early Mathematics Intervention
The vision for improving primary math education in the United States includes
early intervention when students struggle. Four rationales for early intervention in the
related literature are: (a) Mathematics difficulties are a national concern; (b) Early math
achievement is a strong predictor of a student’s future achievement; (c) Without early
intervention, deficits persist despite core math instruction; and (d) Underachievement in
mathematics contributes to minority achievement gaps and math disabilities.

4
Math Difficulties Are a National Concern
The first rationale for early intervention is that mathematics difficulties and math
underachievement are of national concern. Children’s early deficits were described in
terms of their skills and cognitive functioning by the U.S. Department of Education’s
Early Childhood Longitudinal Study for the Kindergarten Class of 1998–1999 (DiPerna,
Pui-Wa, & Reid, 2007). The study found that 6% of students were unable to count ten
objects when they entered kindergarten. They also found that 43% were unable to count
20 objects. The 2009 National Assessment of Educational Progress has shown average
student achievement at fourth grade increasing from a score of 213 to 240 since 1990, but
documented no change from 2007 to 2009 (Rampey, Dion, & Donahue, 2009). The 2007
Trends in International Mathematics and Science Study (TIMSS) reported U.S. fourth
grade (529) and eighth grade (508) average mathematics scores as higher than the TIMSS
average (500), but lower than averages for five countries at fourth and eighth grades
(Gonzales et al., 2008). Asian and European countries outperformed the U.S. across
content and cognitive domains, with significantly more students reaching TIMSS
Advanced International Benchmarks. The Program for International Student Assessment
(2009) reported that fifteen year olds in the United States scored lower on mathematical
literacy than the average score of fifteen year olds in the 34 countries with the world’s
most advanced economies. National concerns about math achievement contributed to
federal policy revisions. Early intervention programs became a part of federal policy in
the 2004 Elementary and Secondary Schools Act and Individuals with Disabilities
Education Act (IDEA, 20 U.S.C. § 140, 2004).

5
Early Math Achievement Predicts Future Achievement
The second rationale for early intervention is that early mathematics achievement
is a strong predictor of a student’s future achievement. Math skills upon entry to school
are the strongest predictor of future math performance and future reading skills (Duncan
et al., 2007). In fact, math skills upon entry to school were a better predictor of later
reading achievement than even entry level reading skills. Early struggles may affect
future math performance through a lack of foundational numeracy skills, persisting
misconceptions, inefficient or inadequate strategies, attention difficulties, and other poor
patterns of cognition (Duncan et al., 2007; Fosnot & Dolk, 2001; Grissemier, Grimm,
Aiyer, Murrah, & Steele, 2010; Van Luit & Schopman, 2000).
Early intervention is crucial because early mathematics success has such a strong
correlation to future math achievement. Grissemier et al. and others have confirmed the
strong predictive value of early math achievement by following students from
kindergarten through fifth grade (Grissemier et al., 2010; Pagani, Fitzpatrick,
Archambault, & Janosz 2010). The U.S. Department of Education’s longitudinal study of
the kindergarten class of 1998–1999 followed students through spring of their 5th grade
year. Students’ achievement test scores from fall of their kindergarten year were used to
group them as being in the lowest, middle, or highest third of their class. Table 1.1 shows
the percentage of children that demonstrated specific mathematics knowledge and skills
in spring of 2004.

6
Table 1.1.
Fifth-Grade Follow-up of the Early Childhood Longitudinal Study
Kindergarten: Fall 1998
Fifth Grade: Spring 2004 Math Achievement
Multiplication, Division
Place Value
Rate, Measurement Fractions Area,
Volume
Lowest Third 82.1 47.2 15.4 1.7 0.1 Middle Third 95.6 77.6 39.3 7.5 0.6 Highest Third 99.5 95.7 74.0 30.5 4.7
Note. Adapted from Findings from the Fifth-Grade Follow-up of the Early Childhood Longitudinal Study,
Kindergarten Class of 1998–99 (ECLS-K). (NCES, 2006). U. S. Department of Education.
The five areas of mathematics proficiency included in the report, ordered by level
of difficulty, were (1) simple multiplication, division, and complex number patterns; (2)
place value with integers to hundreds place; (3) word problems with measurement and
rate; (4) word problems with fractions; and (5) word problems with area and volume.
Students in the highest third of the 1998 kindergarten class were most likely to be the
highest third of their 2004 fifth grade class. Students in the lowest third of their
kindergarten class scored lower as fifth grade students than students in the other ranges
for overall mathematics. The students from the lowest third of the kindergarten class were
least likely to demonstrate proficiency in any area of math (Grissemier et al., 2010).
In addition to demonstrating that early struggles can predict future math
difficulties, the data in Table 1.1 makes connections to the last two rationales for early
intervention. The discrepancy in student performance on the fifth grade assessment was
greater as the level of challenge increased for the math content and skills. This illustrates

7
how math difficulties may persist and be amplified as students move into higher grades
with more challenging curricula.
Deficits Persist Despite Core Math Instruction
The longitudinal data from the Early Childhood Longitudinal studies also
illustrate the third rationale for early intervention: difficulties in mathematics often persist
despite years of core math instruction (Duncan et al., 2007; Princiotta, Flanagan, &
Germino Hausken, 2006). Early intervention instruction can supplement core math
instruction, improve number sense that is needed as a foundation for understanding
mathematics, and accelerate student achievement. Without intervention, the achievement
gap between struggling mathematics students and their peers continues to widen (Aunola,
Leskinen, & Lerkin, 2004). The U.S. Department of Education’s Early Childhood
Longitudinal Study for the Kindergarten Class showed that students who scored in the
lowest third of their class in kindergarten were less likely to score proficient in fifth grade
on measures of multiplication and division, place value, rate and measurement, fractions,
area, and volume (Princiotta et al., 2006). At-risk students were found to make
achievement gains that were greater than their non-at-risk peers when they received
intervention in addition to core math instruction, but replacing core instruction with
intervention did not allow at-risk students to narrow their achievement gap (Fuchs, Fuchs,
Craddock, Hollenbeck, & Hamlet, 2008). Early math intervention can help students
correct their misconceptions and develop skills and understanding. When young students
experience success and develop persistence in problem-solving, their early difficulties

8
need not predestine them for underachievement in mathematics (Griffin, 2004; Griffin &
Case, 1996; Wright, Martland, Stafford, & Stanger, 2006).
Underachievement Contributes to Achievement Gaps and Math Difficulties
The fourth and most compelling rationale for early intervention is the reduction of
the number of students who have persisting math difficulties and over-identification of
learning disabilties. An estimated 6% to 8% of students have math learning disabilities or
general learning disabilities that produce underachievement in mathematics (Barbaresi,
Katusic, Colligan, Weaver, & Jacobsen, 2005; Fleischner & Manheimer 1997; Seethaler
& Fuchs, 2005). Students with math disabilities often struggle with reading as well,
compounding their difficulties. Researchers at Vanderbilt University estimate that
reading disabilities affect 43% of students with math disabilities (Fuchs & Fuchs, 2002).
Approximately 2.5 million U.S. students received services for Specific Learning
Disabilities in 2009, including 14,025 students in Kentucky (NCES, 2010a; DAC, 2010).
According to the National Center for Education Statistics for 2007 (NCES,
2010b), 4% of six to twenty-one (6–21) year-old students had diagnoses of specific
learning disabilities. The proportions of students with learning disabilities by race were
7% of American Indians/Alaska Natives, 5% of Blacks and Hispanics, 3% of Whites, and
2% of Asians/Pacific Islanders. The National Math Advisory Panel reported that, “at least
(five) 5% of students will experience a significant learning disability in mathematics
before completing high school, and many more children will show learning difficulties in
specific mathematical content areas” (NMAP, 2008, p. 4-xxvi). Math ability becomes a

9
55%
59%
70%
83%
72%
0% 20% 40% 60% 80% 100%
Hispanic
African American
White
Asian
All Students
gatekeeper due to the extent of its influence on interpersonal relationships, grades,
college opportunities, personal finances, and career advancement (Moses, Kamii, Swap,
& Howard, 1998). Under IDEA (2004), states must monitor for significant
disproportionality of minority students in any aspect of special education diagnosis or
service options. The importance of addressing minority underachievement and
disproportionate numbers of minority students with disabilities is seen in Kentucky’s
Graduation Rates for 2005–2006, which is illustrated in Figure 1.1.
Figure 1.1. Kentucky’s 2005-2006 Graduation Gaps: Estimated Four Year
Graduation Rate. Comparison shows gaps between the rate for all students with
Hispanic (-17 points) and African American students (-13 points) to illustrate
one rationale for early math intervention programs. Adapted from The Alliance
for Excellent Education (2009): http://www.all4ed.org/files/Kentucky_wc.pdf.
Kentucky’s 2005–2006 graduation rates were 59% for African American students,
55% for Hispanic students, and 72% for all students. The reality of the graduation rates in
Figure 1.1 could be visualized as standing in front of forty of Kentucky’s kindergarten

10
students and selecting twelve of them to send home without an education: two Asian
children, three white children, four African American children, and five Hispanic
children. While diplomas are not awarded or denied in kindergarten, the work toward
improving graduation rates can begin in primary grades.
Early intervention can address the disproportionate number of minority students
that struggle with mathematics or require services through special education (Harry &
Klingner, 2006; Hosp & Reschly, 2002, 2004). High-quality instruction can allow
students to develop mathematical understanding of numbers and operations that are the
basis for problem solving. Students gain confidence and build stamina for problem
solving when they have instruction at the correct level of challenge. Carefully
orchestrated learning experiences can also accelerate their learning and close the
achievement gap between struggling students and their peers (Wright et al., 2006).
Early Intervention in Primary Grades
Early intervention does not refer to the chronological age of the student, but to
providing assistance to students before they develop a disability. The students in this
study are in primary grades. There is evidence that intervention during preschool,
kindergarten, and primary grades can have a substantial impact on students’ mathematics
achievement (Clements & Sarama, 2007; Fuchs, Fuchs, Yazdian, & Powell, 2002;
Griffin, Case, & Siegler, 1994). When sustained intervention is essential to student
progress, services through special education are valuable. However, it is critical that the
quality of instruction a student receives be the first consideration when a student

11
struggles in mathematics, rather than looking for a deficit in the learner (Hosp & Reschly,
2004; Kavale & Spalding, 2008). Improving core instruction and providing high quality,
early intervention instruction can reduce the number of students identified with learning
disabilities in mathematics.
There is a growing body of research that validates instructional strategies for
reducing math achievement gaps for primary students, preventing the need for special
education services. In a first grade math intervention, Fuchs and fellow researchers at
Vanderbilt University studied the impact of 16 weeks of small-group tutoring on
students’ math computation, concepts, applications, and story. The students had
significantly higher achievement than their peers in the control group throughout first
grade and had maintained a significant achievement advantage when re-evaluated at the
end of second grade (Fuchs, Fuchs, & Prentice, 2005). A subsequent study found that the
first grade students’ incidence of mathematics disability was significantly lower through
the spring of second grade, a full year after their math tutoring ended (Compton, Fuchs,
Fuchs, & Bryant, 2006). Teachers can help close achievement gaps and reduce the
number of students identified as having math disabilities through high quality instruction
and monitoring the student’s learning in response to intervention (Al Otaiba & Torgesen,
2007; Gersten, Jordan, & Flojo, 2005; Scanlon, Gelzheiser, Velluntino, Schatschneider,
& Sweeney, 2008).
Powerful goals of early math intervention have engaged the research community
in efforts to identify effective instructional strategies; based on the premise that
underachievement is the result of inadequate instruction and not a deficit in the student
12
(Cumbria Local Authority, 2007; Hosp & Madyun, 2007; Hughes & Dexter, 2009;
Scruggs & Mastropieri, 2002). Schools are implementing Response to Intervention (RTI)
processes that use formative assessment data to determine whether a particular
instructional strategy is adequately accelerating student achievement (Fuchs & Fuchs,
2008; Quenemoen, Thurlow, Moen, Thompson, & Morse, 2003; Speece, 2006). When
struggling students are not achieving at a level or pace that is commensurate with grade
level peers, improving instruction is the first consideration (Kavale & Spaulding, 2008).
The length and frequency of intervention lessons may be increased. The instructional
strategy may be changed or supplemented. Instruction may be delivered by a teacher with
specialized training (Burns, Scholin, Kosciolek, & Livingston, 2010; Rahn-Blakeslee,
Ikeda, & Gustafson, 2005). In most schools, teams of educators and school psychologists
study data and systematically select from among instructional strategies that are research-
validated. The intervention teacher is then responsible for implementing the strategy with
fidelity to accelerate the student’s learning.
Rationale for the Study of Teachers’ Pedagogical Content Knowledge
The rationale for examining teachers’ pedagogical content knowledge as a critical
variable in early math intervention is that the primary student who is struggling due to a
history of inadequate instruction in mathematics is substantially dependent upon the
teacher to make mathematics comprehensible (Abell, 2008; Graeber, 1999; Hill, Rowan,
& Ball, 2005). Students’ difficulties may be due to limited life or school experiences
(Bryant, 2005). Inadequate instruction may be due to previous assignment to teacher(s)
13
who did not possess an adequate repertoire of instructional strategies to address the
learner’s needs (Brownell, Sindlar, Kiely, & Danielson, 2010; Fleischner & Manheimer,
1997). A student may have gaps in understanding due to a mismatch between instruction
and the learner’s processing abilities or deficits (Berninger & Abbott, 1994).
The Mathematics Intervention Teacher must continually assess student
understanding and respond with effective instruction in order to make mathematics
comprehensible to the learner (Burns, Appleton, & Stehouwer, 2005; Fuchs & Fuchs,
2006; Hosp & Madyun, 2007). The intervention teacher must possess and make use of
several types of knowledge to accelerate the student’s learning (Griffin, Dodds, &
Rovegno, 1996; Shulman, 1986; Wilson, Shulman, & Richert, 1987). That knowledge
includes understanding of the student and the typical preconceptions and misconceptions
of students of that age for the specific math content being taught. Teachers use their
pedagogical content knowledge to select from a repertoire of content and topic-specific
instructional strategies (Shulman & Grossman, 1988).
Pedagogical content knowledge (PCK) is a useful construct for understanding the
mechanism of a teacher’s impact on student achievement (Abell, 2008; Ball, 1988, 1991;
Veal & MaKinster, 1999). In 1986, Lee Shulman of Stanford University sought to
influence the scope of teacher certification examinations by introducing the concept of
pedagogical content knowledge (PCK). He defined it as a particular kind of content
knowledge for teaching that included a grasp of common preconceptions and
misconceptions. Shulman suggested that PCK includes knowledge of the most powerful
demonstrations, illustrations, and explanations that make content comprehensible to
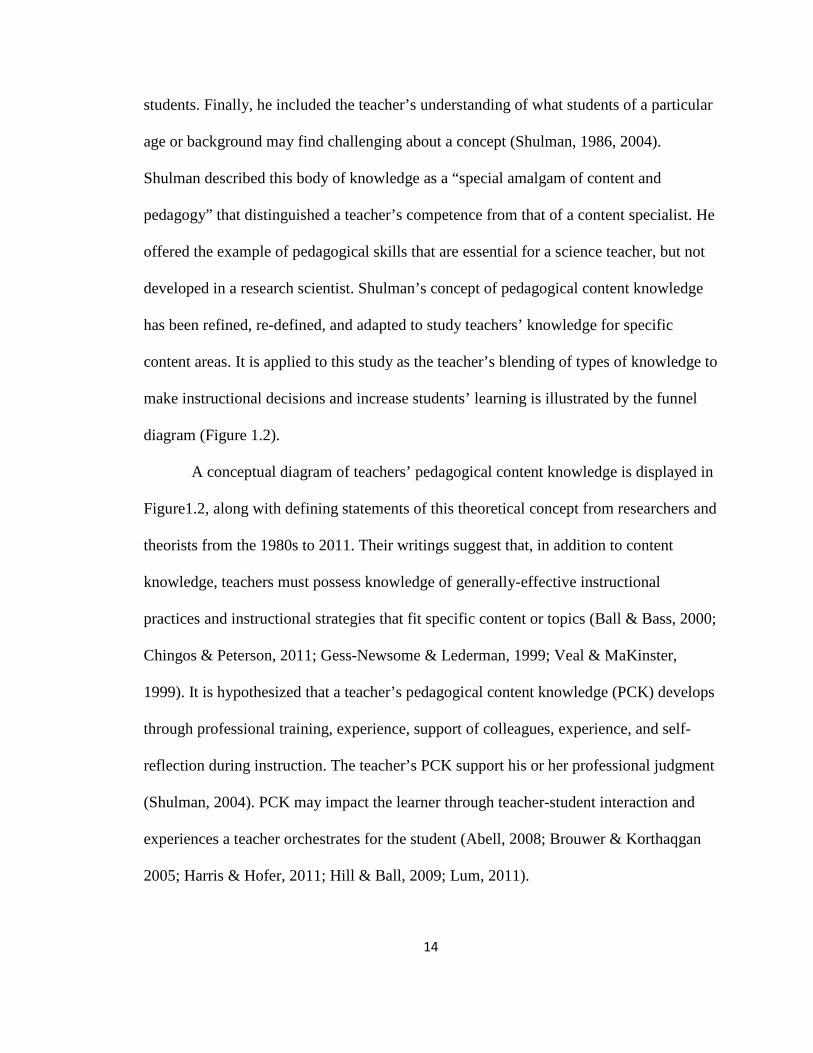
14
students. Finally, he included the teacher’s understanding of what students of a particular
age or background may find challenging about a concept (Shulman, 1986, 2004).
Shulman described this body of knowledge as a “special amalgam of content and
pedagogy” that distinguished a teacher’s competence from that of a content specialist. He
offered the example of pedagogical skills that are essential for a science teacher, but not
developed in a research scientist. Shulman’s concept of pedagogical content knowledge
has been refined, re-defined, and adapted to study teachers’ knowledge for specific
content areas. It is applied to this study as the teacher’s blending of types of knowledge to
make instructional decisions and increase students’ learning is illustrated by the funnel
diagram (Figure 1.2).
A conceptual diagram of teachers’ pedagogical content knowledge is displayed in
Figure1.2, along with defining statements of this theoretical concept from researchers and
theorists from the 1980s to 2011. Their writings suggest that, in addition to content
knowledge, teachers must possess knowledge of generally-effective instructional
practices and instructional strategies that fit specific content or topics (Ball & Bass, 2000;
Chingos & Peterson, 2011; Gess-Newsome & Lederman, 1999; Veal & MaKinster,
1999). It is hypothesized that a teacher’s pedagogical content knowledge (PCK) develops
through professional training, experience, support of colleagues, experience, and self-
reflection during instruction. The teacher’s PCK support his or her professional judgment
(Shulman, 2004). PCK may impact the learner through teacher-student interaction and
experiences a teacher orchestrates for the student (Abell, 2008; Brouwer & Korthaqgan
2005; Harris & Hofer, 2011; Hill & Ball, 2009; Lum, 2011).
15
Pedagogical Content Knowledge is: “…A special amalgam of content and pedagogy,” (Shulman, 1989, p. 8).
“…The manner in which teachers relate their pedagogical knowledge to their subject matter knowledge in the school context, for the teaching of specific students,” (Cochran, King, & DeRuiter, 1991, p 211).
Knowledge for Teaching
“…Understanding of how particular topics, problems, or issues are organized, presented, and adapted to the diverse interests and abilities of learners.”
“…Most useful forms of representation of these ideas, most powerful analogies, illustrations, examples, explanations, and demonstrations…
…The ways of representing and formulating the subject that make it comprehensible to others,” (Shulman, 1987, pp. 8, 9).
Blended forms of knowledge for teaching: “Knowledge of content and students, content and teaching, and content and curriculum,” (Hill & Ball, 2009, p. 70).
Components of Pedagogical Content Knowledge include:
Content Knowledge: Important information, processes, principles, skills and theories within a field of study (Shulman, 2004).
Pedagogical Knowledge: Teachers’ repertoire of instructional strategies that effectively transfer the knowledge to others (Geddis, 1993, p. 576).
Knowledge of Context: Includes understanding of typical learning patterns and the individual learner’s mind (Strauss, 1993; Shulman & Grossman, 1988).
Figure 1.2. Perspectives on Pedagogical Content Knowledge (PCK). The concept of pedagogical content knowledge has been refined, re-defined, and adapted to study teachers’ knowledge for specific content areas. The teacher’s blending of types of knowledge to make instructional decisions and increase students’ learning is illustrated by the funnel diagram. Developed by Lisa Ivey Waller, 2011.

16
Definition of Terms
• Content Knowledge: The grasp of information, processes, principles, theories, and
skills within a field of study (Shulman, 2004).
• Knowledge of Context: Interdependent understanding of the learner and strategies
for communicating to learners. Some researchers include knowledge of the school
and curriculum as context (Harris & Hofer, 2011; Strauss, 1993).
• Intervention: Instruction that accelerates the rate and level of a student’s academic
achievement (Fuchs & Fuchs, 2006).
• Number sense: “moving from the initial development of basic counting to more
sophisticated understandings of the size of numbers, number relationships,
patterns, operations, and place value” (Bryant, Bryant, Gersten, Scammacca, &
Chavez, 2008, p. 21).
• Math Recovery: A mathematics program for early intervention, designed to build
a strong numeracy foundation using a constructivist-based approach to one-on-
one and small group instruction. Math Recovery teachers receive extensive
training to assess each child’s math issues and apply current, research-validated
instruction to develop numerical competence (USMRC). This training includes
Learning Framework in Number and the Instructional Framework in Early
Number (Wright, Martland, & Stafford, 2006; Wright, Martland, Stafford, &
Stanger, 2006; Wright, Stranger, Stafford, & Martland, 2006).
• Pedagogy: A repertoire of instructional strategies to help transfer the knowledge
of content to others (Geddis, 1993).

17
• Pedagogical Content Knowledge: Knowledge for teaching that includes
“…understanding of how particular topics, problems, or issues are organized,
presented, and adapted to the diverse interests and abilities of learners;” and the
“…most useful forms of representation of these ideas, most powerful analogies,
illustrations, examples, explanations, and demonstrations,” and “…the ways of
representing and formulating the subject that make it comprehensible to others,”
(Shulman, 1987, pp. 8, 9).
• Response to Intervention (RTI): The process of monitoring a struggling student’s
rate and level of learning in response to research-validated instruction in order to
accelerate learning and close achievement gaps in comparison to peers of the
same age. The RTI process may be used in the diagnosis of a Specific Learning
Disability. According to IDEA (2004), the process of referral “must not require
the use of a severe discrepancy between intellectual ability and achievement for
determining whether a child has a specific learning disability [and] must permit
the use of a process based on the child’s response to scientific, research-based
intervention” (IDEA, 34 CFR 300.8(c)(10), 2004).
Rationale for Study of Kentucky’s Mathematics Interventions
The purpose of Kentucky’s grant funded Mathematics Interventions was to
increase the quality of instruction and level of student achievement in the state. The
grants included training in math content, math pedagogy, and assessment of student
achievement to inform instructional decisions. Data were gathered on the entire

18
population of teachers and students involved in grants from 2006 to 2009. In the 2009–
2010 school year data were gathered on a stratified random sample of teachers and
randomly for some or all of the grade levels they served (Kentucky Center for
Mathematics, 2010). Longitudinal data on the teacher training, collegial support, and
pedagogical content knowledge of Mathematics Intervention Teachers was available
from the Kentucky Center for Mathematics from 2006 to 2010. The data offer an
opportunity to examine relationships between these factors with student achievement.
The Logic Model in Figure 1.3 illustrates the implementation of Kentucky’s
Mathematics Intervention grants from 2006 until 2010. The Mathematics Intervention
grants sought to build teachers’ ability to assess students’ mathematics skills and respond
with research-validated instruction. The goal was to help students construct
understanding of basic numeracy through problem-solving support and carefully
orchestrated experiences. The intent was for teachers to gain a greater understanding of
mathematics (content knowledge), effective strategies for teaching of mathematics
(pedagogy), and skill in observation and assessment of students’ mathematical
understandings (knowledge of context) to respond with effective instruction (pedagogical
content knowledge) (Appendix A: Kentucky Revised Statutes). The Learning
Mathematics for Teaching Tests (LMT) were used to measure teachers’ pedagogical
content knowledge (Appendix B: LMT Released Items).

19
Logic Model
LOGIC MODEL: Cumulative Effect of Training, Support, and Experience for Mathematics Intervention Teachers’ (MITs’) Pedagogical Content Knowledge (PCK)
and Students’ 2010 Math Achievement Gains PROGRAM a GOAL: Improve the Teaching and Learning of Mathematics
Initial Grant Year: 2006–2007 2007–2008 2008–2009 2009–2010
INPUT Training Math Content Pedagogy Assessment Support Consultants Colleagues Conferences Experience As MIT 2010 Students’ Characteristics
Cohort One
N = 17
169–280 Hours of Training
136–171 Hours of Support
Fourth Year of Experience as
MIT
Cohort Two
N = 23
45–215 Hours of Training
38–159 Hours of Support
Third Year of Experience as
MIT
Cohort Three
N = 22
78–143 Hours of Training
61–112 Hours of Support
Second Year of Experience as
MIT
2009 MITs
N = 3
75 Hours of Training
65–130 Hours of Support
First Year of Experience as
MIT
OUTPUT MITs Gain PCK Measure:LMTb
MITs apply their Pedagogical Content Knowledge during math instruction to accelerate student learning.
OUTCOME Mathematics Achievement Measure: TNc
2010 Students’ Math Achievement Gains N = 889: 230 Kindergarten; 243 Grade 1; 188 Grade 2; 228 Grade 3d
Figure 1.3. Logic Model: Teachers’ Pedagogical Content Knowledge and Student Math Achievement.Gains a Kentucky Revised Statutes related to this grant program are included in Appendix A. b The Learning Mathematics for Teaching Test (LMT) is a measure of Pedagogical Content Knowledge (Hill, Schilling, & Ball 2004). c The Terra Nova Mathematics Achievement Test (TN) is a widely-used, standardized measure with national norms (McGraw-Hill, 2001). d The stratified random sample was selected from the 142 MITs and over 2800 students that participated in MAF math intervention programs during the 2009–2010 school year. Logic model developed by Lisa Ivey Waller (2012) for this study.

20
The MIT’s contact with a student during instruction was the mechanism for
impacting student achievement. The MIT applied integrated knowledge of the content,
pedagogy, and student when selecting the best tasks for communicating math concepts to
the student. The Terra Nova (TN) mathematics tests were administered as pre-tests and
post-tests for the math intervention students. The difference in the two scaled scores
provided a measure for student achievement gains.
The Kentucky Center for Mathematics gathered the following quantitative data:
student demographics; student Terra Nova scores; the minutes per week and beginning
and end dates of intervention instruction each student received; the hours of trainings
each MIT attended; the hours of support each MIT received; and MIT scores on the LMT
as a measure of their pedagogical content knowledge.
Variable One: Professional Training
The Math Achievement Fund (MAF) grants were administered by the Kentucky
Center for Mathematics (KCM). KCM provided initial and ongoing training to the
teachers each school selected to become Mathematics Interventionists. The interventions
serve students who are significantly below grade level as identified by a screening test
(selected by the school) and teacher recommendation (Appendix C: KCM Handbook).
Most MITs that implemented the Number Worlds intervention received training in
Landscape of Intervention, Math Solutions, and Add+Vantage MR (Math Recovery
adapted for small group instruction). The MITs with Math Recovery training provided
one-to-one intervention instruction. MITs may have training to use all three interventions.

21
Additional Training opportunities occur each year of the grant implementation.
They have included Add+Vantage Champion Training for Certified Math Recovery
Specialists, Add+Vantage MR Course 2; AdMIT Event for MITs and their principals;
EQUALS Family Math Training, KCM Connections, KCM PRIME MIT Leaders’
Group, Math Literacy workshop for Teachers, Math Solutions, NCSM Leadership
Academy, PIMSER Math Leadership Support Network, PIMSER One-to-One with
Vonda Stamm; SNAP Teacher Course; and Young Mathematicians at Work: The
Landscape of Intervention. Information on the dates, length, locations, and costs of
training is available at http://www.kentuckymathematics.org/archives.asp. Training was
measured in hours, based on a review of the KCM training registration forms from
summer 2006 to spring 2010 for the MITs in the 2010 sample. The variable is the total
hours of training across all years of the teacher’s experience as a Mathematics
Intervention Teacher.
Math Recovery training. The training provided through the KCM for schools
that selected Math Recovery as the primary intervention was provided through Math
Recovery in the United States (2000). It included a study of Wright, Martland, and
Stafford’s (2006) assessment manual for Math Recovery. Teachers align their instruction
with the inquiry-based program, so students routinely make progress by solving problems
that challenge their mathematical thinking. Teachers apply their professional judgment to
choose from research-based problem-solving tasks. Ongoing observations and a deep
understanding of numerical stages allow teachers to build on the child’s verbal strategies

22
as the basis for written forms of arithmetic. Children are empowered and motivated by
the intrinsic satisfaction of successful problem-solving. Research from the Netherlands
identifies preparing teachers to make instructional decisions as the function that must
improve to increase the quality of elementary mathematics education. Teachers need an
understanding of the learning process that children typically follow to serve as
benchmarks for assessment and teaching objectives (van den Heuvel-Panhuizen, 2008).
Ongoing assessment in Math Recovery. Math assessments were part of math
Recovery Teacher Training. The SNAP (Student Numeracy Assessment Progressions) is
an individual diagnostic assessment of early numeracy for use with 4–8 year-olds,
developed by Wright, Stanger, Stafford, and Martland (2006). MITs receive a two-day
SNAP training. The assessment is a concise tool for classroom teachers and special
educators to use in differentiating instruction and monitoring student progress. Teachers
gain an awareness of the many facets of early numeracy and learn instructional strategies
that align to the components of the assessment.
The second Math Recovery (MR) assessment is the Learning Framework in
Number (LFIN), a series of tasks with verbal directions and some manipulative materials
and visuals for student use. Dr. Robert J. Wright, founder of Math Recovery; Gary
Stanger who has worked with him on Math Recovery since its inception; Jim Martland
who leads Math Recovery in the United Kingdom; and Ann Stafford, who leads Math
Recovery in the U.S., have created the Math Recovery handbook. It provides a
framework for assessment called the LFIN, a set of interview schedules for diagnosis of a

23
range of aspects of early number knowledge. Like MR lessons, the assessments are
videotaped and later analyzed to determine a child’s strategies and levels of knowledge.
The assessment includes a framework called the Learning Framework in Number with 11
aspects of early number organized into four parts (A–D). The first and most important
framework is the Stages of Early Learning (SEAL). SEAL helps to determine the
sophistication of counting, addition, and subtraction. Part A also includes the Assessment
Interview Schedule for base-ten strategies. Part B examines forward and backward
number-word sequences, and numeral identification. Part C, Structuring Numbers,
assesses five aspects of early number learning: combining and partitioning, spatial
patterns and sibitizing, temporal sequences, finger patterns, and base-five strategies.
Subitizing is identifying small quantities without counting them. A teacher might show
four disks and cover them immediately with an opaque screen. The student would say,
“Four” without having to count the objects. Part D is Early and Advanced Multiplication
and Division. The book provides detailed descriptions and many illustrations of the
prompts and teacher talk for each component of the assessment. It ends with the
pragmatics of videotaping sessions of assessment and the process of coding to analyze
the student’s results.
The LFIN guides individualized instruction and whole class teaching in a
constructivist approach that focuses on sense-making and autonomy of the learner.
Details about the stages of mathematics strategies and knowledge are aligned to the
assessment and teaching topics and procedures with lesson outlines, designed to move
students from stage to stage. Mathematic Recovery is not a lesson guide. Teachers must

24
use their learned expertise to decide what they are seeing in the learner and what to do
next. New research-based strategies can be added by the MIT (Wright, Martland,
Stafford, & Stanger, 2006).
Classroom Instructional Framework for Early Numeracy. Interventionists
learn a Math Recovery framework for planning of instructional sequences, the Classroom
Instructional Framework for Early Numeracy (CIFEN) (Wright, Stranger et al., 2006).
There are eight topics with a set of assessment tasks and appropriate instructional
activities. These are well-illustrated and explained to address each topic. For example,
under Structuring Numbers from 1 to 10, assessment tasks include: making finger
patterns for 1 to 5 and 6 to 10; naming and visualizing domino patterns 1 to 6; naming
and visualizing patterns on a tens-frame, pair-wise and five-wise; partitions of five (5)
and ten (10); and addition and subtraction in the range of one (1) to ten (10). The
instructional activities are then Bunny Ears (holding up fingers by the child’s head to
illustrate a number out of line of sight); Five and Ten Frame Flashes, Domino Flashes,
etc. The book addresses the critical issue of teacher training to address conceptual
development and the use of the teachers’ professional judgment, intuition, and creativity.
They use scenarios to teach the teacher to videotape and analyze their lessons later, so
they can focus exclusively on the student during lessons. The program puts the
responsibility to construct meaning on the learner and focuses the teacher on keeping the
child active in their learning (Ellemor-Collins, & Wright, 2008; Wright, Stranger et al.,
2006).

25
Number Worlds training. When schools chose Number Worlds interventions,
the MIT’s training included initial assessments to identify a student’s level of
understanding in various aspects of numeracy. The assessment identifies deficits by
numeracy topic(s). Intervention for the student is a set of game-like lessons on the needed
topic(s) (Griffin, 2004). The theoretical basis for the Number Worlds program is the
theory of cognitive development. The program uses a sequence of activities to fit the
development of three to nine year olds.
Kindergarten and first grade levels of Number Worlds aim to prevent math
difficulties. Second and third grade levels of Number Worlds are remedial and
incorporate computational fluency Number Worlds incorporates hands-on activities to
build conceptual understanding. The program is more scripted and is less dependent on a
teacher’s pedagogical content knowledge for decision making than Math Recovery
(Griffin & Case, 1997; Griffin, Case, & Siegler, 1994). Some of the interventionists that
used Number Worlds did not participate in additional trainings, while others received
training in Math Recovery or Add+Vantage MR, which applies Math Recovery to a small
group of learners (Ludwig, Maltbie, Marks, & Jordan, 2009).
Variable Two: Collegial Support
The Kentucky Center for Mathematics also provides professional support through
the Kentucky Council of Teachers of Mathematics Annual Conference, Math Recovery
Video Review Meetings, Regional Consultants, and Peer Visits. The nature of the
interventions, training, and services of the KCM make it a valuable opportunity for

26
investigating pedagogical content knowledge and Early Intervention in Mathematics.
MIT’s report the hours of support they receive through such sources as phone calls or
visits from regional consultants, professional conferences, and peer visits. Support also
exits in the form of continual monitoring of interventions for fidelity, student progress,
MIT beliefs and practices, the quality of support received, the MITs’ PCK, and student
progress on a variety of assessments.
Variable Three: Experience as a Mathematics Intervention Teacher
Experience as a Mathematics Intervention Teacher builds pedagogical content
knowledge as it improves student achievement. All lessons in Math Recovery are
videotaped, so the teacher can focus on the child’s approach to each task and set up the
next task. Fosnot and Dolk (2001) describe the benefits of reflection on practice using
video-recordings. Teachers work back and forth between the structure of mathematics
and the student’s progression of learning. Students create many representations and
models of numbers and operations to develop and make their thinking visible. The
teacher as a learner is critical to students as learners. Students’ explanations followed
with the teacher’s questioning keep students problem-solving, constructing meaning, and
checking discrepancies in their own thinking. Teachers’ content knowledge,
understanding of their student learning, and repertoire of instructional strategies affect the
questions they ask and the activities they select to help a student develop math concepts
(Fosnot & Dolk, 2001). Video recordings allow the teacher to analyze the child’s
thinking. They also allow the MIT to focus on the student during lessons. Instruction is

27
provided to keep the student working on the cutting-edge of his or her understanding.
Daily reviews of the lessons also allow the MITs to self-reflect on their instructional
decision-making. Time is built into teachers’ schedules to view the recordings and allow
for the synthesis of the content, pedagogy, and understanding of the learner (Swanson,
Bush, McCarty, & Wright, 2009).
Variable Four: Pedagogical Content Knowledge
The teacher’s pedagogical content knowledge may be developed during training,
support, and experience as an intervention teacher. This is both the output in the logic
model and a teacher variable. The integrated knowledge of the math content, pedagogy,
and the student will guide the MIT’s selection of tasks to communicate math concepts to
the student. The elementary version of the Learning Mathematics for Teaching Test
(LMT) is the quantitative measure of pedagogical content knowledge selected for use
with the Mathematics Intervention Teachers.
Variable Five: Contact Hours for Intervention Instruction
The MIT’s contact with a student during instruction is the mechanism for
impacting student achievement. Contact hours are considered Output in the Logic Model.
Each MITs submitted the dates that math intervention instruction began and ended for
each student. MITs also self-reported the number of hours of intervention math
instruction each student received per week during intervention. This data was used to
estimate a student’s contact hours with an MIT.

28
The data from 2010 teachers and students in Kentucky’s math intervention
programs lend themselves to this investigation because of the quality of the alignment of
the interventions with the aspects of PCK. MIT training addressed teachers’ knowledge
of math content, content-specific pedagogy, and assessments to develop an understanding
of the learner. The opportunities MITs received for collegial support, additional training,
and reflection on instructional decision-making appear to support the integration of
teachers’ knowledge and its application to intervention instruction, also consistent with
the construct of PCK.
Dependent Variable: Student Math Achievement Gains
Student math achievement is the Outcome for the Logic model. The Terra Nova
(TN) mathematics subtest was administered as both a pre-test and post-test during a year
when a student received math intervention. The difference in the two scaled scores will
be used as the measure for student achievement gains. In all analyses, student math
achievement gains will be the dependent variable. The study will examine relationships
between the teacher variables above and student math achievement gains. Student
demographic data, gathered by KCM, will allow consideration of the following student
variables with achievement gains: students’ grade level, history of retention, gender,
special education IEP status, and students’ math achievement levels prior to intervention.

29
CHAPTER TWO: LITERATURE REVIEW
The purpose of Chapter Two is to contextualize the study within conceptually
important literature and current research on the teacher’s development of pedagogical
content knowledge and early intervention in mathematics. The premise for early
intervention is that many students struggle due to a lack of high quality instruction (Hosp
& Reschly, 2004). Intervention is the use of research-validated instruction to accelerate
students’ achievement. If instruction is the mechanism for accelerating student
achievement, then there are important question to address about the teacher that provides
the instruction. Does the teacher need training in math content, content-specific teaching
strategies, or assessment? Does support from colleagues increase the effectiveness of
math intervention? Will the teacher become more effective at increasing student
achievement with experience as an interventionist?
Early Intervention in Mathematics
National concern about mathematics deficits are reflected in the U.S. Department
of Education’s Early Childhood Longitudinal Studies (DiPerna et al., 2007), the National
Assessment of Educational Progress (Rampey et al., 2009), and the 2007 Trends in
International Mathematics and Science Study (TIMSS) reports (Gonzales et al., 2008).
The U.S. Department of Education has documented increasing and disproportionate
percentages of low income, minority, and linguistically diverse students receiving special
education services over the last 40 years (Donovan & Cross, 2002; Hosp & Reschly,

30
2004). The Elementary and Secondary Schools Act (No Child Left Behind Act of 2001,
20 U.S.C. § 6319 (2008) set goals of proficient achievement for all students, including
those from low-income or minority backgrounds and those with disabilities (Hanushek &
Raymund, 2004). President George W. Bush signed the NCLB act into law with the
requirement that 100% of students be evaluated, cautioning against “the soft bigotry of
low expectations” (Quenemoen, Thurlow, Moen, Thompson, & Morse, 2003, p.4). The
federal law governing special education, IDEA, was revised to require early intervention
and evaluation for disabilities that “must not require the use of a severe discrepancy
between intellectual ability and achievement for determining whether a child has a
specific learning disability [and] must permit the use of a process based on the child’s
response to scientific, research-based intervention” [IDEA, 20 U.S.C. § 140, 2004, 34
CFR 300.8(c)(10)]. This process has come to be known as Response to Intervention
(RTI) and typically involves screening the school population to identify struggling
students, providing intervention in tiers of increasing intensity, and considering special
education services when a student requires sustained intervention to sustain academic
progress.
VanDerHeyden (2009) sees Response to Intervention as a vehicle for system
reform because it provides a framework for determining who needs help and distributing
instructional resources to do the greatest good. She calls it a science of decision-making
to improve student learning. In RTI, the Diagnostic Framing is a major shift. Universal
screening of a whole student population can identify gaps in instruction or curriculum,
rather than testing only low-performing students to locate their deficits (Hughes &

31
Dexter, 2009; Speece, 2006; Scruggs & Mastropieri, 2002). The new framework becomes
that inadequate achievement is first attributed to inadequate instruction, not a deficit in
the learner (Burns, Griffiths, Parson, Tilly, & VanDerHeyden, 2007). The Prognostic
framing in RTI is an even more dramatic shift to an instruction cycle of using evidence-
based strategies with on-going monitoring of the student’s response to that instruction.
Assessment becomes a guide to instruction and not a summary judgment of the learner
(Ardoin, 2006).
Ardoin, Witt, Connell, and Koenig (2005) conducted an RTI efficacy study and
described the use of a screening measure for mathematics skills and performance. The
screening identified a class-wide deficit in subtraction skills in two fourth grade
classrooms. The researchers had classroom teachers institute a short-term peer tutoring
strategy with all students. Curriculum-based monitoring (CBM) tests showed that all but
five students made adequate progress with this intervention (Ardoin et al., 2005). In
Ardoin’s (2005) study, the five students who did not make adequate progress with the
whole class intervention alone were also provided additional assistance with a one-to-one
strategy called Complete, Check, and Correct where the teacher gave mini-lessons over
items students missed on brief CBM tests for subtraction. Students did a self-check and
then corrected their work. This intervention was effective for four of these five students
(Ardoin et al., 2005). The fifth student needed increased time in intervention to avoid
falling further behind (Pasnak, Cooke, & Hendrix, 2006).
In a typical school population, 80% to 85% of students make good academic
progress in core instruction. If the percentage of students is lower, the core instructional
32
program and the fidelity of its implementation need to be examined and improved (Fuchs
et al., 2008; O’Donnell, 2008). Around 15% of students are likely to need intervention, in
addition to core instruction, to progress at a rate and level with their peers. Research-
validated instruction by the classroom teacher to supplement the core program should
accelerate achievement for most of these students. However, it is estimated that 5% of
students may need help from an interventionist with specialized training (Hughes &
Dexter, 2009).
These national expectations offer a sharp contrast to 2010 statistics on student
achievement in Kentucky’s public schools. On the 2010 Kentucky Core Content Test,
23.7% of students were below proficient in mathematics. The percentage of third grade
students below proficient was 30.4% for Hispanic students and 43.5% for African
American students. The percentage of third grade students below proficient was 30.7%
for students approved for federal lunch programs. Approximately 14% of students tested
in 2010 were receiving intervention through special education, but only 43% of students
with disabilities were achieving proficiency in the general education curriculum (KDE,
2010). Despite contributing factors, excuse making is unproductive, and public policy
must define realistic goals that public schools can be responsible for achieving (Behn,
1995). Some state legislatures and departments of education issued mandates in response
to the IDEA and NCLB revisions (Swanson, & Stevenson, 2002). Others, like Kentucky,
developed implementation guidelines. The Kentucky System of Interventions (KSI) was
designed to guide districts in all aspects of intervention (KDE, 2008).

33
In 2005, Kentucky Revised Statues were created to improve mathematics
instruction and achievement in Kentucky schools. These statutes established the
Mathematics Achievement Fund (MAF) grant program to provide training, salaries, and
instructional materials for research-based mathematics intervention programs. They also
established the Kentucky Center for Mathematics (KCM) to oversee grant programs,
provide training for Mathematics Intervention Teachers (MITs) and Regional
Coordinators to support interventionists, gather implementation data, and conduct other
activities to improve mathematics instruction and student math achievement in the state
of Kentucky (KRS § 156.553, 2005; KRS § 158. 842, 2005; KRS § 158.844, 2005; KRS
§ 164.525, 2005; Appendix A). Data from these interventions may provide insight into
the efficacy of improving student achievement by building a teacher’s pedagogical
content knowledge (Griffin et al., 1996). Is there support in the literature for Kentucky’s
investment in ongoing teacher training and support for new and experienced math
interventionists?
Pedagogical Content Knowledge
Hill, et al. (2005) investigated how a teacher’s Mathematical Knowledge for
Teaching affected student math achievement gains. They used an instrument developed at
the University of Michigan that examines the level of knowledge a teacher needs to teach
elementary or middle school mathematics. Their investigation involved first and third
grade students from 89 schools participating in America’s Choice, Success for All, or the
Accelerated Schools Project and 26 control schools. Hill et al. (2005) used a linear

34
mixed-model in which first and third grade students’ math achievement gains were nested
within teachers, within schools. Their results suggested that teachers’ Mathematical
Knowledge for Teaching (MKT) as measured with the MKT assessment and student
achievement gains were significantly related. Their conclusion was that direct
measurement of teachers’ content knowledge for teaching is more valid than relying on
indirect indicators of teachers’ pedagogical content knowledge like coursework or
experience. If PCK affects student achievement, then it becomes important to know what
contributes to the development of PCK.
Training the Mathematics Intervention Teachers
The elementary teacher is a generalist with a broad understanding that enables
him or her to make connections across subjects. Consequently, elementary teacher
preparation programs do not set high admission requirements for mathematics or demand
rigorous mathematics and science coursework (Shulman, 2004). Special education
teacher-preparation programs also lack depth in content and pedagogy (Brownell et al.,
2010; Ma, 1999). Elementary teachers plan and present lessons on several subjects each
day, unlike secondary teachers who teach multiple sections of the same course and may
better develop depth of understanding in a single content. Developing similar depth of
knowledge for an elementary teacher involves post-graduate studies in a single content,
but many choose to do graduate work in curriculum supervision or administration to
allow for career advancement.

35
Kukla-Acevedo (2009) studied a state database of all the teachers that had taught
fifth grade students in prior grades against the students’ math achievement in 2001–2003.
After accounting for missing information, the Kentucky EPSB dataset contains 3812
students, 46 schools, and 120 teachers. Each individual student’s KCCT fifth grade math
score was matched to his or her teachers’ undergraduate GPA and coursework in
math/math-education. A regression analysis with Ordinary Least Squares (OLS) & Fixed
Effects suggested that fifth grade math achievement was predicted by overall teacher
grade point averages. Teachers’ years of experience and math education coursework
interacted positively to increase students’ fifth grade math achievement. Teacher
characteristics were also found to have a differential effect for African American students
(but not low-income) and students with above average prior achievement scores. This
research supports an increase of math education coursework for elementary teachers and
connects it to closing minority achievement gaps and to accelerating the achievement of
students in the Above Average range.
In a case study, Smith (2007) examined four primary science teachers’
development of pedagogical content knowledge for teaching science during pre-service
classroom experiences and during their first year of teaching in the United Kingdom. Her
observations and the beginning teachers’ own reflections attributed the limited
pedagogical content knowledge of most primary teachers to deficits in teacher-
preparation programs. Smith suggests that because primary teachers provide instruction
in many subjects each day, a deep repertoire of topic specific instructional strategies is
not as likely to develop as it might be for a secondary teacher who teaches multiple

36
sections of the same course each semester, year after year. Smith suggests that
elementary teachers most often develop pedagogical knowledge that applies across
subjects. Although limited to a few topics, Smith found evidence that primary teachers
sought to gain knowledge of content, pedagogy, and of their students understanding.
A longitudinal study of four public schools by VanDerHeyden, Witt, and
Gilbertson (2007) found that the training level and years of experience of the school
psychologist affected outcomes of RTI as a pre-referral process. Less experienced school
psychologists referred more students for special education assessment and had a lower
percentage of those students who qualified for special education services. If the outcomes
of the RTI process are affected by the bias, experience, and training level of one of the
intervention team members, what effect can the PCK of the intervention teacher have on
student outcomes?
The Wyoming Indian Elementary School reported a case study of its three-year
implementation of Math Recovery. Their implementation of Math Recovery involved an
intervention specialist who completed a year-long training program and classroom
teachers that were trained to apply Math Recovery theory and practice to classroom
teaching. This implementation of Math Recovery’s effect on student achievement was
gauged by the Wyoming state assessments in mathematics. The percentage of students
who achieved at or above the Proficient level included (a) 78% of the 2007 third grade
cohort (up from 23%); (b) 63% of the 2007 fourth grade cohort (up from 20%); and (c)
32% of the 2007 fifth grade cohort (up from 15% in 2006).
37
MacLean (2003) evaluated the relative effectiveness of three different
professional development models on low-achieving first-grade students in a large urban
school district. The first model consisted of a full Math Recovery implementation in an
intensive one-on-one tutorial intervention provided to selected, low-achieving, first grade
children with on-going professional development for classroom teachers provided by the
on-site Math Recovery leader. This professional development took the form of
presentations, joint planning sessions, modeling, and team teaching. The second model
involved those same Math Recovery leaders conducting on-going professional
development in Math Recovery theory, strategies, and activities to classroom teachers
from schools without an on-site Math Recovery intervention, adapting the strategies and
activities for the classroom setting. The third model involved schools in which classroom
teachers received periodic, one-shot professional development and conference
attendance, but no Math Recovery theory and methods. MacLean (2003) found that the
full Math Recovery implementation model significantly out-performed both the on-going
professional development only model as well as the periodic, one-shot model.
Baker, Gersten, Dimino, and Griffiths’s (2004) two-year case study of the
implementation of Peer-Assisted Learning Strategies in mathematics (PALS) offers
insight into the value of training, support, and experience. Although all of the fourth
grade teachers reported student achievement gains with the intervention, those who had
the highest level of fidelity of implementation also had the most positive attitudes toward
the intervention. The teacher with the highest level of implementation had also
generalized the strategies to other content instruction. The teacher with the least fidelity

38
of implementation and with the most reservations about its continued use was a
beginning teacher who was not part of the original training and who allowed the
researcher who was there to support implementation to do the majority of the instruction.
Researchers felt their qualitative observations evidenced the importance of training,
ongoing support, and the value of having an experienced educator who is able to handle
managerial tasks with routines and focus their thinking on assessment and instruction.
Internationally, the question of teacher training’s ability to increase pedagogical
content knowledge and affect student achievement has been investigated. The relative
contributions of teachers’ content knowledge (CK) and pedagogical content knowledge
(PCK) as distinct knowledge categories for the preparation of teachers of mathematics
were the focus of a study by Baumert, Kunter, Blum, Brunner, Voss, Jordan, Klausmann,
Krauss, Neubrand et al. (2010). They defined pedagogical content knowledge as the
competency of teachers to communicate subject matter to students. They denote it as the
area of knowledge that best explains a teacher’s impact on student progress and
hypothesize that PCK directly affects the quality of instruction which mediates its effect
on student learning (Baumert et al., 2010). Their research indicated that when the
selective intake of German high schools was statistically controlled at the individual
level, teachers’ PCK explained 39% of the variance in student achievement at the end of
grade 10. If teachers’ PCK differed by two standard deviations, mean student
achievement differed by d = 0.46 SD. Baumert et al. recommend that mathematics
teacher preparation programs must strengthen both content knowledge and pedagogical
content knowledge in teacher preparation programs.

39
Knowledge of Content
Teachers must possess a grasp of essential mathematical knowledge. The domains
of arithmetic include pre-computational skills, basic operations, place value, whole
number computation, calculators, part-to-whole relationships, fractions, and problem-
solving (Fleischner & Manheimer, 1997). Intervention must address critical aspects of the
curriculum. Researchers in mathematics suggest that intervention for kindergarten
through second grade address counting, number composition and number decomposition,
base 10, place-value, and multi-digit operations, meaningful addition and subtraction, and
the associative, commutative, and distributive properties of numbers (Fosnot & Dolk,
2001). Recommendations of The National Mathematics Advisory Panel (2008) include
explicit instruction to ensure that struggling students gain foundational skills and
conceptual knowledge to understand their grade-level mathematics. This means that
teachers provide students clear models, extensive feedback, opportunities to think aloud,
and extensive practice with new learning. The National Council of Teachers of
Mathematics (1989) and National Mathematics Advisory Panel are sources for
mathematical standards for teachers. The National Council for Teachers of Mathematics
(NCTM) Standards’ five goals for students are to (a) learn to value mathematics, (b)
become confident in their mathematical abilities, (c) become problem solvers, (d) learn to
reason mathematically, and (e) learn to communicate mathematically.
In addition to knowing math content, teachers must also know how to teach
content (Gess-Newsome & Lederman, 1999). Abell (2008) notes that pre-service teachers
come with pedagogical content knowledge derived from the practices of their own

40
teachers or in reaction to the practices of their own teachers. Cancoy (2010) found that
without training to develop knowledge of content-specific pedagogy, novice and
experienced teachers relied heavily on memorization and procedural knowledge. Cancoy
asked how teachers at both stages of their careers would teach a0, 0!, and a ÷ 0. There
were very few attempts at building a conceptual understanding in students proposed by
either group of teachers. Moses, et al. (1989) proposed that all math topics should be
taught to students of any age following a progression that begins with Concrete
Representation using manipulative materials. Next, students should create Pictorial
Representations of topics or operations using pictures or diagrams. Concrete and Pictorial
Systems of representations must next be linked clearly by having students describe
reasoning to others, sharing their concrete and pictorial representations.
Fleichner and Manheimer (1997) offered their principles to rely upon in math
instruction:
1. Follow this sequence, regardless of the age of your students or topic you
are introducing:
Concrete representation: Use manipulative materials to introduce
new topics and/or operations to students. Use manipulatives far
beyond the grade in which they typically are no longer used, and use
them for every topic or operation. Students with learning disabilities
do not develop the ability to infer from abstract examples at the same
rate as students who do not have learning disabilities.

41
Pictorial representation: Ask students to represent their
understanding of the topics and/or operations that you are teaching
by pictures or other figures. Students with learning disabilities often
have difficulty translating their understanding, based on concrete
representation, to iconic representational forms.
Link these systems of representation: Do this by having students talk
about their reasoning and explain it to others, using both concrete
and pictorial examples.
Symbolic: Be sure that students understand the symbols that
represent operations in mathematics, and that they can use these
appropriately in the examples that they are working on.
Abstract: Check to see if students can suggest other ways of solving
problems or if they can state the steps in a way that allows other
students to understand what they did.
2. Use cooperative learning groups in heterogeneously grouped classes
whenever they are appropriate.
3. Maintain a balance between an emphasis on achieving solutions to real-
life problems and mastery of skills, such as basic facts or procedural rules.
4. Accommodate special needs by using such cueing systems as graph
paper for recording responses, color coding for highlighting procedural
steps, and calculators to check the accuracy of computation.

42
5. Realize that students whose primary learning disability is in reading
often have related problems in achievement in mathematics (p.397).
Knowledge of Students
Shulman (1987) says that “The teacher knows something others do not;
presumably the student,” (p. 7). Knowledge of Context is a component of PCK that
includes teacher understanding of the typical progression of learning and common
preconceptions and misconceptions for students of a particular age. The knowledge about
the primary student that a teacher must synthesize in mathematics instruction may be
illustrated by a study of Dutch kindergarten students with math deficits conducted by Van
Luit and Schopman in 2000. The researchers described multiple reasons for student
difficulty with a simple task of telling the number of bricks in a container. While one
child was unable to rote count, another struggled with one-to-one correspondence, and a
third did not realize that the last number word spoken represented the total quantity. This
illustrates that the teacher must have an understanding of concepts of early numeracy,
know the particular student’s issue, and be skilled at orchestrating learning experiences to
build the understanding needed by each student (Van Luit & Schopman, 2000). When
teachers lack this understanding, student achievement suffers. Käpylä, Heikkinen, and
Asunta (2009) examined pre-service elementary and secondary biology student-teachers
content knowledge and pedagogical content knowledge for teaching photosynthesis to
students in sixth grade in Finland. They found that both groups of teachers lacked

43
suitable pedagogical strategies and the primary teachers lacked an understanding of the
conceptual abilities of young students or the appropriate content to address.
Formative assessment is a teacher’s tool for increasing understanding of the
learner. Ashlock (1990) recommends error analysis of an adequate sampling of student
work and clinical interviews to determine the source of a child’s errors. Moran (1978)
proposed that error analyses should focus on mastery of facts, using an appropriate
operation, and using a strategy effectively. Ellemor-Collins and Wright (2008) emphasize
using students’ misunderstandings as an opportunity to advance their learning. As
students work through contradictions between previous thinking and new understanding,
learning is occurring in their zone of proximal development. Careful error analysis can
help a teacher design errorless learning for students with memory issues and prevent
practicing an error that may make it difficult to unlearn a mistake (Etzel & LeBlanc,
1979). Careful observation, conferring conversations that address a student’s learning,
and evaluation of a student’s errors each contribute to knowing the student. When this
understanding is blended with the teacher’s knowledge of math content, instruction can
be tailored to the learner (Hill et al., 2005).
In clinical interviews, teachers coach students to talk through their thinking and
the process they used to obtain correct or incorrect answers. Teachers must have adequate
knowledge of mathematics content and an understanding of students’ common
preconceptions and misconceptions associated with the content. Manheimer and
Fleischner (1997) found that elementary teachers arrived at incorrect conclusions if they
had inadequate mathematical content knowledge. Desoete, Stock, Schepens, Baeyens,
44
and Roeyers (2009) of the University of Belgium investigated the importance of key
arithmetic skills for early identification of students who may be vulnerable to
underachievement. They found classification, seriation, and counting skills during
primary grades to have some predictive ability during the elementary grades. Fleischner
and Manheimer of Columbia University advocate two approaches to assessment of a
struggling student’s present level of performance in these domains, error analysis and
clinical interviews, each aimed at determining a student’s thought processes. Carpenter,
Fennema, Peterson, Chiang, and Loef (1998) evaluated teachers’ knowledge of the
differences among problems and students’ problem-solving strategies, hypothesizing that
such understanding would affect how and what was taught. They anticipated that
knowledge about how students learn would help teachers match instruction to their
students' abilities, resulting in greater achievement. The teachers' ability to predict how
each student would approach a specific problem and whether the student would succeed
was used as a measure of teacher understanding. The researchers found that training in
problem-solving increased teachers’ knowledge of students and the time spent interacting
with students and considering students’ alternative solutions. However, achievement
gains were only modestly significant compared to the gains of students whose teachers
were in a control group.
In 1994, Wright conducted interviews with 41 primary students in Australia to
replicate a New Zealand study that had found students who entered school with stronger
mathematical understanding made greater gains than those with lesser understanding,
suggesting that the curriculum best addressed lower levels. Wright interviewed five and

45
six year old students at the beginning, middle, and end of the school year and analyzed
their responses. He concluded that a rating system can monitor students’ thinking about
mathematics and inform teachers’ selection of strategies to challenge the most advanced
students and those at lower levels to all make substantial progress in mathematics. Wright
found the Theoretical Models were valuable for informing teachers of the progression of
students’ understanding of critical aspects of numbers and counting to inform teachers.
He found that five year olds’ number knowledge advanced across a wide variety of
number topics, but the typical curriculum underestimated students’ prior knowledge.
Wright suggested specific topics for early childhood mathematics assessment: Forward
number word sequence (counting, one more than); Backward number word sequence
(counting, one less than); Numerical identification and recognition; Addition and
subtraction; Multiplication and division; Spatial patterns; Finger patterns; and Use of tens
and ones. Knowledge of math content is blended with knowledge of the student to
orchestrate optimal learning opportunities (Cumbria Local Authority, 2007).
Zone of Proximal Development. Knowing a student’s level of achievement is
instrumental in selecting the most advantageous instructional strategy to keep a student
making optimal progress because instruction that is not challenging will produce little
gain in student achievement. If instruction is too difficult, it will bring frustration and no
learning. This Zone of Proximal Development (ZPD) is a concept, initially proposed by
Vygotsky (1978), to describe a learner’s readiness to learn a concept (Norton &
D’Ambrosio, 2008). This is a social constructivist view of the learner. Applied to
46
mathematics, the ZPD would be the level at which a student cannot successfully solve a
problem independently but can succeed with the assistance of another student (Norton &
D’Ambrosio, 2008). Teachers need an understanding of the learning process that children
typically follow to serve as benchmarks for assessment and teaching objectives (van den
Heuvel-Panhuizen, 2008). Researchers (Geary, 2004; Gersten, Jordan, & Flojo, 2005;
Hanich, Jordan, Kaplan, & Dick, 2001; Jordan, Kaplan, & Hanich, 2002; Jordan, Hanich,
& Kaplan, 2003) found that difficulty with counting contributes to future difficulties with
mastering arithmetic combinations, computational fluency, whole number computation,
and word problems. These early struggles among elementary-age students are associated
with persisting mathematics difficulties.
Confrey (1990) advocates a constructivist approach to mathematics derived from
the work of Piaget, Glaserfield, and others. With a constructivist approach to instruction,
students are provided experiences that challenge their current level of understanding
within their Zone of Proximal Development. Misconceptions are explored to allow the
student to reach new understandings. As the learner reflects on the discrepancies between
the new experience and their previous understandings, she constructs new mathematical
understandings. Confrey focuses on teacher and student interactions as individual case
studies where the teacher assists each student in constructing, reflecting, evaluating,
exploring, and justifying mathematical understanding. She advocates promoting the
student’s autonomy as a learner through modeling and encouraging reflection.

47
Prior achievement. Intervention seeks to accelerate learning, changing the
trajectory of a student’s previous achievement. However, prior student achievement can
have a persistent impact on student learning in mathematics where new learning is almost
always built upon prior learning. Princiotta et al. (2006) report the findings of the U.S.
Department of Education’s Early Childhood Longitudinal Study that investigated how
students progress over the course of their education. A nationally representative sample
of 22,782 kindergarten students was first evaluated in the 1998–1999 school year. About
9,700 students (85% of those eligible for the fifth grade data collection) participated in
2004. The report of reading, math, and science achievement in fifth grade was compared
to performance at kindergarten and analyzed by sets of student, family, and school
characteristics. The results reflect the potential impact of prior achievement with most
students remaining in the same third of the class in fifth grade as in kindergarten.
Interestingly, 67% of students in the highest third of the class in kindergarten were still in
the highest third of the class in fifth grade, and students in the lowest third of their
kindergarten class showed lower rates of mastery across categories of math content.
Student characteristics also influence the outcome of an intervention. The age of a
student and their current level of understanding must be considered in selecting
instructional strategies. Bryant, Bryant, Gersten, Scammacca, and Chavez (2008) studied
the effects of a Tier 2 math intervention on the achievement of students in first- and
second grade identified as having math difficulties. There were 126 first grade students
and 140 second grade students who received 15 minute booster lessons on math skills and
concepts two to three times per week for 18 weeks. The Texas Early Mathematics
48
Inventories–Progress Monitoring (TEMI-PM) was used as a measure of student progress.
A significant intervention effect was present for the second-grade students but not for
first grade students. Researchers suspect that the intensity of the intervention was better
suited to the goals of the second grade students. They speculate that the length and
frequency of booster lessons were inadequate for developing the basic numeracy
concepts that were needed by the first grade students. A meta-analysis of data from 17
published math intervention studies that met researchers’ criteria was conducted by
Burns, Codding, Boice, and Likito (2010). They found significantly different success
rates for two types of math interventions by the student’s entry skill levels. Fluency-
building interventions were most effective when students were at the instructional level
with a skill. Acquisition interventions were most effective when students were at a
frustration level with a skill. Prior achievement was also clearly tied to future
achievement in VanDerHeyden and Burns’s (2009) investigation into math interventions
and found that learning a skill early in a sequence of skills significantly related to success
with future related or more complex skills.
Initial data, from the University of Cincinnati’s Evaluation of the Kentucky
Mathematics Interventions, showed a difference in student scale score gains based on
their entry levels. However, the evaluation did not examine the relationship with
statistical analysis across interventions. These studies illustrate the importance of
considering students’ entry skill levels when selecting or evaluating the impact of an
intervention to inform subsequent instruction.

49
Knowledge of Pedagogy and Pedagogical Content Knowledge
Knowledge of content allows a teacher to plan instruction, evaluate a student’s
understanding, and select effective representations to communicate mathematical ideas.
Teachers must make numerous decisions in the course of instruction, exercising the
judgment of a professional educator (Shulman, 1986). Schwab (1964) and Shulman
(1984) propose that it is both impossible and unproductive to attempt to prescribe what a
teacher does externally. Therefore, the teacher must be prepared with content knowledge,
curricular knowledge, pedagogical strategies, and pedagogical content knowledge upon
which to base professional judgment. Using instructional strategies and programs that
have been empirically evaluated can validate the selection of pedagogy. Research from
the Netherlands describes preparing teachers to make the instructional decisions as the
function that must be improved to increase the quality of elementary mathematics
education. Teachers need an understanding of the learning process that children typically
follow to serve as benchmarks for assessment and teaching objectives (van den Heuvel-
Panhuizen, 2008).
Fuchs, Fuchs, Craddock et al. (2008) investigated the value of research-validated
instruction by investigating the effects of small-group tutoring with and without validated
classroom instruction on at-risk students’ math problem solving. This study included 119
third grade classes and 243 at-risk students, with both classes and students randomly
assigned to treatment (validated core instruction/tutoring) or control conditions. Tutoring
was significantly and substantially more effective when it occurred in combination with
validated classroom instruction than when the tutoring occurred with conventional

50
classroom instruction. Increased exposure to high quality instruction resulted in greater
student achievement gains.
In a 2006–2007 study of the performance of Kentucky mathematics interventions,
students’ average fall pre-assessment scores on the Terra Nova were compared to spring
Terra Nova scores based on the intervention program that had been implemented. Scores
for students in Math Recovery, students in an alternative intervention, and a comparison
group of first grade students were compared. Math Recovery students’ average gain of
+61 percentile points was significantly greater than the average +29 percentile points
gained by students in the alternative intervention and the average +24 percentile points
gained by the comparison group. The mean percentile point gains for students in each
program during the first year of intervention, 2006–2007, are provided in Table 2.1.
Table 2.1.
2006–2007 Mathematics Achievement Fund Intervention Data
Program Average Percentiles on Terra Nova Math Tests
Pre-Assessment (Fall) Post-Assessment (Spring)
Math Recovery (n=66) 9 70
Alternative Intervention (n=159) 5 34
Comparison Students (n=252) 14 38
Note: Adapted from 2006/2007 Terra Nova (McGraw-Hill, 2001) results, retrieved from
http:/www./kentuckymathematics.org/research.asp

51
Researchers proposed that the difference in the two programs was the pedagogical
decision-making that Math Recovery teachers had been taught. Because the state
intervention prioritized improving teacher practice and student achievement gains over
preserving empirical structures, the decision was made to provide Math Recovery
training to other interventionists.
Collegial Support
Support for teachers can improve practice and advance student achievement. In
response to international assessments of student achievement, Barber and Mourshed
(2007) conducted an international qualitative study of the top school districts in the
world. Their strongest recommendation was hiring high quality teachers and providing
them with support from more experienced high quality teachers. Ellemor-Collins and
Wright (2008) studied the use of video-recordings of student work to identify a student’s
difficulties with conceptualizing mathematic ideas. Teachers were found to benefit most
from analyzing the videotapes and discussing the children’s responses. The researchers
saw changes in teachers’ video analyses that improved implementation over time. There
were three distinct phases found in teachers learning to analyze the videos. Initially,
teachers were very focused on their own work: managing materials for assessments and
the videotaping. As teachers went into the second phase, they were able to focus more on
the tasks they were designing for the student. By the third phase, the teachers were able to
focus on the impact on the child: his or her thinking, perspective, changes in
understanding, and benefits from a particular task (Ellemor-Collins & Wright, 2008).

52
In 1996, the National Commission on Teaching and America's Future published
What Matters Most: Teaching for America's Future with the premise that improving
student achievement in the Unites States is dependent upon having teachers who have the
support, skills, and knowledge to impact student learning. The potential for support to
help teachers implement and sustain high-quality math interventions was elucidated by
Baker et al. (2004) study of teachers’ long-term use of Peer Assisted Learning Strategy
(PALS) with fidelity over time. This case study included eight teachers in grades 2–4 in a
Title I elementary school that served 53% African-American students, 40.6% European-
American students, and 0.2% Asian-American students. Their multi-method case study
used a semi-structured interview, classroom observations, and formal surveys of teachers’
reactions to PALS (nine years after training and four years after graduate student support
was ended). They reported that three teachers were high-sustaining, and five teachers
were moderate-sustaining. Survey responses attributed results to the quality of initial
training, support during four years of implementation, and data on student achievement
gains. In this case, support was provided by a graduate student who trained, modeled, and
helped with materials and other procedural aspects of the intervention. The school had
valued the support because student gains had been substantial and continued to fund the
assistant after the initial funding was depleted.
Shulman (1986) observed that teaching is predominantly practiced in the isolation
of a classroom without the benefit of an audience of peers. Valuable support for
implementation may come in the form of guiding the teacher to reflect on his or her
practice. Strauss (1993) attributes the difference in what teachers say they believe about

53
learning and their actual practice to preconceptions about how students’ minds work and
suggests that these “mental models” are resistant to change, but affect teachers’
application of pedagogical content knowledge. She advocates that to improve their
practice teachers benefit from considering the pedagogical content knowledge of their
espoused and in-use “mental models.” One activity that helped teachers understand these
“mental models” was watching and describing the instructional decisions made in
videotaped math lessons.
The McKinsey Company (Barber & Mourshed, 2007) study set out to link
quantitative evaluation results to qualitative observations by examining 25 school
systems worldwide, including ten top performing systems and rapidly improving systems.
The report identified three factors that the best schools have in common: a) getting the
right people to become teachers, b) developing them into effective instructors, and c)
ensuring that the system is able to deliver the best possible instruction to every child.
Most of the top ten school districts and those that have made dramatic gains used teacher-
coaching to support these processes, sending expert teachers into the classroom to
observe, model high quality instruction, assist with planning, and facilitate teachers’
reflection on their own instruction. Cognitive Coaching (Costa & Garmston, 2002) is a
model of coaching that is also used to support Kentucky Math teachers through the KCM.
All support from colleagues was not found to be of equal benefit to teachers
implementing professional development in an inquiry-based, earth sciences program in a
study by Penuel, Fishman, Yamaguchi, and Gallagher (2007). They surveyed teachers
that had received training from 28 different providers. The trainings all addressed fidelity
54
of program implementation, knowledge of pedagogy, and teacher change in practice.
Greater levels of implementation were associated with active professional training that
promoted student inquiry and a focus on content. The value of support from university
partners was more effective than a longer duration of professional development; however,
support from other teachers in the school was actually associated with less frequent use of
student inquiry (Penuel, et al., 2007). The lower levels of implementation by teachers
who reported higher levels of in-school support were attributed to a normalizing
phenomenon called occupational socialization.
Teacher training may be ineffective when colleagues pressure new teachers to
abandon the practices they have been taught in teacher preparation programs. Brouwer
and Korthaqgan (2005) investigated factors in pre-service teacher preparation that may
counter the tendency of occupational socialization to change new teachers’ practices to
reflect the norms of their colleagues rather than what they have been taught in
coursework. This investigation of 357 education students from 24 university programs
looked at pre-service and in-service elements that contributed to teachers developing
competence. It also examined how new teachers’ program implementation differed from
the curriculum intended. The universities examined had programs that offered extensive
practice teaching opportunities. Students who placed a higher value on alternating
between college instruction and practice teaching (increased support for program
implementation) were more likely to score themselves higher on starting competence and
lesson-plan improvement. The beginning teachers who felt they had learned to improve

55
lesson plans the least were most likely they to say that their time in college instruction
was too long.
Teacher Experience
Shulman (2004) sees instruction as an opportunity for both the student and teacher
to gain understanding. Reflection on one’s practice and students’ work and progress can
increase a teacher’s PCK. How could teacher experience improve instruction? Shulman
(1986) proposes that the “Wisdom of Practice” is built a lesson at a time. He sees
professional judgment built through reflective experience. His model for Pedagogical
Reasoning and Action has six steps: Comprehension, Transformation, Instruction,
Evaluation, Reflection, and New Comprehension. First, the teacher must comprehend the
purpose, structure, and ideas related to the content to be taught. Next, the teacher’s work
is to transform knowledge of the content through a selection of materials, analogies or
metaphors, teaching methods, and adaptations suited to the students. During instruction
the teacher interacts with the student, uses careful questioning, models thinking,
gradually moves from the concrete toward abstract concepts, and guides the student
through inquiry processes. The evaluation of student understanding and the teacher’s own
performance occurs during interactive teaching and after instruction. Reflection on data
from this evaluation and critical analysis of one’s performance ultimately lead to the new
comprehension that guides subsequent instruction and produces learning from
experience. Shulman (2004) parallels the practices of medicine and teaching, concluding
that “professional judgment is the hallmark of any learned profession” (p. 253).

56
The value of teacher experience was the focus of a study by Chingos and Peterson
(2011). The researchers investigated the correlates of teacher effectiveness in Florida
public schools, examining math achievement of students in fourth through eighth grades
from 2002– 2009. Correlates of teacher effectiveness were calculated using student gains
(estimated value-added model) while controlling for school, teacher, and student
characteristics using Fixed Effects models. Teachers typically became more effective in
mathematics (had students with higher gains on state standardized assessments) over the
first 5 to 10 years of teaching experience but became less effective later in their careers.
In theory, experience should have a positive impact on pedagogical content
knowledge (Ball & Cohen, 1999). Cochran, DeRuiter, and King (1993) defined PCK as
the manner in which teachers relate their pedagogical knowledge to “specific subject
matter knowledge, in a specific context, for the teaching of specific students" (p. 266).
They used Venn diagrams to show how these four components overlap and how PCK is
centralized within the overlaps. The first diagram represented the integration of the four
components in a novice teacher, and the second larger diagram represented the
integration of the four components of an experienced teacher symbolizing the extra
knowledge gained from years of experience. The Venn diagram for the experienced
teacher showed expanding overlap, symbolizing increased integration of the four
components, thus greater PCK development. Cochran et al. (1993) advocate providing
teachers PCK learning opportunities that invite integration of specific subject matter
knowledge for a specific context and specific students.

57
Borko and Livingston (1989) conducted a qualitative case study of one
elementary and two secondary student teachers of mathematics and their supervising
teachers. Data were gathered through observations of teaching, interviews, and
examinations of lesson plans and post-lesson reflections. Novices had inefficient
planning practices and difficulty in responding to students during instruction. Novice
teachers were more likely to deviate from scripted lesson plans and were not as focused
on their post lesson reflections when compared to expert teachers. The researchers
concluded that novice teachers’ schemas were less elaborate and interconnected, resulting
in weaker pedagogical reasoning.
Two state-wide studies in South Dakota and Florida do not seem to validate
teacher-experience as a predictor of increased achievement. Apaza (2009) investigated
the relationship of teachers’ years of teaching experience and their years of involvement
in a mathematics reform grant program, but did not find significant variance in students’
performance assessment results or their scores on South Dakota’s high stakes
accountability assessment correlated to these teacher factors. Chingos and Peterson
(2011) examined the Florida Department of Education’s K–12 Education Data
Warehouse of student gain scores in reading and math by their teacher for each year from
2002 to 2009 for correlates of teacher effectiveness. They used three models to evaluate
the effect of on-the-job training/ teacher experience on student gain scores (value-added).
For fourth through sixth grades, they found that two models suggest improvement for
only the first five years of teaching in both reading and math. One model that assumed no
growth for the average teacher based on years of experience alone showed continued

58
growth in both subjects until about 25 years of experience. Based on their findings,
Chingos and Peterson questioned the practice of paying teachers more based on
experience and suggested that it is easier to hire well than it is to train a teacher (Chingos
& Peterson, 2011).
Contact Hours for Instruction
The amount of time spent in intervention is one variable a child study team may
adjust when a student is not making adequate progress in intervention. The student may
need additional, high-quality instruction to gain an understanding. Bryant, Bryant,
Gersten, Scammacca, and Chavez (2008) conducted a study of Tier 2 mathematics
interventions with students who were struggling with mathematics in first and second
grades. They targeted first and second grade students with math difficulties at a major
suburban school district in central Texas. The intervention was provided in small same-
ability groups for 64, fifteen minute sessions, across 18 weeks. The lessons focused on
number concepts, base 10 / place value, and addition / subtraction combinations.
Emphasis was placed on concepts known to be difficult for students struggling in
mathematics. Students did make accelerated progress in the interventions, but not at a
rate or level commensurate with their peers. The authors concluded that additional time
and more effective strategies were needed to close the achievement gaps.

59
Summary
The current literature addresses aspects of early intervention in mathematics, the
development of pedagogical content knowledge, and effects of teacher training, support,
and experience on student achievement. There are many opportunities to deepen
understanding of relationships among these factors and student achievement outcomes.
Often, studies of math interventions have small numbers of students and focus on
students’ fluency and calculations. PCK research from the 1990s associated teacher
variables with improved instruction, but focused on inputs. Recent research has applied
PCK to specific content areas: physical education, technology education, and math
education. The LMT measure allows a quantitative evaluation of PCK development and
its relationship to other teacher variables and student outcomes. The study described in
the following chapter will add to the literature with a large scale study with longitudinal
data of primary students with early numeracy goals. Findings may influence policy and
practice for teacher education and early math intervention.

60
CHAPTER THREE: METHDOLOGY
The purpose of Chapter Three is to propose methodology for a study that will add
to current research on early intervention in mathematics by addressing the gap in
understanding the relationship of teachers’ pedagogical content knowledge (PCK) with
students’ achievement gains. Shulman (2004) advocated deriving theory from teachers’
practices that have been shown to be of value. This study is undertaken in that spirit,
examining primary students’ documented math achievement gains and longitudinal data
on the following teacher characteristics: training, support, experience, pedagogical
content knowledge, and contact hours for instruction. The following student
characteristics will be considered: gender, grade, retention, IEP status, and entry math
achievement scores.
The math intervention grant program in this study may provide an exemplar of the
development and impact of teachers’ pedagogical content knowledge in early
mathematics intervention. A clear relationship between teacher characteristics and
student achievement gains could help guide schools’ early math intervention programs.
The relationship of contact hours for instruction and the teachers’ PCK to student
achievement could influence decisions to: (a) adjust instructional programs, (b) change
the duration of intervention lessons, or (c) employ a highly-skilled intervention teacher.
The relationship of specialized teacher training and/or support to student achievement
could help prioritize the use of resources. Certainly, increasing the effectiveness of early
intervention is necessary before diagnosing a learning disability based on a student’s
Response to Intervention alone. Clearly linking teachers’ pedagogical content knowledge
61
and contact hours for instruction to accelerated mathematics achievement would affirm
the importance of high quality, responsive instruction from a knowledgeable teacher.
Method
The methodology to be used to analyze the relationships between the teacher and
student variables with student achievement gains is presented in this chapter. First, the
research design will be described, beginning with a restatement of the research questions.
Then, descriptions will be provided for the context of the study, nature of the extant data,
teacher variables and student variables in the Logic Model, measures of student
achievement and teachers’ pedagogical content knowledge, analyses, limitations, and
implications for policy, practice and future research. The purpose of this chapter is to
describe the methods to be used to examine relationships of student and teacher
characteristics and students’ math achievement gains.
Research Design
This is a quantitative study of extant data from teachers and students that
participated in early intervention programs for mathematics. The data originated from the
monitoring of grant-funded programs by Kentucky Center for Mathematics (KCM,
2009). The study examines the math intervention teachers’ knowledge set for making
instructional decisions, termed pedagogical content knowledge in the research questions
that guided this study (Grossman, 1990; Veal & MaKinster, 1999).

62
Research Questions
(1) What is the relationship between a Mathematics Intervention Teacher's pedagogical
content knowledge, training hours, collegial support hours, years of intervention
experience, and intervention contact hours with students’ math achievement gains?
(2) Do math achievement gains differ between primary intervention students in each
quartile of prior math achievement?
Question one will be addressed with bivariate correlations between teacher and
student characteristics with the dependent variable of student achievement gains. A
regression will also be used to determine the proportion of influence for variables that are
correlated to student achievement. Question two will be addressed using an ANCOVA of
the student sample stratified in quartiles by their prior level of math achievement (entry
Terra Nova Math scaled scores). Variables with significant relationships to student
achievement gains will be included as covariates in the ANCOVA to determine the
importance of prior math achievement on students’ math achievement gains.
Shulman proposed that educational research should be: “(1) experimental; (2)
longitudinal; (3) multivariate at the level of both independent and dependent variables,
and …(4) differential, in that the interactions of the experimental programs with the
students’ entering individual differences are not treated as error variance, but as data of
major interest in the research” (Shulman, 2004, p. 35). The mathematic interventions in
this study were not a true experimental design, since the MAF grants were intended to
help struggling students and improve mathematics instruction across the state (Ludwig,

63
Maltbie, Marks, & Jordan, 2009). However, the structured, random sampling of MIT and
student data from 2009–2010 lends itself to statistical evaluation. The study includes
longitudinal data on teacher variables gathered from school year 2006–2007 to 2009–
2010. Data from the 2009–2010 school year includes students’ demographics (gender,
retention, and IEP status – whether the student had an Individualized Education Plan for
special education services), hours of contact with the MIT for math instruction, and math
achievement scores. Students come to school with some math experiences, so even
kindergarten students vary in the amount of math content knowledge they have before
they begin intervention instruction. The question is whether students benefit differentially
from intervention instruction based on their previous math knowledge. Bivariate
correlations, analysis of variance, regression correlations, and an analysis of covariance
will be used to examine relationships between teacher and student variables, students’
prior math achievement, and student math achievement gains.
The Logic Model (Figure 3.1) reflects teachers’ cumulative hours of training,
support, and experience as Mathematics Intervention Teachers as of 2009–2010. The
underlying assumption is that the quality of instruction teachers provided in 2009–2010
would be affected by the sum of their experiences.
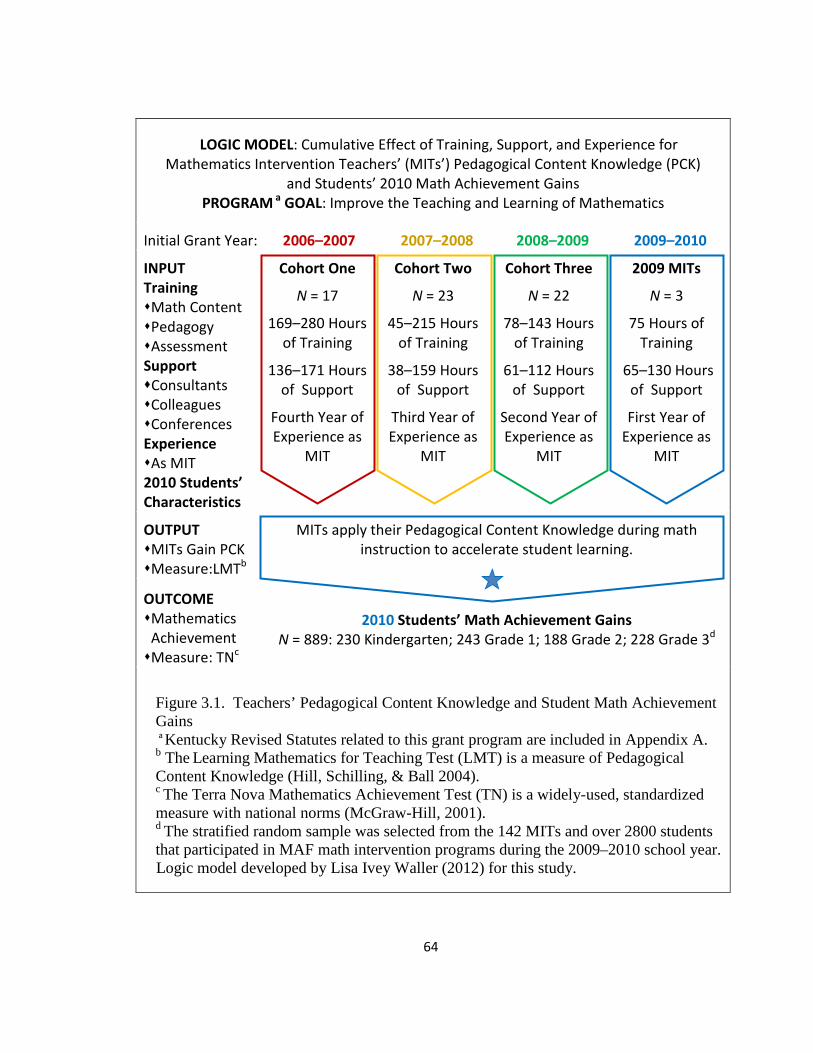
64
LOGIC MODEL: Cumulative Effect of Training, Support, and Experience for Mathematics Intervention Teachers’ (MITs’) Pedagogical Content Knowledge (PCK)
and Students’ 2010 Math Achievement Gains PROGRAM a GOAL: Improve the Teaching and Learning of Mathematics
Initial Grant Year: 2006–2007 2007–2008 2008–2009 2009–2010
INPUT Training Math Content Pedagogy Assessment Support Consultants Colleagues Conferences Experience As MIT 2010 Students’ Characteristics
Cohort One
N = 17
169–280 Hours of Training
136–171 Hours of Support
Fourth Year of Experience as
MIT
Cohort Two
N = 23
45–215 Hours of Training
38–159 Hours of Support
Third Year of Experience as
MIT
Cohort Three
N = 22
78–143 Hours of Training
61–112 Hours of Support
Second Year of Experience as
MIT
2009 MITs
N = 3
75 Hours of Training
65–130 Hours of Support
First Year of Experience as
MIT
OUTPUT MITs Gain PCK Measure:LMTb
MITs apply their Pedagogical Content Knowledge during math instruction to accelerate student learning.
OUTCOME Mathematics Achievement Measure: TNc
2010 Students’ Math Achievement Gains N = 889: 230 Kindergarten; 243 Grade 1; 188 Grade 2; 228 Grade 3d
Figure 3.1. Teachers’ Pedagogical Content Knowledge and Student Math Achievement Gains a Kentucky Revised Statutes related to this grant program are included in Appendix A. b The Learning Mathematics for Teaching Test (LMT) is a measure of Pedagogical Content Knowledge (Hill, Schilling, & Ball 2004). c The Terra Nova Mathematics Achievement Test (TN) is a widely-used, standardized measure with national norms (McGraw-Hill, 2001). d The stratified random sample was selected from the 142 MITs and over 2800 students that participated in MAF math intervention programs during the 2009–2010 school year. Logic model developed by Lisa Ivey Waller (2012) for this study.
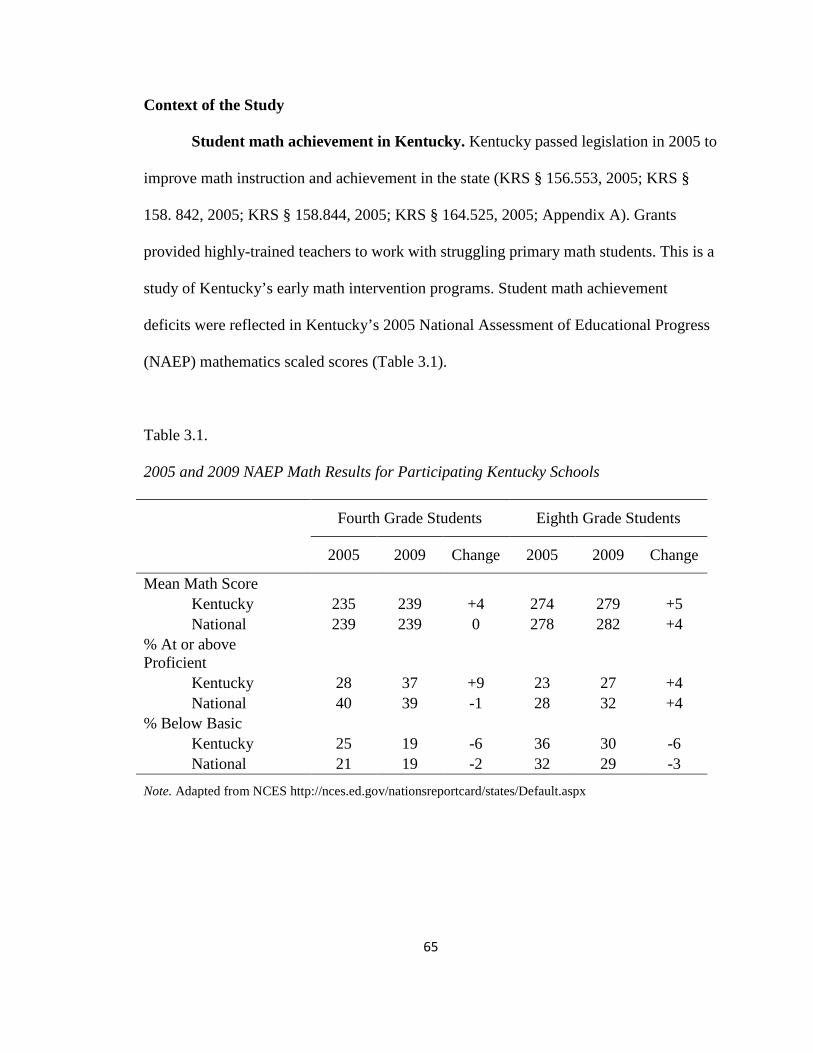
65
Context of the Study
Student math achievement in Kentucky. Kentucky passed legislation in 2005 to
improve math instruction and achievement in the state (KRS § 156.553, 2005; KRS §
158. 842, 2005; KRS § 158.844, 2005; KRS § 164.525, 2005; Appendix A). Grants
provided highly-trained teachers to work with struggling primary math students. This is a
study of Kentucky’s early math intervention programs. Student math achievement
deficits were reflected in Kentucky’s 2005 National Assessment of Educational Progress
(NAEP) mathematics scaled scores (Table 3.1).
Table 3.1.
2005 and 2009 NAEP Math Results for Participating Kentucky Schools
Fourth Grade Students Eighth Grade Students
2005 2009 Change 2005 2009 Change
Mean Math Score Kentucky 235 239 +4 274 279 +5 National 239 239 0 278 282 +4 % At or above Proficient
Kentucky 28 37 +9 23 27 +4 National 40 39 -1 28 32 +4 % Below Basic Kentucky 25 19 -6 36 30 -6 National 21 19 -2 32 29 -3
Note. Adapted from NCES http://nces.ed.gov/nationsreportcard/states/Default.aspx

66
Kentucky’s students’ mean math scores at fourth and eighth grades were 235 and
274, respectively, compared to national means of 239 (fourth grade) and 298 (eighth
grade) public schools. Before Kentucky began its math intervention grant program, 25%
of fourth grade students and 36% of eighth grade students scored in the Below Basic
range on the 2005 NAEP. By 2009 Kentucky’s fourth grade scores had risen to 239 and
its eighth grade math scaled scores had risen to 279 in the average range. Accelerated
NAEP Mathematics gains for Kentucky students are reflected in Table 3.1.
Math Achievement Fund grant program. Kentucky Mathematics Achievement
Fund Grants included the math intervention teacher’s salary; technology; and training in
math content, pedagogy, and the assessment of student learning. Funds were also
available for instructional materials, ongoing monitoring, and teacher support. The
Kentucky Center for Mathematics gathered teacher and student data from 2006 to 2009 to
be independently evaluated through the University of Cincinnati Evaluation Services
Center. During the 2009–2010 school year, Math Intervention Teachers (MITs) were in
123 schools within 72 school districts, directly serving 3,075 students (KCM, 2010).
There are 648 elementary schools and 174 school districts in the state of Kentucky in
2009–2010 (KDE, 2011). In the 2009–2010 school year data were gathered on a stratified
random sample of teachers and some or all of the grade levels they served (KCM, 2010).
The 2010 MIT and student data sets are suitable for statistical analysis. Longitudinal data
from 2006 to 2010 on MITs’ training, collegial support, contact hours for instruction, and

67
pedagogical content knowledge provide an opportunity to examine relationships between
these factors with student achievement in 2009–2010.
Students Receiving Early Math Intervention
Individual schools determined the selection process for students that will
participate in math interventions, but schools’ plans were approved within the grant
application process (Appendix C). Each school used a universal screening measure (e.g.
Measures of Academic Progress, GMADE, or Terra Nova) along with teacher judgment,
parent input, and other relevant information to identify struggling students at risk of
failing to achieve state academic standards for mathematics. The 2009–2010
interventions served students in kindergarten to third grade, between the ages of five and
nine. Statewide 60% of the students in interventions were in kindergarten; 15.4% were in
first grade; 20.1% were in second grade; and 4% were in third grade. In 2009–2010,
50.5% of intervention students were female, and 19.9% of the intervention students had
an Individualized Education Plan. The extant data does not include information on ethnic
background, race, socio-economic status, or health status.
The students in the sample and all primary students in the math interventions were
selected because they were struggling in mathematics. The Math Intervention Teacher
Handbook’s guidelines for student selection state that students should be “…failing or
most at risk of failing to meet proficiency on Kentucky's Program of Studies, on the basis
of multiple, educationally related, objective criteria established by the local school.
Additional sources of data for selection are teacher judgment, interviews with parents and

68
other developmentally appropriate measures,” (Appendix C, p. 12). Parental consent was
required for participation in the intervention and Terra Nova assessment (Appendix D).
Teachers Providing Math Intervention Instruction
All participating teachers had Kentucky elementary teaching certificates and at
least three years of prior teaching experience, before becoming Math Intervention
Teachers. As elementary teachers, each MIT had a generalist college course of study that
included some math content and instructional methods classes, but less mathematics
coursework than is required for secondary math certification. In 2010, MITs had one to
four years of experience as interventionists and varied amounts of training, support, and
hours of contact with students. The majority of the MITs were hired and trained in
cohorts (2006–2007, 2007–2008, or 2008–2009). Funding was not available for an
additional cohort of MITs in 2009–2010. However, teachers were hired and trained to
replace exiting MITs. All mathematics intervention training was organized by the
Kentucky Center for Mathematics. MITs received an average of 126 hours of training. for
Math Recovery, Number Worlds, and/or Math Add+Vantage Math Recovery intervention
programs. Also, teachers were trained to assess student understanding through strategic
observation. All teachers had access to ongoing support through regional coordinators,
peer visits, web based resources, and annual math conferences.
69
Student and Teacher Samples for Study
This study uses a stratified random sample of MITs and students in randomly
selected grade levels from each MIT in the sample from the 2009–2010 school year. The
teacher sample was stratified by program training, years of experience, and grade level
served. The sample data set includes 65 teachers and 889 students. MITs in the sample
were asked to submit data for students in randomly selected grade level(s). The years of
experience for MITs in the sample were as follows: 17 were in year four (4); 23 were in
year three (3); 22 were in year two (2); and 3 were in year one (1). The 889 student
sample included 230 students in kindergarten; 243 students in first grade; 188 students in
second grade; and 228 students in third grade. The data from the 2009–2010 Math
Intervention Teacher and student samples can be analyzed with inferential and
multivariate statistics (Table 3.2).
Data Collection
The Kentucky Center for Mathematics (KCM) was given charge of the
Mathematics Achievement Fund (MAF) interventions. KCM gathered demographic data,
achievement scores, teacher, and program information. This is a study of that extant data.
Additional information was not gathered from teachers or students. Confidentiality of
human subjects’ data has been maintained through the Kentucky Center for Mathematics’
use of codes. Data included no individually identifiable information on teachers or
students. Because the data are blinded, there are no identifiers that would allow
identification of students or individual math intervention teachers. Furthermore, all
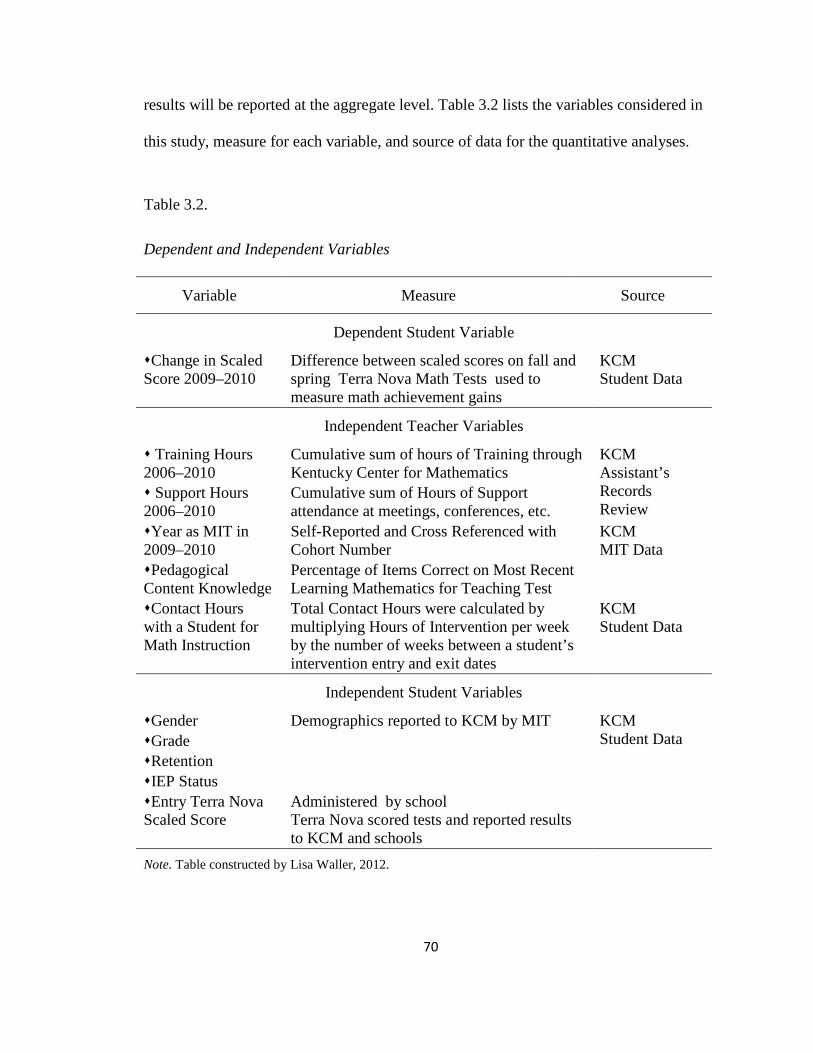
70
results will be reported at the aggregate level. Table 3.2 lists the variables considered in
this study, measure for each variable, and source of data for the quantitative analyses.
Table 3.2.
Dependent and Independent Variables
Variable Measure Source
Dependent Student Variable
Change in Scaled Score 2009–2010
Difference between scaled scores on fall and spring Terra Nova Math Tests used to measure math achievement gains
KCM Student Data
Independent Teacher Variables
Training Hours 2006–2010
Cumulative sum of hours of Training through Kentucky Center for Mathematics
KCM Assistant’s Records Review
Support Hours 2006–2010
Cumulative sum of Hours of Support attendance at meetings, conferences, etc.
Year as MIT in 2009–2010
Self-Reported and Cross Referenced with Cohort Number
KCM MIT Data
Pedagogical Content Knowledge
Percentage of Items Correct on Most Recent Learning Mathematics for Teaching Test
Contact Hours with a Student for Math Instruction
Total Contact Hours were calculated by multiplying Hours of Intervention per week by the number of weeks between a student’s intervention entry and exit dates
KCM Student Data
Independent Student Variables
Gender Demographics reported to KCM by MIT KCM Student Data Grade
Retention IEP Status Entry Terra Nova Scaled Score
Administered by school Terra Nova scored tests and reported results to KCM and schools
Note. Table constructed by Lisa Waller, 2012.
71
Teacher Variables
Training for math intervention. This study uses the term training to distinguish
teacher education in the MAF grants from college coursework and professional
development offered by a school district. The Kentucky Center for Mathematics provided
opportunities for teachers to receive training in mathematics intervention programs, math
concepts, content-specific pedagogy, patterns of student learning, and student assessment.
KCM monitored trainings in which each MIT participated from summer of 2006
to spring of 2010 and reported it by teachers’ identification codes. The hours were totaled
across their years as MITs to calculate the number of training hours for each MIT in the
sample. Training topics were closely aligned to components of pedagogical content
knowledge: math content knowledge, knowledge of context— including understanding
the student as a learner; and pedagogical knowledge of topic-specific instructional
strategies to accelerate student learning. The Learning Mathematics for Teaching (LMT)
was used to measure the impact of training on teachers’ pedagogical content knowledge
prior to trainings and in the spring of each school year.
Collegial support. Collegial support for teachers is a variable identified by
Kentucky Revised Statues as an essential part of the work of the Kentucky Center for
Mathematics (KRS § 164.525, 2005). Support for teachers doing interventions was
monitored for each MIT through self-reported responses to surveys and anecdotal
feedback on the quality of support provided by Kentucky Center for Mathematics,
schools, administration, and school districts. Regional coordinators and KCM staff

72
members were available for support by e-mail and phone. Support also took the form of
attendance at conferences, meetings, and peer visits. The evaluation report from the
UCESC summarized responses to surveys about the range of supports that were
available. Anecdotal remarks from teachers suggested that they were appreciative of the
promptness and willingness of Regional Coordinators and KCM staff members to
provide support, but gave little detail about what they gained from contacts. The data that
was available through KCM for the 2009–2010 school year could not be matched to
individual MIT identification codes, but the number of hours teachers had reported for
support for each year as an MIT was available. Graduate assistants compiled the hours of
support from MIT attendance at meetings and conferences from 2006 to 2010. The
cumulative hours of support were calculated for each MIT in the sample. The data did not
represent all peer visits, phone calls, and conversations with regional consultants. The
surveys conducted by KCM addressed support with qualitative questions about the MITs’
satisfaction with support services. There was little variation in the number of hours
reported. Analysis with incomplete data may underestimate the relationship between
collegial support with student achievement gains.
Experience as an MIT. Experience as an MIT was the measure selected to
analyze the impact of a teacher’s intervention practice and reflection. The number of
years each teacher had as a math intervention teacher was reported as years of experience
and according to whether the teacher was part of cadre 1, 2, 3, or trained in 2009–2010 to
replace an MIT who had exited the program. The nature of teachers’ anecdotal records

73
had been described to shift from procedural issues to instructional decisions and then to
observation of student learning across the course of a Math Recovery teacher’s first two
years of instruction (US MRC, 2010). The LMT assessment is designed to monitor
changes in a teacher’s pedagogical content knowledge that result from teaching
experience (Hill et al., 2004). The MITs were elementary teachers with at least three
years of teaching experience when selected for cohorts in 2006, 2007, or 2008. The
2009–2010 school year was the fourth year of MIT experience for the 2006–2007 cohort
members, but it was the first year of MIT experience for teachers hired in 2009. The
variable of MIT experience may provide insight into the impact of practice and reflection
on teachers’ PCK and students’ achievement gains.
Pedagogical content knowledge. The variable of pedagogical content knowledge
is what teachers need to know to provide effective instruction. The measure used in this
analysis is the percentage of items answered correctly on the elementary Learning
Mathematics for Teaching Test. A significant relationship with student achievement
gains would affirm the importance of a teacher possessing and being able to make
application of the knowledge during instruction. A knowledgeable teacher can accelerate
student achievement by helping the student work at the upper limits of her mathematical
understanding. A teacher’s pedagogical content knowledge may be increased through
training, support, experience, hours of contact with students, years of experience, and
reflection on teaching and learning while watching daily recordings of their own lessons.
Pedagogical content knowledge (PCK) is hypothesized to account for the differential

74
effect of teachers upon student achievement, since PCK blends knowledge of math
content, knowledge of the student as a learner, and the teachers’ pedagogical skills to
help students improve their mathematical reasoning.
Contact hours for instruction. Contact hours for instruction are included as a
teacher-variable for each student in the analysis. This variable measures the duration of
time for a teacher’s pedagogical content knowledge, experience, and/or training to affect
student achievement through instruction. When schools evaluate student progress in an
intervention, decisions are made concerning the amount of time a student receives
instruction by a highly–skilled teacher. The size of the student sample from each MIT’s
caseload varies because a stratified random sampling determined which students and
grade levels were included in the sample. The sample was stratified to be proportionate to
the 2009–2010 population of students and MITs.
Math intervention program. The mathematics intervention program will not be
considered as a teacher variable for three reasons. First, all MIT’s have received training
in Math Recovery to improve the responsiveness of their instruction whether they use
Number Worlds or Math Recovery and Add+Vantage Math. Second, the trend lines of
data published in the 2009 program evaluation (UCESC, 2009) suggest that students
made similar math achievement gains in each math intervention program and in the year
following intervention. Third, there were no significant differences among teachers’ gains

75
on the LMT based on the intervention program they had been trained to implement
(UCESC, 2009).
Math Recovery is an intervention designed specifically for students in first grade.
It is taught one to one. Math Recovery teacher training develops the teacher’s ability to
observe students’ work and select instructional strategies to best help students make
continual progress. It uses models and manipulative materials to help the students
construct mathematical understanding. It is designed to last for up to 60 thirty-minute
lessons. Add+Vantage Math Recovery (MR) uses the same instructional approach for
small group instruction with primary students. Add+Vantage MR is designed to be used
with a small group of five to six students. It is driven by an assessment that identifies a
student’s current level of understanding. The frequency and duration of lessons is
determined by the teacher. Number Worlds is designed to be a preventative program for
kindergarten and first grades. It is usually taught in a small group of five students.
Number Worlds uses a series of lessons to address one or more areas of mathematics,
based on a student’s areas of low performance on a pre-test. Intervention with Number
Worlds may last for a few weeks, a semester, or a full year.
Teachers who were initially trained to use Number Worlds for intervention were
provided the opportunity to learn Math Recovery strategies to increase the responsiveness
of their math instruction. The Math Intervention Teachers were also provided
Add+Vantage Math Recovery training to use the same researched strategies as were used
in Math Recovery for small group instruction. Figure 3.2 illustrates the achievement of
students in 2007–2008, the second year of the MAF intervention grants.

76
Terr
a N
ova
Scal
ed S
core
s 550
563 Number Worlds Math Recovery
541 555
525 528
500
475
461
450
435 2007–2008 Student Counts
425 Number Worlds (n = 68)
Math Recovery (n = 77)
Fall 2007 Spring 2008 Spring 2009
Figure 3.2. First Grade Math Achievement Gains through Spring of Second
Grade. Adapted from The Kentucky Center for Mathematics 2008–2009
Intervention Program: Evaluation by the University of Cincinnati Evaluation
Services Center (2009).
In Figure 3.2 the entry scaled scores for first grade intervention students were
similar for Number Worlds at 461 and Math Recovery at 435. Mean scaled score gains
during the year of intervention were 80 points for students in Number Worlds (N = 68)
and 93 points for students in Math Recovery (N = 93). Mean scaled score gains during
the students’ second grade year, with core math instruction alone, were 22 points for
students who had Number Worlds instruction 27 points for students who had Math
Recovery.
Second and third grade intervention students in Math Recovery/Add+ Vantage
Math are observed as they work for understandings, preconceptions, and misconceptions.

77
Math tasks are chosen to help the student reconcile the incongruence and construct new
understanding. Number Worlds for second and third grades is a remediation program that
uses games and manipulative materials to support the student’s progress in the core math
program. Although the programs differ more at these grade levels, students’ progress
during intervention and into the next school year were similar (Figure 3.3 & Figure 3.4).
Terr
a N
ova
Scal
ed S
core
s
625
Number Worlds Math Recovery
609
600
575 576 596
550 564
525
500 506 2007–2008 Student Counts
503 Number Worlds (n = 141)
475 Math Recovery (n = 19)
Fall 2007 Spring 2008 Spring 2009
Figure 3.3. Second Grade Math Achievement Gains through Spring of Third
Grade. Adapted from The Kentucky Center for Mathematics 2008–2009
Intervention Program: Evaluation by the University of Cincinnati Evaluation
Services Center (2009).
In Figure 3.3 the entry scaled scores for second grade intervention students were
similar for Number Worlds at 506 and Math Recovery at 503. Mean scaled score gains
during the year of intervention were 70 points for students in Number Worlds (N = 141)

78
and 61 points for students in Math Recovery (N = 19). Mean scaled score gains during
the students’ third grade year, with core math instruction alone, were 33 points for
students who had Number Worlds instruction and 32 points for students who had Math
Recovery. Third grade students’ scores are illustrated in Figure 3.4.
Terr
a N
ova
Scal
ed S
core
s
675
Number Worlds Math Recovery
650
625 615
600 605 612
575 592
550 552 2007–2008 Student Counts
550 Number Worlds (n = 188)
525 Math Recovery (n = 33)
Fall 2007 Spring 2008 Spring 2009
Figure 3.4. Third Grade Math Achievement Gains through Spring of Fourth
Grade. Adapted from The Kentucky Center for Mathematics 2008–2009
Intervention Program: Evaluation by the University of Cincinnati Evaluation
Services Center (2009).
In Figure 3.4 the entry scaled scores for third grade intervention students were
similar for Number Worlds at 552 and Math Recovery at 550. Mean scaled score gains
during the year of intervention were 53 points for students in Number Worlds (N = 188)
and 42 points for students in Math Recovery (N = 33). Mean scaled score gains during

79
the students’ fourth grade year, with core math instruction alone, were 10 points for
students who had Number Worlds instruction 20 points for students who had Math
Recovery.
Student Variables
Grade. Shulman’s (2004) recommendations for sound research design in
education included the recommendation that student factors be considered as essential to
an investigation. The variables included in the extant data from the Kentucky Center for
Mathematics included the student’s grade. The math interventions in this study were
implemented in kindergarten through grade three. The student’s grade level may affect
prior math achievement, attitudes towards themselves as mathematicians, the potential
size of the achievement gap between the student and same-aged peers, and the difficulty
level the student experiences in their core mathematics instruction.
Retention and IEP status. Retention is a variable that suggests long-term
learning difficulties that were significant enough to consider separating a child from their
same aged peers. Retention may have a negative relationship with student achievement
gains. Similarly, a student’s Individual Education Plan status is a variable that indicates
whether the student receives services through special education due to a diagnosed
disability. The nature of students’ disabilities varies. Students’ health, intellectual,
learning, developmental, speech, or language difficulties may have been sufficient to
warrant special education services. While the nature or severity of a student’s difficulties

80
cannot be determined from this data, it was included to examine any interaction between
IEP services and success in early math intervention.
Gender. Gender was also a variable. There were similar numbers of girls and
boys in the 2009–2010 population and sample. Historically, boys have outperformed girls
in science and mathematics by the time they are in secondary schools. On Kentucky’s
2009 Interim Performance Report, 71.67% of female fourth grade students and 71.04% of
male fourth grade students were at or above the proficient level in mathematics (KDE,
2010). On the 2011 NAEP math test, Kentucky’s male students outperformed female
students by two scale score points with no more than 2% difference by gender for any
achievement range (NCES, 2011). This variable will provide insight into the relationship
of gender to achievement gains from early math intervention.
Prior math achievement. Finally, the prior math achievement variable allows for
analysis of the effect of previous learning on math achievement gains during intervention.
While all students selected to receive instruction from an MIT were among the lowest
performing students in the school, there can be large differences in the nature of a
student’s deficits. When students are selected for intervention, the lowest performing
students may be unable to rote count to three (3), while others may need alternative
strategies for adding two-digit numbers. The question for a school may be whether
students at different starting points benefit differentially to math intervention.

81
Dependent Variable
Student math achievement gains. Student math achievement gains, as measured
by the Terra Nova Math Achievement Tests, are the dependent variable for this study.
The fall Terra Nova was administered as a pre-test. The spring Terra Nova was
administered as a post-test after intervention instruction had ended. The difference in the
two Terra Nova math scores was calculated to provide a math achievement gain score for
each student in the sample. Student characteristics from the extant data base that may
affect student achievement include grade level, prior math achievement, gender,
retention, Individualized Education Plan status, and contact hours for math intervention
instruction. Student achievement gains may affect: (a) a MIT’s sense of efficacy, (b) the
impact of intervention experience (c) the training or support a MIT seeks, or (d) the
number of hours of instruction an MIT provides the student.
Relationships between Variables with Math Achievement Gains
Teacher pedagogical content knowledge, teacher training and support and
intervention experience are hypothesized to affect achievement during contact hours for
intervention instruction Training and support may affect student achievement gains by
building pedagogical content knowledge to be applied in instructional decision-making.
Trainings provided by KCM addressed components of PCK, including contextual
knowledge for assessing and understanding the struggling primary student as a learner
and content-specific pedagogy to promote student achievement. It is possible that
strategies gained in the trainings or from conversations with colleagues may directly

82
impact instruction and student achievement without affecting PCK. Similarly, experience
applying training may increase PCK and/or effectiveness of instruction.
The impact of PCK as measured by the LMT may be dependent on skilled
application of that knowledge to accelerate student achievement. In turn, student
achievement gains may affect the level of a teacher’s application of pedagogical content
knowledge during instruction or affect how much support or additional training a teacher
seeks. Multivariate analysis will be used to investigate the significance of relationships
between teacher and student variables with students’ math achievement gains. These
hypothetical relationships are illustrated in Figure 3.5.
In addition to the development and application of pedagogical content knowledge,
Figure 3.5 illustrates that students’ characteristics provide the context for early math
intervention and that instructional contact hours are the mechanism through which
training, support, experience, and the application of PCK may affect student
achievement.

83
Math Achievement
Gains
Pedagogical Content
Knowledge
Math Intervention Experience
Prior Math Achievement, Gender, Grade, Retention, & IEP Status
Intervention Training &
Support
Instruction Contact Hours
Figure 3.5. Possible Relationships between Teacher and Student Variables with
Primary Intervention Students’ Math Achievement Gains. Accelerated student
achievement is the purpose of early intervention. Instruction contact hours
provide the opportunity for the teacher’s pedagogical content knowledge, training,
support, and intervention experience to affect achievement. Training, support, and
experience may also affect teachers’ pedagogical content knowledge. The figure
is embedded in a larger triangle representing the context and impact of students’
characteristics during math interventions.
Developed by Lisa Waller, 2012.
84
Assessments Included in Data Analyses
Measure of student achievement: Terra Nova Math tests. The Terra Nova
standardized math achievement tests were used when students entered and exited
interventions. These are commercially available achievement tests with national norms
and are widely used in schools. As proprietary publications, copies of these assessments
may not be included in this document, but information is available at
http://www.ctb.com. Tests were administered by the schools, but scoring and data
collection were done by SRA McGraw-Hill and sent to the schools and KCM. The Terra
Nova was administered at the beginning of the school year in all participating schools as
a pre-test for students who were struggling in mathematics and were under consideration
for early intervention. The test was also used at mid-year or near the end of the second
semester as a post-test to assess math achievement gains. Schools obtained written
parental permission to administer the assessments and provide math intervention
instruction to students. The data base includes scores for each administration of the Terra
Nova math test, scaled scores, normal curve equivalencies, percentiles, and grade
equivalencies. Achievement gains were calculated using scaled scores, because they are
an equal-interval scale that makes gains of the same number of points comparable across
grade levels and allows the scores to be used in calculations. For use in this analysis,
entry fall Terra Nova Math Test scaled scores were subtracted from spring scaled scores
to obtain a math achievement gain score. These scores will be the dependent variable as a
measure of student learning in this analysis of the relationships between teacher and
student characteristics in early math interventions.

85
Measure of teachers’ PCK: Learning Mathematics for Teaching tests. The
teachers’ pedagogical content knowledge was assessed using the elementary Learning
Mathematics for Teaching (LMT) measures. The LMT tests were developed by Heather
Hill, Deborah Ball, and Stephen Schilling at the University of Michigan through a grant
from the National Science Foundation (2004). The assessments are designed to
investigate the mathematical and professional knowledge used to support the teaching of
math content. Also, the LMT is intended to monitor knowledge developed through
professional experience and teaching (Hill, Dean, & Goffney, 2008). The assessments’
items are designed to reflect mathematics tasks that tea.chers encounter as they assess
student work, use concrete, symbolic, and abstract representations of numbers and
operations, and communicate the rules and procedures of mathematics to learners. The
items seek to determine the teacher’s ability to choose representations, interpret student
responses to assessing understanding and analyze difficulties. Items probe for teachers’
knowledge of typical student errors and the reasoning behind the errors. They draw upon
a teacher’s understanding of developmental sequences and the strategies students might
employ for solving a problem (Hill et al., 2004).
LMT item design. Items on the Learning Mathematics for Teaching were
validated to address the specialized knowledge used by teachers through a process that
examined the reasoning used by teachers, non-teachers, and mathematicians to answer
the test items. The justifications of test-takers included mathematical justification,
memorized rules and algorithms, definitions, examples and counter-examples or pictures,

86
knowledge of students and context, or other mathematical reasoning (Hill, et al., 2008).
The LMT factor analysis reflects three dimensions: “(a) knowledge of content in number
concepts and operations K–6; (b) knowledge of content in patterns, functions, and algebra
K–6; and (c) knowledge of students and content in number concepts and operations 3–8,”
(Hill, Ball, & Schilling, 2004, p. 18).
LMT administration. The LMT can be administered with pencil and paper or
through the online Teacher Knowledge Assessment System. The KCM sent invitations to
MITs to take the online version of the LMT in spring of 2010. The University of
Cincinnati Evaluation Services Center then downloaded results for analysis. Results were
included in the extant data base as percentage correct. The LMT items were designed so
that 50% of teachers answer 50% of test items correctly. A histogram of MITs’ 2009–
2010 LMT scores is displayed with the normal curve from the MITs’ first LMT scores in
Figure 3.6. The histogram shows a negative skew for the LMT scores in 2009–2010. The
mean score of 59.73 shows an increase in teachers’ pedagogical content knowledge,
compared to the mean score of their first LMT tests of 54.82 (SD = 13.75). All MIT’s in
the teacher sample had spring 2010 LMT scores. For a small number of MITs the
summer 2009 LMT score was the most recent score available for the analysis shown in
Table 3.3.

87
Figure 3.6. MITs’ 2009–2010 Learning Mathematics for Teaching Test Scores:
Compared to Normal Curve for MITs’ First LMT Scores. Adapted from Kentucky
Center for Mathematics’ 2006–2010 MIT database.
Table 3.3.
Learning Mathematics for Teaching Test: MITs’ Percentage Correct
Measure of Pedagogical Content Knowledge
2009–2010 Math Intervention Teachers Percentage Correct
N Valid 142 M 59.73 Missing 0 Mdn 59.74 SD 16.51 Range (9.09 to 93.51) 84.42
Freq
uenc
y
Percentage Correct
2010 LMT __ M = 59.73 SD = 16.51 N = 142 First LMT __ M = 54.75 SD = 13.75 N = 142

88
In 2009–2010, the median LMT score for all MITs (N = 142) was 59.73% correct,
with only 26.1% scoring below 50% correct (Table 3.3; Figure 3.6). Scores ranged from
9.09 to 93.51% correct. The scores represent higher levels of pedagogical content
knowledge than expected in a random sample of teachers.
LMT use in this analysis. LMT scores were used in this analysis as a measure for
MITs’ pedagogical content knowledge. LMT scores were taken as they were present in
the extant data base as percentage correct. The KCM gathered data to monitor whether
teacher training effectively increased teachers’ math content and pedagogical content
knowledge. Although the LMT was administered as a pre-test before training sessions, a
post-test was not administered at the close of the sessions, but spring administration of
the LMT was conducted through online administration of the assessment. The majority of
LMT scores in this analysis were from spring of 2010. The most recent LMT score from
the 2009–2010 school year was used as a measure of teachers’ PCK level during that
school year.
Summary
The analyses of the teacher and student data from the 2009–2010 school year will
examine relationships between the variables with student math achievement gains. The
analyses will also examine how students’ prior achievement affects the relationship of the
independent variables and the dependent variable of student math achievement gains. The
results may guide the decision-making when a student is not making adequate progress.

89
CHAPTER FOUR: RESULTS
Overview of the Study
Chapter Four presents the results of quantitative analyses of Math Intervention
Teachers’ pedagogical content knowledge and students’ math achievement gains. The
intent of the investigation is to inform decision-making in early intervention programs.
Longitudinal teacher data from summer 2006 to spring 2010 was examined in
relationship to 2010 student achievement gains. The two research questions under
consideration are as follows:
(1) What is the relationship between a Mathematics Intervention Teacher's pedagogical
content knowledge, training hours, collegial support hours, years of intervention
experience, and intervention contact hours with students’ math achievement gains?
(2) Do math achievement gains differ between primary intervention students in each
quartile of prior math achievement?
Students’ math achievement gains were shown to increase with the hours of
contact for instruction with the highly trained math specialists and with teachers’ higher
pedagogical content knowledge. These findings and others are discussed in this chapter.
The quantitative results begin with general descriptive statistics of the sample population
of teachers and students. The first question is addressed with correlation and regression
analyses of teacher variables with the dependent variable of student math achievement

90
gains. The chapter then addresses the second question by stratifying the student sample in
quartiles by entry scores on the Terra Nova Mathematics tests. Then, differences in math
achievement gains are examined between student quartiles with an Analysis of
Covariance.
Student Sample
The dependent variable for all statistical analyses in this study is Student Math
Achievement Gains. The student sample for this study (n = 889) includes all students
who participated in Mathematics Achievement Fund (MAF) interventions during the
2009–2010 school year and completed the pre and post Terra Nova assessments. The
sample included students in kindergarten (n = 230), first grade (n = 243), second grade (n
= 188), and third grade (n = 228). There were 440 male students and 449 female students
in the sample. Teachers reported the IEP status for 862 of the 889 students in the sample,
identifying 172 (19.9%) of the students in math intervention as having an IEP. MITs were
not asked to identify students’ category of disability. Teachers identified 32 (3.6%) of the
889 students as having been retained.
The math intervention program used with each student influenced the number of
contact hours they had with the Math Intervention Teacher for instruction. The
recommended duration for each intervention program was as follows: Math Recovery or
Add+Vantage MR, twelve to fifteen weeks; Number Worlds, one unit to a full year of
lessons; and Student Numeracy Assessment Progressions’ (SNAP’s) duration of
interventions were unspecified.

91
Each student participated in a pre-test administration of a Terra Nova
Mathematics test and a post-test administration of a Terra Nova Mathematics test. The
entry scaled score was subtracted from the post-test scaled score. The difference in the
two scaled scores became the student’s math achievement gain score for these
calculations. The mean scaled score gain for all students in the sample was 61.28 points
(SD = 45.14). The mean math achievement gain for students grouped according to each
of these variables was calculated by grade, gender, IEP status, and history of retention.
Mean math achievement gains. The mean math achievement gain for all
students in the sample (n = 899) as 61.28 scaled score points, calculated from the
difference in entry and post-test administration of Terra Nova math achievement tests.
The math achievement scores gains ranged from -45 to 243 points with a standard
deviation of 45.14.
Gains by grade. Student achievement gains were calculated from Terra Nova
scaled scores. This is an equal interval and vertically equated scale that allows gains to be
compared across grade levels, so that a gain of 40 points at first grade is comparable to a
gain of 40 points at third grade. A score of 550 by a student in any grade reflects mastery
of similar mathematics. The mean gains for the sample of math interventions students in
2009–2010 by grade level are displayed in Table 4.1.

92
Table 4.1.
2009–2010 Students’ Mathematics Achievement Gains by Grade
Grade M N SD Range
Kindergarten 76.98 230 50.85 257 1st Grade 67.26 243 43.80 270 2nd Grade 50.07 188 38.55 233 3rd Grade 46.66 228 38.98 279 Total 61.28 889 45.14 286 Note. Scaled score gains calculated from Terra Nova Mathematics tests given before and after intervention
during 2009–2010 school year.
Table 4.1 shows the greatest mean scaled score gains were achieved at
kindergarten, 76.98 (SD = 50.85) and slightly decreased each year. The mean
achievement gains for intervention students were 67.26 (SD = 43.80) at first grade (n =
243), 50.07 (SD = 38.55) at second grade (n = 188), and 46.66 (SD = 38.98) at third grade
(n = 228).
Gains by retention status. The Kentucky Department of Education encouraged
an ungraded primary program as part of its 1991 school reforms. Students could progress
from kindergarten through third grade at their own pace and receive instruction at the
appropriate level without being retained. However, the use of the ungraded primary has
diminished, and 32 students in the sample were identified as having been retained in or
before the 2008–2009 school year. Retention is an important variable because it suggests
a persisting difficulty with learning and/or inadequate instruction (Table 4.2).

93
Table 4.2.
2009–2010 Students’ Mathematics Achievement Gains by Retention
Retained M N SD Range
No 61.69 857 45.58 286 Yes 50.25 32 29.36 130 Total 61.28 889 45.14 286 Note. Scaled score gains calculated from Terra Nova Mathematics tests given before and after intervention
during 2009–2010 school year.
Table 4.2 shows mean math achievement gain for students who had been retained
as 50.25 (SD = 29.36) (n = 32), compared to a mean achievement gain score of 61.69 (SD
45.58) for students who had not been retained (n = 857). The group of students who had
been retained represented 3.6% of the student sample and had a smaller standard
deviation a (SD = 29.36) and range (130) than the full student sample.
Gains by gender. The consideration of gender for early math intervention is
important because math difficulties can limit students’ education, career, and life
opportunities. A national effort to increase the number of girls entering fields of study for
science, technology, engineering, and mathematics (STEM) has brought gender to the
attention of math researchers (Fleischner & Manheimer, 1997). Girls are far less likely to
receive special education services for reading or mathematics than boys. In 2010 the
proportion of school-aged male students in Kentucky that received special education
services was 13.4%, compared to 7.5% of female students (KDE, 2011). The proportion
of female students in the student sample is provided in Table 4.3.

94
Table 4.3.
2009–2010 Students’ Mathematics Achievement Gains by Gender
Gender M N SD Range
Male 64.92 440 47.03 284 Female 57.70 449 42.96 277 Total 61.28 889 45.14 286 Note. Scaled score gains calculated from Terra Nova Mathematics tests given before and after intervention
during 2009–2010 school year.
Student achievement gains for male (n = 440) and female (n = 449) students in the
2009–2010 sample are shown in Table 4.3. Mean achievement gains were 64.92 points
for male students (SD 47.03) and 57.70 for female students (SD 42.96).
Gains by IEP status. Special education services are guided by a legally binding
annual plan called an Individualized Education Plan (IEP). Federal early intervention
legislation proposes to close achievement gaps and reduce the over-identification of
students for special education services due to inadequate instruction. Kentucky’s math
interventions were designed to serve students with the greatest need in mathematics. An
Individualized Education Plan (IEP) through special education did not prevent a student
from participating in math intervention. In Kentucky, disabilities among five to nine year
olds often include speech articulation, speech language, developmental delays, mild
mental delays, other health impairments, learning disabilities and other diagnoses.
Teachers reported whether students received special education services, but did not report
a student’s type of disability (Table 4.4).

95
Table 4.4.
2009–2010 Students’ Mathematics Achievement Gains by IEP Status
IEP Status M N SD Range
No 61.80 690 45.12 286 Yes 56.90 172 43.58 228 Total 60.82 862 44.83 286 Note. Scaled score gains calculated from Terra Nova Mathematics tests given before and after intervention
during 2009–2010 school year.
Table 4.4 shows that MITs reported IEP status for 862 of the 889 students in the
sample, identifying 19.9% (n = 172) of the students in the sample as having an IEP. The
mean gain score for students with an IEP was 56.90 (SD 43.58) compared to a mean of
61.80 for students without an IEP (SD = 45.12). Although the gains are slightly lower, it
is critical to note that students with IEPs did benefit substantially from early intervention.
Math Intervention Teacher Sample
Student gains by MITs’ year of experience. The teacher sample (n = 65) was a
stratified random sampling of MITs who were teaching in the 2009–2010 school year (N
= 142). All teachers in this study were elementary certified and had at least three years of
teaching experience before being trained as Math Intervention Teachers. The training for
teaching mathematics was more specialized than most teachers receive in undergraduate
elementary teacher preparation programs that are typically generalist in nature. There
were three cadres of teachers trained in 2006, 2007, or 2008, and a small group of
teachers trained in 2009. Thus, teachers had from one to four years of MIT experience in

96
2010. When the student and teacher data sets were merged, there was a mean of 14 (range
56) students from the sample served by each teacher in the sample.
The achievement gains and years of MIT experience in Table 4.5 are from the
2009-2010 school year. The mean math achievement score gain for students was 45
scaled score points for students of first year MITs (n = 37), 61.44 for students of second
year MITs (n = 262), 61.47 for students of third year MITs (n = 362), and 63.41 for
students of MITs in their fourth year (n = 228).
Table 4.5.
2009–2010 Mathematics Achievement Gains by MIT’s Experience
MIT Experience / Cohort # M N SD Range
First Year 45.00 37 39.30 176 Second Year / #3 61.44 262 44.81 270 Third Year / #2 61.47 362 39.00 272 Fourth Year / #1 63.41 228 54.31 284 Total 61.28 889 45.14 286 Note. Scaled score gains calculated from Terra Nova Mathematics tests given before and after intervention
during 2009–2010 school year.
Descriptive statistics for teacher variables. The independent teacher variables
include the MIT’s cumulative hours of math intervention training, hours of collegial
support, years of math intervention experience from 2006 to 2010, the number of contact
hours for math instruction the MIT had with each student, and the most recent 2009–2010
LMT score. Descriptive statistics are provided for the MIT’s with students in the student
sample in Table 4.6. The mean number of hours of training MITs received from the

97
Kentucky Center for Mathematics was 141.97 (SD 63.00). The MITs’ mean for
cumulative hours of collegial support from 2006–2010 was 124.64 (SD 28.09). The 2010
mean for number of years of MIT experience was 2.77 (SD .90). The mean number of
contact hours for instruction that MITs reported with students were 80.12 (SD 36.58).
Finally, as a measure of MITs’ pedagogical content knowledge, the mean percent correct
on the most recent Learning Mathematics for Teaching test was 59.38 on a scale of zero
to one hundred (0-100).
Table 4.6.
Descriptive Statistics for Teacher Variables
M SD Minimum Maximum
N Valid
65
65
65
65
Missing 0 0 0 0 Training Hours 141.97 63.00 45.50 318.50 Support Hours 124.64 28.09 61.20 170.70 Years Experience 2.77 .90 1.00 4.00 Contact Hours 80.12 1.00 2.36 147.86 PCK Score 59.38 4.00 15.58 90.91
Note. The number of students in the sample matched to each MIT in the sample ranged from two (2) to 57,
with a mean of 14.
Research Question One
(1) What is the relationship between a Mathematics Intervention Teacher's pedagogical
content knowledge, training hours, collegial support hours, years of intervention
experience, and contact hours of instruction with students’ math achievement gains?

98
Correlations between Student and Teacher Variables with Achievement Gains
The individual relationships between all student and teacher variables with the
dependent variable of student math achievement gains were examined by calculating
bivariate correlations (Table 4.7). Specifically, the relationships of the independent
variables with students’ math achievement gains were examined by calculating two-tailed
Pearson product-moment correlation coefficients. The correlations are displayed in Table
4.7. The results indicate a significant positive correlation between students’ math
achievement gains and the contact hours of the MIT with the student for math instruction
(r = .23, p < .00). There was a significant, but small, negative correlation of gender with
math achievement gains (r = -.08, p < .02). Males made greater gains during math
intervention (males = 1, females = 2). The male students’ mean scaled score was 64.93
(SD 47.03) (n = 440). Similarly, the female students’ mean scaled score was 57.70 (SD
42.96) (n = 449) (Table 4.2). There were no other significant correlations of independent
variables with achievement gains.

99
Tabl
e 4.
7.
Cor
rela
tions
of T
each
er a
nd S
tude
nt V
aria
bles
with
Stu
dent
Ach
ieve
men
t Gai
ns
M
ath
Inte
rven
tion
Teac
hers
200
6–20
10
St
uden
ts 2
009–
2010
Tr
aini
ng
Hou
rs
Col
legi
al
Supp
ort
Hou
rs
Expe
rienc
e as
MIT
Peda
gogi
cal
Con
tent
K
now
ledg
e
Con
tact
H
ours
20
09–1
0
Ret
aine
d
0 =
No
1
= Y
es
IEP
Stat
us
0 =
No
1 =
Yes
Gen
der
1 =
mal
e 2
= fe
mal
e
Mat
h A
chie
vem
ent
Gai
ns
Trai
ning
H
ours
Pear
son
r Si
g. (2
-taile
d)
N
1 88
9
**
.59
.00
889
**
.68
.00
889
*.07
.0
5 88
9
**
-.28
.00
889
-.02
.47
889
.06
.11
862
-.02
.52
889
-.04
.22
889
Col
legi
al
Supp
ort
Hou
rs
Pear
son
r Si
g. (2
-taile
d)
N
1
889
**
.56
.00
889
** -
.35
.00
889
** -
.16
.00
889
.02
.50
889
.05
.12
.862
-.04
.27
889
-.01
.68
889
Expe
rienc
e
as M
IT
Pear
son
r Si
g. (2
-taile
d)
N
1 88
9
** .
12
.00
889
-.03
.38
889
-.01
.69
889
-.02
.51
863
-.03
.40
889
.05
.14
889
Peda
gogi
cal
Con
tent
K
now
ledg
e
Pear
son
r Si
g. (2
-taile
d)
N
1
889
** -
.14
.00
889
.05
.12
889
.02
.51
862
.01
.68
889
.01
.69
889
Con
tact
H
ours
Pear
son
r Si
g. (2
-taile
d)
N
1 88
9
* .
07
.05
889
.06
.08
862
.03
.38
889
**
.23
.00
889
Ret
aine
d***
0
= N
o 1
= Y
es
Pear
son
r Si
g. (2
-taile
d)
N
1
889
** .
14
.00
862
-.05
.13
889
-.02
.47
889
IEP
Stat
us
0 =
No
1 =
Yes
Pear
son
r Si
g. (2
-taile
d)
N
1 86
2
** -.
19
.00
862
-.04
.22
889
Gen
der
1 =
mal
e
2 =
fem
ale
Pear
son
r Si
g. (2
-taile
d)
N
1
889
** -
.08
.02
889
Mat
h A
chie
vem
ent
Gai
n
Pear
son
r Si
g. (2
-taile
d)
N
1
889
** C
orre
latio
n is
sign
ifica
nt a
t the
0.0
1 le
vel (
2-ta
iled)
. * C
orre
latio
n is
sign
ifica
nt a
t the
0.0
5 le
vel (
2-ta
iled)
.
100
Correlations between Teacher Variables
There were significant negative correlations between three teacher variables with
contact hours (Table 4.7). Contact hours was negatively correlated with pedagogical
content knowledge (PCK) (r = -14, p =.01), hours of training (r = -.28, p < .00), and
collegial support (r = -.16, p < .00). In other words, as MIT training, PCK, and collegial
support hours increased the number of contact hours decreased. Significant positive
correlations among teacher variables included: hours of MIT training with collegial
support (r = .59, p < .00); training with experience (r = .68, p < .00); training with PCK
(r = .07, p = .05); support with experience as a MIT (r = .56, p < .00); and experience
with PCK (r = .12, p < .00). Significant negative correlations among teacher variables
included PCK with support (r = -.35, p < .00) and hours of training (r = -.14, p < .00).
There were no significant correlations between teacher and student variables.
Correlations between Student Variables
Contact hours for instruction was positively correlated with student math
achievement gains (r = .23, p < .00) and retention (r = .07, p < .05). Students making the
largest achievement gains and those who had been retained received more contact hours
for instruction. There also was a significant positive correlation between IEP status and
students having been retained (r = .14, p < .00), which indicates that retained students are
more likely to receive special education services. There was a significant negative
correlation between IEP status with gender (r = -.19, p < .00). This indicates that more

101
male students had IEPs (Table 4.7). As previously stated, there were no significant
correlations between teacher and student variables.
Regression. Teachers’ pedagogical content knowledge (β = .075, p < .046),
contact hours for instruction (β =.357, p = .00), students’ grade level (β = -.357, p < .00),
and IEP status (β = -.075, p =. 018) are significant predictors of math achievement gains
(Table 4.8). Collectively, the variables in this model account for 18% of the variance in
math achievement gains (R2 = .19; Adjusted R2 = .18). The model is significant at the .01
level. In Table 4.8, Beta scores allow comparison of the influence of each variable, so
that contact hours and grade level have similar influence. Pedagogical content knowledge
and contact hours as significant predictors are positively related to math achievement
gains, with contact hours being approximately five times more powerful. As they
increase, math achievement gains increase.
Students’ grade level and IEP status as significant predictors were negatively
correlated to math achievement gains. As grade level increases, student math
achievement gains decrease. Students with disabilities also made smaller gains. The best
predictors of math achievement gains were contact hours and grade level (with equal
values, but in the opposite directions). Interestingly, teacher pedagogical content
knowledge had a positive effect on student achievement that was equal to the negative
effect of IEP status (Table 4.8).

102
Table 4.8.
Regression Coefficients a
Model Standardized Coefficients
Beta t Sig.
1 (Constant) 3.048 .002 MIT 2006–2010
Hours of Training .000 -.006 .995 Hours of Support .061 1.282 .200 Years MIT Experience .021 .455 .649 Pedagogical Content Knowledge: (2009-‘10 LMT Score)
* .075 2.00 .046
Hours of Contact with Student ** .357 10.166 .000 Student 2009–2010
Grade ** -.353 -10.908 .000 Retained (0=no, 1=yes) -.024 -.767 .443 IEP Status (0=no, 1=yes) ** -.075 -2.371 .018 Gender (1=male, 2=female) -.058 -1.840 .066
a Regressions Coefficients are standardized to allow comparison of the contribution of each variable on
student Math Achievement Gains. b. Dependent Variable: Student Math Achievement Gain 2009–2010.
Collectively, the variables in this model account for 18% of the variance in students’ math achievement
score gains (R Square = .19; Adjusted R Square = .18; ANOVA [F = 22.25 (9, 879), p < .00].
* Significant at the .05 level. **Significant at the .01 level.
Research Question Two Do math achievement gains differ between primary intervention students in each
quartile of prior math achievement?
Prior Math Achievement
Schools screened all students’ math achievement at the beginning of the school
year and selected the lowest ten to 15% of students to receive intervention. This is a
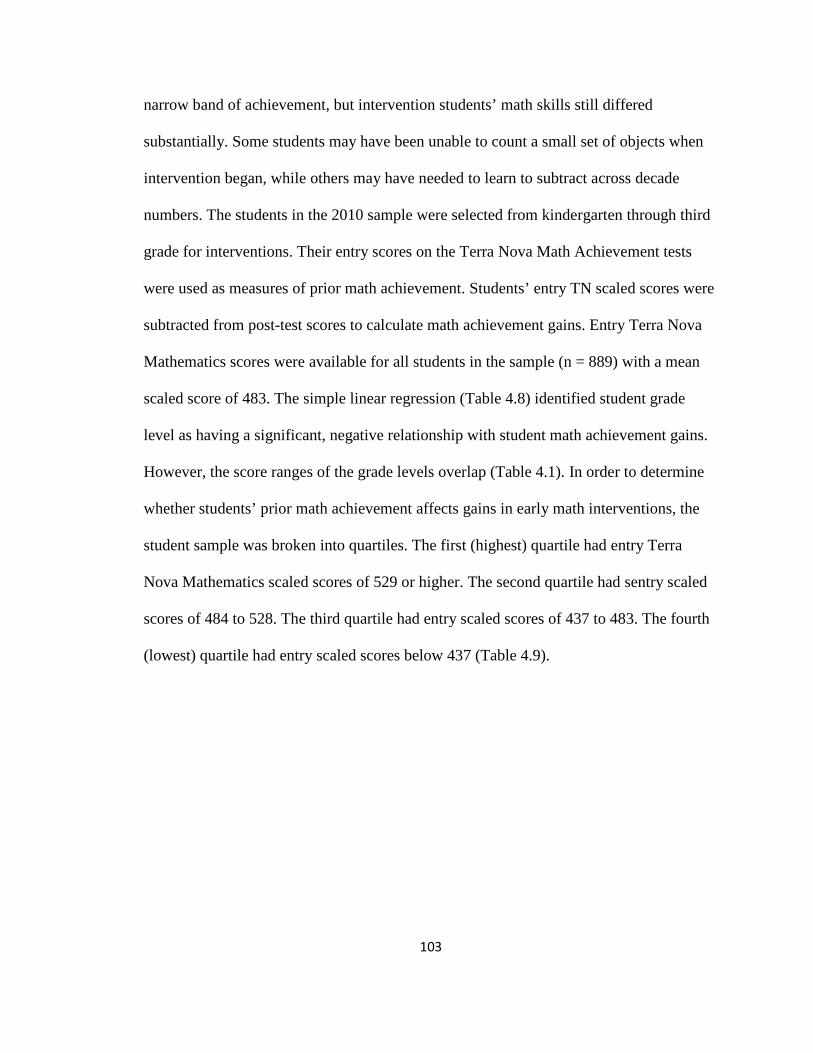
103
narrow band of achievement, but intervention students’ math skills still differed
substantially. Some students may have been unable to count a small set of objects when
intervention began, while others may have needed to learn to subtract across decade
numbers. The students in the 2010 sample were selected from kindergarten through third
grade for interventions. Their entry scores on the Terra Nova Math Achievement tests
were used as measures of prior math achievement. Students’ entry TN scaled scores were
subtracted from post-test scores to calculate math achievement gains. Entry Terra Nova
Mathematics scores were available for all students in the sample (n = 889) with a mean
scaled score of 483. The simple linear regression (Table 4.8) identified student grade
level as having a significant, negative relationship with student math achievement gains.
However, the score ranges of the grade levels overlap (Table 4.1). In order to determine
whether students’ prior math achievement affects gains in early math interventions, the
student sample was broken into quartiles. The first (highest) quartile had entry Terra
Nova Mathematics scaled scores of 529 or higher. The second quartile had sentry scaled
scores of 484 to 528. The third quartile had entry scaled scores of 437 to 483. The fourth
(lowest) quartile had entry scaled scores below 437 (Table 4.9).

104
Table 4.9.
Entry Terra Nova Math Scaled Scores
2009–2010
N Valid 889 Missing 0 M 482.91 SD 48.81 Range 349 Percentiles 25 437.00 50 484.00 75 529.00 Note. Calculated from Kentucky Center for Mathematics 2009–2010 student data.
Table 4.10 shows Terra Nova Mathematics and Combined Mathematics scaled
scores that align with Normal Curve Equivalent (NCE) scores at percentiles 1, 25, 50, 75,
and 99 for kindergarten through third grades. The scaled scores for the 2009–2010
student sample are broken into quartiles by entry of student achievement and aligned with
the Fall Terra Nova Math test norms for first through third grade and with the Winter
norms for kindergarten since Fall norms were not available for kindergarten.

105
Table 4.10.
Terra Nova Fall Math Scaled Scores and Normal Curve Equivalents (NCE)
Terra Nova Math Scaled Scores
NCE Kindergartena Grade 1b Grade 2b Grade 3b
1 1–338 1–492 1–415 1–447
25 415–416 460–461 473–474 521–522
50 471–472 509–510 549–550 567–568
75 526–528 559–560 563–564 611–612
99 612–999 624–999 615–999 663–999
a. California Achievement Test Winter Norms Book, Terra Nova, (2nd Ed.), (2001), 106, McGraw–Hill.
b. California Achievement Test Fall Norms Book, Terra Nova, (2nd Ed.), (2001), 102–126, McGraw-Hill.
Math achievement gains are displayed by students’ entry math achievement
quartile in Table 4.11. Students in the fourth (lowest) quartile by entry TN score made
mean scaled score gains of 103.96 (SD 53.18). Students in the third quartile earned a
mean scaled score gain of 61.03 (SD 33.50). Those in the second quartile exhibited a
mean scaled score gain of 49.85 (SD 32.00). Students in the first (highest) quartile by
entry TN scaled score made the lowest mean scaled score gain of 37.33 (SD 33.26).
Overall, the student sample (n = 889) from 2009–2010 had a mean scaled score gain of
61.82 (SD 45.14) (Table 4.11). Table 4.11 also displays the 95% confidence interval for
the mean and the minimum and maximum scaled scores for each quartile. The minimum
scores at each quartile are negative, which indicates that some students in each quartile
earned a lower score on the post-test compared to their entry Terra Nova Math test.
Table 4.11.

106
Math Achievement Gains by Entry Level Quartiles
N M SD SE
95% CI for M
Lower Bound
Upper Bound Min. Max.
4th Quartile 192 103.96 53.18 3.84 96.39 111.53 -21 243
3rd Quartile 247 61.03 33.50 2.13 56.83 65.23 -17 161
2nd Quartile 211 49.85 32.00 2.20 45.50 54.19 -43 151
1st Quartile 239 37.33 33.26 2.15 33.09 41.57 -37 172
Total 889 61.28 45.14 1.15 58.31 64.25 -43 243
Note. Adapted from Kentucky Center for Mathematics student data (2009–2010).
An Analysis of Variance (ANOVA) for student math achievement gains by
quartiles was significant at the 0.01 level [F = 117.21(3, 885), p = .000, α =.01] (Table
4.12). Therefore, post hoc tests were run to determine between which quartiles student
achievement gains differ.
Table 4.12.
ANOVA for Math Achievement Gain by Quartiles
Sum of Squares df MS F Sig.
Between Groups 514475.85 3 171491.95 117.21 .000 Within Groups 1294862.52 885 1463.12 Total 1809338.37 888 Note. Adapted from Kentucky Center for Mathematics student data (2009–2010).
Tukey’s post-hoc tests of Honestly Significant Differences provided pair-wise
comparisons of mean gain scores for each entry math achievement quartile. There were
significant differences between all pairs of means. Students in the first quartile, those

107
with the highest entry scores, earned mean gains that were lower than those for students
in the second, third, and fourth quartiles, respectively (M = -12.52, M = -23.70, M = -
66.63; p < .05). Similarly, students in the second quartile made smaller mean math
achievement gains than students in the third and fourth quartiles, respectively (M = -
11.18, M = -54.12; p < .05). Finally, mean achievement gains for students in the third
quartile were less than those of students in the fourth quartile (M = -42.93, p < .05).
Collectively, these results indicate that when entry math achievement scores were used to
rank students in quartiles, students in the lower quartile made greater gains in math
achievement compared to peers in higher performing quartiles (Table 4.13).
Table 4.13.
Entry Math Achievement by Quartiles -Tukey HSD
(I) Entry Math
Achievement Quartile
(J) Entry Math
Achievement Quartile
M Difference
(I - J) SE Sig.
95% CI
Lower Bound
Upper Bound
4th Quartile 3rd Quartile 42.93* 3.68 .000 33.46 52.40 2nd Quartile 54.12* 3.82 .000 44.30 63.93 1st Quartile 66.63* 3.71 .000 57.09 76.17
3rd Quartile 4th Quartile - 42.93*
3.68 .000 -52.40 -33.45
2nd Quartile 11.18* 3.58 .010 1.95 20.41 1st Quartile 23.70* 3.47 .000 14.77 32.63
2nd Quartile 4th Quartile -54.12* 3.82 .000 -63.93 -44.30 3rd Quartile -11.18* 3.59 .010 -20.41 -1.95 1st Quartile 12.52* 3.61 .003 3.22 21.82
1st Quartile 4th Quartile -66.63* 3.71 .000 -76.17 -57.09 3rd Quartile -23.70* 3.47 .000 -32.64 -14.77 2nd Quartile -12.52* 3.61 .003 -21.82 -3.21 * The mean difference is significant at the 0.05 level.

108
Figure 4.1. Students’ Entry Math Achievement Quartiles, Gains, and Grades.
Students in the lowest quartile, formed by entry Terra Nova Math test scores, made
the greatest math achievement gains. Gains and entry scores overlap for grade levels.
Kindergarten n = 230, 1st grade n = 243, 2nd grade n = 188; and 3rd grade n = 228. Note. Adapted from Kentucky Center for Mathematics student data (2009–2010).
Figure 4.1 is color-coded by grade to illustrate the relationship between students’
entry quartiles, achievement gains, and grades. Students’ entry Terra Nova Math test
scores are compared to math achievement gains. As noted earlier, students with lower
entry scaled scores tended to make greater math achievement gains. The scatter plot and
regression line illustrate a linear relationship that suggests math interventions were most
effective for students with the lowest levels of prior math achievement.

109
Students’ math achievement gains were compared by students’ entry Terra Nova
math scaled score quartiles using a one-way Analysis of Variance (ANCOVA). The
previous analyses suggested that there were significant differences in math achievement
gains between students in each quartile of prior math achievement. The ANCOVA
investigates whether there are differences other than prior math achievement that explain
the variances between the quartiles. Therefore, the independent variables that had been
shown significant in previous analyses were included in this model as covariates: total
contact hours, pedagogical content knowledge (LMT) score, and IEP status.
The values in Table 4.14 differ from those in Table 4.11 due to missing data on
the covariate of IEP status for 27 of the 889 students in the sample. The students in the
fourth quartile (n = 186) had the lowest entry TN scores, but made mean gains of 102.74
(SD = 52.78). Students in the third quartile (n = 241) earned mean gains of 60.42 (SD =
33.55), and students in the second quartile (n = 199) made mean gains of 49.97 (SD =
32.04). Students in the fourth quartile (n = 236) exhibited the highest entry math scores,
but made the lowest mean gains at 37.34 (SD = 33.36). The number of students in each
quartile differs due to students with the same score at quartile cut points.
Table 4.14.
Dependent Variable: Math Achievement Gain by Entry Quartile
Entry Math Achievement Quartile M SD N
4th Quartile 102.74 52.78 186 3rd Quartile 60.42 33.55 241 2nd Quartile 49.97 32.04 199 1st Quartile 37.34 33.36 236 Total 60.82 44.83 862

110
Levene’s Test for Equality of Variance indicates that homogeneity of variance
between quartiles of entry TN math test scaled scores cannot be assumed [F = 29.98, (df
= 3, 858), p = .000] (Table 4.15). Equality of variance is an important assumption for an
ANCOVA. When the groups to be analyzed do not have equal N sizes, the results of an
Analysis of Covariance should be interpreted with caution when the assumption of equal
variance is violated. However, the literature suggests that when sample sizes between
groups are relatively similar, violations of the assumption of homogeneity may be
considered negligible (Lomax & Hahs-Vaughn 2007; Shields, 1978). Variation in the
quartiles for this analysis is due to the number of students with the same score at cut
points between the quartiles. The N sizes of the quartiles are close enough that this
ANCOVA analysis is anticipated to be valid.
Table 4.15.
Levine’s Test of Equality of Error Variances a
Dependent Variable: Math Achievement Gain
F df1 df2 Sig.
29.98 3 858 .000
Note. Tests the null hypothesis that the error variance of the dependent variable is equal across groups.
a. Design Intercept + Contact Hours + PCK Score + IEP Status +Entry Quartile
Collectively, the variables account for 35% of the variance in Math Achievement
Gains [F = 77.85, (6, 855), p = .000, η² = .353]. Prior math achievement exhibited the
largest effect (Partial η² = .318) and accounted for the largest amount of variance in

111
students’ math achievement gains. Among the covariates, contact hours for instruction
(η² = .10) was the most powerful. IEP status was also significant, but accounted for only
a small amount of variance in achievement gains (η² = .006). Teachers’ pedagogical
content knowledge (LMT score) was not a significant covariate (Table 4.16).
Table 4.16.
Tests of Between-Subjects Effects a b
Dependent Variable: Math Achievement Gain
Source Type III SS df MS F Sig. Partial Eta Squared
Corrected Model 611449.52a 6 101908.25 77.85 .000 .353 Intercept 49257.39 1 49257.39 37.63 .000 .042 Total Contact Hours 127247.26 1 127247.26 97.20 .000 .102 PCK: LMT Score 771.00 1 771.00 0.59 .443 .001 IEP Status 6699.88 1 6699.88 5.12 .024 .006 Entry Quartile 522266.18 3 174088.73 132.98 .000 .318 Error 1119299.61 855 1309.12 Total 4919369.00 862 Corrected Total 1730749.129 861 a. R Squared = .353 (Adjusted R Squared = .349)
The estimated marginal means for each entry math achievement quartile
appear in Table 4.17, adjusted for the impact of the covariates of contact hours,
pedagogical content knowledge (LMT score), and IEP status from the ANCOVA.
Similar to Table 4.11, students in the fourth (lowest) quartile by entry TN score made the
highest adjusted mean scaled score gains of 103.61. Those in the third quartile exhibited a
mean entry scaled score gain of 62.49. Students in the second quartile earned a mean

112
entry scaled score gain of 50.11. Those in the first (highest) quartile by entry TN scaled
score had the lowest adjusted mean scaled score gains of 34.42. Table 4.17 also displays
the 95% confidence intervals for the adjusted means of each quartile.
Table 4.17.
Estimated Marginal Means: Entry Math Achievement Quartile
Dependent Variable: Math Achievement Gains
Entry Math Achievement Quartile M SE 95% CI
Lower Bound Upper Bound
4th Quartile 103.61a 2.66 98.39 108.84 3rd Quartile 62.49a 2.34 57.89 67.09 2nd Quartile 50.11a 2.57 45.06 55.15 1st Quartile 34.42a 2.38 29.76 39.09 a. Covariates appearing in the model are evaluated at the following values: Contact Hours = 79.89,
Pedagogical Content Knowledge (LMT) Score = 58.99, IEP Status = .20.
When the adjusted means of each quartile are compared pair wise, the differences
in all pairs of means are statistically significant at the .05 level. Table 4.18 displays the
differences in the adjusted mean scaled scores between each pair of means. After
controlling for total contact hours, pedagogical content knowledge, and IEP status, the
result were similar to those from the ANOVA. Specifically, students in quartiles with
lower entry scores made greater adjusted mean gains in math achievement, compared to
students in quartiles with higher entry math achievement scores.

113
Table 4.18.
Pair Wise Comparisons of Math Achievement Gains by Entry Quartile
(I) Entry Math Achievement
Quartile
(J) Entry Math Achievement
Quartile
M Difference
(I - J) SE Sig.
95% CI
Lower Bound
Upper Bound
4th Quartile 3rd Quartile * 41.12 3.55 .000 34.16 48.08 2nd Quartile * 53.50 3.71 .000 46.22 60.78 1st Quartile * 69.19 3.57 .000 62.18 76.19
3rd Quartile 4th Quartile * -41.12 3.55 .000 -48.08 -34.15 2nd Quartile * 12.39 3.47 .000 5.57 10.20 1st Quartile * 28.07 3.36 .000 21.48 34.65
2nd Quartile 4th Quartile * -53.50 3.71 .000 -60.78 -46.22 3rd Quartile * -12.39 3.47 .000 -19.20 -5.57 1st Quartile * 15.68 3.51 .000 8.80 22.56
1st Quartile 4th Quartile * -69.19 3.67 .000 -76.19 -62.18 3rd Quartile * -28.07 3.36 .000 -34.66 -21.48 2nd Quartile * -15.68 3.50 .000 -22.56 -8.80 * The mean difference is significant at the 0.05 level.
a. Adjustment for multiple comparisons: Least Significant Difference (equivalent to no adjustments).
Summary
Statistical analyses suggest significant relationships between a Math Intervention
Teacher's instruction contact hours and pedagogical content knowledge with the
dependent variable of students’ math achievement gains. Analyses confirm that primary
intervention students’ prior math achievement has a significant effect on their
achievement gains. The implications of these results are discussed in the following
chapter.

114
CHAPTER FIVE: DISCUSSION AND RECOMMENDATIONS
This chapter consists of two major sections: (a) the discussion of the results of this
study of early math interventions and (b) the recommendations for research, policy, and
practice. The opening discussion reviews the purpose of the study and summarizes the
findings in response to the two research questions. The first section of the chapter begins
with discussion of the relationship of teacher and student characteristics with students’
math achievement gains. Next, the effect and implications of students’ prior math
achievement are discussed. The second section of the chapter begins with the limitations
of the study. It then addresses implications for research, policy and practice. The chapter
ends with concluding remarks.
Discussion of Results
Purpose of the Study
The purpose of this study is to add to the math intervention research by analyzing
the relationship of teachers’ pedagogical content knowledge with students’ math
achievement gains. As schools provide early interventions to accelerate achievement and
close achievement gaps, it is important that data informs decision-making. Administrators
and teachers must determine what kind of instruction to provide for struggling students,
when, how often, how long to continue intervention, and whether to use teachers with
specialized training. During intervention lessons, teachers must monitor student learning
and respond with high-quality instruction to accelerate the student’s learning. The results

115
of this study may help educators make decisions and suggest directions for additional
research into these important issues.
The study investigated the relationships of teacher training, collegial support, and
experience with teachers’ PCK. The teacher’s PCK was conceptualized as the integrated
knowledge of math content, general and content-specific pedagogy, and understanding of
the learner. Application of PCK was theorized to affect student achievement through
math instruction fitted to the learner and the content. The study also examined the impact
of students’ level of math achievement prior to receiving intervention instruction. The
findings are anticipated to be of value to teachers, schools, universities, and legislators
who seek to provide better instruction for students who students struggle with
mathematics.
Summary of Findings
There were statistically significant relationships with student math achievement
gains found through correlations and regressions. In addition, ANOVA, and ANCOVA
analyses revealed effects on student achievement gains from contact hours for instruction,
prior math achievement, grade level, pedagogical content knowledge, special education
IEP status, and gender. There were no significant relationships found between MITs’
hours of training, hours of collegial support, or students’ history of retention with math
achievement gains. Years of experience as an MIT and hours of training were
significantly correlated with PCK. The statistically significant relationships are illustrated
by Figure 5.1.

116
Figure 5.1. Statistically Significant Relationships with Math Achievement Gains.
Results of correlation, simple linear regression, ANOVA, and ANCOVA analyses
identified statistically significant relationships between student achievement gains
and (a) Contact hours for instruction; (b) Prior math achievement; (c) Student
Grade Level; (d) Pedagogical Content Knowledge (e) Special Education IEP
Status; and (6) Gender. There were no statistically significant relationships
between MITs’ hours of training, hours of collegial support; MITs’ experience, or
students’ history of retention with math achievement gains. Training and support
were positively correlated with experience. Experience and training were
positively correlated with Pedagogical Content Knowledge.
Developed by Lisa Waller, 2012.
Math Achievement
Gains
Students’ Prior Math Achievement, Grade, IEP Status, & Gender
MIT Training & Collegial Support
MIT Experience
Contact Hours for Intervention Instruction
Pedagogical Content Knowledge

117
The results of the analyses described in Chapter Four are reflected in Figure 5.1.
In addition to the relationships of the independent variables with student achievement
gains, there were statistically significant correlations among teacher variables. Years of
experience as an MIT were positively correlated with pedagogical content knowledge;
thus, practice increased teachers’ scores on the Learning Mathematics for Teaching test.
Predictably, hours of training and collegial support were positively correlated with years
of experience as MITs. However, hours of training and collegial support had significant
negative correlations with contact hours for instruction, so that MITs with more hours of
training and collegial support had less instruction time with individual students. These
results will be discussed in detail in the sections that follow.
Question One
What is the relationship between a Mathematics Intervention Teacher's
pedagogical content knowledge, training hours, collegial support hours, years of
intervention experience, and intervention contact hours with students’ math achievement
gains?
Pedagogical Content Knowledge
Pedagogical content knowledge was found to have a significant positive
relationship with student achievement. It is hypothesized that a teacher’s pedagogical
content knowledge is developed through professional training and teaching experience,
facilitated through the support of colleagues in implementation, and refined through

118
experience and self-reflection during instruction. The pedagogical content knowledge
(PCK) was measured by the percent correct on the teachers’ 2009-2010 Learning
Mathematics for Teaching Test (LMT). This test was designed to measure a teacher’s
ability to evaluate the reasoning and level of understanding reflected in a student’s math
work as the basis for instructional decisions. It is proposed that pedagogical content
knowledge has its impact on student achievement through teacher-student interaction and
the experiences a teacher orchestrates for the student (Abell, 2008; Brouwer &
Korthaqgan 2005; Harris & Hofer, 2011; Hill & Ball, 2009; Lum, 2011).
The LMT assessment has been used in a number of studies to measure changes in
teachers’ mathematical knowledge for teaching after professional development in
mathematics. Mathematical knowledge for teaching is the name test developers selected
for pedagogical content knowledge as applied to mathematics. Developing this type of
knowledge and reasoning is a significant goal of Kentucky’s math intervention teachers’
training, but the test was not specifically aligned to learning targets of the trainings. Each
MIT participated in the LMT before trainings and in the spring of each school year. The
instrument is being used to measure the differences in PCK among certified teachers with
specialized training in mathematics and experience as math interventionists. It was
hypothesized that students’ math achievement gains would be greater when MITs had
greater pedagogical content knowledge to guide their instructional decision-making.
Pedagogical content knowledge was positively correlated with training as an MIT
(r = .07; p = .05), confirming that PCK can be improved with teacher education
programs. Pedagogical content knowledge was positively correlated with experience as

119
an MIT (r = .12; p = .00), confirming the benefit of experience as a math specialist. PCK
was negatively correlated with contact hours (r = .14; p = .00), suggesting that teacher
time may have been used for reflection on videotaped lessons or other responsibilities.
Pedagogical content knowledge was a significant predictor in the regression (β =.075; p
= .046) and accounted for 2% of the variation in student achievement gains. This may
sound small, but policy researchers have found that relatively small effect sizes are
significant when large sample sizes and statistical significance using covariate
adjustments and gains models to assess instructional effects (Rowan, Correnti, & Miller
(2002). The National Math Advisory Panel report attributed a total of 12% to 14% of a
year’s variability in elementary students’ math achievement scores to teachers’
differences (NMAP, 2008).
The effect size for PCK exceeded all other variables except contact hours for
instruction, prior math achievement levels, and grade level. The effect size for PCK was
.075, equivalent in magnitude to the negative effect size of IEP status, -.075. This is a
significant finding. The implication is that teachers’ pedagogical content knowledge can
have a positive impact on primary students’ math achievement gains equivalent to the
negative effect of having a disability.
Early Math Intervention
Math achievement gains as the dependent variable. Student math achievement
gains were the measure used in these analyses to monitor the success of early math
interventions. Intervention is instruction provided to students who are identified and

120
monitored at the school level. Improving instruction is the first consideration when
struggling students are not achieving at a level or pace that is commensurate with grade
level peers (Fuchs, Fuchs, & Karns, 2001; Gonzales et al., 2008; Kavale & Spaulding,
2008). Instruction may be delivered by a teacher with specialized training (Burns, Scholin
et al., 2010; Rahn-Blakeslee et al., 2005). In most schools, teams of educators and school
psychologists study data and systematically select from among instructional strategies
that are research-validated. Most elementary teachers do not have specialized knowledge
of mathematics (Malzahn, 2002). A teacher with specialized training may be needed to
accelerate the math achievement of struggling primary students (Dehane, 1992,
Diezmann & English, 2001). The intervention teacher is then responsible for
implementing the strategy with fidelity to accelerate the student’s learning (Burns,
Scholin et al., 2010) and monitoring student progress (Fuchs & Fuchs, 2008). The length
and frequency of intervention lessons may be increased. The instructional strategy may
be changed or supplemented. The goal is to close the student’s achievement gap and avert
math difficulty (Fuchs, Compton et al., 2005). Data from the math intervention programs
in this study suggest that student math achievement was accelerated. Collectively, the
variables in this model account for 18% of the variance in math achievement gains (R2
=.19; Adjusted R2 = .18). The regression model was significant at the .01 level.

121
Explanation of Results
Building Pedagogical Content Knowledge
The 2010 MIT sample included teachers with one to four years of experience as
math interventionists. During each year as interventionists, MITs had opportunities for
math intervention trainings and collegial support from KCM staff members, regional
consultants, peers, and attending conferences. The MITs were encouraged to be reflective
about their experiences through surveys and reviews of video recorded lessons. MITs
took the LMT each summer before training and in the spring of each year of their
experience and were aware that one goal of the interventions was improving their
performance on the LMT. Training was chosen as the first teacher-variable because it is
the primary means schools have for changing teacher practices. The MITs’ opportunities
for hours of training increased with their years of experience. The goal of training was to
improve math instruction and learning. Training differed among MITs because schools
had some discretion over which intervention to implement, which trainings the MIT
attended, and whether optional training opportunities were funded. It was hypothesized
that pedagogical content knowledge would improve when teachers learned to implement
math interventions with fidelity, gained knowledge of mathematics concepts, acquired
effective instruction and formative assessment strategies, and gained understanding of
learners’ typical progression, misconceptions, and understanding of math. The variable of
cumulative hours of training did not have statistically significant relationships with
student achievement gains, but was positively correlated with hours of support (r = .68, p
= .00), MIT experience (r = .56, p = .00), and PCK (r = .07, p = .05).

122
The relationship of hours of training with years of MIT experience may only be
due to the increased opportunity for training that was available each year. However,
adequate training may also contribute to teachers’ choosing to continue in the role of
interventionist and schools continuing to provide a math interventionist, thus contributing
to MITs’ years of experience. The LMT assessment is often used to measure teachers’
learning after professional development. MITs’ training was correlated with higher LMT
(PCK) scores, but the test was given at the end of the year of experience, rather than
immediately following training. Examining the relationships of hours of training and
LMT scores with teacher attrition might be worthwhile for future studies.
There was a negative correlation between hours of training with contact hours (r
= -28, p = .00). This may indicate that training took time away from instruction, or it
may be that hours of training and contact hours were both influenced by the intervention
program(s) the MIT implemented. To illustrate the influence of math programs, Math
Recovery programs required the most training and limited intervention to sixty, thirty-
minute lessons, while Add+Vantage MR and Number Worlds programs did not limit the
number of lessons or time that a student could remain in intervention.
Hours of collegial support variable. Support was chosen as the second teacher
variable because it was a requirement of the Math Achievement Fund grants and has been
credited with improving initial and sustained implementation of instructional
interventions. Support has been shown to increase the fidelity and duration of teachers’
implementation of interventions (Noell, Witt, LaFleur, Mortenson, Rainer, & LeVelle,

123
2000). Coaching by colleagues is another form of support that has been shown effective
for developing the pedagogical content knowledge of new teachers (Gilbertson, Witt,
LaFleur Singletary, & VanDerHeyden, 2007; Jenkins & Veal, 2002). Similarly,
professional learning communities have been shown to improve practice (Wood, 2007).
Support during implementation has been deemed a critical aspect of improving teacher
training to improve learning (Cohen & Ball, 1999).
Kentucky Center for Mathematics defined support to include consultation in
person or by phone with a regional consultant, visits to other MIT classrooms,
participation in math conferences, or similar activities (Appendix C). Support provided
an opportunity for MITs to reflect on their own practice, pursue assistance in problem-
solving, and learn from others’ practice. It was hypothesized that support from expert
regional consultants and colleagues would promote application of intervention training
and pedagogical content knowledge to accelerate students’ math achievement gains.
The data used in this investigation was provided by a research assistant at
Northern Kentucky University who summarized the hours of support MITs reported. This
data from 2006 to 2010 was summed to arrive at the cumulative hours of support for each
MIT in the 2010 sample. PCK’s negative correlation with collegial support hours (r = -
.35, p = .00) may suggest that teachers who had integrated their professional knowledge
sought fewer hours of support. However, the number of support hours may be deceptive
because there was little variation among the number of hours reported for each MIT,
suggesting that conferences and required meetings accounted for the majority of hours
reported, while potentially powerful consultation by phone or visits may have been

124
overshadowed by conference hours or may not have been included in the totals. In light
of the limitations, there is no basis for a proposal that support has a detrimental effect on
pedagogical content knowledge. There remains a strong theoretical basis for the potential
for collegial support to advance the thought processes that are proposed to facilitate the
application of pedagogical content knowledge to improving instruction to accelerate
student achievement (Costam & Garmston, 2002; McCaughtry, 2005; and McCaughtry &
Rovegno, 2003).
Years of experience as an MIT variable. Experience as a Math Intervention
Teacher was chosen as the third teacher variable with the expectation that experience
paired with reflection would increase the teacher’s pedagogical content knowledge. MIT
experience for the teacher sample ranged from one to four years with a mean of 2.77
years of experience. Because funding for a new cohort was not available in the 2009-
2010 school year, only a few MITs were hired and trained to address attrition. The mean
math achievement gain was 45.00 for students taught by these interventionists. The mean
math achievement gains were 61.44 for students of MITs in cohort three with two years
of experience, 61.47 for MITs in cohort two with three years experience, and 63.41 for
students of MITs in cohort one with four years of intervention experience. Students in the
sample scored higher when they received instruction from MITs with more experience. It
is the recommendation that teachers continue in the role of interventionist for multiple
years and that schools make an effort to continue funding interventionists’ salaries, even
when they exceed the amount provided in a grant.

125
MITs were expected to reflect on their instructional practice using video-
recordings of daily lessons. This allowed the teacher to focus on the learner during
instruction and to watch the tape later in the day to further assess the student and to
facilitate reflective practice. It was also possible that teachers with higher PCK might be
more likely to remain in the role of MIT. It was hypothesized that teachers with more
experience as math interventionists would have greater PCK to guide their decision
making and accelerate student achievement.
Experience as a Math Intervention Teacher was the teacher variable exhibiting a
significant correlation with pedagogical content knowledge (PCK) (r =.12, p = .00).
Teacher experience does not always have a linear relationship with increased student
achievement (Goldhaber & Brewer, 1997). Chingos & Peterson (2011) found that after
five years teachers stopped showing significant improvement. However, the MITs made a
shift in their professional practice, and experience appears to have contributed to
increases in their LMT scores. Communication and monitoring through reports and
surveys suggest that teachers understood that the expectation was to improve instruction
and student achievement.
Aspects of the Math Intervention program that may have contributed to the
relationship between MIT experience and increased pedagogical content knowledge
included: (a) application of pedagogy to instruction, (b) observing students’ work and
thinking, (c) ongoing assessment, (d) using assessments that help conceptualize stages of
numeracy, (e) reflection on practice and students’ learning while watching videos of
assessment and instruction, and (f) collegial discussions of students and pedagogy

126
(Ellemor-Collins, & Wright, 2008; Griffin, 2004; Griffin & Case, 1996; Swanson et al.,
2009; Wright, Martland, & Stafford, 2006; Wright, Martland, Stafford, & Stanger, 2006;
Wright, Strange et al., 2006).
Applying Pedagogical Content Knowledge to Instruction
Instructional contact hours variable. The final teacher variable considered was
a measure of the amount of contact the MIT had with the student for math intervention
instruction. Contact hours was the teacher variable with the greatest influence on student
achievement gains (r = .23; p = .01). Contact hours also accounted for 10% of the
variance in student achievement gains (p = .00) in an Analysis of Covariance that
examined the impact of students’ prior math achievement. This supported the hypothesis
that more time with a highly skilled intervention teacher would yield greater student
achievement gains. The student database included the student’s beginning and end dates
for intervention and the number of hours per week that the student received intervention
during the 2009-2010 school year. This information was used to calculate the contact
hours or duration of math instruction the student received from the MIT. It was
anticipated that contact during instruction was the mechanism through which MITs’
pedagogical content knowledge affected student achievement.
The MIT’s pedagogical content knowledge is theorized to support professional
judgment (Shulman, 2004) and impact the learner through teacher-student interaction and
the math experiences a teacher orchestrates for the student (Abell, 2008; Brouwer &
Korthaqgan, 2005; Carlsen, 1999; Harris & Hofer, 2011; Hill & Ball, 2009; Lum, 2011).

127
In addition to the teachers’ knowledge of the math content and instructional strategies
that fit that content, PCK includes understanding of the learner (McCaughtry, 2005,
McCaughtry & Rovegno, 2003). The Kentucky Center for Mathematics (KCM) gathered
data on a variety of student characteristics. Those that were considered in the analyses
included gender, grade level, eligibility for an Individualized Education Plan (IEP)
through special education, and whether the student had been retained before or at the end
of the 2008-2009 school year. The student characteristics may affect teachers’
pedagogical decisions (Miller & Mercer, 1997).
Math achievement gains dependent variable. The inclusion of student
characteristics provides context for understanding the dependent variable of math
achievement gains. Students’ math achievement gains had statistically significant
relationships with teacher and student variables. The mean gain on the Terra Nova Math
test for all students in the sample was 61.28 scaled score points. The variables exhibiting
significant correlations with student achievement gains were gender (r = -.08; p = .01)
and contact hours (r = .23; p = .01). Males earned slightly higher gains than females.
Contact hours accounted for 10% of the variance in achievement gains (p = .00). Clearly,
student achievement gains were greater when students received more instruction from the
math specialist.
One major goal of early intervention is preventing significant learning deficits
that could later require special education services. However, preschool and primary
students may receive services for language, speech, or developmental delays and still

128
need intervention in math or reading through general education programs. Legally,
students with Individualized Education Plans must have access to all programs available
to the general population (IDEA, 2004). However, when schools must prioritize the use
of finite resources, the question of who will benefit from a particular intervention arises.
While a school would know the nature of a student’s disability, this data set only
identified whether the student received special education services. Students with IEPs (n
= 172) made a mean gain of 56.90 compared to students without IEPs (n = 690) with
gains of 61.80. The discrepancy may be due to language or other developmental delays,
inadequate early learning experiences, difficulty with memory, perception, expression,
concepts, or attention. Although the gains were slightly lower, the mean gain for students
with IEPs exceeded the mean gain for all students in second and third grade interventions
(50.07 and 46.66, respectively). In a regression, students’ IEP status accounted for 2.3%
of student math achievement gains (β = -.075; t = -2.37; p = .018). This negative impact
was opposite, but equal to the positive impact of teachers’ pedagogical content
knowledge. It is recommended that students who have IEPs are considered for math
intervention instruction.
Gender differences have nearly disappeared on the fourth and eighth grade NAEP
mathematics tests. Male students’ scores were 242 and 284 compared to female students’
scores of 240 and 283 (fourth and eighth grades, respectively) (NCES, 2011). Yet, in
2010, the proportion of school-aged male students in Kentucky that received special
education services was 13.4%, compared to 7.5% of female students (KDE, 2011). The
student sample for this evaluation consisted of 449 female students and 440 male

129
students, initially selected for intervention based on a universal screening assessment and
teacher/parent input. Female students’ mean entry Terra Nova Math scaled score (489.91)
was higher than males students’ mean entry scaled score (476.07). Yet, male students had
a mean gain of 64.92 scaled score points compared to the female students’ mean gain of
57.70 scaled score points. Furthermore, there was a significant correlation between
gender and math achievement gains (r = -.08; p = .02).
Finally, it is recommended that students who have previously been retained are
considered for math intervention instruction. Students who had been retained had mean
gains that were lower than the total mean of the student sample (50.25 vs. 61.69), but
were comparable to the mean gains made by all second grade students in the sample
(50.25 vs. 50.07).
Question Two
Do math achievement gains differ between primary intervention students in each
quartile of prior math achievement?
Prior Math Achievement Levels
Students’ prior math achievement was measured by an administration of a Terra
Nova Math achievement test when students entered intervention. The scores used for
these calculations are scaled scores which allow comparison of scores across grade levels
and may be used in mathematical calculations since they are equal interval. The students
were broken into quartiles by entry math achievement scaled scores in order to evaluate

130
the impact of prior math achievement. An ANOVA indicated significant differences in
student achievement gains between students grouped into quartiles based on entering
baseline scores. Post hoc tests using Tukey’s test of Honestly Significant Differences
identified significant differences in gain scores among all pairs of means at the .01 level
of significance. It also identified students in the lowest quartiles by entry math
achievement levels as having the greatest achievement gains and students with the
highest entry math achievement levels as having lower gains than students in any other
quartile. These findings suggest that selecting the students with the greatest need for
intervention is a sound practice.
An ANCOVA was used to determine if factors other than entry math achievement
could account for the variance between the quartiles formed from the entry Terra Nova
scores. The model was significant and accounted for 35% of the variance in achievement
gains between entry quartiles (R2 = .353, Adjusted R2 = .349). Entry quartile accounted
for 32% of the variance in achievement gain scores after allowing for covariates (ε2 =
.318). The only two covariates that were significant were contact hours that accounted for
10% of achievement gains between quartiles (ε2 = .102, p = .00) and IEP status that was
significant, but accounted for only .6% of the variance between quartiles (ε2 =.006, p =
.024). It is recommended that a high quality pre-assessment be used to help select
students for intervention. It is also recommended that students with the lowest levels of
prior math achievement be considered for early intervention. While lower grade levels
tended to have lower entry math achievement scores, students with lower achievement
levels from second and third grade also tended to make higher gains than their classmates

131
with higher entry scores. These results are based on the intervention programs used by
Kentucky’s MITs and may be attributed to the pedagogy (instructional strategies),
assessments, and pedagogical content knowledge used in the interventions. The results of
these analyses do not support any categorical exclusion of students who receive special
education services from math interventions. The effectiveness of the interventions
suggests that they may reduce achievement gaps for struggling students with and without
IEPs, possibly reducing the number of students misidentified as having a learning
disability.
Effect of Prior Math Achievement Levels on Students’ Gains
As noted above, the second question in the study examines the influence of
students’ prior math achievement on math achievement gains. This question was selected
for three reasons. Since a multiple regression showed that student grade level was a
significant predictor of student achievement gains (β = -.353, p < .00) and the gains were
greater for students in kindergarten and first grades, the question was whether there was a
better match between these interventions and students of a particular age or in a particular
grade-level’s curriculum. Second, although all intervention students were selected from
the lowest percentiles for their schools, there was a wide range of intervention learning
goals. The question was whether the interventions were differentially effective. Third,
schools may have to prioritize limited resources. The question became whether these
interventions worked best with students in a particular Zone of Proximal Development
(ZPD).

132
The results of an ANCOVA showed that when intervention students were divided
into quartiles by their level of math achievement prior to their 2009-2010 math
intervention instruction, there were significant differences between all quartiles with the
lowest performing students making the greatest gains. Students’ prior math achievement
levels were shown to affect their achievement gains. Utilizing non-adjusted mean scores,
the students in the fourth quartile (n = 186) had the lowest entry TN scores but had mean
gains of 102.74 (SD = 52.78). Students in the third quartile (n = 241) had mean gains of
60.42 (SD = 33.55), and students in the second quartile (n = 199) had mean gains of
49.97 (SD = 32.04). Students in the fourth quartile (n = 236) had the highest entry math
achievement scores but had the lowest mean gains at 37.34 (SD = 33.36). When these
mean achievement gains were adjusted using total contact hours, PCK, and IEP as
covariates, the gains ranked in the same order and the differences between the adjusted
mean held. Collectively, the variables account for 35% of the variance in Math
Achievement Gains [F (6, 855) = 77.85, p = .000, η² =.353]. Prior math achievement
exhibited the largest effect (Partial η² = .318) and accounted for 32% of the variance in
students’ math achievement gains between the quartiles. Among the covariates, contact
hours for instruction accounted for 10% of the variance in student achievement gains
between quartiles. IEP status accounted for only 0.6% of the variance between quartiles.
Teachers’ pedagogical content knowledge (LMT score) was not a significant covariate to
account for the differences in performance between the quartiles of students by entry
level TN scaled scores (Partial η² = .001).

133
Even kindergarten students have a variety of preschool math experiences.
Students’ readiness for kindergarten may be affected by home and preschool. Magnuson,
Meyers, & Ruhm (2004) found that the quality of educational experiences in the
preschool could be biased against low income and ethnic minority students. The students
in the study were from kindergarten through third grades. Their previous math
achievement may be affected by the quality and fit of the instruction they have received.
Students in kindergarten and first grade made greater mean gains (above the mean
for the total student sample) than students in second and third grades (below the mean for
the total sample). In a regression, grade was shown to account for almost 11% of student
math achievement gains (β =-.353; t = -10.91, p = .00). The values are negative because
students in lower grades made greater gains. Providing high-quality math intervention
during primary grades may be the most important step a school can take toward math
intervention.
Limitations of the Study
There are four types of limitations in the study. The first is related to its
recommended experimental design. The first is that a true experimental design was not
used throughout the four years of math interventions because their purpose was to
improve the quality of math instruction and learning in the state of Kentucky. Therefore,
students who began as part of a control group frequently received services later in the
school year. No control group comparisons were used in this study. When one
instructional program was shown to increase the teachers’ PCK at the end of the first

134
year, all teachers were encouraged to receive that training and apply it to their schools’
intervention program (Ludwig, Maltbie, Marks, & Jordan, 2009).
The second type of limitation relates to the source of the data. Some of it was self-
reported as surveys and record-keeping completed by the Math Intervention Teachers,
and records of participation in training and collegial support opportunities maintained by
the Kentucky Center for Mathematics (KCM). There were no problems reported with this
method of data collection. The teacher and student assessments were not self-reported.
Terra Nova math tests are well-established, commercially available, report national
norms, administered at the school using standardized procedures, scored by the testing
service, and reported directly to KCM and the schools. The Learning Mathematics for
Teaching (LMT) test for measuring teachers’ pedagogical content knowledge was taken
online by MITs at their own school sites in the spring of 2010. The LMT test used
electronic scoring and reported results directly to the University of Cincinnati Evaluation
Services Center (Ludwig et al., 2009). However, the quality of the testing environment
and technology used when taking the LMT may have varied.
The third type of limitation for this study relates to the amount of discretion
schools retained. Schools selected teachers for training that met criteria established by
Math Achievement Fund grant guidelines. The schools also determined grade levels
receiving intervention, the length of interventions, and what assessments were used to
identify students for intervention. The level of discretion retained by the schools may also
be interpreted as strengths of the study because the results were obtained in the clinical

135
setting with real teachers, real budgets, finite schedules, and many of the variables that
affect student achievement.
The fourth limitation of the study is the absence of information on student socio-
economic status, race, and ethnicity in the extant database. Without these demographics,
this study cannot address the relationship of early intervention to the disproportionality in
special education. Such information would allow a valuable extension of the research.
Implications for Future Research
Early Math Intervention
Early math intervention was shown to be effective. Students with the lowest prior
math achievement scores and students in the lowest grade levels made the greatest gains.
Even primary students who already received special education services made gains
similar or greater than those of their peers in the intervention program. The most pressing
extension of this research for early intervention would examine how the rate and level of
achievement can be maintained after intervention ends. The math interventions helped
students build a foundation of number sense and problem solving strategies. The concepts
included: Number words and numerals goals include saying numbers in sequence
(counting) forward and backward, counting to and from any number, and identifying
numerals. Addition and subtraction goals include counting collections and strategies for
adding and subtracting numbers to 20. Structuring number goals include developing
mental models for breaking apart and combining numbers to 20 and beyond.
Multiplication and division goals include making equal groups, using physical and mental
136
models for multiplication, skip counting, and facility with multiplication facts. Place
value goals include counting on and off the decade (starting at a number other than a
multiple of ten, for example 34 +10 is 44). Goals also include developing a variety of
strategies for adding and subtracting with multiple-digit numbers. It is recommended that
early math intervention research investigate how to prepare intervention students to
continue to excel in mathematics (Cobb, Gresalfi, & Hodge, 2009; Common Core State
Standards Initiative, 2010), and how classroom math teachers’ practices can best support
students’ accelerated achievement (Williams, 2001; Cobb, Gresalfi, & Hodge, 2009).
Teacher Training and Support
The effectiveness of math intervention is evident in the significant differences in
the math achievement gains of primary students, students with IEPs, students who had
been retained, and the greatest gains for the lowest performing students. Early math
intervention is a clear priority for schools. While training increased teachers’ pedagogical
content knowledge, it was clear that training alone did not produce susstantive student
achievement gains. This result is not unique to this study, but results vary (Cohen & Ball,
1999; Goldhaber & Brewer, 1997; Williams, 2001; Ziegler, 2000).
The results of successful inquiries may include answers, but always include new
questions. Educators’ first questions may address the absence of evidence for hours of
training and collegial support to directly affect student achievement. The accountability
movement has focused attention on student achievement as an outcome, rather than
teacher practices as input (Lee, 2006). Response to intervention uses student

137
achievement data as the basis for selecting instructional strategies that fit the learner
(Carney & Stiefel, 2010; Hosp, 2009) and the content (McDiarmid, Ball, & Anderson,
1989). Support has been shown in other studies to improve instruction (Noell, Witt,
LaFleur, Mortenson, Rainer, & LeVelle, 2000).
The Learning Mathematics for Teaching test (LMT) is designed for 50% of
certified teachers to score below 50% correct. However, there was a relatively small
increase in the mean on 2009-2010 LMT scores on this measure of PCK. Overall, the
teacher scores on the LMT did not suggest that teachers achieved high level of expertise.
Statistically, 45.25% scored below the mean before math intervention training and
40.27% of MITs still scored below the mean after 45 to 250 hours of training and after
one to four years of experience as an MIT. Shulman (1987) and others have proposed a
measure of PCK be included in teacher licensure exams, but future research into the
validity of the LMT as a measure of teacher knowledge could include alignment of the
LMT to the goals of training provided to primary math intervention teachers. Research is
also needed to develop formative measures to guide and accelerate teacher’s knowledge
of math content, pedagogy, and ability to assess and respond to students’ levels of
understanding.
Refinements for future research addressing training and support with math
intervention would be (a) examining the alignment of the instruments used to monitor
teacher growth and student achievement with the content of primary interventions, (b)
examining the effectiveness of teacher training for increasing teachers’ knowledge of
math content, pedagogy, and ability to assess and respond to students’ levels of

138
understanding, and most importantly (c) examining the student achievement results of
interventions by elementary certified teachers with or without specialized math training;
and with or without access to collegial support. In future investigations, collegial support
should be more specifically defined by the person(s) and purpose(s) of contacts.
Longitudinal Study of PCK
Ideas can increase our capacity for understanding. Pedagogical content knowledge
is not a new idea (Bullough, 2001), but it has the potential to be used more broadly as a
framework for teachers’ reflection on their knowledge and practice. By examining the
thinking of the most effective intervention teachers, a qualitative understanding of their
assessment and instructional decision making could be captured. Hill, Ball, and Schilling
(2004) used a process in developing the LMT that might be an effective reflection
process to gain insight into teachers’ decision-making. The researchers had teachers
explain their thinking as they chose answers on their test to determine if the answer
choices reflected the understandings that test-developers intended. Pairing this type of
examination with MITs’ reflections on their videotaped assessments and lessons could
help identify when and whether teachers were drawing upon or synthesizing their
knowledge of content, pedagogy, student characteristics, or other contextual factors. It
would also be interesting to control for whether teachers were introduced to the concepts
of pedagogical content knowledge and used that construct to talk about their thinking and
decision-making.
139
The LMT is usually applied to monitoring the impact of professional development
on teachers’ mathematical knowledge for teaching. Each item on the LMT offers teachers
a chance to respond to hypothetical student work. Future research could monitor the
actual decisions teachers make during intervention and students’ corresponding
performance on weekly curriculum-based measures used to monitor students’ response to
instruction in intervention programs. This could provide insight into the fidelity of
teachers’ use of student data for instructional decision-making.
Math Intervention and Special Education
The current study yielded important insights into the value of early intervention
for students who receive special education services in primary grades. As a group
students with IEPs made gains that were very similar to those who did not have IEPs.
Students with IEPs in second and third grade math interventions earned higher gains than
intervention students without IEPs. The students with the lowest scores on their entry
math achievement tests may have been seen as the most at-risk of being misidentified as
having a math disability, but they made the greatest gains at all four grade levels. A
longitudinal study is warranted to monitor the progress of students and any special
education services they might later require.
According to the most recent data available through NCES, in 2009 Kentucky’s
proportion of public school enrollment served under IDEA (2004), Part B and provided
special education services was 13% of students. The national average in 2009 was 13.1%
(NCES a, 2010) (Table 5.1). Comparisons to neighboring states are provided to illustrate

140
the differences in the numbers of students diagnosed with Specific Learning Disabilities
under Kentucky’s rigorous Discrepancy Tables (KDE, 2011).
Table 5.1.
Percent of Special Education Enrollment by Disability: Kentucky and Surrounding States
Enrollment% Special Education
Specific Learning Disability
Speech or
Language
Other Health
Impaired
Develop-mental Delay
USA 13 41.47 18.73 0.30 0.00 Illinois 13 43.82 17.55 9.87 3.85 Indiana 15 36.59 21.72 9.15 0.00 Kentucky 13 16.61 23.64 17.33 8.43 Missouri 13 31.05 26.59 4.47 0.00 Ohio 13 42.21 12.38 12.63 0.00 Tennessee 11 40.52 24.12 11.75 3.80 Virginia 12 39.18 15.10 19.52 0.98 West Virginia 15 30.82 28.93 31.96 10.35 Note. Adapted from a Data Accountability Center at https://www.ideadata.org/default.asp and b National
Center for Learning Disabilities at http://www.ncld.org/on-capitol-hill/policy-related-publications/special-
education-scorecards.
Only 16.1% of Kentucky’s special education students were diagnosed with
Specific Learning Disabilities, while the national average was 41.47% of students in
special education programs (NCLD, 2010; DAC, 2010). Table 5.1 shows the percent of
students enrolled in special education and diagnosed with Specific Learning Disabilities
or other mild to moderate learning-related disabilities in Kentucky and surrounding
states.
The students in the state’s math interventions would be a valuable population for
research to address such questions as: What percentage of early math intervention

141
students are later identified with disabilities? If students do receive special education
services, what is the category of their disability? Do they receive special education
assistance in math? What is their age at diagnosis? What intensity of special education
services is required (time and setting)? Is there a reduction in the disproportionality of
minorities in special education? Is the data different depending on the age that
intervention began, the number of years a student was in intervention, or if the school had
trained other teachers to extend the students’ number sense developed during
intervention? How does current data for students that participated in math interventions
compare with 2005 data? How does data change for students in schools without an MIT?
Implications for Policy and Practice
Elementary Math Teacher Training Programs
Undergraduate level coursework for the elementary teachers provides a generalist
education. Historically, reading has been the most likely area of concentration of studies.
Adding the concept of pedagogical content knowledge to all methods course syllabi
would affect teachers’ metacognition (Fernandez-Balboa, & Stiehl, 1995; Graber, 1995;
Malzahn, 2002). The success of these math intervention programs supports the
recommendation for teacher education programs to emphasize: (a) constructivist
approaches to mathematics (Ball, 1990; Ziegler, 2000), (b) developing number sense and
problem solving (Burch, 2005), (c) assessment of aspects of early numeracy (Ellemor-
Collins & Wright, 2008; Stock et al., 2009), (d) understanding common preconceptions
and misconceptions that can be shaped into sound mathematical understanding (Graeber,

142
1999; Shulman, 1986; Tamir, 1988), (e) pedagogy that is content and topic specific
(Edens & Potter, 2007; Griffin & Case, 1997; Shuhua, Kulm, & Wu, 2004; Shulman,
1987), and (f) pedagogy that is responsive to the learner’s characteristics (Shulman, 2004;
Harry & Klinger, 2006). It would be valuable for universities to offer elementary teachers
the options specialization in mathematics and for public schools to staff with math
specialists at each primary grade level. Because the teaching workforce changes
gradually, it is imperative that universities partner with school districts to retrain in-
service teachers (Kinach, 2002). Otherwise the prevailing culture may prevent change
from happening (Spillane, Reiser, Reimer, 2002).
Math Intervention Programs
Math intervention programs for primary students have several lessons to draw
from this research. Most importantly, contact hours for instruction by a math specialist
produce student achievement gains. Second, teachers cost more as they gain years of
experience, but students of MITs with more experience made greater gains. Pedagogical
content knowledge increases with experience and contributes to student achievement in a
positive direction as powerfully as special education identification contributes in a
negative direction. The LMT may be a valuable tool for selecting teachers to provide
math intervention. Taken altogether, the message is that instruction makes a difference.
However, difficult decisions about the funding and effectiveness of intervention
programs or teachers must consider a set of factors, the most important of which is
student progress in intervention. Student progress after an intervention ends may reflect
143
on the quality of the intervention and the preparation of the core math teacher to provide
appropriate instruction in the student’s Zone of Proximal Development to keep the
student learning at the level and pace of peers who are not at-risk.
The results also speak to the RTI process (National Center on Response to
Intervention, 2010). The fact that the greatest gains are made by students who enter
intervention at the lowest levels of prior achievement speaks to the importance of using a
universal screener to identify students for intervention. The gains that students made were
valuable throughout their intervention year and into the next year, showing the value of
addressing number sense and problem solving in a manner that invites students to
construct meaning and work at the cutting edge of their understanding. This may help
schools select the type of intervention program they implement (Bryant, Bryant, Gersten,
Scammacca, Winter, Shih, & Pool, 2008; Smith, Cobb, Farran, et al., 2010). Students in
the sample scored higher when they received instruction from MITs with more
experience. Their mean math achievement gain increased from 45.00 points for students
of first year MITs to 63.41 points for students of MITs with four years of intervention
experience. It is recommended that school councils provide funds for intervention
specialists to continue for multiple years even when salaries exceed the amount provided
in a grant. There are also fiscal implications for decision-making at the district level when
finite resources must be carefully allocated to accelerate all students’ achievement.
Everyone who serves on a school’s child study team, deciding when to provide,
change, or discontinue intervention instruction needs to understand the results of this
study (Gravois & Rosenfield, 2006; Speece, 2006). Children who had been retained,

144
children who had IEPs (special education Individualized Education Plans), and children
with low levels of prior math achievement all made significant math achievement gains
with intervention. Children in kindergarten through third grades made significant gains,
and the students in the lowest grades made the greatest mean gains. This supports the
proposition that schools must approach intervention without looking for a deficit in the
learner, but as an instructional problem due to inadequate prior education opportunities
(Gravois & Rosenfield, 2006; Speece, 2006).
Federal and State Policies
Kentucky’s math interventions are a legislative success story. In 2005 the
legislature set out to make a difference in mathematics instruction and learning. The
Kentucky Center for Mathematics (KCM) and an independent evaluation service center
provide the legislature data on the effectiveness of the interventions. The message for
state and federal policymakers is that contact hours with a highly skilled math
intervention teacher yielded student achievement gains. This implies a value to continue
funding the existing math intervention programs and expand grant opportunities for
schools to train and provide a skilled Math Intervention Teacher for struggling primary
students. The NAEP 2011 results in Table 5.2 indicate that Kentucky students continue to
make accelerated math achievement gains that outpace the national averages.

145
Table 5.2.
2005, 2009, and 2011 NAEP Math Results for Participating Kentucky Schools
Fourth Grade Students Eighth Grade Students
2005 2009 2011 Change 2005 2009 2011 Change
Mean Math Score Kentucky 235 239 241 +6 274 279 282 +8 National 239 239 240 +1 278 282 283 +5 % At or above Proficient Kentucky 28 37 39 +11 23 27 30 +7 National 40 39 39 -1 28 32 34 +6 % Below Basic Kentucky 25 19 15 -10 36 30 28 -8 National 21 19 18 -3 32 29 28 -4 Note. Source: NCES http://nces.ed.gov/nationsreportcard/states/Default.asp
The student data provided by KCM did not identify students by race, ethnicity, or
income levels. Adding these demographics to the data collected by the grants is
suggested. However, intervention is a matter of improving instruction for individual
children. The questions legislators and researchers may wish to answer are (1) whether
teachers’ existing pedagogical knowledge is adequate for mathematics content and fits
the learner and (2) whether teachers and school child-study teams understand when and
how to provide culturally responsive instruction (Braun, Wang, Jenkins, & Weinbaum
2006; Finn, 1982; Harry & Klingner, 2006; Hosp & Reschly, 2003; Nye, Hedges, &
Konstantopoulos, 2004).
The last question for legislators is whether pedagogical content knowledge should
become a component of teacher evaluation models that are being considered for state-
wide implementation or as part of teacher-licensing exams. It is recommended that if the

146
committees are not currently considering a teacher’s pedagogical content knowledge that
it be offered to the committee members for consideration.
Conclusion
This study first speaks against bias in selecting students to receive early math
intervention. Students with the lowest entry levels of math achievement and those in
kindergarten or first grade made greater gains than students with higher levels of entry
math achievement and those in second or third grades. Significant gains were made by
students in all grades, students who had been retained, and students with IEPs.
Intervention is recommended for all students who are struggling in mathematics.
The study also speaks to the importance of providing students access to high
quality instruction from a teacher with specialized knowledge of mathematics, pedagogy,
and an understanding of students’ learning processes. Primary students who received
instruction from teachers with specialized training had higher math achievement gains
when they had more contact hours for instruction and when their teachers had higher
levels of pedagogical content knowledge. Students also made greater gains as teachers
gained years of math intervention experience.
Finally, the study offers insight to educators and policymakers. Providing
interventions for struggling students can be informed by this study in five ways: (a) Math
intervention should begin in kindergarten, (b) Math programs should allow the teacher to
differentiate instruction, (c) High quality teacher training and experienced intervention
teachers affect student achievement, (d) As instruction contact hours increase, so does

147
student achievement, and (e) Students with the greatest need should receive intervention
without bias for young age, early grade, gender, retention, or IEP status.
In closing, a caution is offered to public school districts who are implementing a
Response to Intervention (RTI) process. Intervention is instruction. Assessment helps
measure its effectiveness, but assessment is not intervention. Formative assessment data
that is gathered through curriculum-based measurement cannot be valid unless (1) at least
80% of students enrolled in the schools are able to achieve at grade level with core math
instruction, (2) intervention instruction uses high-quality, research-validated strategies
with fidelity, and (3) formative assessment is used to adjust instruction when students are
not making progress at a rate and level commensurate with their peers (NCRI, 2010).
IDEA (2004) then allows for data from interventions to be used along with other sources
of information in the evaluation process for specific learning disabilities. Even so, the
primary purpose of early intervention is not as a pre-referral process, but to accelerate
students’ learning.
148
LIST OF REFERENCES
Abell, S. K. (2008). Twenty years later: Does pedagogical content knowledge remain a
useful idea? International Journal of Science Education, 30(10), 1405–1416.
Al Otaiba, S., & Torgesen, J. (2007). Effects from intensive standardized kindergarten
and first-grade interventions for the prevention of reading difficulties. In S. R.
Jimerson, M. K. Burns, & A. M. VanDerHeyden (Eds.), Handbook of response to
intervention: The science and practice of assessment and intervention (pp. 212–
222). New York: Springer Publishing.
Apaza, J. A. (2009). Factors impacting teacher change during a mathematics reform
initiative. University of South Dakota). ProQuest Dissertations and Theses,
Retrieved from http://search.proquest.com/docview/304995887?accountid=10628
Ardoin, S.P. (2006). The response in response to intervention: Evaluating the utility of
assessing maintenance of intervention effects. Psychology in the Schools, 43(6),
713-725.
Ardoin, S. P., Witt, J. C., Connell, J. E., & Koenig. J. L. (2005). Planning, decision
making, and the identification of children in need of services. Journal of Psycho-
educational Assessment, 23, 362-380. doi:10.1177/073428290502300405
Ashlock, R. B. (1990). Error patterns in computation: A semi-programmed approach
(5th ed.). Columbus, OH: Charles E. Merrill.

149
Aunola, K., Leskinen, E., & Lerkkanen, M. (2004). Developmental dynamics of math
performance from preschool to grade 2. Journal of Educational Psychology,
96(4), 699–713.
Baker, S., Gersten, R., Dimino, J. A., & Griffiths, R. (2004). The sustained use of
research-based instructional practice: A case study of peer-assisted learning
strategies in mathematics. Remedial and Special Education, 25(1), 5–24.
Ball, D. L. (1988). Knowledge and reasoning in mathematical pedagogy: Examining
what prospective teachers bring to teacher education (Unpublished doctoral
dissertation). Michigan State University, East Lansing.
Ball, D. L. (1990). The mathematical understandings that prospective teachers bring to
teacher education. Elementary School Journal, 90(4), 449–466.
Ball, D. L. (1991). Research on teaching mathematics: Making subject matter part of the
equation. In J. Brophy (Ed.), Advances in research on teaching (Vol. 2, pp. 1–48).
Greenwich, CT: JAI Press.
Ball, D. L., & Bass, H. (2000). Interweaving content and pedagogy in teaching and
learning to teach: Knowing and using mathematics. In J. Boaler (Ed.), Multiple 43
perspectives on the teaching and learning of mathematics (pp. 83–104). Westport,
CT: Ablex.
Ball, D. L., & Bass, H. (2001). Making mathematics reasonable in school. In G. Martin
(Ed.), Research compendium for the principles and standards for school
mathematics (pp. 27-44). Reston, VA: National Council of Teachers of
Mathematics.
150
Ball, D. L., & Cohen, D. K. (1999). Developing practice, developing practitioners:
Toward a practice-based theory of professional education. In L. Darling-
Hammond & G. Sykes (Eds.), Teaching as the learning profession: Handbook of
policy and practice (pp. 3–32). San Francisco: Jossey-Bass.
Barber, M., & Mourshed, M. (2007, September). How the world’s best-performing school
systems come out on top. McKinsey and Company. Retrieved from
http://www.kentuckymathematics.org/coaching/docs/2008/Worlds_School_Syste
ms_Final.pdf
Barbaresi, W. J., Katusic, S. K., Colligan, R. C., Weaver, A. L., & Jacobsen, S. J. (2005).
Math learning disorder: Incidence in a population-based birth cohort. Ambulatory
Pediatrics, 5(5), 281–289.
Baumert, J., Kunter, M., Blum, W., Brunner, M., Voss, T., Jordan, A., Tsay, Y. (2010).
Teachers’ mathematical knowledge, cognitive activation in the classroom, and
student progress. American Educational Research Journal, 47(133), 133–180.
doi:10.3102/0002831209345157
Berninger, V., & Abbott, R. (1994). Redefining learning disabilities: Moving beyond
aptitude-achievement discrepancies to failure to respond to validated treatment
protocols. In G.R. Lyon (Ed.), Frames of reference for the assessment of learning
disabilities: New views on measurement issues, 163-202. Baltimore: Paul H.
Brookes.

151
Behn, R.D. (1995). The big questions of public management. Public management
review, 55(4), 313-324. Blackwell Publishing. Stable URL:
http://www.jstor.org/stable/977122
Borko, H. & Livingston, C. (1989). Cognition and improvisation: Differences in
mathematics instruction by expert and novice teachers. American Educational
Research Journal, 26(4), 473–498.
Braun, H. I., Wang, A., Jenkins, F., & Weinbaum, E. (2006). The Black-White
achievement gap: Do state policies matter? Education Policy Analysis Archives,
14(8), 1–107. Retrieved from http://epaa.asu.edu/epaa/v14n8/
Brouwer, N., & Korthagan, F. (2005). Can teacher education make a difference?
American Educational Research Journal, 42(1), 153–224. Retrieved from
http://www.jstor.org/stable/3699458
Brownell, M. T., Sindelar, P. T., Kiely, M. T., & Danielson, L. C. (2010). Special
education teacher quality and preparation: Exposing foundations, constructing a
new model. Exceptional Children, 76(3), 357–377.
Bryant, D.P. (2005). Commentary on early identification and intervention for students
with mathematics difficulties. Journal of Learning Disabilities, 38(4), 350-345.
Bryant, D. P., Bryant, B. R., Gersten, R., Scammacca, N., & Chavez, M. M. (2008).
Mathematics intervention for first and second grade students with mathematics
difficulties: The effects of tier 2 intervention delivered as booster lessons.
Remedial and Special Education 29(1), 20-32. doi: 10.1177/0741932507309712

152
Bryant, D. P., Bryant, B. R., Gersten, R. M., Scammacca, C. F., Winter, A., Shih, M. &
Pool, C. (2008). The effects of tier 2 intervention on the mathematics performance
of first-grade students who are at risk for mathematics difficulties. Learning
Disabilities Quarterly, 31, 47–60.
Bullough, R. (2001). Pedagogical content knowledge circa 1907 and 1987: A study in the
history of an idea. Teaching and Teacher Education, 17, 655–666.
Burch, D. B. (2005). Making sense of number sense: Implications for children with
mathematical disabilities. Journal of Learning Disabilities, 38(4), 333–339.
Burns, M. K., Appleton, J. J., & Stehouwer, J. D. (2005). Meta-analytic review of
responsiveness-to- intervention research: Examining field-based and research-
implemented models. Journal of Psycho-educational Assessment, 23, 381–394.
doi:10.1177/073428290502300406
Burns, M. K., Codding, R. S., Boice, C. H., & Lukito, G. (2010). Meta-analysis of
acquisition and fluency math interventions with instructional and frustration level
skills: Evidence for a skill-by-treatment interaction. School Psychology Review,
39(1), 69–83.
Burns, M. K., Griffiths, A. J., Parson, L. B., Tilly, W. D., & VanDerHeyden, A. (2007).
Response to intervention: Research to practice. Alexandria, VA: National
Association of State Directors of Special Education.
Burns, M. K., Scholin, S. E., Kosciolek, S., & Livingston, J. (2010). Reliability of
decision-making frameworks for RTI for reading. Journal of Psychological
Assessment, 28(2), 102–114.

153
Cancoy, O. (2010). Mathematics teachers' topic-specific pedagogical content knowledge
in the context of teaching a°, 0! and a^ 0. Education Sciences: Theory & Practice,
10(2), 749–769.
Carney, K. J., & Stiefel, G. S. (2010). Long-term results of a problem-solving approach
to response to intervention: Discussion and implications. Learning Disabilities: A
Contemporary Journal, 6(2), 61–75.
Carpenter, T. P., Fennema, E., Peterson, P. L., Chiang, C., & Loef, M. (1989). Using
knowledge of children's mathematics thinking in classroom teaching: An
experimental study. American Educational Research Journal, 26(4), 499–531.
Retrieved from http://www.jstor.org/stable/1162862
Chingos, M. M., & Peterson, P. E. (2011). It’s easier to pick a good teacher than to train
one: Familiar and new results on the correlates of teacher effectiveness.
Economics of Education Review, 30, 449–465.
doi:10.1016/j.econedurev.2010.12.010
Clements, D. H., & Samara, J. (2005). Experimental evaluation of the effects of a
research-based preschool mathematics curriculum. American Educational
Research Journal, 45(2) 443–494. doi:10.3102/0002831207312908.
Cobb, P., Gresalfi, M., & Hodge, L. L. (2009). An interpretive scheme for analyzing the
identities that students develop in mathematical classrooms. Journal for Research
in Mathematics, 40(1), 40–68.
154
Cochran, K. F., DeRuiter, J. A., & King, R. A. (1993). Pedagogical content knowledge:
An integrative model for teacher education. Journal of Teacher Education, 44,
263–272. doi:10.1177/0022487193044004004
Cochran, K.F., King, R.A., & DeRuiter, J.A. (1991). Pedagogical content knowledge: A
tentative model for teacher preparation. East Lansing, MI: National Center for
Research on Teacher Learning. (ERIC Document Reproduction Service No.
ED340683)
Committee for Mathematics Achievement. KRS § 158. 842 (2005).
Common Core State Standards Initiative. (2010). Reaching higher: The common core
state standards validation committee. Retrieved from
http://www.corestandards.org/in-the-states
Compton, D. L., Fuchs, D., Fuchs, L. S., & Bryant, J. D. (2006). Selecting at-risk readers
in first grade for early intervention: A two-year longitudinal study of decision
rules and procedures. Journal of Educational Psychology, 98(2), 394–409.
Confrey, J. (1990). What constructivism implies for teaching. In R. B. Davis, C. A.
Maher, & N. Noddings (Eds.), Constructivist views on the teaching and learning
of mathematics. Journal for Research in Mathematics Education, Monograph, 4,
107-210. Retrieved from http:www.jstor.org/stable/749916
Costam A. L., & Garmston, J. G. (2002). Cognitive coaching: A foundation for
renaissance schools (2nd ed.). Norwood, MA: Christopher-Gordon Publishers.
Cumbria Local Authority. (2007). Mathematics Recovery evaluation. Cumberia, UK.
Retrieved from

155
http://www.cumbria.gov.uk/eLibrary/Content/Internet/537/3953/4202/4350/
39449111219.pdf
Data Accountability Center (2010). Number of students, ages 6 through 21, served under
IDEA, Part B, by disability category and state: Fall 2010. Office of Special
Education Programs (OSEP), U.S. Department of Education. Retrieved from
https://www.ideadata.org/arc_toc12.asp#partbCC
Dehane, S. (1992). Varieties of numerical abilities. Cognition, 44, 1–42.
Desoete, A., Stock, P., Schepens, A., Baeyens, D., & Roeyers, H. (2009). Classification,
seriation, and counting in grades 1, 2, and 3 as two-year longitudinal predictors
for low achieving in numerical facility and arithmetical achievement? Journal of
Psychoeducational Assessment, 27(3), 252-264.
Diezmann, C. & English, L. (2001). Developing young children's multi-digit number
sense. Roeper Review, 24(1), 11–13.
DiPerna, J., Pui-Wa, L., & Reid, E. (2007). Kindergarten predictors of mathematical
growth in the primary grades: An investigation using the early childhood
longitudinal study—kindergarten cohort. Journal of Educational Psychology,
99(2), 369–379. doi:10.1037/0022-0663.99.2.369.
Donovan, M. S., & Cross, C. T., (Eds.) (2002). Minority students in special and gifted
education. Washington, DC: National Academy Press.
Duncan, G. J., Dowsett, C. J., Claessens, A., Magnuson, K., Huston, A.C., Klebanov, P.,
& Japel, C. (2007). School readiness and later achievement. Developmental
Psychology, 43, 1428–1446.

156
Edens, K., & Potter, E. (2007). The relationship of drawing and mathematical problem
solving: Draw for math tasks. Studies in Art Education, 48(3), 282–298.
Ellemor-Collins, D. L., & Wright, R. J. (2008). Assessing student thinking about
arithmetic: Videotaped interviews. Teaching Children Mathematics, 15, 106–111.
Etzel, B. C., & LeBlanc, J. M. (1979). The simplest treatment alternative: The law of
parsimony applied to choosing appropriate instructional control and errorless-
learning procedures for the difficult-to-teach child. Journal of Autism and
Developmental Disorders, 9(4), 361–382. doi:10.1007/BF01531445.
Fernandez-Balboa, J. M. & Stiehl, J. (1995). The generic nature of pedagogical content
knowledge among college professors. Teaching and Teacher Education, 11(3),
293-306.
Fleischner, J. E., & Manheimer, M. A. (1997). Math interventions for students with
learning disabilities: Myths and realities. School Psychology Review, 26(3), 397.
Fosnot, C., & Dolk, M. (2001). Young mathematicians at work: Constructing number
sense, addition and subtraction. Portsmouth, NH: Heinemann.
Fuchs, D., & Fuchs, L. (2002). Mathematical problem-solving profiles of students with
mathematics disabilities with and without reading disabilities. Journal of
Learning Disabilities, 35, 564–574.
Fuchs, D., & Fuchs, L. (2006). Introduction to response to intervention: What, why, and
how valid is it? Reading Research Quarterly, 41(1), 93–99.
doi:10.1598/RRQ.41.1.4

157
Fuchs, L. S., Compton, D. L., Fuchs, D., Paulsen, K., Bryant, J. D., & Hamlett, C. L.
(2005). The prevention, identification, and cognitive determinants of math
difficulty. Journal of Educational Psychology, 97(3), 493–513. doi:10.1037/0022-
0663.97.3.493
Fuchs, L. S., & Fuchs, D. (2008). Best practices in progress monitoring reading and
mathematics at the elementary grades. In A. Thomas & J. Grimes (Eds.), Best
practices in school psychology (5th ed., pp. 2147–2164). Bethesda, MD: National
Association of School Psychologists.
Fuchs, L. S., Fuchs, D., Craddock, C., Hollenbeck, K. N., & Hamlett, C. L. (2008).
Effects of small-group tutoring with and without validated classroom instruction
on at-risk students’ math problem solving: Are two tiers of prevention better than
one? Journal of Educational Psychology, 100(3), 491–509. doi:10.1037/0022-
0663.100.3.491
Fuchs, L. S., Fuchs, D., & Karns, K. (2001). Enhancing kindergarteners’ mathematical
development: Effects of peer-assisted learning strategies. The Elementary School
Journal, 101, 495–511.
Fuchs, L. S., Fuchs, D., & Prentice, K. (2005). Responsiveness to mathematical problem-
solving instruction: Comparing students at risk of mathematics disability with and
without risk of reading disability. Journal of Learning Disabilities, 37(4), 293–
306.

158
Fuchs, L. S., Fuchs, D., Yazdian, L., & Powell, S. R. (2002). Enhancing first grade
children’s mathematical development with peer-assisted strategies. School
Psychology Review, 31, 569–583.
Geary, D. C. (2004). Mathematics and learning disabilities. Journal of Learning
Disabilities, 37, 4–15.
Geddis, A. N. (1993). Transforming subject matter knowledge: The role of pedagogical
content knowledge in learning to reflect on teaching. International Journal of
Science Education, 15, 673–683.
Gersten, R., Jordan, N. C., & Flojo, J. R. (2005). Early identification and interventions
for students with mathematics difficulties. Journal of Learning Disabilities, 38(4),
293–304.
Gess-Newsome, J., & Lederman, N. (Eds). (1999). Examining pedagogical content
knowledge. Dordrecht, Netherlands: Kluwer Academic Publishers.
Gilbertson, D., Witt, J. C., LaFleur Singletary, L., & VanDerHeyden, A. (2007).
Supporting teacher use of interventions: Effects of response dependent
performance feedback on teacher implementation of a math intervention. Journal
of Behavioral Education, 16, 311–326. doi:10.1007/s10864-007-9043-0
Goldhaber, D. D., & Brewer, D. J. (1997). Why don’t schools and teachers seem to
matter? Assessing the impact of unobservables on educational productivity. The
Journal of Human Resources, 32(3), 505–523.
Gonzales, P., Williams, T., Jocelyn, L., Roey, S., Kastberg, D., & Brenwald, S. (2008).
Highlights from TIMSS 2007: Mathematics and science achievement of U.S.

159
fourth- and eighth-grade students in an international context (NCES 2009–
001Revised). Washington, DC: National Center for Education Statistics.
Graeber, A. O. (1999). Forms of knowing mathematics: What preservice teachers should
learn. Educational Studies in Mathematics, 38, 189–208. Retrieved from
http://www.jstor.org/stable/3483136
Graber, K. (1995). The influence of teacher education programs on the beliefs of student
teachers: General pedagogical knowledge, pedagogical content knowledge, and
teacher education course work. Journal of Teaching in Physical Education, 14,
157–178.
Gravois, T. A., & Rosenfield, S.A. (2006). Impact of instructional consultation teams on
the disproportionate referral and placement of minority students in special
education. Remedial and Special Education, 27(1), 42–52.
Griffin, L., Dodds, P., & Rovegno, L. (1996). Pedagogical content knowledge for
teachers: Integrate everything you know to help students learn. Journal of
Physical Education, Recreation, and Dance, 67, 58–61.
Griffin, S. (2004). Teaching number sense. Educational Leadership, 61(5), 39-42.
Griffin, S., & Case, R. (1996). Number worlds: Kindergarten level. Durham, NH:
Number Worlds Alliance.
Griffin, S., & Case, R. (1997). Rethinking the primary school math curriculum: An
approach based on cognitive science. Issues in Education, 3(1), 1–49.
Griffin, S., Case, R., & Siegler, R. (1994). Rightstart: Providing the central conceptual
prerequisites for first formal learning of arithmetic to students at risk for school

160
failure. In K. McGilly (Ed.), Classroom lessons: Integrating cognitive theory and
classroom practice (pp. 24–49). Cambridge, MA: MIT Press.
Grissemier, D., Grimm, K. J., Aiyer, S. M., Murrah, W. M., & Steele, J.S. (2010). Fine
motor skills and early comprehension of the world: Two new school readiness
indicators. Developmental Psychology, 46(5), 1008–1017. doi:10.1037/a0020104
Grossman, P. (1990). The making of a teacher: Teacher knowledge and teacher
education. New York: Teachers College Press.
Hanich, L., Jordan, N. C., Kaplan, D., & Dick, J. (2001). Performance across different
areas of mathematical cognition in children with learning difficulties. Journal of
Educational Psychology, 93(3), 615–626.
Hanushek, E. A., & Raymond, M. E. (2004). Lessons about the design of state
accountability. In P. E. Peterson & M. R. West (Eds.) No Child Left Behind? The
Politics and Practice of School Accountability (127–151). Washington, DC:
Brookings Institution.
Harris, J. B., & Hofer, M. J. (2011) Technological pedagogical content knowledge
(TPACK) in action: A descriptive study of secondary teachers’ curriculum-based,
technology-related instructional planning. Journal of Research on Technology in
Education, 43(3), 211–229.
Harry, B., & Klingner, J. (2006). Why are so many minority students in special
education? Understanding race and disability in schools. New York: Teachers
College Press.

161
Hill, H.C. & Ball, D.L. (2009). Learning mathematics for teaching: Results from
California’s mathematics professional development institutes. Journal for
Research in Mathematics Education, 35(5), 330-351.
Hill, D. C., Dean, C., & Goffney, I. M. (2008). Assessing elemental and structural
validity: Data from teachers, non-teachers, and mathematicians. Retrieved from
http://sitemaker.umich.edu/lmt/files/measuring_-_assessing_elemental.pdf
Hill, H.C., Rowan, B., & Ball, D.L. (2005). Effects of Teachers' Mathematical
Knowledge for Teaching on Student Achievement. American Educational
Research Journal, 42(2), 371–406.
Hill, H. C., Schilling, S. G., & Ball, D. L. (2004). Developing measures of teachers'
mathematics knowledge for teaching. Elementary School Journal, 105(1), 11-30.
Hosp, J. L. (2009). Response to intervention and the disproportionate representation of
culturally and linguistically diverse students in special education. Retrieved from
http://www.rtinetwork.org/learn/diversity/disproportionaterepresentation
Hosp, J. L., & Madyun, N. (2007). Addressing disproportionality with response to
intervention. In S. Jimerson, M. Burns, & A. VanDerHeyden (Eds.), Handbook of
response to intervention: The science and practice of assessment and intervention
(pp. 10–24). New York: Springer.
Hosp, J. L., & Reschly, D. J. (2002). Predictors of restrictiveness of placement for
African-American and Caucasian students with learning disabilities. Exceptional
Children, 68, 225–238.

162
Hosp. J. L., & Reschly, D. J. (2003). Referral rates for intervention or assessment: A
meta-analysis of racial differences. The Journal of Special Education, 37, 67–80.
Hosp, J. L., & Reschly, D. J. (2004). Disproportionate representation of minority students
in special education: Academic, economic, and demographic predictors.
Exceptional Children, 70, 185–200.
Hughes, C., & Dexter, D. D. (2009). Universal screening within a response to
intervention model. Response to Intervention Network. Retrieved from
http://www.rtinetwork.org/learn/research/universal-screening-within-a-rti-model
Individuals with Disabilities Education Improvement Act of 2004, 20 U.S.C. § 140
(2004). Identification of specific learning disabilities. 34 CFR 300.8(c)(10).
Retrieved from
http://www.ideapartnership.org/index.php?option=com_content&view=article&id
=844&oseppage=1
Jenkins, J. M., & Veal, M. (2002). Pre-service teachers' PCK development during peer
coaching. Journal of Teaching in Physical Education, 22, 49–68.
Jordan, N. C., Hanich, L. B., & Kaplan, D. (2003). Arithmetic fact mastery in young
children: A longitudinal investigation. Journal of Experimental Child Psychology,
85, 103–119.
Jordan, N. C., Kaplan, D., & Hanich, L. B. (2002). Achievement growth in children with
learning difficulties in mathematics: Findings of a two-year longitudinal study.
Journal of Educational Psychology, 94, 586–597.

163
Käpylä, M., Heikkinen, J., & Asunta, T. (2009). Influence of content knowledge on
pedagogical content knowledge: The case of teaching photosynthesis and plant
growth. International Journal of Science Education, 31(10), 1395–1415.
doi:10.1080/09500690802082168
Kavale, K.A. & Spalding, L. S. (2008). Is response to intervention good policy for
specific learning disability? Learning Disabilities Research & Practice, 23(4),
169–179. doi:10.1111/j.1540-5826.2008.00274.x
Kentucky Center for Mathematics. (2009). An evaluation of the effectiveness of
Mathematics Recovery professional development. Retrieved from
http://www.kentuckymathematics.org/research/docs/2010/08-
09InterventionReportFinal.pdf
Kentucky Center for Mathematics. (2010). Kentucky’s primary grades mathematics
intervention program longitudinal results, July 2010. Retrieved from
http://kentuckymathematics.org
Kentucky Department of Education. (2008). A guide to the Kentucky system of
interventions. Retrieved from
http://www.education.ky.gov/users/otl/RTI/KSI%2010_30.pdf
Kentucky Department of Education. (2010). Kentucky state report card 2009-2010.
Retrieved from http://www.kde.state.ky.us/NR/rdonlyres/99FA32B5-3AE7-4898-
8D06-B2A98878644C/0/KYReportCard_200910.pdf

164
Kentucky Department of Education. (2011). Kentucky education facts. Retrieved from
http://www.education.ky.gov/kde/homepagerepository/news+room/kentucky+edu
cation+facts.htm
Kentucky Department of Education. (2011). Reference tables for identifying students with
a specific learning disability. Retrieved from
http://www.education.ky.gov/KDE/Instructional+Resources/Exceptional+Childre
n/Forms+and+Documents/LD+Reference+Tables.htm
Kentucky Center for Mathematics. KRS § 164.525 (2005).
Kinach, B. (2002). A cognitive strategy for developing pedagogical content knowledge in
the secondary mathematics methods course: Toward a model of effective practice.
Teaching and Teacher Education, 18, 51–71.
Kukla-Acevedo, S., (2009). Do teacher characteristics matter? New results on the effects
of teacher preparation on student achievement. Economics of Education Review,
28, 49–57 doi:10.1016/j.econedurev.2007.10.007
Lee, J. (2006). Input-guarantee versus performance-guarantee approaches to school
accountability: Cross-state comparisons of policies, resources, and outcomes.
Peabody Journal of Education, 81(4), 43–64.
Lomax, R. G., & Hahs-Vaughn, D. L. (2007). Statistical concepts: the second course.
(3rd ed.). London: Lawrence Erlbaum Associates.
Lum, Lydia. (2011). Grooming teachers. Diverse: Issues in Higher Education, 28(10), 4.
http://search.ebscohost.com.libproxy.eku.edu/login.aspx?direct=true&db=aph&A
N=61868547&site=ehost-live

165
Ludwig, K., Maltbie, C., Marks, J., & Jordan, J. (2009). Kentucky Center for
Mathematics: 2008-2009 Intervention program evaluation summary of results.
University of Cincinnati Evaluation Services Center. Cincinnati, OH. Retrieved
from http://www.kentuckymathematics.org/research/docs/2010/08-
09InterventionReportFinal.pdf
Ma, L. (1999). Knowing and teaching elementary mathematics: Teachers’ understanding
of fundamental mathematics in China and the United States. Mahwah, NJ:
Lawrence Erlbaum Associates.
MacLean, H. E. (2003). The effects of early intervention on the mathematical
achievement of low-performing first-grade students (Unpublished doctoral
dissertation). University of Houston, Houston, TX. Available from Dissertations
& Theses: Full Text database. (Publication No. AAT 3081498)
Magnuson, K., Meyers, M., & Ruhm, C. (2004). Inequality in preschool education and
school readiness. American Educational Research Journal, 41(1), 115–157.
Malzahn, K. A. (2002). Status of elementary school mathematics teaching. 2000 National
Survey of science and mathematics education. Chapel Hill, NC: Horizon
Research. Retrieved from www.horizon-research.com
Mathematics Achievement Fund. KRS § 158.844 (2005).
Mathematics Recovery in the United States. (2011). RTI and math recovery. Retrieved
from
http://mathrecovery.org/index.php?option=com_content&view=article&id=66&It
emid=89

166
McCaughtry, N. (2005). Elaborating pedagogical content knowledge: What it means to
know students and think about teaching. Teachers and Teaching: Theory and
Practice, 11(4), 379–395.
McCaughtry, N., & Rovegno, I. (2003). Development of pedagogical content knowledge:
Moving form blaming students to predicting skillfulness, recognizing motor
development, and understanding emotion. Journal of Teaching in Physical
Education, 22(4), 355–368.
McDiarmid, G., Ball, D., & Anderson, C. (1989). Why staying one chapter ahead doesn't
really work: Subject specific pedagogy. In M. Reynolds (Ed.), Knowledge base
for the beginning teacher (pp. 193–205). New York: Pergamon.
McGraw-Hill. (2001). California Achievement Tests (CAT) norms book for Terra Nova
(2nd ed.). Monterey, CA: Author. Retrieved from http://www.ctb.com
Miller, S. P. & Mercer, C. D. (1997). Educational aspects of mathematics disabilities.
Journal of Learning Disabilities, 30, 47–56.
Moran, M.R. (1978). Assessment of the exceptional learner in the regular classroom.
Denver: Love Publications.
Moses, R., Kamii, M., Swap, S., & Howard, J. (1989). The Algebra Project: Organizing
in the spirit of Ella. Harvard Educational Review, 59, 423–443.
National Association of State Directors of Special Education. (2005). Response to
intervention: Policy considerations and implementation. Alexandria, VA: Author.
National Center for Education Statistics. (2006). How do U.S. Students and Adults
Compare with Their Peers in Other Countries? The Condition of Education,

167
Special Analysis 2006: U.S. Student and Adult Performance on International
Assessments of Educational Achievement. Retrieved from
http://nces.ed.gov/programs/coe/analysis/2006-sa03b.asp
National Center for Education Statistics. (2010a). Children 3 to 21 years old served
under Individuals with Disabilities Education Act, Part B, by type of disability:
Selected years, 1976-77 through 2008-09. Retrieved from
http://nces.ed.gov/programs/digest/d10/tables/dt10_045.asp
National Center for Education Statistics. (2010b). Status and trends in the education of
racial and ethnic minorities: Indicator 8. Special needs. Retrieved from
http://nces.ed.gov/pubs2010/2010015/indicator2_8.asp#1.asp
National Center on Response to Intervention. (2010). Essential components of RTI: A
closer look at response to intervention. Washington, DC: U.S. Author.
National Center for Learning Disabilities. (2010). Special education scorecards. National
Center For Learning Disabilities, Inc. Retrieved from http://www.ncld.org/on-
capitol-hill/policy-related-publications/special-education-scorecards
National Commission on Teaching and America’s Future. (1996). What matters most:
Teaching and America’s future. New York: Author. National Council of Teachers
of Mathematics. (1989). Curriculum and evaluation standards for school
mathematics (Report No. SE-050-418). Reston, VA: National Council of
Teachers of Mathematics.

168
National Mathematics Advisory Panel. (2008). Foundations for success: The final report
of the National Mathematics Advisory Panel. Washington, DC: U.S. Department
of Education.
National Mathematics Advisory Panel (NMAP). (2008). Foundations for success:
Reports of the Task Groups and Subcommittees. Washington, DC: U.S.
Department of Education. Retrieved from http://eric.ed.gov/PDFS/ED502980.pdf
No Child Left Behind Act of 2001, 20 U.S.C. § 6319 (2008).
Noell, G. H., Witt, J. C., LaFleur, L.H., Mortenson, B. P., Rainer, D. D., & LeVelle, J.
(2000). Increasing intervention implementation in general education following
consultation: A comparison of two follow-up strategies. Journal of Applied
Behavior Analysis, 33, 271–284.
Norton, A., & D’Ambrosio, B. S. (2008). ZPC and ZPD: Zones of teaching and learning.
Journal for Research in Mathematics Education, 39, 220–246.
Nye, B., Hedges, L., & Konstantopoulos, S. (2004). Do Minorities Experience Larger
Lasting Benefits From Small Classes? The Journal of Educational Research,
98(2), 94–100.
O'Donnell, C. L. (2008). Defining, conceptualizing, and measuring fidelity of
implementation and its relationship to outcomes in K–12 curriculum intervention
research. Review of Educational Research, 78(1), 33-84.
Pagani, L. S., Fitzpatrick, C., Archambault, I., & Janosz, M. (2010). School readiness
and later achievement: A French Canadian replication and extension.
Developmental Psychology, 46(5), 984–994. doi:10.1037/a0018881

169
Pasnak, R., Cooke, W.D., & Hendrix, C. (2006). Enhancing academic performance by
strengthening class-inclusion reasoning. The Journal of Psychology, 140, 603-
613.
Penuel, W. R., Fishman, B. J., Yamaguchi, R., & Gallagher, L. P. (2007). What makes
professional development effective? Strategies that foster curriculum
implementation. American Educational Research Journal, 44(4), 921–958.
doi:1T0.3102/0002831207308221C 2007 AERA
Princiotta, D., Flanagan, K. D., & Germino Hausken, E. (2006). Fifth grade: Findings
from the fifth-grade follow-up of the early childhood longitudinal study,
kindergarten class of 1998–99 (ECLS-K). (NCES 2006-038). Washington, DC:
National Center for Education Statistics.
Program for International Student Assessment (PISA). (2009). National Center for
Education Statistics: http://nces.ed.gov/pubs2011/2011004.pdf
Quenemoen, R., Thurlow, M., Moen, R., Thompson, S., & Morse, A. B. (2003). Progress
monitoring in an inclusive standards-based assessment and accountability system
(Synthesis Report 53). Minneapolis, MN: University of Minnesota, National
Center on Educational Outcomes. Retrieved from
http://education.umn.edu/NCEO/OnlinePubs/Synthesis53.html
Rahn-Blakeslee, A., Ikeda, M. J., & Gustafson, J. (2005). Evaluating the quality and
responsiveness of reading interventions developed through problem solving.
Journal of Psycho-educational Assessment, 23, 395–410.
doi:10.1177/073428290502300407

170
Rampey, B. D., Dion, G. S., & Donahue, P. L. (2009). NAEP Trends in Academic
Progress (CES 2009- 479). Washington, DC: National Center for Education
Sciences.
Rowan, B., Correnti, R., & Miller, R. (2002). What large-scale research tells us about
teacher effects on student achievement: Insights from the prospects study of
elementary schools. Teachers College Record, 104(8), 1525–1567.
Scanlon, D. M., Gelzheiser, L. M., Vellutino, F. R., Schatschneider, C., & Sweeney, J. M.
(2008). Reducing the incidence of early reading difficulties: Professional
development for classroom teachers versus direct interventions for children.
Learning and Individual Differences, 18(3), 346–359. doi:10.1016/j.
lindif.2008.05.002
Schwab, J. J. (1964). Structure of the disciplines: Meanings and significance. In G. W.
Ford & L. Pugno (Eds.), The structure of knowledge and the curriculum (pp. 6–
30). Chicago: Rand McNally.
Scruggs, T. E., & Mastropieri, M. A. (2002). On babies and bathwater: Addressing the
problems of identification of learning disabilities. Learning Disability Quarterly,
25, 155–168.
Seethaler, P. M., & Fuchs, L. S. (2005). A drop in the bucket: Randomized controlled
trials testing reading and math interventions. Learning Disabilities Research &
Practice, 20(2), 98–102.
Shields, J. L. (1978). An empirical investigation of the effect of heteroscedasticity and
heterogeneity of variance on the analysis of covariance and the Johnson-Neyman

171
technique (Report No. ARI-TP-292). Arlington, VA: Army Research Institute for
the Behavioral and Social Sciences. Retrieved from
http://eric.ed.gov/PDFS/ED175422.pdf
Shuhua, A., Kulm, G., & Wu, Z. (2004). The pedagogical content knowledge of middle
school mathematics teachers in China and the U.S. Journal of Mathematics in
Teacher Education, 7, 145–172.
Shulman, L. S. (1984). The practical and the eclectic: A deliberation on teaching and
educational research, Curriculum Inquiry, 14(2):183-200.
Shulman, L. S. (1986). Those who understand: Knowledge growth in teaching.
Educational Researcher, 15(4), 4-14. doi:10.3102/0013189X015002004
Shulman, L. S. (1987). Knowledge and teaching: Foundations of the new reform.
Harvard Educational Review, 57(1), 1–22.
Shulman, L.S. (1989). Aristotle had it right: On knowledge and pedagogy. The Holmes
Group, Occasional Papers series based on keynote at Annual Meeting, Atlanta,
Georgia, January 27, 1989.
Schulman, L. S. (2004). The wisdom of practice: essays in teaching, learning, and
learning to teach. San Francisco: Jossey-Bass.
Shulman, L., & Grossman, P. (1988). The Intern Teacher Casebook. San Francisco, CA:
Far Wets Laboratory for Educational Research and Development.
Smith, R.G. (2007).Developing professional identities and knowledge: Becoming
primary teachers. Teachers and Teaching: Theory and Practice, 13(4) 377-397.

172
Smith, T., Cobb, P., Farran, D., Cordray, D., Munter, C., & Dunn, A. (2010, March).
Evaluating Math Recovery: Assessing the causal impact of Math Recovery on
student achievement. Paper presented at the Society for Research on Educational
Effectiveness Conference, Washington, D.C.
Speece, D. (2006). How progress monitoring assists decision making in a response-to-
instruction framework. Washington, DC: National Center on Child Progress
Monitoring. Retrieved from
http://www.studentprogress.org/library/decisionmaking.pdf
Spillane, J., Reiser, B., Reimer, T. (2002). Policy implementation and cognition:
Reframing and refocusing implementation research. Review of Educational
Research, 72(2), 387-431.
Strauss, S. (1993). Teachers’ pedagogical content knowledge about children’s minds and
learning: Implications for teacher education. Educational Psychologist, 28(3),
279–290.
Stock, P., Desoete, A.., & Roeyers, H. (2009). Predicting arithmetic abilities: The role of
preparatory arithmetic markers and intelligence. Journal of Psychoeducational
ssessment, 27(3), 237-251. doi:10.1177/0734282908330587
Swanson, C., & Stevenson, D. (2002). Standards-based reform in practice: Evidence on
state policy and classroom instruction from the NAEP State Assessments.
Educational Evaluation & Policy Analysis, 24(1), 1–27.
Swanson, D., Bush, M., McCarty, P., & Wright, B. (2009). RTI and Math Recovery: How
they can go hand in hand. Retrieved from

173
http://mathrecovery.org/index.php?option=com_content&view=article&id=66&It
emid=89
Tamir, P. (1988). Subject matter and related pedagogical knowledge in teacher education.
Teaching and Teacher Education, 4(2), 99–110.
Tapp, D. (June, 2010). Developing number sense with strategies from Singapore
mathematics. Presentation given at Shelby County Public Schools, Central Office,
Shelbyville, Kentucky.
Teachers’ Professional Growth Fund. KRS § 156.553 (2005).
U.S. Math Recovery Council. (2010). Math Recovery research documentation.
Brentwood, TN. Retrieved from
http://mathrecovery.org/index.php?option=com_content&view=article&id=61&Itemi
d=70
van den Huevel-Panhuizen, M. (Ed.). (2008). Children learn mathematics: A learning-
teaching trajectory with intermediate attainment targets for calculation with
whole numbers in primary school. Rotterdam, Netherlands: Sense Publishers.
VanDerHeyden, A. (2009). Using RTI to improve learning in mathematics. RTI and math
instruction. Fairhope, AL: Education Research and Consulting, Inc. Retrieved
from http://www.rtinetwork.org/Learn/Why/ar/RTIandMath/1
VanDerHeyden, A.M. & Burns, M.K. (2009). Performance indicators in math:
Implications for brief experimental analysis of academic performance. Journal of
Behavioral Education 18, 71-91. doi: 10.1007/sl10864-009-9081-x

174
VanDerHeyden, A. M., Witt, J. C., & Gilbertson, D. (2007). A multi-year evaluation of
the effects of a Response to Intervention (RTI) model on identification of children
for special education. Journal of School Psychology, 45, 225–256.
Van Luit, J. E., & Schopman, E. A. M. (2000). Improving early numeracy of young
children with special educational needs. Remedial and Special Education, 21(1),
27–40.
Veal, W. R., & MaKinster, J. G. (1999). Pedagogical content knowledge taxonomies.
Electronic Journal of Science Education, 3(4). Retrieved from
http://ejse.southwestern.edu/article/view/7615/5382
Vygotsky, L. (1978). Interaction between learning and development. In Mind in Society.
Cambridge, MA: Harvard University Press.
Williams, L. A. G. (2001). The influences of participation in a Mathematics Recovery
program on classroom practices (Unpublished doctoral dissertation). University of
Virginia, Charlottesville. Retrieved from Dissertations & Theses: Full Text
database. (Publication No. AAT 3025979)
Wilson, S. M., Shulman, L. S., & Richert, A. (1987). 150 different ways of knowing:
Representations of knowledge in teaching. In J. Calderhead (Ed.), Exploring
teacher thinking (pp. 104–124). Sussex: Holt, Rinehart & Winston.
Wood, D. R. (2007). Professional learning communities: Teachers, knowledge, and
knowing. Theory into Practice, 46(4), 281–290.
Wright, R. J. (1994). A Study of the numerical development of five-year-olds and six-
year-olds. Educational Studies in Mathematics, 26, 25–44.

175
Wright, R. J., Martland, J., & Stafford, A. (2006). Early numeracy: Assessment for
teaching and intervention (2nd ed.). London: Paul Chapman Publications/Sage.
Wright, R. J., Martland, J., Stafford, A., & Stanger, G. (2006). Teaching number,
advancing children’s skills and strategies, (2nd ed.). Thousand Oaks, CA: Sage
Publications Ltd.
Wright, R. J., Stranger, G., Stafford, A. K., & Martland, J. (2006). Teaching number in
the classroom with 4-8 year olds. Thousand Oaks, CA: Sage Publications Ltd.
Ziegler, John F. (2000). Constructivist views of teaching, learning, and supervising held
by public school teachers and their influence on student achievement in
mathematics. Indiana University of Pennsylvania, Indiana, PA. Available from
Dissertations & Theses: Full Text database. (Publication No. AAT 9959147).

176
APPENDIX A:
Kentucky Revised Statutes

177
156.553 Teachers' professional growth fund -- Purposes -- Courses -- Duties of Department of Education -- Professional development programs -- Administrative regulations -- Advancement by local boards of funds to teachers for professional development education -- Reimbursement -- Priority for use of funds from 2010 to 2016.
(1) The teachers' professional growth fund is hereby created to provide teachers with high quality professional development in content knowledge in mathematics, reading, science, language arts, social studies, arts and humanities, practical living, vocational studies, and foreign languages; classroom-based screening, diagnostic, assessment, and intervention strategies; and teaching methodologies, including professional development that may lead to additional certification endorsements or renewal of certification. Based on available funds, student achievement data, and teacher data, the Kentucky Board of Education shall annually determine the priority for content emphasis based on the greatest needs.
(2) (a) The fund may provide moneys to teachers for: 1. Tuition reimbursement for successful completion of college
or university level courses, including on-line courses and seminars, approved for this purpose by the Education Professional Standards Board;
2. Stipends for participation in and successful completion of: a. College or university courses, including on-line courses
and seminars, approved for this purpose by the Education Professional Standards Board;
b. Teacher institutes developed for core content instructors by theDepartment of Education in compliance with KRS 156.095; and
c. Other professional development programs approved by the Kentucky Department of Education, including professional development for teachers participating in grants awarded by the Middle School Mathematics and Science Scholars Program established under KRS 158.848;
3. Reimbursement for the purchase of materials required for professional development programs; and
4. Reimbursement for other approved professional development activities throughout the school year, including reimbursement for: a. Travel to and from professional development workshops; and b. Travel to and from other schools for the observation of,
and consultation with, peer mentors; or (b) The fund may be used to provide grants to local school districts to
support staff participation in specific, statewide initiatives for the

178
professional development of teachers and administrators in specific content areas as established by the Kentucky Department of Education and the Kentucky Board of Education under the provisions of subsections (4), (5), and (6) of this section and referenced in KRS 158.842.
(c) The fund may be used to provide grants to colleges and universities to plan and develop statewide professional development institutes and other professional development services.
(d) The fund may be used to provide grants to local school districts, to colleges and universities, or other entities to assist the Kentucky Department of Education in evaluating costs and the effectiveness of activities and initiatives established under this section.
(3) The Education Professional Standards Board shall determine the college and university courses, including on-line courses and seminars, for which teachers may receive reimbursement from the fund.
(4) The Department of Education shall: (a) Administer the fund. In order to process reimbursements to teachers promptly,
the reimbursements shall not be subject to KRS 45A.690 to 45A.725; (b) Determine the professional development programs for which teachers
may receive reimbursement, or districts or colleges and universities may receive grants, from the fund;
(c) Determine the level of stipend or reimbursement, subject to the availability of appropriated funds, for particular courses and programs, under subsection (2) of this section; and
(d) Provide an accounting of fund expenditures and results of the use of the funds for each biennium to the Interim Joint Committee on Education by November 1 of each odd-numbered year.
(5) The professional development programs approved by the Department of Education for which teachers may receive support from the fund shall: (a) Focus on improving the content knowledge of teachers; (b) Provide training in the use of research-based and developmentally
appropriate classroom-based screening, diagnostic, assessment, and intervention strategies;
(c) Provide instruction on teaching methods to effectively impart content knowledge to all students;
(d) Include intensive training institutes and workshops during the summer; (e) Provide programs for the ongoing support of teacher participants throughout
the year, which may include: 1. A peer coaching or mentoring, and assessment program; and 2. Planned activities, including:

179
a. Follow-up workshops; and b. Support networks of teachers of the core disciplines
using technologies, including but not limited to telephone, video, and on- line computer networks;
(f) Provide teacher participants with professional development credit toward renewal of certification under the provisions of KRS 161.095, relating to continuing education for teachers; and
(g) Provide teacher participants with the opportunity to obtain certificate endorsements or extensions in critical shortage areas, with priority given to mathematics and science through 2016, and in core content areas to their existing certifications through the TC-HQ process, established by the Education Professional Standards Board to meet the requirements of the No Child Left Behind Act of 2001, 20 U.S.C. sec. 6301 et seq.
(6) The Kentucky Board of Education shall specify through promulgation of administrative regulations: (a) The application and approval process for receipt of funds; (b) The requirements and process for the disbursal of funds; and (c) The number of each kind of approved course for which applicants may
receive funds. (7) Notwithstanding any other provisions to the contrary, a local school board
may advance the funds necessary for its teachers to participate in a college course or professional development seminar or activity approved by the Kentucky Department of Education and the Education Professional Standards Board under provisions of this section and receive reimbursement from the department at the conclusion of the activity or course by the teacher. If funds are advanced for the benefit of a teacher under this subsection, but the teacher does not fulfill his or her obligation, the teacher shall reimburse the school district for the funds expended by the district on the teacher's behalf.
(8) Notwithstanding the provisions of KRS 45.229, unexpended funds in the teachers' professional growth fund in the 2000-2001 fiscal year or in any subsequent fiscal year shall not lapse but shall carry forward to the next fiscal year and shall be used for the purposes established in subsections (1) and (2) of this section.
(9) Notwithstanding any provisions of this section to the contrary, beginning June 1,
2006, through the 2009-2010 school year, priority for the use of funds from the teachers' professional growth fund shall be used to train and support teams of teachers from all school levels to be trained as reading coaches and mentors or as mathematics coaches and mentors in statewide institutes referenced in KRS 158.840 and 158.842, and for selected teachers to be highly trained in providing

180
diagnostic assessment and intervention services for students in the primary program struggling with mathematics. (a) The design of the statewide mathematics institutes to train
mathematics coaches and mentors shall be developed by the Committee for Mathematics Achievement established in KRS 158.842. The committee shall provide recommendations to the Kentucky Department of Education and the Kentucky Board of Education in the preparation of administrative regulations that may be promulgated by the board to implement the provisions of this subsection relating to mathematics.
(b) The design of the professional development program to provide highly trained mathematics intervention teachers in the primary program shall be developed by the Center for Mathematics in collaboration with public and private institutions of postsecondary education.
(c) The development of the statewide program to train reading coaches and mentors shall be coordinated by the Kentucky Department of Education with recommendations from the Collaborative Center for Literacy Development, established in KRS 164.0207, and the reading steering committee established in KRS 158.794. The design of the program shall reflect a consensus of the agencies involved in the development of the program. The training program for reading coaches and mentors shall complement other statewide reading initiatives, funded with state and federal funds, and shall give priority to teachers in grades four (4) through twelve (12). The program shall be implemented no later than June 1, 2006. The board shall promulgate administrative regulations required to implement the provisions of this subsection relating to reading.
(10) Notwithstanding any provision of this section to the contrary, beginning June 1,2010, through the 2015-2016 school year, priority for the use of funds from the teachers' professional growth fund shall be for the purpose of increasing the number of certified teachers with extensions or endorsements in mathematics and science as described in subsection (5)(g) of this section.
Effective: July 15, 2008 History: Amended 2008 Ky. Acts ch. 134, sec. 13, effective July 15, 2008; and ch.
185, sec. 2, effective April 24, 2008. -- Amended 2005 Ky. Acts ch. 164, sec. 5, effective March 18, 2005. -- Amended 2002 Ky. Acts ch. 135, sec. 4, effective April 2, 2002. - - Amended 2001 Ky. Acts ch. 135, sec. 1, effective June 21, 2001. -- Created 2000 Ky. Acts ch. 527, sec. 2, effective July 14, 2000.
Legislative Research Commission Note (7/15/2008). This section was amended by
2008 Ky. Acts chs. 134 and 185, which do not appear to be in conflict and have been codified together.

181
158.842 Definitions for KRS 158.840 to 158.844 -- Committee for Mathematics Achievement -- Membership, purposes, organization, staffing, and duties of committee -- Report to Interim Joint Committee on Education.
(1) As used in KRS 158.840 to 158.844, unless the context requires otherwise: (a) "Concepts" means mathematical ideas that serve as the basis for
understanding mathematics; (b) "Mathematics" means the curriculum of numbers and computations,
geometry and measurements, probability and statistics, and algebraic ideas; (c) "Mathematics coach" means a mathematics leader whose primary
responsibility is to provide ongoing support for one (1) or more mathematics teachers. The role of the coach is to improve mathematics teaching practices by working with teachers in their classrooms, observing and providing feedback to them, modeling appropriate teaching practices, conducting workshops or institutes, establishing learning communities, and gathering appropriate and useful resources;
(d) "Mathematics diagnostic assessment" means an assessment that identifies a student at risk of failure in mathematics or a student with major deficits in numeracy and other mathematical concepts and skills;
(e) "Mathematics intervention program" means an intensive instructional program that is based on valid research and is provided by a highly trained teacher to specifically meet individual students needs;
(f) "Mathematics leader" means any educator with a specialization in mathematics who: 1. Serves in a supervisory capacity, such as mathematics department
chair, school-based mathematics specialist, or district mathematics supervisor or coordinator; or
2. Regularly conducts or facilitates teacher professional development, such as higher education faculty or other mathematics teachers;
(g) "Mathematics mentor" means an experienced mathematics coach who typically works with beginning or novice teachers only. The responsibilities and roles of the mentor are the same as those of the coach;
(h) "Numeracy" means the development of the basic concepts which include counting, place value, addition and subtraction strategies, multiplication and division strategies, and the concepts of time, money, and length. To be numerate is to have and be able to use appropriate mathematical knowledge, concepts, skills, intuition, and experience in relationship to every day life;
(i) "Relationships" means connections of mathematical concepts and skills within mathematics; and

182
(j) "Skills" means actions of mathematics. (2) The Committee for Mathematics Achievement is hereby created for the purposes
of developing a multifaceted strategic plan to improve student achievement in mathematics at all levels of schooling, prekindergarten through postsecondary and adult. At a minimum the plan shall address: (a) Challenging curriculum that is aligned prekindergarten through
postsecondary, including consensus among high school teachers and postsecondary education faculty about expectations, curriculum, and assessment;
(b) Attitudes and beliefs of teachers about mathematics;
(c) Teachers' knowledge of mathematics; (d) Diagnostic assessment, intervention services, and instructional strategies; (e) Shortages of teachers of mathematics, including incentives to attract strong
candidates to mathematics teaching; (f) Statewide institutes that prepare cadres of mathematics leaders in local
school districts, which may include highly skilled retired mathematics teachers, to serve as coaches and mentors in districts and schools;
(g) Cohesive continuing education options for experienced mathematics classroom teachers;
(h) Closing the student achievement gap among various student subpopulations; (i) Curriculum expectations and assessments of students among the
various school levels, prekindergarten, primary, elementary, middle, and high school;
(j) Content standards for adult education centers providing mathematics curricula;
(k) Introductory postsecondary education mathematics courses that are appropriate to the wide array of academic programs and majors;
(l) Research to analyze further the issues of transition from high school or GED programs to postsecondary education mathematics; and
(m) The early mathematics testing program under KRS 158.803. Other factors may be included in the strategic plan as deemed appropriate by the committee to improve mathematics achievement of Kentucky students.
(3) In carrying out its responsibility under subsection (2)(f) of this section, the committee shall: (a) Design a statewide professional development program that includes
summer mathematics institutes at colleges and universities, follow-up, and school- based support services, beginning no later than June 1, 2006, to prepare teams of teachers as coaches and mentors of mathematics at all school levels to improve student achievement. Teachers shall receive

183
training in diagnostic assessment and intervention. The statewide initiative shall be funded, based on available funds, from the Teachers' Professional Growth Fund described in KRS 156.553. The design shall: 1. Define the curricula focus; 2. Build on the expertise of specific colleges and universities; 3. Place emphasis on mathematics concepts, skills and
relationships, diagnostic assessment, intervention services, and instructional strategies;
4. Identify quality control measures for the delivery of each institute; 5. Establish evaluation procedures for the summer institutes and the
other professional development components; 6. Provide updates and networking opportunities for coaches and
mentors throughout the school year; and 7. Define other components within the initiative that are necessary to
meet the goal of increasing student achievement in mathematics; (b) Require schools and districts approved to have participants in the
mathematics leader institutes to provide assurances that: 1. The district and schools have, or will develop, local
mathematics curricula and assessments that align with state standards for mathematics;
2. There is a local commitment to build a cadre of mathematics leaders within the district;
3. The district and participating schools will provide in-school support for coaching and mentoring activities;
4. The mathematics teachers are willing to develop classroom assessments that align with state assessments; and
5. Students who need modified instructional and intervention services will have opportunity for continuing education services beyond the regular school day, week, or year; and
(c) In addition to the conditions specified in paragraph (b) of this subsection, the committee shall make recommendations to the Kentucky Department of Education and the Kentucky Board of Education for criteria to be included in administrative regulations promulgated by the board which define: 1. Eligible grant recipients, taking into consideration how this
program relates to other funded mathematics initiatives; 2. The application process and review; 3. The responsibilities of schools and districts, including but not limited
to matching funds requirements, released or extended time for coaches and mentors during the school year, continuing education

184
requirements for teachers and administrators in participating schools, data to be collected, and local evaluation requirements; and
4. Other recommendations requested by the Kentucky Department of Education.
(4) The committee shall initially be composed of twenty-five (25) members as follows:
(a) The commissioner of education or his or her designee; (b) The president of the Council on Postsecondary Education or his or
her designee; (c) The president of the Association of Independent Kentucky Colleges
and Universities or his or her designee; (d) The executive director of the Education Professional Standards Board or
his or her designee; (e) The secretary of the Education and Workforce Development Cabinet or his
or her designee; (f) A representative with a specialty in mathematics or mathematics
education who has expertise and experience in professional development, especially with coaching and mentoring of teachers, from each of the nine (9) public postsecondary education institutions defined in KRS 164.001. The representatives shall be selected by mutual agreement of the president of the Council on Postsecondary Education and the commissioner of education;
(g) Two (2) adult education instructors selected by the vice president for Kentucky Adult Education;
(h) Two (2) elementary, two (2) middle, and two (2) high school mathematics teachers, appointed by the board of the statewide professional education association having the largest paid membership with approval from their respective local principals and superintendents of schools; and
(i) Three (3) school administrators, with one (1) each representing elementary, middle, and high school, appointed by the board of the statewide administrators' association having the largest paid membership with approval from their respective local superintendents of schools.
When the Center for Mathematics created under KRS 164.525 becomes operational, the executive director of the center shall be added to the committee, which shall then be composed of twenty-six (26) members. Appointments to the committee shall be made no later than thirty (30) days following March 18, 2005, and the first meeting of the committee shall occur no later than thirty (30) days following appointment of the members.
(5) A majority of the full membership shall constitute a quorum.

185
(6) Each member of the committee, other than members who serve by virtue of their positions, shall serve for a term of three (3) years or until a successor is appointed and qualified, except that the initial appointments shall be made in the following manner: six (6) members shall serve a one (1) year term, six (6) members shall serve a two (2) year term, and eight (8) members shall serve a three (3) year term.
(7) A temporary chair of the committee shall be appointed prior to the first meeting of the committee through consensus of the president of the Council on Postsecondary Education and the commissioner of education, to serve ninety (90) days after his or her appointment. Prior to the end of the ninety (90) days, the committee shall elect a chair by majority vote. The temporary chair may be a nominee for the chair by majority vote. Thereafter, a chair shall be elected each calendar year. An individual may not serve as chair for more than three (3) consecutive years. The chair shall be the presiding officer of the committee, and coordinate the functions and activities of the committee.
(8) The committee shall be attached to the Kentucky Department of Education for administrative purposes. The commissioner of education may contract with amathematics-trained professional to provide part-time staff support to the committee. The commissioner of education and the president of the council shall reach consensus in the selection of a person to fill the position. The person selected shall have a graduate degree, a mathematics major, and teaching or administrative experience in elementary and secondary education. The person shall not be a current employee of any entity represented on the committee. The department shall provide office space and other resources necessary to support the staff position and the work of the committee.
(9) The committee, under the leadership of the chair, may organize itself into appropriate subcommittees and work structures to accomplish the purposes of the committee.
(10) Members of the committee shall serve without compensation but shall be reimbursed for necessary travel and expenses while attending meetings at the same per diem rate promulgated in administrative regulation for state employees under provisions of KRS Chapter 45. Funds shall be provided school districts to cover the cost of substitute teachers for those teachers on the committee at each district's established rate for substitute teachers.
(11) If a vacancy occurs within the committee during its duration, the board of the statewide professional education association having the largest paid membership or the board of the statewide administrators association having the largest paid membership or the president of the Council on Postsecondary Education, as appropriate, shall appoint a person to fill the vacancy.
(12) The committee shall:

186
(a) Present a draft strategic plan addressing the requirements in subsection (1) of this section and other issues that arose during the work of the committee to the Education Assessment and Accountability Review Subcommittee no later than August 2005;
(b) Present the strategic plan for improving mathematics achievement to the Interim Joint Committee on Education by July 15, 2006, which shall include any recommendations that require legislative action; and
(c) Provide a final written report of committee activities to the Interim Joint Committee on Education and the Legislative Research Commission by December 1, 2006.
(13) The committee shall have ongoing responsibility for providing advice and guidance to policymakers in the development of statewide policies and in the identification and allocation of resources to improve mathematics achievement. In carrying out this responsibility, the committee shall periodically review the strategic plan and make modifications as deemed appropriate and report those to the Interim Joint Committee on Education.
(14) The committee shall collaborate with the Center for Mathematics to ensure that there is ongoing identification of research-based intervention programs for K-12 students who have fallen behind in mathematics, rigorous mathematics curricula that prepare students for the next level of schooling, research-based professional development models that prepare teachers in mathematics and pedagogy, and strategies for closing the gap between high school or GED and postsecondary mathematics preparation.
Effective: June 25, 2009 History: Amended 2009 Ky. Acts ch. 11, sec. 51, effective June 25, 2009. -- Amended
2006 Ky. Acts ch. 211, sec. 89, effective July 12, 2006. -- Created 2005 Ky. Acts ch. 164, sec. 2, effective March 18, 2005.
Legislative Research Commission Note (3/18/2005). 2005 Ky. Acts ch. 164, sec. 2, subsection (3), contained a reference to "subsection (1)(f) of this section." This reference should have been changed to "subsection (2)(f) of this section" when the Senate committee substitute inserted a new subsection (1). The Statute Reviser, under the authority of KRS 7.136, has made the change.

187
158.844 Mathematics achievement fund -- Creation -- Use and disposition of moneys -- Administrative regulations -- Requirements for grant applicants -- Department to provide information to schools and to make annual report to Interim Joint Committee on Education.
(1) The mathematics achievement fund is hereby created to provide developmentally appropriate diagnostic assessment and intervention services to students, primary through grade 12, to help them reach proficiency in mathematics on the state assessments under KRS 158.6453 and in compliance with the "No Child Left Behind Act of 2001," 20 U.S.C. secs. 6301 et seq., as required under KRS 158.840.
(2) The grant funds may be used to support the implementation of diagnostic and intervention services in mathematics. The use of funds may include: pay for extended time for teachers, released time for teachers to serve as coaches and mentors or to carry out other responsibilities needed in the implementation of intervention services, payment of substitute teachers needed for the support of mathematics teachers, purchase of materials needed for modification of instruction, and other costs associated with diagnostic and intervention services or to cover other costs deemed appropriate by the Kentucky Board of Education.
(3) The fund shall: (a) Provide funding for the Center for Mathematics created in KRS 164.525
and the costs of training selected teachers in the diagnostic assessment and intervention skills that are needed to assist struggling students in the primary program and other grade levels;
(b) Provide renewable, two (2) year local grants to school districts and for purposes described in subsection (2) of this section; and
(c) Provide operational funding for the Committee for Mathematics Achievement created in KRS 158.842.
(4) Any funds appropriated to the mathematics achievement fund that are specifically designated by the General Assembly to support the Center for Mathematics shall be appropriated to the Council on Postsecondary Education and distributed to the university administering the center, as determined by the council under KRS 164.525.
(5) Any moneys in the fund at the close of a fiscal year shall not lapse but shall be carried forward to be used for the purposes specified in this section.
(6) Any interest earnings of the fund shall become a part of the fund and shall not lapse. (7) (a) Any funds appropriated to the mathematics achievement fund and specifically
designated by the General Assembly as funding for grants to local school
188
districts or to support the Committee for Mathematics Achievement shall be administered by the Kentucky Department of Education.
(b) The Kentucky Board of Education shall promulgate administrative regulations relating to the grants for local school districts based on recommendations from the Committee for Mathematics Achievement, the secretary of the Education and Workforce Development Cabinet, the commissioner of education, and the Center for Mathematics established in KRS 164.525. The administrative regulations shall: 1. Identify eligibility criteria for grant applicants; 2. Specify the criteria for acceptable diagnostic assessments
and intervention programs and coaching and mentoring programs; 3. Establish the minimum annual evaluation process for each
grant recipient; 4. Identify the annual data that must be provided from each grant recipient; 5. Define the application and approval process; 6. Establish matching fund requirements if deemed necessary by the board; 7. Define the obligations for professional development and
continuing education for teachers, administrators, and staff of each grant recipient;
8. Establish the conditions for renewal of a two (2) year grant; and 9. Specify other conditions necessary to implement the purposes of
this section. (c) As part of the application process, the board shall require that a
grant applicant provide assurances that the following principles will be met if the applicant's request for funding is approved: 1. Mathematics instruction will be standards-based and utilize
research- based practices; 2. Intervention and support services will supplement, not replace,
regular classroom instruction; and 3. Intervention services will be provided to primary program students
and other students who are at risk of mathematics failure within the school based upon ongoing assessments of their needs.
(d) If matching funds are required, the school council or, if none exists, the principal or the superintendent of schools, shall allocate matching funds. Funding for professional development allocated to the school council under KRS 160.345 and for continuing education under KRS 158.070 may be used to provide a portion or all of a school's required match.
(e) The Department of Education shall make available to schools:

189
1. Information from the Center for Mathematics regarding diagnostic assessment and intervention programs and coaching and mentoring programs of proven-practice in meeting the needs of primary students and other students who are at risk of failure;
2. Technical assistance to potential applicants and grant recipients; 3. A list of professional development providers offering teacher training
in diagnostic assessment and intervention strategies and coaching and mentoring; and
4. Information from the Center for Mathematics on how to communicate to parents effective ways of interacting with their children to improve their mathematics concepts, skills, and understanding.
(f) The Department of Education shall submit a report to the Interim Joint Committee on Education no later than September 1 of each year outlining the use of grant funds. By November 1, 2007, the Department of Education with input from the Committee for Mathematics Achievement and the Center for Mathematics shall conduct a statewide needs assessment of the resources needed in each school to help each child achieve proficiency in mathematics by the year 2014 and report to the Interim Joint Committee on Education an estimate of the cost and a specific timeline for meeting the goal established by the Commonwealth.
Effective: June 25, 2009 History: Amended 2009 Ky. Acts ch. 11, sec. 52, effective June 25, 2009. -- Created
2005 Ky. Acts ch. 164, sec. 3, effective March 18, 2005. Legislative Research Commission Note (3/18/2005). 2005 Ky. Acts ch. 164, sec.
3, contained three references to the Mathematics Achievement Committee. The correct name for this entity is the Committee for Mathematics Achievement. The Statute Reviser, under the authority of KRS 7.136, has changed these references to be consistent with sec. 2 of this Act, which created the Committee for Mathematics Achievement and was codified as KRS 158.842.
2010-2012 Budget Reference. See State/Executive Branch Budget, 2010 (1st Extra.
Sess.) StateKy. Acts ch. 1, Pt. I, C, 3, (16) at 21.

190
164.525 Center for Mathematics -- Creation, duties, and location.
(1) The Center for Mathematics is hereby created to make available professional development for teachers in reliable, research-based diagnostic assessment and intervention strategies, coaching and mentoring models, and other programs in mathematics. The center shall be headed by an executive director and administered by a public postsecondary education institution. The center shall: (a) Act as a clearinghouse for information about professional
development programs for teachers that address mathematics diagnostic assessment, intervention programs, coaching and mentoring programs, and other instructional strategies to address students' needs;
(b) Collaborate with Kentucky's other public and private postsecondary institutions to develop teachers' mathematical knowledge needed for teaching and help teachers improve students' mathematical concepts, thinking, problem-solving, and skills, with an emphasis on diagnostic assessment and intervention programs for students in the primary program;
(c) Provide teacher training to develop teacher leaders and teaching specialists in primary programs who have skills in diagnostic assessment and intervention services to assist struggling students or those who are at risk of failure in mathematics. The center may contract for services in order to carry out this responsibility;
(d) Maintain a demonstration and training site for mathematics located at each of the public universities;
(e) Advise the Kentucky Department of Education and Kentucky Board of Education regarding:
1. Early mathematics content, diagnostic assessment practices, and intervention programs;
2. Costs and effectiveness of various mathematics intervention programs; 3. Coaching and mentoring models that help improve
student achievements; 4. Trends and issues relating to mathematics programs in
schools throughout the state; and 5. The establishment and implementation of the Middle School
Mathematics and Science Scholars Program established under KRS 158.848; and
(f) Disseminate information to teachers, administrators, and policymakers on an ongoing basis.

191
(2) The Council on Postsecondary Education shall select a location for the center no later than January 1, 2006. The council shall use a request for proposal process. In developing the request for proposal, the council shall seek advice from the Committee for Mathematics Achievement created in KRS 158.842 and the commissioner of education. The center shall be located at the selected university through July 1, 2011, unless funding is not available, the council deems the performance of the institute to be inadequate, or the university requests to discontinue its relationship to the institute. Contingent upon available funding at the end of the initial cycle, and each five (5) year period thereafter, the council shall issue a request for proposal to all public postsecondary education institutions to administer the center.
Effective: July 15, 2008 History: Amended 2008 Ky. Acts ch. 134, sec. 21, effective July 15, 2008. -- Created
2005 Ky. Acts ch. 164, sec. 4, effective March 18, 2005. Legislative Research Commission Note (3/18/2005). 2005 Ky. Acts ch. 164, sec.
4, contained one reference to the Mathematics Achievement Committee. The correct name for this entity is the Committee for Mathematics Achievement. The Statute Reviser, under the authority of KRS 7.136, has changed this reference to be consistent with sec. 2 of this Act, which created the Committee for Mathematics Achievement and was codified as KRS 158.842.

192
APPENDIX B:
Learning Mathematics for Teaching (LMT) Released Items
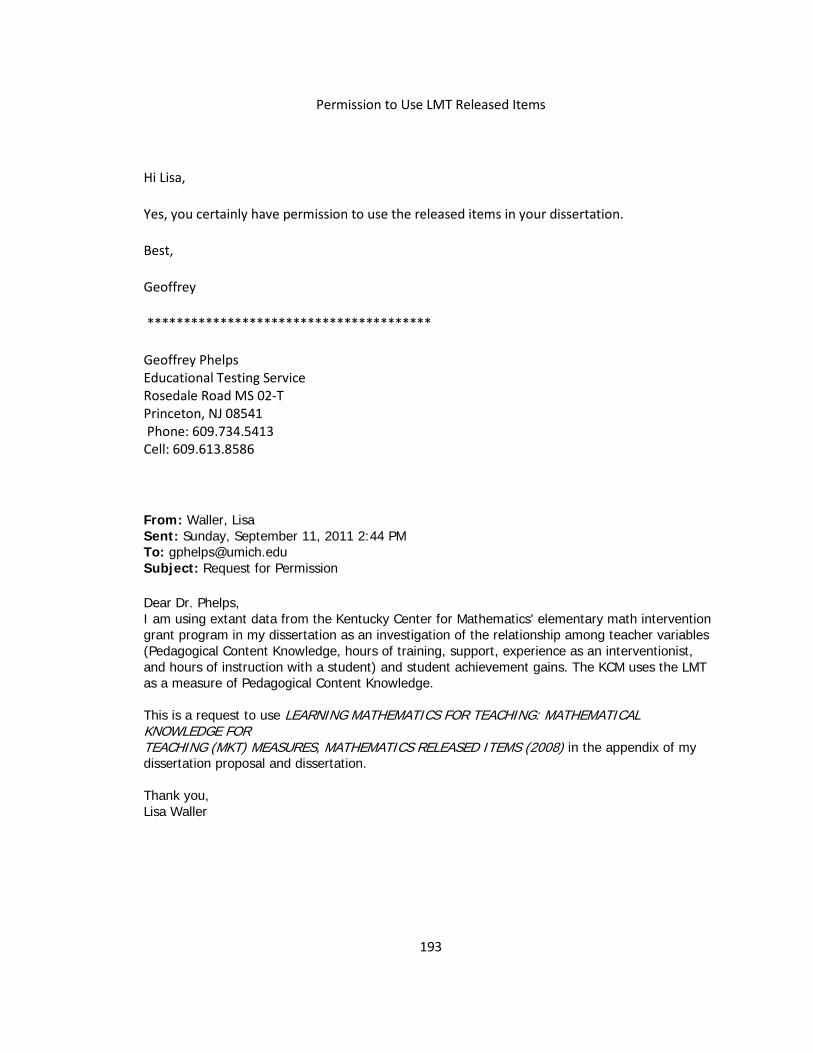
193
Permission to Use LMT Released Items
Hi Lisa,
Yes, you certainly have permission to use the released items in your dissertation.
Best,
Geoffrey
***************************************
Geoffrey Phelps Educational Testing Service Rosedale Road MS 02-T Princeton, NJ 08541 Phone: 609.734.5413 Cell: 609.613.8586
From: Waller, Lisa Sent: Sunday, September 11, 2011 2:44 PM To: [email protected] Subject: Request for Permission
Dear Dr. Phelps, I am using extant data from the Kentucky Center for Mathematics' elementary math intervention grant program in my dissertation as an investigation of the relationship among teacher variables (Pedagogical Content Knowledge, hours of training, support, experience as an interventionist, and hours of instruction with a student) and student achievement gains. The KCM uses the LMT as a measure of Pedagogical Content Knowledge. This is a request to use LEARNING MATHEMATICS FOR TEACHING: MATHEMATICAL KNOWLEDGE FOR TEACHING (MKT) MEASURES, MATHEMATICS RELEASED ITEMS (2008) in the appendix of my dissertation proposal and dissertation. Thank you, Lisa Waller

194

195

196

197

198
Note. These sample released items from the Learning mathematics for Teaching test were used by permission of Geoffrey Phelps, Educational Testing Service, Rosedale Road MS 02-T, Princeton, NJ 08541. Permission received September 12, 2011.

199
APPENDIX C:
Kentucky Center for Mathematics MIT Handbook

200
Mathematics Intervention Teacher Handbook
August 2010

201
Mission Statements
Drawing on the expertise and research of mathematics educators and mathematicians, the Kentucky Center for Mathematics supports diverse teacher and student populations across the Commonwealth by facilitating the development of mathematical proficiency, power for future success, and enjoyment of teaching and learning mathematics.
INTERVENTION
The goal of the state mathematics diagnostic intervention program is to expand the capacity of teachers to assess a child’s current status and adjust instruction accordingly.
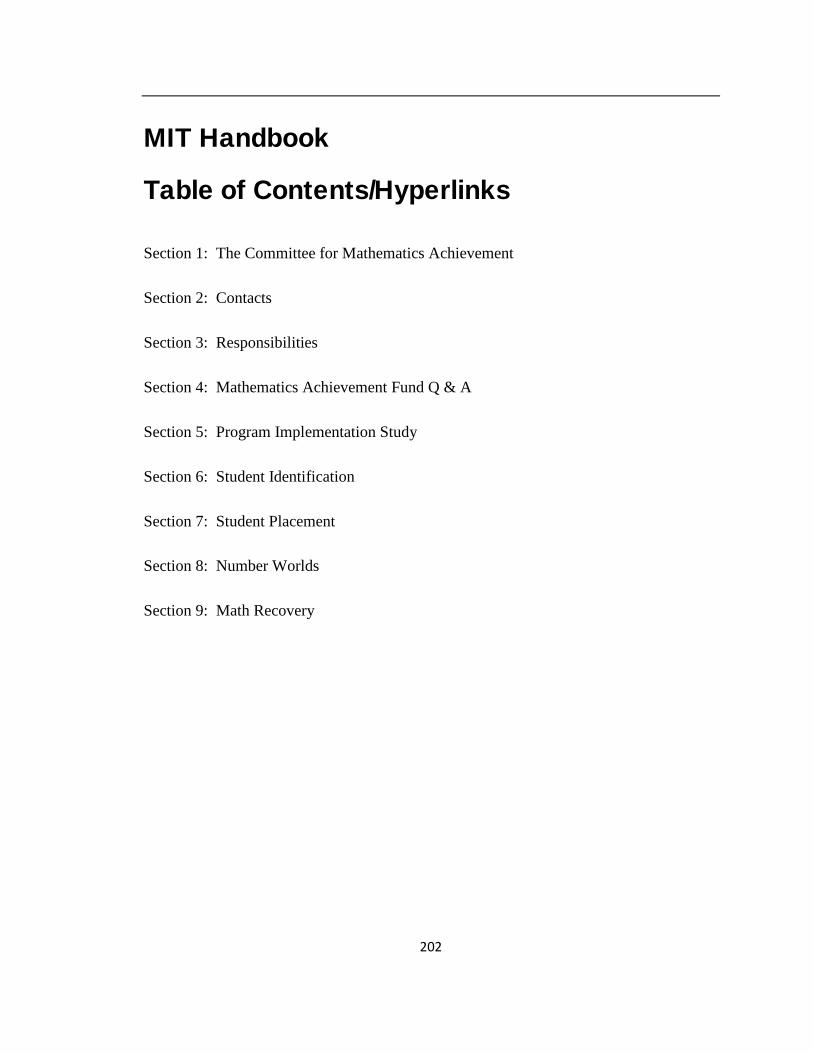
202
MIT Handbook
Table of Contents/Hyperlinks Section 1: The Committee for Mathematics Achievement
Section 2: Contacts
Section 3: Responsibilities
Section 4: Mathematics Achievement Fund Q & A
Section 5: Program Implementation Study
Section 6: Student Identification
Section 7: Student Placement
Section 8: Number Worlds
Section 9: Math Recovery

203
Section The Committee for Mathematics
Achievement 1
Edna Schack, Chairperson Wanda Weidemann, Co-Chairperson
Established by House Bill 93 “…create a new section of KRS Chapter 158 to establish the Committee for Mathematics
Achievement for purposes of developing a multi-faceted strategic plan to improve student
achievement in mathematics at all levels of schooling….”
In spring 2005, recognizing that mathematical proficiency is a gateway skill necessary for all Kentucky students to achieve their academic goals, the Kentucky Legislature passed House Bill 93 in support of mathematics teaching and learning in Kentucky. As part of the bill, the Committee on Mathematics Achievement (CMA Strategic Plan - Updated February 9, 2007) was formed and set the following four goals:
• Create a shared vision of high-quality mathematics instruction by enhancing the beliefs and attitudes of students, teachers, instructors, faculty, administrators, families and community members about mathematics.
• Enhance Pre-K through 16 teachers’ mathematics knowledge and ability to differentiate instruction to meet the needs of all students.
• Enhance the awareness and knowledge of Pre-K-12 teachers, adult educators, and postsecondary faculty regarding effective mathematics resources, including curriculum materials, intervention and remediation programs, and technology, and provide them the support necessary to use the resources effectively.
• Increase the number of Kentucky teachers with expertise in mathematics and mathematics teaching through aggressive recruitment programs and support-based retention strategies.

204
Section
Contacts 2 Kentucky Center for Mathematics
Contact for: Training, support, and research/assessments
Website: http://kentuckymathematics.org
Email: Alice Gabbard, [email protected] or Laura Bristol, [email protected]; Tomica Moeller, Data Specialist,
[email protected] ; Julia Sullivan, Budget Officer, [email protected]; Bill Nostheide, Technology Director/Centra,
Regional Coordinators
Contact for: Online meetings, in-person visits, regional collegial meetings, and school-based assistance
Cindy Aossey, University of Kentucky, [email protected]
Gwen Morgan, Kentucky Educational Development Cooperative, [email protected]
Linda Montgomery, Morehead State University, [email protected]
Linda Jewell, Kentucky State University, [email protected]
Mary Helen Hodges, Murray State University, [email protected]
Wilma Rogers, Western Kentucky University, [email protected]
Nancy Williams, Eastern Kentucky University, [email protected]

205
Kentucky Department of Education
Contact for: Grant compliance and Mathematics Achievement Fund (MAF) budget
Website: http://www.education.ky.gov/KDE/Default.htm
Email: for grant compliance, [email protected] and [email protected]; for budget
submission, [email protected] .
Math Recovery
Website: http://mathrecovery.org or http://kymath.org/intervention/mathrecovery.html
Email: Jenny Cobb, [email protected]; Petey MacCarty, [email protected] or Kurt Kinsey,

206
Section
Responsibilities 3
Kentucky Center for Mathematics Staff Responsibilities
Program Evaluation:
• Collect assessments and coordinate the implementation study to determine the effectiveness of the intervention programs as implemented (NOT to evaluate teachers).
MIT Support:
• Communicate with the KDE regarding the interpretation of Mathematics Achievement Fund (MAF) regulations.
• Provide training and ongoing support for MITs. Document training attendance for MAF compliance.
• Coordinate the leadership efforts of the Regional Coordinators.
Resource Development:
• Organize and create mathematics resources for use by MITs and other mathematics teachers.
Outreach:
• Collaborate with other state mathematics leadership organizations.
• Present Kentucky’s intervention initiatives at conferences, at regional meetings, and to legislators.
• Report to the Kentucky Department of Education, the Committee for Mathematics Achievement and the Council on Postsecondary Education.

207
Regional Coordinators’ Responsibilities
• Lead weekly online Centra meetings for level 1 MITs. Lead monthly (or more frequently, depending on
group consensus) online Centra meetings for level 2+ MITs.
• Visit MITs as needed, including orientation activities.
• Organize and lead three in-person regional collegial team meetings (CTMs) and one online CTM.
• Work with students to gain experience in program implementation.
• Network with other mathematics leaders in the region, especially with the regional coops, local councils
of teachers of mathematics, and the university.
• Apply to present/co-present at the annual state conferences: The Kentucky Council of Teachers of
Mathematics Annual Conference and the KCM Conference.
• Present KCM initiatives to regional groups.
• Share MIT resources with other RCs and with KCM staff via the KCM Forum.
• Host/facilitate KCM training.
• Assist with MIT training & develop expertise in the KCM programs.

208
Mathematics Intervention Teachers’ Responsibilities
• If your school receives Mathematics Achievement Funds (MAFs):
• Read the MAF grant requirements, your school’s grant proposal, and this handbook.
• Collaborate with your principal regarding decisions for spending the MAF. • Administer and submit student assessments as directed by KCM staff. • Prepare mid-year and end-of-year reports for the Kentucky Department of
Education, including a list of Mathematics Achievement Fund expenses.
• Complete MIT assessments/surveys as directed by KCM staff.
• Attend and fully participate in all required MIT trainings/meetings/conferences/visits. (This includes 3 Collegial Team Meetings, 2 Peer Visits, and online meetings – weekly for level 1 MITs and monthly for level 2+ MITs). New MITs will also be required to attend Add+Vantage MR 1 or the Math Recovery Intervention Specialist Course, in accordance to your school’s existing or modified grant proposal as approved by the KDE. Changes in the MAF plan should be cleared with the KDE. Please see flyers and registration links on the KCM Growth Opportunities webpage: http://kymath.org/intervention/iTraining.asp. Experienced MITs should complete a leadership activity of their choice: conference presentation, intervention guide submission, one-hour online symposium, facilitating an online study group, submitting video and handouts from a PD led at your school, etc. according to details to be released in early September 2010.
• Post a thoughtful comment on the KCM Forum each month.
• Collaborate with administrators in the student identification process.
• Obtain parental permission for participation in the intervention program and/or program evaluation.
• Collaborate with regular classroom teachers and/or share strategies to improve the mathematics instruction in all primary grades classrooms.
• Communicate with the KCM Regional Coordinator any problems, needs for support, or legitimate reasons for meeting absences.
• Involve families in the intervention program.

209
MAF decision making protocol:
1) Review the MAF grant regulations, your school proposal, and this handbook.
Make the decision if you are clear about all the rules. If you need further
clarification, go to #2 and/or #3.
2) Discuss the decision with your regional coordinator.
3) Email Alice Gabbard, Laura Bristol, and/or Joseph McCowan for assistance.
Consulting other MITs for advice is very appropriate for teaching and learning, but
may not be 100% reliable for interpretation of the complex grant guidelines and
requirements.

210
Administrators’ Responsibilities
• Provide support for the MIT, including:
o access to students who are struggling in mathematics o materials, including past MAF purchases o classroom space o time for administering assessments o acceptance of cutting-edge, daily lesson plans based on formative assessment o adequate time for lessons, video review (Math Recovery), and planning o appropriate group size o release time for the MIT to attend and fully participate in all required MIT
trainings/meetings/visits. (This includes 3 Collegial Team Meetings, 2 Peer Visits, and online meetings – weekly for level 1 MITs and monthly for level 2+ MITs). New MITs will also be required to attend Add+Vantage MR 1 or the Math Recovery Intervention Specialist Course, in accordance to your school’s existing or modified grant proposal as approved by the KDE. Changes in the MAF plan should be cleared with the KDE. Please see flyers and registration links on the KCM Growth Opportunities webpage: http://kymath.org/intervention/iTraining.asp.
o professional development resources, such as books and journal subscriptions o collaborative online meeting time with other MITs o opportunities for MIT sharing of strategies with other staff members o time for visiting/collaborating with the regular math classes o time for involving families
• Secure the Terra Nova tests (if chosen as your preferred KCM program success measure) at all times
except during administration
• Collaborate with the MIT in the identification of struggling students
For administrators at schools receiving Mathematics Achievement Funds (MAFs):
• Restrict the MIT assignment to primary grades mathematics teaching (no substitute teaching), at least
half of which must be direct service for struggling primary students
• Collaborate with the MIT in decisions regarding appropriate expenditures of the Mathematics
Achievement Funds (MAFs)
• Collaborate with the MIT in preparing the end-of-year report for the KDE
• (Financial Office) Submit quarterly budget reports and the next year’s annual budget to KDE ; work with
the MIT to prepare the annual budget request and submit to the KDE.

211
Section
Mathematics Achievement Fund 4 Answers to MIT grant questions from the Kentucky Department of Education This is a working document, written February 2007 and updated August 2009, and is subject to change as new situations and concerns are presented.
Part 1—Changes in the Grant Proposal
1.1 - May a school modify the proposed number of students to be served, in order to better fit the guidelines of the intervention program to be implemented? What is the correct procedure for requesting permission for the change?
1.2 - May a school pay a different amount for salary than was stated in the original budget proposal? What is the correct procedure for requesting permission for the change?
1.3 - May a school change the professional development plan as stated in the original grant proposal? What is the correct procedure for requesting permission for the change?
1.4 - May a school change the assessment plan as stated in the original grant proposal? What is the correct procedure for requesting permission for the change?
KDE: The answer is the same for the first four questions: "yes". The school/school district should send an email to [email protected] and [email protected] and copy [email protected] outlining why the original budget needs to

212
be changed. The KDE will either approve the request or request additional information.
Part 2—Submission of Reports
2.1 - Who is responsible for completing and submitting the Evaluation Reports to KDE?
KDE: The MIT may complete the Evaluation Reports to KDE or the district/school may designate some other person to complete the reports. The grant states the district may not use grant funds to hire someone other than the MIT to do this job.
2.6 - What is the purpose of the End-of-Year Evaluation?
KDE: To document overall yearly progress; to discover any adjustments that need to be made for the next year's program.
2.7 - When is the End-of-Year Evaluation due?
KDE: Early June
2.8 - For the year-end report to KDE, may the Terra Nova scores be sent as an addendum after the report due date?
KDE: The Terra Nova scores may be sent as an addendum after the report due date.
2.9 - Who is responsible for submitting quarterly budget reports?
KDE: There should be collaboration between the MIT, the school administrator and the district financial officer. The MIT should be sure the finance officer has all accurate information; i.e. receipts, purchase orders, etc. The official report is submitted by the district financial officer to [email protected] on a quarterly basis.

213
Part 3—Permitted Expenditures
3.1 - May grant funds be used to test all primary students if the test is used to identify the lowest students?
KDE: Yes, it is acceptable to use grant funds to test every primary student in order to identify the eligibility pool for the intervention program.
3.2 - May an MIT serve as a substitute teacher?
KDE: No, the MIT should not serve as a substitute since that would prevent him/her from working with the identified students in the intervention program.
3.3 - May grant funds be used to purchase food manipulatives for math activities?
KDE: No, grant money may not be used to purchase food for any reason. The school will need to use other funds for such purposes.
3.4 - May a school use the technology allowance ($5000 or 5 computers) for other types of technology hardware other than computers?
KDE: Schools may spend up to $5000 for the life of the grant on all technology hardware, including a maximum of 5 computers and other types of equipment. Schools may also use remaining 2008/2009 grant funds by September 30, 2009 to purchase additional technology items. The KDE will consider other individual requests for video equipment.
3.5 - Must computers purchased with grant funds be placed in the MIT’s classroom?
KDE: Yes, the computers must be placed in the MIT's classroom. If there is a time period when the identified intervention students are not using the computers, other students could be allowed to do work on them as long as the use does not decrease the value of the computers or time available for intervention students.
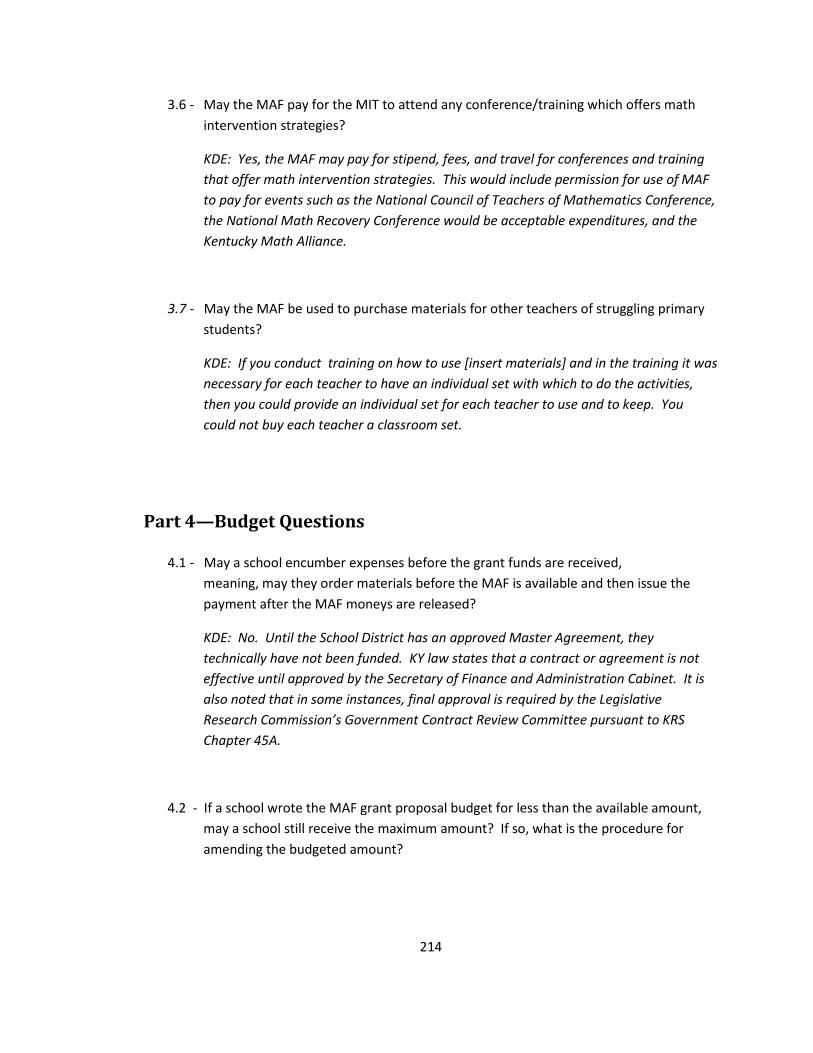
214
3.6 - May the MAF pay for the MIT to attend any conference/training which offers math intervention strategies?
KDE: Yes, the MAF may pay for stipend, fees, and travel for conferences and training that offer math intervention strategies. This would include permission for use of MAF to pay for events such as the National Council of Teachers of Mathematics Conference, the National Math Recovery Conference would be acceptable expenditures, and the Kentucky Math Alliance.
3.7 - May the MAF be used to purchase materials for other teachers of struggling primary students?
KDE: If you conduct training on how to use [insert materials] and in the training it was necessary for each teacher to have an individual set with which to do the activities, then you could provide an individual set for each teacher to use and to keep. You could not buy each teacher a classroom set.
Part 4—Budget Questions
4.1 - May a school encumber expenses before the grant funds are received, meaning, may they order materials before the MAF is available and then issue the payment after the MAF moneys are released?
KDE: No. Until the School District has an approved Master Agreement, they technically have not been funded. KY law states that a contract or agreement is not effective until approved by the Secretary of Finance and Administration Cabinet. It is also noted that in some instances, final approval is required by the Legislative Research Commission’s Government Contract Review Committee pursuant to KRS Chapter 45A.
4.2 - If a school wrote the MAF grant proposal budget for less than the available amount, may a school still receive the maximum amount? If so, what is the procedure for amending the budgeted amount?
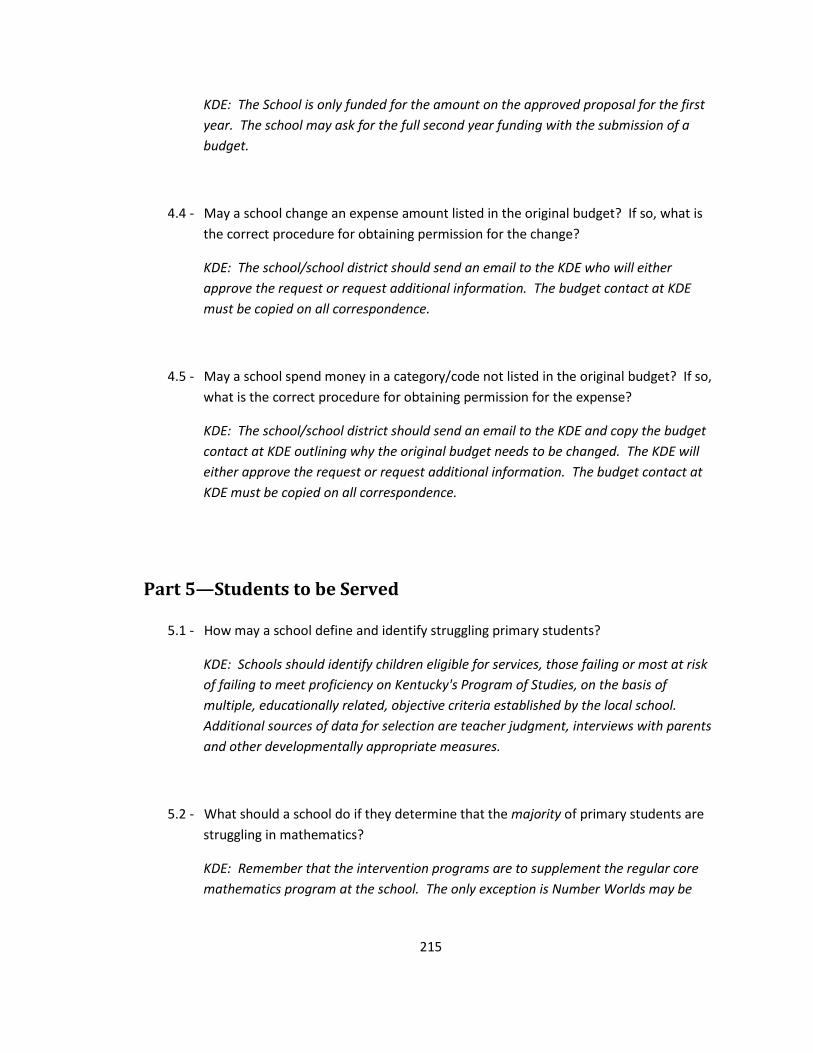
215
KDE: The School is only funded for the amount on the approved proposal for the first year. The school may ask for the full second year funding with the submission of a budget.
4.4 - May a school change an expense amount listed in the original budget? If so, what is the correct procedure for obtaining permission for the change?
KDE: The school/school district should send an email to the KDE who will either approve the request or request additional information. The budget contact at KDE must be copied on all correspondence.
4.5 - May a school spend money in a category/code not listed in the original budget? If so, what is the correct procedure for obtaining permission for the expense?
KDE: The school/school district should send an email to the KDE and copy the budget contact at KDE outlining why the original budget needs to be changed. The KDE will either approve the request or request additional information. The budget contact at KDE must be copied on all correspondence.
Part 5—Students to be Served
5.1 - How may a school define and identify struggling primary students?
KDE: Schools should identify children eligible for services, those failing or most at risk of failing to meet proficiency on Kentucky's Program of Studies, on the basis of multiple, educationally related, objective criteria established by the local school. Additional sources of data for selection are teacher judgment, interviews with parents and other developmentally appropriate measures.
5.2 - What should a school do if they determine that the majority of primary students are struggling in mathematics?
KDE: Remember that the intervention programs are to supplement the regular core mathematics program at the school. The only exception is Number Worlds may be

216
used as a prevention program for struggling students at the P1 and P2 levels (kindergarten and 1st grade) and for these students may be used as the core mathematics program. If a majority of students are struggling in mathematics, the MIT must use some other criteria to narrow down the list until the students who need the most intervention are being served first. As students are released from the program, others may be served. The MIT should model lessons and share strategies with the regular classroom teachers so they can work more successfully with the struggling students who have not received intervention services.
5.3 - Must an MIT serve students who have an Individual Education Plan (IEP) for mathematics and already receive specialized help from a special education teacher?
KDE: All students are eligible to receive intervention services based on established criteria. The intervention program can supplement special education services for those students identified as potentially benefiting from the program. An Admissions and Release Committee (ARC) would need to determine if the program is appropriate. On-going monitoring over time is needed to further determine if the student is truly benefiting. A special education student with math goals and objectives on the IEP can be served by this program and taught by the MIT with collaboration from the special education teacher as determined by the ARC. If a district has trained a special education teacher to meet certification requirements to teach the math intervention program, the teacher can serve as math teacher for both special and general education students for up to two blocks of instructional time.
5.4 - Must an MIT serve a student whose behavior is disruptive to other intervention students? Must the teaching assistant (if applicable) of a student with an IEP for behavior/emotional disorder assist the MIT during the mathematics intervention class?
KDE: Whether a MIT serves a student whose behavior is disruptive to the other students depends on the individual school's behavior policy and how it handles disruptive students in other classes. Whether a teaching assistant should assist the MIT working with a special needs student would depend on the student's IEP.
5.5 - Must an MIT serve all students in all grades, K—3, who are “having difficulty.” What is the definition of “having difficulty?”

217
KDE: All primary grades must receive some kind of services. The MIT can directly serve only a limited number of students. However, the MIT should work with the regular classroom teachers to share strategies, model lessons, and provide activities to be used in the regular classroom. "Having difficulty" is defined by the school's requirements for identifying eligible students and students selected to be served. The students selected should be the students most at risk to not reach proficiency.
5.6 - May a school use MAF grant funds to pay for a prevention program for all students in P1 and/or P2 (kindergarten and first grade)? Or is the MAF grant limited to paying for a prevention program only for struggling P1 and/or P2 students?
KDE: Grant funds may not be used for prevention for the entire P1/P2 population. However, if the program has a built-in prevention component, then it could be used as the core program for P1/P2 struggling students.
5.7 - Although the grant requirements state that the intervention program must supplement the core mathematics program, may a school use a “prevention” program to supplant, rather than supplement, the core math program for struggling K/1 students?
KDE: If the school is using Number Worlds, it could be used as the core math program for struggling K/1 students as a prevention program. This is the only time the intervention program can replace the core mathematics program.
5.8 - May the MAF be used to pay for an MIT to work with students outside the regular schedule? If so, which students may participate?
KDE: MAF money may pay the MIT to work after school, but only with identified struggling primary students that the MIT does not otherwise see during regular school hours. The MAF funds were not put in place to provide ESS services in general. Since there are frequently more students that need intervention than can be served, an MIT could have an additional intervention group outside school hours, but the service is restricted to identified struggling students who do not participate in mathematics intervention during the school day. Further, an MIT may only work with identified struggling primary students after school provided that the group time does not
218
interfere with a student's opportunity to attend ESS if they need tutoring in other subject areas.
5.9 - If a student receives intervention instruction directly from the MIT for 30 hours and has shown little or no progress, may an MIT permanently exit that student and allow the space for another struggling student?
KDE's position is that ultimately the school is responsible for making decisions about the best placement for students; however, students should not automatically be excluded from intervention services because they have special needs.
Part 6—Other Grant Implementation Questions
6.1 - When will a KDE representative visit the MIT’s classroom?
KDE: At least once a year, depending on the KDE’s ability to fund travel.
6.2 - What will the KDE representative look for when visiting the MIT’s classroom?
KDE: Implementation of the program; documentation of expenditures; process of identifying students and evidence of progress. A Visitation Checklist with more details will be sent to the MIT before the visit.
6.4 - Since the original grant proposal was successful, may a school assume that all parts of the plan are acceptable and legal?
KDE: No. KDE staff must review grants and budgets. Amendments will be required for areas of noncompliance.
6.5 - Is a school required to provide separate classroom space for the intervention program?
KDE: Yes, the MIT should have a separate classroom for the intervention program.

219
6.6 - Should a school hire a substitute intervention teacher if an MIT is absent for either short or long-term?
KDE: It is highly recommended that a substitute be hired when the MIT is absent due to the importance and value of the program. The MIT should have plans prepared for any scheduled absences and should have a set of plans/activities available for unexpected absences. A long-term substitute would need to receive training to implement the intervention program to its fullest intent.
6.7 - If an MIT must be replaced during the school year, how should the new MIT become highly trained?
KDE: KCM may consult on the training options, such as through the Regional Coordinator or through the company’s training leader(s).
6.8 - May teachers other than the MIT teach the primary mathematics intervention program for struggling students?
KDE: No. The mathematics intervention and diagnostic assessment program is to be taught by a highly trained and highly qualified mathematics intervention teacher. Teachers who have received professional development training from the MIT can implement the strategies in the classroom but not teach the intervention program.
6.9 - May an administrator assign an MIT to be a reader/scribe during CATS testing?
KDE: In an ideal world, the MIT would be able to use the testing time to administer the required KCM assessments and/or to continue intervention teaching with P1-P3. However, it may be necessary for the MIT to serve as a reader/scribe during CATS testing. It is ultimately an individual school decision.
6.10 - May an administrator replace an experienced MIT in order to reduce the required salary payment?
KDE: An administrator may replace the MIT if she/he feels it is best for the program. However, the value of experience should be taken into consideration. Also, the cost of training the new MIT would not be paid by the Center and would be the

220
responsibility of the school and/or grant. This could offset the expected savings in salary. Also, consider that the MIT salary will have to be paid either from the MAF or from the school’s general fund, so there is essentially a net loss to the school (due to the additional re-training expense) for reassigning/replacing an experienced MIT.
6.11 - If an MIT leaves a school, who should keep the kits/materials that were purchased with MAFs?
KDE: If an MIT leaves the school, the kits/materials must stay with the school.
6.12 – Must an MIT order Number Worlds workbooks if they are implementing the Number Worlds program?
KDE: The workbooks are optional.

221
Section
Program Implementation Study 5
KCM’s intent is to measure the effectiveness of the programs as implemented.
• If you teach Number Worlds, please refer to the implementation guide on the KCM/intervention/resources webpage. The hypothesis is that students of teachers who have the highest fidelity may have lower achievement gains than the students of teachers who modify as needed.
• Program fidelity of implementation by MITs selected by KCM researchers for student testing during the KCM 2010/2011 school year study will be measured in order to correlate the implementation decisions with the student achievement results. Results will remain confidential and MITs will not be evaluated regarding individual job performance. MITs in the study using Number Worlds and/or Add+Vantage MR (and not Math Recovery) will receive 2 fidelity visits from regional coordinators during the 2009/2010 school year. MITs in the study who teach video-taped Math Recovery lessons will be asked to submit video-taped lessons for fidelity review.
• There will be no teacher accountability for implementation decisions. Fidelity measures will be confidentially linked to student performance, but not to individual teachers.
*Results of observations and interviews will be reported without identifying schools
or teachers.
Data Reporting
There are two options for data reporting in 2010/2011.
1) Schools may choose to share existing tracking data (for example, GMADE, MAP, or other assessment scores) for all K-5 students (by student number only) in the fall,

222
mid-year, and spring. If a school only assesses students mid-year and in the spring, the previous year’s spring score may be used in place of the fall score.
2) If a school is not able or prefers not to release existing data, the KCM will provide Terra Nova test booklets for testing of current intervention students and a group of an equal number of comparison students in the fall and in the spring (also mid-year as students may be beginning or exiting intervention).
To meet MAF grant requirements, a letter stating the type of student assessment data each school will be providing to the KCM must be received from each grant recipient. The letter (on school letterhead) may be signed by either the principal of the school or the district assessment coordinator, addressed to the KCM Executive Director, Dr. Kirsten Fleming, and sent to the Kentucky Center for Mathematics.
Examples:
Option 1 (submit school’s tracking data) sample:
[Northside Elementary School] will send [MAP] mathematics data in electronic format for K-5 students to the KCM for the purpose of monitoring mathematics intervention student progress. This data will be stripped of student names and will be provided at the end of September, January, and May. The school will also submit supplemental, confidential student details as requested by the KCM (i.e. the Dates of Record).
Option 2 (give the Terra Nova) sample:
[Northside Elementary School] will administer the mathematics segment of the Terra Nova to intervention students and a comparison/control group of students equal in number in September and May and to any intervention students who may begin or end intervention mid-year. Further, [NES] will send the completed test booklets to the KCM for scoring immediately after administration. The school will also submit supplemental, confidential student details as requested by the KCM (i.e. the Dates of Record).
It is important that we receive your letter by August 18th.
223
Section
Student Identification 6
• KCM has developed an assessment list that may be helpful to schools wanting to identify struggling students. The website is: http://kymath.org/docs/kcm/AssessmentListnov132006.xls. You may also be interested in seeing the supplemental program ratings from experienced MITs: http://kymath.org/docs/2010/ResourceEvaluationJun2010.pdf.
• Schools will decide on the recommendation/assessment process for determining which students will receive intervention services.
• Many schools use the GMADE, MAP, or other assessments for identification of struggling students, but that is optional.
• Grant funds will pay for the assessments for all students, provided the purpose of the test is to identify struggling primary students. If you choose to purchase booklets and scoring for Terra Nova, you will have faster, more comprehensive results which may supplant the KCM testing requirement.
• Number Worlds and Math Recovery each contain a screening interview and diagnostic interviews that can be used (alone or in conjunction with other assessments) to identify struggling primary students.
• Students exit Math Recovery after receiving 40 to 60 lessons. Students may exit Number Worlds if they score 75% or higher on the placement tests of untaught units or if the MIT gathers other evidence (GMADE, MAP, Number Worlds unit/comprehensive test etc.) of student progress that indicates no further intervention is needed.
• If your KCM data choice is Terra Nova, that test will be administered to selected intervention students at the beginning of the school year and will not be scored quickly enough for use in identifying struggling students who need intervention services.
• Keep in mind that at the beginning of the school year many students may score low on that grade--level test because they have not yet been taught that grade—level content. A lower-level assessment (or results from the previous spring) may give the best indication of which students have not mastered the previous grade—level content.

224
• Once intervention students are identified, schools should send home media release forms and permission slips for parents to give their consent for their children to receive intervention services and participate in diagnostic interviews. These permissions slips are posted on the Intervention Resources webpage.
Section
Student Placement 7
Math Recovery, Add+Vantage MR, or SNAP (Student Numeracy Assessment Progressions) lessons are designed to fit the student’s zone of proximal development for number, based on their developmental level as determined through student interviews.
Most intervention students in Number Worlds are placed according to grade level (into content that is below grade level):
K—Level B (1 book), prevention
1st—Level C (1 book), prevention
2nd—Level D (6 units), intervention
3rd—Level E (6 units), intervention
However, Number Worlds placement tests may be given to further determine the best units and level for each specific child. Scores of 75% and higher indicate that a student does not need that unit. The MIT should use professional judgment in ultimately deciding the best placement for each intervention student. Although individualized placement may be a scheduling challenge, most teachers appreciate that student need is the first priority.
Number Worlds author, Sharon Griffin, offered an alternate, optional method of determining proper placement in the Number Worlds program, based on the results of the Number Knowledge Test:
Score of 3—4 years place in level A
Score of 4—5 years place in level A (or B, if close to ceiling)
Score of 5—6 years place in level B (or C, if close to ceiling)
Score of 6—7 years place in level C (or D, if close to ceiling)

225
Score of 7—8 years place in level D (or E, if close to ceiling)
Score of 8—9 years place in level E
Section
Number Worlds 8
Recommended group size: 5 students
Recommended lesson length: 45 minutes to one hour per day
Recommended computer time for Building Blocks/eMath Tools software: 10 to 20 minutes per day
Students may exit after one unit or continue the program indefinitely.
Students may not be pulled from the regular math class.
Levels A—C are for “prevention” and may supplant the core curriculum for struggling students (typically this is K/1), if the school concludes that the Number Worlds prevention levels will fully prepare struggling students for second grade mathematics. Most of our schools are using levels A—C as a supplemental to the regular core program.
Levels D and E are for supplemental “intervention” and may not supplant the core curriculum for struggling students (typically this is grades 2 and 3). Struggling students may not be pulled during regular math class.
Number Worlds author Sharon Griffin has enlisted Kentucky MITs to pilot revised units for Levels D and E (Patterns, Addition, Subtraction) and has recommended that they skip the week on Perimeter in the Geometry units. The KCM will supply copies of pilot units for $20 per level.
See the KCM/Intervention/Resources webpage for sample schedules and an implementation guide.

226
Section
Math Recovery 9
One-on-one instruction and reflection of video allows for rigorous, in-depth teacher growth as well as most efficient targeted instruction for the student.
First grade students are taught one-on-one for 30 minutes per day. Each student requires 60-75 minutes per day of teaching/reflection/planning time.
Students exit intervention after 30 hours (60 lessons) or less of intervention instruction.
All lessons are videotaped for review by the MIT for daily planning and for sharing during Collegial Team Meetings.
MITs may teach small groups of students in addition to the one-on-one sessions.
Teachers use an instructional framework to plan lessons.
Lessons are focused on developing number concepts (quantity sense) and skills (automaticity).
MITs may visit primary classrooms and collaborate with primary teachers in improving the mathematics program.
Students may not be pulled during the regular math class.
After becoming a certified specialist the MIT may become an official Add+Vantage Math Recovery Champion and a SNAP Facilitator, certified to train other primary classroom teachers. After year—two the MIT may become a Math Recovery Leader who is certified to train Math Recovery Intervention Specialists.
See sample schedules on the KCM/intervention/Resources webpage.
227
APPENDIX D:
Parental Permission for Intervention and Terra Nova Assessment

228
Mathematics Intervention Notice
Part 1
Dear Parent or Guardian,
If you consent, your child will be participating in a math intervention program during some or all of the 2009/2010 school year. This program will be taught by a teacher who has special training in helping students who need extra help. This teacher will talk with you about your child’s progress.
Your child’s intervention class may be observed by persons from the Kentucky Center for Mathematics who will be checking how the program is implemented. Student behaviors will be observed only to determine how the statewide success is related to the intervention instruction. During these observations no data will be collected from individual students.
If you want your child to participate in this program, please sign below and return this form to your child's teacher.
I want my child to participate in this program.
X__________________________________________________________________
Child’s Name______________________________________Date________________
If you have any questions or concerns we ask that you please contact Philip J. Moberg, Ph.D.,Chair of the Institutional Review Board, Northern Kentucky University at (859) 572-1913/email: [email protected] or Kirsten Fleming, Ph.D., Executive Director of the Kentucky Center for Mathematics at (859)572-7690/email: [email protected]

229
Media Release
Part 2
If you allow your child to participate in this program there is a chance that he/she may be videotaped. This will allow the teacher to observe student thinking as well as their own teaching skills. These videotapes, as well as photos and work samples from your child, may be viewed by others involved in the program.
I will allow my child to be videotaped during math classes and for these videotapes to be shared with other persons involved in the program and/or in professional presentations. Additionally, these videotapes may be analyzed for professional/scholarly articles. Your child’s identity will be protected.
My child’s photo can be posted, anonymously, on the Kentucky Center for Mathematics website and shared during teacher training sessions, with other persons involved in the program, during professional presentations and/or in professional articles.
My child’s written work can be posted, anonymously, on the Kentucky Center for Mathematics website and shared during teacher training sessions, with other persons involved in the program, during professional presentations, and/or in professional articles. Your child’s identity will be protected.
If you agree to all of the above statements, please sign your name below and return this form to your child's teacher.
X__________________________________________________________________
Child’s Name______________________________________Date________________
If you have any questions or concerns we ask that you please contact Philip J. Moberg, Ph.D.,Chair of the Institutional Review Board, Northern Kentucky University at (859) 572-1913 or [email protected]
.
230
APPENDIX E:
Institution Review Board Certificate

231
NOTICE OF IRB EXEMPTION STATUS Protocol Number: 12-008
Institutional Review Board IRB00002836, DHHS FWA00003332
Principal Investigator: Lisa Denise Ivey Waller Faculty Advisor: Dr. James Rinehart Project Title: Effect of Mathematics Intervention Teachers' Pedagogical Content
Knowledge on Student Achievement Exemption Date: 8/5/2011 Approved by: Dr. Matthew Winslow, IRB Member This document confirms that the Institutional Review Board (IRB) has granted exempt status for the above referenced research project as outlined in the application submitted for IRB review with an immediate effective date. Exempt status means that your research is exempt from further review for a period of three years from the original notification date if no changes are made to the original protocol. If you plan to continue the project beyond three years, you are required to reapply for exemption. Principal Investigator Responsibilities: It is the responsibility of the principal investigator to ensure that all investigators and staff associated with this study meet the training requirements for conducting research involving human subjects and follow the approved protocol. Adverse Events: Any adverse or unexpected events that occur in conjunction with this study must be reported to the IRB within ten calendar days of the occurrence. Changes to Approved Research Protocol: If changes to the approved research protocol become necessary, a description of those changes must be submitted for IRB review and approval prior to implementation. If the changes result in a change in your project’s exempt status, you will be required to submit an application for expedited or full IRB review. Changes include, but are not limited to, those involving study personnel, subjects, and procedures. Other Provisions of Approval, if applicable: None Please contact Sponsored Programs at 859-622-3636 or send email to [email protected] or [email protected] with questions.
Graduate Education and Research Division of Sponsored Programs
Institutional Review Board
Jones 414, Coates CPO 20 521 Lancaster Avenue
Richmond, Kentucky 40475-3102 (859) 622-3636; Fax (859) 622-6610
http://www.sponsoredprograms.eku.edu EASTERN KENTUCKY UNIVERSITY
Serving Kentuckians Since 1906

232
VITA
Lisa Ivey Waller was born in Dayton, Ohio on April 12, 1960. Her maiden name
was Lisa Denise Ivey. She attended schools in Kentucky and Tennessee, graduating in
May 1977 from Madisonville North Hopkins High School in Madisonville, Kentucky. In
May 1981, she graduated from Lipscomb University in Nashville, Tennessee and
received the degree of Bachelor of Science in elementary education. In May of 1984, she
received the degree of Master of Education in special education from Vanderbilt
University in Nashville Tennessee. In May 2012, she received the degree of Doctor of
Education in education leadership and policy studies from Eastern Kentucky University
in Richmond, Kentucky.
Lisa Ivey Waller is currently employed as an educational diagnostician and
cognitive coach with Shelby County Public Schools in Shelbyville, Kentucky. She is a
resident of Lexington, Kentucky.
Top Related
Copyright © 2022 FDOKUMEN

