


Bahasa
Halaman
Hukum


INTELLIGENT ENERGY CONSERVATION SYSTEM
BASED ON A LIGHTING CONTROL SYSTEM
BY
RAJI YEWANDE M
MATRIC NO: 138953
A PROJECT REPORT SUBMITTED TO THE DEPARTMENT OF
ELECTRICAL AND ELECTRONIC ENGINEERING, FACULTY OF
TECHNOLOGY, UNIVERSITY OF IBADAN
IN PARTIAL FULFILLMENT OF THE AWARD OF BACHELOR OF
SCIENCE (B.SC) DEGREE IN THE DEPARTMENT OF ELECTRICAL
AND ELECTRONIC ENGINEERING, UNIVERSITY OF IBADAN
NOVEMBER 2012
i
CERTIFICATION
This is to certify that the project upon which this report is based was carried out and
submitted by RAJI YEWANDE MARYAM, MATRICULATION NUMBER 138953, of the
Department Of Electrical And Electronics Engineering, Faculty of Technology, University of
Ibadan, Nigeria
PROJECT SUPERVISOR; DR O.A. FAKOLUJO
Signature and date ………………………………
HEAD OF DEPARTMENT: DR A. OLATUNBOSUN
Signature and date ………………………………

ii
ACKNOWLEDGEMENT
This project is a success with gratitude to GOD almighty. My parents, Brigadier
General and Mrs Raji for their immense support in my life and my education in the
University of Ibadan
I also would like to appreciate the support of my lecturers in the department of electrical
electronics especially my supervisor DR O.A FAKOLUJO.
I also appreciate my classmates and colleagues both past and present. God Bless You All

iii
DEDICATION
This project is dedicated to Almighty God.
iv
ABSTRACT
The importance of saving energy in recent times has proved to be paramount, to
sustain environmental conditions and factors as well as to improve cost of energy. The
intelligent conservation system as a proposed solution would help in curbing these factors.
Considering that lighting accounts for 20%-40% of a buildings energy budget. It is important
to find a way to manage these percentages and reduce the energy buildings consume by
implementing a lighting control system; intelligently controlled by a microcontroller.
A lighting control system can be implemented basically on three levels; artificial light
on/off, artificial light with external information, artificial light and day lighting with HVAC.
The control system applied in this project is artificial light control based on external
information. This information is measurement of external conditions within where the
lighting is situated such as ambient light and occupancy sensing. In measuring these
variables, the project makes use of 2 major sensors; Passive Infrared Sensor to sense
occupancy by motion detection, LDR sensor to sense ambient lighting conditions. These two
variables are the major inputs to the control system.
Using a microcontroller, the project sought to model the control system by
programming it and communicating the inputs of the sensors and controlling the output to the
lighting. Other components of the design are optocouplers used to isolate and separate the
mains power from the electronic circuit and also link them and a zero crossing detector as an
external interrupt that controls the dimming property of the system.
In the final analysis, the system proved to be efficient in conserving energy by
reducing power dissipated to the lighting and also reducing the hours used as it is only
activated by motion sensing.

v
TABLE OF CONTENTS
CERTIFICATION ................................................................................................................................... i
ACKNOWLEDGEMENT ...................................................................................................................... ii
DEDICATION ....................................................................................................................................... iii
ABSTRACT ........................................................................................................................................... iv
TABLE OF CONTENTS ........................................................................................................................ v
TABLE OF FIGURES .......................................................................................................................... vii
CHAPTER ONE ..................................................................................................................................... 1
INTRODUCTION .................................................................................................................................. 1
1.1 BACKGROUND .................................................................................................................... 1
1.2 PROBLEM STATEMENT ..................................................................................................... 2
1.3 AIM & OBJECTIVES ............................................................................................................ 2
1.4 METHODOLOGY ................................................................................................................. 3
1.5 JUSTIFICATION ................................................................................................................... 3
1.6 CONCLUSION ....................................................................................................................... 4
CHAPTER TWO .................................................................................................................................... 5
LITERATURE REVIEW ....................................................................................................................... 5
2.1. OVERVIEW ........................................................................................................................... 5
2.2. ENERGY CONSERVATION ................................................................................................ 5
2.3. END USER EFFIECIENCY ................................................................................................... 7
2.3.1. WHAT IS DEMAND RESPONSE? ............................................................................... 8
2.4. LIGHTING CONTROL SYSTEMS ..................................................................................... 10
2.4.1. LEVEL 1 (artificial lighting alone): .............................................................................. 11
2.4.2. LEVEL 2 (artificial lighting control based on external information): .......................... 12
2.4.3. LEVEL 3 (artificial lighting and daylight and HVAC system): ................................... 13
2.5. CONCLUSION ..................................................................................................................... 14
CHAPTER THREE .............................................................................................................................. 15
DESIGN ANALYSIS AND CONSTRUCTION .................................................................................. 15
3.1. OVERVIEW ......................................................................................................................... 15
3.2. DESIGN ANALYSIS ........................................................................................................... 15
3.3. REGULATED POWER SUPPLY ........................................................................................ 16
vi
3.3.1. Step Down Transformer ................................................................................................ 16
3.3.2. Rectifier ......................................................................................................................... 17
3.3.3. Filter .............................................................................................................................. 17
3.3.4. Regulator ....................................................................................................................... 17
3.4. PIR SENSOR ........................................................................................................................ 18
3.5. OPTOCOUPLER .................................................................................................................. 21
3.6. LDR SENSOR (LIGHT DEPENDENT RESISTOR) .......................................................... 22
3.7. ZERO CROSSING DETECTOR .......................................................................................... 22
3.8. MICROCONTROLLER ....................................................................................................... 23
3.9. CIRCUIT CONFIGURATION ............................................................................................. 24
CHAPTER FOUR ................................................................................................................................. 28
IMPLEMENTATION AND TESTING ................................................................................................ 28
4.1. OVERVIEW ......................................................................................................................... 28
4.2. CONSTRUCTION ................................................................................................................ 28
4.3. TESTING .............................................................................................................................. 28
4.4. CONCLUSION ..................................................................................................................... 33
CHAPTER FIVE .................................................................................................................................. 35
CHALLENGES, CONCLUSION AND RECOMMENDATION ........................................................ 35
5.1. CHALLENGES .................................................................................................................... 35
5.2. CONCLUSION ..................................................................................................................... 35
5.3. RECOMMENDATION ........................................................................................................ 36
APPENDIX A ....................................................................................................................................... 37
APPENDIX B ....................................................................................................................................... 43
APPENDIX C ....................................................................................................................................... 45
REFERENCES ..................................................................................................................................... 48
vii
TABLE OF FIGURES
Figure 2.1: LIGHTING CONTROL INTERGRATION ......................................................... 11
Figure 2.2: ARTIFICIAL LIGHTING ALONE ...................................................................... 12
Figure 2.3: ARTIFICIAL LIGHTINING BASED ON EXTERNAL INFORMATION ........ 13
Figure 2.4: ARTIFICIAL LIGHTING AND DAYLIGHT WITH HVAC SYSTEM ............ 14
Figure 3.1: BLOCK DIAGRAM ………………………………………………………….…15
Figure 3.2: POWER SUPPLY CIRCUIT ................................................................................ 16
Figure 3.3: LM7805 REGULATOR CHIP .............................................................................. 18
Figure 3.4: PIR SENSOR BLOCK DIAGRAM ...................................................................... 19
Figure 3.5: PIR WITH FRESNEL LENS ................................................................................ 19
Figure 3.6: FRESNEL LENS EFFECT ................................................................................... 20
Figure 3.7: OPTOCOUPLER WITH TRIAC .......................................................................... 21
Figure 3.8: LDR VOLTAGE DIVIDER CONFIGURATIONS ............................................. 22
Figure 3.9: PIN CONFIGURATION FOR PIC16F873A........................................................ 24
Figure 3.10: PROCESS FLOW CHART ................................................................................. 26
Figure 3.11: FULL CIRCUIT HARDWARE .......................................................................... 27
Figure 4.1: FULLY IMPLEMENTED CIRCUIT ................................................................... 33
Figure 4.2: FULL OUTPUT (LDR IS COVERED) ................................................................ 33
Table 1: DEPENDENCY FACTORS FOR SENSORS .......................................................... 31

1
CHAPTER ONE
INTRODUCTION
1.1 BACKGROUND
Energy is paramount in every aspect of human activity. The world today seeks to conserve
energy not only due to the declining nature of non-renewable resources but also a way to
tackle the environmental challenges that energy excesses have brought about especially
global warming; its health effects, carbon emissions and footprints, and the costs incurred due
to wastage.
In Nigeria today, a lot of energy is wasted because industries, power companies, offices and
households use more energy than is actually necessary to fulfil their needs. With energy
efficiency practices and products, the nation can save over 50% of the present energy
consumed in the country. The energy presently generated in our country could be sufficient
for the entire Nigerian population. (Uyigue, 2007)
The potential for energy savings in the Nigerian economy is huge, especially in the three
main energy demand sectors, namely household, industry and transportation. In the
household sector, there is considerable energy loss due to inefficient energy saving practices.
Similarly, there is considerable scope for energy conservation in the Nigerian industries.
Energy audit studies have shown that as much as twenty five per cent of industrial energy can
be saved through simple housekeeping measures. (Energy Commision for Nigeria, APRIL
2003)
2
Progress can begin immediately because knowledge and technology exist today to slash the
energy used in households, while at the same time improving levels of comfort. This would
be done by providing an energy conservation system in a typical household. This system is a
demand response incentive for individuals to be able to save energy in their homes.
1.2 PROBLEM STATEMENT
Conservation of energy is paramount in the world today. Households for example can
conserve energy with very little human intervention. They are the focal point of the project
because they have a higher demand for energy and a lot can be harvested from them and
thereby saving them cost and improving energy efficiency. Rooms such as kitchen, toilets
and bedrooms are areas seasonally in use and account for most of the wasted energy in a
typical household. The project seeks to implement an intelligent energy conserving system
lighting in a typical household.
1.3 AIM & OBJECTIVES
The aim of this project is to design a system which would allow energy efficiency in a
building using a demand response incentive that is: motion and occupancy sensors to control
usage of lighting systems
To achieve solution to the above stated problems, the following objectives have to be put in
place in order to achieve the desired result of the project. These are:
1. To study rooms in a building with high energy demand that are prone to wastage,
based on occupancy frequency and load analysis

3
2. To design a model that would implement the system’s operation
3. To program the microcontroller in the system to make it and intelligent system
4. To test and analyse the system
1.4 METHODOLOGY
To achieve the desired objectives, the intelligent energy conservation system would be
implemented in the following ways:
1. The system would be designed to be implemented in a typical household measured,
considering the power specifications, design requirements, circuit components and
microcontroller software.
2. The circuit would be designed and analysed using mathematical equations and circuit
design software
3. The components would then be acquired and configured for the system, the PIR
sensor, microcontroller, and power supply components
4. The acquisition and programming of the microcontroller PIC16F873A to interface the
sensors with the system
5. The entire system would then be fully implemented , tested and further analysed
1.5 JUSTIFICATION
The need for a demand response energy system is necessary in an environment where
knowledge of energy efficiency is limited. The energy saving system provides an effective
method towards energy efficiency to be implemented in a household, by imbibing the

4
practice of power saving from lighting with the least possible human intervention. It also
aims to save cost to the energy consumer on electricity bills.
1.6 CONCLUSION
The importance of conserving energy in a building cannot be overemphasised and a
practical solution to improve the energy management in homes would be analysed and
implemented
5
CHAPTER TWO
LITERATURE REVIEW
2.1. OVERVIEW
This chapter discusses energy conservation, its impact to the environment generally.
The impact of lighting in buildings, how they account for major energy losses and also
highlights strategies implemented in homes and office buildings to improve efficient use of
energy.
2.2. ENERGY CONSERVATION
Energy conservation is the practice of decreasing the quantity of energy used. It may be
achieved through efficient energy use, in which case energy use is decreased while achieving
a similar outcome, or by reduced consumption of energy services. Energy conservation may
result in increase of financial capital, environmental value, national security, personal
security, and human comfort. Individuals and organizations that are direct consumers of
energy may want to conserve energy in order to reduce energy costs and promote economic
security. Industrial and commercial users may want to increase efficiency and thus maximize
profit.
Energy conservation supports the eco-friendly lifestyle by providing energy, which saves
your money and at the same time saves the earth. When you decrease the amount of energy
you use you automatically make efforts to reduce increasing global warming. (VADER,
NISHA V. and PATIL, R.U, 2009)
6
Reducing the impacts of the use of energy has been described as one of the key technical,
political and moral challenges facing the world today. While the world works towards the use
of cleaner energy, our priority should be to use the energy we generate more efficiently.
According to a publication by the International Rivers, energy efficiency measures are
cheaper, cleaner and faster to install than any other energy options. (Uyigue, 2009) Energy
efficiency measures have the potential to promote economic development and can lead to job
creation and saving of personal income. More also, energy efficiency will play a pivotal role
in the mitigation of climate change; a large part of the greenhouse gases emitted into the
atmosphere come from energy generation. This assertion is contained in the Fourth
Assessment Report (AR4) of the Intergovernmental Panel on Climate Change (IPCC), which
has demonstrated that improved energy efficiency will play a key role in our mitigation of
climate change.
Energy efficiency does not mean that we should not use energy, but we should use energy in
a manner that will minimize the amount of energy needed to provide services. This is
possible if we improve in practices and products that we use. If we use energy efficient
appliances, it will help to reduce the energy necessary to provide services like lighting,
cooling, heating, manufacturing, cooking, transport, entertainment etc. Hence, energy
efficiency products essentially help to do more work with less energy. For instance, to light a
room with an incandescent light bulb of 60 W for one hour requires 60 W/h (that is 60 watts
per hour). A compact fluorescent light bulb would provide the same or better light at 11 W
and only use 11 W/h. This means that 49 W (82% of energy) is saved for each hour the light
is turned on. (Uyigue, 2009)
7
2.3. END USER EFFIECIENCY
Energy efficiency lowers energy use while providing the same level of service.
Energy conservation reduces unnecessary energy use. Both energy efficiency and
conservation provide environmental protection and utility bill savings. Energy efficiency
measures can permanently reduce peak demand by reducing overall consumption. In
buildings this is typically done by installing energy efficient equipment and/or operating
buildings efficiently. Energy‐efficient operations, a key objective of new building
commissioning and retro‐commissioning (for existing buildings), require that building
systems operate in an integrated manner
Energy efficient practices are not so common in Nigerian homes and institutions. Due to
inconsistency of power in the country, most individuals and institutions take less interest in
energy conservation. In public institutions such as universities, government ministries were
also found to have their outdoor lighting switched on during the day. Many respondents to a
study carried out by energy efficiency survey in Nigeria blame the Power Holding Company
of Nigeria (PHCN) for this behaviour. According to them, when there is power outage during
the dark hours of the day and it lingers into the day, they forget to put off their outdoor
lighting. (Uyigue, 2009)
Since the introduction of smart meters by the Power Holding Company of Nigeria, more
people would become aware of how their inefficient energy consuming practices affect their
bills as there is now regularity on electricity charges gradually nationwide. A lot of energy
can be saved if Nigerians cultivate the habit of putting off their outdoor lighting in the day
time. Energy saved from using the natural light instead of light bulbs during the day can be
made available for use in offices and for industrial activities.
8
In end-use efficiency we refer to technologies, appliances or practices that improve the
efficient use of energy at the level of the final user. For example the appliances we use in our
houses and offices. Though this term is not limited to electrical appliances, it can also be used
for other areas of efficiency such as measures to improve the ability of houses to absorb and
retain heat in winter and keep out heat in the summer. On the side of utility companies,
providing electricity, they can also device ways and technologies to promote the efficient use
of energy. These are Demand side and Demand response
2.3.1. WHAT IS DEMAND RESPONSE?
Demand Response (DR) is a term used for programs designed to encourage end-users
to make short-term reductions in energy demand in response to a price signal from the
electricity hourly market, or a trigger initiated by the electricity grid operator. Typically, DR
actions would be in the range of 1 to 4 hours and include turning off or dimming banks of
lighting, adjusting HVAC levels, or shutting down a portion of a manufacturing process.
Alternatively, onsite generation can be used to displace load drawn from the electricity power
grid.
Lighting accounts for a substantial amount of a building’s energy budget. Estimates vary in
the literature, with percentages from 20% to 40% being reported. Some of this variation
comes from the variation in building designs. One study found that between 440 Wh and
1400 Wh of electricity were wasted per day on unneeded lighting in three office
environments. Over an entire year, this would correspond to waste between 160 kWh and 511
kWh. (Pierkaz, 2012)
Demand shedding is a temporary reduction or curtailment of peak electric demand. Ideally a
demand shedding strategy would maximize the demand reduction while minimizing any loss
of building services.
9
Lighting demand shed strategies tend to be simple and depend widely on wiring and controls
infrastructures.
Estimating the demand savings potential of lighting strategies depend on how the demand
savings are achieved. Demand response control capability of lighting systems is generally
determined by the characteristics of lighting circuit and control system. There are two ways
to implement demand response control with lighting
Absolute reduction
Relative reduction.
Absolute reduction is achieved by programming pre-set lighting level for times when demand
response is required. This may be configured in many different ways based on the lighting
control strategies, i.e. half the fixtures on, one third of the lamps in each fixture on, or all
lamps at 70% of full light output.
The problem with an absolute reduction approach is that it does not yield any savings or may
even increase lighting electricity consumption if the lighting levels are the same as or lower
than the pre-set levels at the time demand response is initiated. Therefore, although this
approach is easy to implement with current lighting control systems, the demand savings
estimate varies depending on the building use and occupancy.
Relative reduction means reducing loads with respect to the level of lighting at the time of
demand response. Instead of reducing to a pre-set level, a certain per cent reduction over the
current value is achieved during a demand response event. Implementation requires that the
light output from the lamp or power output from the ballast is communicated back to the
lighting control system, so central closed loop control is required. Systems with such
sophisticated controls tend to be newer and more expensive. The decision to implement
10
absolute or relative lighting reduction depends on the building lighting infrastructure, the
lighting use in the building, and the capabilities of the installed lighting control system.
An effective control system is essential for optimizing natural day lighting and electric
lighting for energy savings and occupant satisfaction. This allows changes to the electric
lighting output to be unnoticeable to occupants. This strategy can reduce glare and eye
fatigue and generate energy savings. An extension of manual control also leads to automatic
dimming systems, such as daylight harvesting control. This system can be applied to homes,
classrooms and offices where there is sufficient daylight to obtain savings from dimming
electric lights (Motegi, 2006)
2.4. LIGHTING CONTROL SYSTEMS
Lighting control systems can range from a very simple manual on/off switch that is
operated by the occupant, to a system of addressable ballasts, dimmers, photosensors and
occupant sensors all controlled by a central computer. Such systems are widely available, and
are encouraged by energy codes and green building rating systems, yet there are limited
studies of the long-term performance of such systems in the field. For example, Jennings et al
found that private offices with occupancy sensors saved 20-26% compared to the manual
operation of a wall switch alone. In offices where automatic daylight dimming controls were
installed and properly commissioned additional savings of 21% were obtained over a seven-
month period. Galasiu et al measured a saving of up to 70% in an open plan office with the
combined use of an occupancy sensor, photosensor and a personal dimming control. Had the
various controls been installed individually they would have saved, on average: occupancy
sensors 35%, photosensors 20% and individual dimming controls 11%. Automatic and
manual controls in private offices in a study by Morrow et al saved 61% of the energy over a
11
10 hour schedule; 46% of the savings were due to motion sensors and automatic dimming
while the remaining 15% was due to occupant switching and dimming. (BIRT, 2009)
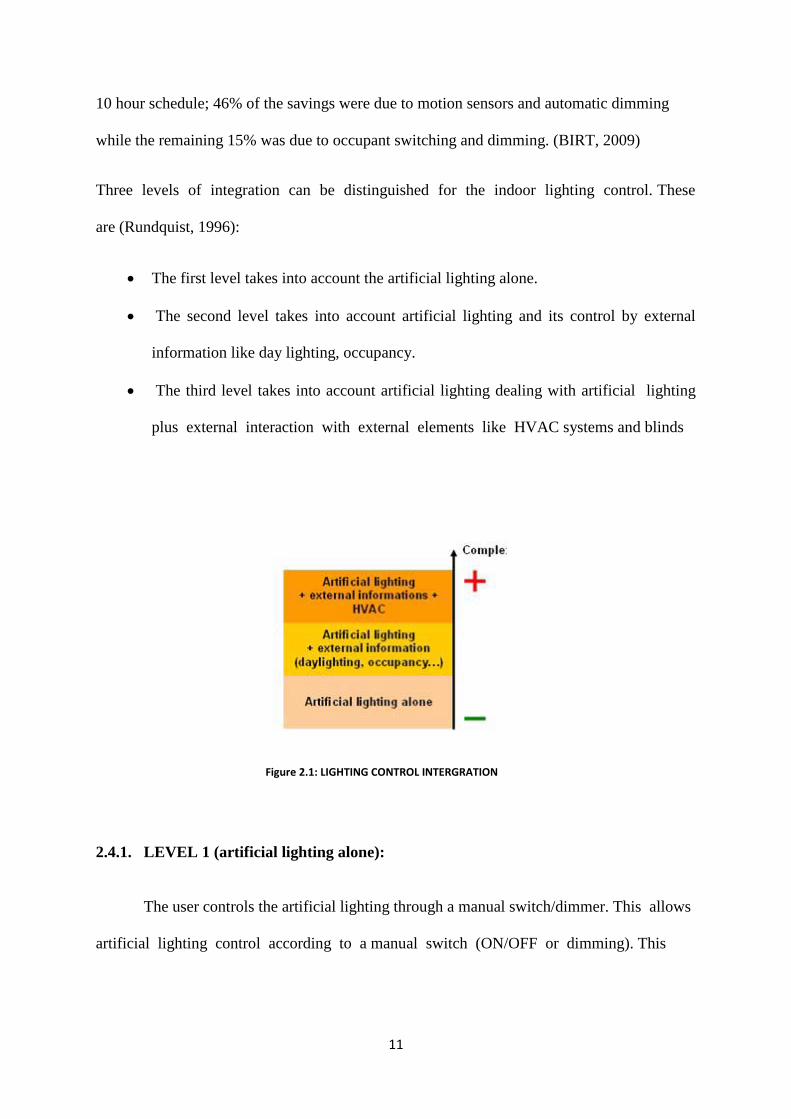
Three levels of integration can be distinguished for the indoor lighting control. These
are (Rundquist, 1996):
The first level takes into account the artificial lighting alone.
The second level takes into account artificial lighting and its control by external
information like day lighting, occupancy.
The third level takes into account artificial lighting dealing with artificial lighting
plus external interaction with external elements like HVAC systems and blinds
Figure 2.1: LIGHTING CONTROL INTERGRATION
2.4.1. LEVEL 1 (artificial lighting alone):
The user controls the artificial lighting through a manual switch/dimmer. This allows
artificial lighting control according to a manual switch (ON/OFF or dimming). This
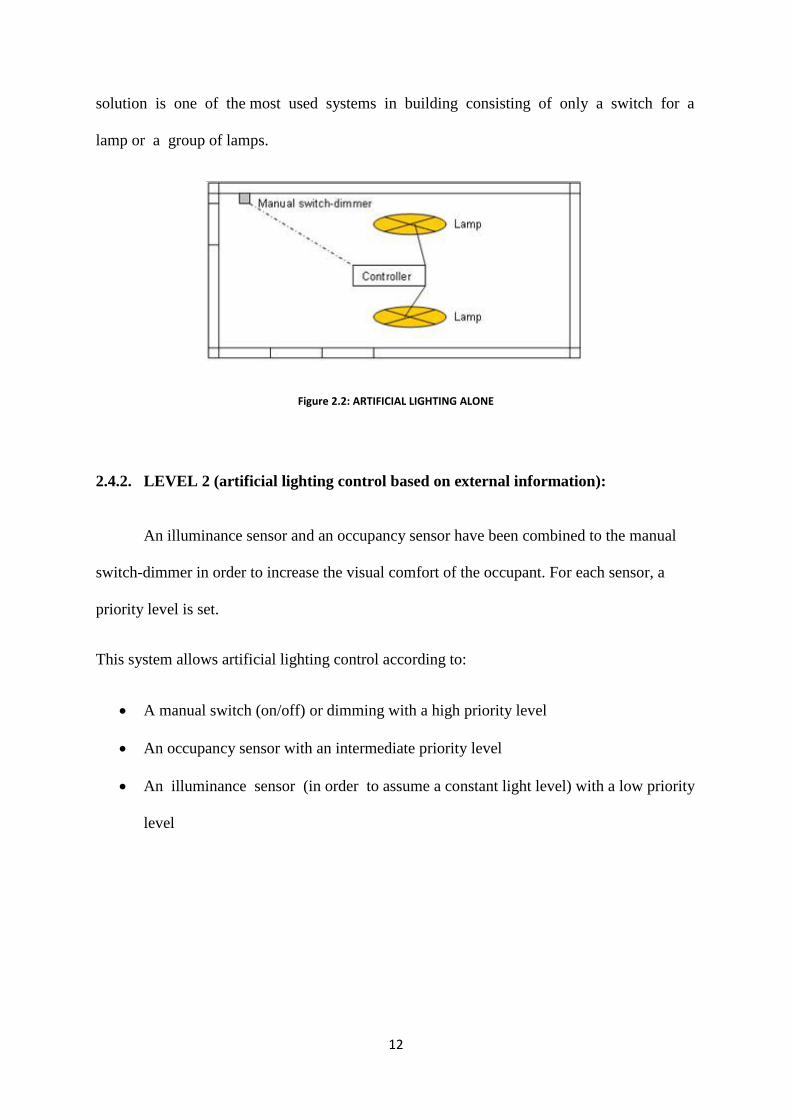
12
solution is one of the most used systems in building consisting of only a switch for a
lamp or a group of lamps.
Figure 2.2: ARTIFICIAL LIGHTING ALONE
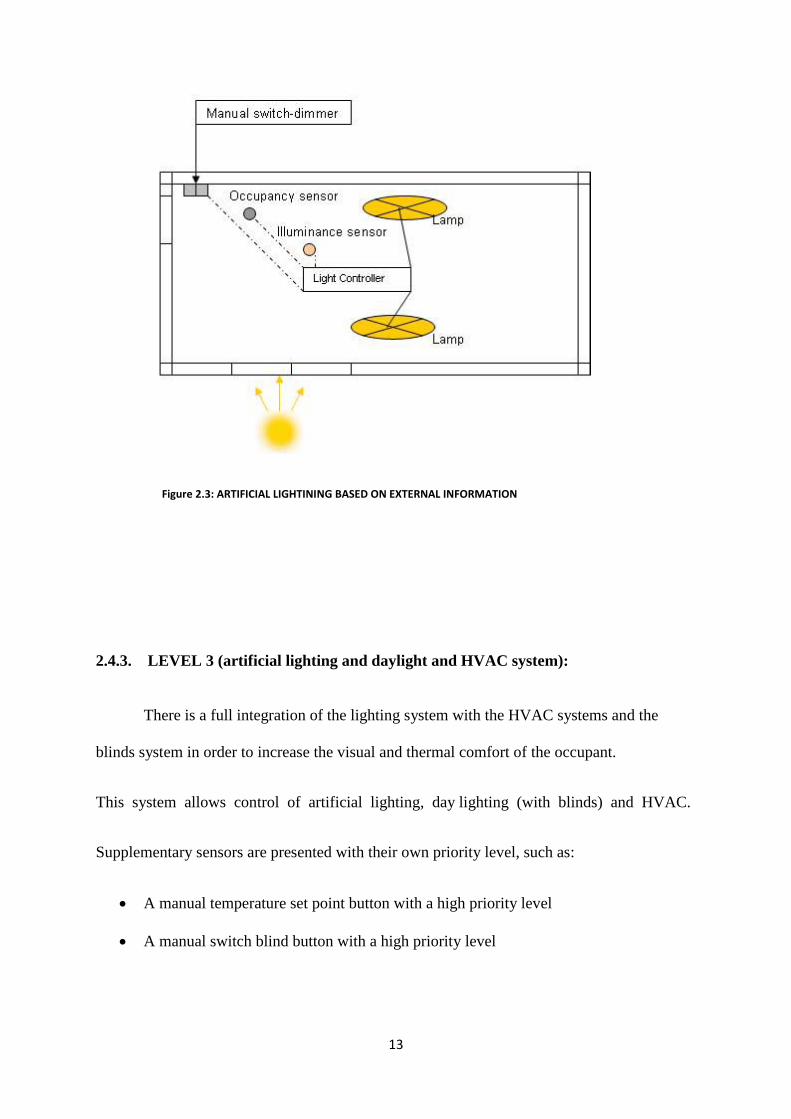
2.4.2. LEVEL 2 (artificial lighting control based on external information):
An illuminance sensor and an occupancy sensor have been combined to the manual
switch-dimmer in order to increase the visual comfort of the occupant. For each sensor, a
priority level is set.
This system allows artificial lighting control according to:
A manual switch (on/off) or dimming with a high priority level
An occupancy sensor with an intermediate priority level
An illuminance sensor (in order to assume a constant light level) with a low priority
level
13
Figure 2.3: ARTIFICIAL LIGHTINING BASED ON EXTERNAL INFORMATION
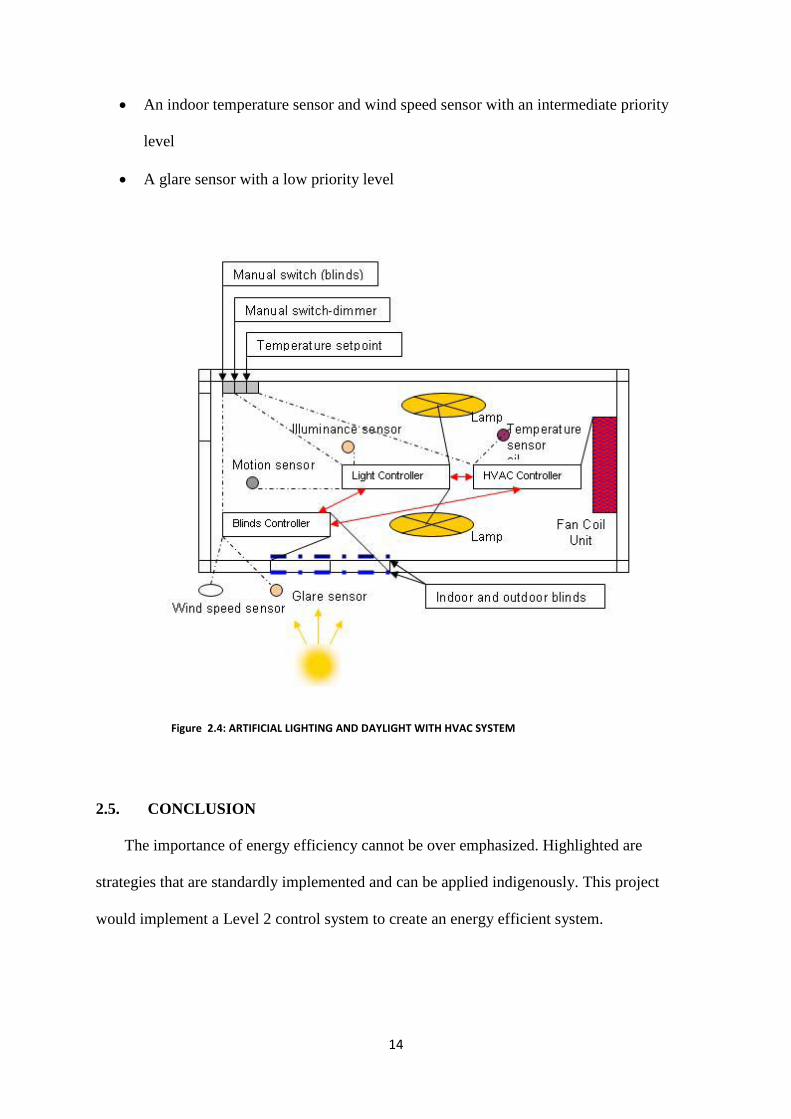
2.4.3. LEVEL 3 (artificial lighting and daylight and HVAC system):
There is a full integration of the lighting system with the HVAC systems and the
blinds system in order to increase the visual and thermal comfort of the occupant.
This system allows control of artificial lighting, day lighting (with blinds) and HVAC.
Supplementary sensors are presented with their own priority level, such as:
A manual temperature set point button with a high priority level
A manual switch blind button with a high priority level
14
An indoor temperature sensor and wind speed sensor with an intermediate priority
level
A glare sensor with a low priority level
Figure 2.4: ARTIFICIAL LIGHTING AND DAYLIGHT WITH HVAC SYSTEM
2.5. CONCLUSION
The importance of energy efficiency cannot be over emphasized. Highlighted are
strategies that are standardly implemented and can be applied indigenously. This project
would implement a Level 2 control system to create an energy efficient system.
15
CHAPTER THREE
DESIGN ANALYSIS AND CONSTRUCTION
3.1. OVERVIEW
This section contains considerations made in design and construction of the hardware
aspect of the project.
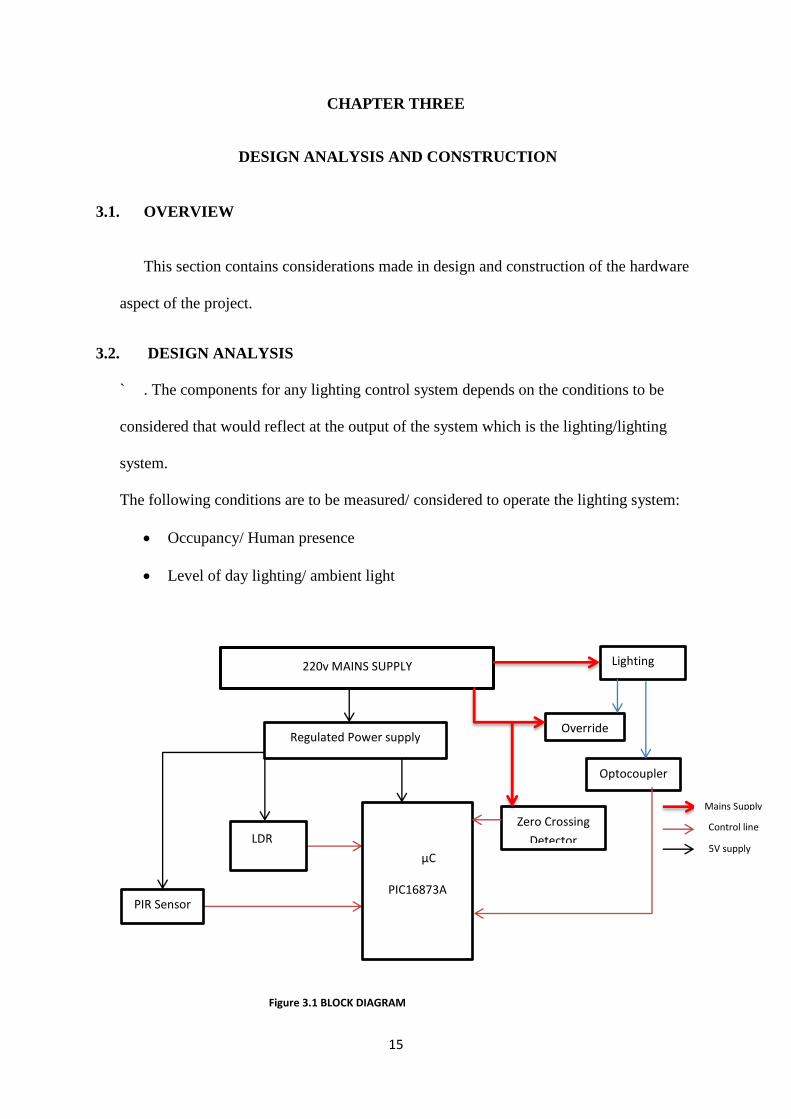
3.2. DESIGN ANALYSIS
` . The components for any lighting control system depends on the conditions to be
considered that would reflect at the output of the system which is the lighting/lighting
system.
The following conditions are to be measured/ considered to operate the lighting system:
Occupancy/ Human presence
Level of day lighting/ ambient light
LDR
PIR Sensor
220v MAINS SUPPLY
Regulated Power supply
µC
PIC16873A
Lighting
Override
Zero Crossing
Detector
Optocoupler
Figure 3.1 BLOCK DIAGRAM
Mains Supply
Control line
5V supply

16
The block diagram represents the operation and hardware layout of the lighting control
system. Each of the components considered are described accordingly.
3.3. REGULATED POWER SUPPLY
The lighting control system would require a smooth DC supply. This supply chosen
would be able to give out the required output from an AC source. The functioning
components of this supply include:
Step down transformer
Diode Bridge rectifier
Filter
Regulator
Figure 3.2: POWER SUPPLY CIRCUIT
3.3.1. Step Down Transformer
A typical transformer consists of two coils (windings) linked by an iron core and are
linked by a magnetic field. The transformer is used to convert electricity from one voltage to
17
another with minimal loss of power, usually and AC source at the primary because they
require a changing magnetic field to be created in the core. The step down is used to reduce
the voltage from the mains supply of 220v to 12v. The resulting voltage is the fed to the
rectifier.
3.3.2. Rectifier
Rectification is a process of converting AC to DC voltage. The rectifier performs this
function, essential to the power supply circuit. There are two different rectification circuits;
the full wave and the half wave. Diodes are the components that make up the rectifier.
A full wave rectifier made up of four diodes is selected for this project. These four diodes are
arranged so that both the positive and negative parts of the ac waveform are converted to DC.
3.3.3. Filter
A smoothing capacitor is used here to generate a ripple free DC. A smoothing
capacitor is also a filter capacitor and it converts the full wave rectified AC output into a
smooth DC. The power rating of the capacitor must be greater than the off load output
voltage supply. The capacitor chosen is rated at 1000µFarad. The ripple that appears in the
capacitor is directly proportional to the load current and inverse to the capacitive value. The
capacitor selected keeps the peak-to-peak values of the ripple minimum under full load
condition.
3.3.4. Regulator
Regulators are often used to make the power supply output insensitive to input
voltage amplitude variations and further reduce the ripple voltage. The regulator is also be
used to adjust or change the dc output voltage and limit the amount of current delivered by
the power supply. Regulators are a form of dc-to-dc converter.
18
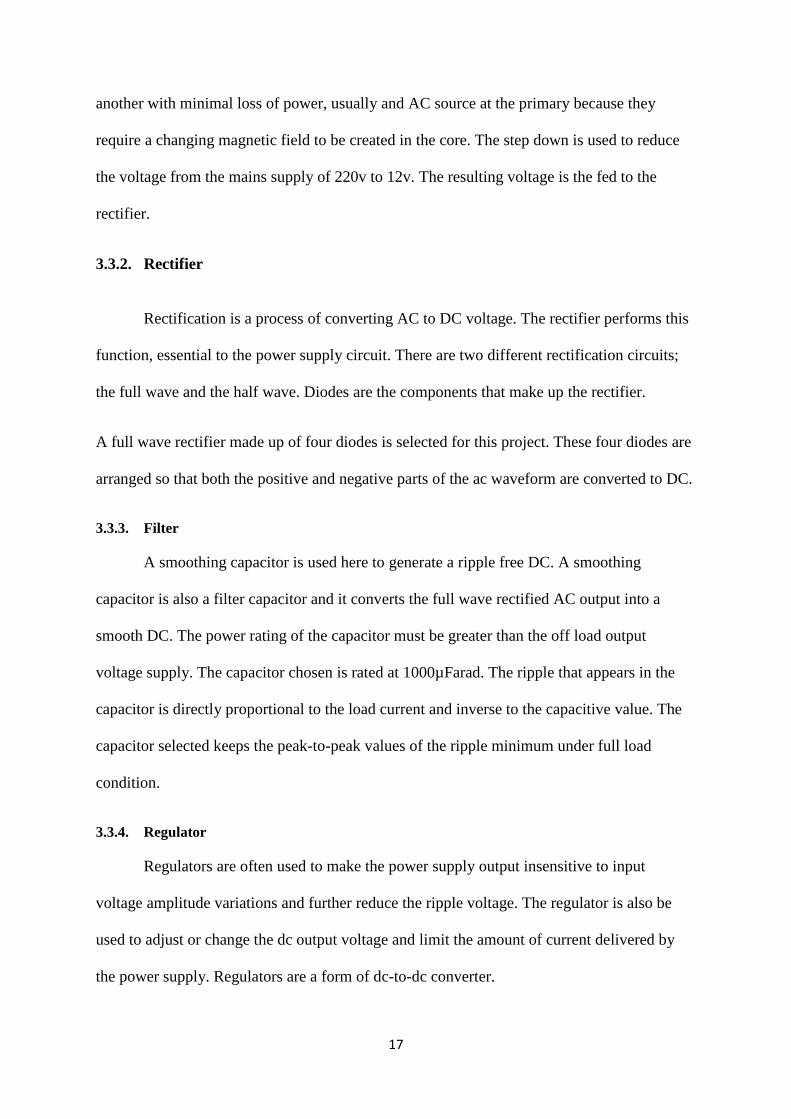
For the purpose of this project, a single regulator chip is used to provide the desired constant
dc output of 5V, which is independent of the input voltage to a reasonable extent. The
regulator used is AN7805 (commonly stated as 7805).
Figure 3.3: LM7805 REGULATOR CHIP
3.4. PIR SENSOR
PIR (Passive Infrared Sensors) are basically made up of pyroelectric sensors which can
detect levels of infrared radiation. The pyroelectric sensor is made of a crystalline material
that generates a surface electric charge when exposed to heat in the form of infrared radiation.
When the amount of radiation striking the crystal changes, the amount of charge also changes
and can then be measured with a sensitive FET device built into the sensor.
19
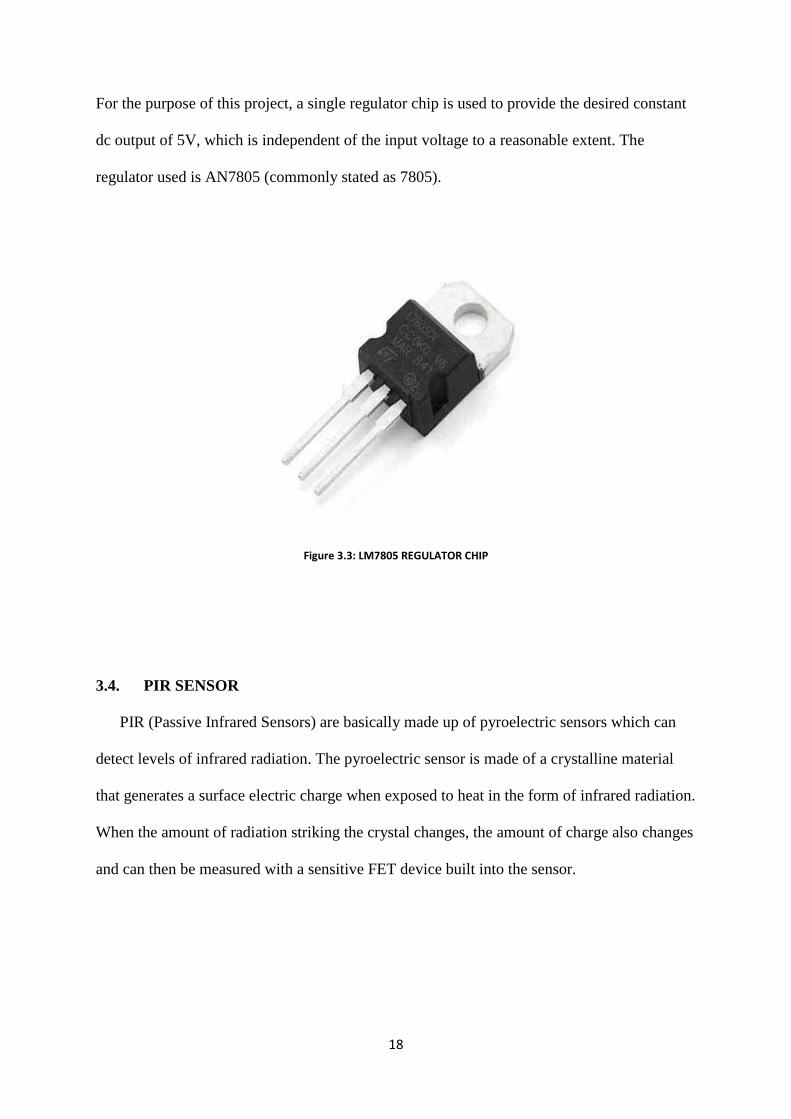
Figure 3.4: PIR SENSOR BLOCK DIAGRAM
The sensor elements are sensitive to radiation over a wide range so a filter window is added
to the TO5 package to limit detectable radiation to the 8 to 14mm range which is most
sensitive to human body radiation. Typically, the FET source terminal pin 2 connects through
a pull-down resistor of about 100 K to ground and feeds into a two stage amplifier having
signal conditioning circuits. The amplifier is typically bandwidth limited to below 10Hz to
reject high frequency noise and is followed by a window comparator that responds to both the
positive and negative transitions of the sensor output signal.
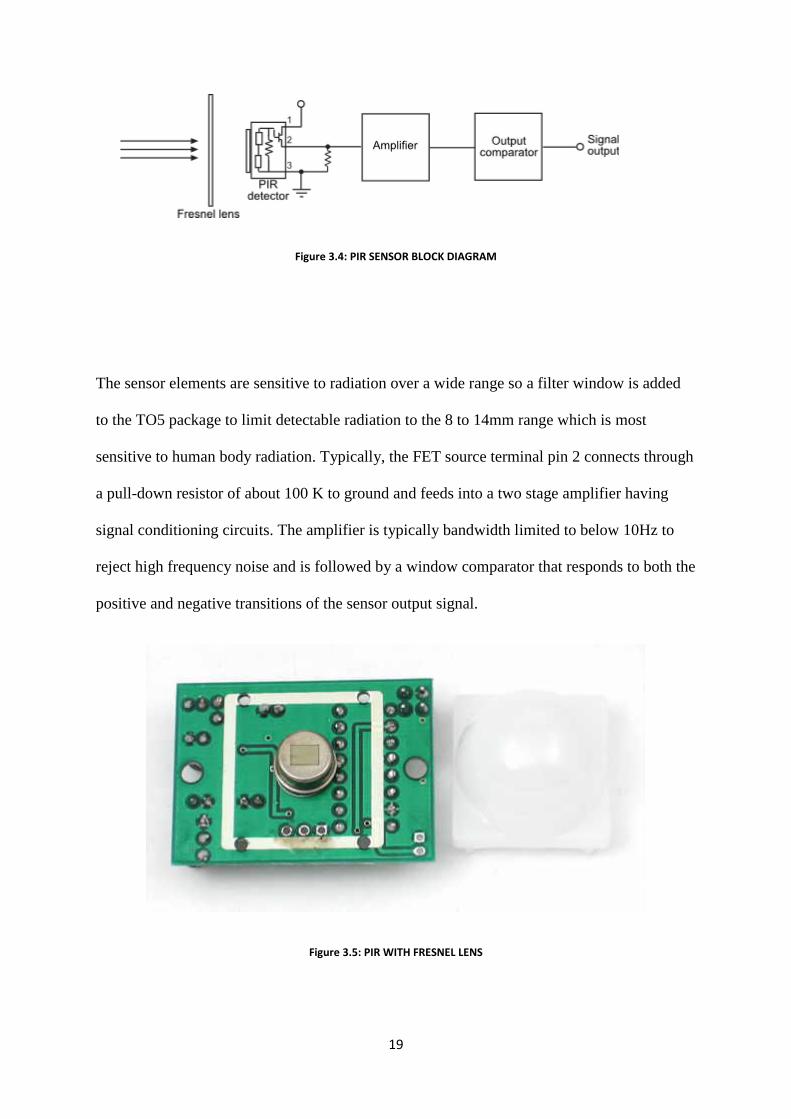
Figure 3.5: PIR WITH FRESNEL LENS
20
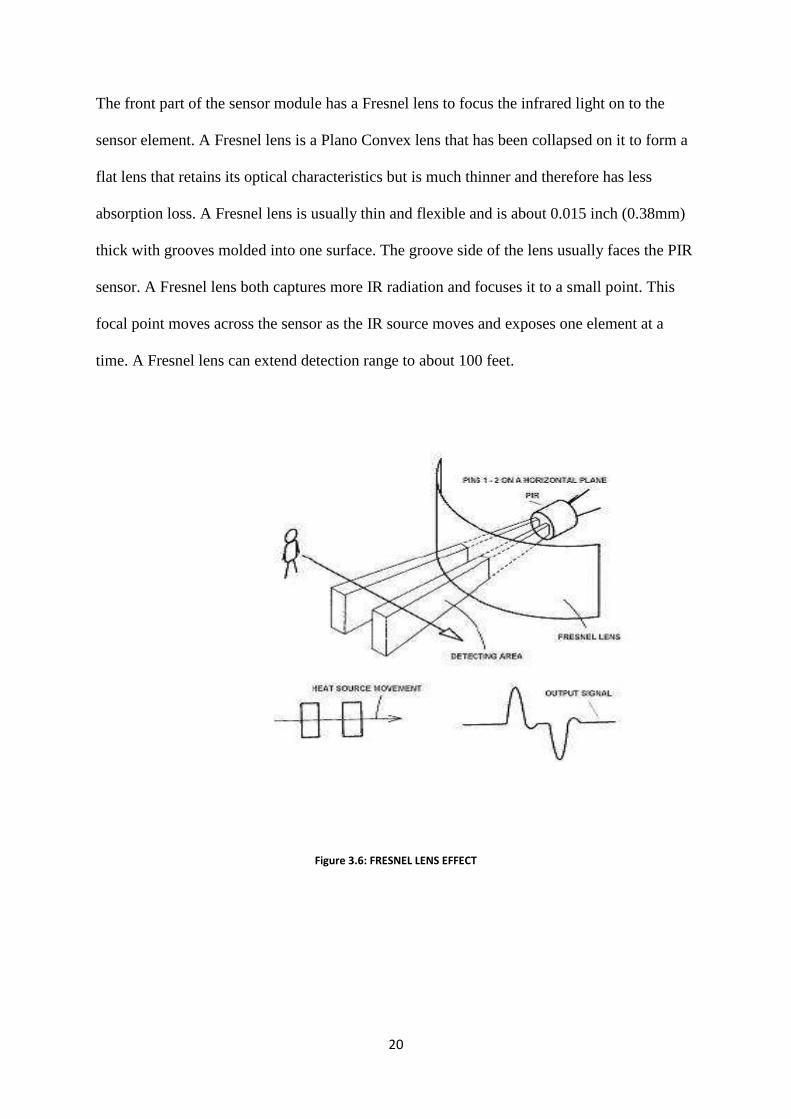
The front part of the sensor module has a Fresnel lens to focus the infrared light on to the
sensor element. A Fresnel lens is a Plano Convex lens that has been collapsed on it to form a
flat lens that retains its optical characteristics but is much thinner and therefore has less
absorption loss. A Fresnel lens is usually thin and flexible and is about 0.015 inch (0.38mm)
thick with grooves molded into one surface. The groove side of the lens usually faces the PIR
sensor. A Fresnel lens both captures more IR radiation and focuses it to a small point. This
focal point moves across the sensor as the IR source moves and exposes one element at a
time. A Fresnel lens can extend detection range to about 100 feet.
Figure 3.6: FRESNEL LENS EFFECT
21
The PIR sensor requires an initial stabilization time of about 10 to 60 seconds in order to
function properly. During this time, the sensor gets familiar with the surrounding
environment, and any motion in its field of view should be avoided. The PIR sensor has a
typical range of 20 feet, and is designed to adjust to slowly changing conditions such as the
gradual change in the thermal profile of the surrounding as the day passes.
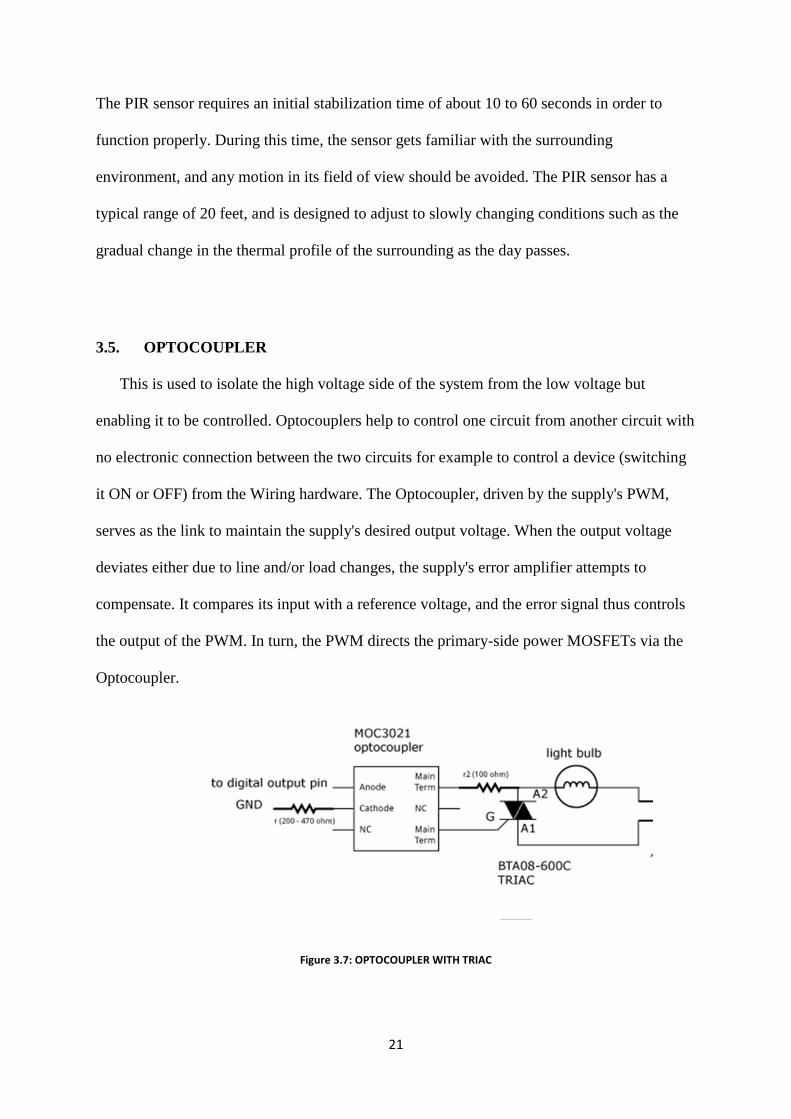
3.5. OPTOCOUPLER
This is used to isolate the high voltage side of the system from the low voltage but
enabling it to be controlled. Optocouplers help to control one circuit from another circuit with
no electronic connection between the two circuits for example to control a device (switching
it ON or OFF) from the Wiring hardware. The Optocoupler, driven by the supply's PWM,
serves as the link to maintain the supply's desired output voltage. When the output voltage
deviates either due to line and/or load changes, the supply's error amplifier attempts to
compensate. It compares its input with a reference voltage, and the error signal thus controls
the output of the PWM. In turn, the PWM directs the primary-side power MOSFETs via the
Optocoupler.
Figure 3.7: OPTOCOUPLER WITH TRIAC
22
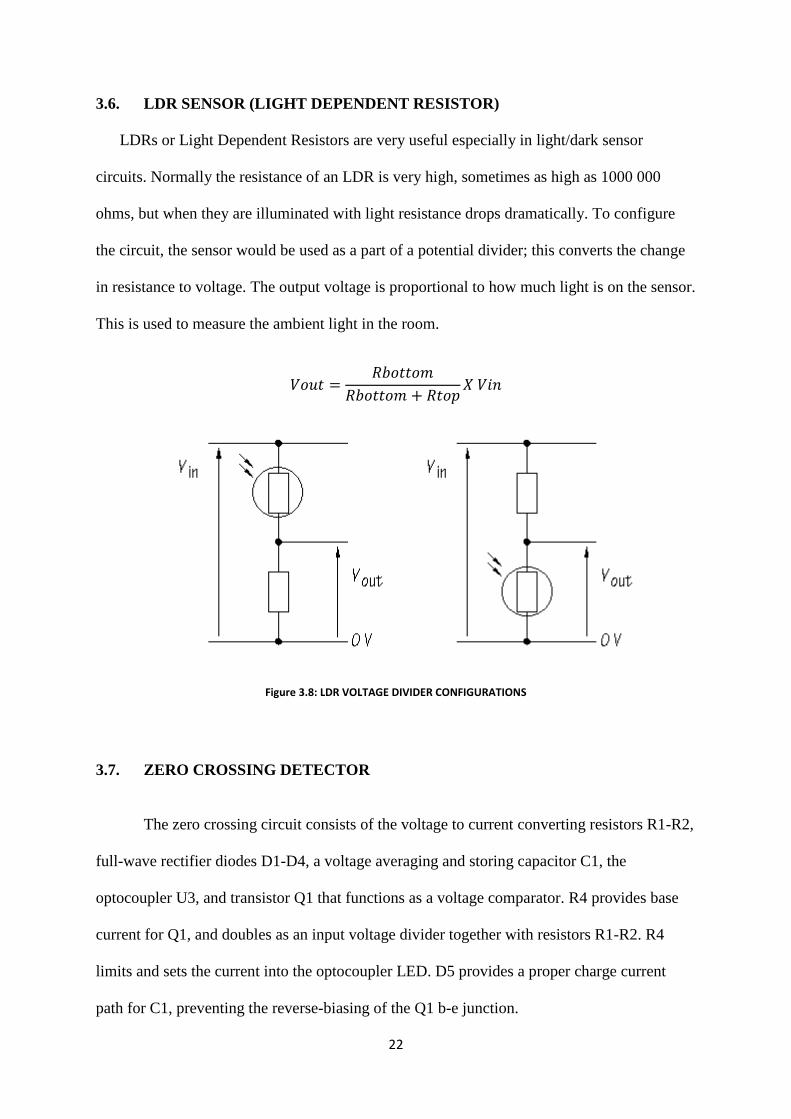
3.6. LDR SENSOR (LIGHT DEPENDENT RESISTOR)
LDRs or Light Dependent Resistors are very useful especially in light/dark sensor
circuits. Normally the resistance of an LDR is very high, sometimes as high as 1000 000
ohms, but when they are illuminated with light resistance drops dramatically. To configure
the circuit, the sensor would be used as a part of a potential divider; this converts the change
in resistance to voltage. The output voltage is proportional to how much light is on the sensor.
This is used to measure the ambient light in the room.
Figure 3.8: LDR VOLTAGE DIVIDER CONFIGURATIONS
3.7. ZERO CROSSING DETECTOR
The zero crossing circuit consists of the voltage to current converting resistors R1-R2,
full-wave rectifier diodes D1-D4, a voltage averaging and storing capacitor C1, the
optocoupler U3, and transistor Q1 that functions as a voltage comparator. R4 provides base
current for Q1, and doubles as an input voltage divider together with resistors R1-R2. R4
limits and sets the current into the optocoupler LED. D5 provides a proper charge current
path for C1, preventing the reverse-biasing of the Q1 b-e junction.
23
Transistor Q1 stays off during the majority of the mains cycle, during which C1 is charged
via R1-R2 and D5. Q1 turns on and feeds current from C1 to the optocoupler via R4,
whenever the mains voltage (divided by (R1+R2)/R3) is lower than the voltage across C1.
The voltage across C1 will reach within about 400ms an equilibrium that defines the final
operating point. The voltage across C1 never exceeds 10 volts with the given resistor ratios.
The voltage stabilizes at a point when the average current charged equals the average current
consumed. The typical pulse width is 1ms at 50Hz. The output pulse width is fairly constant,
independent of the designated AC-line voltage (220VAC). This makes this simple zero
crossing detector quite unique, since the mains voltage does not affect the pulse width nor its
position.
The circuit’s total power consumption is a 120mW at 220VAC. The majority of this power is
dissipated in the input resistors R1-R2. The peak current flowing into the optocoupler LED
varies almost linearly with the mains voltage. This does not cause any inaccuracies to the
zero crossing function, as long as the optocoupler output is always allowed to saturate - even
at the lowest mains voltage. This factor determines the minimum allowed value of the pull-up
resistor R5. The 4N35 optocoupler has a guaranteed CTR (Current Transfer Ratio) of 100%.
3.8. MICROCONTROLLER
A microcontroller is a highly integrated chip, which includes on single chip, all or most of
the parts needed for a controller. The microcontroller typically includes: CPU (Central
Processing Unit), RAM (Random Access Memory), EPROM/PROM/ROM (Erasable
Programmable Read Only Memory), I/O (input/output) – serial and parallel, timers, interrupt
controller.
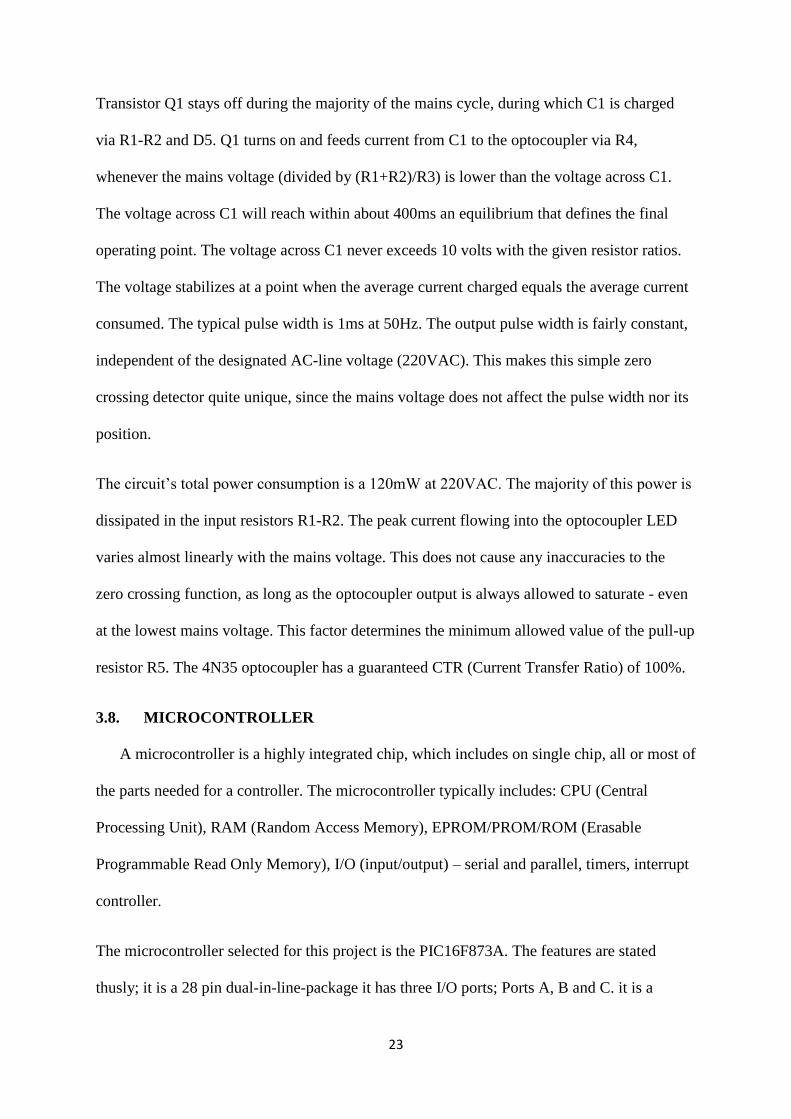
The microcontroller selected for this project is the PIC16F873A. The features are stated
thusly; it is a 28 pin dual-in-line-package it has three I/O ports; Ports A, B and C. it is a
24
CMOS FLASH- based 8-bit microcontroller with 128 bytes of EEPROM data memory, self-
programming, an ICD, 2 comparators, 5channels of 10-bit analog-to-digital converter.
The synchronous serial port can be configured as either a 3- wire serial peripheral interface or
a 2 wire inter- integrated circuit bus.
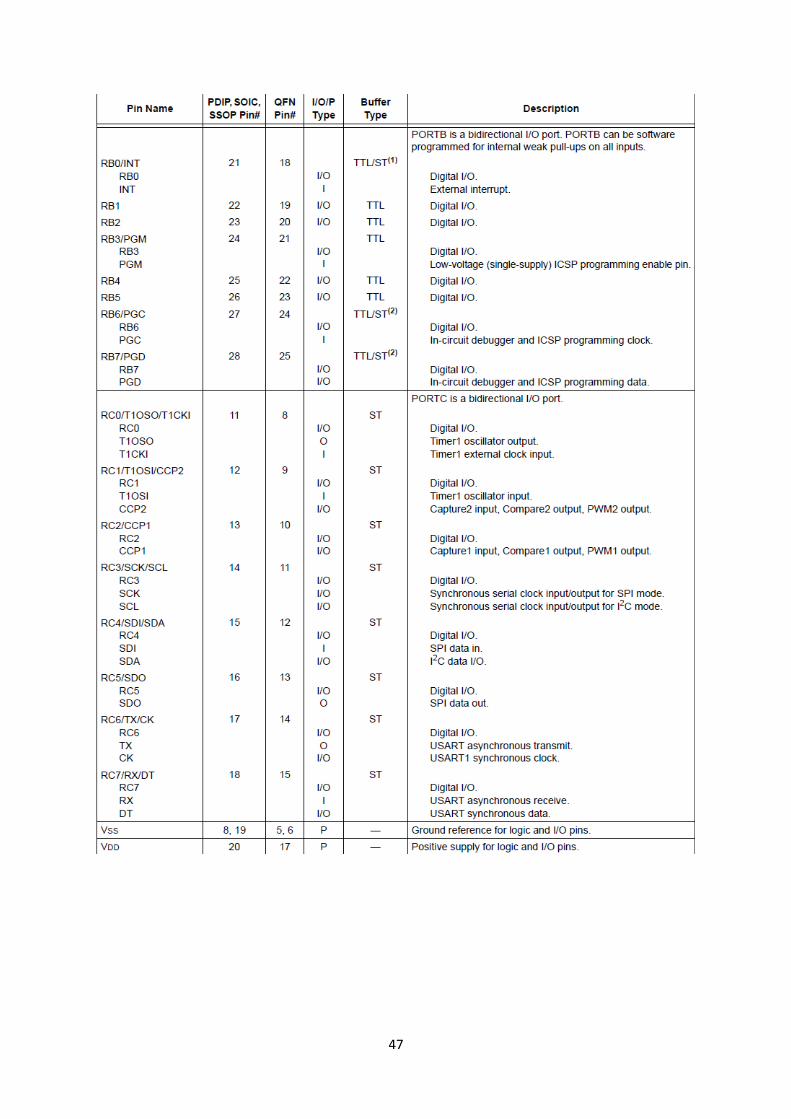
Figure 3.9: PIN CONFIGURATION FOR PIC16F873A
3.9. CIRCUIT CONFIGURATION
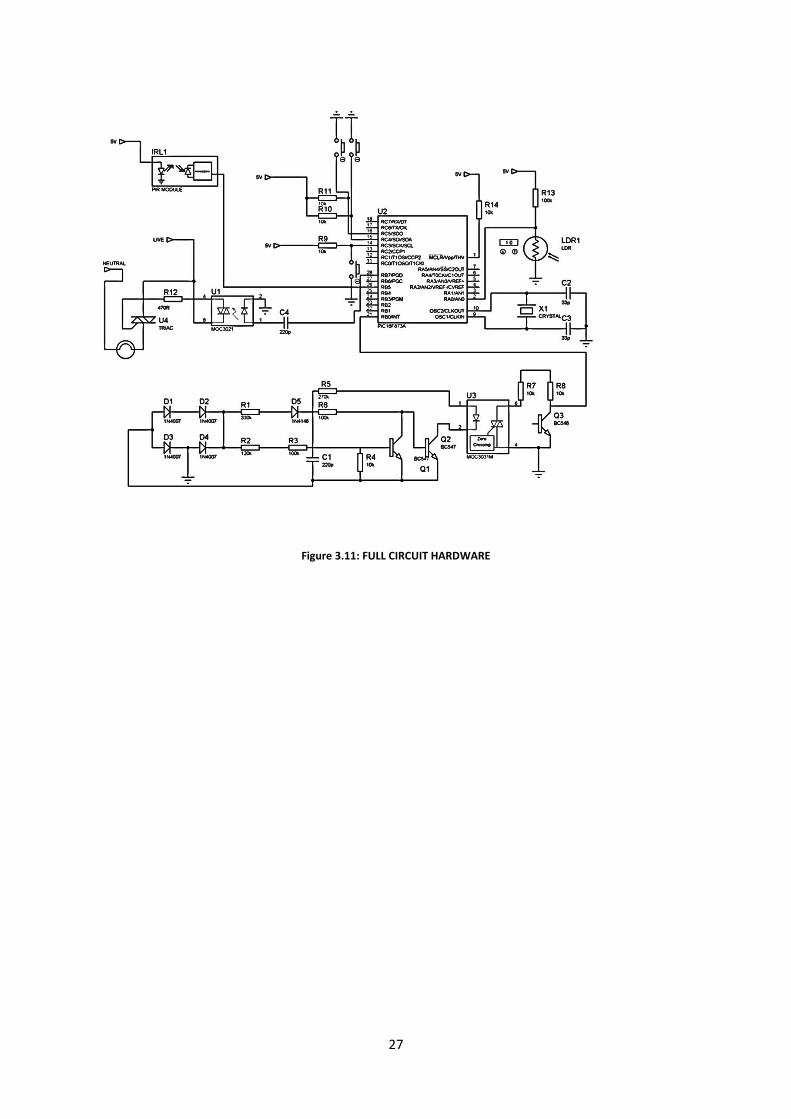
Figure 3.11 shows the circuit and how the components are interfaced with the
microcontroller. The PIC16F873A has 3 I/O Ports. The ports A serve as digital I/O and
analog input simultaneously. PIN 1 is the VPP, where the programming voltage is supplied.
Crystal oscillator is connected to the clock input and out pins OSC1 and OSC2 to
generate the clock waveform. The oscillator produces square wave pulses whose frequency is
controlled by the oscillator which regulates the master clock and system timing. The
analogue pins AN0 receive the signal from the LDR, and converted by Analogue-To Digital
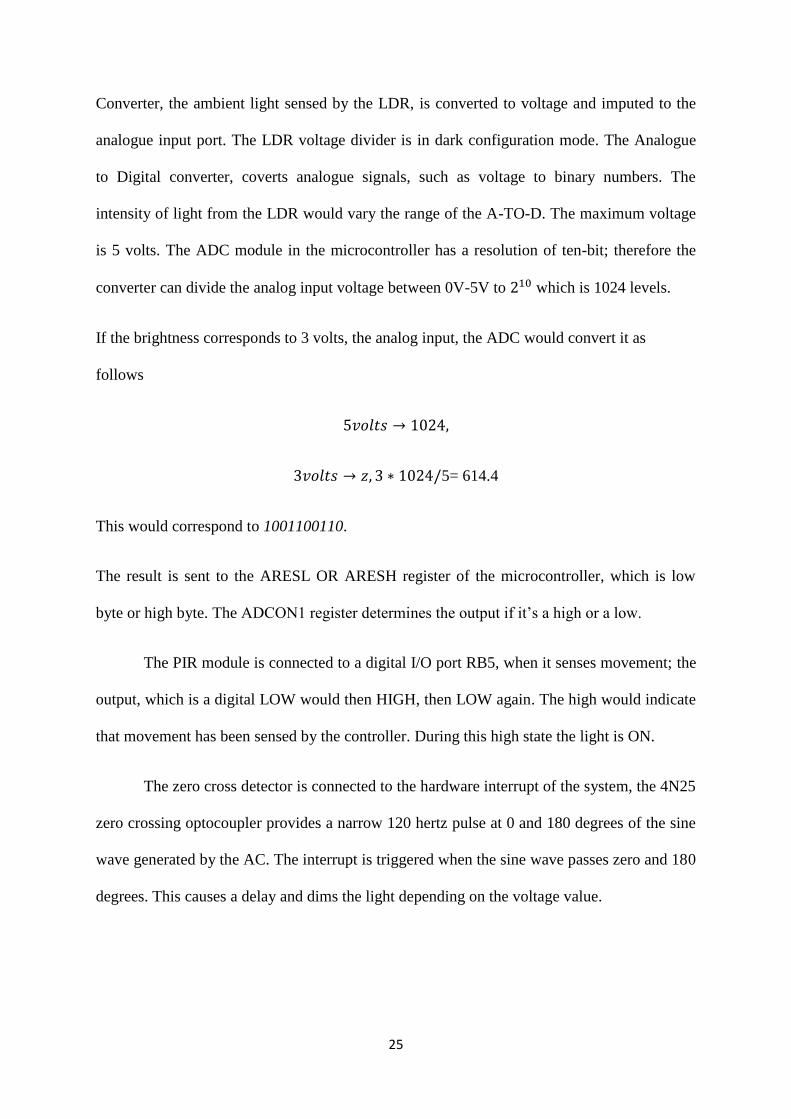
25
Converter, the ambient light sensed by the LDR, is converted to voltage and imputed to the
analogue input port. The LDR voltage divider is in dark configuration mode. The Analogue
to Digital converter, coverts analogue signals, such as voltage to binary numbers. The
intensity of light from the LDR would vary the range of the A-TO-D. The maximum voltage
is 5 volts. The ADC module in the microcontroller has a resolution of ten-bit; therefore the
converter can divide the analog input voltage between 0V-5V to which is 1024 levels.
If the brightness corresponds to 3 volts, the analog input, the ADC would convert it as
follows
5= 614.4
This would correspond to 1001100110.
The result is sent to the ARESL OR ARESH register of the microcontroller, which is low
byte or high byte. The ADCON1 register determines the output if it’s a high or a low.
The PIR module is connected to a digital I/O port RB5, when it senses movement; the
output, which is a digital LOW would then HIGH, then LOW again. The high would indicate
that movement has been sensed by the controller. During this high state the light is ON.
The zero cross detector is connected to the hardware interrupt of the system, the 4N25
zero crossing optocoupler provides a narrow 120 hertz pulse at 0 and 180 degrees of the sine
wave generated by the AC. The interrupt is triggered when the sine wave passes zero and 180
degrees. This causes a delay and dims the light depending on the voltage value.
26
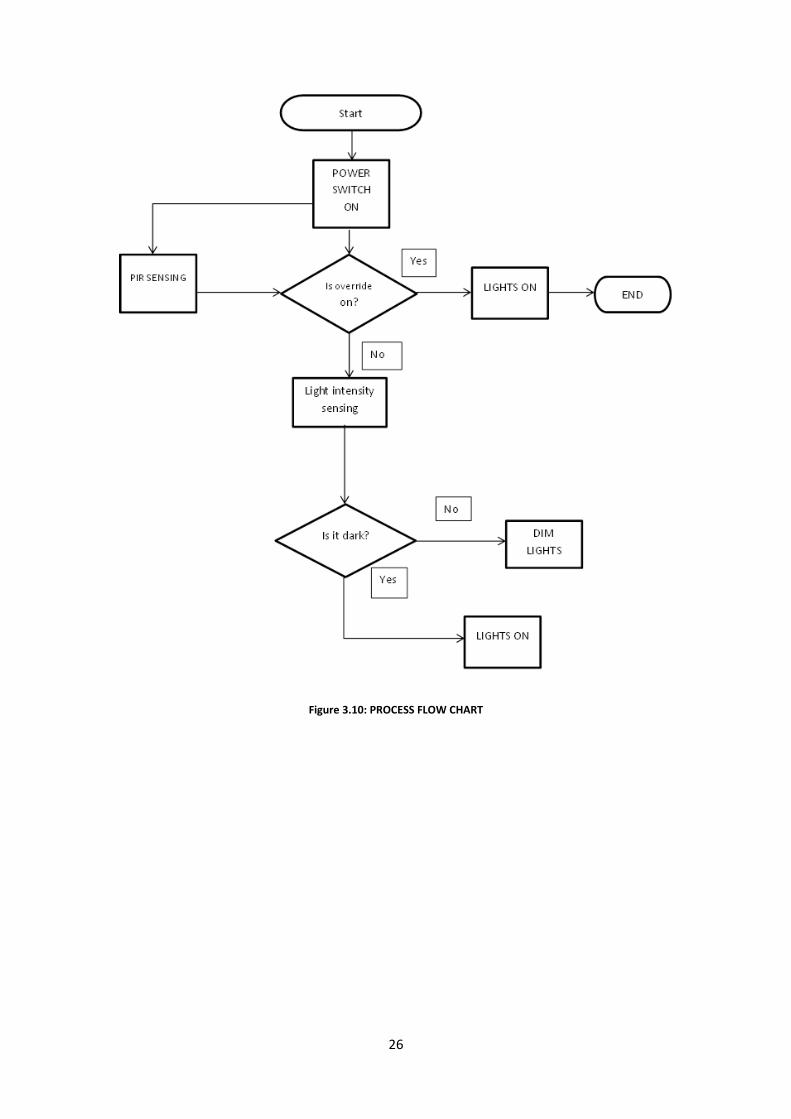
Figure 3.10: PROCESS FLOW CHART
27
Figure 3.11: FULL CIRCUIT HARDWARE

28
CHAPTER FOUR
IMPLEMENTATION AND TESTING
4.1. OVERVIEW
This chapter gives the result of the test carried out on the constructed model. It covers the
final implementation of the designed circuitry, the operation of the system and final
evaluation of the output of the system.
4.2. CONSTRUCTION
The physical realization of the project is very vital. This is design considerations are put to
test. Here the paper work is transformed into a finished hardware.
After carrying out all the paper design and analysis, the project was implemented, constructed and
tested to ensure its working ability. The construction of this project was done in three different stages.
The implementation of the whole project on a solder-less experiment board (bread board).
The soldering of the circuits on Vero-boards.
The coupling of the entire project to the casing.
4.3. TESTING
During the testing phase, the effects of the sensors were consider and responded to the
output, which is the lighting (a 100 watt bulb), to observe the process.
The output power of the bulb in total darkness that is, when the LDR voltage Vout is at maximum
(5Volts). The bulb gave out the maximum brightness. This corresponds to the full output power of the
bulb (100 WATTS).
29
= 0.454 Amps
Under bright conditions, the zero crossing detector with the triac, delays (about 800µS) the
microcontroller which simultaneously dims the output, the voltage across the LDR drops because of
the current ambient conditions. The output of the test light drops brightness, this reduces the full
wattage also.
The voltage drop across the LDR is about 0.09, the bulb is dimmest. The voltage drop is 99 Volts
from measurement with a multimeter
Therefore output power
99×0.454= 44.946 WATTS
If daylight sensing is considered with the motion sensing, the amount of energy in watt hours
is considered. In order to estimate the lighting energy consumption and related impact
of controls the simplified equation from the European standard EN 15193 (Manancia, 2000)
Where,
W - Total energy used for lighting: the amount of energy consumed in period t, by
the luminaires when operating, and parasitic loads when the luminaires are not
operating in a room or zone, measured in kWh.
30
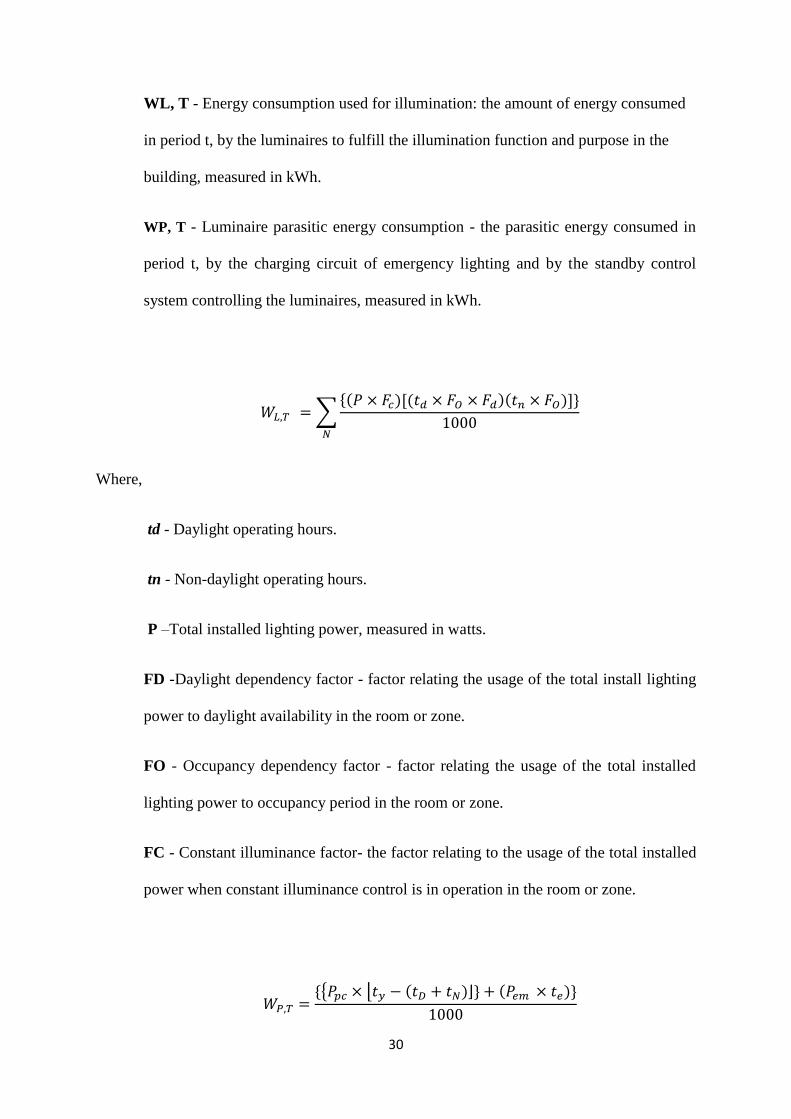
WL, T - Energy consumption used for illumination: the amount of energy consumed
in period t, by the luminaires to fulfill the illumination function and purpose in the
building, measured in kWh.
WP, T - Luminaire parasitic energy consumption - the parasitic energy consumed in
period t, by the charging circuit of emergency lighting and by the standby control
system controlling the luminaires, measured in kWh.
∑{( ( (
Where,
td - Daylight operating hours.
tn - Non-daylight operating hours.
P –Total installed lighting power, measured in watts.
FD -Daylight dependency factor - factor relating the usage of the total install lighting
power to daylight availability in the room or zone.
FO - Occupancy dependency factor - factor relating the usage of the total installed
lighting power to occupancy period in the room or zone.
FC - Constant illuminance factor- the factor relating to the usage of the total installed
power when constant illuminance control is in operation in the room or zone.
{{ ⌊ ( ⌋ (
31
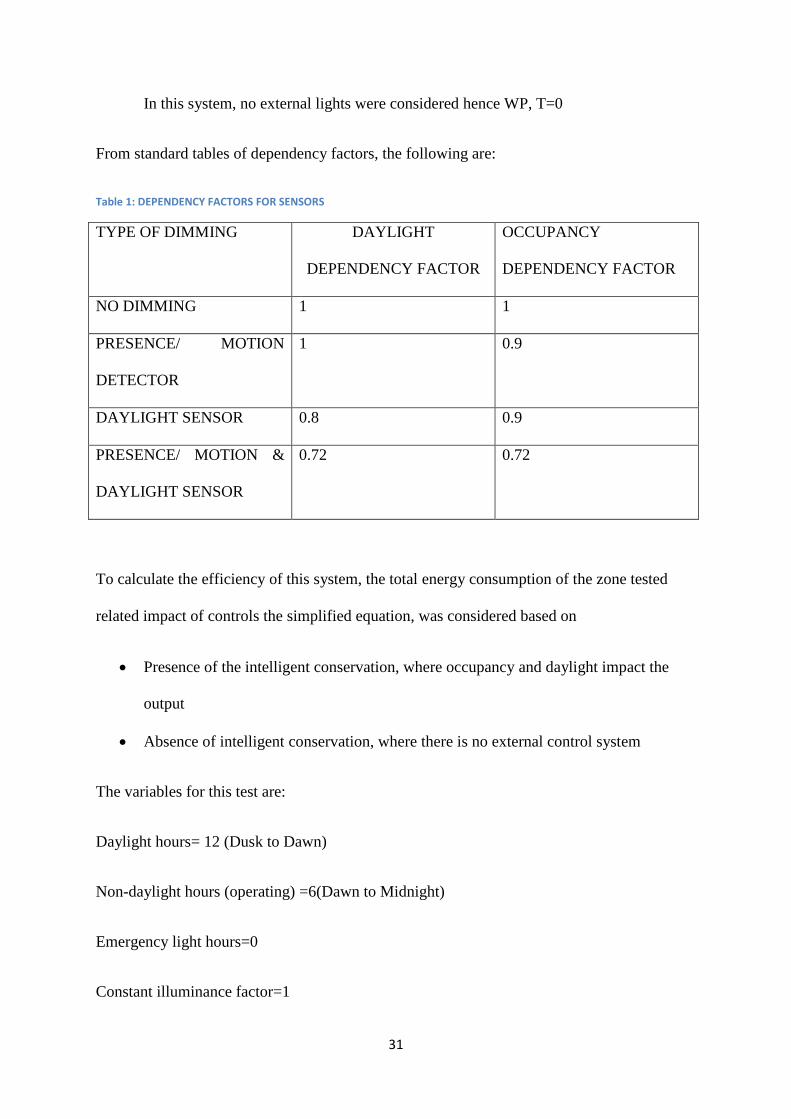
In this system, no external lights were considered hence WP, T=0
From standard tables of dependency factors, the following are:
Table 1: DEPENDENCY FACTORS FOR SENSORS
TYPE OF DIMMING DAYLIGHT
DEPENDENCY FACTOR
OCCUPANCY
DEPENDENCY FACTOR
NO DIMMING 1 1
PRESENCE/ MOTION
DETECTOR
1 0.9
DAYLIGHT SENSOR 0.8 0.9
PRESENCE/ MOTION &
DAYLIGHT SENSOR
0.72 0.72
To calculate the efficiency of this system, the total energy consumption of the zone tested
related impact of controls the simplified equation, was considered based on
Presence of the intelligent conservation, where occupancy and daylight impact the
output
Absence of intelligent conservation, where there is no external control system
The variables for this test are:
Daylight hours= 12 (Dusk to Dawn)
Non-daylight hours (operating) =6(Dawn to Midnight)
Emergency light hours=0
Constant illuminance factor=1
32
Dependency ratios are given in table 1
For presence of intelligent conservation:
{( ( (
=1.1620 KWh
1. 1620 KWh
For absence of intelligent conservation:
{( ( (
=1.8 KWh
1. 8KWh
The efficiency of the system is thus:
0.638
35.44%
33
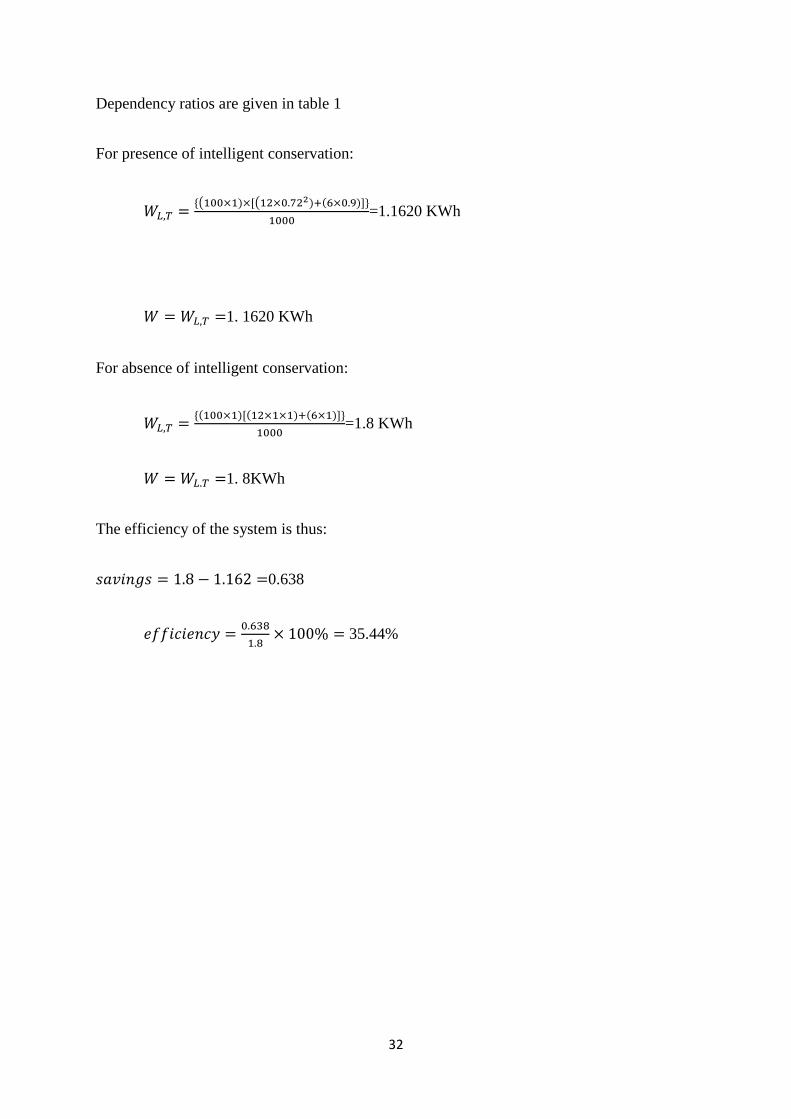
Figure 0.1: FULLY IMPLEMENTED CIRCUIT
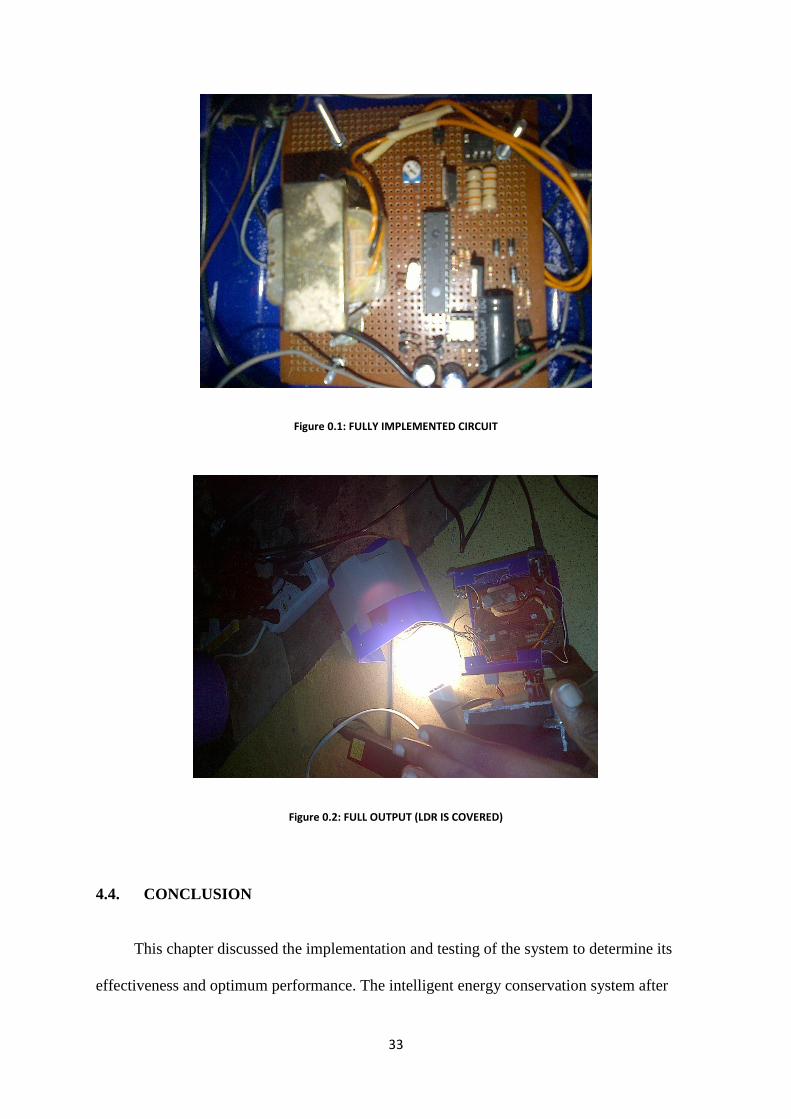
Figure 0.2: FULL OUTPUT (LDR IS COVERED)
4.4. CONCLUSION
This chapter discussed the implementation and testing of the system to determine its
effectiveness and optimum performance. The intelligent energy conservation system after

34
implementation and tests is efficient for just a single test bulb. This can be applied to several
luminaires and the efficiency would increase accordingly.
35
CHAPTER FIVE
CHALLENGES, CONCLUSION AND RECOMMENDATION
5.1. CHALLENGES
Like every research and practical engineering work, diverse kinds of challenges and
problems are often encountered. A number of problems and challenges were encountered
during the course of implementing this project.
During the construction phase, I had problems with the PIR sensor. The sensitivity of
the sensor was dependent on environmental temperature and brightness. The effects were
better towards evening conditions or dull environments. This was corrected by including and
extra enclosure for the sensor to reduce false triggering and under-sensitivity.
The sensor also needs to observe motion, so when an occupant is static, it seizes to
sense movement and lights are triggered off.
5.2. CONCLUSION
The intelligent energy system is an efficient system for controlling the use of lights.
The ease in the operation makes it practicable in residential buildings and office buildings
also. In Nigeria where energy efficient systems are not common nut energy demand is high,
the intelligent energy conservation system due to its demand response nature can provide an
energy management solution for most end users. Energy savings realised from its use would
reflect financially, as cost of recharging prepaid meters would reduce, and also the
environmental impact of energy efficiency.
36
5.3. RECOMMENDATION
The intelligent energy conservation system can be improved by incorporating other types
of sensors such as ultrasonic sensors, wind speed sensors and CO₂ sensors to implement in
larger spaces in buildings. These sensors would consider other environmental conditions
within the building to make the energy management more efficient and effective.
It would also curb the limitations of the PIR sensor of not detection static human
presence. It can also be expanded to include HVAC systems such as air conditioners,
electronic devices and appliances in kitchens and offices such as computers, cookers,
microwave ovens just to name a few

37
APPENDIX A
PROGAMMING CODE FOR PIC 16F873A
#define dimmer PORTC.F4
#define up PORTB.F1
#define down PORTB.F2
#define auto_ldr PORTB.F3
#define auto_pir PORTB.F4
#define ldr_indicator PORTB.F5
#define pir_indicator PORTB.F6
#define pir PORTB.F7
unsigned char a;
unsigned char aa;
unsigned char aaa;
void interrupt(void) {

38
for(a = 0; a < aa; a++) {
dimmer = 0;
delay_us(800);
}
dimmer = 1;
INTCON.INTF = 0;
}
unsigned int val;
void main()
{
aaa = 0;
ADCON1 = 0x80;
TRISC.F4 = 0;
TRISB.F1 = 1;
TRISB.F2 = 1;
TRISB.F3 = 1;
TRISB.F4 = 1;
TRISB.F5 = 0;

39
TRISB.F6 = 0;
TRISB.F7 = 1;
TRISA = 255;
delay_ms(4000);
INTCON.GIE = 1;
INTCON.INTE = 1;
INTCON.PEIE = 0;
OPTION_REG.INTEDG = 1;
aa = 5;
for(;;) {
if (aaa == 0) {
val =Adc_Read(0);
if (val < 70) aa = 12;
else if ((val >=70) && (val < 140)) aa = 11;
else if ((val >=140) && (val < 210)) aa = 10;
else if ((val >=210) && (val < 280)) aa = 9;
else if ((val >=280) && (val < 350)) aa = 8;

40
else if ((val >=350) && (val < 420)) aa = 7;
else if ((val >=420) && (val < 490)) aa = 6;
else if ((val >=490) && (val < 560)) aa = 5;
else if ((val >=560) && (val < 630)) aa = 4;
else if ((val >=630) && (val < 700)) aa = 3;
else if ((val >=700) && (val < 770)) aa = 2;
else if ((val >=770) && (val < 840)) aa = 1;
else if (val >=840) aa = 0;
delay_ms(10);
if (pir == 0) {
//dimmer = 1;
INTCON.INTE = 1;
delay_ms(5000);
}
else {
INTCON.INTE = 0;
dimmer = 0;
} if (auto_ldr == 0) {
aaa = 100;

41
INTCON.INTE = 0;
dimmer = 0;
delay_ms(1000);
dimmer = 1;
delay_ms(1000);
dimmer = 0;
INTCON.INTE = 1;
}
}
else {
if (up == 0) {
if (aa > 0) {
aa = aa - 1;
// E = B;
}delay_ms(100);
}
if (down == 0) {

42
if (aa < 12 ) {
aa = aa + 1;
//E = B;
} delay_ms(100);
}
if (auto_ldr == 0) {
aaa = 0;
INTCON.INTE = 0;
dimmer = 0;
delay_ms(1000);
dimmer = 1;
delay_ms(1000);
dimmer = 0;
INTCON.INTE = 1;
}
}
}
}

43
APPENDIX B
DATASHEET FOR PIC16F873A

44
45
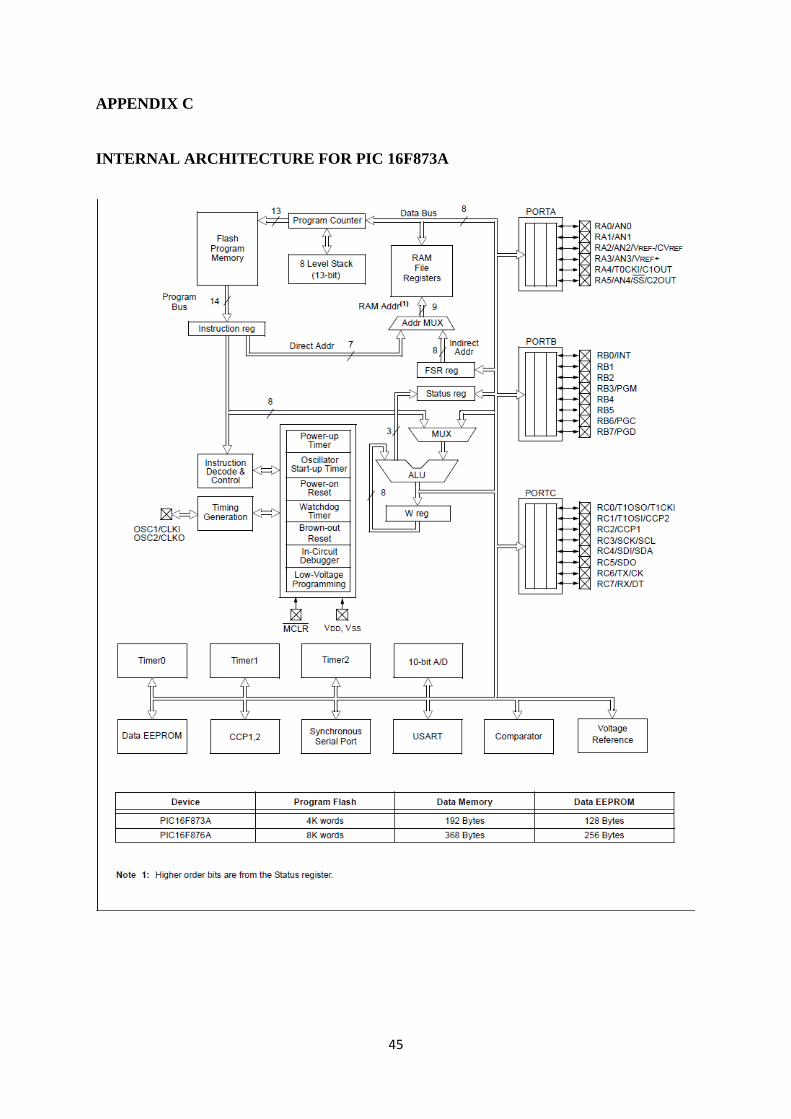
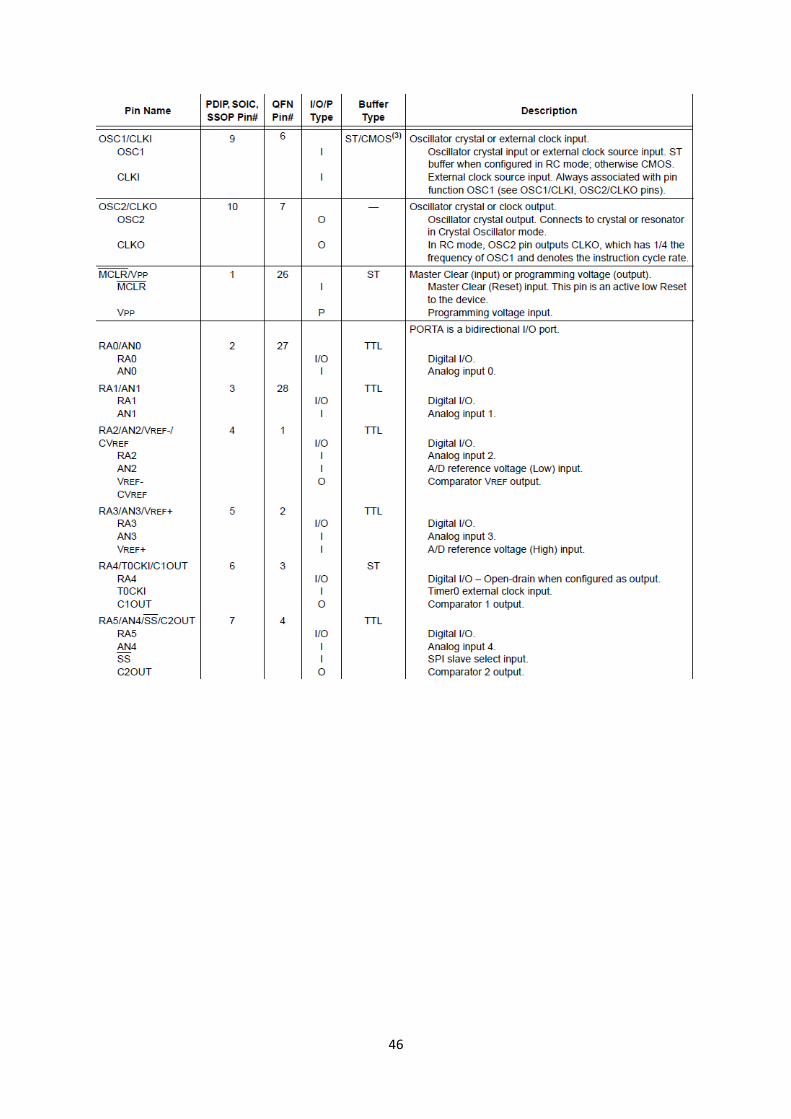
APPENDIX C
INTERNAL ARCHITECTURE FOR PIC 16F873A
46
47

48
REFERENCES
Anon., 2012. DORMITORY MOTION SENSOR LIGHTING. ETA KAPPA NU, ELECTRICAL, COMPUTER AND
SOFTWARE ENGINEERING SOCIETY.
Anon., n.d. ENERGY CONSERVATION-SWIKIPEDIA. [Online] Available at: http://www.sustainable-
buildings.org/wiki/index.php/Energy_Conservation 2012 AUGUST 2012].
BIRT, N., 2009. Energy savings from photosensors and occupant sensors/wall switches on a college
campus. ONTARIO, CANADA: INSTITUTE FOR RESEARCH IN CONSTRUCTION.
Energy Commision for Nigeria, APRIL 2003. NIGERIAN ENERGY POLICY. ABUJA: THE PRESIDENCY.
LAFARGE AND UNITED TECHNOLOGIES CORPORATION, 2007. ENERGY EFFICIENCY IN BUILDINGS.
WORLD BUSINESS COUNCIL FOR SUSTAINABLE DEVELOPMENT.
Manancia, D.T., 2000. Occupancy Sensor Simulations and energy analysis for commercial buildings.
Troy, NY: Lighting Reserch Centre Rensselear Polythecnic Institute.
mediawiki, 2009. ENERGY CONSERVATION - swikipedia. [Online] Available at: www.swikepedia.com.
Motegi, N..M.A.P.D.S.W.S.K.P.X., 2006. Introduction to Commercial Building Control Strategies and
Techniques for Demand Response. PUBLIC INTEREST ENERGY RESEARCH. CALIFORNIA ENERGY
COMMISSION.
Pierkaz, M., 2012. DORMITORY MOTION SENSOR LIGHTING. ETA KAPPA NU, ELECTRICAL, COMPUTER
AND SOFTWARE ENGINEERING SOCIETY.
Rundquist, M., 1996. Lighthing controls: Patterns For Design. Plesant Hills, CA: Electric Power
Institute.
Uyigue, 2007. Proceedings of a One Day seminar on Renewable Energy: The Key. In PROMOTING
RENEWABLE ENERGY AND ENERGY EFFICIENCY IN NIGERIA. CALABAR, 2007.
Uyigue, E., 2009. ENERGY EFFICIENCY SURVEY IN NIGERIA. COMMUNITY RESEARCH AND
DEVELOPMENT CENTER.
VADER, P., 2009. ENERGY CONSERVATION IN ELECTRICAL SYSTEM., 2009.
VADER, N.V. & PATIL, R.U., 2009. ENERGY CONSERVATION IN ELECTRICAL SYSTEM.
www.FAADOOENGINEERS.COM, n.d. INTELLIGENT ENERGY CONSERVATION SYSTEM. [Online].

49
Top Related
Copyright © 2022 FDOKUMEN

