


Bahasa
Halaman
Hukum

163
Impact of Political Events on Stock Market: Evidence from Pakistan
Shahid Mahmood
PhD Student, Department of Management Sciences, COMSAT Institute of Information
Technology, Islamabad, Pakistan and Lecturer, Department of Business Administration,
University of Sargodha, Pakistan
Muhammad Irfan and Saeed Iqbal
MBA student; Department of Business Administration, University of Sargodha, Pakistan
Muhammad Kamran
M. Phil student; Department of Education, University of Lahore, Sargodha Campus, Pakistan
Ali Ijaz
Visiting Lecturer; Department of Business Administration, University of Sargodha, Pakistan
Abstract
In this paper it is examined that how much political events impact the KSE-100 index returns,
fifty major political events are selected from the period of 1998 to 2013. To calculate the
abnormal returns, event study methodology is applied and KSE-100 index returns data for 30
days before and 60 days after happening of an event are also collected. Results of each window
verify that negative abnormal returns are observed some days before and some days after
happening of an event. This study helps the investor to judge the effect of political events on
KSE-100 index returns and develop strategy according to the political environment. Only major
political events are selected for a selected time horizon which is not covering the all political
episodes. Political conditions vary country to country and period to period. Further researches
can be made by selecting different political events for any other country. This study contributes
in literature and verifies the significant relationship between political events and stock market
returns.
Keywords: Political events, KSE-100 index, stock returns, event study
Introduction*
Usually, calculation of stock prices are
based on expected future cash flows
generated by asset and on the basis of
offered discount rate. In-spite of this, there
is a lot of other factors that affect the prices
of stocks like political policies of the
country (Yang et al., 2014), keeping
Corresponding author's
Name: Muhammad Irfan
Email address: [email protected]
organization under specific control (Lease et
al., 1983; Nenova, 2003; Zingales, 1994)
and restricted ownership (Stulz &
Wasserfallen, 1995). Since past few
decades, researchers discover various
economic factors that affect the stock market
performance such as interest rate, exchange
rate, inflation and deflation, foreign markets
trends etc. Stock market is also affected due
to different political events and such risk
always exists in less developed countries
due to their instable political conditions
(Bittlingmayer, 1998). During last decade
Journal of Asian Business Strategy
journal homepage: http://aessweb.com/journal-detail.php?id=5006
Journal of Asian Business Strategy, 4(12)2014: 163-174
164
several researches have analyzed the
importance of political conditions on
volatility of stock market around the world
(Beaulieu et al., 2006). Political stability
means predictable and reliable environment
of country in which residence feel safe and
all the activities are controlled by law.
Stability in political system is achieved
when the system is not derailing in crises
and during internal warfare. Political
stability is favorable for the investors
because investors feel less risk in the market
where political conditions are stable
(Manzoor, 2013). A disturbed political
system caused decline in the economic
performance of a country. In this study it is
investigated that how much stock market is
volatile due to different political changes
which also affect the economy in positive or
negative sense (Suleman, 2012). Unstable
political situations reduced foreign
investment in stock market and cause
volatility because investors are reluctant to
invest in more diverse political conditions
(Chan & John Wei, 1996).
This study focuses on shifting of
Government among different political
parties as well as discusses national and
international political changes that influence
the stock market behavior. Developing
countries affected through domestic as well
as international events but domestic events
like political conditions and imbalance
macro-economic variables are more
dangerous for the economy then the
international events (Khalid & Rajaguru,
2010) Political risk becomes a source of
negative returns in the stock market (Simon,
1982). This study inspects that how political
events lead to stock market volatility.
Impact of political events is analyzed in
various styles with reference to volatility.
Stock Market responds according to the
nature of a political event, prices will move
up if the events occur according to the
investor’s view point, on the other hand
prices will move down if events occur
against investor’s thoughts (Tan & Gannon,
2002). Different studies show that stock
prices fluctuate due to political events
(Nguthi, 2013). A Study about the
transformation of government between
different political parties and its
consequences with reference to stock
market, verifies that a relationship exist
between change in government and stock
market volatility. In this study it will be
investigated that political changes in
Pakistan have impact on KSE-100 index
returns. Since 1947, when Pakistan came
into bang, its political conditions remain
unstable and highly volatile for the
economy. After the death of Quaid-e-Azam
Muhammad Ali Jinnah and after that murder
of first Prime Minister Liaqat Ali Khan
political environment of Pakistan become
more unpredictable. Afterwards three Wars
with India, number of military takeovers,
international economic boycott after nuclear
test, depending upon foreign debts, incident
of Nine-Eleven and terrorism are the major
factors in history which make political
environment more unstable (Suleman,
2012). In first fifty years, no elected
government completed its five year duration.
Conflict of power between PMLn and PPP
provide a path to the Military takeovers and
none of them completed its government till
2008. So, this scenario confused the
investors about the policies of government
and increased systematic risk. Pakistani
political system is more uncertain and
affects by many national and international
events so this study analyzes the impact of
national and international political changes
on stock market of Pakistan (Gul et al.,
2013). This study will focus on 50 major
political changes during 1998 to 2013 in
Pakistan and check its impact on the Karachi
Stock Market. Karachi Stock Market is
becoming one of the best Asian Stock
Market and its index is increasing day by
day from last six to seven months. So, this
market has great attraction for the investors
who want to diversify their portfolio in
different markets (Gul et al., 2013).
Rest of the Paper is arranged as follows:
Literature review is discussed in second
section. Methodology is explained in third
section and Analysis is given in fourth
section. In the fifth and last section
conclusion of the study is described.
Literature review
In the past, lot of research work is done to
check to relationship between stock market
Journal of Asian Business Strategy, 4(12)2014: 163-174
165
and macro-economic factors like exchange
rate, inflation and interest rate etc. But
political factors are also having equal rank
in order to influence the trends of Stock
Market. In this study evidence from
(Pakistan) Karachi Stock Market is collected
to check whether political instability involve
in movement of prices or how much
political risk affect the investor’s decision
making. In Pakistan, after 52 years stable
political conditions are born which have
positive impact on KSE such as trading
volume is increasing day by day as well as
Stock Market Index touching its highest
limit of the history. But terrorist’s attack and
unstable law and order situation is still a
question mark for the investors (Gul et al.,
2013).
(Khalid & Rajaguru, 2010) conducted a
study using eight years data of different
political events which occur in Pakistan or
outside of Pakistan from Jan, 1999 to Sep,
2006 and examine the response of Karachi
Stock Market with reference to those events.
Different indicators of secondary market
such as exchange rate, stock prices and
interest rate are used to collect empirical
evidence. In this study Markov Switching
VAR model is used for the analysis of data
and results support that a relationship exist
between Karachi Stock Exchange and
national & international political reforms.
In another study on Karachi Stock Exchange
by (Suleman, 2012), outcomes of political
headlines are investigated in order to check
their impact on market return and how much
market is volatile due to these gossip. News
is divided into two classes as Good news
and Bad news, GARCH model is utilized to
evaluate variation in returns due to different
political news. The result defines that low
volatility of the market and high returns
when various optimistic news is prevailing.
On the other hand, shocking news political
affairs lead to more volatility of KSE and
low return is recorded due to such news.
A research work by (Aggarwal et al., 1999),
explains that different political events
become a source of volatility in stock
market of different countries. First of all
decided the duration of volatility in
developing stock markets afterward scan
internal and external event in order to check
base of volatility. To measure the abrupt
changes in stock returns in every market and
duration of those changes, ICSS algorithm
technique is applied. Domestic reforms are
affecting more than international events
such as Mexican exchange rate crises, high
inflation at Latin America etc. Only single
international event found during ten years
period that was a Crash of October 1987 due
to that security prices of different under-
developed stock markets become volatile.
A study by (Laverde et al., 2009), checked
the relationship among crime, political
uncertainty and market returns volatility in
Colombia. Last five years daily data was
used (July 2001 to October 2006) in order to
confirm a link between variables. Their
results showed that political uncertainty and
crime are important determinants of market
returns volatility. Market returns an activity
are partly influenced by crime while
political uncertainty has negative impact on
market returns of Colombia. Political
stability might accelerate the long run
growth.
In an article (Mukherjee & Leblang, 2007),
it is experimented that; is there any link
between diplomat’s policies, rate of interest
and rise and fall in stock prices in USA and
UK It is observed that investors hope high
interest rate when Democratic Party and
Labor Party are on government benches in
USA and UK respectively. On the other side
trading community anticipate low interest
rate when Republican Party and
Conservative Party are in Ruling in USA
and UK respectively. Investors Predictions
about an increase or decrease in interest rate
become reason of volatility in Stock
Markets. In this study the outcomes after
applying GARCH (LM and ARCH test)
model support the researcher theory.
A German study by (Döpke & Pierdzioch,
2006) is conducted to watch that how much
stock market is depending upon Political
events. VAR-based and popularity functions
are exercised in order to check the
relationship between variables. The results
suggest that there is a poor relationship
between political changes and stock market.
It is also concluded that exchange of
Journal of Asian Business Strategy, 4(12)2014: 163-174
166
Government between political parties does
not volatile the stock market unlike a study
on American Stock Market. It is also not
found that voting period affect the German
Stock Exchange.
In the light of existing literature it is evident
that political events have strong impact on
stock returns. Therefore present study
attempts to adopt the methodology used by
previous researchers to investigate the
impact of political events on KSE-100 index
returns.
Methodology
Political events have great impact on the
volatility of returns of any stock market.
After nuclear test, Pakistan faced economic
sanctions and similarly after nine-eleven
attacks Pakistan blamed to refuge the
terrorists and some other events also
impacted the economy of Pakistan
(Suleman, 2012). In order to check the
impact of different political events after
nuclear test of Pakistan this study is
conducted. Fifty major events from 1998-
2013 are selected for analyzing that how
much these events become cause of
volatility in returns. One month before event
day and two months after event day KSE-
100 Index returns are also collected to prove
null hypothesis.
In order to prove null hypothesis that
political events do not affect the stock
market returns, event study technique is
used. Event study is most common
technique to check the impact of various
events on the efficiency of stock market.
According to this method it is measured how
market trends are going on before happening
of an event and what changes occur after
happening of an event (Bhagat et al., 1985).
Same technique is used to measure the short
time period volatility in returns of Quebec
companies in response to October 30th
1995,
elections (Beaulieu et al., 2006). Event
study technique is used to evaluate that the
stock purchase plan affect the value of the
stock hold by existing shareholders. To
analyze the change in return between pre
and post period from purchase day, event
study methodology is used (Bhagat et al.,
1985). Event study technique is way to
check the impact of different events for
short time horizon that how much abnormal
returns are generated after happening of an
event (Brown & Warner, 1985). A study
about stock dividend announcements and its
impact on fluctuations of return, after and
before announcement days, is calculated by
using event study methodology.
It is expected that political events will affect
the market returns for the short time period
(for 10-15 days) not for longer time period.
In short run KSE-100 Index shows volatility
because every event affect the economy of
Pakistan and KSE-100 index is best
indicator to gauge the economic
performance in the country. But, it is
expected that after 10-15 days no more
volatility in KSE-100 Index.
Three event windows are established to
evaluate the impact of different political
events on KSE-100 index. First window
consists of 91 days (-30th
day to +60th
day),
second window consists of 61 days (-30th
day to +30th
day) and third window consists
of 21 days (-10th
day to +10th
day). Purpose
of selecting different windows is to measure
that how returns behave towards the closer
the event day and far from event day.
Market adjusted returns
Afterwards a return generating technique is
used; actual returns of KSE-100 index for all
selected days are calculated as closing index
minus opening index (previous day closing)
and divided by opening index (previous day
closing) define in equation (1) as under:
Rmt = (Mt – Mt-1)/Mt-1 ……………..... (1)
Where
Rmt = Market return on day t.
Mt = Market index value today.
Mt-1 = Market index value of last day.
Mean return of selected sample is calculated
by applying average formula on actual
return of all days. Abnormal return is
calculated as difference between actual and
average return which is explained in
equation (2) as under:
Ait = Ri,t – Ri,t …………………. (2)
Journal of Asian Business Strategy, 4(12)2014: 163-174
167
Where
Ait = Abnormal return for the t day.
Ri,t= Actual return for the t day.
__
Ri,t= Average return for the t day.
When abnormal return of all events are
achieved for whole sample period then
average abnormal return and cumulative
average abnormal return is calculated
according to following equation (3) and (4)
respectively:
Avg. of abnormal returns of all fifty events
for each day.
AARit = 1
𝑁 𝐴𝑅𝑁
𝑡=1 𝑖𝑡 ………………… (3)
Here,
AAR= Average of abnormal returns of all
fifty events for each day.
1
𝑁 𝐴𝑅𝑁
𝑡=1 𝑖𝑡= Sum of abnormal returns of
all fifty events for each day.
Cumulative average of abnormal returns of
all fifty events for each day.
𝐶𝐴𝐴𝑅 𝑇1,𝑇2 = 1
𝑁 𝐴𝑅𝑖𝑡𝑁
𝑡=1𝑇2𝑇1 .….....
(4)
Here,
CAAR= Cumulative average abnormal
returns of all fifty events for each day.
1
𝑁 𝐴𝑅𝑖𝑡𝑁
𝑡=1𝑇2𝑇1 = Sum of every next
average abnormal return till last day.
Test of significance
Results of average abnormal returns and
cumulative average abnormal returns are
understandable when it is statistically tested
and its level of significance is obtained
through statistical test. Numbers of
parametric and non-parametric tests are
available to find out the level of
significance. But in this study t-test is used
because it is very simple test to apply on
abnormal returns of KSE-100 index. It is
assumed in t-test that data is normally
distributed. Fifty major political events are
selected to estimate their impact on the
KSE-100 index returns before 30 days after
60 days of event day, therefore distribution
normality for the selected period is biased.
T-test is calculated as under:
t value= AAR or CAAR/ S.D. of (AAR) or
(CAAR) …………………………… (5)
Here,
AAR= Average Abnormal returns
S. D. of (AR) = Standard Deviation of
Average abnormal return or Cumulative
Average abnormal return.
Analysis results
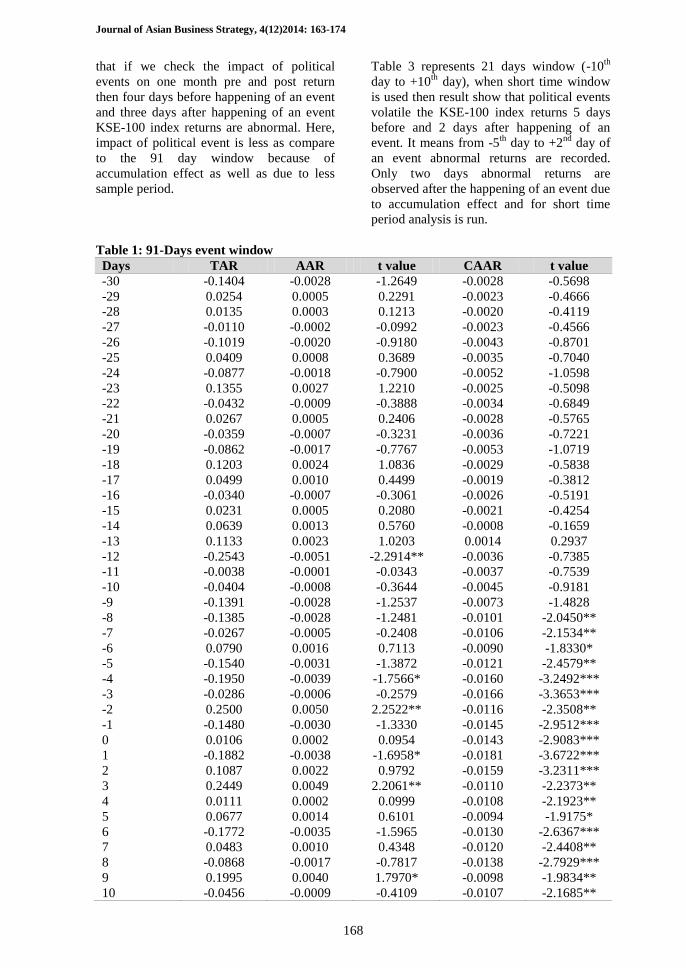
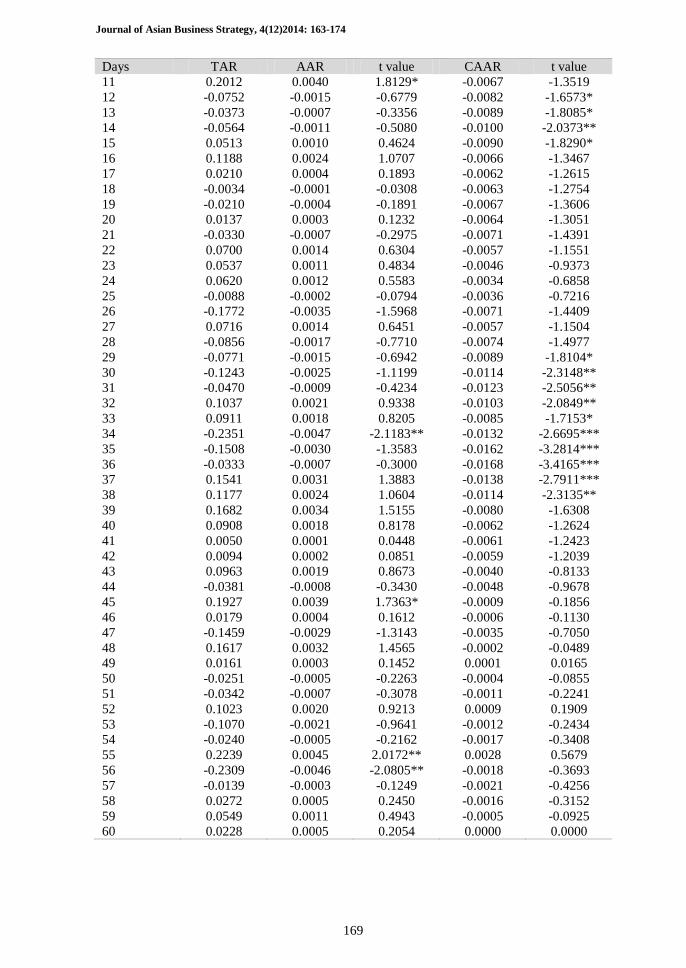
Following table 1, table 2 and table 3
represents 91 days window (-30th
day to
+60th
day), 61 days window (-30th
day to
+30th
day) and 21 days window (-10th
day to
+10th
day) respectively. The purpose of
selecting three different windows (for
different period) is to compare the volatility
in returns for short time period as well as for
long time period. The result of this analysis
indicates that return of average abnormal
returns and cumulative abnormal return are
90%, 95%, 99% significant where *, **, ***
exist respectively in front of t-value. T-value
is determined by applying t-test on AAR and
CAAR; t-test is calculated according to the
equation (05).
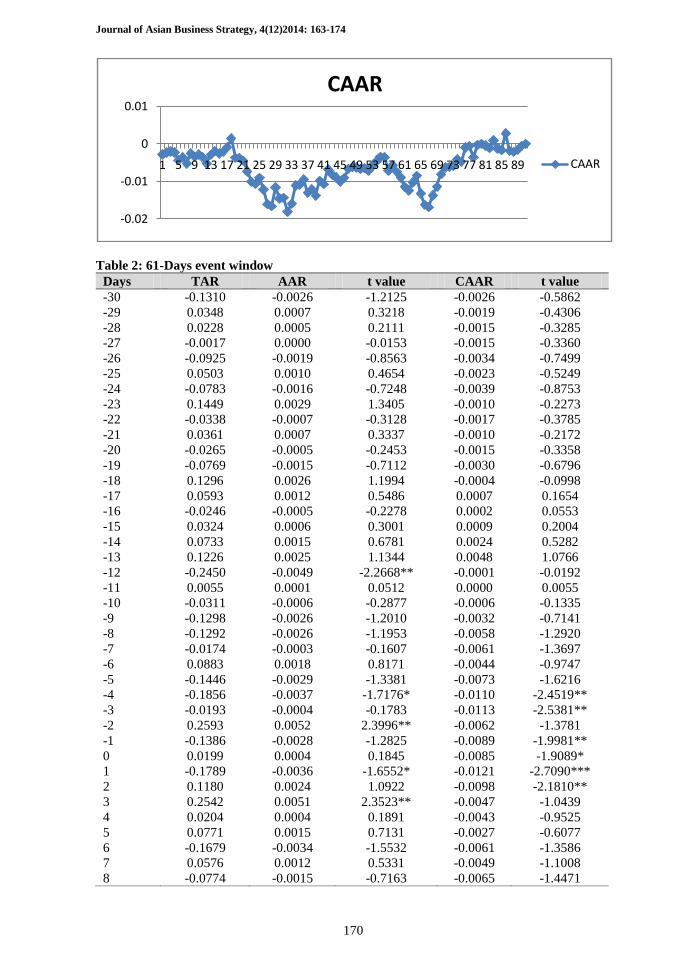
Table 1 represents 91days window (-30th
day to +60th
day), when t-test is applied on
this window significant results are achieved
from (-8th
day to +15th
day). This thing
shows that political events in Pakistan
volatile the KSE-100 index returns before
8th
day of an event and abnormal returns is
observed till 15th day after the occurrence of
an event. After the 15th
day the KSE-100
index move according to its routine but
again significant results are achieved from
+29th
day to +38th day. Because Pakistan has
instable political conditions and number of
events happened in three month period, so,
repeated significance is in response of any
other event or may be due to market
inefficiency.
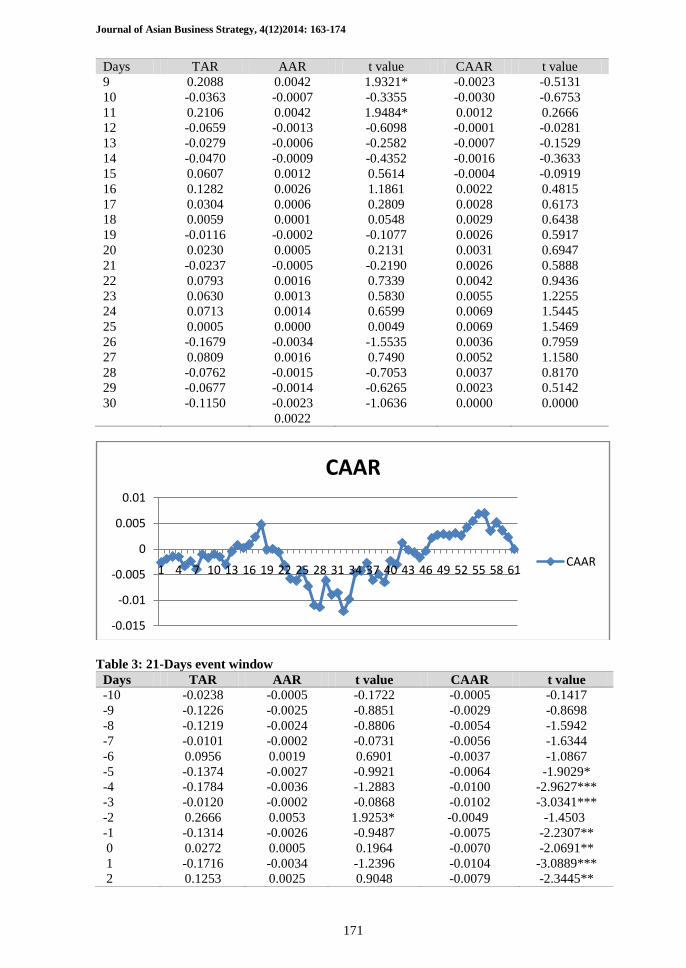
Table 2 denotes 61 days window (-30th
day
to +30 day), in this selected time horizon
results become significant from -4th
day to
+3rd
day when event happened so it is said
Journal of Asian Business Strategy, 4(12)2014: 163-174
168
that if we check the impact of political
events on one month pre and post return
then four days before happening of an event
and three days after happening of an event
KSE-100 index returns are abnormal. Here,
impact of political event is less as compare
to the 91 day window because of
accumulation effect as well as due to less
sample period.
Table 3 represents 21 days window (-10th
day to +10th
day), when short time window
is used then result show that political events
volatile the KSE-100 index returns 5 days
before and 2 days after happening of an
event. It means from -5th
day to +2nd
day of
an event abnormal returns are recorded.
Only two days abnormal returns are
observed after the happening of an event due
to accumulation effect and for short time
period analysis is run.
Table 1: 91-Days event window
Days TAR AAR t value CAAR t value
-30 -0.1404 -0.0028 -1.2649 -0.0028 -0.5698
-29 0.0254 0.0005 0.2291 -0.0023 -0.4666
-28 0.0135 0.0003 0.1213 -0.0020 -0.4119
-27 -0.0110 -0.0002 -0.0992 -0.0023 -0.4566
-26 -0.1019 -0.0020 -0.9180 -0.0043 -0.8701
-25 0.0409 0.0008 0.3689 -0.0035 -0.7040
-24 -0.0877 -0.0018 -0.7900 -0.0052 -1.0598
-23 0.1355 0.0027 1.2210 -0.0025 -0.5098
-22 -0.0432 -0.0009 -0.3888 -0.0034 -0.6849
-21 0.0267 0.0005 0.2406 -0.0028 -0.5765
-20 -0.0359 -0.0007 -0.3231 -0.0036 -0.7221
-19 -0.0862 -0.0017 -0.7767 -0.0053 -1.0719
-18 0.1203 0.0024 1.0836 -0.0029 -0.5838
-17 0.0499 0.0010 0.4499 -0.0019 -0.3812
-16 -0.0340 -0.0007 -0.3061 -0.0026 -0.5191
-15 0.0231 0.0005 0.2080 -0.0021 -0.4254
-14 0.0639 0.0013 0.5760 -0.0008 -0.1659
-13 0.1133 0.0023 1.0203 0.0014 0.2937
-12 -0.2543 -0.0051 -2.2914** -0.0036 -0.7385
-11 -0.0038 -0.0001 -0.0343 -0.0037 -0.7539
-10 -0.0404 -0.0008 -0.3644 -0.0045 -0.9181
-9 -0.1391 -0.0028 -1.2537 -0.0073 -1.4828
-8 -0.1385 -0.0028 -1.2481 -0.0101 -2.0450**
-7 -0.0267 -0.0005 -0.2408 -0.0106 -2.1534**
-6 0.0790 0.0016 0.7113 -0.0090 -1.8330*
-5 -0.1540 -0.0031 -1.3872 -0.0121 -2.4579**
-4 -0.1950 -0.0039 -1.7566* -0.0160 -3.2492***
-3 -0.0286 -0.0006 -0.2579 -0.0166 -3.3653***
-2 0.2500 0.0050 2.2522** -0.0116 -2.3508**
-1 -0.1480 -0.0030 -1.3330 -0.0145 -2.9512***
0 0.0106 0.0002 0.0954 -0.0143 -2.9083***
1 -0.1882 -0.0038 -1.6958* -0.0181 -3.6722***
2 0.1087 0.0022 0.9792 -0.0159 -3.2311***
3 0.2449 0.0049 2.2061** -0.0110 -2.2373**
4 0.0111 0.0002 0.0999 -0.0108 -2.1923**
5 0.0677 0.0014 0.6101 -0.0094 -1.9175*
6 -0.1772 -0.0035 -1.5965 -0.0130 -2.6367***
7 0.0483 0.0010 0.4348 -0.0120 -2.4408**
8 -0.0868 -0.0017 -0.7817 -0.0138 -2.7929***
9 0.1995 0.0040 1.7970* -0.0098 -1.9834**
10 -0.0456 -0.0009 -0.4109 -0.0107 -2.1685**
Journal of Asian Business Strategy, 4(12)2014: 163-174
169
Days TAR AAR t value CAAR t value
11 0.2012 0.0040 1.8129* -0.0067 -1.3519
12 -0.0752 -0.0015 -0.6779 -0.0082 -1.6573*
13 -0.0373 -0.0007 -0.3356 -0.0089 -1.8085*
14 -0.0564 -0.0011 -0.5080 -0.0100 -2.0373**
15 0.0513 0.0010 0.4624 -0.0090 -1.8290*
16 0.1188 0.0024 1.0707 -0.0066 -1.3467
17 0.0210 0.0004 0.1893 -0.0062 -1.2615
18 -0.0034 -0.0001 -0.0308 -0.0063 -1.2754
19 -0.0210 -0.0004 -0.1891 -0.0067 -1.3606
20 0.0137 0.0003 0.1232 -0.0064 -1.3051
21 -0.0330 -0.0007 -0.2975 -0.0071 -1.4391
22 0.0700 0.0014 0.6304 -0.0057 -1.1551
23 0.0537 0.0011 0.4834 -0.0046 -0.9373
24 0.0620 0.0012 0.5583 -0.0034 -0.6858
25 -0.0088 -0.0002 -0.0794 -0.0036 -0.7216
26 -0.1772 -0.0035 -1.5968 -0.0071 -1.4409
27 0.0716 0.0014 0.6451 -0.0057 -1.1504
28 -0.0856 -0.0017 -0.7710 -0.0074 -1.4977
29 -0.0771 -0.0015 -0.6942 -0.0089 -1.8104*
30 -0.1243 -0.0025 -1.1199 -0.0114 -2.3148**
31 -0.0470 -0.0009 -0.4234 -0.0123 -2.5056**
32 0.1037 0.0021 0.9338 -0.0103 -2.0849**
33 0.0911 0.0018 0.8205 -0.0085 -1.7153*
34 -0.2351 -0.0047 -2.1183** -0.0132 -2.6695***
35 -0.1508 -0.0030 -1.3583 -0.0162 -3.2814***
36 -0.0333 -0.0007 -0.3000 -0.0168 -3.4165***
37 0.1541 0.0031 1.3883 -0.0138 -2.7911***
38 0.1177 0.0024 1.0604 -0.0114 -2.3135**
39 0.1682 0.0034 1.5155 -0.0080 -1.6308
40 0.0908 0.0018 0.8178 -0.0062 -1.2624
41 0.0050 0.0001 0.0448 -0.0061 -1.2423
42 0.0094 0.0002 0.0851 -0.0059 -1.2039
43 0.0963 0.0019 0.8673 -0.0040 -0.8133
44 -0.0381 -0.0008 -0.3430 -0.0048 -0.9678
45 0.1927 0.0039 1.7363* -0.0009 -0.1856
46 0.0179 0.0004 0.1612 -0.0006 -0.1130
47 -0.1459 -0.0029 -1.3143 -0.0035 -0.7050
48 0.1617 0.0032 1.4565 -0.0002 -0.0489
49 0.0161 0.0003 0.1452 0.0001 0.0165
50 -0.0251 -0.0005 -0.2263 -0.0004 -0.0855
51 -0.0342 -0.0007 -0.3078 -0.0011 -0.2241
52 0.1023 0.0020 0.9213 0.0009 0.1909
53 -0.1070 -0.0021 -0.9641 -0.0012 -0.2434
54 -0.0240 -0.0005 -0.2162 -0.0017 -0.3408
55 0.2239 0.0045 2.0172** 0.0028 0.5679
56 -0.2309 -0.0046 -2.0805** -0.0018 -0.3693
57 -0.0139 -0.0003 -0.1249 -0.0021 -0.4256
58 0.0272 0.0005 0.2450 -0.0016 -0.3152
59 0.0549 0.0011 0.4943 -0.0005 -0.0925
60 0.0228 0.0005 0.2054 0.0000 0.0000
Journal of Asian Business Strategy, 4(12)2014: 163-174
170
Table 2: 61-Days event window
Days TAR AAR t value CAAR t value
-30 -0.1310 -0.0026 -1.2125 -0.0026 -0.5862
-29 0.0348 0.0007 0.3218 -0.0019 -0.4306
-28 0.0228 0.0005 0.2111 -0.0015 -0.3285
-27 -0.0017 0.0000 -0.0153 -0.0015 -0.3360
-26 -0.0925 -0.0019 -0.8563 -0.0034 -0.7499
-25 0.0503 0.0010 0.4654 -0.0023 -0.5249
-24 -0.0783 -0.0016 -0.7248 -0.0039 -0.8753
-23 0.1449 0.0029 1.3405 -0.0010 -0.2273
-22 -0.0338 -0.0007 -0.3128 -0.0017 -0.3785
-21 0.0361 0.0007 0.3337 -0.0010 -0.2172
-20 -0.0265 -0.0005 -0.2453 -0.0015 -0.3358
-19 -0.0769 -0.0015 -0.7112 -0.0030 -0.6796
-18 0.1296 0.0026 1.1994 -0.0004 -0.0998
-17 0.0593 0.0012 0.5486 0.0007 0.1654
-16 -0.0246 -0.0005 -0.2278 0.0002 0.0553
-15 0.0324 0.0006 0.3001 0.0009 0.2004
-14 0.0733 0.0015 0.6781 0.0024 0.5282
-13 0.1226 0.0025 1.1344 0.0048 1.0766
-12 -0.2450 -0.0049 -2.2668** -0.0001 -0.0192
-11 0.0055 0.0001 0.0512 0.0000 0.0055
-10 -0.0311 -0.0006 -0.2877 -0.0006 -0.1335
-9 -0.1298 -0.0026 -1.2010 -0.0032 -0.7141
-8 -0.1292 -0.0026 -1.1953 -0.0058 -1.2920
-7 -0.0174 -0.0003 -0.1607 -0.0061 -1.3697
-6 0.0883 0.0018 0.8171 -0.0044 -0.9747
-5 -0.1446 -0.0029 -1.3381 -0.0073 -1.6216
-4 -0.1856 -0.0037 -1.7176* -0.0110 -2.4519**
-3 -0.0193 -0.0004 -0.1783 -0.0113 -2.5381**
-2 0.2593 0.0052 2.3996** -0.0062 -1.3781
-1 -0.1386 -0.0028 -1.2825 -0.0089 -1.9981**
0 0.0199 0.0004 0.1845 -0.0085 -1.9089*
1 -0.1789 -0.0036 -1.6552* -0.0121 -2.7090***
2 0.1180 0.0024 1.0922 -0.0098 -2.1810**
3 0.2542 0.0051 2.3523** -0.0047 -1.0439
4 0.0204 0.0004 0.1891 -0.0043 -0.9525
5 0.0771 0.0015 0.7131 -0.0027 -0.6077
6 -0.1679 -0.0034 -1.5532 -0.0061 -1.3586
7 0.0576 0.0012 0.5331 -0.0049 -1.1008
8 -0.0774 -0.0015 -0.7163 -0.0065 -1.4471
-0.02
-0.01
0
0.01
1 5 9 13 17 21 25 29 33 37 41 45 49 53 57 61 65 69 73 77 81 85 89
CAAR
CAAR
Journal of Asian Business Strategy, 4(12)2014: 163-174
171
Days TAR AAR t value CAAR t value
9 0.2088 0.0042 1.9321* -0.0023 -0.5131
10 -0.0363 -0.0007 -0.3355 -0.0030 -0.6753
11 0.2106 0.0042 1.9484* 0.0012 0.2666
12 -0.0659 -0.0013 -0.6098 -0.0001 -0.0281
13 -0.0279 -0.0006 -0.2582 -0.0007 -0.1529
14 -0.0470 -0.0009 -0.4352 -0.0016 -0.3633
15 0.0607 0.0012 0.5614 -0.0004 -0.0919
16 0.1282 0.0026 1.1861 0.0022 0.4815
17 0.0304 0.0006 0.2809 0.0028 0.6173
18 0.0059 0.0001 0.0548 0.0029 0.6438
19 -0.0116 -0.0002 -0.1077 0.0026 0.5917
20 0.0230 0.0005 0.2131 0.0031 0.6947
21 -0.0237 -0.0005 -0.2190 0.0026 0.5888
22 0.0793 0.0016 0.7339 0.0042 0.9436
23 0.0630 0.0013 0.5830 0.0055 1.2255
24 0.0713 0.0014 0.6599 0.0069 1.5445
25 0.0005 0.0000 0.0049 0.0069 1.5469
26 -0.1679 -0.0034 -1.5535 0.0036 0.7959
27 0.0809 0.0016 0.7490 0.0052 1.1580
28 -0.0762 -0.0015 -0.7053 0.0037 0.8170
29 -0.0677 -0.0014 -0.6265 0.0023 0.5142
30 -0.1150 -0.0023 -1.0636 0.0000 0.0000
0.0022
Table 3: 21-Days event window
Days TAR AAR t value CAAR t value
-10 -0.0238 -0.0005 -0.1722 -0.0005 -0.1417
-9 -0.1226 -0.0025 -0.8851 -0.0029 -0.8698
-8 -0.1219 -0.0024 -0.8806 -0.0054 -1.5942
-7 -0.0101 -0.0002 -0.0731 -0.0056 -1.6344
-6 0.0956 0.0019 0.6901 -0.0037 -1.0867
-5 -0.1374 -0.0027 -0.9921 -0.0064 -1.9029*
-4 -0.1784 -0.0036 -1.2883 -0.0100 -2.9627***
-3 -0.0120 -0.0002 -0.0868 -0.0102 -3.0341***
-2 0.2666 0.0053 1.9253* -0.0049 -1.4503
-1 -0.1314 -0.0026 -0.9487 -0.0075 -2.2307**
0 0.0272 0.0005 0.1964 -0.0070 -2.0691**
1 -0.1716 -0.0034 -1.2396 -0.0104 -3.0889***
2 0.1253 0.0025 0.9048 -0.0079 -2.3445**
-0.015
-0.01
-0.005
0
0.005
0.01
1 4 7 10 13 16 19 22 25 28 31 34 37 40 43 46 49 52 55 58 61
CAAR
CAAR
Journal of Asian Business Strategy, 4(12)2014: 163-174
172
3 0.2615 0.0052 1.8884* -0.0027 -0.7910
4 0.0277 0.0006 0.2000 -0.0021 -0.6265
5 0.0843 0.0017 0.6090 -0.0004 -0.1256
6 -0.1606 -0.0032 -1.1600 -0.0036 -1.0798
7 0.0649 0.0013 0.4685 -0.0023 -0.6944
8 -0.0702 -0.0014 -0.5068 -0.0037 -1.1113
9 0.2161 0.0043 1.5604 0.0006 0.1724
10 -0.0290 -0.0006 -0.2095 0.0000 0.0000
0.0028
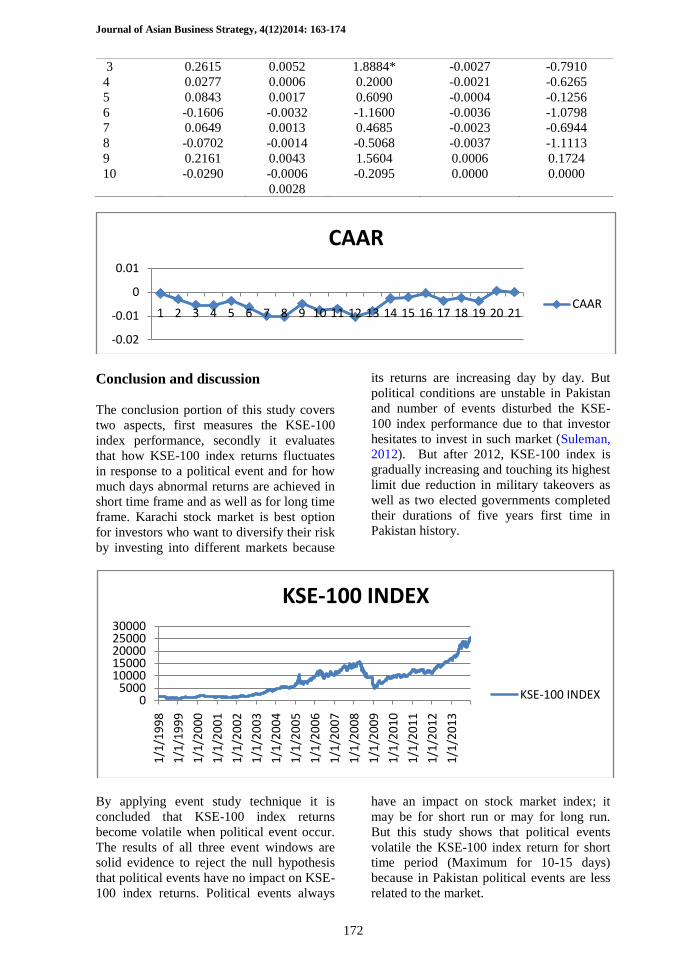
Conclusion and discussion
The conclusion portion of this study covers
two aspects, first measures the KSE-100
index performance, secondly it evaluates
that how KSE-100 index returns fluctuates
in response to a political event and for how
much days abnormal returns are achieved in
short time frame and as well as for long time
frame. Karachi stock market is best option
for investors who want to diversify their risk
by investing into different markets because
its returns are increasing day by day. But
political conditions are unstable in Pakistan
and number of events disturbed the KSE-
100 index performance due to that investor
hesitates to invest in such market (Suleman,
2012). But after 2012, KSE-100 index is
gradually increasing and touching its highest
limit due reduction in military takeovers as
well as two elected governments completed
their durations of five years first time in
Pakistan history.
By applying event study technique it is
concluded that KSE-100 index returns
become volatile when political event occur.
The results of all three event windows are
solid evidence to reject the null hypothesis
that political events have no impact on KSE-
100 index returns. Political events always
have an impact on stock market index; it
may be for short run or may for long run.
But this study shows that political events
volatile the KSE-100 index return for short
time period (Maximum for 10-15 days)
because in Pakistan political events are less
related to the market.
-0.02
-0.01
0
0.01
1 2 3 4 5 6 7 8 9 10 11 12 13 14 15 16 17 18 19 20 21
CAAR
CAAR
05000
1000015000200002500030000
1/1
/19
98
1/1
/19
99
1/1
/20
00
1/1
/20
01
1/1
/20
02
1/1
/20
03
1/1
/20
04
1/1
/20
05
1/1
/20
06
1/1
/20
07
1/1
/20
08
1/1
/20
09
1/1
/20
10
1/1
/20
11
1/1
/20
12
1/1
/20
13
KSE-100 INDEX
KSE-100 INDEX
Journal of Asian Business Strategy, 4(12)2014: 163-174
173
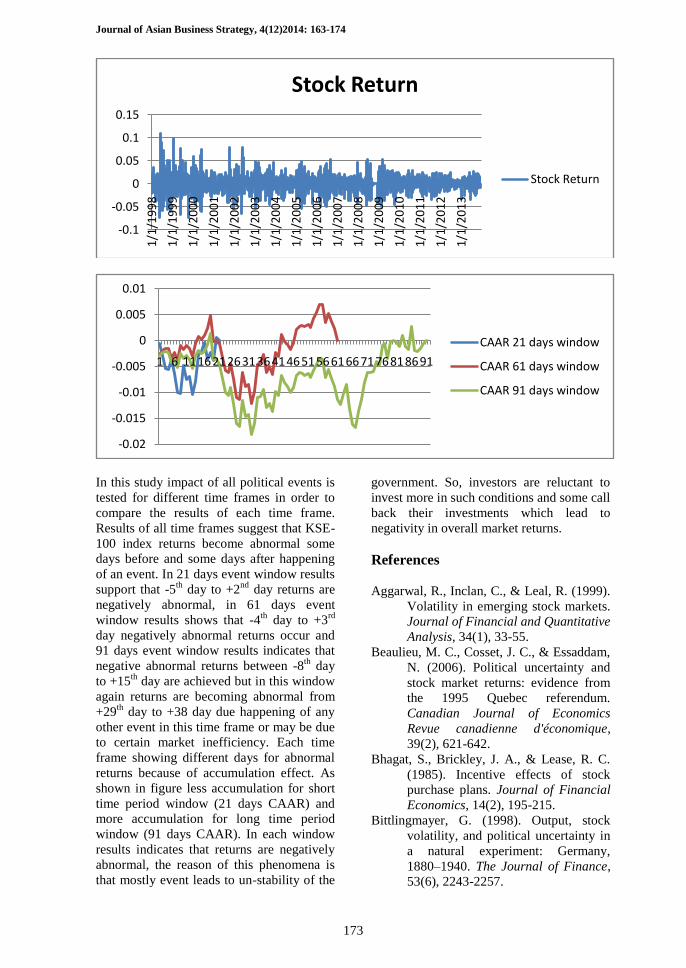
In this study impact of all political events is
tested for different time frames in order to
compare the results of each time frame.
Results of all time frames suggest that KSE-
100 index returns become abnormal some
days before and some days after happening
of an event. In 21 days event window results
support that -5th
day to +2nd
day returns are
negatively abnormal, in 61 days event
window results shows that -4th
day to +3rd
day negatively abnormal returns occur and
91 days event window results indicates that
negative abnormal returns between -8th
day
to +15th
day are achieved but in this window
again returns are becoming abnormal from
+29th
day to +38 day due happening of any
other event in this time frame or may be due
to certain market inefficiency. Each time
frame showing different days for abnormal
returns because of accumulation effect. As
shown in figure less accumulation for short
time period window (21 days CAAR) and
more accumulation for long time period
window (91 days CAAR). In each window
results indicates that returns are negatively
abnormal, the reason of this phenomena is
that mostly event leads to un-stability of the
government. So, investors are reluctant to
invest more in such conditions and some call
back their investments which lead to
negativity in overall market returns.
References
Aggarwal, R., Inclan, C., & Leal, R. (1999).
Volatility in emerging stock markets.
Journal of Financial and Quantitative
Analysis, 34(1), 33-55.
Beaulieu, M. C., Cosset, J. C., & Essaddam,
N. (2006). Political uncertainty and
stock market returns: evidence from
the 1995 Quebec referendum.
Canadian Journal of Economics
Revue canadienne d'économique,
39(2), 621-642.
Bhagat, S., Brickley, J. A., & Lease, R. C.
(1985). Incentive effects of stock
purchase plans. Journal of Financial
Economics, 14(2), 195-215.
Bittlingmayer, G. (1998). Output, stock
volatility, and political uncertainty in
a natural experiment: Germany,
1880–1940. The Journal of Finance,
53(6), 2243-2257.
-0.1
-0.05
0
0.05
0.1
0.15
1/1
/19
98
1/1
/19
99
1/1
/20
00
1/1
/20
01
1/1
/20
02
1/1
/20
03
1/1
/20
04
1/1
/20
05
1/1
/20
06
1/1
/20
07
1/1
/20
08
1/1
/20
09
1/1
/20
10
1/1
/20
11
1/1
/20
12
1/1
/20
13
Stock Return
Stock Return
-0.02
-0.015
-0.01
-0.005
0
0.005
0.01
1 6 1116212631364146515661667176818691
CAAR 21 days window
CAAR 61 days window
CAAR 91 days window

Journal of Asian Business Strategy, 4(12)2014: 163-174
174
Brown, S. J., & Warner, J. B. (1985). Using
daily stock returns: The case of event
studies. Journal of Financial
Economics, 14(1), 3-31.
Chan, Y. C., & John, W. K. (1996). Political
risk and stock price volatility: the
case of Hong Kong. Pacific-Basin
Finance Journal, 4(2), 259-275.
Döpke, J., & Pierdzioch, C. (2006). Politics
and the stock market: Evidence from
Germany. European Journal of
Political Economy, 22(4), 925-943.
Gul, S., Khan, M. T., Saif, N., & Rehman, S.
U. (2013). Stock Market Reaction to
Political Events (Evidence from
Pakistan). Journal of Economics and
Sustainable Development, 4(1), 165-
174.
Khalid, A. M., & Rajaguru, G. (2010). The
impact of political events on financial
market volatility: Evidence using a
Markov Switching process, Working
Paper Series; No. 43, The
Globalisation and Development
Centre, Bond University, Austraila.
Laverde, J. C. F., Varua, M. E., & Garces-
Ozanne, A. (2009). Understanding
Crime, Political Uncertainty and
Stock Market Returns. World
Economics, 10(2), 109-116.
Lease, R. C., McConnell, J. J., & Mikkelson,
W. H. (1983). The market value of
control in publicly-traded
corporations. Journal of Financial
Economics, 11(1), 439-471.
Manzoor, H. (2013). Impact of pak-US
relationship news on KSE-100 Index.
Basic Research Journal of Business
Management and Accounts, 2(2), 1-
24.
Mukherjee, B., & Leblang, D. (2007).
Partisan politics, interest rates and the
stock market: Evidence from
American and British returns in the
twentieth century. Economics &
Politics, 19(2), 135-167.
Nenova, T. (2003). The value of corporate
voting rights and control: A cross-
country analysis. Journal of
Financial Economics, 68(3), 325-351.
Nguthi, P. N. U. (2013). The effect of
political news on stock market
returns in Kenya. The case of March
2013 general elections. University of
Nairobi.
Simon, J. D. (1982). Political risk
assessment-past trends and future-
prospects. Columbia Journal of
World Business, 17(3), 62-71.
Stulz, R. M., & Wasserfallen, W. (1995).
Foreign equity investment
restrictions, capital flight, and
shareholder wealth maximization:
Theory and evidence. Review of
Financial Studies, 8(4), 1019-1057.
Suleman, M. T. (2012). Stock market
reaction to good and bad political
news. Asian Journal of Finance &
Accounting, 4(1), 299-312.
Tan, O. G., & Gannon, G. L. (2002).
‘Information effect ‘of economic
news: SPI futures. International
Review of Financial Analysis, 11(4),
467-489.
Yang, F., Wilson, C., & Wu, Z. (2014).
Investor perceptions of the benefits of
political connections: Evidence from
China's A-share premiums.
International Journal of Managerial
Finance, 10(3), 312-331.
Zingales, L. (1994). The value of the voting
right: A study of the Milan stock
exchange experience. Review of
financial Studies, 7(1), 125-148.
Top Related
Copyright © 2022 FDOKUMEN

