


Bahasa
Halaman
Hukum


Lincoln University Digital Thesis
Copyright Statement
The digital copy of this thesis is protected by the Copyright Act 1994 (New Zealand).
This thesis may be consulted by you, provided you comply with the provisions of the Act and the following conditions of use:
you will use the copy only for the purposes of research or private study you will recognise the author's right to be identified as the author of the thesis and
due acknowledgement will be made to the author where appropriate you will obtain the author's permission before publishing any material from the
thesis.

Impact of commercial banking sector development on economic
growth in small Pacific countries: A case study of the Vanuatu
economy
A thesis
submitted in partial fulfilment
of the requirements for the Degree of
Master of Commerce and Management
at
Lincoln University
by
Lynette Ragonmal
Lincoln University
2015

ii
Abstract of a thesis submitted in partial fulfilment of the
requirements for the Degree of Master of Commerce and Management.
Abstract
Impact of commercial banking sector development on economic growth in
small Pacific countries: A case study of the Vanuatu economy
by
Lynette Ragonmal
Apart from the positive and significant correlation between bank credit and development (King &
Levine, 1993b), earlier studies by McKinnon (1973) and Shaw (1973) also documented the role of
financial sectors in developing economies and identified struggling economies with least developed
financial sectors which exhibit less minimization of asymmetric information and high transaction
costs. A number of extensive literatures have highlighted the positive impact of financial
development in developed countries on growth; however very little has been documented for small
Pacific Island Countries with underdeveloped financial systems. An empirical analysis using time-
series data from 1983 to 2013 is used in this study to investigate the impact of financial development
through commercial banking on economic growth in Vanuatu. The model estimation includes unit
root tests, checks for cointegration using the Johansen cointegration procedure, checks for Granger
non-causality tests and investigating the short-run and long-run relationships using a Vector-Error-
Correction Model (VECM). The results show that financial development has a positive and significant
relationship (lagged by a two year period) with growth, reflecting the weak monetary policy
transmission in under-developed money markets and financial systems. The causality test results
show that a positive and significant short run relationship runs from financial intermediation to
economic growth, and a long-run relationship exists between private sector credit and growth. In
addition, the implementation of the Comprehensive Reform Program in 1997 has had little impact on
growth as a result of the persisting hurdles to growth in small Island countries. This study offers
opportunities for future reforms that will address sustainable financial development policies
supporting growth.
Keywords: impact, small island country, financial development, economic growth, Ganger causality,
Johansen cointegration procedure.

iii
Acknowledgements
I wish to express my sincere appreciation to the following individuals and institutions for their
valuable support. First and foremost, I owe much gratitude to my Principal Supervisor Professor
Christopher Gan and my Associate co-Supervisors Dr. Baiding Hu and Dr. Nazmun Ratna at the
Faculty of Agribusiness and Commerce at Lincoln University for their respective guidance, insights
and assistance in this thesis; to the Faculty of Agribusiness and Commerce at Lincoln University for
all the academic support; to NZAID who have provided me with financial support under the NZAID
Pacific Development Scholarship Award Scheme to undertake this study program; to the Reserve
Bank of Vanuatu and to the staff of the Research and Statistics Department and the Vanuatu
Meteorological Department for assistance in obtaining source statistical data for this study.

iv
Table of Contents
Abstract ............................................................................................................................................. ii
Acknowledgements ...........................................................................................................................iii
List of Tables ..................................................................................................................................... vi
List of Figures ................................................................................................................................... vii
Chapter 1 Introduction ....................................................................................................................... 1 1.1 Rationale of the Study ............................................................................................................... 1 1.2 The background of Vanuatu’s economy..................................................................................... 4 1.3 Research Problem and Objectives ............................................................................................. 5 1.4 Significance of the study ........................................................................................................... 6 1.5 Structure of the study ............................................................................................................... 9
Chapter 2 Literature Review ............................................................................................................. 10 2.1 Review of related literature..................................................................................................... 10 2.2 Theoretical framework surrounding the financial development and economic growth
relationship ............................................................................................................................. 13 2.2.1 Access to financial resources and services as part of financial development................ 16 2.2.2 Financial development indicators ............................................................................... 16
2.3 Empirical Background .............................................................................................................. 17 2.4 Vanuatu’s economic background and factors determining Vanuatu’s economic growth .......... 21
2.4.1 Macroeconomic background....................................................................................... 21 2.4.2 Structure of formal financial institutions in Vanuatu ................................................... 22
2.5 Overview of Vanuatu’s financial sector structure .................................................................... 23 2.6 Vanuatu’s financial development: some facts.......................................................................... 28
2.6.1 Comparison of financial depth in selected Pacific Island Countries .............................. 29 2.6.2 Financial depth and access for Vanuatu, selected Pacific Island Countries and high
income OECD average ................................................................................................. 31 2.6.3 Correlation between Vanuatu’s financial development and growth ............................ 33
Chapter 3 Research Methodology .................................................................................................... 35 3.1 Research Design ...................................................................................................................... 35
3.1.1 Investigating the relationship between Vanuatu’s financial sector development and economic growth ........................................................................................................ 36
3.2 Investigating the finance-growth relationship ......................................................................... 41 3.2.1 Empirical Model .......................................................................................................... 41 3.2.2 Data ............................................................................................................................ 42 3.2.3 Stationarity and Unit Root Tests ................................................................................. 43 3.2.4 Johansen Cointegration Procedure ............................................................................. 44 3.2.5 Vector Error Correction Model (VECM) estimation ...................................................... 44 3.2.6 Testing for Granger non-causality – investigating the short-run and long-run
causality links ............................................................................................................. 45 3.3 Identifying the contribution of major financial sector development reforms on productivity
growth on productive sectors and investment ........................................................................ 46
Chapter 4 Results ............................................................................................................................. 48

v
4.1 Descriptive Statistics ............................................................................................................... 48 4.2 Impact of financial development on economic growth ............................................................ 49
4.2.1 Unit Roots and Stationary Tests .................................................................................. 49 4.2.2 Regression Results ...................................................................................................... 50 4.2.3 Johansen Cointegration Procedure Results for the VECM ............................................ 59 4.2.4 Vector Error Correction Model (VECM) Results ........................................................... 61
4.2.4…1 Short-run Causality …………………………………………………………………………………... 61 4.2.4…2 Long-run Causality ……………………………………………………………………………………. 64 4.3 Contribution of major financial sector development reforms to major economic sectors of
Vanuatu’s economy ................................................................................................................ 65 4.3.1 Regression Results ...................................................................................................... 65
Chapter 5 Discussion and Conclusion ............................................................................................... 72
Appendix .......................................................................................................................................... 76
Appendix A Data Variables ............................................................................................................... 76 A.1 Variables description ............................................................................................................... 76
Appendix B Model Specifications ..................................................................................................... 77 B.1 Growth Model 1 – Real GDP (LRGDP) ...................................................................................... 77 B.2 Growth Model 2 – Real GDP Per Capita (LRGDPPC) ................................................................. 77 B.3 Model 3 – VECM Model .......................................................................................................... 78 B.4 Model 4 – Model Showing Impact on Sectorial Growth (Liquid Liabilities as the Independent
Variable) ................................................................................................................................. 78 B.5 Model 5 – Model Showing Impact on Sectorial Growth (Private Sector Credit as the
Independent Variable) ............................................................................................................ 79
References ....................................................................................................................................... 80
vi
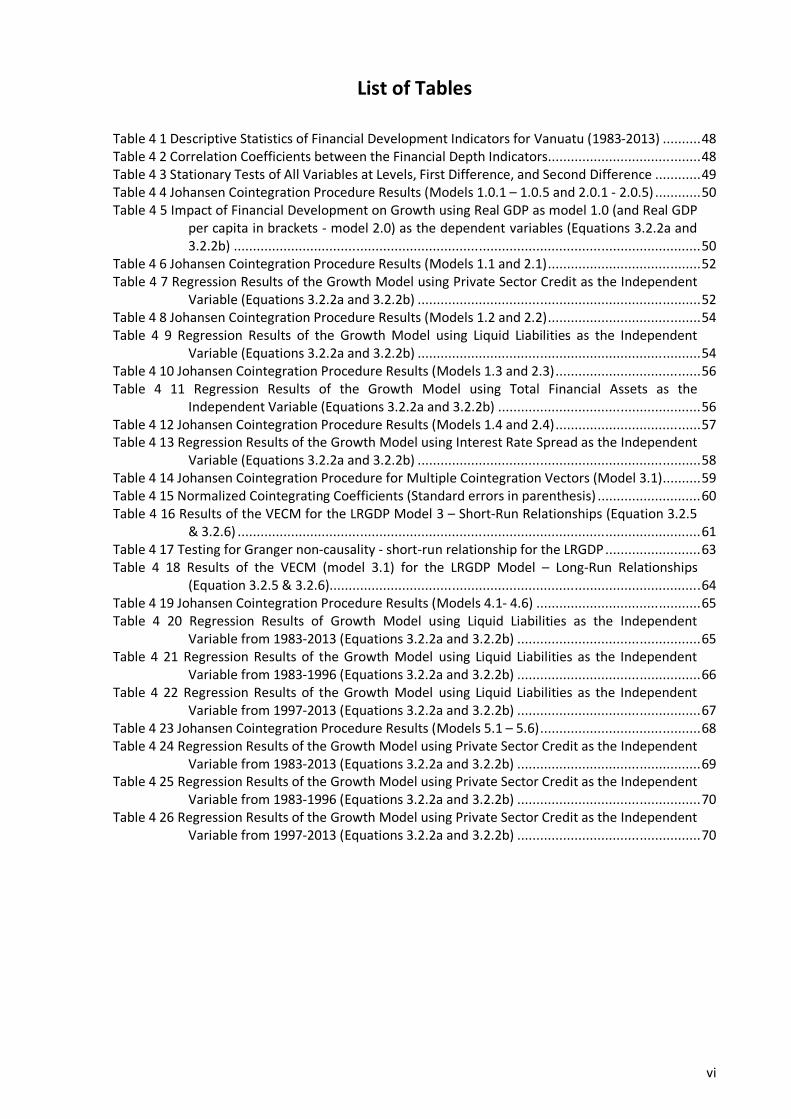
List of Tables
Table 4 1 Descriptive Statistics of Financial Development Indicators for Vanuatu (1983-2013) .......... 48 Table 4 2 Correlation Coefficients between the Financial Depth Indicators........................................ 48 Table 4 3 Stationary Tests of All Variables at Levels, First Difference, and Second Difference ............ 49 Table 4 4 Johansen Cointegration Procedure Results (Models 1.0.1 – 1.0.5 and 2.0.1 - 2.0.5) ............ 50 Table 4 5 Impact of Financial Development on Growth using Real GDP as model 1.0 (and Real GDP
per capita in brackets - model 2.0) as the dependent variables (Equations 3.2.2a and 3.2.2b) .......................................................................................................................... 50
Table 4 6 Johansen Cointegration Procedure Results (Models 1.1 and 2.1) ........................................ 52 Table 4 7 Regression Results of the Growth Model using Private Sector Credit as the Independent
Variable (Equations 3.2.2a and 3.2.2b) .......................................................................... 52 Table 4 8 Johansen Cointegration Procedure Results (Models 1.2 and 2.2) ........................................ 54 Table 4 9 Regression Results of the Growth Model using Liquid Liabilities as the Independent
Variable (Equations 3.2.2a and 3.2.2b) .......................................................................... 54 Table 4 10 Johansen Cointegration Procedure Results (Models 1.3 and 2.3) ...................................... 56 Table 4 11 Regression Results of the Growth Model using Total Financial Assets as the
Independent Variable (Equations 3.2.2a and 3.2.2b) ..................................................... 56 Table 4 12 Johansen Cointegration Procedure Results (Models 1.4 and 2.4) ...................................... 57 Table 4 13 Regression Results of the Growth Model using Interest Rate Spread as the Independent
Variable (Equations 3.2.2a and 3.2.2b) .......................................................................... 58 Table 4 14 Johansen Cointegration Procedure for Multiple Cointegration Vectors (Model 3.1) .......... 59 Table 4 15 Normalized Cointegrating Coefficients (Standard errors in parenthesis) ........................... 60 Table 4 16 Results of the VECM for the LRGDP Model 3 – Short-Run Relationships (Equation 3.2.5
& 3.2.6) ......................................................................................................................... 61 Table 4 17 Testing for Granger non-causality - short-run relationship for the LRGDP ......................... 63 Table 4 18 Results of the VECM (model 3.1) for the LRGDP Model – Long-Run Relationships
(Equation 3.2.5 & 3.2.6)................................................................................................. 64 Table 4 19 Johansen Cointegration Procedure Results (Models 4.1- 4.6) ........................................... 65 Table 4 20 Regression Results of Growth Model using Liquid Liabilities as the Independent
Variable from 1983-2013 (Equations 3.2.2a and 3.2.2b) ................................................ 65 Table 4 21 Regression Results of the Growth Model using Liquid Liabilities as the Independent
Variable from 1983-1996 (Equations 3.2.2a and 3.2.2b) ................................................ 66 Table 4 22 Regression Results of the Growth Model using Liquid Liabilities as the Independent
Variable from 1997-2013 (Equations 3.2.2a and 3.2.2b) ................................................ 67 Table 4 23 Johansen Cointegration Procedure Results (Models 5.1 – 5.6) .......................................... 68 Table 4 24 Regression Results of the Growth Model using Private Sector Credit as the Independent
Variable from 1983-2013 (Equations 3.2.2a and 3.2.2b) ................................................ 69 Table 4 25 Regression Results of the Growth Model using Private Sector Credit as the Independent
Variable from 1983-1996 (Equations 3.2.2a and 3.2.2b) ................................................ 70 Table 4 26 Regression Results of the Growth Model using Private Sector Credit as the Independent
Variable from 1997-2013 (Equations 3.2.2a and 3.2.2b) ................................................ 70

vii
List of Figures
Figure 2 1 Theoretical Framework. The Channels of Financial Development Influencing Economic
Growth .......................................................................................................................... 14 Figure 2 2 Financial Depth – Vanuatu and Selected Small Pacific Island Countries ............................. 29 Figure 2 3 Private Sector Credit – Vanuatu and Selected Small Pacific Island Countries ..................... 30 Figure 2 4 Deposit Money Bank Assets – Vanuatu and Small Pacific Island Countries ......................... 31 Figure 2 5 Number of Bank Branches per 100,000 people ................................................................. 32 Figure 2 6 Number of Automatic Teller Machines (ATMs) per 100,000 people................................... 32 Figure 2 7 Growth and Financial Development, Vanuatu ................................................................... 33

1
Chapter 1
Introduction
1.1 Rationale of the Study
Little research has been carried out on the impact of the financial development on growth in
Vanuatu and this empirical study examines the influence of commercial banking development on
economic growth. A well-functioning financial sector can spur economic growth (Schumpeter, 1912
and Levine, 1997). The financial sector provides positive avenues in several fields which indirectly
increase people’s standards of living and reduce the poverty level. This study, however focuses on
the possible effects of financial development on the income level, that is economic growth and
economic development. Studies on developed countries with developed financial systems have
concluded that a well-functioning financial system supports and enhances efficiency in the allocation
of resources and stimulates the growth process (Merton, 1991).
There are several approaches to analyse the influence of financial development on economic growth.
This study follows Levine’s (1979) model which focuses on how finance is channelled from
technological progress and capital accumulation to economic growth. A well-developed financial
sector may increase investments, which can promote economic growth. Like other developing
countries, the progress of financial development in small island countries in the Pacific is a gradual
process, so therefore, it is of interest to investigate the impact of the current stage of development
on Vanuatu’s financial sector, its contribution to investment and whether it promotes economic
growth. To investigate this problem, we use Schumpeter’s, and King and Levine's (1993b) principles
to identify the link between financial sector and economic growth for a small Pacific Island economy.
According to Boyd and Prescott (1986), these principles identified two main important roles
performed by financial intermediaries. Firstly, the financial intermediaries identify the best
production technologies and reduce the costs of acquiring and processing information which
improves resource allocation. Secondly, they boost the rate of technological innovation by identifying
those entrepreneurs with the best chances of successfully initiating new goods and production
processes. In general, commercial banks in Vanuatu follow these principles by both extending credit
to the private sector and identifying the most successful entrepreneurs whose initial activities
support growth. By identifying the effects of these channels through which finance affects growth,
the results of the study will contribute to the literature on Vanuatu’s financial sector development.
The definition of the financial sector includes mainly formal financial intermediaries in Vanuatu’s
financial system, specifically commercial banks that meet the definition of financial depository

2
institutions. The financial system is a channel through which financial development influences
growth and sound financial system is characterised by healthy financial institutions and smooth, well-
functioning financial markets which jointly allow for robustness and resilience in the face of adverse
shocks (OECD, 2010; Estrada, Park, and Ramayandi, 2010). Access to financial services is another
dimension of financial development, although it is not widely covered in this study. The lack of access
to finance can be a serious barrier to investment and business growth and impedes the setting up of
businesses essential for the growth of a dynamic economy.
Despite progress in financial intermediation, the pace of financial development continues to be
hindered by the development problems and prospects faced by small island countries. The
characteristics of small island countries include physical disadvantages, remoteness from world
markets, a small domestic market, dispersion and narrow production bases which often raise
significantly the costs of doing business (ADB, 2001). Winters and Martin (2004) show that most
small economies have cost disadvantages in doing business and have significant difficulties in
achieving or sustaining high levels of economic growth. In an inefficiently functioning banking
system, it is harder for savings to be mobilised and normally accumulated outside the banking system
where they are not effectively used for capital formation and growth of the economy. The
commercial banks as part of a legal financial structure play a significant role in the transmission
process. Therefore, financial development needs to bridge the gap between the formal financial
institutions and rural households’ financial needs (Levine, 2003). This study aims to investigate the
contribution of Vanuatu‘s banking sector reform to the country’s economic growth and
development.
Commercial banking activities play a facilitating role in promoting economic development in
developing countries. More than half of the population in the South Pacific countries are involved in
traditional agriculture and subsistence farming (Agri-Trade, 2011). This portion of the population is
often faced with an underdeveloped transport system, a critical shortage of capital and lacks
initiative for enterprise development (Prasad and Roy, 2007; PSDI, 2014). In addition, other
identifiable causes of the lack of investment include specific cultural, or social issues and government
policies that raise the cost and risks of investment (Duncan, Sandy, & Malcolm, 1999). Commercial
banks play an inclusive role in overcoming these obstacles and promote economic development
through mobilising savings for capital formation by encouraging people to save through introducing
deposit schemes, mobilising idle savings from the rich portion of the population and channelling
them into productive investments, and creating support for capital formation of the economy (Rose,
1986). According to Rose, savings are a catalyst for capital formation, but equally a major
determinant of the cost of credits is based on the law of scarcity, which holds that when the former
are low and scarce, they becomes more costly to obtain. These financial institutions also finance the

3
industrial and agricultural sectors with short-term, medium-term and long-term loans. The financial
system supports the economy by financing both internal and external trade through their overdraft
facilities and issuing drafts by giving loans to retailers and wholesalers to stock goods. In the same
way the support of commercial banks through advance loans to consumers in developing countries
with low incomes for the purchase of consumable items could raise the standards of living of the
people through loans for consumptive activities. Commercial banks play an important role and lead
in following the mandates of the monetary policy of the central bank conducive for stable
macroeconomic environment (Crockett (2001); Mishkin (2007)). Part of this role includes providing
employment generating activities and entrepreneurial activities in the county by providing loans to
productive sectors (UN-ESCAP, 2005). The importance of the banking sector to economic
development makes the access to financial resources and services an important issue discussed by
development and aid agencies in the Pacific and around the world. The Small Pacific Island States
with underdeveloped financial systems have pressing needs to develop and institute financial
solutions that can support rural household and business needs. In addition, the interest in financial
inclusion has become important in financial development where the recognition of access to financial
services (specifically their role in reducing poverty) and boosting shared prosperity becomes
important in supporting inclusive and sustainable development (World-Bank (2014); PSDI (2014)).
The financial system provides a means of payment which underpins all economic transactions and
provides a link between current and future output, and consumption. The World Bank highlighted
the important role of commercial banks in the development process of developing countries through
loans, investment, financial counselling and mobilising local capital and channelling it into new and
expanding business (World-Bank, 2008). A well-functioning financial system serves a vital role by
offering saving, payment, credit and risk management services to individuals and firms. Financial
market frictions make it harder for people in rural areas to invest in education and opportunities for
employment. Banerjee and Newman's (1993) nonlinear model study shows that occupational choices
of individuals (to become entrepreneurs or remain as wage earners) are limited by initial
endowments. These occupational choices determine how much each individual can save and what
risks they can bear, with long-run implications for growth and income distribution.
This study investigates the impact of financial development on the economic development using
Vanuatu as a case-study of a small island country with developing financial systems. Financial
development can be defined as increased access to financial resources made available through
banking reforms to the latest new innovative banking services initiatives such as mobile banking,
micro-lending and savings (Levine, 1997).
4
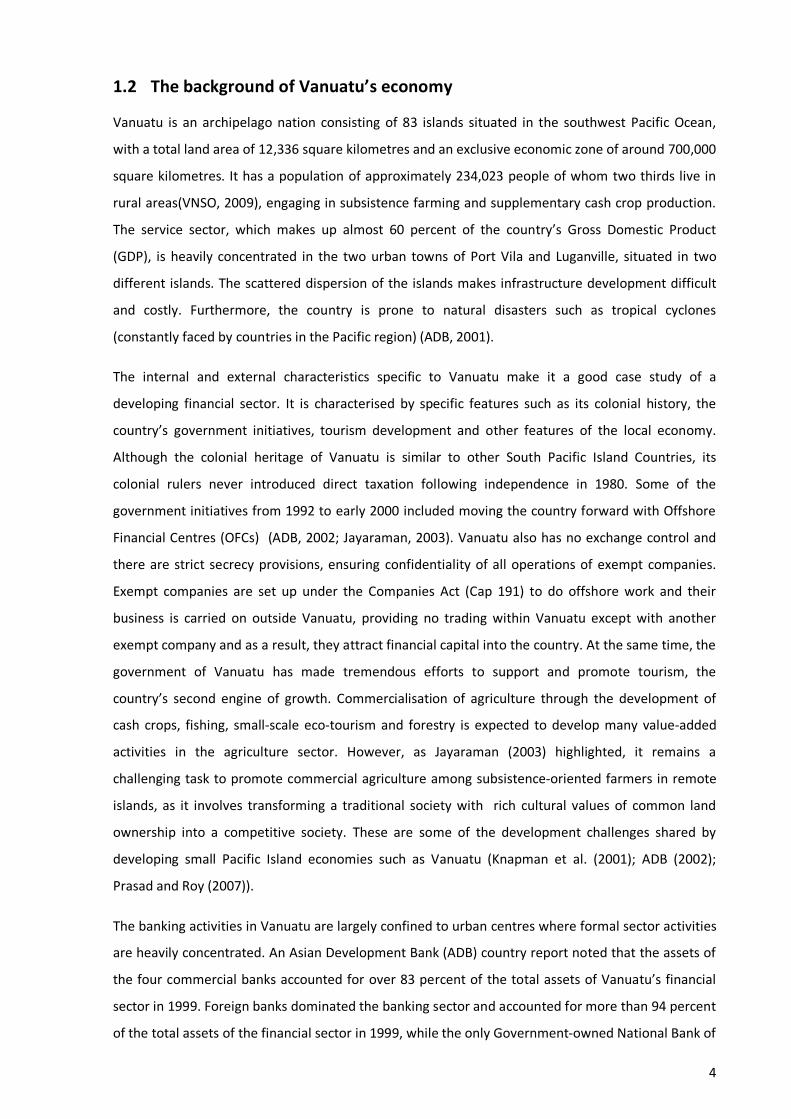
1.2 The background of Vanuatu’s economy
Vanuatu is an archipelago nation consisting of 83 islands situated in the southwest Pacific Ocean,
with a total land area of 12,336 square kilometres and an exclusive economic zone of around 700,000
square kilometres. It has a population of approximately 234,023 people of whom two thirds live in
rural areas(VNSO, 2009), engaging in subsistence farming and supplementary cash crop production.
The service sector, which makes up almost 60 percent of the country’s Gross Domestic Product
(GDP), is heavily concentrated in the two urban towns of Port Vila and Luganville, situated in two
different islands. The scattered dispersion of the islands makes infrastructure development difficult
and costly. Furthermore, the country is prone to natural disasters such as tropical cyclones
(constantly faced by countries in the Pacific region) (ADB, 2001).
The internal and external characteristics specific to Vanuatu make it a good case study of a
developing financial sector. It is characterised by specific features such as its colonial history, the
country’s government initiatives, tourism development and other features of the local economy.
Although the colonial heritage of Vanuatu is similar to other South Pacific Island Countries, its
colonial rulers never introduced direct taxation following independence in 1980. Some of the
government initiatives from 1992 to early 2000 included moving the country forward with Offshore
Financial Centres (OFCs) (ADB, 2002; Jayaraman, 2003). Vanuatu also has no exchange control and
there are strict secrecy provisions, ensuring confidentiality of all operations of exempt companies.
Exempt companies are set up under the Companies Act (Cap 191) to do offshore work and their
business is carried on outside Vanuatu, providing no trading within Vanuatu except with another
exempt company and as a result, they attract financial capital into the country. At the same time, the
government of Vanuatu has made tremendous efforts to support and promote tourism, the
country’s second engine of growth. Commercialisation of agriculture through the development of
cash crops, fishing, small-scale eco-tourism and forestry is expected to develop many value-added
activities in the agriculture sector. However, as Jayaraman (2003) highlighted, it remains a
challenging task to promote commercial agriculture among subsistence-oriented farmers in remote
islands, as it involves transforming a traditional society with rich cultural values of common land
ownership into a competitive society. These are some of the development challenges shared by
developing small Pacific Island economies such as Vanuatu (Knapman et al. (2001); ADB (2002);
Prasad and Roy (2007)).
The banking activities in Vanuatu are largely confined to urban centres where formal sector activities
are heavily concentrated. An Asian Development Bank (ADB) country report noted that the assets of
the four commercial banks accounted for over 83 percent of the total assets of Vanuatu’s financial
sector in 1999. Foreign banks dominated the banking sector and accounted for more than 94 percent
of the total assets of the financial sector in 1999, while the only Government-owned National Bank of

5
Vanuatu (NBV) accounts for less than 6 percent (ADB, 2001). Commercial banks have increased their
market share as a result of the merger of the Development Bank of Vanuatu into the government-
owned bank, National Bank of Vanuatu in 1998 (ADB (2001); ADB (2002)). The financial deepening1
process of the financial sector over the period has been slow and this is related to the minimal
development of the financial system where savings and time deposits are the only likely options for
savers to invest in(Jayaraman & Choong, 2012). Commercial banks’ claims on the private sector in
vatu terms increased from 31 percent in 1995 to 32 percent in 1999 reflecting the fairly low level of
financial intermediation (ADB, 2002). In a study by Yang, Davies, Wang, Dunn, and Wu (2012),
domestic money markets measured by the ratio of broad money (M2) to GDP were quite shallow.
This, along with other characteristics of under-developed domestic financial markets in Pacific Island
countries, includes limited markets for commercial papers, corporate bonds and foreign exchange
products. Collateralised inter-bank lending is not widely available with non-existent secondary
markets for government and central bank paper. This under-developed state of the financial markets
affects not only the interest rates and credit pass-through, but also other channels of monetary
policy transmission (Knapman et al. (2001); ADB (2001); Yang et al. (2012)).
1.3 Research Problem and Objectives
Does formal financial development matter for economic growth in small island economic
development? With the vast collection of documented literature supporting the positive contribution
of finance to growth in general, what is the impact of financial development in terms of commercial
banking development on the overall growth and major economic sectors of Vanuatu? What are the
challenges associated with financial development for small island countries? The current study aims
to investigate the relationship between financial development (specifically commercial banking
sector development) and economic growth in Vanuatu.
The specific objectives are:
1. To investigate the relationship between Vanuatu’s formal financial sector development and
economic growth;
2. To identify the contribution of existing major financial sector development reforms on major
economic sectors of Vanuatu’s economy; and
3. To identify the main problems and challenges involved in financial sector development in
Vanuatu, and to provide implications and recommendations to relevant policymakers and
players in financial sector development.
1 The rate of increase in liquid money in the economy that provides more opportunities for continued growth.

6
1.4 Significance of the study
King and Levine's (1993a) paper laid the foundation for empirical assessment of the finance-growth
relationship followed by many new stylized facts and challenges discovered in the finance-economic
growth literature. These included studies of developed countries with developed financial systems on
the finance-growth relationship and how loanable funds promote economic activity. Their findings
showed how various measures of the level of financial development are strongly associated with
present rates and future rates, the real per capita GDP growth and the rate of physical capital
accumulation. Early studies by McKinnon (1973) and Shaw (1973) provided valuable insights into the
role of financial sectors in developing economies. The authors identified that struggling economies
with least developed financial sectors have less minimisation of asymmetric information and high
transaction costs due to divisive regulation, inadequate infrastructure and macroeconomic control
with low performance. Recent studies have focused on large developed nations with developed
financial systems during the structural shifts in the world economy in the early 1900s. Greenwood
and Jovanovic's (1990) model highlighted the dynamic interactions between finance and growth
whereby, if capital is scarce, financial intermediaries that produce better information on the firms
will therefore fund more promising firms inducing a more efficient allocation of capital. King and
Levine (1993b) found a positive and significant correlation between bank credit and development, a
faster economic growth and a positive influence of financial liberalisation on bank efficiency in
reducing intermediation costs. The next stage of the finance-growth nexus was built up on the core
research by Schumpeter (1912) which highlighted finance in the process of economic development.
Schumpeter’s monograph published in 1912 on ‘The Theory of Economic Development’ identified
five forms of combinations that drive economic development through bank loans (Schumpeter,
1912). Recent studies have also shown that financial intermediaries also boost the rate of
technological innovation by identifying those entrepreneurs with the best chance of successfully
initiating new goods and production processes (Galetovic (1996); Morales (2003); Acemoglu et al.
(2003)). This highlighted that banks are an important intermediary between investors and borrowers.
The importance of the banking institutions was not realised well during the recession following
WW1 leading up to 1934, where processes from the real economy were considered as first-priority
and a matter of ‘enterprise leading finance’ (Robinson, 1952), thus reflecting the absence of work
dedicated to the finance-growth nexus in the 1930-1940s. The works of other seminal authors
focusing on the finance-growth nexus began to emerge in the period from 1950 to the 1980s and
supported by Gerschenkron (1962). They focused particularly on the role of the banking sector
associated specifically with the huge scale of capital required for investment.
The causality and correlation relationship was further highlighted in many studies. Patrick (1966)
highlighted two ways of looking at financial development and economic growth and brought out the

7
causality in the finance-growth nexus literature, first through ‘demand-following’ where finance is
required to attract external financing in terms of supporting economic growth. On the other hand,
‘supply-leading’ takes place when financial institutions accumulate savings and transform them into
investments which are necessary for the development of modern sectors of the economy. Goldsmith
(1969) who was largely successful in documenting the evolution of national financial systems and
intermediaries highlighted that economic growth can be financed through the increase in
effectiveness and build-up of the aggregate volume of investments using the ratio of financial assets
to GNP and GNP per capita for 35 countries. The author documented a positive correlation between
financial development and the level of economic activity in the countries studied. Goldsmith’s
analysis presented evidence that banks tend to become larger relative to national output as the
countries develop.
In later literature, Rousseau and Wachtel's (1998) study showed that financial development
enhances long-run economic growth in the early stages of industrial development. Levine, Loayza,
and Beck (2000) demonstrated that omitted variables, simultaneity or reverse causality do not alter
the main finding of a positive correlation between financial intermediaries’ development and growth.
Considering these individual effects, Benhabib and Spiegel (2000) also showed empirically that
estimated growth equations under the framework of both neoclassical and endogenous models
revealed that financial development (deepening) indicators are positively correlated with total factor
productivity growth and investment. These findings support the functions of financial institutions as
positively and strongly fostering a country’s economic growth and development.
Despite the positive impact of financial development on growth for well-functioning financial
systems, there are a number of factors constraining the access to credit and financial services for
borrowers in underdeveloped financial systems like Vanuatu. These constraining factors are related
to the structure of the financial system, where in some cases, obtaining collateral can be difficult. For
example, land titles cannot be transferred easily because they are inefficiently small and shared by
too many stakeholders, especially land disputes with customary titles, which cannot be negotiated as
a lease (Hariharan & Marktanner, 2012). Similarly, with a smaller economic base, banking services
are not offered widely owing to the lack of economies of scale and high operational costs. Banks take
operational costs into major consideration when deciding whether or not to serve remote or sparsely
populated areas. This raises the importance of financial development in which the lack of financial
inclusion is costly to society and the individual, which forces the un-bankable segment of the
population into informal credit sectors where interest rates are higher and the amounts of available
funds are smaller. Since the informal credit structure is outside any legislative framework, any
dispute between lenders and borrowers cannot be settled legally (Hariharan & Marktanner, 2012).
The situation is made worse for farmers who are pushed into borrowing funds for fertilizer,

8
machinery and seeds at the beginning of the growing season and have great difficulties in repaying
after the harvest, specifically during periods where there is a natural disaster and production and
income are both below expected levels during harvest. Hariharan and Marktanner (2012) also show
that although structural adjustment programs and financial market reforms have been introduced in
developing countries, these markets have largely failed to reach large segments of the society. This is
often associated with related fixed costs which serve as a market barrier that prevents the financial
inclusion of certain segments of the society. Chibba (2009) explicitly reports the lack of financial
inclusion in the case of Botswana where poor governance in areas such as monetary policy, land
ownership, public sector agency government, government procurement and the legal and regulatory
framework form barriers for most rural households’ borrowing.
A vast number of studies have been conducted on developed financial markets, but there is limited
study conducted on the impact of financial development on economic growth in small island
countries with underdeveloped financial systems. Merton (1995) noted that the basic functions of a
financial system are essentially the same in all economies, the most efficient structure for fulfilling
the functions changes over time, and differs across geopolitical divisions for a variety of reasons –
differences in size, complexity, and available technology, as well as differences in political, cultural
and historical backgrounds. Our study addresses the gap in the literature in the area of financial
system development and the financial sector in small South Pacific Island Countries. The study
attempts to identify that if the support for financial sector development conducive to growth has
been successful for developed countries, then the impact of reforms for small developing countries
could be pronounced. The findings from this study will be useful for commercial banks and the
Reserve Bank of Vanuatu for development policies that support financial development in areas of
accessibility to financial resources and services and promoting financial inclusion by increasing the
participation rate of rural people in major economic sectors.
There are gaps in the studies on developing countries since they continue to face a lack of high-
quality data representative of major indicators in bank finance data. This area continues to lack
sufficient rigorous analysis, therefore filling this gap is important in order to support poor and
developing countries to develop effective development policy reform (Rousseau & D'Onofrio, 2013).
The limited research in this area in the Pacific region makes these reforms even more difficult
because of the uncertainty surrounding it. However, filling this gap should help give a better view of
the relationship between finance and growth in Vanuatu, not only the direct laws, regulations, and
macroeconomic policies shaping the financial sector, but also the political, cultural and geographic
contexts shaping financial development.
This study briefly looks at the micro-macro links which provide the benefits in understanding the key
constraints on financial development in low-income countries like Vanuatu, how banks in Vanuatu

9
function and their loan distribution per sector. It could provide opportunities for future research
focusing on how financial structure reforms are fostered and the challenges faced in the domestic
financial system. Further research could also address the technology aspects of financial
development which are suitable for Vanuatu with low savings and population density, and where
new forms of technology such as mobile banking, internet banking and Automatic Teller Machines
(ATMs) can have a great impact.
1.5 Structure of the study
The rest of the thesis is organised as follows. Chapter 2 starts with a review of earlier literature, such
as theories of growth and the relationship between the financial sector development and economic
growth. A brief outline of the way the subject has been analysed, and the conclusions of previous
studies are then presented. The chapter also covers the literature and facts about the structure of
Vanuatu’s economy and its financial sector and financial development. Chapter 3 discusses the data
and methodology and the econometric analysis and results are presented in Chapter 4. Chapter 5
concludes the study.

10
Chapter 2
Literature Review
This chapter begins with an introduction of the previous studies carried out by seminal authors and
researchers in the area of finance-growth. Section 2.2 introduces an overview of the theoretical
framework and channels that link financial development to economic growth and discusses the
indicators used in previous studies. Section 2.3 presents previous empirical studies on finance and
growth theories and their findings. Sections 2.4 -2.6 summarise the preliminary facts and descriptive
statistics from the literature on Vanuatu’s economic background, the financial structure and the
correlation between Vanuatu’s financial development and economic growth.
2.1 Review of related literature
The influence of financial system development on growth and the role it plays through its impact on
savings and investment are well documented. Financial institutions, financial instruments and
financial markets arise to remove the effects of information, enforcement and transactions costs.
How efficiently the financial system is able to reduce these costs has enormous and widespread
effects on savings and investment decisions, technological innovation, and ultimately on per capita
GDP and productivity growth rates. Apart from financial institutions’ main task of producing and
disseminating information about investment projects and allocating resources, they also monitor
these investments and manage and diversify these investment risks. At the same time, the financial
systems such as commercial banks, mobilise savings and ease exchange (King & Levine, 1993a).
Cihak, Demirguc-Kunt, Feyen, and Levine (2013) show that low-income countries’ financial systems
are internationally comparable in terms of stability. As for financial depth, low-income countries are
about a fourth of those in high (lower-middle) income countries, while in terms of financial efficiency
these ratios are half and two-thirds and regarding financial access a tenth and a quarter, respectively.
Such aggregate measures show that financial depth is far from being the only important issue for
low-income countries, with efficiency and access as more pressing issues.
A growing body of literature including that of Rousseau and Wachtel (1998), Levine et al. (2000), and
Knapman et al. (2001), demonstrates a strong positive link between financial development and
economic growth, and Levine (1997) provides evidence that the level of financial development is a
good predictor of future economic development. Empirical studies have established that there is a
positive relationship between the financial sector development (banking sector development) and
economic growth (Levine, 2005). This was initially influenced by Schumpeter (1912) whose work
identified a ‘new combination’ of concepts for entrepreneurs used in economic development. In his

11
book, “The Theory of Economic Development”, Schumpeter (1912) emphasised that economic
development in a market economy is evidenced specifically through the means of administrative
power and bank loans. It raises the important emphasis on the role played by entrepreneurs who,
according to Schumpeter, in many cases use stocks of capital supplied through the mechanisms of
credit by capitalists and bankers. Other seminal works in this field include Gerschenkron (1962)
whose work focused on determining the role of the banking sector during the industrialisation
process. Furthermore, Patrick (1966) and Goldsmith (1969) discussed the finance-growth relationship
and identified two ways of looking at the financial development and economic growth relationship
specified as “demand-following” and “supply-leading”. These set the theoretical framework on the
study of financial development and economic growth. There is also evidence that the level of
financial development is a good predictor of future economic growth, capital accumulation and
technological change that can crucially affect the speed and pattern of economic development
(Levine 1993).
Studies on the Pacific Island financial sector are limited to a few studies by Jayaraman (2003) and
Pacheco (2007). Pacheco’s study on the pro-independence reform of Vanuatu’s financial system
following the Comprehensive Reform Program implementation revealed that foreign banking
institutions were not particularly interested in broadening credit access to the poorer sections of the
population and that high levels of state dependence hindered the development of a sustainable
micro-credit sector. However, the rise of a few civil society organisations in Vanuatu has significantly
increased economic democracy and participation among the local residents. This has been regarded
as the best practice for the country in supporting the local communities.
One issue associated with the focus on low-income countries is how financial development emerges.
If financial development is an important pre-condition for low-income countries, a study of the type
of financial system structure conducive for growth (for example the role of commercial banks) or a
study of the crucial role played by capital flows could be further investigated in these countries.
Furthermore, further research into the role of foreign aid (and the donor community) in shoring up
financial development in poorer countries; identifying whether foreign aid plays a role in changing
the structure of domestic financial systems in poorer countries; and identifying how financial
development connects economic and political elites can provide avenues in supporting financial
development policies. For example, Nkusu and Sayek (2004) empirically highlighted that developing
local financial market depth through financial sector reform enhances aid effectiveness. These
studies may stimulate authorities and policymakers to carry out financial liberalisation and structural
reforms if necessary. While it may require a substantial data collection effort, findings from related
empirical studies such as those of Campos and Kinoshita (2008) point to the direction in which
financial sector reform may be a key factor in enhancing the benefits of foreign capital inflows

12
specifically for developing countries, in particular, financial liberalization and privatization. These
studies by Nkusu and Sayek (2004) and Campos and Kinoshita (2008) illustrated how efforts for
successful financial liberalization and structural reforms fostered by the domestic financial system
may support aid effectiveness and foreign direct investment. Another aspect concerns the micro-
macro link in the institutions which may prove crucial to understanding the key constraints on
financial development in low-income countries.
Access to financial resources and services plays an important role in economic development;
however whether ‘inadequate’ financial development has an impact on economic growth is
questionable. Although studies such as those of Goldsmith (1969), King and Levine (1993b), Aghion,
Howitt, and Mayer-Foulkes (2005) and Levine (2005) show a positive relationship between financial
development and economic growth, economists hold different views on the existence and direction
of causality that exist between financial development and economic growth. The first is the “supply-
side” view, which states that financial development has a positive effect on economic growth.
According to this view, financial intermediation contributes to economic growth through two main
channels: (1) by raising the efficiency of capital accumulation and in turn the marginal productivity of
capital (Goldsmith, 1969) and (2) by raising the savings rate and thus the investment rate (McKinnon
(1973); Shaw (1973)). In other words, by increasing the size of savings and improving the efficiency of
investment, financial development leads to higher economic growth. The second view of the
relationship between the two variables was advanced by (Robinson, 1952) who stated that financial
development follows economic growth or “where enterprise leads finance follows”. According to this
“demand-following” view, as the real economy expands, its demand for financial services increases,
leading to the growth in these services. Empirical support for both views can also be found in recent
studies (Demetriades and Hussein (1996); Christopoulos and Tsionas (2004)). Expansion of the
financial system may be induced by a higher per capita income due to increased demand for financial
services. This is based on Robinson’s (1952) hypothesis that more financial institutions, financial
products and services will emerge in response to the greater demand for financial services when an
economy expands. This implies that the level of real economic activity critically affects financial
development.
McKinnon (1973) and Shaw (1973) took a different view on how the financial system regulation and
its framework, particularly interest rate ceilings, may distort the economy in several ways. First, it
may discourage entrepreneurs from investing in high risk but potentially high-yielding investment
projects. Second, financial intermediaries may become more risk averse and offer preferential
lending to established borrowers. Third, borrowers who obtain their funds at relatively low cost may
prefer to invest only in capital intensive projects. McKinnon (1973) and Shaw (1973) argued in favour
of liberalising the financial sector by way of removing interest rate controls and allowing the market

13
to determine its own credit allocation in order to deepen the financial systems. On the other hand,
other arguments suggest otherwise, for instance, with deposit insurance, the absence of interest rate
control may result in overly risky lending behaviour among banks. Stiglitz (1994) opposes the view
that interest rate restraints may lead to higher financial savings in the presence of good governance
in the financial system. When depositors perceive restrictions as policies aimed at enhancing the
stability of the financial system, they may be more willing to keep their savings in the form of bank
deposits thereby increasing the depth of the financial system. On the other hand, the rapid changes
in the financial sectors as a result of deregulation, technological innovation and new financial
products have contributed to financial and economic development (Levine, 1997).
2.2 Theoretical framework surrounding the financial development and economic growth relationship
Levine (1997) highlighted in his work that the level of financial development is a good predictor of
future rates of economic growth, capital accumulation and technological change. Financial
instruments, markets and institutions arise to mitigate the effects of information and transaction
costs. Finding ways to reduce transaction costs influences saving rates, investment decisions,
technological innovations and the long-run growth rate of the economy. In the same way,
innovations in telecommunications (such as internet banking) and technological changes (the use of
EFTPOS and Automatic Teller Machines) have affected the financial services industries and the way
commercial banks deliver services to their clients (Claessens, Glaessner, & Klingebiel, 2000). The
works of Schumpeter (1912) point out that a well-functioning financial system encourages
technological innovations by increasing funding to entrepreneurs which ultimately leads to economic
growth that establishes the link between the functioning of the financial systems and economic
growth. These findings also include firms and industries that rely heavily on external financing and
grow disproportionately faster in countries with well-developed banks and securities than in
countries with poorly developed financial systems.
In addition to many other important aspects, the performance and long-term economic growth and
welfare of a country are related to its degree of financial development. Financial development is
measured by factors such as the size, depth, access, efficiency and stability of a financial system. This
includes markets, intermediaries, range of assets, institutions and regulations (World-Economic-
Forum, 2012). Financial intermediation and financial markets contribute directly to economic growth
and aggregate economic welfare through their effects on capital accumulation (the rate of
investment) and technological innovations. First, greater financial development leads to greater
mobilisation of savings and its allocation to the highest-return investment projects. This increased
accumulation increases economic growth. Second, by allocating capital to the right investment
projects and promoting sound corporate governance, financial development increases the rate of

14
technological innovation and productivity growth, further enhancing economic growth and welfare
(World-Economic-Forum, 2012).
The financial sector can be developed in many different ways, such as with improvements in the
efficiency and competitiveness of the sector (ADB, 2015). The range of financial services that are
available may increase the diversity of the institutions which operate in the financial sector; the
amount of money that is intermediated through the financial sector may also increase, along with
the extent to which capital is allocated by private sector financial institutions to private sector
enterprises. The regulation and stability of the financial sector may improve, and more importantly
the improvement in access to financial services is considered important from a poverty reduction
perspective (World-Bank (2011); ADB (2015)).
Modern growth theory identifies two specific channels through which the financial sector might
affect long-run growth: (1) through its impact on capital accumulation (including human as well as
physical capital) and (2) through its impact on the rate of technological progress (Levine, 1997) (see
Figure 2-1). Theil (2001) noted a very simple growth model that illustrates the three important
connections between financial variables and economic activity via the so-called AK model (Yt= . 퐾 ;
where Yt is output in period t produced by capital 퐾 , and A symbolises capital productivity). This
model assumes that an efficient financial system reduces the loss of resources required to allocate
capital and can be used to derive the optimal size of the financial system (Theil, 2001). The more
efficient the transformation of savings into investment, the lower the loss of resources and the more
the savings can be used for productive investments. This positive feedback effect between finance
and growth is demonstrated in Harrison et al's (1999) study.
Figure 2 1 Theoretical Framework. The Channels of Financial Development Influencing Economic Growth
Source: (Robinson, 1952); (Levine, 1997); (Theil, 2001) The positive feedback effects through the credit and investment channels on the finance-economic
growth relationship is evidently productive in mobilising savings for investment, facilitating and
encouraging inflows of foreign capital (including FDI, portfolio investment and bonds, and
Financial sector
Allocate resources
Exert corporate control
Ease risk management
Ease trading
Mobilise savings Capital accumulation
Technological innovation
Economic Growth

15
remittances), optimising the allocation of capital between competing uses, and ensuring that capital
goes to the most productive use (FitzGerald, 2006). In this regard, Levine (1997) identified five basic
functions of financial intermediaries which give rise to these positive feedbacks effects in this
channel: (1) saving mobilisation, (2) risk management, (3) acquiring information about investment
opportunities, (4) monitoring borrowers and exerting corporate control, and (5) facilitating the
exchange of goods and services (Figure 2-1).
Mobilisation of savings could be an important function of the financial sector in developing island
countries with developing financial systems. The provision of saving facilities or transaction bank
accounts enables households to store their money in a secure place, and allows money to be put to
productive use. Bringing savings into the financial sector where they can be utilised productively
could itself make a significant contribution to growth in the country, in particular, the productivity
growth and capital accumulation channels. The returns on investment can create positive expected
returns for the savers, which may in turn increase savings. At the same time, credit may also be made
available to finance investment in education or health, and can thus promote the accumulation of
human capital (De-Gregorio, 1996). Financial institutions may also increase the rate of technological
progress by identifying and thus allocating capital towards those innovations with the best chances
of succeeding (King & Levine, 1993b).
Researchers have also identified limitations in the methods of investigating the relationship between
financial development and economic growth. The problem associated with the types of cross-country
studies is that they generate estimates of the average effects of financial development, while the
relationship may vary considerably among countries. On the other hand, the political, economic and
institutional diversity that build up the financial system differs for different countries(Al-Yousif,
2002). As a result, a number of authors have extended their studies to examine the finance-growth
relationship using time-series data on individual countries, and thus have found that the nature of
the relationship can indeed vary among countries. Therefore, caution should be used in making
generalisations about the likely benefits arising from Financial Sector Development (FDS) in any
particular country compared to developed countries. The weight of the evidence shows that FSD
does make an important contribution to growth in most countries in the developing world (Esso
(2010); Hassan, Sanchez, and Yu (2011); Pan and Wang (2013)).
Insufficient financial development could lead to the high-cost structure of small island countries as
noted by Berthelemy and Varoudakis (1996) that may leave a country in a ‘poverty trap’. They argued
that a vicious cycle can be created where low levels of financial intermediation result in only a few
market players. The lack of competition results in high costs, leading to low real deposit rates and
hence low savings, which in turn limits the amount of financial intermediation.

16
Previous studies conducted by International Aid Agencies, the International Monetary Fund (IMF)
and the Asian Development Bank (ADB) on the relationship between financial development and
growth have brought together a broad consensus that finance plays a crucial role in the process of
growth. It does that through a variety of mechanisms: reducing the cost of capital to firms, by
allocating capital more efficiently to entrepreneurs, and by encouraging greater competition among
non-financial firms (Khan & Senhadji, 2000). These support the benefits of financial development.
2.2.1 Access to financial resources and services as part of financial development
Apart from their vast cultural diversity, a main feature of the developing countries, typical of small
island countries with underdeveloped financial systems, is the existence of unorganised money
markets that reflects the importance of traditional cultural practices and communal ownership of
assets. The unorganised money markets do not help in the accumulation of capital funds, neither can
their financial assets be used and invested in those areas where the need for development is the
greatest. They tend to remain isolated from other money markets, centring on indigenous banks or
money lenders and possess strong regional characteristics. This type of weak financial intermediation
is dominant in the rural and a few urban areas and can result in insecurity of debt contracts (ADB,
2002). The Indian money market is an example of such financial markets where indigenous bankers
constitute a larger portion of the money market contributing to the weakness in the financial sector
(Sinha, 2015).
The commercial sector becomes an important sector in lending because there is sufficient credit and
security, and the capital is invested for a short term (usually less than one year). The biggest task for
financial development in underdeveloped countries is the accumulation of domestic capital and its
investment as capital for the industry. In order to establish an organised money market, such
measures can only be established through the establishment of new banks, increases in branch
offices, making banking facilities available throughout the nation, or raising interest rates to support
savings. Increased capital formation cannot be achieved by mere financial and fiscal techniques
alone, but also movement of people’s savings (Aryeetey & Gockel, 1991). Owing to the impediments
to access to finance, developing small island states do not have a saving propensity under their social
and economic conditions. Therefore, economic development should be supported with active
savings.
2.2.2 Financial development indicators
The common indicators used in empirical studies to investigate the finance-economic growth
relationship include the total credit to the economy termed as an appropriate measure of financial
development (Levine et al. (2000); Abubakar and Gani (2013)). This monetary aggregate is a
traditional proxy of financial development and deepening (Lynch, 1996). It supports the mobilisation

17
of savings to facilitate transactions, provide credit to producers and consumers, reduce transaction
costs and fulfil the medium exchange function of money. The ratio of liquid liabilities to GDP
(indicated as M3/GDP) was used as a measure of financial depth; however Levine and Zervos (1998)
argued that the use of this indicator limits the identification of where the financial system allocates
capital. Despite its widely used measure, Levine and Zervos also argued that increases in M3/GDP as
a measure of the liabilities of banks, the central bank and financial intermediaries are not necessarily
associated with increases in credit (one aspect of financial development that might generate
economic growth). Therefore, our study will include other proxy measurements that can be used to
identify the development of the formal financial sector in Vanuatu, such as the ratio of total financial
assets of the commercial banking system to GDP as a proxy indicator for financial system
development, the ratio of private sector credit to GDP as a proxy indicator in measuring the
development of financial intermediaries, and commercial banks’ average interest rate spread as a
proxy indicator for efficiency or accessibility of financial intermediaries. Lynch (1996) also identified
that various other monetary aggregates, namely broad/money and bank deposits as quantity
measures, are more reliable across time in a country than across countries. Most importantly, Lynch
indicated that financial intermediation transaction costs cannot be evaluated accurately in individual
countries and cannot be compared across countries, owing to differences in variables ranging from
financial sector design to population dispersion. Alternatively, bank interest rate margins are another
indicator often used to estimate the intermediation transaction costs (Lynch, 1996).
2.3 Empirical Background
The empirical literature on finance and growth is supported by cross-country growth regressions,
time-series analyses, panel-data studies, industry and firm-level studies, and historical evidence. In
their study of the finance-growth relationship, Berkes et al. (2002) highlighted that the relationship
between finance and growth seems to be causal and unidirectional, from finance to growth. There
are five recent findings that are worth mentioning. First, the long-run effect of finance on growth is
indeed positive and dominates the short-term effect that tends to be negative. The second is that the
relationship is non-linear. Beyond a certain threshold (calculated to be above 100% of GDP) finance is
associated with negative growth. In terms of distribution, a third finding shows that household credit
seems to have small growth payoffs, while private sector credit has large growth payoffs (Barajas,
Beck, Dabla-Norris, & Yousefi, 2013). Fourth, financial development reduces income inequality and
exerts a disproportionally positive impact on the bottom quintile. Fifth, different financial
liberalisation policies have contrasting effects on income inequality.
A gap in the literature exists, especially in studies regarding poorer countries or low-income
countries, which often do not have enough high-quality data and therefore lack sufficient rigorous

18
analysis (Rousseau & D'Onofrio, 2013). The reason for this gap is that development policy reform is
difficult enough with uncertainty, but it is almost impossible with ignorance. An attempt to fill this
gap in the literature requires a more complete view of the relationship between financial
development and growth. This may need further research into this relationship at lower levels of per
capita income and to identify the context in which finance affects growth. Therefore, in light of the
relatively small size of low-income countries’ financial systems, investigating how financial
development can be triggered in the low-income countries will, as growth ensures, help to distil and
refine the lessons from the literature on the finance-growth causal nexus. In this context of study, a
clearer picture of the finance-growth relationship for small island countries in the Pacific region will
be investigated.
A number of cross-sectional studies have established the positive relationship between financial
sector reform and performances of the economic sector. These studies include that of Goldsmith
(1969) who compiled data on 35 countries over the period 1860 to 1963 on the value of financial
intermediary assets as a share of economic output. The author assumed that the size of the financial
intermediary sector is positively correlated with the quality of financial functions provided by the
financial sector. However, Goldsmith’s work had several weaknesses; it did not systematically control
for other factors influencing economic growth, the size of financial intermediaries may not accurately
measure the functioning of the financial system and may not identify the direction of causality.
Following Goldsmith’s work, King and Levine (1993b) studied 77 countries over the period 1960 to
1989, and systematically controlled for other factors affecting long-run growth. The authors looked
at capital accumulation and productivity growth channels, constructed additional measures of the
level of financial development and analysed whether the level of financial development predicts
long-run economic growth. Their findings showed that there is a strong positive relationship between
each of the financial development indicators and the three growth indicators (long run real per
capita growth rates, capital accumulation and productivity growth) used in the authors’ study.
The positive impact of finance on economic growth was highlighted by a number of seminal authors
on the finance-growth relationship links. King and Levine (1993b) supported Schumpeter’s view on
the positive impact of finance on economic growth for an extended period of 1960-1989, using the
measures of financial intermediary development and added a new measure of private credit (credits
to the private sector) as a percentage of GDP. Their results indicated a strong connection between
the exogenous component of financial development and real per capita GDP long-term growth, and
the rate of physical capital accumulation. Similar findings were highlighted in the study of Levine et
al. (2000) who used the Generalized Method of Moments (GMM) to examine the nature of the effect
of financial intermediary development on growth using panel and cross-sectional data of 71
countries. The GMM is specially designed to deal with key problems in past studies investigating the

19
finance-growth relationship. In addition, in terms of cross-country differences in the legal rights of
creditors, the authors’ findings support the view that legal and accounting reforms, such as creditors’
rights, contract enforcement, and accounting practices can boost financial intermediary
development. Despite their results implying that financial development boosts steady-state growth,
Aghion et al. (2005) challenged this conclusion by developing a model of technological change that
predicts countries with levels of financial development above a critical level, in which the threshold
level will converge to growth rates. Aghion et al. found that financial development positively
influences the rate of convergence, where financial development exerts positive but diminishing
influence on the steady-state levels of real per capita output.
These studies extended to findings that permit the identification of the long-term cumulative effects
of financial development on economic growth. This finding was highlighted by Xu (2000) who used a
VAR approach to investigate 41 countries over the period 1960-1993 and provided strong evidence
that financial development is important for economic growth through the investment channel.
Similarly, Demetriades and Hussein (1996), and Christopoulos and Tsionas (2004) found strong
evidence in favour of the hypothesis that long-run causality runs from financial development to
growth, however there is no evidence of bi-directional causality. These sum up the main findings of
cross-sectional analysis studies on developed countries, but little has been documented on small
island countries in the Pacific region.
Previous studies have also addressed the methodological aspect of studying the financial
development and economic growth relationship. Building on the work of Schumpeter (1912), Gurley
and Shaw (1955), Goldsmith (1969) and McKinnon (1973) employed different econometric
methodologies and data to assess the role of the financial sector in stimulating economic growth.
The growing body of empirical research, using different statistical procedures and data sets,
produces remarkably consistent results. First, countries with better-developed financial systems tend
to grow faster – specifically, those with large privately owned banks that funnel credit to private
enterprises and a liquid stock exchange. Here the level of banking development and the stock market
both exert a positive influence on growth (Levine, 2003). The financial system matters because it
influences the spread between deposit and loan rates and a more efficient financial system can lead
to a slight increase in investment, thus growth. King and Levine (1993a) and Levine (2003) have
shown that better-functioning of the financial system eases the external financing constraints that
impede firm and industrial expansion. Thus, access to external capital is a channel of financial
development through which financially constrained firms can expand. This opens up the possibility of
studying how the financial system affects long-run growth.
Financial development is associated with productivity growth and capital accumulation, the two
channels through which finance may influence economic growth. Beck and Levine (2001) applied the
20
GMM method to a panel data set for periods 1976-1998 and found that stock markets and banks
positively influence economic growth. These findings are not due to potential biases induced by
simultaneity, omitted variables or unobserved country-specific effects. This highlighted the
assumption that across different estimation procedures and different control variables, both stock
market and bank development independently impact economic growth. This forms the basis that
helps policymakers set reform priorities and influence debates on the comparative importance of
different segments of the financial sector (Demirguc-Kunt & Levine, 2001). Evidence from other
studies such as Guiso, Sapienza, and Zingales (2002) finds that local financial development enhances
the probability that an individual who starts his/her own business, increases competition and
promotes the growth of firms.
Further studies also focus specifically on the measurements of financial development indicators in
econometric models. Levine and Zervos (1998) measured banking sector development by using bank
credit defined as the bank credit to the private sector as a share of GDP. This measure of banking
development excludes credit issued by the government and the central bank. The authors argued
that this indicator is able to capture the banking sector allocation of credit to private firms. Recent
studies have used instrumental variables to extract the exogenous component of financial
development. In using instrumental variables, Levine et al. (2000) also developed a new measure of
overall financial development. They used private credit, which equals the value of credits by financial
intermediaries to the private sector divided by GDP. The cross-country instrumental variables are
used to address both causality issues and the construction of accurate measures of financial
development. Alternatively, another approach is using the microeconomic studies of finance and
growth by looking at industry and firm-level data. Empirical studies may not resolve the issue of
causality, which could be due to differences in political systems, legal traditions or institutions that
drive both financial development and economic growth rates. Seeking to resolve the causality issues
and to document in greater detail the mechanisms through which finance influences economic
growth in developing small island states such as Vanuatu shape the main focus of our study.
A growing body of empirical analyses using various measurements of financial development, such as
those of Demirguc-Kunt and Maksimovic (2001) whose work covers firm-level and industry-level
studies, and others including Xu (2000), Beck and Levine (2001), King and Levine (1993a),
Christopoulos and Tsionas (2004) and Aghion et al. (2005) who focus on individual country and broad
cross-country studies, all demonstrated a strong positive link between the functioning of the financial
system and long-run economic growth. The finance-growth link goes beyond the relationship
between finance and shorter-term fluctuations. Undoubtedly, the financial system is shaped by non-
financial developments, such as telecommunications, computer, institutions and economic growth
which influence the quality of financial services and the structure of the financial system.

21
Technological improvements and lower transaction costs affect financial arrangements. In specific
cases, better-developed financial intermediaries reduce income inequality by disproportionately
boosting the incomes of the poor (Beck, Demirguc-Kunt, & Levine, 2004).
2.4 Vanuatu’s economic background and factors determining Vanuatu’s economic growth
2.4.1 Macroeconomic background
Vanuatu shares similar economic features with 14 other small Pacific Island Countries (PICs). These
features include a small manufacturing base and a narrow range of exports of copra and fish. These
islands are highly dependent on imports ranging from food and mineral fuels to intermediate and
capital goods and transport machinery. They have a narrow range of exports dominated by primary
products, such as bananas, copra, fish and timber. Their fixed exchange rate regimes have served
them well since most of their imports have been sourced from Australia and New Zealand
(Jayaraman & Choong, 2012).
Samoa, Solomon Islands, Tonga and Vanuatu have independent currencies and their own central
banks under the fixed exchange rate regimes. Their financial sectors are small and have
underdeveloped money and capital markets. Vanuatu is heavily subsistence-oriented, dominated by
agriculture and fisheries (Jayaraman & Choong, 2012). Its communally-owned land tenure system
(unique to all Pacific Islands) makes it difficult for private sector land based activities to develop in
these areas (Jayaraman, 2003).
Vanuatu’s economic growth rate since independence has kept pace with the rate of population
growth of almost 3 percent per year. In 1995economic growth deteriorated and GDP fell by 2.9
percent. The economy remained stagnant and declined in each of the next two years (Jayaraman,
2003). This was a result of a weak offshore financial sector. The economic recovery in 2000 was led
by construction and improved tourism against a backdrop of weakened tourism in the neighbouring
country of Fiji, as a result of political instability. Economic growth was stifled by a still fragile tourism
sector and a narrow range of primary product exports (copra, beef, cocoa, coffee and kava) that
were susceptible to external and supply shocks through vulnerability to natural disasters.
From 1997, the government of Vanuatu implemented a three year Comprehensive Reform Program
(CRP) with support from the Asian Development Bank and bilateral donors (Pacheco 2007). The
program encompassed governance, fiscal management, public service reform, reform of public
financial institutions, outer island development and mitigation of the social impact of reforms. The
reform of the financial sector was central to the private sector development component of the CRP,
which focuses more on streamlining and restructuring government-owned financial institutions (ADB
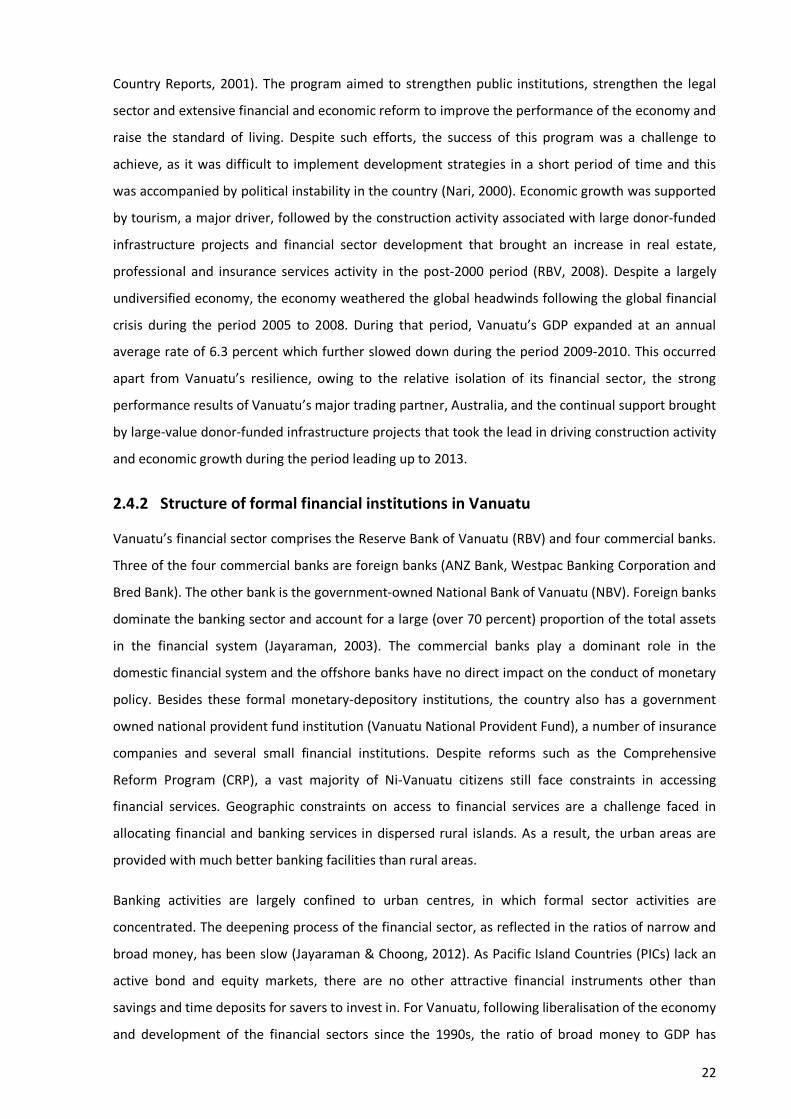
22
Country Reports, 2001). The program aimed to strengthen public institutions, strengthen the legal
sector and extensive financial and economic reform to improve the performance of the economy and
raise the standard of living. Despite such efforts, the success of this program was a challenge to
achieve, as it was difficult to implement development strategies in a short period of time and this
was accompanied by political instability in the country (Nari, 2000). Economic growth was supported
by tourism, a major driver, followed by the construction activity associated with large donor-funded
infrastructure projects and financial sector development that brought an increase in real estate,
professional and insurance services activity in the post-2000 period (RBV, 2008). Despite a largely
undiversified economy, the economy weathered the global headwinds following the global financial
crisis during the period 2005 to 2008. During that period, Vanuatu’s GDP expanded at an annual
average rate of 6.3 percent which further slowed down during the period 2009-2010. This occurred
apart from Vanuatu’s resilience, owing to the relative isolation of its financial sector, the strong
performance results of Vanuatu’s major trading partner, Australia, and the continual support brought
by large-value donor-funded infrastructure projects that took the lead in driving construction activity
and economic growth during the period leading up to 2013.
2.4.2 Structure of formal financial institutions in Vanuatu
Vanuatu’s financial sector comprises the Reserve Bank of Vanuatu (RBV) and four commercial banks.
Three of the four commercial banks are foreign banks (ANZ Bank, Westpac Banking Corporation and
Bred Bank). The other bank is the government-owned National Bank of Vanuatu (NBV). Foreign banks
dominate the banking sector and account for a large (over 70 percent) proportion of the total assets
in the financial system (Jayaraman, 2003). The commercial banks play a dominant role in the
domestic financial system and the offshore banks have no direct impact on the conduct of monetary
policy. Besides these formal monetary-depository institutions, the country also has a government
owned national provident fund institution (Vanuatu National Provident Fund), a number of insurance
companies and several small financial institutions. Despite reforms such as the Comprehensive
Reform Program (CRP), a vast majority of Ni-Vanuatu citizens still face constraints in accessing
financial services. Geographic constraints on access to financial services are a challenge faced in
allocating financial and banking services in dispersed rural islands. As a result, the urban areas are
provided with much better banking facilities than rural areas.
Banking activities are largely confined to urban centres, in which formal sector activities are
concentrated. The deepening process of the financial sector, as reflected in the ratios of narrow and
broad money, has been slow (Jayaraman & Choong, 2012). As Pacific Island Countries (PICs) lack an
active bond and equity markets, there are no other attractive financial instruments other than
savings and time deposits for savers to invest in. For Vanuatu, following liberalisation of the economy
and development of the financial sectors since the 1990s, the ratio of broad money to GDP has

23
increased between 50 percent to 60 percent, while Vanuatu’s broad money has been close to 200
percent of GDP (RBV, 2012), an indication of the growing economy and the development of the
financial system (Jayaraman, 2003; Jayaraman and Choong, 2007).
2.5 Overview of Vanuatu’s financial sector structure
The literature on the Pacific region’s banking systems is minimal, thus the effectiveness of the
banking frameworks is relatively unknown, particularly because these island nations are relatively
small. However, over the last 30 years, significant banking reforms following economic development
have taken place at a different pace. This provides the platform for this case-study of Vanuatu’s
banking system.
The World Bank classifies Vanuatu as a lower middle income country, with gross domestic product
valued at US$781 million in 2013 (see Table 2.1). In comparison to other neighbouring small island
countries, Fiji, Solomon Islands, Samoa and Tonga, Vanuatu ranks in the middle in terms of size area
and population. The country covers 12,190 square kilometres, with a population of approximately
250,000 people with the size of its economy over US$800,000 (World-Bank, 2014). In terms of
macroeconomic development, Vanuatu performed well alongside its neighbouring island countries
(with the exception of Solomon Islands). The country has gained macroeconomic stability through
low inflation throughout the period of study against a background of fluctuating economic growth
and highly concentrated tourism services exports. In terms of human development, Vanuatu was
ranked 131 (2013) by the United Nations Development Program, lower than its neighbouring
countries of Fiji, Samoa and Tonga.
Table 2 1 Vanuatu – Major Economic and Social Statistics for the period 2013 Country Fiji Solomon Is Vanuatu Samoa Tonga Area (sq. km) 18,270 28,900 12,190 2,840 750 Population (million) 0.881 0.561 0.252 0.190 0.105 GDP ($US billion) 3.855 1.060 0.802 0.796 0.433 GDP per capita 4,376 1,889 3,172 4,189 4,123 Avg growth rate 1983-1997 2.1 5.8 3.8 1.0 1.8 (GDP) 1998-2013 2.0 2.3 2.8 2.8 1.5 Avg Inflation rate 1983-1997 4.8 9.5 4.2 12.0 7.3 (CPI) 1998-2013 3.5 6.3 3.2 3.4 5.4 HDI Rank (2013) 88 157 131 106 100 Import as % of GDP 78 67 51 50 58 Export as % of GDP 59 56 48 31 22 Source: World Bank, UNDP; HDI – Human Development Index
Table 2.2 shows that the per capita GDP of Vanuatu rose from a level of $1,067 in 1984 to $3,161 in
2013, indicative of Vanuatu’s growth and development, despite a slight decline in the period 2002

24
(ADB, 2002). This places Vanuatu as a lower middle income country of the world, although its Human
Development Index ranking seems to be lagging behind four Small Pacific Island Countries.
Table 2 2 Vanuatu – Per Capita GDP for the period 1984 to 2013 Vanuatu 1984 1990 1996 2002 2008 2013
Per Capita GDP 1,067 1,080 1,427 1,354 2,697 3,161 % annual growth rate 20.3 6.8 2.6 -0.6 12.7 0.3
Source: RBV, World Bank
There is a great consensus amongst studies on the finance growth relationship documenting the
importance of banking to the economy. Economic activities such as consumption, production, and
distribution cannot be carried out effectively without banks. The government cannot effectively use
various monetary and fiscal measures without banks for the accomplishment of various socio-
economic objectives. Therefore, the literatures have supported the statement made by Knut Wicksell
concerning money and credit that the ‘bank is the heart and central point of a modern exchange
economy’ through money creation and expanding purchasing power (Friedman and Kuttner (2010);
Ravn (2015)). Capital formation is the basic factor for economic development as a means of creation
of physical assets, such as machines and buildings, which increase the productive capacity of a
country. For capital formation, savings are required which are largely mobilised by commercial banks.
In the same way, bank credit enables entrepreneurs to innovate and invest, and thus promote
economic activity (Levine, 2003).
A financial system is a broad network that encompasses all savings and financing opportunities as
well as the financial institutions that mobile savings and provide credit (Rousseau & Sylla, 2003). This
can be divided into three categories, namely the formal, semi-formal and informal institutions. This
current study mainly looks at the formal institutions which include a legal infrastructure that provides
an option to lenders and protection to depositors. Vanuatu’s formal financial institution is similar to
other Island countries in the Pacific (Fiji, Samoa, Tonga and Solomon Islands). The financial institution
structure comprises the Reserve Bank of Vanuatu (RBV) and the government owned Vanuatu
National Provident Fund (VNPF) Institution with four commercial banks: a government-owned bank
(National Bank of Vanuatu), three foreign owned banks (ANZ Bank, Westpac Bank and Bred Bank), a
number of insurance companies and several small financial institutions.
Table 2.3 shows the mean and standard deviations of financial intermediation indicators for the
period 1983 to 2013. It can be seen that Vanuatu has a reasonably high level of financial
intermediation. Interest spread which represents the cost of financial intermediation in a
competitive environment should fall as the level of financial intermediation increases. However, for
Vanuatu, the interest rate spread is high (although the standard deviation shows a low variability on

25
the spread) which may reflect the high market concentration and the low effective competition
amongst banks.
Table 2 3 Financial intermediation indicators for the period 1983-2013 for Vanuatu Ratio of private sector credit
to GDP Ratio of commercial bank assets to
sum of commercial banks’ and central bank assets
Interest Rate Spread
Mean 34.7 85.6 9.1 Std. D 23.6 4.5 1.0 Min 10.8 79.4 7.3 Max 87.1 95.9 11.3 Source: Reserve Bank of Vanuatu
Despite the similarities to its neighbours, Vanuatu stands out as a unique country among the Pacific
Island Countries (PICs). The specific features of Vanuatu include having no exchange controls of any
kind and there are no currency restrictions with its citizens and residents permitted to hold their
deposits with commercial banks in foreign currency. There are no direct taxes of any kind on its
citizens or expatriates and business enterprises (Jayaraman, 2003). Although Vanuatu’s Offshore
Financial Centre (OFC) institutions have a tax haven status, they are not allowed to accept local
deposits or make loans to residents in Vanuatu. The commercial banks in Vanuatu play a dominant
role in the domestic financial system, as most offshore banks are restricted to dealing in domestic
currency. As a result, these formal financial intermediaries interact and have a direct impact on the
conduct of monetary policy and their development impacts the country’s overall economic
development (Knapman et al. (2001); Jayaraman (2003)). On the other hand, the activities of semi-
financial institutions are often not reflected in the national statistics, and are considered important
for Vanuatu owing to their increasing role in the rural areas (specifically those of credit units and
VANWODs).
Like most developing countries, Vanuatu relies on a bank-based system developed during the
colonial era (pre-1980s). It began with trading houses (Campagnie Caledonienne de Nouvelles
Hebrides and the Australian-based Burns Philp Company) that provided banking services for colonial
economic interests. After WWII, metropolitan banks such as the Banque de l’Indochine and the
Australian-owned Commonwealth Savings Bank began operating in towns where the plantation
economy was most widespread (Jayaraman, 2003). From there the British colonial authorities
introduced company and banking legislation in 1970 and 1971 to take advantage of the expanding
Eurocurrency markets. This resulted in an increase in the number of international banks, trust
companies and financial services in the country’s Overseas Financial Centres (OFC) (Pacheco, 2007).
The private banks not only created a demand for legal and other services but also provided
employment and revenues for the colonial administrators. Although the off-shore financial centres
grew in the late 1970s, a number of commercial banks set up business in the on-shore market during

26
the 1980s to 1990s but failed, while others succeeded largely through mergers and acquisitions of
already established entities, for example, the ANZ Bank purchase of Barclays Bank in 1985 and the
Bank of Hawaii acquisition of Banque Indosuez in 1993 (Jayaraman (2003); Pacheco (2007)). The
original banks in Vanuatu were actually the agents of international commercial banks, which set up
branch offices in Port Vila on Efate and eventually expanded their operations to Luganville on Santo
Island.
Commercial banks as an intermediary in the economy perform the main function of mobilising
savings from sectors that have surplus funds and extend them by way of credit to individuals,
corporations, financial institutions and others. Commercial banks have a long involvement in the
economic development of Vanuatu. According to the IMF, the gradual exit of foreign banking
institutions in Vanuatu from the on-shore market is the result of banks seeking to consolidate and
reduce the marginal cost of their operations, besides Vanuatu having a small but lucrative market. At
the same time private banks that survive the intense competition between them not only benefit
from the country’s tax free status but are able to realise high profits (Knapman et al. (2001);
Jayaraman (2003)). Jayaraman (2003) noted that since the 1990s, private banks do not mobilise
deposits for the benefit of the local market with only less than 35 percent of the total deposits
transformed into loans and advances to residents. This means that, even though these banks have
very good access to financial resources, their role as facilitators of credit for the local market is
somewhat narrow and socially exclusive. This is partially related to the high operational costs and
risks involved. The UNDP estimates more than two-third of Vanuatu’s household incomes in the
urban areas come from wages and salaries. Only 23 percent of the household incomes in rural areas
come from wages and salaries which is an indication that it is harder for the rural population to have
access to loan and credit facilities(VNSO-UNDP, 2010). Onshore private banks are still directing their
services to a very small section of the population, which is affordable to a few (see Table 2.4). The
high concentration of credit is evident as banks allocate over a third of the credit available in the
country to housing and land purchases and consumption activities that only a few can afford.
Table 2 4 An Overview of Vanuatu Credit Allocation to the Private Sector (2005, 2009 and 2013) Economic Sector 2005 2009 2013 Million VT Share Million VT Share Million VT Share Housing & Land Purchases 4,387 23% 12,227 28% 16,894 31% Personal: others 3,737 20% 5,651 13% 10,506 19% Construction 2,918 16% 5,183 12% 3,773 7% Distribution 1,863 10% 3,267 8% 4,717 9% Tourism 1,707 9% 3,020 7% 4,991 9% Manufacturing 1,117 6% 2,085 5% 1,724 3% Professional & Other Services 916 5% 1,969 5% 6,049 11% Transport 626 3% 3,020 7% 443 1% Agriculture 304 2% 595 1% 661 1%
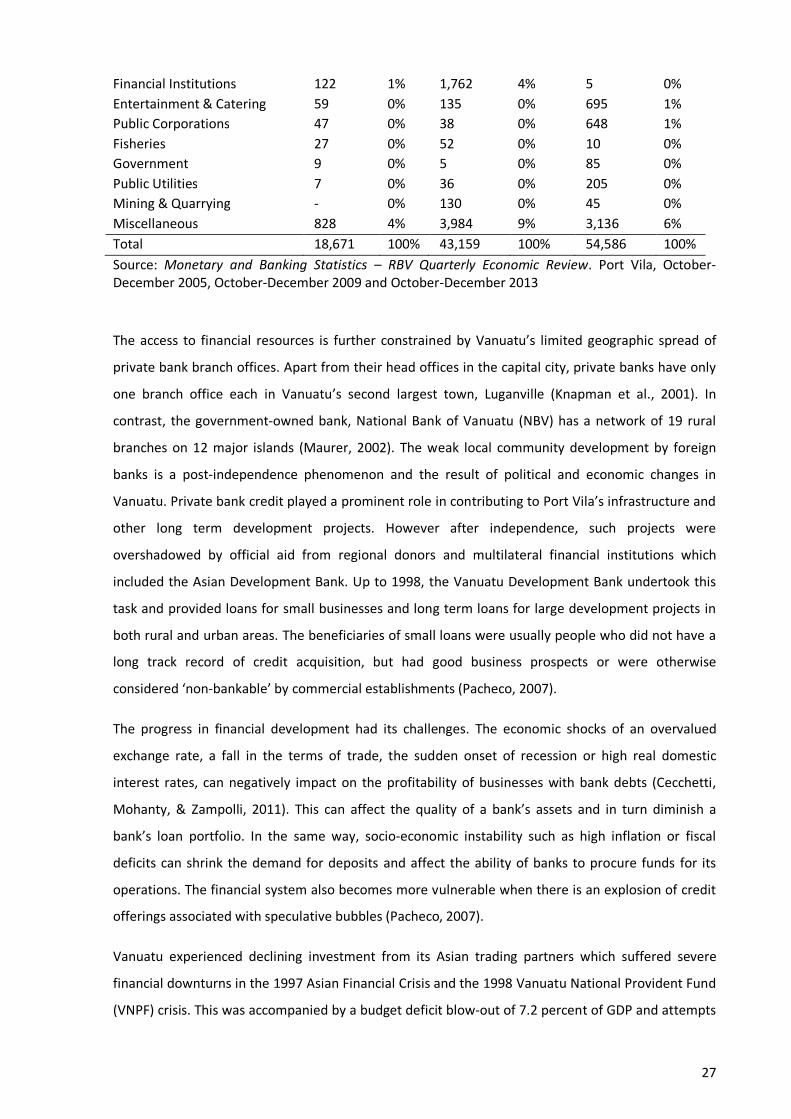
27
Financial Institutions 122 1% 1,762 4% 5 0% Entertainment & Catering 59 0% 135 0% 695 1% Public Corporations 47 0% 38 0% 648 1% Fisheries 27 0% 52 0% 10 0% Government 9 0% 5 0% 85 0% Public Utilities 7 0% 36 0% 205 0% Mining & Quarrying - 0% 130 0% 45 0% Miscellaneous 828 4% 3,984 9% 3,136 6% Total 18,671 100% 43,159 100% 54,586 100% Source: Monetary and Banking Statistics – RBV Quarterly Economic Review. Port Vila, October-December 2005, October-December 2009 and October-December 2013
The access to financial resources is further constrained by Vanuatu’s limited geographic spread of
private bank branch offices. Apart from their head offices in the capital city, private banks have only
one branch office each in Vanuatu’s second largest town, Luganville (Knapman et al., 2001). In
contrast, the government-owned bank, National Bank of Vanuatu (NBV) has a network of 19 rural
branches on 12 major islands (Maurer, 2002). The weak local community development by foreign
banks is a post-independence phenomenon and the result of political and economic changes in
Vanuatu. Private bank credit played a prominent role in contributing to Port Vila’s infrastructure and
other long term development projects. However after independence, such projects were
overshadowed by official aid from regional donors and multilateral financial institutions which
included the Asian Development Bank. Up to 1998, the Vanuatu Development Bank undertook this
task and provided loans for small businesses and long term loans for large development projects in
both rural and urban areas. The beneficiaries of small loans were usually people who did not have a
long track record of credit acquisition, but had good business prospects or were otherwise
considered ‘non-bankable’ by commercial establishments (Pacheco, 2007).
The progress in financial development had its challenges. The economic shocks of an overvalued
exchange rate, a fall in the terms of trade, the sudden onset of recession or high real domestic
interest rates, can negatively impact on the profitability of businesses with bank debts (Cecchetti,
Mohanty, & Zampolli, 2011). This can affect the quality of a bank’s assets and in turn diminish a
bank’s loan portfolio. In the same way, socio-economic instability such as high inflation or fiscal
deficits can shrink the demand for deposits and affect the ability of banks to procure funds for its
operations. The financial system also becomes more vulnerable when there is an explosion of credit
offerings associated with speculative bubbles (Pacheco, 2007).
Vanuatu experienced declining investment from its Asian trading partners which suffered severe
financial downturns in the 1997 Asian Financial Crisis and the 1998 Vanuatu National Provident Fund
(VNPF) crisis. This was accompanied by a budget deficit blow-out of 7.2 percent of GDP and attempts

28
to devalue the Vatu by 20 percent led to a loss of investor confidence and a sharp decline in foreign
currency deposits (Jayaraman, 2003). These factors brought to the surface some socio-economic
problems faced by the financial institutions. As a result, reform in the financial sector began after the
implementation of the Comprehensive Reform Program (CRP) in July 1998, which provided amongst
other measures, legislation that improved governance procedures within the government-owned
financial institutions. This reform and other transformations resulted in a slow turnaround and signs
of recovery by 2002 (Chand (2002); ADB (2002)).
Studying the financial system gives an indication of whether the state is committed to the welfare of
most of its citizens. And as a result, banking practices impact directly on people’s ability to access
banking services and in turn affect their ability to create viable income-generating activities
(Pacheco, 2007). According to the ADB, financial intermediation can be weak in an economy with an
open capital account and a combination of factors, such as regulatory barriers, insecurity of debt
contracts, lack of creditor records that raise the risk premium of lending and high sovereign risks in
the form of exchange rate risk (ADB, 2002). More importantly, ADB highlighted that the long-term
solution to access to credit could be supported by direct state intervention (such as the establishing
of the Vanuatu Development Bank), and paying more attention on the cause of limited access to
credit. This supports the various reasons that the development of the financial system is of interest
to past researchers and seminal authors in finance.
Financial reforms can be classified through the monetarist principles that view liquidity or the ability
to convert assets into cash as the prime factor affecting the economic conditions in the country
(Pacheco, 2007; Sahay et al., 2015). McKinnon (1973) developed the concept of financial ‘repression’
to describe the way the states interfere with financial freedom. Shaw (1973) on the other hand
developed the concept of financial ‘deepening’, which suggests that the most efficient financial
systems are those that achieve low transaction costs whilst providing an optimal risk/reward profile
for firms and individuals (Pacheco, 2007). It is important that state-led efforts to create legal and
economic environments that make up the expansion of the financial markets should be seen as a
positive force. In the early establishment of Vanuatu’s financial system, this is important for the
country because of its Offshore Financial Centre which grew not so much as a result of local
entrepreneur activity, but more due to Vanuatu’s tax haven.
2.6 Vanuatu’s financial development: some facts
In this section, some stylised facts about financial development in Vanuatu, specifically on the
financial depth of the country are discussed. The traditional indicators of financial depth such as
private sector credit to GDP ratio are analysed and compared with other sub-regions in the Pacific
and high income OECD countries, and over time. Finally, this section covers an examination of the

29
correlation between financial development and economic growth in Vanuatu and how the
correlation may have changed since the economic reform that took place in 1997.
2.6.1 Comparison of financial depth in selected Pacific Island Countries
Table 2.5 Correlations of Financial Depth with GDP Per Capita Vanuatu Fiji Samoa Tonga Solomon Is GDP per capita 1982-1997 1982-1997 1982-1997 1982-1997 1990-1997 Liquid liabilities 0.08 0.74 0.32 -0.11 -0.57 Credit to private sector 0.05 0.85 0.32 0.79 -0.74 1998-2013 1998-2013 1998-2013 1998-2013 1998-2013 Liquid liabilities -0.46 0.36 0.64 0.59 0.50 Credit to private sector 0.63 0.44 0.91 -0.19 0.26 Source: Author’s calculation (2015)
Table 2.5 shows that liquid variables have mixed results in each set of periods. Liquid liabilities has a
stronger correlation with GDP per capita in the period leading to 2013 than the period leading to
1997 for Samoa, Tonga and Solomon Islands. Samoa and Tonga exhibit positive correlation while
Vanuatu exhibits a negative correlation. Fiji has a positive correlation but weakened compared to the
period leading to 1997. Solomon Islands has weakened correlation but the signs of correlation
change from negative to positive. Credit to private sector has a stronger correlation with GDP per
capita in the period leading to 2013 than 1997 for Vanuatu and Samoa and both are positively
correlated. Fiji continued to maintained a positive (although slightly weakened) correlation with GDP
per capita. Tonga and Solomon Islands not only exhibited a weakened, but also an opposite
correlation in 2013 vs. the period leading to 1997. Apart from a negative correlation between liquid
liabilities (as a variable of financial development) and income, the growth in credit in the private
sector in Vanuatu has a stronger correlation with GDP per capita.
Although the ratio of liquid liabilities to GDP per capita has helped to identify the possible link
between financial development and growth for these Pacific island countries, further analysis is likely
to identify whether financial development causes growth (or vice versa). The results of the
correlations do not address causality issues and the effect of one variable on another. Therefore,
estimation of various Ordinary Least Square models helps to identify the direction of causality from
one variable to another or the degree of the influence of one variable on another.
Figure 2.2 shows the financial development as a proportion of GDP in Vanuatu is higher than the
other four selected small island country states and well above the average of these countries put
together. By 1993, Vanuatu’s Liquid Liabilities as a percent of GDP rose to 104%, higher than the
selected Pacific Island Countries’ average.
Figure 2 2 Financial Depth – Vanuatu and Selected Small Pacific Island Countries

30
Source: World Bank Global Financial Development Database
The financial depth provides a measure of the size of the financial system relative to the size of the
economy (or GDP). As Figures 2.3 and 2.4 show, the expansion of both the private sector credit and
total deposit money bank assets indicates that aggregate financial depth in the region has increased
since the early 2000. Vanuatu and Fiji lead above the average trend of the selected Pacific Island
Countries and are weakened after the 1997-1998 Asian Financial Crisis. Financial depth measured by
bank credit to the private sector doubled in 2010 as a percentage of GDP compared to their levels
over a decade ago. Apart from Solomon Islands and Tonga which noted declines in bank credit after
2008, the other three countries maintained high levels of bank credit, specifically led by Vanuatu and
Fiji. Likewise, the total deposit money bank assets as percent of GDP also a showed similar trend. For
Vanuatu, the banking sector has been important in the deepening of the financial sector following
the introduction of a new commercial bank (Bred Bank) in 2008. Aside from Fiji which has a capital
market, the financial sectors in the selected small Pacific Island Countries are dominated by the
banking sector.
When making comparisons with the average level for high income countries, the level of financial
depth measured by bank credit to the private sector as a percentage of GDP is relatively low for
Pacific Island countries. This supports the perception that the financial systems of these selected
Pacific Island Countries has developed at a slow pace over recent years. This implies that the system
is financially underdeveloped.
Figure 2 3 Private Sector Credit – Vanuatu and Selected Small Pacific Island Countries

31
Source: World Bank Global Financial Development Database
Figure 2 4 Deposit Money Bank Assets – Vanuatu and Small Pacific Island Countries
Source: World Bank Global Financial Development Database
2.6.2 Financial depth and access for Vanuatu, selected Pacific Island Countries and high income OECD average
Figures 2.5 and 2.6 show financial access, measured by bank branches and ATMs per 100,000 people,
respectively. The data in Figure 2.5 shows that there are fewer than 25 commercial bank branches
per 100,000 people for these selected Pacific Island Countries compared to the average of 30
commercial bank branches per 100,000 people for high income (OECD) countries, an indication that
financial access in these countries is also more difficult. This implies that selected Pacific Island
Countries are financially underdeveloped. Despite this, Tonga, Samoa and Vanuatu have over 20
branches per 100,000 people, higher than the selected group average level, while Fiji and Solomon
0102030405060708090
100
1980
1982
1984
1986
1988
1990
1992
1994
1996
1998
2000
2002
2004
2006
2008
2010
2012
Financial Depth (Private Sector Credit as % of GDP)
Vanuatu
Fiji
Samoa
Tonga
Solomon Islands
Avg Small PacificIsland StatesOECD High IncomeCountries

32
Islands are below the average. Similarly, that the access to financial services, measured by the
number of ATMs, is lower compared to high income (OECD) countries also shows the
underdeveloped financial sector of these selected Pacific Island Countries (see Figure 2.6). This may
reflect the dispersion of bank branches and may mean that it could be more difficult for small
enterprises to gain access to financing than larger firms. Therefore, encouraging competition by
commercial banks for deposits or using innovation by helping their customers to utilise financial
services through the use of the internet may assist in increasing the access to finance.
Figure 25 Number of Bank Branches per 100,000 people
Source: World Bank Global Financial Development Database
Figure 26 Number of Automatic Teller Machines (ATMs) per 100,000 people
Source: World Bank Global Financial Development Database
0
5
10
15
20
25
30
35
2004 2005 2006 2007 2008 2009 2010 2011
Number of bank branches per 100,000 people
Vanuatu
Fiji
Samoa
Tonga
Solomon Is
Avg Small PacificIsland StatesHigh Income;OECD

33
2.6.3 Correlation between Vanuatu’s financial development and growth
The section empirically examines the central focus of this current study, the relationship between
financial development and economic growth. As previously discussed, economic theory suggests that
more robust and efficient financial systems will have a positive effect on growth, and hence a
positive relationship between the two variables. Figure 2.7a and Figure 2.7b show mixed views of the
trend in the financial development-growth relationship in the early 1980s to 1990s, with liquid
liabilities showing a negative relationship and private sector credit showing a positive relationship
with growth. However, the relationships improved and became positive, but remained weak through
the late 1990s to 2013 (for both indicators of financial development).
Figure 27 Growth and Financial Development, Vanuatu a. Liquid liabilities
b. Private Sector Credit
Source: Author’s calculations (2015)
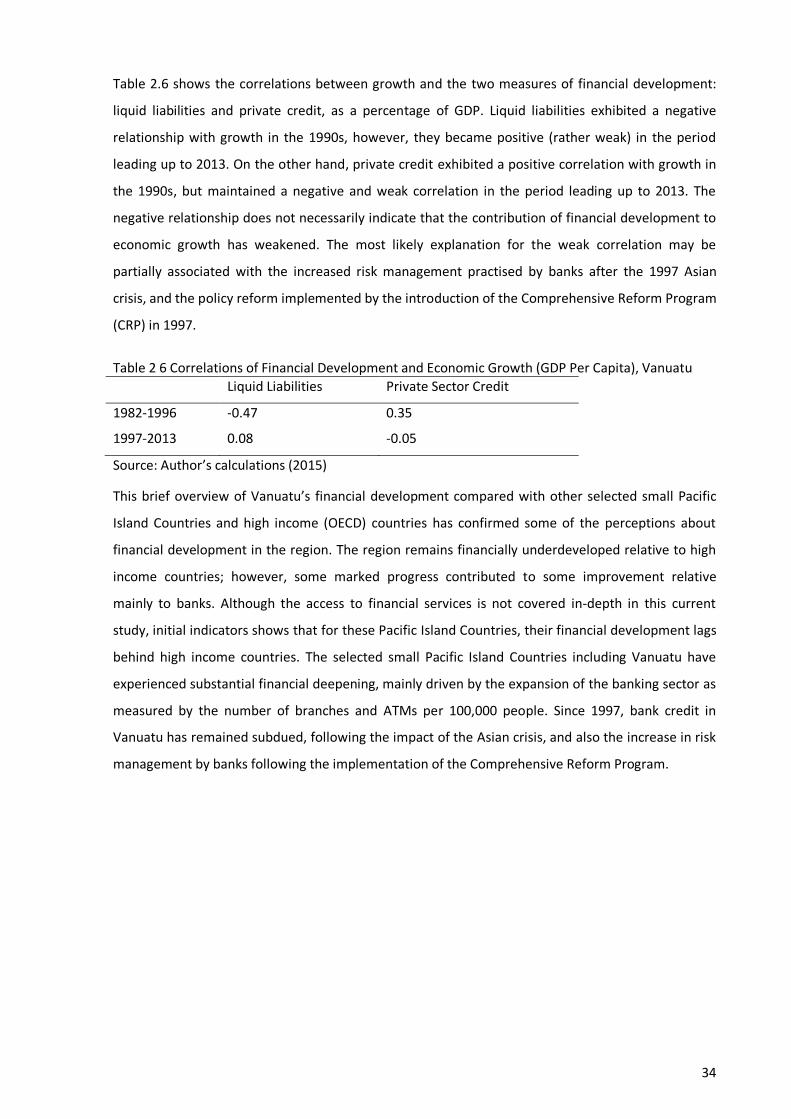
34
Table 2.6 shows the correlations between growth and the two measures of financial development:
liquid liabilities and private credit, as a percentage of GDP. Liquid liabilities exhibited a negative
relationship with growth in the 1990s, however, they became positive (rather weak) in the period
leading up to 2013. On the other hand, private credit exhibited a positive correlation with growth in
the 1990s, but maintained a negative and weak correlation in the period leading up to 2013. The
negative relationship does not necessarily indicate that the contribution of financial development to
economic growth has weakened. The most likely explanation for the weak correlation may be
partially associated with the increased risk management practised by banks after the 1997 Asian
crisis, and the policy reform implemented by the introduction of the Comprehensive Reform Program
(CRP) in 1997.
Table 2 6 Correlations of Financial Development and Economic Growth (GDP Per Capita), Vanuatu Liquid Liabilities Private Sector Credit
1982-1996 -0.47 0.35
1997-2013 0.08 -0.05
Source: Author’s calculations (2015)
This brief overview of Vanuatu’s financial development compared with other selected small Pacific
Island Countries and high income (OECD) countries has confirmed some of the perceptions about
financial development in the region. The region remains financially underdeveloped relative to high
income countries; however, some marked progress contributed to some improvement relative
mainly to banks. Although the access to financial services is not covered in-depth in this current
study, initial indicators shows that for these Pacific Island Countries, their financial development lags
behind high income countries. The selected small Pacific Island Countries including Vanuatu have
experienced substantial financial deepening, mainly driven by the expansion of the banking sector as
measured by the number of branches and ATMs per 100,000 people. Since 1997, bank credit in
Vanuatu has remained subdued, following the impact of the Asian crisis, and also the increase in risk
management by banks following the implementation of the Comprehensive Reform Program.

35
Chapter 3
Research Methodology
This chapter describes the data and econometric methodology used to investigate the relationship
between financial development and economic growth. Section 3.1 presents the research design and
Section 3.2 discusses the methodology used to test the hypotheses. Section 3.3 identifies the
contribution of major financial sector development reforms on productivity growth, productive
sectors and investment.
This methodology closely follows an individual country case-study regression approach used in
literatures on finance and growth, using time series data and estimation techniques. Various
literatures have identified the characteristics of small developing Pacific Island Countries. These
include their smallness, remoteness and isolation causing challenges in trade, their low resource and
export base, low capital intensity and low technology capacity contributing to their low economies-
of-scale (Winters & Martin, 2004). Despite the progress in financial development, Vanuatu’s
economic growth is also influenced by other factors including the large dependence on overseas aid
and the less resilience to natural disasters that influence growth. This is because small developing
countries are faced with diverse political, legal, economic and social structures that contribute to
their diverse phases in economic development. These diversities among different developing
economies support a country-specific case-study approach to identify the impact of financial
development on growth.
3.1 Research Design
Time series analysis is used in our study to investigate the impact of financial development on
economic growth. It covers and examines the three research questions (see Chapter 1). The first set
of regression analysis investigates whether formal financial development (represented by
commercial banking development indicators) contributes to economic growth in small Pacific Island
Countries, using Vanuatu as a case-study. Despite the progress in financial development, Vanuatu’s
economic growth is also influenced by other factors including large dependence on overseas aid and
less resilience to natural disasters that impact economic growth. Control variables are introduced in
the model to account for other factors that influence economic growth. The model estimation
includes unit root tests, tests for causality and non-stationary characteristics, and investigating the
short-run and long-run relationship using a Vector-Error-Correction Model (VCEM). Time-series data
for the period 1983 to 2013 are used to examine the relationship between the financial development
and growth variables.

36
Further, an Ordinary Least Square (OLS) regression model is estimated with time series data for the
period 1983 - 2013 to identify the contribution of financial development, pre and post-
Comprehensive Reform Program (CRP), a major financial reform implemented in Vanuatu in 1997.
Besides investigating the relationship between financial development and growth, this analysis also
determines the impact of finance on productivity growth by major economic sectors and capital
accumulation in Vanuatu. Finally, an empirical investigation of Vanuatu’s financial sector on growth
will be conducted to help identify the problems and challenges small Pacific Island Countries face in
developing financial systems and their implications for future growth. It also supports the in-depth
analysis of Vanuatu’s financial sector structure carried out in the previous chapter and explores the
rate of financial deepening, the size and efficiency of Vanuatu’s banking system, and the allocation of
credit to the private sector with respect to economic development.
Overall, the research is designed to investigate the impact of selected indicators representative of
financial development on Vanuatu’s economic growth. In doing so, we aim to identify the
relationship and the supporting role of financial development on Vanuatu’s economic growth.
Therefore, we hypothesise that a positive relationship exists between financial sector development
through commercial banking development and economic growth, and test the causality (including
short-run and long-run) relationship from financial development to economic growth. Secondly, we
aim to identify the major sectors receiving the highest level of private sector credit from commercial
banks and their contribution to economic growth and hypothesise that financial development
influences different channels and sectors following an economic reform. This will support the
hypothesis that existing financial sector development initiatives have a positive impact on Vanuatu’s
major economic sectors.
3.1.1 Investigating the relationship between Vanuatu’s financial sector development and economic growth
To investigate the role of finance in the economy, the relationship between Vanuatu’s formal
financial sector development and economic growth is identified using the theoretical framework
established by Schumpeter (1912) who identified how bank loans are essential for economic
development. This framework focuses on the role played by entrepreneurs who use stocks of capital
supplied through the mechanisms of credit capitalists and banks to support economic development.
Banks act as intermediaries between savers and persons who are able and willing to borrow money.
Financial intermediaries may boost the rate of technological innovation by identifying those
entrepreneurs with the best chances of successfully initiating new goods and production processes
(King and Levine (1993a); Galetovic (1996)). Aghion et al. (2005) developed a model on how the
ability of firms to access credit during the production process influences innovation and long-run
growth when the firms face macroeconomic shocks (e.g. recession). Their findings provided evidence

37
in line with the theory that macroeconomic volatility exerts a particularly negative impact on
innovation and growth in under-developed financial systems because the firms’ willingness to
undertake research and development (R&D) depends on their ability to borrow in the future to meet
adjustment costs. Their ability to borrow is influenced negatively by the likelihood of experiencing a
recession and positively by the level of financial development. King and Levine (1993a) have
identified various measures of the level of financial development, which is strongly associated with
present and future rates of growth, the real GDP per capita growth and the rate of physical capital
accumulation. These empirical studies have identified how financial sector development plays an
important role in the economic growth and development of developed and developing countries.
Finance through the banking system plays a crucial role in the process of growth. It does this through
a variety of mechanisms, such as reducing the cost of capital to firms, allocating capital more
efficiently to entrepreneurs, and encouraging greater competition among non-financial firms (Khan &
Senhadji, 2000). This current study focuses on the mechanism of credit allocation through bank
credit to the private sector and how the allocation decisions foster productivity growth. Khan and
Senhadji noted that for small developing countries, the commercial sector becomes an important
sector in lending where there is sufficient credit and security, and the capital is invested for a short
term (usually for less than a year). Through this process, credit may be allocated to major sectors
that support growth. Therefore, a study on Vanuatu’s economy and financial system is important
from the standpoint of assessing the strengths and weaknesses of ongoing financial development
and its impact on economic growth.
Apart from the credit channel highlighting the role of the banking system in supporting economic
growth, the financial sector can also be developed in many different ways. McKinnon (1973) and
Shaw (1973) highlighted in their studies that free entry and competition in the financial markets
increase interest rates on deposits leading to higher saving rates and in turn, increase the amount of
resources available for investment. The improvement in efficiency and competitiveness of the
banking sector may channel growth in the following ways:
The range of financial services that are available may increase;
The diversity of institutions which operate in the financial sector may increase;
The amount of money that is intermediated through the financial sector may also increase;
The extent to which capital is allocated by private sector financial institutions to private
sector enterprises;
The improvement in the regulation and stability of the financial sector; and

38
The improvement in access to financial services (World Bank, 2001; ADB, 2015).
This current study specifically focuses on the financial development aspects concerning the amount
of money that is intermediated through the financial sector, and the extent to which capital or credit
is allocated by banks or financial institutions to the private sector.
The role of financial markets, including banking development, in the economic growth process is one
critical factor receiving considerable attention and interest more recently in developed and
developing countries. The positive link between financial depth (defined broadly as the level of
development of financial markets) and economic growth is evident in developed countries with more
developed financial markets (Levine, 2005). Demetriades and Hussein (1996) also found evidence of
reverse causality where higher growth in developed economies contributes to financial sector
development with supporting evidence that the financial system performs the most important role in
facilitating the allocation of resources over space and time. Financial intermediaries like the banking
system also become essentially important because of the imperfections or frictions which makes
economic exchanges costly or not occurring at all. Therefore, financial intermediaries make these
exchanges affordable, offsetting the underlying market imperfections and frictions. However, there
remains limited theoretical and empirical work in small developing countries supporting this
conceptual role of financial markets in economic development. These small developing countries are
faced with diverse political, legal, economic and social structures that contribute to their diverse
phase in economic development and justify the need for a country-specific case-study approach to
identify the impact of financial development on growth.
The standard Solow growth model is a dynamic model of the economy, which describes how the
economy changes and grows over time as saving and investment, labour force growth and progress
in and advancing technology raise the economy’s level of output per worker. The Solow growth
model investigates the division of output between consumption and investment and mainly focuses
on policies that support long-run growth that increases the efficiency of the labour force. More
importantly, apart from the importance of technological progress to sustained economic growth,
knowledge and technology can only be developed in interaction with physical capital. Savings and
investment are the drivers leading to increases in capital intensity. The developing countries differ
from the developed countries due to their low capital intensity (ratio of capital per unit of output) as
these countries have relatively little in the way of physical capital (MHHE, 2005).
The Solow Growth Theory identifies two specific channels through which the financial sector may
affect long-run growth: capital accumulation and technological progress (Theil, 2001). The more
efficient the transformation of savings into investment, the lower the loss of resources and the more
the savings can be used for productive investments (FitzGerald, 2006). Alternatively, Montiel (2003)

39
identifies three ways through which finance affects growth by: (a) creating incentives for
accumulation of physical and human capital, (b) allocating capital to the most productive activities,
and (c) decreasing the amount of resources used in the process of intermediation. The effects of
these channels are supported by the five basic functions of financial intermediaries identified as
producing information ex ante about possible investments and allocating capital, exerting corporate
governance, facilitating risk management, pooling savings and easing exchange (Levine, 1997). Each
of these financial functions may influence savings and investment decisions and hence economic
growth. Greenwood and Jovanovic (1990) also modelled the dynamic interactions between finance
and growth, where growth means that more individuals can afford to join financial intermediaries,
thus improving the ability of financial intermediaries to produce better information with positive
ramifications for growth.
Extensive empirical work has been done on the relationship between financial development and
growth, such as that by King and Levine (1993a) and others (Roubini and Sala-i-Martin, 1992; Gertler
and Rose, 1994) who found a strong positive link between financial development and growth, and
financial development has predictive power for future growth. They interpret this finding as evidence
of a causal relationship that runs from financial development to growth. Evidence on the financial
development-growth link is also found in country case studies. McKinnon (1973) studied the
relationship between the financial system and economic development in a number of developed
countries such as Argentina, Germany and Korea in the post-World War II period and concluded that
better functioning financial systems support faster growth. Empirical evidence from studies by Levine
(1997) and Demetriades and Hussein (1996) shows that the relationship between financial
development and growth reflects reverse causality, where faster growth leads to financial
deepening. The real issue documented in empirical literature is not spurious correlations, but one of
simultaneity bias. This is tested using a formal causality test to find evidence of a bi-directional
causation relationship between financial development and growth. This current study considers
these formal causality tests to investigate the relationship between Vanuatu’s financial development
and economic growth.
The positive relationship between financial depth and growth was also found in empirical studies by
King and Levine (1993; 1993a), Levine (1998) and De Gregoria and Guidotti (1995). With their
contribution, studies carried out by Rousseau and Wachtel (2007) and Loayza and Ranciere (2005)
supported the individual country case-study approach to investigate the short-run and long-run
impacts of the finance-growth relationship. Abubakar and Gani (2013) carried out a case-study of
Nigeria using the model on the growth of real GDP to gross fixed capital formation, trade openness
and interest rate spread as control variables to control for the possible effects of other growth
determining factors.
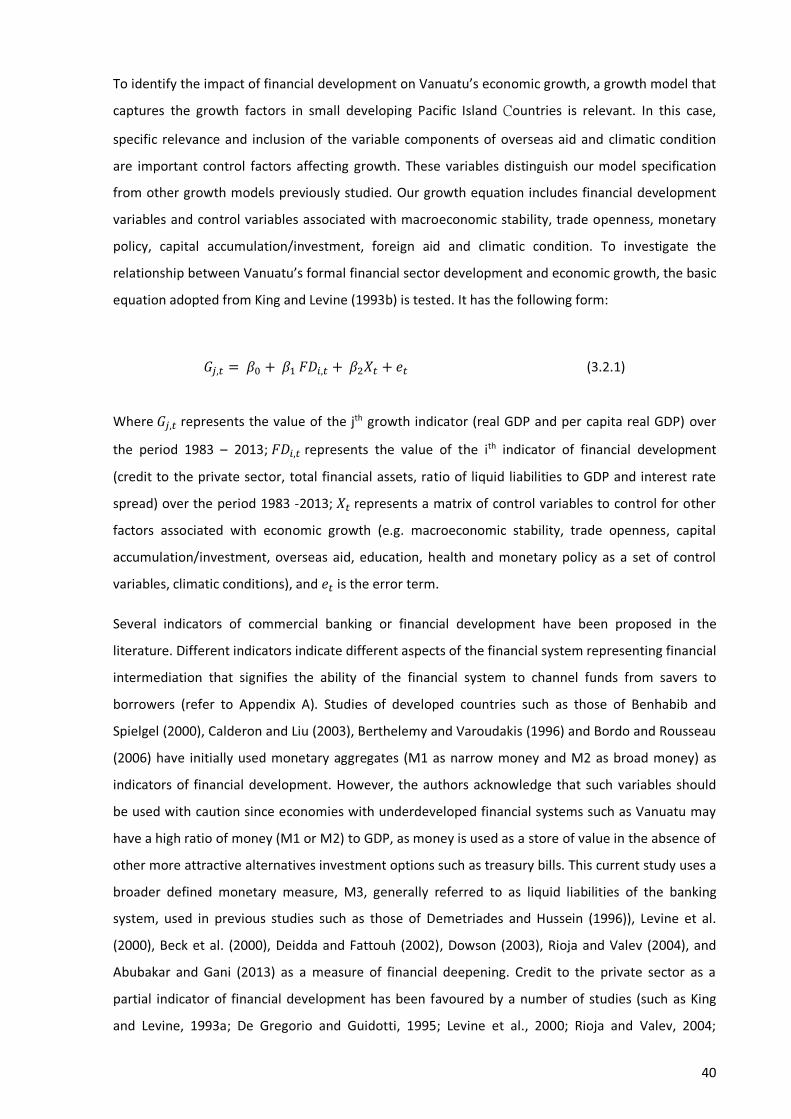
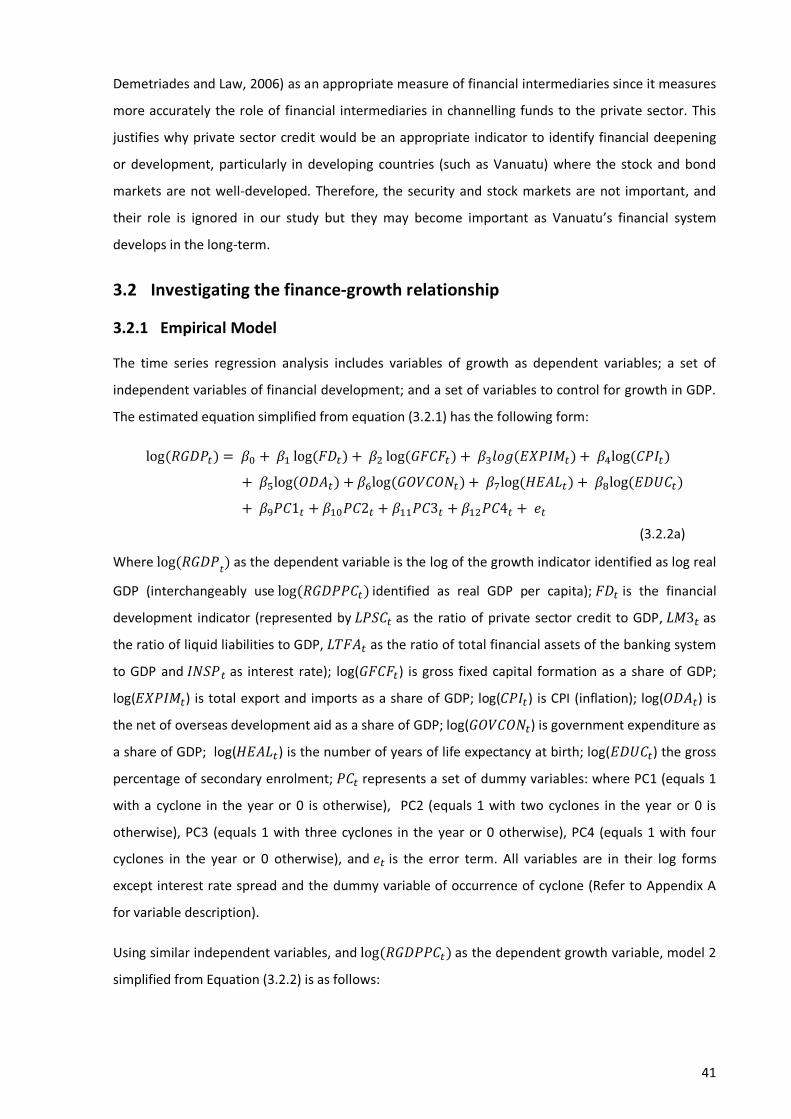


47
(the agriculture, industry and service sectors) as the dependent variables is investigated. To
investigate the contribution of the financial reform following the implementation of the
Comprehensive Reform Programme (CRP), we examine the pre-reform (period 1983-1996) and post-
reform (period 1997-2013) impact on the economy.

48
Chapter 4
Results
This chapter presents the econometric analysis and the results of the link and causality between
financial sector development and economic growth. Section 4.1 describes the summary statistics of
Vanuatu’s financial development indicators. Section 4.2 presents the results of the econometric
model on the impact of financial development on growth; it firstly presents the unit root and
stationarity tests followed by Johansen Cointegration procedure results and regression and the
Vector Error Correction Model (VECM) results. Section 4.3 presents the results of the econometric
model that investigates the contribution of major financial sector development reforms on major
economic reform in the major economic sectors of Vanuatu.
4.1 Descriptive Statistics
Table 4 1 Descriptive Statistics of Financial Development Indicators for Vanuatu (1983-2013) LPSC LM3 LTFA INSP
Mean 34.04 31.07 79.24 8.98 Median 24.50 33.20 77.35 9.20 Maximum 87.10 42.30 130.80 11.30 Minimum 10.80 12.10 22.00 5.10 Std. Dev. 23.56 9.43 31.16 1.19 Source: Author’s calculation (2015); LPSC – log Private Sector Credit (as % of GDP); LM3 – log Liquid Liabilities (as % of GDP); LTFA - log Total Financial Assets (% of GDP); INSP – Interest Rate Spread (%)
Table 4.1 shows all financial development indicators show variability throughout the period 1983-
2013. The large variation between the minimum and maximum values of financial development
indicators (private sector credit, liquid liabilities and total financial assets as a share of GDP) indicate
that there is evidence of increased financial intermediation and financial deepening in Vanuatu’s
economy, and evidently the size of the banking sector has grown over the period of 32 years.
However, the large variation between the interest rate gap range may indicate a high borrowing rate
over the deposit rate of banks over the study period. This implies that there could be evidence of
inefficiency in the banking system (a higher interest rate spread may mean a high borrowing rate
which may potentially limit the number of loanable funds into productive sectors and therefore this
may imply high bank regulation or banking inefficiencies).
Table 4 2 Correlation Coefficients between the Financial Depth Indicators LPSC LM3 LTFA INSP
PSC 1.00 M3 0.71 1.00 TFA 0.83 0.94 1.00 INSP -0.34 -0.03 -0.13 1.00
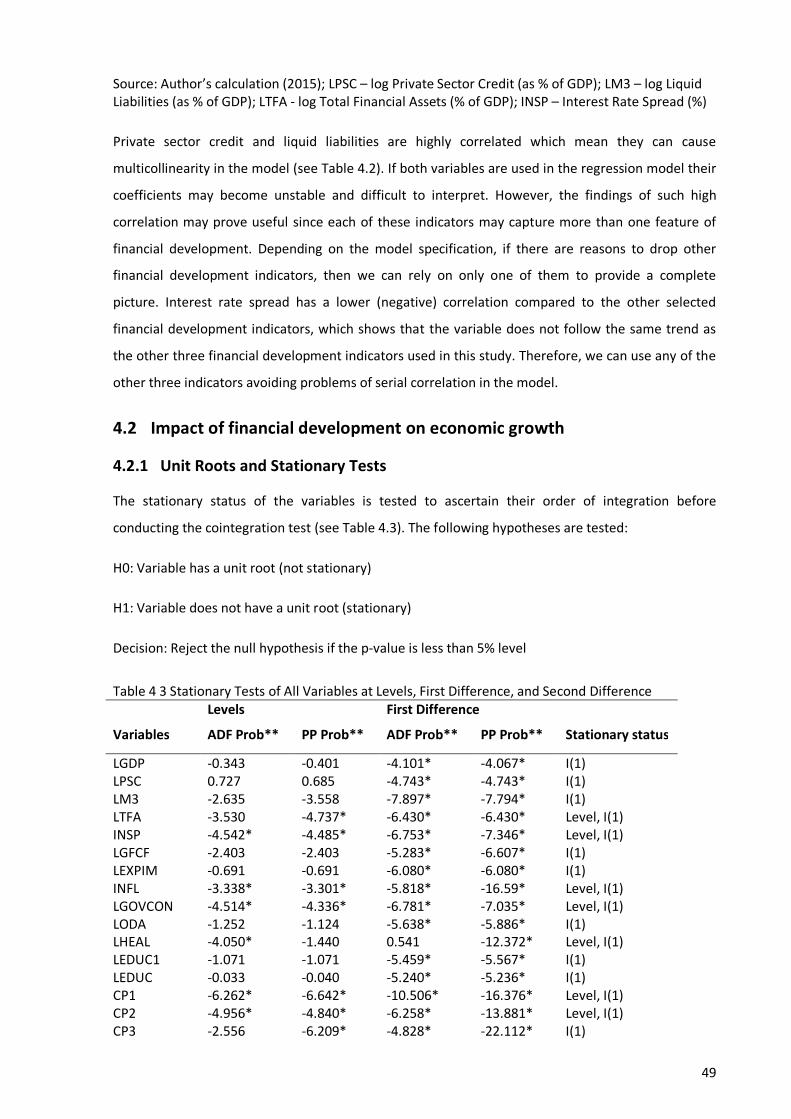
49
Source: Author’s calculation (2015); LPSC – log Private Sector Credit (as % of GDP); LM3 – log Liquid Liabilities (as % of GDP); LTFA - log Total Financial Assets (% of GDP); INSP – Interest Rate Spread (%)
Private sector credit and liquid liabilities are highly correlated which mean they can cause
multicollinearity in the model (see Table 4.2). If both variables are used in the regression model their
coefficients may become unstable and difficult to interpret. However, the findings of such high
correlation may prove useful since each of these indicators may capture more than one feature of
financial development. Depending on the model specification, if there are reasons to drop other
financial development indicators, then we can rely on only one of them to provide a complete
picture. Interest rate spread has a lower (negative) correlation compared to the other selected
financial development indicators, which shows that the variable does not follow the same trend as
the other three financial development indicators used in this study. Therefore, we can use any of the
other three indicators avoiding problems of serial correlation in the model.
4.2 Impact of financial development on economic growth
4.2.1 Unit Roots and Stationary Tests
The stationary status of the variables is tested to ascertain their order of integration before
conducting the cointegration test (see Table 4.3). The following hypotheses are tested:
H0: Variable has a unit root (not stationary)
H1: Variable does not have a unit root (stationary)
Decision: Reject the null hypothesis if the p-value is less than 5% level
Table 4 3 Stationary Tests of All Variables at Levels, First Difference, and Second Difference Levels First Difference
Variables ADF Prob** PP Prob** ADF Prob** PP Prob** Stationary status
LGDP -0.343 -0.401 -4.101* -4.067* I(1) LPSC 0.727 0.685 -4.743* -4.743* I(1) LM3 -2.635 -3.558 -7.897* -7.794* I(1) LTFA -3.530 -4.737* -6.430* -6.430* Level, I(1) INSP -4.542* -4.485* -6.753* -7.346* Level, I(1) LGFCF -2.403 -2.403 -5.283* -6.607* I(1) LEXPIM -0.691 -0.691 -6.080* -6.080* I(1) INFL -3.338* -3.301* -5.818* -16.59* Level, I(1) LGOVCON -4.514* -4.336* -6.781* -7.035* Level, I(1) LODA -1.252 -1.124 -5.638* -5.886* I(1) LHEAL -4.050* -1.440 0.541 -12.372* Level, I(1) LEDUC1 -1.071 -1.071 -5.459* -5.567* I(1) LEDUC -0.033 -0.040 -5.240* -5.236* I(1) CP1 -6.262* -6.642* -10.506* -16.376* Level, I(1) CP2 -4.956* -4.840* -6.258* -13.881* Level, I(1) CP3 -2.556 -6.209* -4.828* -22.112* I(1)

50
CP4 -5.770* -5.837* -6.112* -14.610* Level, I(1) Source: Author’s calculation (2015); * denotes rejection of the null hypothesis at the 5% level; ** MacKinnon one-sided p-values
The Augmented Dicky-Fuller (ADF) (and the Phillips and Perron (PP) verification) tests for unit root
and stationarity on all the variables at levels and first difference (and second difference) show that all
five variables are integrated of the same order meaning that at level they are non-stationary, but
they become stationary when converted to first difference. All variables have a unit root which
implies that they are not stationary at their levels. However, the first difference of the variables has
no unit root and the null hypothesis is rejected at the 5% level of significance, indicating that the
variables are integrated of the same order, I(1). When the variables are integrated of the same order,
we can run the Johansen Test of Cointegration.
4.2.2 Regression Results
Table 44 Johansen Cointegration Procedure Results (Models 1.0.1 – 1.0.5 and 2.0.1 - 2.0.5) Johansen Cointegration Procedure for Equations 3.2.2a
and 3.2.2b Null hypothesis
Existence of cointegration
Model1.0.1 LRGDP LPSC LM3 LTFA INSP r≤1* √ r≥1 Model1.0.2 LRGDP LPSC r=0 None Model1.0.3 LRGDP LM3 r=0 None Model1.0.4 LRGDP LTFA r=0 None Model1.0.5 LRGDP INSP r≤1* √ r≥1 Model2.0.1 LRGDPPC LPSC LM3 LTFA INSP r≤2* √ r≥2 Model2.0.2 LRGDPPC LPSC r=0 None Model2.0.3 LRGDPPC LM3 r=0 None Model2.0.4 LRGDPPC LTFA r≤2* √ r≥2 Model2.0.5 LRGDPPC INSP r≤2* √ r≥2 Source: Author’s calculation (2015); *denotes rejection of the null hypothesis at the 5% level (see Appendix B for model specification) The Johansen Procedure results in Table 4.4 show that there is a long-run relationship between real
GDP, private sector credit, liquid liabilities, total financial assets and interest rate spread (model
1.0.1) and between real GDP and interest rate spread, despite none for the other variables and real
GDP. Similar results are shown for the real GDP per capita and four financial development indicators
(model 2.0.1) while a long-run relationship also exists between total financial assets and interest rate
and real GDP alone.
Table 4 5Impact of Financial Development on Growth using Real GDP as model 1.0 (and Real GDP per capita in brackets - model 2.0) as the dependent variables (Equations 3.2.2a and 3.2.2b)
Dependent Variables (Results of Model 2.0.1-2.0.5 LRGDPPC in brackets)
Independent Variables
LRGDP (Model 1.0.1)
LRGDP (Model 1.0.2)
LRGDP (Model 1.0.3)
LRGDP (Model 1.0.4)
LRGDP (Model 1.0.5)
C 8.109*** (11.995)***
7.822*** (12.073)***
6.797*** (12.01)***
8.573*** (12.238)***
10.996 (12.447)***

51
LPSC 0.308*** (-0.015)
0.757*** (0.07)**
LM3 -0.008 (0.116)
0.672*** (0.057)**
LTFA 0.328*** (-0.0421)
0.473*** (0.022)**
INSP -0.0167 (-0.0091)
-0.045 (-0.013)*
N 32 32 32 32 32 R-Squared 0.942
(0.234) 0.696 (0.146)
0.819 (0.140)
0.847 (0.045)
0.049 (0.091)
Source: Author’s calculation (2015); LPSC – log Private Sector Credit (as % of GDP); ***, **, *, indicate statistical significance at the 1, 5, and 10 percent levels, respectively; LM3 – log Liquid Liabilities (as % of GDP); LTFA - log Total Financial Assets (% of GDP); INSP – Interest Rate Spread (%); LRGDP – log Real Gross Domestic Product; LRGDPPC- log Real Gross Domestic Product per capita (see Appendix B for model specification)
The regression results for equation 3.2.2a using each of the financial development variables as
independent variables show that private sector credit, liquid liabilities and total financial assets have
a positive and significant relationship with GDP at the 1% level, respectively (and with GDP per capita
at the 5% level, respectively) (see Table 4.5). The models’ estimates show that a 1% increase in
banking credit to the private sector leads to a 0.8% increase in growth (0.07% increase in GDP per
capita growth); a 1% increase in liquid liabilities leads to a 0.7% increase in growth (0.06% increase in
GDP per capita growth); and a 1% increase in total financial assets of the banking system leads to a
0.5% increase in growth (or 0.02 percent in GDP per capita growth). Overall, the three financial
development indicators exhibit positive and statistically significant relationships with growth. On the
other hand, an increase in interest rate spread (possibly driven by a higher borrowing rate) has a
negative and significant relationship with GDP per capita growth, at the 10% level. This implies that
bank inefficiency leads to a decline in economic growth or vice versa. If interest rate spread declines,
bank inefficiencies decline and economic growth is predicted to increase. The model results show a
1% increase in banking inefficiency (represented by an increased interest rate spread) leads to a
decline in growth of 0.05 percent (or -0.01 percent in GDP per capita growth). Similar results were
obtained when we ran all four financial development variables together with the growth variables.
Aside from liquid liabilities showing a negative2 and insignificant relationship with growth, bank
credit to the private sector and total financial assets exhibited a positive and significant relationship
with growth. A 1% increase in private sector credit and total financial assets leads to an increase in
growth by 0.3%, respectively. Overall, the results indicate that financial intermediation and the size
of the banking system are important for growth. The models have high r-squared, with the exception
of the growth model using interest rate spread. All five models have relatively low r-squares which
2 The negative relations could be related to the multicollinearity effect since it is highly correlated with private sector credit or due to the small sample size

52
means that changes in the growth variable is not fully explained by the given variables, but there are
other variables that may explain the movement in growth.
To improve the five models, control variables are included as dependent variables to account for
other factors that explain the changes in the growth variables. These control variables include gross
fixed capital formation as an indicator of investment (GFCF), Government expenditure (GOVCON),
total exports and imports as an indicator of trade openness (EXPIM), Consumer Price Index as an
indicator of inflation and macroeconomic stability (CPI), Life expectancy in number of years as an
indicator of health (HEAL), gross percentage of secondary school enrolment as an indicator of
education (EDUC) both indicators of human capital, and four separate dummy variables to capture
the impact of the occurrence of four cyclones in a year (CP1, CP2, CP3 and CP4). Depending on the
model specification and theory, the lag variables of financial development (a maximum of two lags)
are added and the insignificant variables are omitted to select the right model. The regression model
(equation 3.2.2) results show significant coefficients, are high r-squared and pass the robustness test
(no serial correlation, no heroskesdasticity and are normally distributed).
Table 4 6 Johansen Cointegration Procedure Results (Models 1.1 and 2.1)
Johansen Cointegration Procedure for Equations 3.2.2a and 3.2.2b
Null hypothesis
Existence of cointegration
Model 1.1 LRGDP LPSC, LGFCF, LGOVCON LEXPIM, INFL, LHEAL, LEDUC, LEDUC1
r≤7* √ r≥7
Model 2.1 LRGDPPC LPSC, LGFCF, LGOVCON LEXPIM, INFL, LHEAL, LEDUC, LEDUC1
r≤9* √ r≥9
Source: Author’s calculation (2015); *denotes rejection of the null hypothesis at the 5% level (see Appendix B for model specification)
The Johansen procedure results in Table 4.6, using private sector credit as the only financial
development explanatory variable, show that there are seven or more long-run relationships
between all the selected variables with real GDP (model 1.1) and nine or more long-run relationships
with real GDP per capita (model 2.1) as the dependent variables.
Table 4 7 Regression Results of the Growth Model using Private Sector Credit as the Independent Variable (Equations 3.2.2a and 3.2.2b)
Dependent Variable LRGDP LRGDPPC Independent Variables (Model 1.1) (Model 2.1) C -3.41** 10.0*** PSC(-2) 0.22*** 0.23*** LGFCF(-1) 0.05** 0.09*** LGOVCON(-1) -0.16*** LGOVCON(-2) 0.03 LEXPIM 0.19*** 0.08*** INFL(-1) -0.003** -0.004*** LHEAL 2.40***

53
LEDUC -0.13*** -0.18*** LEDUC1 0.32*** 0.32*** CP1 -0.03*** -0.04*** CP2 -0.03** -0.04*** CP3 -0.03** -0.04*** CP4 -0.07*** -0.06*** N 30 30 R-Squared 0.995 0.909 Source: Author’s calculations (2015); ***, **, *, indicate statistical significance at the 1, 5, and 10 percent levels, respectively; LPSC – log Private Sector Credit (as % of GDP); LRGDP – log Real Gross Domestic Product; LRGDPPC- log Real Gross Domestic Product per capita (see Appendix A for description of control variables)
The regression model 1.1 (equation 3.2.2a) uses private sector credit as the independent variable to
test the relationship between private sector credit (indicator of credit allocation) and growth (Table
4.7). The results show that there is a positive and significant relationship between private sector
credit growth (lagged for a two year period) and growth, at the 1% significance level. It is estimated
that a one percent increase in credit allocation in two years increases growth by 0.2 percent in
growth in the current period. This means that the impact of credit financing into the real sector is
rather slow. These results support the findings of the weak Monetary Policy transmission mechanism
in Pacific Island Countries by an International Monetary Fund study (Dunn et al., 2011). Furthermore,
capital investment has a positive and significant relationship with growth at the 5% level; a one
percent increase in capital investment leads to a 0.05 percent increase in growth (or a 0.09 percent
increase in economic development, model 2.1). Trade openness also has a positive and significant
relationship with growth at the 1% level; it is estimated that a one percent increase in trade
openness increases growth by 0.2 percent (or a 0.08 percent increase in economic development).
The human capital investment variable represented by increase in life expectancy is important for
growth. The education variable (mainly primary school enrolment) is deemed important for growth,
although the other component of education variable – secondary school enrolment has a negative
relationship with growth. The negative relationship in the education coefficient is due to a fall in the
gross rate of secondary school enrolment in the decade leading up to 1990. World Bank statistics
show a 5.7 percent fall in gross secondary school enrolment between 1986 and 1992 which is likely
due to the impact of Tropical Cyclone Uma (1987), a category 5 cyclone that destroyed much
infrastructure including schools. The negative coefficient may also be associated with the probable
short sample size3. However, the coefficients of both primary and secondary enrolment in the model
still result in a positive impact of overall education on both real GDP growth and real GDP growth per
capita. This may also mean that primary school enrolment has a greater effect than secondary school
enrolment, and is therefore an appropriate measure of human capital accumulation. On the other
3 Further in-depth studies are recommended to further explore the impact of secondary enrolment on growth for Pacific Island Countries, aside from the finance-growth relationship study

54
hand, inflation and occurrence of cyclones are both detrimental to Vanuatu’s growth. Model
1.1(equation 3.2.2a) regression results show that a 1 percent increase in inflation rate lagged by a
one year period leads to a decline in growth by a -0.003 percent at the 5% significance level (or -
0.004 percent in economic development at the 1% significance level). Likewise, the occurrence of
one cyclone contributes to the decline in growth by -0.03 percent at the 1% significance level (or -
0.04 percent in economic development) and the occurrence of two cyclones and three cyclones in a
year contributes to a decline in growth by -0.03 percent at the 5% significance level; whilst the
occurrence of four cyclones in a year has a greater impact on growth, reducing growth by -0.07
percent at the 1% significance level (or -0.06 percent in economic development). Furthermore, the
empirical results show that a one percent increase in gross fixed capital formation (as a share of GDP)
lagged by a one year period increases growth by a 0.05 percent at the 5% significance level; a one
percent increase in total exports and imports (as a share of GDP) increases growth by 0.19 percent at
the 1% significance level; an increase in life expectancy by one year increases growth by 2.4 percent
at the 1% significance level; a one percent increase in the gross rate of primary school enrolment
increases growth by 0.32 percent at the 1% significance level (despite an increase in the gross rate of
secondary school enrolment, which contributed to a decline in growth by 0.13 percent at the 1%
significance level). These estimated results show that other factors such as capital accumulation and
investment, trade openness and human capital (with the exception of education represented by
secondary school enrolment) have a positive and significant impact on GDP growth. Aside from
these factors, financial intermediation through the increase in credit from the banking system to the
private sector has a positive impact on growth, however with a lag (two periods).
Table 4 8 Johansen Cointegration Procedure Results (Models 1.2 and 2.2) Johansen Cointegration Procedure for
Equations 3.2.2a and 3.2.2b Null hypothesis
Existence of cointegration
Model 1.2 LRGDP LM3, LGFCF, LGOVCON LEXPIM, INFL, LHEAL, LEDUC, LEDUC1
r≤4* √ r≥4
Model 2.2 LRGDPPC LM3, LGFCF, LGOVCON LEXPIM, INFL, LHEAL, LEDUC, LEDUC1
r≤4* √ r≥4
Source: Author’s calculation (2015); *denotes rejection of the null hypothesis at the 5% level (see Appendix B for model specification)
The Johansen procedure results in Table 4.8 using liquid liabilities as the only financial development
explanatory variable, shows that there are four or more long-run relationships between all the
selected variables with real GDP (model 1.2) and four or more long-run relationships with real GDP
per capita (model 2.2) as the dependent variables.
Table 4 9 Regression Results of the Growth Model using Liquid Liabilities as the Independent Variable (Equations 3.2.2a and 3.2.2b)
Dependent Variable LRGDP LRGDPPC

55
Independent Variables (Model 1.2) (Model 2.2) C 4.61*** 18.7*** LM3(-2) 0.22*** 0.21*** LGFCF(-2) -0.06** 0.09*** LGOVCON 0.12*** LGOVCON(-1) -0.13*** LEXPIM 0.26*** 0.19*** INFL(-1) -0.007*** -0.008*** LHEAL -2.81*** LEDUC -0.07*** LEDUC1 0.43*** 0.61*** CP1 -0.02*** CP4 -0.07*** -0.06*** N 30 30 R-Squared 0.994 0.915 Source: Author’s calculations (2015); ***, **, *, indicate statistical significance at the 1, 5, and 10 percent levels, respectively; LM3 – log of Liquid Liabilities (as % of GDP); LRGDP – log Real Gross Domestic Product; LRGDPPC- log Real Gross Domestic Product per capita (see Appendix A for description of control variables)
The regression model 1.2 (equations 3.2.2a and 3.2.2b) uses liquid liabilities (to GDP) as the
independent variable to test the relationship between liquid liabilities and growth. The results show
a positive and significant relationship between financial deepening (growth in liquid liabilities)
(lagged for a two year period) and growth, at the 1% significance level (see Table 4.9). It is estimated
that a one percent increase in financial deepening for two years increases growth by 0.2 percent in
growth in the current period. This result again supports evidence of a weak transmission mechanism
of bank credit financing to the real sector and weak Monetary Policy transmission (Dunn, Davies,
Yang, Wu, & Wang, 2011). On the other hand, the increase in gross fixed capital formation as an
indicator of capital accumulation and investment leads to a 0.09 percent increase in economic
development, at the 1% significance level; however the negative impact of growth may be related to
the period of a low number of aid-funded project implementations. Government expenditure and
trade openness also have a positive and significant relationship with growth at the 1% level; a one
percent increase in each of these variables leads to a 0.12 percent and 0.26 percent in GDP growth,
respectively. The results also support the positive impact of human capital accumulation specifically
through primary school enrolment on growth, aside from a negative relationship with secondary
school enrolment, explained by a fall in the level in the period leading up to the 1990s. On the other
hand, inflation and the occurrence of cyclones are detrimental to Vanuatu’s growth. Model 1.2
results show that a one percent increase in inflation (lagged by a one year period) contributes to a
decline in growth by a -0.007 percent (or -0.008 percent in economic development in model 2.2) at
the 1% significance level. Likewise, the occurrence of a cyclone a year contributes to a decline in
growth by -0.02 percent in economic development; whilst the occurrence of four cyclones in a year
has a greater impact on growth, reducing growth by -0.07 percent (or 0.06 percent in economic
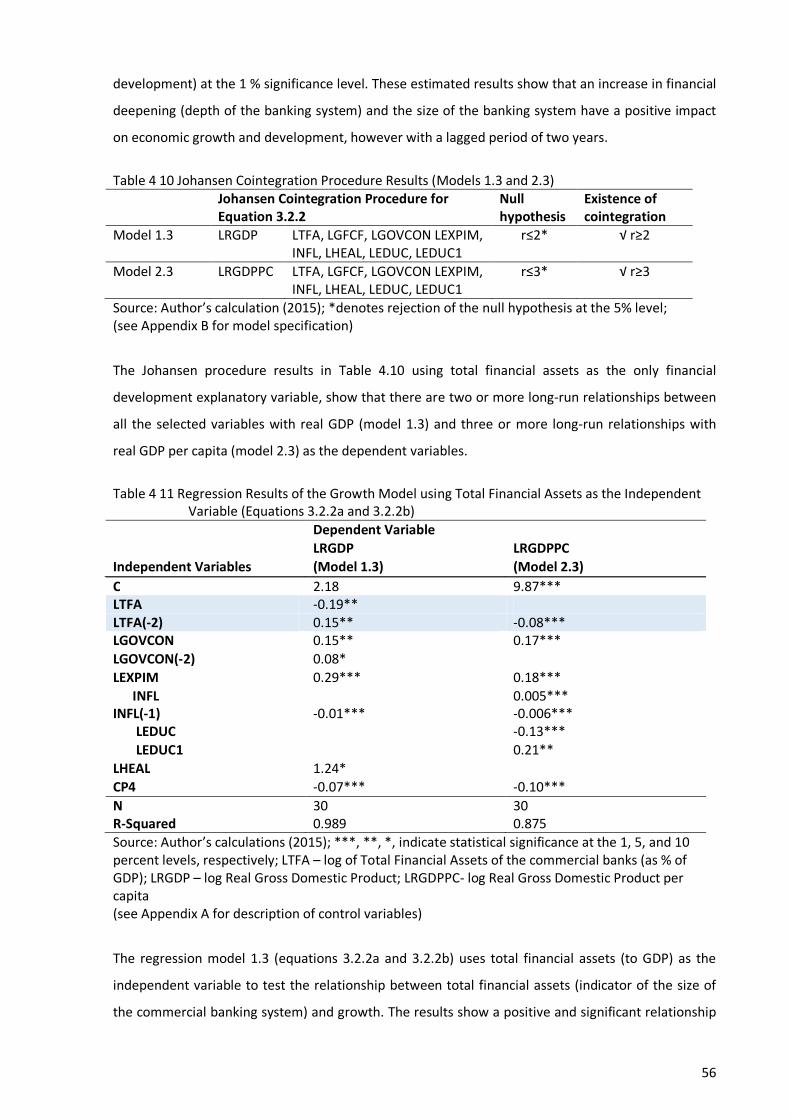
56
development) at the 1 % significance level. These estimated results show that an increase in financial
deepening (depth of the banking system) and the size of the banking system have a positive impact
on economic growth and development, however with a lagged period of two years.
Table 4 10 Johansen Cointegration Procedure Results (Models 1.3 and 2.3) Johansen Cointegration Procedure for
Equation 3.2.2 Null hypothesis
Existence of cointegration
Model 1.3 LRGDP LTFA, LGFCF, LGOVCON LEXPIM, INFL, LHEAL, LEDUC, LEDUC1
r≤2* √ r≥2
Model 2.3 LRGDPPC LTFA, LGFCF, LGOVCON LEXPIM, INFL, LHEAL, LEDUC, LEDUC1
r≤3* √ r≥3
Source: Author’s calculation (2015); *denotes rejection of the null hypothesis at the 5% level; (see Appendix B for model specification)
The Johansen procedure results in Table 4.10 using total financial assets as the only financial
development explanatory variable, show that there are two or more long-run relationships between
all the selected variables with real GDP (model 1.3) and three or more long-run relationships with
real GDP per capita (model 2.3) as the dependent variables.
Table 4 11 Regression Results of the Growth Model using Total Financial Assets as the Independent Variable (Equations 3.2.2a and 3.2.2b)
Dependent Variable LRGDP LRGDPPC Independent Variables (Model 1.3) (Model 2.3) C 2.18 9.87*** LTFA -0.19** LTFA(-2) 0.15** -0.08*** LGOVCON 0.15** 0.17*** LGOVCON(-2) 0.08* LEXPIM 0.29*** 0.18*** INFL 0.005*** INFL(-1) -0.01*** -0.006*** LEDUC -0.13*** LEDUC1 0.21** LHEAL 1.24* CP4 -0.07*** -0.10*** N 30 30 R-Squared 0.989 0.875 Source: Author’s calculations (2015); ***, **, *, indicate statistical significance at the 1, 5, and 10 percent levels, respectively; LTFA – log of Total Financial Assets of the commercial banks (as % of GDP); LRGDP – log Real Gross Domestic Product; LRGDPPC- log Real Gross Domestic Product per capita (see Appendix A for description of control variables)
The regression model 1.3 (equations 3.2.2a and 3.2.2b) uses total financial assets (to GDP) as the
independent variable to test the relationship between total financial assets (indicator of the size of
the commercial banking system) and growth. The results show a positive and significant relationship

57
between the total financial assets of the banking system (lagged for a two year period) and growth at
the 5% level (despite a negative relationship found for the current period) (see Table 4.11). It is
estimated that a one percent increase in financial assets two years ago increases growth by 0.15
percent in the current period. Unexpectedly, the results show a negative relationship for economic
development which may be associated with the small size of the economy and the slowly developing
pace of the financial system related to the weak Monetary Policy transmission mechanism noted for
Vanuatu. On the other hand, the results show a positive and significant relationship between
Government Expenditure and Growth, significant at the 5% level (and also lagged by a two year
period); a one percent increase in consumption expenditure by the government leads to a 0.15
percent in growth (or a 0.17 percent increase in economic development, model 2.3); the model also
estimates a one percent increase in government expenditures (lagged for two years)contributes to a
0.08 percent increase in growth in the current period. The other variable that supports growth is
trade openness, which shows that a one percent increase in trade openness increases growth by a
0.29 percent at the 1 % significance level (or 0.18 percent growth in economic development). The
primary school enrolment is the only human capital investment indicator that has a positive
relationship with economic development at the 5% significance level; a one percent increase in
primary school enrolment leads to an increase in economic development by 0.21 percent. However,
a negative relationship is noted for secondary school enrolment, given the decline in the level in the
period leading to the 1990s. On the other hand, health has a positive and significant relationship with
growth (a one percent increase leads to 1.24 percent growth in economic growth) at the 10%
significance level. On the other hand, inflation and occurrence of cyclones are detrimental for
Vanuatu’s growth. Model 1.3 shows that a one percent increase in inflation (lagged by a one year
period) contributes to a decline in growth by a 0.01 percent (or -0.006 percent in economic
development). Likewise, the occurrence of four cyclones in a year has a greater impact on growth,
reducing growth by -0.07 percent (or 0.10 percent in economic development) at the 1% significance
level. The results also show that other determinants of growth also influence Vanuatu’s growth,
aside from the lagged (2-year period) impact of financial development alone.
Table 4 12 Johansen Cointegration Procedure Results (Models 1.4 and 2.4) Johansen Cointegration Procedure for
Equations 3.2.2a and 3.2.2b Null hypothesis
Existence of cointegration
Model 1.4 LRGDP INSP, LGFCF, LGOVCON LEXPIM, INFL, LHEAL, LEDUC, LEDUC1
r≤4* √ r≥4
Model 2.4 LRGDPPC INSP, LGFCF, LGOVCON LEXPIM, INFL, LHEAL, LEDUC, LEDUC1
r≤5* √ r≥5
Source: Author’s calculation; *denotes rejection of the null hypothesis at the 5% level (see Appendix B for model specification)

58
The Johansen procedure results in Table 4.12 using interest rate spread as the only financial
development explanatory variable, show that there are four or more long-run relationships between
all the selected variables with real GDP (model 1.4) and five or more long-run relationships with real
GDP per capita (model 2.4) as the dependent variables.
Table 4 13 Regression Results of the Growth Model using Interest Rate Spread as the Independent Variable (Equations 3.2.2a and 3.2.2b)
Dependent Variable LRGDP LRGDPPC Independent Variables (Model 1.4) (Model 2.4) C 0.75 11.5*** INSP -0.02*** INSP(-2) -0.02*** -0.02*** LGFC(-1) 0.07** LGFCF(-2) -0.08*** LGOVCON 0.13** 0.19*** LGOVCON(-1) 0.14* LGOVCON(-2) 0.17*** 0.10* LEXPIM 0.17*** 0.10*** INFL(-1) -0.004** -0.003* LEDUC -0.11*** LHEAL 1.86*** CP1 -0.02** CP2 -0.04** CP3 -0.04*** -0.05*** CP4 -0.057*** -0.06*** N 30 30 R-Squared 0.996 0.889 Source: Author’s calculations (2015); ***, **, *, indicate statistical significance at the 1, 5, and 10 percent levels, respectively; INSP – Interest Rate Spread (%); LRGDP – log Real Gross Domestic Product; LRGDPPC- log Real Gross Domestic Product per capita (see Appendix A for description of control variables) The results of the regression model 1.4 (equations 3.2.2a and 3.2.2b) show a negative and significant
relationship between the higher interest rate spread (inefficiencies of the banking system) and
growth at the 5% significance level (see Table 4.13). It is estimated that a one percent increase in
bank inefficiencies (higher interest rate spread or high borrowing rate) reduces GDP growth by -0.02
percent (the same result was noted for GDP per capita). The lagged impact could be partially
explained by the weak transmission mechanism noted for Vanuatu, the high over-head cost of banks
and the low competition amongst banks due to the few banks. On the other hand, the results show
gross fixed capital formation (as an indicator of accumulative capital and investment) lagged by a
period has a positive and significant relationship with growth, at the 5% significance level; a one
percent increase in capital investment increases growth by 0.07 percent. Furthermore, government
expenditure (also lagged by a two year period) also has a positive and significant relationship with
growth at the 5% significance level (and 1% significance level); a one percent increase in government

59
expenditure in the current period and lagged by a two year period increases GDP growth in the
current period by 0.13 percent and 0.17 percent, respectively (positive and significant relationships
were also shown for GDP per capita, model 2.4). Trade openness also has a positive and significant
relationship with growth at the 1% significance level; a 1% increase leads to a 0.17 percent increase
in growth (or 0.10 percent growth in economic development). On the other hand, the health of
human capital investment has a positive relationship with growth (a 1.86 percent growth in
economic growth), despite a negative impact on secondary school enrolment. Inflation and
occurrence of cyclones are detrimental for Vanuatu’s growth. Model 1.4 regression results show that
a one percent increase in inflation (lagged by a one year period) contributes to a decline in growth by
a -0.004 percent (or -0.003 percent in economic development). Likewise, the occurrence of more
than three cyclones impacts economic growth; the occurrence of one cyclone, two cyclones, three
cyclones and four cyclones in a year reduces economic development by -0.02 percent, -0.04 percent,
-0.05 percent and -0.06 percent, respectively.
4.2.3 Johansen Cointegration Procedure Results for the VECM
Following on from the unit root tests and stationary tests, both the lag length selection criterion, that
is the AIC and SBC, revealed that the optimal lag length for all models (see Appendix B) is one.
Therefore, this is used in the Johansen Cointegration Procedure and the VECM model. To proceed
with the Johansen Cointegration Procedure and the problem of high collinearity, the model uses only
six variables. The Johansen Cointegration Procedure is carried out using only six variables (choosing
the ones that are viable through economic theory), including only two financial development
indicators: liquid liabilities (to GDP) and private sector credit (to GDP). The results (using variables in
their logs) are shown in Table 4.14. The following test is carried out:
Null hypothesis H0: Series are not cointegrated.
Alternative hypothesis H1: There is at most one or more cointegration equations
Decision: Reject the null hypothesis if the p-Value is less than 5%. The implication of rejecting the null
hypothesis (H0) is that there is an underlying relationship between the variables selected.
Table 4 14 Johansen Cointegration Procedure for Multiple Cointegration Vectors (Model 3.1) H0: H1: Trace
Statistics 0.05 Critical Values
Prob.** H0: H1: Max-Eigen Statistics
0.05 Critical Values
Prob.**
r=0* r>0 227.3085 95.75366 0.0000 r=0* r>0 100.2446 40.07757 0.0000 r≤1* r>1 127.0639 69.81889 0.0000 r≤1* r>1 63.00034 33.87687 0.0000 r≤2* r>2 64.06361 47.85613 0.0008 r≤2* r>2 35.06773 27.58434 0.0045 r≤3 r>3 28.99588 29.79707 0.0616 r≤3 r>3 17.50982 21.13162 0.1493 r≤4 r>4 11.48606 15.49471 0.1833 r≤4 r>4 11.46747 14.26460 0.1323 r≤5 r>5 0.018589 3.841466 0.8914 r≤5 r>5 0.018589 3.841466 0.8914

60
Source: Author’s calculation (2015); * denotes rejection of the hypothesis at the 5% significance level. ** MacKinnon-Haug-Michelis (1999) p-values Both the Trace statistics and the Max-Eigen statistics results show that the p-value of the null
hypothesis that the number of cointegration equations (r) is at least 3, r ≤ 3, is lower than 0.05.
Therefore, the null hypothesis r ≤ 3 is not rejected at a 5% significance level. This means that there
are at least three cointegration equations and we may conclude that the variables in model 3.1 (see
Appendix B) have a long-run equilibrium relationship.
Table 4 15 Normalized Cointegrating Coefficients (Standard errors in parenthesis) LRGDP LM3 LPSC LEXPIM LODA LGOVCON CE1 1.000000 -1.623748 1.040389 -0.313224 -0.369090 2.070212 (0.11368) (0.10837) (0.05856) (0.07778) (0.14941) CE2 1.000000 -0.541369 -0.216926 0.294819 -1.366095 (0.06489) (0.02351) (0.04462) (0.08790) CE3 1.000000 -0.244932 -0.938509 1.827122 (0.04420) (0.08982) (0.21820) Source: Author’s calculation (2015); LRGDP – log Real Gross Domestic Product; LM3 – log Liquid Liabilities (as % of GDP); LPSC – log Private Sector Credit (as % of GDP); LGFCF – log of Gross Fixed Capital Formation (as % of GDP); LEXPIM - Exports plus Imports (as %of GDP); LCPI – inflation (%); LGOVCON – log of Government Expenditure; LODA – log of overseas-development aid (% of GDP); LHEAL – log of life expectancy (in years).
Since we have identified the existence of three cointegration equations, we can say that a stable
equilibrium relationship is present (see Table 4.15). In the first cointegration equation (Cointegration
equation (1)), the results are normalized on the GDP growth. Owing to the normalisation process, the
signs are reversed to enable proper interpretation. The ratio of liquid liabilities to GDP, exports and
donor-aid into the country have the expected positive signs and are statistically significant according
to the standard error values shown. The coefficients are interpreted as follows:
A 1% increase in liquid liabilities leads to a 1.62% increase in the real GDP in the long run
A 1% increase in total exports plus imports (an indicator of trade openness) leads to a 0.31%
increase in the real GDP in the long run
A 1% increase in gross donor-aid leads to a 0.37% increase in the real GDP in the long run
However, the ratio of private sector credit to GDP and ratio of Government expenditure to GDP
exhibit negative relationships with the GDP growth and are both statistically significant. The
significant results show that the ratio of liquid liabilities to GDP (as an indicator of financial
deepening, therefore financial development) through the banking system positively influences
Vanuatu’s economic growth in the long-run.

61
4.2.4 Vector Error Correction Model (VECM) Results
The variables have long-run relationships and are cointegrated, thus we proceed to develop a
restricted Vector-Auto-Regression Model (VAR) which is a VECM. Table 4.16 summarises the VECM
results and shows the short-run relationships and the adjustment to the long-run. Engle and Granger
(1987)have proven that if a set of series are co-integrated, there exists a mechanism “error-
correction model” which causes the variables to move closely together over time, while allowing a
wide range of short-run dynamics. Using the Johansen approach (Johansen (1988); Johansen and
Juselius (1990)), the concept of short-run and long-run causality is found by identifying the co-
integration relationship between the financial development variable and the economic growth
variable suggesting that they may behave in a different way in the short-run, but will converge
towards a common behaviour in the long-run. This dynamic relationship is described by the error
correction model (ECM) demonstrating the short-run and long-run adjustment parameter. The Wald
statistics explain the short run causality between the independent and dependent variables for the
significance of the coefficients of the series. The coefficients of the error correction term (ECT)
explains the intensity of the long-run causality effect and denotes the speed that deviations from the
long run equilibrium are removed due to variations in each variable.
4.2.4..1 Short-Run Causality
Table 4.16 shows the short-run relationships. In the short-run, the ratio of private sector credit to
GDP (lagged by two periods) has a positive and statistically significant relationship with GDP at the
5% level. This supports the notion that there is a short-run causality running from financial
development to economic growth, however with a lagged impact of a two year period. Exports plus
imports (lagged by one and two year periods) and government expenditure (lagged by one and two
year periods) also exhibit a positive and statistically significant relationship with GDP at the 5% level,
respectively. This is despite the negative and statistically significant short-run relationship found for
GDP growth (lagged by a one year period) and overseas donor-aid (lagged by one and two year
periods) with growth at the 10% level, respectively.
Table 4 16 Results of the VECM for the LRGDP Model 3 – Short-Run Relationships (Equation 3.2.5 & 3.2.6)

62
Source: Author’s calculation (2015); **, * indicate statistical significance at the 5 and 10 percent levels, respectively; LPSC – log Private Sector Credit (as % of GDP); LM3 – log Liquid Liabilities (as % of GDP); LTFA - log Total Financial Assets (% of GDP); INSP – Interest Rate Spread (%); LRGDP – log Real Gross Domestic Product. Testing for Granger Non-Causality
The results on the short-run relationship are justified using the Wald test to test the coefficients of
the model 3.1 (see Appendix B) to determine if a short-run causality runs from lags (one lag and two
lags) of the independent variables to the dependent variable. The following hypotheses are tested:
Null H0: Lagged values of coefficients in each equation are zero. This means there is no short –run
causality relationship with the dependent variable or 푋 does not cause 푌 .
Alt H1: Lagged values of coefficients in each equation are not zero. This means there is a short-run
causality relationship with the dependent variable or 푋 does cause푌 .
Dependent Variables D(LRGDP) D(LM3) D(LPSC) D(LEXPIM) D(LODA) D(LGOVCONR)Independent VariablesD(LRGDP(-1)) -0.537 0.570751 0.218024 -1.562786 1.940865 0.195352
[-2.39448]** [ 0.51103] [ 0.35910] [-1.55817] [ 1.13188] [ 0.21248]D(LRGDP(-2)) -0.113762 -0.643143 0.301364 -2.06045 -1.111355 0.811412
[-0.66292] [-0.75254] [ 0.64868] [-2.68475]** [-0.84700] [ 1.15338]D(LM3(-1)) -0.004533 -0.068923 0.065847 -0.35016 -1.992034 -0.134674
[-0.05809] [-0.17733] [ 0.31166] [-1.00325] [-3.33833]** [-0.42093]D(LM3(-2)) 0.045021 -0.152775 -0.413247 -0.483126 -1.586876 -0.22783
[ 0.58731] [-0.40019] [-1.99132]* [-1.40926] [-2.70748]** [-0.72499]D(LPSC(-1)) 0.06941 -0.183945 -0.241213 0.202852 0.668685 0.231341
[ 1.05503] [-0.56143] [-1.35432] [ 0.68945] [ 1.32934] [ 0.85776]D(LPSC(-2)) 0.141958 0.006991 -0.285335 -0.32007 -0.632055 -0.039967
[ 2.43535]** [ 0.02408] [-1.80815]* [-1.22779] [-1.41816] [-0.16725]D(LEXPIM(-1)) 0.318947 -0.223167 -0.833927 0.379637 -1.392493 -0.093282
[ 3.78291]** [-0.53150] [-3.65353]** [ 1.00683] [-2.16008]** [-0.26988]D(LEXPIM(-2)) 0.177711 -0.083994 -0.432483 0.445573 0.374205 0.12854
[ 2.51825]** [-0.23900] [-2.26376]** [ 1.41183] [ 0.69353] [ 0.44432]D(LODA(-1)) -0.101821 0.21984 0.140409 -0.047249 1.466074 0.206827
[-1.87055]* [ 0.81096] [ 0.95280] [-0.19409] [ 3.52253]** [ 0.92684]D(LODA(-2)) -0.090069 0.241972 0.145315 -0.097933 0.252678 -0.063418
[-2.20566]** [ 1.18984] [ 1.31447] [-0.53625] [ 0.80928] [-0.37883]D(LGOVCONR(-1)) 0.228678 -0.726552 -0.380204 0.747415 -1.036261 -0.15501
[ 2.18789]** [-1.39582] [-1.34367] [ 1.59897] [-1.29670] [-0.36177]D(LGOVCONR(-2)) 0.180526 -0.06941 -0.119816 0.855179 0.604851 0.125971
[ 3.12708]** [-0.24143] [-0.76664] [ 3.31233]** [ 1.37030] [ 0.53228]C 0.011057 0.051072 0.095852 0.097488 0.122663 -0.014258
[ 1.11917] [ 1.03797] [ 3.58360]** [ 2.20634]** [ 1.62376] [-0.35202] R-squared 0.813203 0.444756 0.756605 0.733526 0.790593 0.556138 F-statistic 3.772954 0.694209 2.694073 2.385684 3.272005 1.085893 Log likelihood 81.38167 34.82357 52.5 37.94313 22.39057 40.46656 Akaike AIC -4.509081 -1.298178 -2.517241 -1.51332 -0.440729 -1.687349 Schwarz SC -3.754711 -0.543807 -1.762871 -0.75895 0.313641 -0.932979
Coefficients (t-statistics in parenthesis)
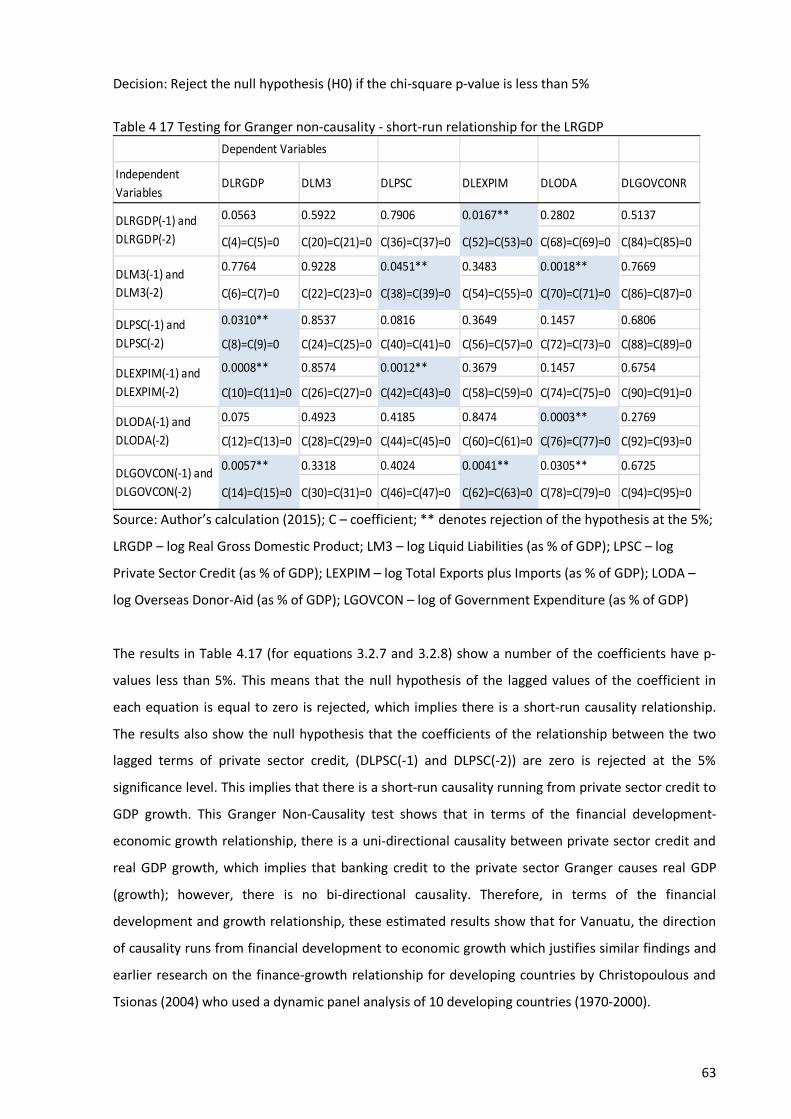
63
Decision: Reject the null hypothesis (H0) if the chi-square p-value is less than 5%
Table 4 17 Testing for Granger non-causality - short-run relationship for the LRGDP
Source: Author’s calculation (2015); C – coefficient; ** denotes rejection of the hypothesis at the 5%;
LRGDP – log Real Gross Domestic Product; LM3 – log Liquid Liabilities (as % of GDP); LPSC – log
Private Sector Credit (as % of GDP); LEXPIM – log Total Exports plus Imports (as % of GDP); LODA –
log Overseas Donor-Aid (as % of GDP); LGOVCON – log of Government Expenditure (as % of GDP)
The results in Table 4.17 (for equations 3.2.7 and 3.2.8) show a number of the coefficients have p-
values less than 5%. This means that the null hypothesis of the lagged values of the coefficient in
each equation is equal to zero is rejected, which implies there is a short-run causality relationship.
The results also show the null hypothesis that the coefficients of the relationship between the two
lagged terms of private sector credit, (DLPSC(-1) and DLPSC(-2)) are zero is rejected at the 5%
significance level. This implies that there is a short-run causality running from private sector credit to
GDP growth. This Granger Non-Causality test shows that in terms of the financial development-
economic growth relationship, there is a uni-directional causality between private sector credit and
real GDP growth, which implies that banking credit to the private sector Granger causes real GDP
(growth); however, there is no bi-directional causality. Therefore, in terms of the financial
development and growth relationship, these estimated results show that for Vanuatu, the direction
of causality runs from financial development to economic growth which justifies similar findings and
earlier research on the finance-growth relationship for developing countries by Christopoulous and
Tsionas (2004) who used a dynamic panel analysis of 10 developing countries (1970-2000).
Independent Variables
DLRGDP DLM3 DLPSC DLEXPIM DLODA DLGOVCONR
0.0563 0.5922 0.7906 0.0167** 0.2802 0.5137
C(4)=C(5)=0 C(20)=C(21)=0 C(36)=C(37)=0 C(52)=C(53)=0 C(68)=C(69)=0 C(84)=C(85)=0
0.7764 0.9228 0.0451** 0.3483 0.0018** 0.7669
C(6)=C(7)=0 C(22)=C(23)=0 C(38)=C(39)=0 C(54)=C(55)=0 C(70)=C(71)=0 C(86)=C(87)=0
0.0310** 0.8537 0.0816 0.3649 0.1457 0.6806
C(8)=C(9)=0 C(24)=C(25)=0 C(40)=C(41)=0 C(56)=C(57)=0 C(72)=C(73)=0 C(88)=C(89)=0
0.0008** 0.8574 0.0012** 0.3679 0.1457 0.6754
C(10)=C(11)=0 C(26)=C(27)=0 C(42)=C(43)=0 C(58)=C(59)=0 C(74)=C(75)=0 C(90)=C(91)=0
0.075 0.4923 0.4185 0.8474 0.0003** 0.2769
C(12)=C(13)=0 C(28)=C(29)=0 C(44)=C(45)=0 C(60)=C(61)=0 C(76)=C(77)=0 C(92)=C(93)=0
0.0057** 0.3318 0.4024 0.0041** 0.0305** 0.6725
C(14)=C(15)=0 C(30)=C(31)=0 C(46)=C(47)=0 C(62)=C(63)=0 C(78)=C(79)=0 C(94)=C(95)=0DLGOVCON(-1) and DLGOVCON(-2)
Dependent Variables
DLRGDP(-1) and DLRGDP(-2)
DLM3(-1) and DLM3(-2)
DLPSC(-1) and DLPSC(-2)
DLEXPIM(-1) and DLEXPIM(-2)
DLODA(-1) and DLODA(-2)

64
Aside from the role of financial development, the hypothesis that there is no short-run causality
running from the lags of total exports plus imports and government expenditure to GDP is also
rejected at the 5% significance level. This means that trade openness and government expenditure
also cause Vanuatu’s economic growth in the short-run (and exports plus imports cause real GDP, a
bi-directional causality between the two variables). On the other hand, the (Wald) causality test
continues to show that there are six other short-run causality running from the lag (two lags) of the
independent variables to dependent variables. The short-run causality runs as follows: liquid
liabilities Granger causes private sector credit; exports plus imports (trade openness) Granger cause
private sector credit; real GDP Granger causes exports plus imports (trade openness); Government
expenditure Granger causes exports plus imports (trade openness); liquid liabilities Granger causes
overseas donor aid; and the lag of overseas donor aid Granger causes overseas donor aid in the
current period.
4.2.4..2 Long-Run Causality
Table 4.18 summarises the results of the long-run relationships. The error correction coefficients
(ECT) indicate the adjustment to the long run as well as long run causality are expected to be
negative and significant coefficients. The results show that in cointegration equation (1), private
sector credit to GDP including overseas aid is negative and statistically significant at the 5% level,
respectively. This means that the adjustment to the long run is taking place in these models. This is
contrary to ratio liquid liabilities and government expenditure models which have the correct sign
but are statistically insignificant. In the third cointegration equation, only private sector credit is
negative and statistically significant at the 5% level, which implies that adjustment to the long-run is
taking place for model 3.1 (see Appendix B).
Table 4 18 Results of the VECM (model 3.1) for the LRGDP Model – Long-Run Relationships (Equation 3.2.5 & 3.2.6)
Source: Author’s calculation (2015); ** and * indicate statistical significance at the 5 and 10 percent levels, respectively; LPSC – log Private Sector Credit (as % of GDP); LM3 – log Liquid Liabilities (as % of GDP); LTFA - log Total Financial Assets (% of GDP); INSP – Interest Rate Spread (%); LRGDP – log Real Gross Domestic Product.
Dependent Variables D(LRGDP) D(LM3) D(LPSC) D(LEXPIM) D(LODA) D(LGOVCONR)Independent VariablesCointEq1 0.408758 -1.329281 -1.527652 1.251419 -4.336116 -0.058336
[ 2.06529]* [-1.34863] [-2.85114]** [ 1.41383] [-2.86540]** [-0.07190]CointEq2 0.266797 -0.133065 0.164357 1.539752 2.452886 0.001277
[ 3.52941]** [-0.35347] [ 0.80313] [ 4.55461]** [ 4.24392]** [ 0.00412]CointEq3 -0.01397 0.08516 -0.383133 -0.115161 0.674019 -0.0733
[-0.29250] [ 0.35803] [-2.96310]** [-0.53914] [ 1.84570]* [-0.37436]
Coefficients (t-statistics in parenthesis)

65
The VECM model justifies the findings given above on the positive and statistically significant impact
of financial intermediation (represented by banking credit to the private sector, although lagged by a
two year period) on economic growth (Table 4.18) despite there being no evidence shown for the
other indicator of financial development [ratio of liquid liabilities to GDP (represents financial
deepening)]. On the other hand, ratio of liquid liabilities (financial deepening), exports plus imports
(trade openness and overseas aid have a positive long-run equilibrium relationship with growth. The
results from model 3.1 (see Appendix B) also show that although private sector credit has a negative
long-run equilibrium relationship with growth, adjustments to the long run take place in this model.
4.3 Contribution of major financial sector development reforms to major economic sectors of Vanuatu’s economy
4.3.1 Regression Results
To investigate the impact of financial development on growth on major economic sectors and show
the impact of the Comprehensive Reform Program implemented in 1997, a number of models using
the similar form of 3.2.2a and 3.2.2b are regressed using a set of dependent variables indicative of
productivity growth (GDP and GDP per capital growth), capital accumulation and investment (Gross
Fixed Capital Formation) and sector growth (Agriculture, Industry and Services).
Table 4 19 Johansen Cointegration Procedure Results (Models 4.1- 4.6) Johansen cointegration procedure for
Equation 3.2.2a and 3.2.2b Null hypothesis
Existence of cointegration
Model 4.1 LRGDP LM3, INFL, LEXPIM, LODA, LGOVCON, LFDI, LHEAL, LEDUC
r≤8* √ r≥8
Model 4.2 LRGDPPC LM3, INFL, LEXPIM, LODA, LGOVCON, LFDI, LHEAL, LEDUC
r≤8* √ r≥8
Model 4.3 LGFCF LM3, INFL, LEXPIM, LODA, LGOVCON, LFDI, LHEAL, LEDUC
r≤7* √ r≥7
Model 4.4 LAGRIC LM3, INFL, LEXPIM, LODA, LGOVCON, LFDI, LHEAL, LEDUC
r≤7* √ r≥7
Model 4.5 LINDUS LM3, INFL, LEXPIM, LODA, LGOVCON, LFDI, LHEAL, LEDUC
r≤7* √ r≥7
Model 4.6 LSERV LM3, INFL, LEXPIM, LODA, LGOVCON, LFDI, LHEAL, LEDUC
r≤7* √ r≥7
Source: Author’s calculation; *denotes rejection of the null hypothesis at the 5% level (see Appendix B for model specification)
The Johansen procedure results in Table 4.19 for the growth models 1-6, using liquid liabilities as the
only financial development explanatory variable, show that there are seven or more long-run
relationships between all the selected variables with the dependent variables.
Table 4 20Regression Results of Growth Model using Liquid Liabilities as the Independent Variable from 1983-2013 (Equations 3.2.2a and 3.2.2b)
Dependent Variables

66
LRGDP LRGDPPC LGFCF LAGRIC LINDUS LSERV (Model4.1) (Model4.2) (Model4.3) (Model4.4) (Model4.5) (Model4.6) C 3.09*** 9.05*** -8.41*** 2.38*** -8.26*** 1.88* LM3 0.09*** -0.09*** -0.17*** 0.20*** INFL 0.01* EXPIM 0.25*** 0.12* 0.88*** 0.33*** 0.19*** LODA -0.11* -0.11** LGOVCON 0.11** 0.20*** 0.48*** 0.72*** 0.18*** LFDI 0.12* 0.07* -0.02* LHEAL 0.34** 0.36* 0.35* LEDUC 0.30*** 0.21*** CP3 -0.03* -0.04* -0.05** CP4 -0.06*** -0.08*** -0.09** -0.08*** N 32 32 32 31 31 31 R-Squared 0.991 0.611 0.949 0.913 0.853 0.991 Source: Author’s calculations (2015); ***, **, *, indicate statistical significance at the 1, 5, and 10 percent levels, respectively; LRGDP – log Real Gross Domestic Product; LRGDPPC- log Real Gross Domestic Product per capita; LGFCF – log of Gross Fixed Capital Formation (as % of GDP); LAGRIC – log of Agriculture sector; LINDUS – log of Industry sector; LSERV – log of services sector; LM3 – log Liquid Liabilities (as % of GDP) (see Appendix A for description of control variables) The regression results of models 4.1-4.6 for equations 3.2.2a and 3.2.2b for the period 1983 - 2013
based on the ratio of liquid liabilities as a measure of financial development show that financial
deepening has a positive relationship with growth in the service sector and overall growth (despite a
negative relationship with growth in the agriculture sector and economic development) at the 1%
significance level (see Table 4.20). This could mean that policies on financial deepening implemented
in the study period (1983-2013) may not have directly focused on the growth in the agriculture
sector, and are also related to the slow pace in financial development during the period. However,
despite minimal impact shown by financial development indicators, trade openness shows a positive
and significant relationship with capital investment, growth in the service sector and industry sector
and overall growth and economic development at the 1% significance level. Human capital
accumulation also has a positive and significant relationship with growth at the 1% significance level.
However, the results show a negative impact of the occurrence of cyclones (four cyclones) on growth
in the agriculture and services sectors at a 1% significance level. Therefore, it negatively affected
growth.
Table 4 21 Regression Results of the Growth Model using Liquid Liabilities as the Independent Variable from 1983-1996 (Equations 3.2.2a and 3.2.2b)
Dependent Variables LRGDP LRGDPPC LGFCF LAGRIC LINDUS LSERV (Model4.1) (Model4.2) (Model4.3) (Model4.4) (Model4.5) (Model4.6) C 6.93*** 10.49*** -16.37*** 7.01*** 4.0*** 1.59 LM3 0.22*** 0.07* 0.31*** 0.19**

67
INFL 0.01* 0.01** LEXPIM 0.16*** 0.22** 0.67** 0.52*** 0.17** LODA -0.22*** -0.52*** LGOVCON 0.91*** 0.38** 0.22* LFDI -0.04* 0.50** LHEAL -0.59* 1.51* -2.46*** 3.2*** LEDUC -0.80** CP1 0.09* 0.05** -0.04* CP3 0.13** -0.06** CP4 -0.05** -0.07** -0.07** 0.12* -0.10*** N 15 14 14 14 14 14 R-Squared 0.971 0.803 0.946 0.985 0.891 0.987 Source: Author’s calculations (2015); ***, **, *, indicate statistical significance at the 1, 5, and 10 percent levels, respectively; LRGDP – log Real Gross Domestic Product; LRGDPPC- log Real Gross Domestic Product per capita; LGFCF – log of Gross Fixed Capital Formation (as % of GDP); LAGRIC – log of Agriculture sector; LINDUS – log of Industry sector; LSERV – log of services sector; LM3 – log Liquid Liabilities (as % of GDP); (See Appendix A for description of control variables)
Before the implementation of the Comprehensive Reform Program in 1997, the regression results of
models 4.1-4.6 for equations 3.2.2a and 3.2.2b for the period 1983-1996 show that financial
deepening has a positive and significant relationship with growth in the agriculture (1% significance
level) and service sectors (5% significance level), overall growth (1% significance level) and economic
development (10% significance level) (see Table 4.21). Following independence, the support of
financial development was important for the economy. Trade openness and government expenditure
show positive and significant relationships with capital investment (at the 5% significance level),
growth in the services sector (at the 5% significance level), industry sector (at the significance 5%
level) and overall growth and economic development. The regression results showed mixed results
on the impact of human capital investment on the major sectors of the economy; however, the
negative relationships may mean that these indicators are not important during the early stages of
economic growth in the country, and there could be other factors that influence growth. The
occurrence of cyclones has a negative impact on the economy; specifically on the growth in the
service sector while the occurrence of four cyclones during the year has a tremendous negative
impact on all sectors of the economy which is detrimental for economic growth and development.
Table 4 22 Regression Results of the Growth Model using Liquid Liabilities as the Independent Variable from 1997-2013 (Equations 3.2.2a and 3.2.2b)
Dependent Variable LRGDP LRGDPPC LGFCF LAGRIC LINDUS LSERV (Model4.1) (Model4.2) (Model4.3) (Model4.4) (Model4.5) (Model4.6) C 4.79*** 11.69*** 11.01* 4.76*** -7.96*** 5.581*** LM3 -0.49*** -0.97** 0.34*** INFL LEXPIM 0.26*** 0.20*** 1.07*** LODA 0.22***

68
LGOVCON 0.12*** 0.13** 0.96*** 0.71*** 0.17*** LFDI -0.23* -0.23*** LHEAL 0.55*** 0.29* -1.8* 0.92*** 0.48*** LEDUC -0.64*** CP1 0.02** N 17 17 17 17 17 17 R-Squared 0.993 0.908 0.957 0.922 0.777 0.993 Source: Author’s calculations (2015); ***, **, *, indicate statistical significance at the 1, 5, and 10 percent levels, respectively; LRGDP – log Real Gross Domestic Product; LRGDPPC- log Real Gross Domestic Product per capita; LGFCF – log of Gross Fixed Capital Formation (as % of GDP); LAGRIC – log of Agriculture sector; LINDUS – log of Industry sector; LSERV – log of services sector; LM3 – log Liquid Liabilities (as % of GDP); (See Appendix A for description of control variables) Following the implementation of the Comprehensive Reform Program, the regression results of
models 4.1-4.6 for equations 3.2.2a and 3.2.2b for the period 1997-2013 show that financial
deepening has a positive and significant relationship with growth in the agriculture sector at the 1%
significance level but a negative relationship with capital investment and economic development (see
Table4.22). Its impact on other sectors was insignificant, which means that there are factors that
supported growth post-CRP implementation. The results also show trade openness and government
expenditure are important for capital investment, with government expenditure showing a greater
role in that period. A positive impact of the post-CRP implementation is that government
expenditure became important for growth in the industry and service sectors, economic
development and overall growth, as a result of the implemented policies that focused on
improvement in the operation of certain government departments. Aid was also important for
growth in the service sector. As in the previous period, the results further show mixed results on the
impact of human capital investment on the major sectors of the economy. The health coefficient is
positively related to economic development and growth. However, there remains the possibility that
there are other factors that have greater influence on growth.
Table 4 23 Johansen Cointegration Procedure Results (Models 5.1 – 5.6) Johansen Cointegration Procedure for
Equations 3.2.2a and 3.2.2b Null hypothesis
Existence of cointegration
Model 5.1 LRGDP LPSC, INFL, LEXPIM, LODA, LGOVCON, LFDI, LHEAL, LEDUC
r≤7* √ r≥7
Model 5.2 LRGDPPC LPSC, INFL, LEXPIM, LODA, LGOVCON, LFDI, LHEAL, LEDUC
r≤7* √ r≥7
Model 5.3 LGFCF LPSC, INFL, LEXPIM, LODA, LGOVCON, LFDI, LHEAL, LEDUC
r≤7* √ r≥7
Model 5.4 LAGRIC LPSC, INFL, LEXPIM, LODA, LGOVCON, LFDI, LHEAL, LEDUC
r≤7* √ r≥7
Model 5.5 LINDUS LPSC, INFL, LEXPIM, LODA, LGOVCON, LFDI, LHEAL, LEDUC
r≤6* √ r≥6
Model 5.6 LSERV LPSC, INFL, LEXPIM, LODA, LGOVCON, LFDI, LHEAL, LEDUC
r≤7* √ r≥7
Source: Author’s calculations (2015); *denotes rejection of the null hypothesis at the 5% level

69
(see Appendix B for model specification)
The Johansen procedure results in Table 4.23 for the growth models 5.1-5.6 using private sector
credit as the only financial development explanatory variable, show that there are seven or more
long-run relationships between all the selected variables with the dependent variables.
Table 4 24Regression Results of the Growth Model using Private Sector Credit as the Independent Variable from 1983-2013 (Equations 3.2.2a and 3.2.2b)
Dependent Variables LRGDP LRGDPPC LGFCF LAGRIC LINDUS LSERV (Model5.1) (Model5.2) (Model5.3) (Model5.4) (Model5.5) (Model5.6) C 2.25* 9.07*** -8.41*** 1.18 -6.0*** -0.44 LPSC 0.08* -0.16*** -1.20*** INFL LEXPIM 0.18*** 0.23*** 0.88*** 0.49*** LODA -0.11** 0.27*** LGOVCON 0.19*** 0.09* 0.48*** 0.79*** 0.22*** LFDI -0.06*** -0.26*** LHEAL 0.47** 0.91*** LEDUC 0.34*** 0.87*** -0.78** 0.31** CP3 -0.04* -0.05* CP4 -0.06** -0.08*** -0.09** -0.08** N 32 32 32 31 31 31 R-Squared 0.985 0.630 0.950 0.927 0.843 0.981 Source: Author’s calculations (2015); ***, **, *, indicate statistical significance at the 1, 5, and 10 percent levels, respectively; LRGDP – log Real Gross Domestic Product; LRGDPPC- log Real Gross Domestic Product per capita; LGFCF – log of Gross Fixed Capital Formation (as % of GDP); LAGRC – log of Agriculture sector; LINDUS – log of Industry sector; LSERV – log of services sector; LM3 – log Liquid Liabilities (as % of GDP) (see Appendix A for description of control variables)
The regression results of models 5.1- 5.6 for equations 3.2.2a and 3.2.2b for the period 1983-2013
show that credit allocation through bank credit to the private sector has a positive and significant
relationship with overall economic growth at the10% significance level (despite a negative
relationship for the growth in the agriculture sector and economic development) (see Table 4.24).
This means a smaller portion of credit was extended to the agriculture sector compared to other
sectors. However, despite minimal impact shown by the financial development indicators, trade
openness and government expenditure show positive and significant relationships with capital
investment, growth in the service sector, industry sector, overall growth and economic development,
at the 1% significance level, respectively. Human capital accumulation is also important for growth
and development. However, the results show a negative impact of the cyclone (specifically the
occurrence of three to four cyclones in a year) on growth in the agriculture and service sectors, thus
overall economic growth and development.

70
Table 4 25 Regression Results of the Growth Model using Private Sector Credit as the Independent Variable from 1983-1996 (Equations 3.2.2a and 3.2.2b)
Dependent Variables LRGDP LRGDPPC LGFCF LAGRIC LINDUS LSERV (Model5.1) (Model5.2) (Model5.3) (Model5.4) (Model5.5) (Model5.6) C 2.56** 11.2*** -8.59* 5.84*** 4.00*** -4.62*** LPSC 0.41* 0.21** INFL 0.02** 0.007* LEXPIM 0.24** 0.13** 0.53** 0.52*** 0.14* LODA -0.21*** -0.10*** LGOVCON 0.25*** 0.54** 0.59*** LFDI -0.03* LHEAL -1.52*** 3.21*** CP1 0.04* CP3 0.13** -0.07*** CP4 -0.07* -0.04* -0.07* 0.12* -0.10*** N 15 15 14 14 14 14 R-Squared 0.893 0.557 0.933 0.935 0.891 0.966 Source: Author’s calculations (2015); ***, **, *, indicate statistical significance at the 1, 5, and 10 percent levels, respectively; LRGDP – log Real Gross Domestic Product; LRGDPPC- log Real Gross Domestic Product per capita; LGFCF – log of Gross Fixed Capital Formation (as % of GDP); LAGRC – log of Agriculture sector; LINDUS – log of Industry sector; LSERV – log of services sector; LM3 – log Liquid Liabilities (as % of GDP) (see Appendix A for description of control variables)
Before the implementation of the Comprehensive Reform Program in 1997, the regression results of
models 5.1- 5.6 for equations 3.2.2a and 3.2.2b for the period 1983-1996 show that bank credit to
the private sector has a positive and significant relationship with capital investment (at the 10%
significance level) and growth in the agriculture sector (at the 5% significance level), despite its
insignificant influence on overall economic growth and development (see Table 4.25). Trade
openness and government expenditure show positive and significant relationships with capital
investment, growth in the service sector and overall growth; while trade openness is important for
growth in the agriculture sector. The results show mixed results on the impact of human capital
investment on the major sectors of the economy; however, the negative relationships imply these
indicators are not important during the early stages of economic growth in the country, and there
could be other factors that influence growth. The occurrence of cyclones has a negative impact on
the economy; specifically on the growth of the agriculture and service sectors with the occurrence of
three to four cyclones occurring in the year. This has a negative impact on economic growth and
development.
Table 4 26 Regression Results of the Growth Model using Private Sector Credit as the Independent Variable from 1997-2013 (Equations 3.2.2a and 3.2.2b)
Dependent Variables
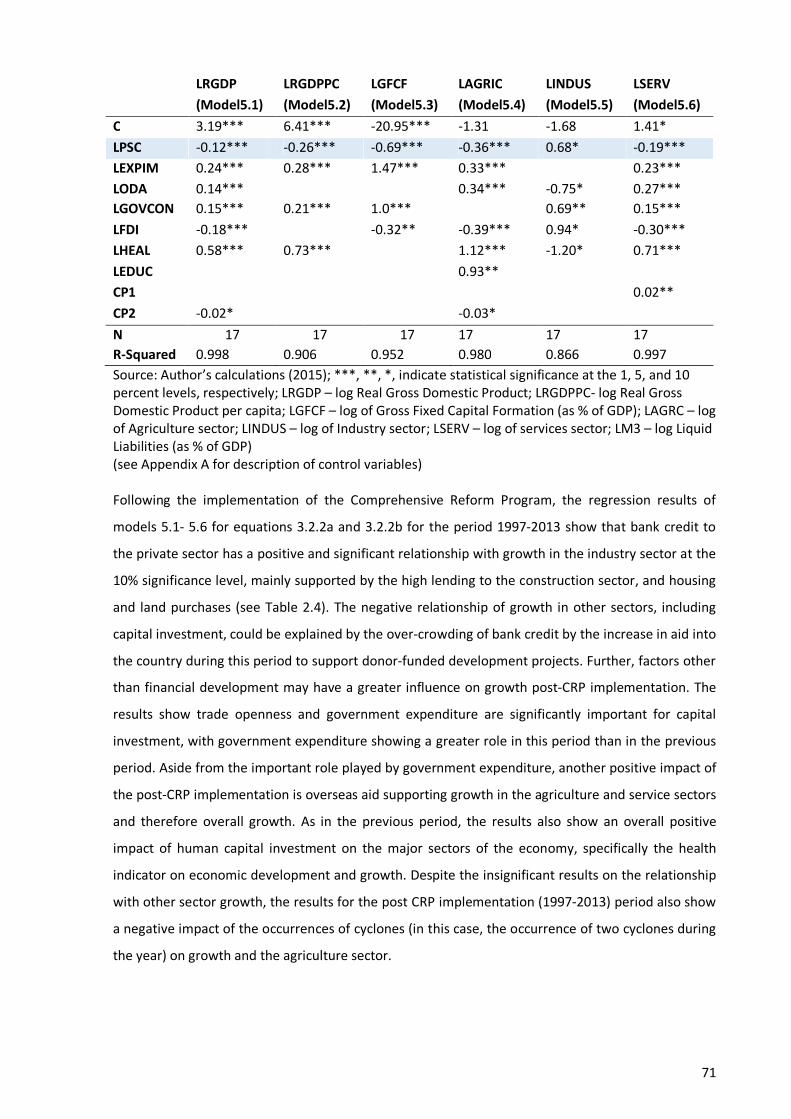
71
LRGDP LRGDPPC LGFCF LAGRIC LINDUS LSERV (Model5.1) (Model5.2) (Model5.3) (Model5.4) (Model5.5) (Model5.6) C 3.19*** 6.41*** -20.95*** -1.31 -1.68 1.41* LPSC -0.12*** -0.26*** -0.69*** -0.36*** 0.68* -0.19*** LEXPIM 0.24*** 0.28*** 1.47*** 0.33*** 0.23*** LODA 0.14*** 0.34*** -0.75* 0.27*** LGOVCON 0.15*** 0.21*** 1.0*** 0.69** 0.15*** LFDI -0.18*** -0.32** -0.39*** 0.94* -0.30*** LHEAL 0.58*** 0.73*** 1.12*** -1.20* 0.71*** LEDUC 0.93** CP1 0.02** CP2 -0.02* -0.03* N 17 17 17 17 17 17 R-Squared 0.998 0.906 0.952 0.980 0.866 0.997 Source: Author’s calculations (2015); ***, **, *, indicate statistical significance at the 1, 5, and 10 percent levels, respectively; LRGDP – log Real Gross Domestic Product; LRGDPPC- log Real Gross Domestic Product per capita; LGFCF – log of Gross Fixed Capital Formation (as % of GDP); LAGRC – log of Agriculture sector; LINDUS – log of Industry sector; LSERV – log of services sector; LM3 – log Liquid Liabilities (as % of GDP) (see Appendix A for description of control variables) Following the implementation of the Comprehensive Reform Program, the regression results of
models 5.1- 5.6 for equations 3.2.2a and 3.2.2b for the period 1997-2013 show that bank credit to
the private sector has a positive and significant relationship with growth in the industry sector at the
10% significance level, mainly supported by the high lending to the construction sector, and housing
and land purchases (see Table 2.4). The negative relationship of growth in other sectors, including
capital investment, could be explained by the over-crowding of bank credit by the increase in aid into
the country during this period to support donor-funded development projects. Further, factors other
than financial development may have a greater influence on growth post-CRP implementation. The
results show trade openness and government expenditure are significantly important for capital
investment, with government expenditure showing a greater role in this period than in the previous
period. Aside from the important role played by government expenditure, another positive impact of
the post-CRP implementation is overseas aid supporting growth in the agriculture and service sectors
and therefore overall growth. As in the previous period, the results also show an overall positive
impact of human capital investment on the major sectors of the economy, specifically the health
indicator on economic development and growth. Despite the insignificant results on the relationship
with other sector growth, the results for the post CRP implementation (1997-2013) period also show
a negative impact of the occurrences of cyclones (in this case, the occurrence of two cyclones during
the year) on growth and the agriculture sector.

72
Chapter 5
Discussion and Conclusion
This study provided evidence on financial intermediation and financial deepening in Vanuatu’s
economy, and evidently the size of the banking sector that has grown over the last 32 years from
1982-2013. The trend in private sector credit, liquid liabilities and total financial assets of the banking
system of Vanuatu has increased tremendously in the period leading up to 2013. This implies that
financial development (through commercial banking) has a positive impact on economic growth
which supports similar findings by King and Levine (1993a, 1993b), and Levine et al. (2000). However,
banking inefficiency related to evidence of high interest rate spreads (during the 32-year period) as a
result of high borrowing rates over the deposit rates of banks, may have been detrimental for
growth. This confirms similar findings by Abubakar and Gani (2013) who investigated the banking
sector reforms in the real sector in Nigeria over a 30 year period. However, our study may have less
scope to identify whether this inefficiency (higher interest rate spread means high borrowing rates)
could potentially limit the number of loanable funds into the productive sectors or whether the high
inefficiencies are a matter of policy issue or high bank regulations. Thus, further study could be
carried out to clarify the determinants of banking inefficiencies in Vanuatu and generally for the
small Pacific Island Countries.
Our study shows a positive and significant relationship between financial development and economic
growth, however lagged by a two year period. We can conclude that private sector credit (lagged by
two years) has a positive and significant relationship with growth at the 1% significance level; the
positive and significance relationship between liquid liabilities (lagged by two years) and growth at
the 1% significance level; the positive and significant relationship between total financial assets of
the banking system (lagged by two years) and growth at the 5% significance level (despite a negative
relationship noted for the current period); and the negative and significant relationship between
interest rate spread as an indicator of bank inefficiencies (both current and lagged impact) and
growth at the5% significance level. These results imply that financial development is important for
Vanuatu’s economic growth and the lagged positive and significant relationship with growth is
evident. The lagged impact of financial development on growth relates to the general perspective of
developing countries with a slower pace of financial development compared to developed countries,
and related to the high over-head cost of commercial banks’ operations and low competition
amongst banks (Deidda & Fattouh, 2002). The lagged impact is also explained by the weak monetary
policy transmission mechanism found in the small Pacific Island Countries, including Vanuatu, which
have underdeveloped money-markets (Dunn, Davies, Yan, Wu, & Wang, 2011). Jayaraman and

73
Choong (2012)also conclude that in these underdeveloped money markets, monetary aggregate is
more important than short-term interest rate as a channel in transmitting impulses from the
monetary sector to the real sector. Aside from the impact of financial development alone, our study
identified that other control variables also play an important role in Vanuatu’s economic growth.
These factors include capital accumulation and investment, trade openness, overseas donor aid into
the country and human capital accumulation. Likewise, it justifies the negative impact of natural
disasters, in the case of tropical cyclones, and the detrimental effect of increased inflation on
economic growth.
For further justification of the positive impact of finance on growth, our study shows the existence of
short-run and long-run causality between the financial development and economic growth for
Vanuatu. The results show that short-run causality runs from financial development to growth with
positive and significant causality running from private sector credit (lagged by two years) to growth
at the 5% level. The Wald coefficient tests show that in terms of the financial development and
economic growth relationship, there is a uni-directional causality between private sector credit and
real GDP growth, but there is no bi-directional causality. This means that for Vanuatu, the direction
of causality runs from financial development to economic growth and justifies similar findings on
developing countries by Christopoulous and Tsionas (2004). It follows the ‘supply-side’ view of the
finance-growth relationship identified by Robinson (1952) that financial development has a positive
effect on growth.
On the other hand, the Johansen cointegration test results provide evidence of long-run equilibrium
relationships between financial development, growth and the selected set of control variables. The
increase in the ratio of liquid liabilities to GDP leads to an increase in growth in the long-run. On the
other hand, the error-correction coefficient shows the ratio of private sector credit to GDP has a
negative and statistically significant relationship with GDP growth in the long-run and is the only
financial development variable (including overseas donor-aid) that exhibits the expected negative
and statistically significant relationship with growth at the 5% significance level. This means a shock
to the short-run equilibrium is adjusted to the long-run, so therefore adjustments to the long-run are
taking place. These findings mean that financial development has a short-run and long-run impact on
growth (although differentiated by different indicators), thereby supporting the importance of
financial development in the formulation of policies that support a sustainable growth.
The impact of the implementation of the Comprehensive Reform Program (CRP) in mid-1997 was
expected to focus on renewing the institutions of governance, redefining the role of the public
sector, improving public sector efficiency and encouraging the private sector to lead growth and
improve social equity. The findings from our study show that before the implementation of the CRP
(1982-1997), bank credit to the private sector had a positive and significant relationship with capital

74
investment and growth in the agriculture sector, despite having an insignificant influence on the
overall economic growth and economic development. This implies that bank credit was important for
business-financing following the country’s independence in 1980 and its important role in supporting
the agriculture sector as one of the main productive sector of the economy. However, the high
volatility in growth during that period was caused by high inflationary pressures, a high trade deficit,
and a high number of tropical cyclones. The results show the impact of financial development on
growth after the implementation of the CRP confirms some of the findings by Gay (2004) that the
CRP reform had little effect on growth. The impact of the increase in the ratio of liquid liabilities to
GDP has a negative and significant relationship with real GDP per capita growth and capital
investment. This implies that the CRP implementation may not have delivered its proposed objective
in supporting the private sector growth. The impact of the increase in private sector credit (as a per
cent of GDP) has a negative and significant relationship with all the growth variables, including
capital investment and growth in the agriculture and service sectors (at the 1% significance level,
respectively). The negative impact confirms similar findings by Gay (2004) that the CRP did not cover
grants or loans to fund the productive sectors in order to boost export-oriented outputs and the lack
of finance constraints by local ni-Vanuatu entrepreneurs to access credit, and this was partly due to
the lack of historical borrowing records.
This current study findings along with other literatures show some important characteristics about
future economic and financial reforms for small developing island countries like Vanuatu. First, the
challenge in putting forward the right reform policy is important in order to meet its objectives and
ensure its impacts are transmitted to the sectors of the economy and to avoid systematic crises that
could be detrimental for both financial development and economic growth. These reforms should
support and develop a well-functioning financial system, securing its financial soundness that
supports raising savings and investment levels, increases growth and improves macroeconomic
stability. Second, a detailed understanding of the background and development issues of Vanuatu
provides the opportunity to shape reform policies for future sustainable growth and prospects that
can be related to other small Pacific Island Countries with similar characteristics and challenges. The
dispersion of the population and income inequality make the capital Port Vila the main centre where
all the foreign-aid ends up. The average 30 percent of the total population who live in towns
accounts for a vast majority of the cash economy while the rest of the population lives in a
subsistence lifestyle in the outer islands. Aside from this, the instability of exports and Vanuatu’s
vulnerability to earthquakes and tropical cyclones contribute to the volatility of the country’s
economic output and as a result, credit creation in the economy may not increase quickly and the
country is faced with periods of major inflationary pressures. Although there is evidence of financial
development having a positive impact on Vanuatu’s economic growth, the lagged impact could be
associated with these existing challenges faced by small Pacific Island Countries like Vanuatu. These

75
difficulties include a weak and fragmented production base, high commodity volatility and a narrow
range of exports. Financial development in small Pacific island Countries is also subject to problems
such as lack of competition that result in high prices, high transport costs and high prices for key
services (Winters and Martin (2004); Duncan et al. (1999)).
This study leads the way forward for further studies in this area. A vigorous research on the financial
development and growth relationship using 32 annual data time-series specifically from the
commercial banking sector (formal financial intermediaries) for Vanuatu could be enhanced if a
longer time-span data is used. Subject to data availability, this research could include a high
frequency data such as quarterly level time-series analysis (the current study is limited to annual
level data availability), and considering other aspects of financial development such as micro-credit
financing, offshore banking operations and other financial institutions to assess their impact on the
overall banking system and growth. Furthermore, a qualitative (demand-side) survey can be carried
out as a follow-up to this study to identify the transmission mechanism of financial development into
the real sector.
In conclusion, the findings of this research show that there is a positive and significant relationship
between the indicators of financial development and economic growth, however lagged by a two
year period. This means that the transmission mechanism to the real sector could be slow and
minimal. The lagged impact could be related to the fact that Vanuatu, like other small Pacific Island
Countries has an underdeveloped money market, no secondary market and its financial system may
have a weak monetary policy transmission mechanism. The study findings also show that there is a
short run causality running from financial intermediation to economic growth, which means
Vanuatu’s financial sector follows a supply-view where financial intermediation causes economic
growth; thus the importance of bank credit to the private sector for the development of enterprises
is important. There is a long-run causality between financial deepening to economic growth, and
shocks to private sector credit in the short run that will adjust towards its long-run equilibrium.
Finally, the study findings show the reform policies implemented by the Comprehensive Reform
Program in 1997 have had little impact on overall economic growth and major economic sector
growth post-1998. The literature suggests that this weak impact is primarily due to contracting policy
objectives that do not meet the aims of the reform, apart from other challenges that discourage
growth. Therefore, reform policies should be implemented with a careful understanding of the
financial system and the real sector, and the need to consider and address the challenges faced by
small Pacific Island Countries like Vanuatu.

76
Appendix
Appendix A Data Variables
A.1 Variables description
Variable Description Indicator of… LRGDP Log of Real Gross Domestic Product – Total value of
goods and services produced in the economy Economic Growth
LRGDPPC Log of Real Gross Domestic Product per capita – Total value of goods and services produced in the economy divided by population
Economic Development
LPSC Log of private sector credit (as a percentage of Real GDP) by the commercial banks – Financial resources provided to the private sector by domestic money banks as share of GDP
Credit allocation by the commercial banks
LM3 Log of liquid liabilities (as a percentage of Real GDP) by the commercial banks (M3) – The sum of currency and deposits in the central bank (M0), plus transferable deposits and electronic currency (M1), plus time and savings deposits, foreign currency transferable deposits, certificates of deposit, and securities repurchase agreements (M2), plus travellers cheques, foreign currency time deposits, commercial paper, and shares of mutual funds or market funds held by residents.
Financial deepening
LTFA Log of total financial assets of the banking system – total assets of the domestic banking system
Size of the commercial banking system
INSP Interest Rate Spread (%) → lending rate minus deposit rate (%)
Efficiency of the banking system
LGFCF Log of Gross Fixed Capital Formation Capital accumulation and Investment
LEXPIM Total Exports plus Total Imports → total exports plus imports
Trade Openness
LINFL Inflation rate (%) Macroeconomic stability LODA Log of Overseas Development Assistance into the country Aid for development LGOVCON Log of Government Consumption Expenditure Project financing LFDI Log of Foreign Direct Investment into Vanuatu Project financing LHEAL Log of number of years of life expectancy Human capital
investment LEDUC Log of Gross of secondary school enrolment Human capital
investment LEDUC1 Log of Gross of primary school enrolment Human capital
investment CP1 Dummy Variable: 1 indicate occurrence of one cyclone in
a year, 0 meaning none Impact of natural disaster
CP2 Dummy Variable: 1 indicate occurrence of two cyclones in a year, 0 meaning none
Impact of natural disaster
CP3 Dummy Variable: 1 indicate occurrence of three cyclones in a year, 0 meaning none
Impact of natural disaster


80
References
Abubakar, A., & Gani, I. M. (2013). Impact of banking sector development on economic growth: Another look at the evidence from Nigeria. Blue Ocean Research Journals, 2(4).
Acemoglu, D., Aghion, P., & Zilibotti, F. (2003). Distance to frontier, selection, and economic growth. National Bureau of Economic Growth, Working Paper No. 9066.
ADB. (2001). Financial sector development in the Pacific developing member countries. 1(The Regional Report).
ADB. (2002). Vanuatu - Economic performance and challenges ahead. Manila, Philippines: Asian Development Bank.
ADB. (2015). Measuring Financial Development. Retrieved 22/05/2015, 2015,from http://www.adbi.org/working-paper/2011/04/08/4504.financial.dev.emerging.markets.india/measuring.financial.development/.
Aghion, P., Howitt, P., & Mayer-Foulkes, D. (2005). The effect of financial development on convergence theory and evidence.
Agri-Trade. (2011). Pacific: Agricultural trade policy debates and developments. Retrieved from http://agritrade.cta.int/Agriculture/Topics/EPAs/Pacific-Agricultural-trade-policy-debates-and-developments.
Al-Yousif, Y. K. (2002). Financial development and economic growth - Another look at the evidence from developing countries. Review of Financial Economics, 11, 131-150.
Aryeetey, E., & Gockel, F. (1991). Mobilizing domestic resource for capital formation in Ghana: The role of informal financial sectors. AERC, Research Paper 3.
Asteriou, D. (2006). Applied econometrics: a modern approach to using EViews and Microfit. New York: Palgrave macmillan.
Banerjee, A. V., & Newman, A. F. (1993). Occupational choice and the process of development. Journal of Political Economy, 101(2).
Barajas, A., Beck, T., Dabla-Norris, E., & Yousefi, S. R. (2013). Too cold, too hot, or just right? Assessing Financial Sector Development across the Globe. IMF Working Paper, WP/13/81.
Beck, T., Demirguc-Kunt, A., & Levine, R. (2004). Finance, Inequality, and Poverty: Cross-Country Evidence. National Bureau of Economic Research, NBER Working Paper No. 10979.
Beck, T., & Levine, R. (2001). Stock markets, banks, and growth: Panel evidence. Bencivenga, V. R., & Smith, B. D. (1991). Financial intermediation and endogeneous growth. Review
of Economic Studies. Benhabib, J., & Spiegel, M. M. (2000). The role of financial development in growth and investment.
Journal of Economic Growth, 5, 341-360. Berthelemy, J. C., & Varoudakis, A. (1996). Financial development, policy and economic growth.
Financial development and economic growth: Theory and experiences from developing countries, London: Routledge, 53-66.
Boyd, J. H., & Prescott, E. C. (1986). Financial intermediary-coalitions. Journal of Economics Theory 38, 211-232.
Campos, N., & Kinoshita, Y. (2008). Foreign direct investment and structural reforms: Panel evidence from Eastern Europe and Latin America. IMF Staff Papers.
Cecchetti, S. G., Mohanty, M. S., & Zampolli, F. (2011). The real effects of debt. Bank of International Settlement, Working papers No 352.
Chand, S. (2002). Vanuatu - A case of mixed performance. Pacific Economic Bulletin, 17, 24-37. Chibba, M. (2009). Financial Inclusion, Poverty Reduction and the Millennium Development Goals.
European Journal of Development Research 21, 213-230. Christopoulos, D. K., & Tsionas, E. G. (2004). Financial development and economic growth: Evidence
from panel unit root and cointegration tests. Journal of Development Economics, 73, 55-74.

81
Cihak, M. A., Demirguc-Kunt, A., Feyen, E., & Levine, R. (2013). Financial development in 2015 economies, 1960-2010. NBER, Working Paper 18946.
Claessens, S., Glaessner, T., & Klingebiel, D. (2000). Electronic finance: Reshaping the financial landscape around the world. The World Bank, Financial Sector Discussion Paper No.4.
Crockett, A. (2001). Monetary policy and financial stability. Bank for International Settlements. De-Gregorio. (1996). Borrowing constraints, human capital accumulation, and growth. Journal of
Monetary Economics, 37(1), 49-71. Deidda, L., & Fattouh, B. (2002). Non linearity between finance and growth. Economics Letter, 74(2),
339-345. Demetriades, P. I., & Hussein, K. A. (1996). Does financial development cause economic growth?
Time-series evidence from 16 countries. Journal of Development Economics, 51(1996), 387-411.
Demirguc-Kunt, A., & Levine, R. (2001). Bank-based and market-based financial systems: Cross-country comparisons Cambridge, MA: MIT Press.
Demirguc-Kunt, A., & Maksimovic, V. (2001). Bank-Based and Market-Based Financial Systems: Evidence from Firm Level Data. World Bank Working Paper.
Duncan, R., Sandy, C., & Malcolm, B. (1999). Pursuing Economic Reform in the Pacific. Manila, Asian Development Bank.
Dunn, J. C., Davies, M., Yan, Y., Wu, Y., & Wang, S. (2011). Monetary Policy Transmission Mechanisms in Pacific Island Countries. IMF Staff Papers.
Dunn, J. C., Davies, M., Yang, Y., Wu, Y., & Wang, S. (2011). Monetary Policy Transmission Mechanisms in Pacific Island Countries. IMF Working Papers, 12(176).
Engle, R. F., & Granger, C. W. J. (1987). Cointegration and Error Correction: Representation, Estimation and Testing. Econometrica, 55, 251-276.
Esso, L. J. (2010). Re-examining the Finance-Growth Nexus: Structural Break, Threshold Cointegration and Causality Evidence from the ECOWAS. Journal of Economic Development, 35(3), 57-58.
Estrada, G., Park, D., & Ramayandi, A. (2010). Financial Development and Economic Growth in Developing Asia. ADB Economics Working Paper Series (No. 233).
FitzGerald, V. (2006). Financial development and economic growth: A critical view. World Economic and Social Survey.
Friedman, B. M., & Kuttner, K. N. (2010). Implementation of monetary policy: How do central banks set interest rates? National Bureau of Economic Research, NBER Working Paper 16165.
Galetovic, A. (1996). Specialization, intermediation and growth. Journal of Monetary Economics, 38, 549-559.
Gay, D. (2004). The emperor's tailor: an assessment of Vanuatu's Comprehensive Reform Program. Pacific Economic Bulletin, 19(3).
Gerschenkron, A. (1962). Economic backwardness in historical perspective: Cambridge, Massachusetts: Belknap Press of Harvard University Press
Goldsmith, R. W. (1969). Financial Structure and Development. New Haven, CT: Yale University Press. Greenwood, J., & Jovanovic, B. (1990). Financial development, growth, and the distribution of
income. Journal of Political Economy. Greenwood, J., Sanchez, J. M., & Wang, C. (2010). Financing Development: The role of information
costs. American Economic Review, 100, 1875-1891. Guiso, L., Sapienza, P., & Zingales, L. (2002). The role of social capital in financial development. NBER
Working Paper w7565. Gurley, J. G., & Shaw, E. S. (1955). Financial aspects of economic development. The American
Economic Review, 45(September), 515-538. Hariharan, G., & Marktanner, M. (2012). The growth potential from financial inclusion. ICA Institute
and Kennesaw State University. Harrison, P., & et al. (1999). Finance and growth: Theory and new evidence. Federal Resserve Board
Discussion Paper, No. 35. Hassan, M. K., Sanchez, B., & Yu, J. (2011). Financial Development and Economic Growth: New
Evidence from Panel Data. The Quarterly Review of Economics and Finance, 51, 88-104.

82
Jayaraman, T., & Choong, C. (2012). Role of Money in Samller Pacific Island Countries. Economics Research International, 2012.
Jayaraman, T. K. (2003). Financial sector development and private investment in Vanuatu: Macmillan Brown Centre for Pacific Studies, University of Canterbury, and Institute of Pacific Studies, University of the South Pacific.
Jayaraman, T. K., & Choong, C. (2007). Financial sector development and growth in Fiji: an analysis of credit boom and its implications. Asia Pacific Economics Journal, 5, 1-20.
Johansen, S. (1988). Statistical Analysis of Cointegration Vectors,. Journal of Economic Dynamics and Control, 12, 231-254.
Johansen, S., & Juselius, K. (1990). Maximum Likelihood Estimation and Inference on Cointegration- With Application to the Demand for Money. Oxford Bulletin of Economics and Statistics, 52(169-210).
Khan, M. S., & Senhadji, A. S. (2000). Financial development and economic growth: An overview. IMF Working Paper WP/00/209.
King, R. G., & Levine, R. (1993a). Finance and Growth: Schumpeter might be right. The Quarterly Journal of Economics.
King, R. G., & Levine, R. (1993b). Finance, entrepreneurship, and growth - theory and evidence. Journal of Monetary Economics, 32(1993), 513-542.
Knapman, B., Zhukov, E., & Bond, M., &. (2001). Financial sector development in Pacific Island Economics [Asian Development Bank Country Reports]. Manila, Philippines: ADB.
Levine, R. (1997). Financial development and economic growth: Views and agenda. Journal of Economic Literature, XXXV, 688-726.
Levine, R. (2003). More on finance and growth: More finance, more growth? The Federal Reserve Bank of St. Louis.
Levine, R. (2005). Finance and Growth: Theory and Evidence. The Netherlands: Elsevier Science. Levine, R., Loayza, N., & Beck, T. (2000). Financial intermediation and growth: Causality and causes.
Journal of Monetary Economics, 46, 31-77. Levine, R., & Zervos, S. (1998). Stock markets, banks and economic growth. The American Economic
Review, 88(3), 537-558. Lynch, D. (1996). Measuring financial sector development: A study of selected Asian-Pacific
Countries. The Developing Economies, XXXIV(1). Maurer, K. (2002). Final Report: Technical Assistance to the National Bank of Vanuatu. Introducing
rural financial services in selected branches. Asian Development Bank South Pacific Regional Mission, TA No. 3206_VAN.
McKinnon, R. (1973). Money and capital in economic development: Washington: Brookings. Merton, M. (1991). Financial Innovations and Markets Volatility. Basil Blackwell Inc. Merton, R. C. (1995). A functional perspective of financial intermediation. Financial Management,
24(2). Mishkin, F. S. (2007). Financial instability and the Federal Reserve as a liquidity provider: a speech at
the Museum of American Finance Commemoration of the Panic of 1907. Board of Governors of the Federal Reserve System, Speech 333.
Morales, M. F. (2003). Financial Intermediation in a model of growth through creative descruction. Macroeconomic Dynamics, 7, 363-393.
Nari, R. (2000). Comprehensive Reform Program in the Republic of Vanuatu: a major challenge through the eyes of a ni-Vanuatu.
Nkusu, M., & Sayek, S. (2004). Local financial development aid-growth relationship. IMF Working Paper(WP/04/238).
OECD. (2010). Policy framework for effective and efficient financial regulation. OECD. Pacheco , D. (2007). Economic Democracy and Financial Reform in Vanuatu. Social and Economic
Studies, 56(1/2), 322-351. Pan, H., & Wang, C. (2013). Financial development and economic growth: A new investigation.
Journal of Economic Development, 38(1), 27-46. Patrick, H. (1966). Financial Development and Economic Growth in Underdeveloped Countries.
Economic Development and Cultural Change, 14, 174-189.

83
Prasad, C. B., & Roy, K. C. (2007). Development problems and prospects in Pacific Island States: Nova Science Publishers, Inc.
PSDI. (2014). Developing a uniquely Pacific approach to financing growth. Retrieved 15/06/2015, 2015,from http://www.adbpsdi.org/2014/12/financing-growth-in-pacific-developing.html.
Ravn, I. (2015). Explaining money creation by commercial banks: Five analogies for public education. real-world economics review(71), 92-112.
Robinson, J. (1952). The generalization of the general theory - The rate of interest and other essays. Rose, P. S. (1986). Money and Capital Markets. Business Publication Inc. Rousseau, P., & D'Onofrio, A. (2013). Monetization, financial development, and Growth: Time series
evidence from 22 countries in Sub-Saharan Africa. World Development, 51, 132-153. Rousseau, P. L., & Sylla, R. (2003). Financial Systems, Economic Growth, and Globalization. National
Bureau of Economic Research, Globalization in Historical Perspective. Rousseau, P. L., & Wachtel, P. (1998). Financial intermediation and economic perfomance: historical
evidence from five industrialized countries. Journal of Money, Credit, and Banking, 30, 657-678.
Sahay, R., & et al. (2015). Rethinking financial deepening: Stability and growth in emerging markets. International Monetary Fund.
Schumpeter, J. (1912). The Theory of Economic Development. New Jersey: Transaction Publishers Financial deepening in economic development [1973]. Sinha, A. (2015). What are the defects of the Indian Money Market? Retrieved from
http://www.preservearticles.com/201012291874/defects-of-indian-money-market.html. Stiglitz, J. E. (1994). The role of the state in financial markets. Theil, M. (2001). Finance and economic growth - a review of theory and the available evidence.
European Communications, 158. UN-ESCAP. (2005). Economic and Social Survey of Asia and the Pacific 2005: Dealing with Shocks VNSO-UNDP. (2010). Vanuatu Hardship & Poverty Report. VNSO. (2009). Vanuatu National Population and Housing Census 2009. Winters, A., & Martin, J., &. (2004). When comparative advantage is not enough: Business costs in
small remote economies [Centre for Economic Policy Research]. London School of Economics, Department of Economics: University of Sussex, Brighton.
World-Bank. (2008). Finance for all? Policies and pitfalls in expanding access. Washington DC: World Bank.
World-Bank. (2011). Financial Sector Development Indicators. Financial Sector Operations and Policy, FSI: 1.
World-Bank. (2014). Financial Inclusion. Global Financial Development Report 2014. World-Economic-Forum. (2012). The Financial Development Report 2012. Xu, Z. (2000). Financial development, investment, and growth. Economic Inquiry, 38, 331-334. Yang, Y., Davies, M., Wang, S., Dunn, J., & Wu, Y. (2012). Monetary policy transmission and
macroeconomic policy coordination in Pacific island countries. Asian-Pacific Economic Literature, 26(1), 46-68.
Top Related
Copyright © 2022 FDOKUMEN

