


Bahasa
Halaman
Hukum


Abstract We analyzed the effects of changes in land
cover on the water balance in Spain’s Marina Baixa
County, on the Mediterranean coast. To reveal how
different land management strategies have affected the
area’s environment, four municipalities within the
same catchment were studied: Benidorm, Callosa
d’en Sarria, Beniarda, and Guadalest. In the munici-
palities of Callosa and Benidorm, the proportion of the
area covered by woodland declined by 4.2% and 30.2%,
respectively, and woodland was replaced by agriculture
and urban development. The abandonment of farm-
land produced a 17% increase in the proportion of the
area covered by vegetation in Guadalest and Beniarda,
where frequent forest fires have exacerbated a
decrease in the area of pine woodland. Tourism
development in Benidorm has been accompanied by
an increase in the transportation infrastructure and by
an expansion of areas with an impermeable surface,
with the lowest level of infiltration into the aquifer
system. These changes have generated a net water
deficit in Callosa and Benidorm of more than
6 Mm3/year, creating a high demand for water
imported from other municipalities (Guadalest and
Beniarda) or from outside of the county to maintain
the sustainability of the current water management
strategies. The Marina Baixa case study is representa-
tive of many of the world’s coastal areas that are
undergoing rapid urban development based on an
inappropriate understanding of human progress based
mainly on economic development and thus provides
insights into water management in other areas.
Keywords Water balance � Land use and cover
changes � Management strategies � Water sustainability
� Human impacts
Introduction
Many factors that result from global influences indi-
rectly affect land management at a local level (Raskin
2005). These influences include resource production
and consumption patterns, economic globalization,
cultural differentiation, international governance, geo-
political conflicts, migration of populations, and global
warming. Economic influences, demographic factors,
and government policies act as driving forces that
define the most appropriate land-use strategies for any
region based on the particular interests of those
responsible for the change (Braimoh and Vlek 2005),
without taking into account the opinion or needs of
local populations. However, in practice, nearly all
environmental management is carried out at a local
level, and measures adopted at this level influence the
impacts at broader scales; for example, they play a
significant role in biodiversity conservation and in
establishing effective procedures to achieve sustainable
development (Gasco and others 2005; Maestre 2001).
Environmental management strategies affect land-
scapes because land-use and land-cover change (LUCC)
is one of the most important human modifications of the
Earth’s surface (Lambin and others 1999). The rate of
J. Bellot (&) � A. Bonet � J. Pena � J. R. SanchezDepartment of Ecology, Alicante University,03080 Alicante, SpainE-mail: [email protected]
Environ Manage (2007) 39:412–422
DOI 10.1007/s00267-005-0317-9
123
Human Impacts on Land Cover and Water Balances in a CoastalMediterranean County
Juan Bellot Æ Andreu Bonet Æ Juan Pena ÆJuan Rafael Sanchez
Received: 7 October 2005 / Accepted: 30 July 2006� Springer Science+Business Media, Inc. 2007

land-cover alteration is increasing dramatically world-
wide due to increasing and intensifying human use of the
land (Antrop 2004; Conway and Lathrop 2005; Dale and
others 2000; Richards 1990). The effects of such changes
have attracted the attention of ecologists, particularly
with regard to the impacts of modifications of landscape
structure, environmental quality, and biodiversity (Ales
and others 1992; Holling 1992; Krummel and others
1987; Levin 1992; Romero-Calcerrada and Perry 2004).
These changes have also been analyzed in semi-arid
and dry Mediterranean areas, concentrating especially
on the consequences of farmland abandonment (Bonet
2004; Bonet and others 2001, 2004; Martinez-Fernan-
dez and others 1995) and reforestation carried out at
different scales (Chirino 2003; Chirino and others 2001,
2006; Maestre and Cortina 2004). In these environ-
ments, where water scarcity is the main factor that
limits ecosystem functioning, any change in land use
will modify the relationships between the different
components of the hydrological cycle, thereby limiting
the availability of water as a resource for human
development due to increased runoff and decreased
recharge of aquifers (Bellot and others 1999, 2001;
Cerda 1995; Chirino and others 2003, 2006). Cause–
effect relationships that describe the impact of land-
scape changes on the conservation of water resources
have been determined (Martinez-Fernandez and
others 1995; Omerick 1977).
For decades, agriculture and tourism have been the
main economic sectors in such Mediterranean envi-
ronments, and this is also the case in Marina Baixa
County (Alicante province, southeastern Spain),
where noticeable changes have occurred in both the
landscape and the regional water balance (Bellot and
others 2005; Sanchez and others 2004). However, the
environmental impacts linked to these developments
have rarely been appraised (Oxley and others 2004).
Recently, some authors have focused on the effects of
woodland transformation into other land uses and of
agricultural land-cover changes that have resulted in
an increase in the area covered by an impermeable
surface that affects the catchment’s hydrology (Wiss-
mar and others 2004). Rural areas where woodlands
have been replaced by sealed soil surfaces (e.g., urban
developments, roads, parking lots, rooftops) or by
irrigation agriculture experience changes in the
hydrologic fluxes, with increased surface runoff during
storms, variable water retention times, increased
water consumption, decreased soil water infiltration,
and decreased recharge of aquifers. All of these
changes affect the reversibility of the land-cover
changes and the sustainability of uses of the water
resource.
The work described in the present article aimed to
evaluate human impacts on the water balance of
Marina Baixa County that resulted from changes in
land use and land cover over the last half-century.
The different management strategies implemented in
several municipalities of the county are compared
during three time periods (predevelopment, until
1956; a period of agricultural development, from
1956 to 1978; and a period of tourism expansion, from
1978 to 2000) to evaluate the human impacts on land
cover and water use. Water balance is used as a key
indicator of the study area’s environmental evolution
and is analyzed to assess the sustainability of these
management strategies at local, county, and regional
scales.
Study Area
Marina Baixa County is a 671-km2 watershed located in
the northeastern part of Alicante province (Figure 1).
The county lies between 0�00¢ and 0�24¢ west longitude,
and 38�28¢ and 38�43¢ north latitude. The topography
varies greatly from the coast to the inland mountains
and is characterized by intensive land use, with irrigated
crops such as medlars (Eriobotrya japonica Lindl.),
citrus (Citrus spp.), and other fruits, coexisting with
dryland crops such as carob trees (Ceratonia siliqua L.),
olive trees (Olea europaea L.), and almond trees
(Prunus dulcis (Miller) D.A. Webb), and interspersed
with scattered settlements and a rough area of Medi-
terranean woodland that is frequently affected by
wildfire. The climate is characterized by an average
temperature of 18�C and an average annual precipita-
tion of 300 mm along the coast, in contrast with an
average temperature of 9�C and an average rainfall of
between 700 and 900 mm farther inland. The region has
undergone one of the greatest socioeconomic changes
in Spain because it hosts more than 60% of the tourist
activity in Spain’s Valencia region. Marina Baixa
County comprises 18 municipalities, which, for the
study period (1956–2000), present a mosaic of different
trends due to the influence of their proximity to the
Mediterranean coast (services and tourism) and the
availability of water in aquifer reserves (for intensive
irrigation of crops).
In order to illustrate human impacts on the land-
scape, three patterns of land-cover and land-use change
were analyzed in two municipalities with different
populations but similar areas (Benidorm, with 51,873
inhabitants and 3860 ha, and Callosa d’en Sarria, with
7057 inhabitants and 3430 ha) and two municipalities
with comparable surface area but much smaller popu-
Environ Manage (2007) 39:412–422 413
123
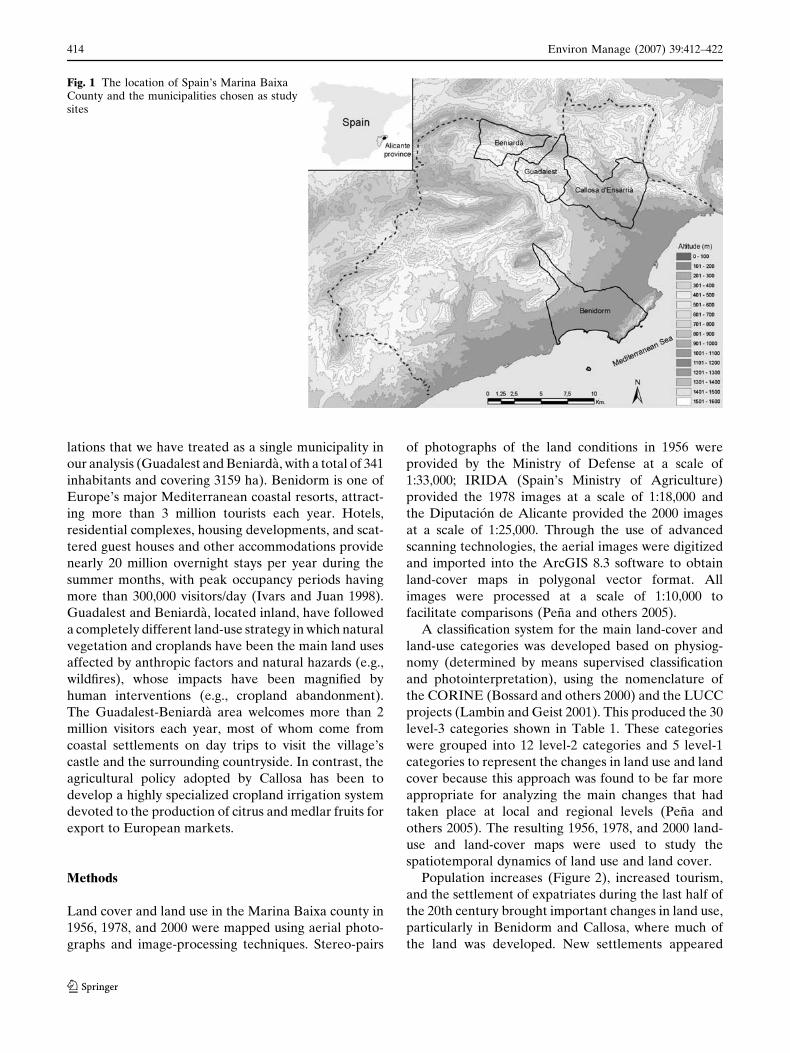
lations that we have treated as a single municipality in
our analysis (Guadalest and Beniarda, with a total of 341
inhabitants and covering 3159 ha). Benidorm is one of
Europe’s major Mediterranean coastal resorts, attract-
ing more than 3 million tourists each year. Hotels,
residential complexes, housing developments, and scat-
tered guest houses and other accommodations provide
nearly 20 million overnight stays per year during the
summer months, with peak occupancy periods having
more than 300,000 visitors/day (Ivars and Juan 1998).
Guadalest and Beniarda, located inland, have followed
a completely different land-use strategy in which natural
vegetation and croplands have been the main land uses
affected by anthropic factors and natural hazards (e.g.,
wildfires), whose impacts have been magnified by
human interventions (e.g., cropland abandonment).
The Guadalest-Beniarda area welcomes more than 2
million visitors each year, most of whom come from
coastal settlements on day trips to visit the village’s
castle and the surrounding countryside. In contrast, the
agricultural policy adopted by Callosa has been to
develop a highly specialized cropland irrigation system
devoted to the production of citrus and medlar fruits for
export to European markets.
Methods
Land cover and land use in the Marina Baixa county in
1956, 1978, and 2000 were mapped using aerial photo-
graphs and image-processing techniques. Stereo-pairs
of photographs of the land conditions in 1956 were
provided by the Ministry of Defense at a scale of
1:33,000; IRIDA (Spain’s Ministry of Agriculture)
provided the 1978 images at a scale of 1:18,000 and
the Diputacion de Alicante provided the 2000 images
at a scale of 1:25,000. Through the use of advanced
scanning technologies, the aerial images were digitized
and imported into the ArcGIS 8.3 software to obtain
land-cover maps in polygonal vector format. All
images were processed at a scale of 1:10,000 to
facilitate comparisons (Pena and others 2005).
A classification system for the main land-cover and
land-use categories was developed based on physiog-
nomy (determined by means supervised classification
and photointerpretation), using the nomenclature of
the CORINE (Bossard and others 2000) and the LUCC
projects (Lambin and Geist 2001). This produced the 30
level-3 categories shown in Table 1. These categories
were grouped into 12 level-2 categories and 5 level-1
categories to represent the changes in land use and land
cover because this approach was found to be far more
appropriate for analyzing the main changes that had
taken place at local and regional levels (Pena and
others 2005). The resulting 1956, 1978, and 2000 land-
use and land-cover maps were used to study the
spatiotemporal dynamics of land use and land cover.
Population increases (Figure 2), increased tourism,
and the settlement of expatriates during the last half of
the 20th century brought important changes in land use,
particularly in Benidorm and Callosa, where much of
the land was developed. New settlements appeared
Fig. 1 The location of Spain’s Marina BaixaCounty and the municipalities chosen as studysites
414 Environ Manage (2007) 39:412–422
123

throughout the region, large areas of woodland were
cleared, and new crops were introduced. The impacts of
these changes on the area’s environmental quality were
evaluated in the present study using a transition matrix
approach in which structural complexity and environ-
mental stability (Heylighen 1999) as well as the
system’s water sustainability were taken into account.
A simple, nonspatially explicit model analogous to the
first-order Markov chain transition method was gener-
ated for each combination of map pairs (1956 and 1978,
1978 and 2000, and 1956 and 2000) based on the
methods of Usher (1992) and Dale and others (2002).
Transitions that decreased water use sustainability
during land-use and land-cover changes (Kates and
Parris 2003; Parris and Kates 2003) and that increased
the degree of irreversibility of those changes were
classified as ‘‘degradative’’ (D). Changes that increased
environmental quality or that were not irreversible
were classified as an ‘‘improvement’’ (I) transition.
Finally, we created the ‘‘stationary’’ (S) category to
cover transitions between land uses within the same
category or a lack of change. Table 2 presents the types
of change between categories for the five level-1
aggregated categories (Table 1), giving a total of
5 · 5 = 25 possible transitions. In the context of this
study, any transformation of woodland or shrubland
into any other use was classified as degradative,
whereas any transformation of urban land into a more
natural environment was classified as an improvement.
Similarly, the change from dryland farming to irrigated
Table 1 Classification of the main land-cover and land-use categories based on the nomenclature of the CORINE (Bossard and others2000) and LUCC (Lambin and Geist 2001) projects, which distinguish 30 categories at level 3, 12 composite categories at level 2, and 5composite categories at level 1
Level 3 Level 2 Level 1
River Body of water UrbanBody of waterDam
Low-density residential Urban low densityMedium-density residential Urban medium densityHigh-density residential Urban high density
Leisure facilityInfrastructure InfrastructuresIndustrial and commercialLandfill and mineral extractionPrimary roadSecondary roadRegional or local roadAccess roadRailwayBare soil or degraded landBeach
Dryland crop Dryland crop Dryland crop
Irrigated crop Irrigated crop Irrigated crop
Shade crop Shade crop
Pine forest Pine forest WoodlandShrubland with dispersed pinesPine forest plantation
Abandoned field regenerating as pine forest Recovered old fieldsAbandoned field regenerating as shrubland with dispersed pines
Shrubland Shrubland ShrublandScrubland ScrublandRavine vegetation
Abandoned field regenerating as scrubland Recovered old fieldsAbandoned field regenerating as shrubland
Note: The criterion for defining land cover and land use was physiognomy, and the results were obtained by means of photo-interpretation
Environ Manage (2007) 39:412–422 415
123

crops was also considered degradative due to the
resulting increase in water consumption and evapora-
tion, whereas a change from irrigation to dryland
farming was considered to be an amelioration.
To calculate the water balances for each type of
land use and cover, a Digital Elevation Model of
Marina Baixa County and precipitation data were
used to estimate the quantity of water flowing into the
Marina Baixa catchment during the study years (1956,
1978, and 2000). Actual evapotranspiration was cal-
culated using different methods for each type of land
use and averaged weighting each surface. In natural
cover types, evapotranspiration was estimated using
the ‘‘Ventos’’ hydrologic model (Bellot and others
2001; Chirino 2003). In dryland agriculture and
irrigated cropland, evapotranspiration was estimated
using the water consumption data (Lopez Bellido
1998) and the water use efficiency for each crop
reported by Allen and others (1998) as input data for
the PARloc software (IVIA 2006). The extent and
buildings density of urban areas and of scattered
settlements were calculated using the land-use data in
ArcGIS, supplemented by field data, and were
divided into three categories (low, middle, and high)
according to the number of buildings per hectare.
Field surveys using the rapid appraisal technique
(Kachondham 1992) and data provided by local water
supply companies and agencies were used to estimate
urban water consumption and to evaluate the impact
of these uses on the water cycle. For gardens and
urban parks, the method of Domene and Saurı (2003)
was applied to estimate water consumption and
evapotranspiration.
Results
Land-Cover Properties
The patterns of change differed greatly among the
municipalities (Table 3), although the predevelop-
ment situations were similar (56–59% natural vegeta-
tion, 39–42% agriculture, and 0.1–2% urban). The
proportion of the area covered by natural vegetation,
which comprises different types of woodland cover
(pine forest, dense or open shrubland, and aban-
doned cropland) decreased by 4.2% during the study
period (1956–2000) in Callosa and by 3.2% in
Fig. 2 Population changes during the 20thcentury in the municipalities in the study area.Data were provided by Spain’s NationalInstitute for Statistics (Instituto Nacional deEstadıstica)
Table 2 Matrix of the transitions between the five level-1 categories of land use (Table 1) and the corresponding consequences forsustainability of water use
To \ From Urban Dryland crops Irrigated crops Shrubland Woodland
Urban Stationary Improvement Degradative Improvement ImprovementDryland crops Degradative Stationary Degradative Improvement ImprovementIrrigated crops Improvement Improvement Stationary Improvement ImprovementShrubland Degradative Degradative Degradative Stationary ImprovementWoodland Degradative Degradative Degradative Degradative Stationary
Stationary: unchanged or changes within the same category; improvement: land-use conversion to natural or artificial uses that result inless water consumption; degradative: more irreversible conversion to artificial uses that increase water consumption
416 Environ Manage (2007) 39:412–422
123
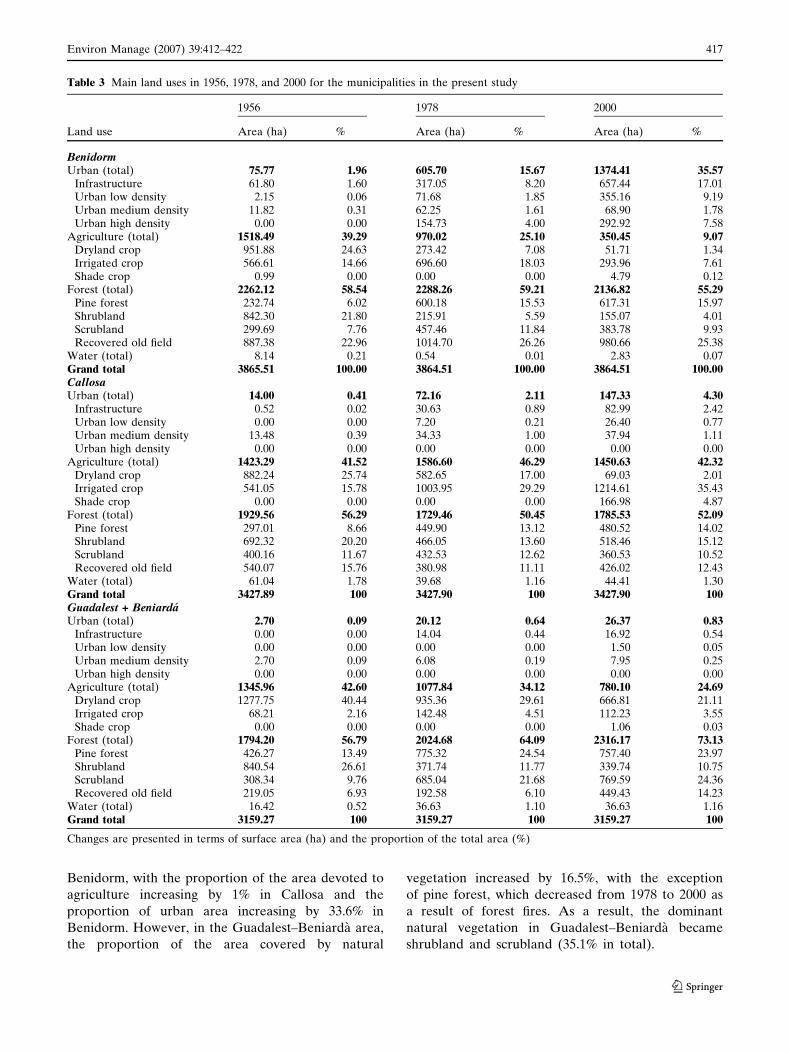
Benidorm, with the proportion of the area devoted to
agriculture increasing by 1% in Callosa and the
proportion of urban area increasing by 33.6% in
Benidorm. However, in the Guadalest–Beniarda area,
the proportion of the area covered by natural
vegetation increased by 16.5%, with the exception
of pine forest, which decreased from 1978 to 2000 as
a result of forest fires. As a result, the dominant
natural vegetation in Guadalest–Beniarda became
shrubland and scrubland (35.1% in total).
Table 3 Main land uses in 1956, 1978, and 2000 for the municipalities in the present study
1956 1978 2000
Land use Area (ha) % Area (ha) % Area (ha) %
BenidormUrban (total) 75.77 1.96 605.70 15.67 1374.41 35.57
Infrastructure 61.80 1.60 317.05 8.20 657.44 17.01Urban low density 2.15 0.06 71.68 1.85 355.16 9.19Urban medium density 11.82 0.31 62.25 1.61 68.90 1.78Urban high density 0.00 0.00 154.73 4.00 292.92 7.58
Agriculture (total) 1518.49 39.29 970.02 25.10 350.45 9.07Dryland crop 951.88 24.63 273.42 7.08 51.71 1.34Irrigated crop 566.61 14.66 696.60 18.03 293.96 7.61Shade crop 0.99 0.00 0.00 0.00 4.79 0.12
Forest (total) 2262.12 58.54 2288.26 59.21 2136.82 55.29Pine forest 232.74 6.02 600.18 15.53 617.31 15.97Shrubland 842.30 21.80 215.91 5.59 155.07 4.01Scrubland 299.69 7.76 457.46 11.84 383.78 9.93Recovered old field 887.38 22.96 1014.70 26.26 980.66 25.38
Water (total) 8.14 0.21 0.54 0.01 2.83 0.07Grand total 3865.51 100.00 3864.51 100.00 3864.51 100.00CallosaUrban (total) 14.00 0.41 72.16 2.11 147.33 4.30
Infrastructure 0.52 0.02 30.63 0.89 82.99 2.42Urban low density 0.00 0.00 7.20 0.21 26.40 0.77Urban medium density 13.48 0.39 34.33 1.00 37.94 1.11Urban high density 0.00 0.00 0.00 0.00 0.00 0.00
Agriculture (total) 1423.29 41.52 1586.60 46.29 1450.63 42.32Dryland crop 882.24 25.74 582.65 17.00 69.03 2.01Irrigated crop 541.05 15.78 1003.95 29.29 1214.61 35.43Shade crop 0.00 0.00 0.00 0.00 166.98 4.87
Forest (total) 1929.56 56.29 1729.46 50.45 1785.53 52.09Pine forest 297.01 8.66 449.90 13.12 480.52 14.02Shrubland 692.32 20.20 466.05 13.60 518.46 15.12Scrubland 400.16 11.67 432.53 12.62 360.53 10.52Recovered old field 540.07 15.76 380.98 11.11 426.02 12.43
Water (total) 61.04 1.78 39.68 1.16 44.41 1.30Grand total 3427.89 100 3427.90 100 3427.90 100Guadalest + BeniardaUrban (total) 2.70 0.09 20.12 0.64 26.37 0.83
Infrastructure 0.00 0.00 14.04 0.44 16.92 0.54Urban low density 0.00 0.00 0.00 0.00 1.50 0.05Urban medium density 2.70 0.09 6.08 0.19 7.95 0.25Urban high density 0.00 0.00 0.00 0.00 0.00 0.00
Agriculture (total) 1345.96 42.60 1077.84 34.12 780.10 24.69Dryland crop 1277.75 40.44 935.36 29.61 666.81 21.11Irrigated crop 68.21 2.16 142.48 4.51 112.23 3.55Shade crop 0.00 0.00 0.00 0.00 1.06 0.03
Forest (total) 1794.20 56.79 2024.68 64.09 2316.17 73.13Pine forest 426.27 13.49 775.32 24.54 757.40 23.97Shrubland 840.54 26.61 371.74 11.77 339.74 10.75Scrubland 308.34 9.76 685.04 21.68 769.59 24.36Recovered old field 219.05 6.93 192.58 6.10 449.43 14.23
Water (total) 16.42 0.52 36.63 1.10 36.63 1.16Grand total 3159.27 100 3159.27 100 3159.27 100
Changes are presented in terms of surface area (ha) and the proportion of the total area (%)
Environ Manage (2007) 39:412–422 417
123

Since 1978, agriculture has declined steadily in
Guadalest-Beniarda (by 10%) and Benidorm (16%),
in contrast with the 177-ha (4.9%) increase in irrigation
farming, especially under shade and using drip irriga-
tion technology, in Callosa. Dryland farming decreased
considerably (by 23%) in Callosa, to a level well below
that in Guadalest-Beniarda and comparable to that in
Benidorm (Table 3).
There has been almost no change in the proportion
of urban area in Guadalest-Beniarda since 1956,
whereas the urban area in Callosa has increased to 10
times its 1956 value; in Benidorm, the urban area
increased to 18 times its 1956 value (Table 3).
Although this category occupies less land area in total
than natural vegetation and agriculture, this change has
important consequences for the conservation of water
resources because urban areas have impermeable
surfaces and because the change has a high degree of
irreversibility. The majority of the urban development
took place between 1978 and 2000 as a result of the
emergence of industrial, commercial, and (above all)
recreational and leisure areas. Access to these devel-
oped areas has been improved by increases in the
county road network, which has expanded to 5 and 11
times the 1956 values in 1978 and 2000, respectively
(data not shown). In 2000, road networks in Benidorm
occupied more than 120 ha of land (Pena and others
2005).
Land-Cover Transitions
The analysis of land-cover transitions included all three
municipal areas shown in Table 3. The changes
observed from 1956 to 2000 (Figure 3) confirm that
most of the Guadalest-Beniarda landscape remained
stable (52% of the transitions) and had the lowest level
Fig. 3 Distribution of land-use transitions inthe municipalities in the study from 1956 to1978, from 1978 to 2000, and for the studyperiod as a whole (1956–2000)
418 Environ Manage (2007) 39:412–422
123

of degradative transitions (13%). Callosa and Beni-
dorm had roughly the same level of degradative change
(35 and 38%, respectively), but Callosa also showed a
high degree of stability (43%). Benidorm went through
the largest number of transitions that were character-
ized by a high level of degradative change (38%).
Abandonment of farming appears to have contributed
most strongly to the improved transitions (31%) that
have taken place in Benidorm.
Impact of Land-Cover Changes on Water Use
Equipment and infrastructure for transporting water
have become a prominent feature of the study area,
adversely affecting its natural appearance. In 1978, the
dam constructed to regulate Guadalest’s river flow
came into service, and although the same area of
bodies of water was maintained, downstream of the
dam the river and its associated vegetation has disap-
peared. However, the sporadic presence of water has
permitted the development of ravine (rambla) vegeta-
tion, leading to the replacement of a river system with
a high ecological value by another (rambla) and
increasing the connectivity between land on opposite
sides of the dry riverbed.
The main changes in the water-use system can be
attributed to the increase in the area of irrigated
cropland (e.g., irrigation reservoirs) and the area of
urban development for recreational use (swimming
pools, golf courses, water parks, etc.). These changes
demand a great amount of water from the region’s
aquifers or the availability of a water supply from
outside of the region. We have estimated the average
water flows (m3/ha/ year) for each land use (Figure 4)
based on an average annual precipitation of 400 mm
(4000 m3/ha) for the whole county. In the natural
vegetation and dryland crop land uses, evapotranspi-
ration represents the main output (87% and 79% of
inputs, respectively), with infiltration representing the
secondary output (10% and 20%, respectively). In areas
under irrigation, the additional input of water greatly
modifies the water flows, with infiltration rates increas-
ing to 34% of the inputs and evapotranspiration
increasing to 63% of the total water input (rainfall
and irrigation combined). In urban areas, evapotrans-
piration decreased to 3% of inputs (rainfall and
supplied water), but urban collectors (‘‘treatment
plants’’ in Figure 4) receive 70% of the water, with
the remainder (27%) being accounted for by infiltra-
tion or lost by the system.
We calculated the annual water balance in millions
of cubic meters (Mm3) for the hydrological areas
occupied by the four municipalities (Table 4). The
changes in land use between 1956 and 2000 increased
water consumption to levels exceeding the available
water resource in Callosa and Benidorm. In both cases,
agricultural and urban uses produced the same effect:
a net negative balance of more than 3.2 Mm3/year.
However, if water collection by the municipalities of
Guadalest and Beniarda is included, the overall
balance remains near equilibrium in 2000 (Table 4).
Considering the four municipalities as a single system,
the balance between collection and use of water
suggests that the relative sizes of the regions that
contribute and consume water affects the overall water
balance and thus the system’s sustainability, with some
areas acting as sources and others as sinks. By
analyzing the contribution of water flows and reserves
(aquifers) in these municipalities (Table 4), we ob-
served that only the Guadalest-Beniarda community is
still a source of water supply, with positive contribu-
tions to the net balance in all three periods under
consideration.
The role of Callosa in the county’s water balance has
changed over time, with a positive contribution during
the predevelopment period changing to a strong
Fig. 4 Average water flow (m3/ha/year) foreach of the main land uses in Marina Baixa.For each land use, the inputs are precipitation(Prec.), irrigation, and urban supply; theoutputs are evapotranspiration (Eta),infiltration into the aquifer (Infil.), and surfacerunoff (Runoff). Inputs and outputs arerepresented by downward-pointing andupward-pointing arrows, respectively.Percentages represent the proportion of totalinputs (precipitation, irrigation, and urbansupply volumes)
Environ Manage (2007) 39:412–422 419
123

negative contribution from 1978 to the present as a
result of intensive development of irrigated agriculture.
Benidorm has acted as a water sink since 1978 due to
the strategies implemented at that time for the devel-
opment of tourism. This net negative balance has
occurred despite the implementation of new sewage
treatment measures in 2000 that now return 38% of the
input water to the Benidorm aquifer. In environmental
management terms, Benidorm has lost nearly all of its
former agricultural character (only 9% of the area is
now agricultural; Table 3), and natural vegetation has
also declined slightly; as a result, 35% of its area is now
occupied by developed land, including infrastructure
for water transportation. Part of the water that is used
is now treated and restored to a polluted and saline
aquifer, whose water is unsuitable for human
consumption or agricultural uses (Figure 4).
Discussion
A global view of the situation in 1956 reflects a more
rational use of the land and a greater sustainability of
water consumption. In that year, Benidorm, Callosa,
and Guadalest–Beniarda had a similar distribution of
land uses, but in recent decades, land use has irrevers-
ibly transformed much of the traditional structure of
the rural landscape, fragmenting the agricultural land-
scape and causing overexploitation of the hydrological
resources. The fact that there was less irrigated
agriculture in Callosa and less tourism in Benidorm
during the predevelopment period resulted in a near-
equilibrium water balance or a net positive balance.
However, when these areas began to flourish econom-
ically and demographically (1978 and 2000), water
consumption increased greatly as a result of taking
advantage of new water sources and increasing the
complexity of the systems used for water exploitation
(wells, transfers from other regions, dams). This
increase has been mitigated in part by the implemen-
tation of new technologies aimed at reducing water
consumption, such as the implementation of drip
irrigation, water treatment plants, and the reuse of
treated sewage water.
The land-use change in favor of housing develop-
ments and irrigated croplands illustrates the impact of
local decisions on land use and hydrology. The case of
Marina Baixa County also illustrates how topograph-
ical conditions and distance from the coast significantly
affected land-use and land-cover types and therefore
affected the landscape configuration, as was the case in
Wear and Bolstad’s (1998) study, which described a
strategy limiting the use of intensive agriculture to
areas of no tourism interest. Road construction and
improvement have also affected the subsequent evo-
lution of rural landscapes in our study area, which
shifted from a matrix of natural vegetation in 1956 to a
primarily anthropogenic matrix in 2000. The environ-
mental impacts of these changes must be evaluated
further, paying special attention to their degradative
characteristics and the degree of irreversibility of the
changes, because even reversible changes will persist
for a long time, simultaneously affecting the water
cycle and the functioning of the region’s ecosystems.
Additional research is needed to evaluate the eco-
logical implications of continuous construction of
housing developments, overexploitation of water
resources, and other impacts attributable to human
actions. These alterations influence local environments
by destroying habitats and modifying water fluxes
(Alberti 1999), and it will be necessary to further
evaluate these effects from an environmental point of
view—that is, from the perspective of biodiversity,
functioning of ecosystems, risk assessment, and so on
(Dale and others 1998a). Currently, other impacts
(both negative and positive) have been observed as a
result of the increased volumes of water flowing over
the surface in 2000, which contrasts with the predevel-
opment period (1956), when this volume of water
normally remained underground in the aquifers. The
Table 4 Annual water flows (in Mm3/year) : inputs (rainfall), outputs (evapotranspiration), consumption (irrigation and urban), andtotal balances at each local level
1956 1978 2000
G + B C B G + B C B G + B C B
Rainfall 25.68 22.71 13.33 25.68 22.71 13.33 25.68 22.71 13.33Evapotranspiration 15.29 14.10 7.89 16.01 13.4 7.51 16.53 13.50 7.09Irrigation 0.41 4.57 4.24 1.29 8.51 5.22 0.98 11.71 2.24Urban 0.02 0.16 0.14 0.09 0.47 3.88 0.08 0.56 7.25Balance 9.96 3.88 1.06 8.30 0.33 –3.28 8.09 –3.04 –3.25
Guadalest and Beniarda = G + B; Callosa = C; Benidorm = B.The same average rainfall was used for each municipality in each year to evaluate the effect of land-use changes without the influenceof changes in rainfall and interannual variability
420 Environ Manage (2007) 39:412–422
123

expansion of housing developments and the presence of
scattered settlements throughout the landscape could
be considered as a totally anthropogenic disturbance in
the sense defined by Dale and others (1998b), and this
might eventually result in an urban region with no
positive environmental function (Antrop 2004).
At present, the water balance in our study area is
roughly in equilibrium at the county scale. The
municipalities of Guadalest and Beniarda, which have
implemented a different management strategy based
on retaining more of the natural and agricultural
environments, can supply Benidorm and Callosa with
the extra water they have collected from rainfall in
order to compensate for the water deficit in these two
larger villages. However, the current trends in land use
suggest that an increased water deficit will occur at the
county level in the future. Published strategic plans for
development of the region suggest that the severity of
human impacts will increase on this area (increased
population, housing development, and development of
recreational sites such as water parks and golf courses),
and these increased impacts can be compensated for
only by new water transfers from outside of the region
(Gasco and others 2005). This management policy will,
in turn, affect the sustainability of other remote areas,
which will similarly need to reassess their development
strategies. Alternatively, water conservation measures
and inputs of marine water using desalination technol-
ogies could be developed.
To minimize the adverse effects of development,
planners and decision-makers must balance the current
availability of natural resources with proposed new
changes in land use before permitting further landscape
changes. As Cumming and others (2005) have pro-
posed, it is necessary to consider the present ecological
limitations before defining additional scenarios for
sustainable development in which land uses will be in
equilibrium with the available resources. Conversely, to
create a ‘‘huge urban development’’ would require an
input of resources from other regions that would
remain undeveloped, thereby intensifying the existing
regional imbalance in land use and economic develop-
ment. Planning and designing landscapes for the future
requires a profound understanding of the highly
dynamic, complex, and multifunctional urbanized land-
scape (Antrop 2004) and of ecologically appropriate
future development. An environmentally correct man-
agement policy must recognize that local and regional
sustainability depends on ecological issues that arise at
the ecosystem level. Unfortunately, reality provides us
with many examples where the sustainability of a local
area is maintained only by requiring the contribution of
resources from other regional, national, or interna-
tional areas. Our case study clearly illustrates how an
inappropriately planned coastal urban development
(in the municipality of Benidorm) has led to occupation
of more than one-third of its area by houses, roads, and
other infrastructure and services, increasing water
consumption to unsustainable levels.
Acknowledgments This work has been financed by theEuropean AQUADAPT (EVK1-CT-2001-00104) project and ispart of the CICYT project CGL2004-03627 and RESELProgramme from Ministerio Medio Ambiente (MMA), Spain.
References
Alberti M. 1999. Modeling the urban ecosystem: A conceptualframework. Environ Plan B: Plan Des 26:605–630
Ales R. F., A. Martin, F. Ortega, E. E. Ales. 1992. Recentchanges in landscape structure and function in a Mediter-ranean region of southwest Spain. Landscape Ecol 7:3–18
Allen R. G., L. S. Pereira, D. Raes, D. Smith. 1998. Cropevapotranspiration. Guidelines for computing crop waterrequirements. Irrigation and Drainage Paper 56. FAO, Rome
Antrop M. 2004. Landscape change and the urbanization processin Europe. Landscape Urban Plan 67:9–26
Bellot J., A. Bonet, J. R. Sanchez, E. Chirino. 2001. Likely effectsof land use changes on the runoff and aquifer recharge in asemi-arid landscape using a hydrological model. LandscapeUrban Plan 778:1–13
Bellot J., J. R. Sanchez, E. Chirino, N. Hernandez, F. Abdelli,J. M. Martinez. 1999. Effect of different vegetation typecover effects on the soil water balance in a semi-arid areas ofsouth eastern Spain. Phys Chem Earth (B) 24:353–357
Bellot J., J. R. Sanchez, E. Chirino, J. C. Tejada, J. Monsalve,J. Pena, A. Bonet, D. Eisenhuth. 2005. Elaboration of ahydrologic model for balances in semi-arid areas Alicante).Deliverable 8 (III). AQUADAPT Project Report, Alicante,Spain
Bonet A. 1997. Efectos del abandono de los cultivos sobre lavegetacion en la cuenca del Alt Llobregat (Barcelona).Relacion con factores ambientales y de usos del suelo.Ecologıa 11:91–104
Bonet A. 2004. Secondary succession on semi-arid Mediterraneanold-fields in south-eastern Spain: Insights for conservationand restoration of degraded lands. J Arid Environ 56:213–233
Bonet A., J. Bellot, J. Pena. 2004. Landscape dynamics ina semiarid Mediterranean catchment (SE Spain). In SMazzoleni (ed), Recent dynamics of Mediterranean vege-tation and landscape. Wiley, Chichester, pp 41–50
Bonet A., J. Pena, J. Bellot, M. Cremades, J. R. Sanchez. 2001.Changing vegetation and landscape patterns in semi-aridSpain. In Y. Villacampa, C. A. Brebbia, J. L. Uso (eds),Ecosystems and sustainable development III. Wessex Insti-tute of Technology, UK, pp 377–386
Bossard M., J. Feranec, J. Otahel. 2000. Corine land covertechnical guide. Addendum 2000. Technical Report 40.European Commission/European Environment Agency,Copenhagen. Available at http://reports.eea.eu.int/tech40-add/en
Braimoh A. K., P. L. Vlek. 2005. Land-cover change trajectoriesin Northern Ghana. Environ Manage 36:356–373
Cerda A. 1995. Factores y variaciones espacio-temporales de lainfiltracion en los ecosistemas mediterraneos. Monografıascientıficas. Geoforma ediciones, Logrono, Spain
Environ Manage (2007) 39:412–422 421
123

Chirino E. 2003. Influencia de las precipitaciones y de la cubiertavegetal en el balance hıdrico superficial y en la recarga deacuıferos en clima semiarido. PhD thesis, Universidad deAlicante, Alicante, Spain
Chirino E., J. Bellot, A. Bonet, J. M. Andreu. 2003. Efecto dediferentes tipos de cubierta vegetal en el control de laerosion en clima semiarido. SE- Espana. In R. Bienes,M. J. Marques (eds), Control de la erosion and degradaciondel Suelo. Forum Calidad, Madrid pp 183–187
Chirino E., A. Bonet, J. Bellot, J. R. Sanchez. 2006. Effects of30-year-old Aleppo pine plantations on runoff, soil erosion,and plant diversity in a semi-arid landscape in south easternSpain. Catena 65:19–29
Chirino E., J. R. Sanchez, A. Bonet, J. Bellot. 2001. Effect ofafforestation and vegetation dynamics on soil erosion in a semi-arid environment (SE Spain). In Y. Villacampa, C. A. Brebbia,J. L. Uso (eds), Ecosystems and sustainable development III,Wessex Institute of Technology, UK, pp 239–248
Conway T. M., R. G. Lathrop Jr. 2005. Modelling the ecologicalconsequences of land-use policies in an urbanizing region.Environ Manage 35:278–291
Cumming G. S., J. Alcamo, O. Sala, R. Swart, E. M. Bennett,M. Zurek. 2005. Are existing global scenarios consistentwith ecological feedbacks? Ecosystems 8:143–152
Dale V. H., S. Brown, R. A. Haeuber, N. T. Hobbs, N. Huntly,R. J. Naiman, W. E. Riebsame, M. G. Turner, T. J. Valone.2000. Ecological principles and guidelines for managing theuse of land. Ecol Applic 10(3):639–670
Dale M., P. Dale, T. Edgoose. 2002. Using Markov models toincorporate serial dependence in studies of vegetationchange. Acta Oecol 23:261–269
Dale V. H., A. W. King, L. K. Mann, R. A. Washington-AllenMcCord. 1998a. Assessing land-use impacts on naturalresources. Environ Manage 22:203–211
Dale V. H., A. E. Lugo, J. A. MacMahon, S. T. A. Pickett. 1998b.Ecosystem management in the context of large, infrequentdisturbances. Ecosystems 1:546–557
Domene E., D. Sauri. 2003. Modelos urbanos y consumo deagua. El riego de los jardines privados en la regionmetropolitana de Barcelona. Invest Geogr 32:5–17
Gasco G., D. A. Hermosilla, A. Gasco, J. M. Naredo. 2005.Applications of a physical input-output table to evaluatethe development and sustainability of continental waterresources in Spain. Environ Manage 36:59–72
Heylighen F. 1999. The growth of structural and functionalcomplexity during evolution. In F. Heylighen, J. Bollen, A.Riegler. (eds), The evolution of complexity, Kluwer Aca-demic, Dordrecht, pp 17–44
Holling C. S. 1992. Cross-scale morphology, geometry, anddynamics of ecosystems. Ecol Monogr 62:447–502
Ivars J. A., F. Juan. 1998. La descentralizacion de la actividadturıstica en Benidorm. Rev Valenciana Estudis Autonomics25:245–258
IVIA. 2006. PARloc. Programa de asesoramiento en riegolocalizado. Conselleria de Agricultura, Pesca y Alimenta-cion. Servicio Tecnologıa del Riego. Available at http://estaciones.ivia.es/estacion/ (accessed June 23, 2006)
Kachondham Y. 1992. Rapid rural appraisal and rapid assess-ment procedures: A comparison. In N. S. Scrimshaw, G. R.Gleason (eds), Rapid assessment procedures: Qualitativemethodologies for planning and evaluation of health relatedprograms. International Nutrition Foundation for Develop-ing Countries (INFDC), Boston
Kates R. W., T. M. Parris. 2003. Long-term trends and asustainability transition. Proc Natl Acad Sci USA100(14):8062–8067
Krummel J. R., R. H. Gardner, G. Sugihara, R. V. O’Neill, P. R.Coleman. 1987. Landscape patterns in a disturbed environ-ment. Oikos 48:321–324
Lambin E. F., X. Baulies, N. Bockstael, G. Fisher, T. Krug, R.Leemans, E. F. Moran, R. Rindfuss, Y. Sato, D. Skole, B. L.Turner, C. Vogel. 1999. Land-use and land-cover change:Implementation strategy, IGBP Secretariat, Stockholm
Lambin E. F., H. J. Geist. 2001. Global land-use and coverchange: What have we learned so far?. Global ChangeNewslett 46:27–30
Levin S. A. 1992. The problem of pattern and scale in ecology.Ecology 73:1943–1967
Lopez Bellido L. 1998. El uso del agua en los sistemas agrıcolasmediterraneos. In R. M. Jimenez Dıaz, J. Lamo de Espinosa.(eds), Agricultura sostenible, Agrofuturo-Life. EdicionesMundi-Prensa, Madrid, pp 227–248
Maestre F. T. 2001. Industrial development versus environmentalconservation at local scale: A case study from southeasternSpain. Environ Manage 28:149–163
Maestre F. T., J. Cortina. 2004. Are Pinus halepensis plantationsuseful as a restoration tool in degraded semiarid Mediter-ranean areas? Forest Ecol Manage 198:303–317
Martınez-Fernandez, J., F. Lopez-Bermudez, J. Martınez-Fern-andez, A. Romero-Dıaz. 1995. Land use and soil-vegetationrelationships in a Mediterranean ecosystem: El Ardal,Murcia, Spain. Catena 25:153–167
Omerick J. M. 1977. Nonpoint source-stream nutrient levelrelationships: A nationwide study. EPA-600/3-77-105. USEnvironmental Protection Agency, Corvallis, OR
Oxley T., N. Winder, B. S. McIntosh, M. Mulligan, G. Engelen.2004. Integrated modelling & decision support tools: AMediterranean example. Environ Model Software19(11):999–1010
Parris T. M., R. W. Kates. 2003. Characterizing and measuringsustainable development. Annu Rev Environ Resources28:559–586
Pena J., R. M. Martinez, A. Bonet, J. Bellot, A. Escarre. 2005.Cartografıa de las coberturas y usos del suelo de la MarinaBaixa (Alicante) para 1956, 1978 y 2000. Invest Geogr 37:5–17
Raskin P. D. 2005. Global scenarios: Background review forthe millennium ecosystem assessment. Ecosystems 8:133–142
Richards J. F. 1990. Land transformations. In B. L. Turner II etal. (eds), The Earth as transformed by human action, globaland regional changes in the biosphere over the past 300years. Cambridge University Press, London
Romero-Calcerrada, R., G. L. W. Perry. 2004. The role of landabandonment in landscape dynamics in the SPA Encinaresdel rıo Alberche and Cofio, Central Spain, 1984–1999.Landscape Urban Plan 66:217–232
Sanchez J. R., D. Eisenhuth, J. Bellot, A. Bonet, A. Aledo, J. Pena,J. Monsalve, J. C. Tejada. 2004. Los vınculos existentes entrelos recursos hıdricos, la calidad ecologica y el desarrollosostenible de una comunidad humana en la Marina Baixa: unaperspectiva coevolutiva. In IV Congreso Iberico sobreGestion y Planificacion del Agua. Tortosa, Spain
Usher M. B. 1992. Statistical models of succession. In D.C.Glenn-Lewin, R. K. Peet, T. T. Veblen (eds), Plant succes-sion: Theory and prediction. Chapman & Hall, London
Wear D. N., P. Bolstad. 1998. Land-use in Southern Appalachianlandscapes: Spatial analysis and forecast evaluation. Eco-systems 1:575–594
Wissmar R. C., R. K. Timm, M. G. Logsdon. 2004. Effects ofchanging forest and impervious land covers on dischargecharacteristics of watersheds. Environ Manage 34:91–98
422 Environ Manage (2007) 39:412–422
123
Copyright © 2022 FDOKUMEN

