


Bahasa
Halaman
Hukum

Bundesamt für Gesundheit
Sektion Health Technology Assessment
Schwarzenburgstrasse 157
CH-3003 Bern
Schweiz
Tel.: +41 58 462 92 30
E-mail: [email protected]
Federal Department of Home Affairs
Federal Office of Public Health FOPH
Health and Accident Insurance Directorate
Section Health Technology Assessment
Health Technology Assessment (HTA)
HTA report
Title Olmesartan mono- and combination therapy in patients with essential hy-
pertension
Author/Affiliation Ingrid Rosian-Schikuta, Daniela Antony, Stefan Fischer, Astrid Füszl,
Stefan Mathis-Edenhofer, Alexandra Posekany, Heidi Stürzlinger, GÖ For-
schungs- und Planungsgesellschaft mbH, Sophie Brunner-Ziegler, exter-
nal medical expert
2
Technology Olmesartan medoxomil (olmesartan for short)
Date 03.07.2020
Type of technology Pharmaceuticals
Executive summary
Background In the context of a Health Technology Assessment (HTA), the Federal Office of Public
Health was tasked to re-evaluate public reimbursement of olmesartum medoxomilum (olmesartan
for short). Olmesartan belongs to the family of angiotensin II receptor blockers (ARBs), one of the
major classes of drugs recommended for essential hypertension treatment in adult patients. The
efficacy, effectiveness and safety of olmesartan therapy in such patients have been questioned due
to a suspected increased risk of adverse events and missing data on morbidity and mortality out-
comes.
The central research questions for this report addressed the efficacy, effectiveness and safety of
olmesartan in adult patients with essential hypertension compared with other sartans. A second
focus covered their costs, cost effectiveness and the anticipated impact on the health insurance
budget if olmesartan were delisted and substituted by other available sartans. In this context, issues
were also examined as to whether legal, social, ethical or organisational aspects should be consid-
ered in the course of a potential delisting of olmesartan from the reimbursement list.
Method For all domains of the HTA, systematic literature searches were conducted. Seventy-two
primary studies were analysed for effectiveness, efficacy and safety and – whenever possible –
meta-analyses were conducted. For the economic domain, six relevant studies were identified; how-
ever, due to heterogenous study designs and outcomes, the results were not transferable to Swit-
zerland. Therefore, the effects of the one retrospective cohort study identified with long-term out-
comes were used to model the cost effectiveness of olmesartan, valsartan, losartan and irbesartan.
Finally, to estimate the implications of a potential substitution of olmesartan for the health insurance
budget, the allocation method was used, simulating three scenarios. In Scenario 1, the number of
olmesartan preparations was allocated to the other sartans separately for mono- and combination
3
preparations (cost and volume for 2018). The market share of the different packs of alternative sar-
tan preparations was used as the redistribution key. Scenario 2 considered the doses of alternative
drugs equivalent to olmesartan (cost and volume for 2018) and Scenario 3 differed from Scenario 2
in that all reimbursed packs were valued with prices as of 1 August 2019.
Results Efficacy: 17 randomised controlled trials (RCTs, 4’036 participants) compared olmesartan
with other sartans. Olmesartan lowered (systolic as well as diastolic) blood pressure more effectively
compared with losartan and diastolic blood pressure more effectively compared with irbesartan. For
olmesartan versus valsartan, azilsartan, candesartan and telmisartan as well as olmesartan/hydro-
chlorothiazide versus telmisartan/hydrochlorothiazide, the results did not differ significantly.
Effectiveness: Based on one study (Swindle et al.), in a limited subsample (108’567 participants),
olmesartan reduced the risk of the composite outcome of cardiac events (particularly heart failure)
more effectively than valsartan, losartan and irbesartan. We conducted independent statistical anal-
yses of the available data and did not identify any significant differences between olmesartan, losar-
tan, irbesartan and valsartan in any of the outcomes.
Safety: Regarding severe adverse events, we analysed five RCTs (1’721 participants) and 12 cohort
studies (>8’250’000 participants). The comparisons indicated similar risk profiles for olmesartan and
other sartans in the short-term follow-up (RCTs) and the long-term follow-up (cohort studies). The
results were not consistent for enteritis. Two of the cohort studies suggested that olmesartan is
associated with an increased risk of enteropathies compared with other ARBs while two other cohort
studies found no significant difference.
Additionally, we evaluated data from 22 single-arm studies (67’922 participants) as well as the sin-
gle-study arms of 11 RCTs (4’587 participants) and 8 cohort studies (125’669 participants). We
identified no striking patterns regarding the occurrence of serious adverse events in olmesartan
users.
Cost effectiveness: The calculated incremental cost effectiveness ratio (ICER) per patient for cardiac
events was between CHF -20’000 and CHF -25’000 for olmesartan compared with valsartan, losar-
tan and irbesartan (perspective: health insurance; time frame: 1 year). In other words, olmesartan
was associated with higher effects and lower costs for cardiac events. However, the sensitivity anal-
ysis showed that the calculated cost-effectiveness results were not robust.
Budget impact: The total net budget impact (pharmaceutical expenditure and additional outpatient
visits) for the potential substitution of olmesartan with other sartans in the three scenarios resulted
in budget savings of CHF 4.8 million (Scenario 1), further expenses of CHF 1.3 million (Scenario 2)
4
and further expenses of CHF 2.6 million (Scenario 3) for the health insurance. In relation to phar-
maceutical expenditures alone, there would be budget savings of CHF 7.4 million in Scenario 1,
CHF 1.3 million in Scenario 2 and no savings in Scenario 3. The effects of a substitution of olmesar-
tan depended strongly on the availability of alternative preparations within the equivalence groups
(their specific prices and market shares) as well as on expenditure for additional visits to physicians
in the course of changing medication.
Social/ethical issues: To avoid medication adherence problems, timely information for physicians
about a potential disinvestment, the reasons for the decision and available equivalent doses of al-
ternative sartans would be useful.
Organisational issues: It would be necessary to monitor if there were any problems with the delivery
of valsartan products due to nitrosamine impurities and whether they could be provided in sufficient
quantities (especially triple combinations) as this is the only alternative for olmesartan triple combi-
nations.
In addition, patients could expect more frequent visits to their physician during the first year in the
course of switching to another sartan.
Conclusions Olmesartan lowered systolic as well as diastolic blood pressure more effectively com-
pared with losartan and diastolic blood pressure more effectively compared with irbesartan without
showing a statistically significant effect compared with candesartan, telmisartan, telmisartan plus
diuretics, azilsartan and valsartan. Evidence (of low quality) from one retrospective cohort study
hinted at a potential advantage of olmesartan for long-term outcomes like certain cardiac events
compared with losartan, irbesartan and valsartan.
The comparisons of harm indicated similar risk profiles for olmesartan and other sartans in the short-
term follow-up (RCTs) and the long-term follow-up (cohort studies). Regarding enteritis, the results
from four cohort studies (comparing olmesartan with other sartans) were inconsistent in terms of
detecting a higher risk for olmesartan users. Despite occurring only rarely, clinicians should remain
vigilant regarding this potential adverse event.
The cost-effectiveness calculations were not robust enough to draw any universal conclusions when
using olmesartan compared with valsartan, losartan and irbesartan.
The budget impact of substituting olmesartan depended strongly on the prices and market shares
of alternative preparations within the specific equivalence groups and the costs for additional medi-
cal consultations associated with the change in medication. Therefore, if physicians prescribing
5
equivalent doses of the alternative sartans to those of olmesartan, it is more likely that the substitu-
tion of olmesartan would result in increased healthcare expenditures.
To maintain blood pressure control after a potential disinvestment decision, physicians should re-
ceive timely information as well as guidance on prescribing equivalent doses of other sartans. To
avoid access problems, the current market situation should be kept under observation, especially
with regard to the availability of double and triple combinations and potential future recalls of some
valsartan products.
Zusammenfassung
Hintergrund Im Rahmen eines Health Technology Assessment (HTA) überprüft das Bundesamt für
Gesundheit die Vergütungspflicht für Olmesartanum medoxomilum (kurz: Olmesartan). Olmesartan
gehört zur Gruppe der Angiotensin-II-Rezeptorblocker (ARB), einer der wichtigsten Arzneimittelklas-
sen, die zur Behandlung von essentieller Hypertonie bei Erwachsenen empfohlen wird. Wegen des
Verdachts auf ein erhöhtes Risiko für unerwünschte Ereignisse sowie fehlender Daten zu Morbidität
und Mortalität wurden die Wirksamkeit – unter idealen Bedingungen sowie unter Alltagsbedingungen
– und die Sicherheit der Olmesartan-Therapie für diese Patientinnen und Patienten in Frage gestellt.
Die zentralen Forschungsfragen für diesen Bericht befassten sich mit der Wirksamkeit unter idealen
Bedingungen sowie unter Alltagsbedingungen und mit der Sicherheit von Olmesartan bei erwachse-
nen Patientinnen und Patienten mit essentieller Hypertonie im Vergleich zu anderen Sartanen. Ein
zweiter Schwerpunkt lag auf deren Kosten, der Kosteneffektivität und der erwarteten budgetären
Auswirkung für die Krankenversicherung, wenn Olmesartan aus dem Leistungskatalog entfernt und
durch andere verfügbare Sartane ersetzt würde. In diesem Zusammenhang wurde auch geprüft, ob
rechtliche, soziale, ethische oder organisatorische Aspekte bei einer allfälligen Entfernung von Olme-
sartan aus dem Leistungskatalog berücksichtigt werden müssten.
Methode Für alle Bereiche des HTA wurden systematische Literaturrecherchen durchgeführt. 72 Pri-
märstudien wurden im Hinblick auf die Sicherheit und die Wirksamkeit unter idealen Bedingungen
und unter Alltagsbedingungen analysiert, und wo möglich wurden Metaanalysen durchgeführt. Zum
Thema Wirtschaftlichkeit wurden sechs relevante Studien identifiziert; aufgrund der heterogenen Stu-
diendesigns und -resultate waren die Ergebnisse allerdings nicht auf die Schweiz übertragbar. Aus
diesem Grund wurde die Kosteneffektivität von Olmesartan, Valsartan, Losartan und Irbesartan an-
hand der Effekte modelliert, die sich in der einzigen identifizierten retrospektiven Kohortenstudie mit
Langzeitergebnissen zeigten. Schliesslich wurden mittels Allokationsmethode drei Szenarien simu-
6
liert, um die budgetären Auswirkungen einer allfälligen Substitution von Olmesartan für die Kranken-
versicherung abzuschätzen. Im ersten Szenario wurden die Olmesartan-Präparate den anderen
Sartanen gesondert nach Mono- und Kombinationspräparaten zugeordnet (Kosten und Mengen von
2018). Als Verteilschlüssel dienten dabei die Marktanteile der verschiedenen Packungen alternativer
Sartan-Präparate. Das zweite Szenario berücksichtigte die zu Olmesartan äquivalenten Dosen von
alternativen Arzneimitteln (Kosten und Mengen von 2018), ebenso das dritte Szenario mit dem Un-
terschied, dass für alle vergüteten Packungen die Preise gemäss Stichtag 1. August 2019 verwendet
wurden.
Ergebnisse Wirksamkeit unter idealen Bedingungen: 17 randomisierte kontrollierte Studien (RCT,
4036 Teilnehmende) verglichen Olmesartan mit anderen Sartanen. Olmesartan senkte den (systoli-
schen und diastolischen) Blutdruck wirksamer als Losartan und den diastolischen Blutdruck wirksa-
mer als Irbesartan. Beim Vergleich zwischen Olmesartan und Valsartan, Azilsartan, Candesartan und
Telmisartan sowie zwischen Olmesartan/Hydrochlorothiazid und Telmisartan/Hydrochlorothiazid
zeigten sich keine signifikanten Unterschiede.
Wirksamkeit unter Alltagsbedingungen: Gemäss einer Studie (Swindle et al.) reduzierte Olmesartan
in einer begrenzten Teilstichprobe (108 567 Teilnehmende) das Risiko eines kombinierten Outcomes
aus kardialen Ereignissen (insbesondere Herzinsuffizienz) effektiver als Valsartan, Losartan und Ir-
besartan. Wir führten mit den verfügbaren Daten unabhängige statistische Analysen durch. Dabei
fanden wir für keinen der Outcomes signifikante Unterschiede zwischen Olmesartan, Losartan, Irbes-
artan und Valsartan.
Sicherheit: Mit Blick auf schwere unerwünschte Ereignisse wurden 5 RCTs (1721 Teilnehmende) und
12 Kohortenstudien (> 8 250 000 Teilnehmende) analysiert. Die Vergleiche zeigten ähnliche Risi-
koprofile für Olmesartan und andere Sartane bei kurzfristigen (RCT) sowie langfristigen Nachbe-
obachtungszeiten (Kohortenstudien). Für Enteritis waren die Ergebnisse nicht konsistent. Zwei Ko-
hortenstudien deuteten darauf hin, dass Olmesartan im Vergleich zu anderen ARBs mit einem erhöh-
ten Risiko für Enteropathien assoziiert ist. Zwei weitere Kohortenstudien fanden jedoch keinen signi-
fikanten Unterschied.
Zusätzlich evaluierten wir die Daten von 22 einarmigen Studien (67 922 Teilnehmende) sowie einzel-
nen Studienarmen von 11 RCTs (4587 Teilnehmende) und 8 Kohortenstudien (125 669 Teilneh-
mende), fanden jedoch keine auffälligen Muster in Bezug auf das Auftreten von schweren uner-
wünschten Ereignissen bei Olmesartan-Patientinnen und -Patienten.
Kosteneffektivität: Das berechnete inkrementelle Kosteneffektivitäts-Verhältnis (ICER) pro Patient/in
für kardiale Ereignisse betrug zwischen CHF –20 000 und CHF –25 000 für Olmesartan im Vergleich
mit Valsartan, Losartan und Irbesartan (Perspektive: Krankenversicherung; Zeitrahmen: 1 Jahr). Das
7
heisst, dass Olmesartan bezüglich kardialer Ereignisse mit höheren Effekten und tieferen Kosten
assoziiert war. Allerdings zeigte die Sensitivitätsanalyse, dass die Ergebnisse der Kosteneffektivitäts-
berechnungen nicht solide waren.
Budgetäre Auswirkung: Insgesamt ergab die budgetäre Nettoauswirkung (Arzneimittelausgaben und
zusätzliche ambulante Arztkontakte) eines möglichen Ersatzes von Olmesartan durch andere
Sartane in den drei Szenarien für die Krankenversicherung Kosteneinsparungen von CHF 4,8 Millio-
nen (Szenario 1), zusätzliche Kosten in Höhe von CHF 1,3 Millionen (Szenario 2) und zusätzliche
Kosten von CHF 2,6 Millionen (Szenario 3). Betrachtet man nur die Arzneimittelausgaben, so resul-
tieren Kosteneinsparungen in Höhe von CHF 7,4 Millionen in Szenario 1 bzw. CHF 1,3 Millionen in
Szenario 2 sowie keine Einsparungen in Szenario 3. Die Auswirkungen einer Substitution von Olme-
sartan hingen stark von der Verfügbarkeit alternativer Präparate innerhalb der Äquivalenzgruppen
(deren jeweiligen Preisen und Marktanteilen) sowie von den Ausgaben für zusätzliche Arztbesuche
aufgrund der Medikationsumstellung ab.
Soziale/ethische Aspekte: Um Problemen mit der Medikationsadhärenz zuvorzukommen, wäre eine
rechtzeitige Information der Ärzteschaft über eine mögliche Einschränkung der Vergütungspflicht
(«Disinvestment»), die Gründe für den Entscheid und erhältliche Äquivalenzdosen alternativer
Sartane sinnvoll.
Organisatorische Aspekte: Es müsste beobachtet werden, ob es bei der Lieferung von Valsartan-
Produkten aufgrund von Nitrosamin-Verunreinigungen zu Problemen kommen könnte und ob sie in
ausreichenden Mengen lieferbar wären (insbesondere Dreifachkombinationen), da sie die einzige
Alternative für Dreifachkombinationen mit Olmesartan sind.
Ausserdem ist zu erwarten, dass die Zahl der Arztkonsultationen für die Patientinnen und Patienten
im ersten Jahr der Umstellung auf ein anderes Sartan zunehmen wird.
Schlussfolgerungen Olmesartan senkte den systolischen wie auch den diastolischen Blutdruck
wirksamer als Losartan und den diastolischen Blutdruck wirksamer als Irbesartan. Im Vergleich mit
Candesartan, Telmisartan, Telmisartan plus Diuretika, Azilsartan und Valsartan zeigte Olmesartan
hingegen keinen statistisch signifikanten Effekt. Evidenz (von geringer Qualität) aus einer retrospek-
tiven Kohortenstudie deutete auf einen möglichen Vorteil von Olmesartan bei Langzeit-Outcomes wie
gewissen kardialen Ereignissen gegenüber Losartan, Irbesartan und Valsartan hin.
Bei Vergleichen der unerwünschten Wirkungen zeigten Olmesartan und andere Sartane sowohl bei
kurzfristigen (RCT) als auch langfristigen Nachbeobachtungszeiten (Kohortenstudien) ähnliche Risi-
koprofile. Bezüglich der Frage, ob Olmesartan-Patientinnen und -Patienten ein höheres Risiko für
Enteritis aufweisen, waren die Resultate von vier Kohortenstudien (die Olmesartan mit anderen
8
Sartanen verglichen) inkonsistent. Auch wenn dieses unerwünschte Ereignis nur selten eintritt, sollten
Ärztinnen und Ärzte diesbezüglich wachsam bleiben.
Die Kosteneffektivitätsberechnungen waren nicht genügend solide und liessen deshalb keine allge-
meingültigen Schlussfolgerungen zur Olmesartan-Therapie im Vergleich zu Valsartan, Losartan und
Irbesartan zu.
Die budgetäre Auswirkung der Substitution von Olmesartan hing stark von den Preisen und Marktan-
teilen der alternativen Präparate innerhalb der spezifischen Äquivalenzgruppen und den Kosten für
zusätzliche Arztkonsultationen in Zusammenhang mit der Medikationsumstellung ab. Es ist deshalb
wahrscheinlicher, dass die Substitution von Olmesartan zu höheren Gesundheitsausgaben führen
würde, wenn Ärztinnen und Ärzte zu Olmesartan äquivalente Dosen von alternativen Sartanen ver-
schreiben.
Im Falle eines Disinvestment-Entscheids sollten die Ärztinnen und Ärzte rechtzeitig informiert werden
und Hilfestellung zur Verschreibung von Äquivalenzdosen anderer Sartane erhalten. Um Versor-
gungsprobleme zu verhindern, sollte die aktuelle Marktsituation beobachtet werden, insbesondere im
Hinblick auf die Verfügbarkeit von Zweifach- und Dreifachkombinationen und mögliche künftige Rück-
rufe gewisser Valsartan-Produkte.
Résumé
Contexte Dans le cadre des évaluations des technologies de la santé (HTA pour Health Technology
Assessment), l’Office fédéral de la santé publique (OFSP) a été chargé de réévaluer le rembourse-
ment de l’olmesartum medoxomilum (ci-après olmésartan). L’olmésartan appartient à la famille des
antagonistes des récepteurs de l’angiotensine II (ARB pour Angiotensin II Receptor Blockers), qui
entrent dans la composition des principaux traitements recommandés pour l’hypertension essentielle
chez les patients adultes. L’efficacité en conditions réelles et idéales et l’innocuité des traitements à
l’olmésartan chez ces patients ont été remises en question en raison d’une suspicion de risque accru
d’effets indésirables et d’un manque de données concernant la morbidité et le taux de mortalité.
Ce rapport s’est concentré sur l’efficacité en conditions réelles et idéales et l’innocuité de l’olmésartan
chez des patients adultes atteints d’hypertension essentielle en comparaison avec d’autres sartans.
Il a également abordé leurs coûts et leur rapport coût-efficacité, ainsi que l’impact prévu sur le budget
de l’assurance maladie si l’olmésartan était retiré de la liste des spécialités et remplacé par d’autres

9
sartans. Dans ce contexte, le rapport a aussi examiné l’opportunité de considérer des aspects juri-
diques, sociaux, éthiques ou organisationnels dans le cadre d’un retrait de l’olmésartan de la liste
des remboursements.
Méthode Des recherches bibliographiques systématiques ont été effectuées dans tous les domaines
HTA. 72 études primaires ont été passées en revue pour observer l’efficacité en conditions réelles et
idéales et l’innocuité ; des méta-analyses ont été effectuées lorsque cela était possible. 6 études ont
été identifiées comme pertinentes pour le domaine économique ; cependant, leurs conceptions hé-
térogènes ont empêché de transposer les résultats à la Suisse. Pour modéliser le rapport coût-effi-
cacité de l’olmésartan, du valsartan, du losartan et de l’irbésartan, nous avons donc utilisé les effets
de la seule étude de cohorte rétrospective identifiée avec des résultats à long terme. Finalement,
3 scénarios ont été simulés avec la méthode de répartition pour estimer l’impact sur le budget de
l’assurance maladie d’un éventuel remplacement de l’olmésartan. Dans le scénario 1, le nombre de
préparations à l’olmésartan est réparti sur les autres sartans, de manière séparée pour les mono-
préparations et les préparations combinées (coût et volume de 2018). La clé de répartition est basée
sur les parts de marché des différents emballages de préparations à base de sartans alternatifs. Le
scénario 2 considère les doses de produits alternatifs équivalents à l’olmésartan (coût et volume de
2018). Le scénario 3 ne diffère du scénario 2 qu’en ce que les emballages remboursés sont évalués
avec les prix en vigueur au 1er août 2019.
Résultats Efficacité en conditions idéales : 17 essais randomisés contrôlés (RCT pour Randomised
Controlled Trials) comprenant 4036 participants ont comparé l’olmésartan à d’autres sartans. L’olmé-
sartan a abaissé la pression sanguine (systolique et diastolique) plus efficacement que le losartan et
la pression sanguine diastolique plus efficacement que l’irbésartan. Dans les comparaisons entre
l’olmésartan et le valsartan, l’azilsartan, le candésartan et le telmisartan, ainsi qu’entre les combinai-
sons olmésartan/hydrochlorothiazide et telmisartan/hydrochlorothiazide, les résultats ne présentaient
aucune différence significative.
Efficacité en conditions réelles : d’après une étude (Swindle et al.) et dans un sous-échantillon limité
(108 567 participants), l’olmésartan a réduit le risque d’un résultat composite sous forme d’effets car-
diaques (en particulier insuffisance cardiaque) plus efficacement que le valsartan, le losartan et l’ir-
bésartan. Nous avons mené des analyses statistiques indépendantes avec les données disponibles
et n’avons identifié aucune différence significative entre l’olmésartan, le losartan, l’irbésartan et le
valsartan.
Innocuité : en ce qui concerne les effets indésirables graves, nous avons analysé 5 RCT (1721 par-
ticipants) et 12 études de cohorte (> 8 250 000 participants). Les comparaisons ont indiqué des pro-
fils de risque similaires pour l’olmésartan et les autres sartans dans les suivis à court terme (RCT) et
10
les suivis à long terme (études de cohorte). Les résultats concernant l’entérite n’étaient pas constants.
Deux des études de cohortes ont suggéré que l’olmésartan était associé à une augmentation du
risque d’entéropathie par rapport à d’autres ARB, tandis que deux autres études de cohortes n’ont
pas trouvé de différence significative.
De plus, nous avons évalué les données de 22 études à bras unique (67 922 participants), ainsi que
les bras à étude unique de 11 RCT (4587 participants) et 8 études de cohorte (125 669 participants).
Nous n’avons pas identifié de schémas marquants en ce qui concerne la présence d’effets indési-
rables graves chez les utilisateurs d’olmésartan.
Rapport coût-efficacité : le rapport coût-efficacité différentiel calculé par patient pour les problèmes
cardiaques allait de - 20 000 francs à - 25 000 francs pour l’olmésartan comparé au valsartan, au
losartan et à l’irbésartan (perspective de l’assurance maladie, période d’une année). Autrement dit,
l’olmésartan était associé à des meilleurs effets et à des coûts moindres pour les problèmes car-
diaques. Cependant, l’analyse de sensibilité a montré que les résultats calculés ne sont pas solides.
Impact budgétaire : le budget total net (dépenses pharmaceutiques et consultations ambulatoires) de
l’éventuel remplacement de l’olmésartan par d’autres sartans dans les trois scénarios générerait,
pour l’assurance maladie, des économies de l’ordre de 4,8 millions de francs dans le scénario 1 et
des coûts supplémentaires de 1,3 million de francs dans le scénario 2 et de 2,6 millions dans le scé-
nario 3. Les dépenses pharmaceutiques seules entraîneraient des économies de 7,4 millions dans le
scénario 1 et de 1,3 million dans le scénario 2, tandis qu’aucune économie ne serait effectuée dans
le scénario 3. Les effets d’un remplacement de l’olmésartan dépendaient fortement de la disponibilité
de préparations alternatives au sein des groupes équivalents (prix spécifiques et parts de marchés),
ainsi que des dépenses engendrées par les visites médicales supplémentaires au cours du change-
ment de médication.
Questions sociales et éthiques : pour éviter des problèmes d’adhésion aux médicaments, les méde-
cins devraient être informés suffisamment tôt d’un éventuel désengagement, des raisons menant à
cette décision et des doses équivalentes et disponibles de sartans alternatifs.
Questions organisationnelles : il serait nécessaire de surveiller qu’aucun problème ne puisse survenir
dans l’approvisionnement en produits à base de valsartan à cause d’impuretés de nitrosamines, et si
des quantités suffisantes seraient disponibles (particulièrement pour les combinaisons triples), étant
donné qu’il s’agit de la seule alternative aux combinaisons triples d’olmésartan.
De plus, les patients pourraient s’attendre à devoir effectuer davantage de visites médicales pendant
la première année suivant le changement de médication.
11
Conclusions L’olmésartan a abaissé la pression sanguine systolique et diastolique plus efficacement
que le losartan et la pression sanguine diastolique plus efficacement que l’irbésartan, sans indiquer
d’effet statistiquement significatif en comparaison avec le candésartan, le telmisartan, le telmisartan
avec diurétiques, l’azilsartan et le valsartan. Les données (de faible qualité) d’une étude de cohorte
rétrospective ont indiqué un éventuel avantage de l’olmésartan, par rapport au losartan, à l’irbésartan
et au valsartan, pour les résultats à long terme tels que les problèmes cardiaques.
La comparaison des effets négatifs a indiqué des profils de risque similaires pour l’olmésartan et les
autres sartans dans les suivis à court terme (RCT) et les suivis à long terme (études de cohorte). En
ce qui concerne l’entérite, les résultats de quatre études de cohorte (comparaison entre l’olmésartan
et d’autres sartans) étaient inconstants et ne permettaient donc pas de détecter un risque plus élevé
pour les utilisateurs d’olmésartan. Bien qu’il s’agisse d’un phénomène rare, les médecins doivent
rester vigilant à ce propos.
Les calculs du rapport coût-efficacité n’étaient pas assez solides pour tirer des conclusions univer-
selles quant à l’utilisation de l’olmésartan par rapport à celle du valsartan, du losartan et de l’irbésar-
tan.
L’impact budgétaire d’un remplacement de l’olmésartan dépendait fortement des prix et des parts de
marché des préparations alternatives au sein du groupe spécifique d’équivalence, ainsi que des coûts
des consultations médicales supplémentaires qu’un changement de médication entraînerait. En con-
séquence, si les médecins prescrivaient des doses de sartans alternatifs équivalentes à celles de
l’olmésartan, il est probable que le remplacement de l’olmésartan entraînerait une hausse des coûts
de la santé.
Afin de garder un contrôle sur la pression sanguine après une éventuelle décision de désengage-
ment, les médecins devraient recevoir suffisamment tôt des informations à ce propos et sur la ma-
nière de prescrire des doses équivalentes d’autres sartans. Pour éviter des problèmes de disponibi-
lité, la situation actuelle du marché devrait être surveillée, particulièrement en ce qui concerne l’ap-
provisionnement en doubles et triples combinaisons, ainsi que pour d’éventuels rappels futurs de
certains produits à base de valsartan.
12
Table of contents
Table of contents ..................................................................................................................................... 6
List of tables ............................................................................................................................................ 8
List of figures ......................................................................................................................................... 11
Abbreviations and acronyms ................................................................................................................. 12
1 Policy question and context .......................................................................................................... 15
2 Research questions ...................................................................................................................... 16
3 Medical background ...................................................................................................................... 17
4 Technology .................................................................................................................................... 19
4.1 Technology description .................................................................................................... 19
4.2 Alternative technologies ................................................................................................... 20
4.3 Regulatory status/provider ............................................................................................... 20
5 PICO .............................................................................................................................................. 23
6 HTA key questions ........................................................................................................................ 25
7 Effectiveness, efficacy and safety ................................................................................................. 26
7.1 Methodology effectiveness, efficacy and safety .............................................................. 26
7.1.1 Databases and search strategy ........................................................................ 26 7.1.2 Other sources ................................................................................................... 27 7.1.3 Assessment of quality of evidence ................................................................... 27 7.1.4 Methodology data analysis effectiveness, efficacy and safety ......................... 28
7.2 Results effectiveness, efficacy and safety ....................................................................... 28
7.2.1 Evidence base pertaining to effectiveness, efficacy and safety ....................... 28 7.2.2 PRISMA flow diagram ...................................................................................... 30 7.2.3 Evidence table .................................................................................................. 31 7.2.4 Findings efficacy ............................................................................................... 36 7.2.5 Findings effectiveness ...................................................................................... 43 7.2.6 Findings safety ................................................................................................. 45
8 Costs, cost effectiveness and budget impact ................................................................................ 50
8.1 Methodology costs, cost effectiveness and budget impact ............................................. 50
8.1.1 Databases and search strategy ........................................................................ 50 8.1.2 Other sources ................................................................................................... 50 8.1.3 Assessment of quality of evidence ................................................................... 50 8.1.4 Methodology costs, cost efffectiveness and budget impact ............................. 50
8.2 Results costs, cost effectiveness and budget impact ...................................................... 57
8.2.1 PRISMA flow diagram ...................................................................................... 57 8.2.2 Evidence table .................................................................................................. 58 8.2.3 Findings costs................................................................................................... 59 8.2.4 Findings cost effectiveness .............................................................................. 59
13
8.2.5 Findings budget impact .................................................................................... 68
9 Legal, social and ethical issues..................................................................................................... 72
9.1 Methodology legal, social and ethical issues ................................................................... 72
9.1.1 Databases and search strategy ........................................................................ 72 9.1.2 Assessment of the quality of evidence ............................................................. 72 9.1.3 Methodology data analysis legal, social and ethical issues ............................. 72
9.2 Results legal, social and ethical issues ........................................................................... 73
9.2.1 PRISMA flow diagram ...................................................................................... 73 9.2.2 Findings legal issues ........................................................................................ 73 9.2.3 Findings social issues ...................................................................................... 74 9.2.4 Findings ethical issues ..................................................................................... 75
10 Organisational issues .................................................................................................................... 76
10.1 Methodology organisational issues.................................................................................. 76
10.1.1 Databases and search strategy ........................................................................ 76 10.1.2 Other sources ................................................................................................... 76 10.1.3 Assessment of quality of evidence ................................................................... 76 10.1.4 Methodology data analysis organisation issues ............................................... 76
10.2 Results organisational issues .......................................................................................... 77
10.2.1 PRISMA flow diagram ...................................................................................... 77 10.2.2 Findings organisational issues ......................................................................... 77
11 Discussion ..................................................................................................................................... 80
12 Conclusions ................................................................................................................................... 84
13 References .................................................................................................................................... 85
14 Appendices.................................................................................................................................... 96
14.1 Appendix A: Regulatory status ........................................................................................ 96
14.2 Appendix B: Selection criteria and search strategy ....................................................... 101
14.3 Appendix C: Effectiveness/Safety.................................................................................. 115
14.4 Appendix D: Costs, cost effectiveness and budget impact ........................................... 120
14.5 Appendix E: Quality assessment economic studies ...................................................... 137

14
List of tables
Table 1: Classification of hypertension grades as recommended by the ESC/ESH guidelines ........ 18
Table 2: Overview of the indications* for sartans in Switzerland approved by Swissmedic .............. 21
Table 3: Current national coverage policy for OLM (mono- and combination therapy) in selected
European countries .............................................................................................................. 22
Table 4: PICO for efficacy/effectiveness/safety/economic aspects ................................................... 23
Table 5: Study characteristics of comparative effectiveness/efficacy studies ................................... 32
Table 6: Study characteristics of comparative safety studies ............................................................ 34
Table 7: Synthesis of evidence of comparative efficacy/effectiveness based on randomised
controlled trials (GRADE assessment) ................................................................................ 41
Table 8: Synthesis of evidence of comparative long-term outcomes on efficacy/effectiveness
based on one study .............................................................................................................. 44
Table 9: Synthesis of evidence of comparative long-term outcomes on safety based on
RCTs/cohort studies ............................................................................................................ 47
Table 10: Scenarios for sensitivity analysis ......................................................................................... 53
Table 11: Fictitious example of the allocation method with a distribution key: market share .............. 55
Table 12: Probability of a cardiac event per patient (within at least one year) .................................... 60
Table 13: Incremental effect (difference in probability of a cardiac event per patient) ........................ 60
Table 14: Utilisation data on the use and costs per pharmaceutical and patient (in CHF 2018) ........ 61
Table 15: Treatment costs per patient (in CHF 2018) ......................................................................... 62
Table 16: Incremental costs per patient (difference in treatment costs, in CHF 2018) ...................... 62
Table 17: Number needed to treat per additional event averted (rounded) ........................................ 63
Table 18: Costs of OLM per event averted per year and patient (comp. to VAL, LOS and IRB) ........ 64
Table 19: ICER (incremental costs per incremental effect) ................................................................. 66
Table 20: Sartans: reimbursed mono-preparations in Switzerland and authorisation status .............. 96
Table 21: Sartans: reimbursed combination preparations and authorisation status in Switzerland .... 98
Table 22: Search strategies for EFF, SAF and ECO (search for scoping report incl. search
update) ............................................................................................................................... 101
15
Table 23: Search strategies for observational studies for SAF (widened search for HTA report) ..... 105
Table 24: Search strategies for ethical and social domain (widened search for HTA report) ........... 107
Table 25: Search strategies for organisational domain (widened search for HTA report) ................. 110
Table 26: Selection criteria for EFF, SAF and ECO .......................................................................... 113
Table 27: Documentation of queries .................................................................................................. 114
Table 28: Study quality assessment for RCTs: outcome diastolic blood pressure ............................ 115
Table 29: Study quality assessment for cohort studies: outcome enteropathy and long-term
effectiveness outcomes ..................................................................................................... 116
Table 30: Study characteristics and SAE occurrences in single-arm studies as well as single
arms of RCTs/cohort studies ............................................................................................. 116
Table 31: Case-control studies evaluating OLM-induced cases of enteritis ...................................... 119
Table 32: Equivalent doses ................................................................................................................ 120
Table 33: Evidence table domain ECO (systematic literature search) .............................................. 121
Table 34: Results average cost/pack 2018 ........................................................................................ 125
Table 35: Costs per event (in CHF 2018, per patient, per year) ........................................................ 126
Table 36: Effects per pharmaceutical (part I) ..................................................................................... 127
Table 37: Effects per pharmaceutical (part II) .................................................................................... 127
Table 38: Sensitivity analysis results for incremental costs and effects (Scenario A) ....................... 128
Table 39: Sensitivity analysis results for incremental costs and effects (Scenario B) ....................... 129
Table 40: Mono-preparations: pharmaceutical expenditures and packs reimbursed by health
insurance in Switzerland in 2018 ....................................................................................... 130
Table 41: Fixed-dose combinations: pharmaceutical expenditures and packs reimbursed by
health insurance in Switzerland in 2018 ............................................................................ 130
Table 42: Scenario 1: budget impact – substitution of OLM, allocation corresponding to market
shares 2018 (at single product level, base total market share mono- or combination
preparations, valued at average cost/pack 2018) .............................................................. 131
Table 43: Scenario 2: budget impact – substitution of OLM with equivalent doses and allocation
with market share based on equivalence group, valued at average cost/pack 2018 ........ 133

16
Table 44: Scenario 3: budget impact – substitution of OLM with equivalent doses and allocation with
market share based on equivalence group, valued with list prices as of 1 August 2019 .. 135
17
List of figures
Figure 1: Core drug treatment strategy for uncomplicated hypertension............................................ 19
Figure 2: PRISMA flow diagram for the domains EFF/SAF ................................................................ 30
Figure 3: Meta-analysis of systolic blood pressure OLM versus LOS ................................................ 36
Figure 4: Meta-analysis of systolic blood pressure OLM versus IRB ................................................. 37
Figure 5: Meta-analysis of systolic blood pressure OLM versus VAL ................................................. 38
Figure 6: Meta-analysis of diastolic blood pressure OLM versus LOS ............................................... 39
Figure 7: Meta-analysis of diastolic blood pressure OLM versus IRB ................................................ 39
Figure 8: Meta-analysis of diastolic blood pressure OLM versus VAL ............................................... 40
Figure 9: Comparative safety of OLM versus LOS ............................................................................. 45
Figure 10: PRISMA flow diagram for the domain ECO ........................................................................ 57
Figure 11: Costs per event (in CHF 2018) ............................................................................................ 61
Figure 12: Cost-effectiveness ratio of OLM (compared with VAL, LOS and IRB) ................................ 65
Figure 13: Results of the sensitivity analysis ........................................................................................ 67
Figure 14: Overview of budget impact scenarios 1-3, in million CHF* .................................................. 70
Figure 15: PRISMA flow diagram for the domains LEG/SOC/ETH ...................................................... 73
Figure 16: PRISMA flow diagram for the domain ORG ........................................................................ 77
18
Abbreviations and acronyms
ACE inhibitors Angiotensin-converting enzyme inhibitors
AHRQ Agency for Healthcare Research and Quality
ARBs Angiotensin II receptor blockers
AZI Azilsartan
BP Blood pressure
CADTH Canadian Agency for Drugs and Technologies in Health
CAN Candesartan
CCA Cost-consequences analysis
CCBs Calcium channel blockers
CEA Cost-effectiveness analysis
CI Confidence interval
CHEC Consensus Health Economic Criteria (CHEC) Checklist
DALYs Disability adjusted life years
EMA European Medicines Agency
EPR Eprosartan
ERP External reference price
ESC European Society of Cardiology
ESH European Society of Hypertension
EUnetHTA European Network for Health Technology Assessment
FDA Food and Drug Administration
FOPH Federal Office of Public Health
GRADE Grading of Recommendations, Assessment, Development and Evaluations
HAS Haute Autorité de Santé
HCTZ Hydrochlorothiazide (diuretics)
HMOD Hypertension-mediated organ damage
HTA Health Technology Assessment
HTAi Health Technology Assessment International
ICD International Statistical Classification of Diseases and Related Health Problems
ICER Incremental cost-effectiveness ratio
INAHTA International Network of Agencies for Health Technology Assessment
IQWIG Institut für Qualität und Wirtschaftlichkeit im Gesundheitswesen (The indepen-
dent Institute for Quality and Efficiency in Health Care)
19
IRB Irbesartan
ISPOR The International Society for Pharmaeconomics and Outcome Research
KLV Krankenpflege-Leistungsverordnung (Healthcare Benefits Ordinance)
LOS Losartan
LS List of specialities (Spezialitätenliste)
MeSH Medical Subject Headings
MSAC Medical Services Advisory Committee (Australian government)
MSD Merck Sharp & Dohme
N.A. Not applicable
NICE National Institute for Health and Care Excellence (UK)
OLM Olmesartan
PBAC The Pharmaceutical Benefits Advisory Committee (Australia)
PICO Population, Intervention, Comparator/Control, Outcome
QALY Quality-adjusted life year
RCT Randomised controlled trial
RePEc Research Papers in Economics
TEL Telmisartan
US/A United States (of America)
VAL Valsartan
WHO World Health Organisation
WZW W (Wirksamkeit: “effectiveness”), Z (Zweckmässigkeit: “appropriateness”),
W (Wirtschaftlichkeit: “economic efficiency”)
ZIN Zorginstituut Nederland (The National Health Care Institute)
20
Objective of the report
The objective of a health technology assessment (HTA) is to generate a focused assessment of various
aspects of a health technology. The analytical methods applied to assess the value of using a health
technology are described. The analytical process is comparative, systematic, transparent and involves
multiple stakeholders. The domains covered in an HTA report include clinical effectiveness and safety,
costs, cost effectiveness and budget impact as well as legal, social, ethical and organisational issues.
The purpose is to inform healthcare policy and decision making to promote an efficient, sustainable,
equitable and high-quality healthcare system.
21
1 Policy question and context
The Federal Office of Public Health (FOPH) is reviewing the public reimbursement of olmesartum me-
doxomilum (OLM for short), a therapy for adult patients with essential hypertension, because its efficacy,
effectiveness and safety have been questioned by the applicant santésuisse. One reason for the as-
sessment comparing OLM with other sartans was the suggestion of the transparency committee of the
Haute Autorité de Santé (HAS)1 in France to exclude olmesartan (mono- and combination therapy) from
its reimbursement list due to an increased risk of serious enteropathies (diseases of the intestinal tract),
an increased risk of hospitalisation for intestinal malabsorption and OLM not demonstrating effects on
morbidity and mortality (only on blood pressure reduction). The recommendation from April 2015 be-
came effective on 31 December 2016.
The process to evaluate health technologies involves multiple phases, (1) the pre-scoping phase, (2)
the scoping phase and (3) the HTA phase. This document represents the outcome of the HTA phase.
22
2 Research questions
The central research questions for this report are:
- What are the efficacy, effectiveness and safety of OLM mono- and combination therapy in adult
patients with essential hypertension compared with mono- and combination therapy with other
available sartans?
- What are the costs and cost effectiveness of OLM mono- and combination therapy in adult pa-
tients with essential hypertension compared with mono- and combination therapy with other avail-
able sartans? What is the budget impact for the health insurance under the assumption that OLM
will be substituted by other available sartans?
23
3 Medical background
Essential – also called primary or idiopathic – arterial hypertension is defined as elevated systemic
arterial blood pressure (BP) for which no causal organic pathology can be identified. The aetiology of
essential hypertension is multifactorial, including genetic factors, lifestyle and environmental conditions
as well as metabolic risk factors such as obesity and impaired glucose or lipid metabolism. From a
pathophysiological point of view, elevated BP may be the result of either cardiac volume overload or,
more likely, of enhanced resistance in the blood vessel system, each exacerbating the other in a vicious
circle.2
Arterial hypertension affects 30 to 40 per cent of the world population.3 Essential hypertension may be
asymptomatic for many years and only a minority of affected patients complain about unspecific symp-
toms, such as morning headaches (cephalea), nausea, tinnitus, shortness of breath (dyspnoea), fatigue
or nosebleeds (epistaxis). However, chronic arterial hypertension is associated with premature deaths,
increased disability-adjusted life years (DALYs) and cardiovascular complications such as ischaemic
heart disease and stroke as well as cognitive impairments.4-6
Diagnosis: BP is measured in millimetres of mercury (mmHg) and is expressed as two numbers. A
normal systolic BP is between 120 and 129 mmHg and a normal diastolic BP between 80 and 84 mmHg.
Essential hypertension is defined as the elevation of systolic and diastolic BP to a cut-off value at which
the benefit of diagnostic and therapeutic measures outweighs the risk of these measures.2
The diagnosis of essential hypertension pursues three major goals:
1. quantification of the severity grade of the disease,
2. systemic exclusion of potential secondary aetiological causes, such as pauses in breathing while
asleep (sleep apnoea), abnormal narrowing (stenosis) of the renal arteries, a tumour of the adrenal
gland tissue and pregnancy- or drug-induced BP elevation, and
3. classification of the patient’s overall cardiovascular risk profile by assessing cardiovascular comor-
bidities and early hypertension-mediated organ damage.
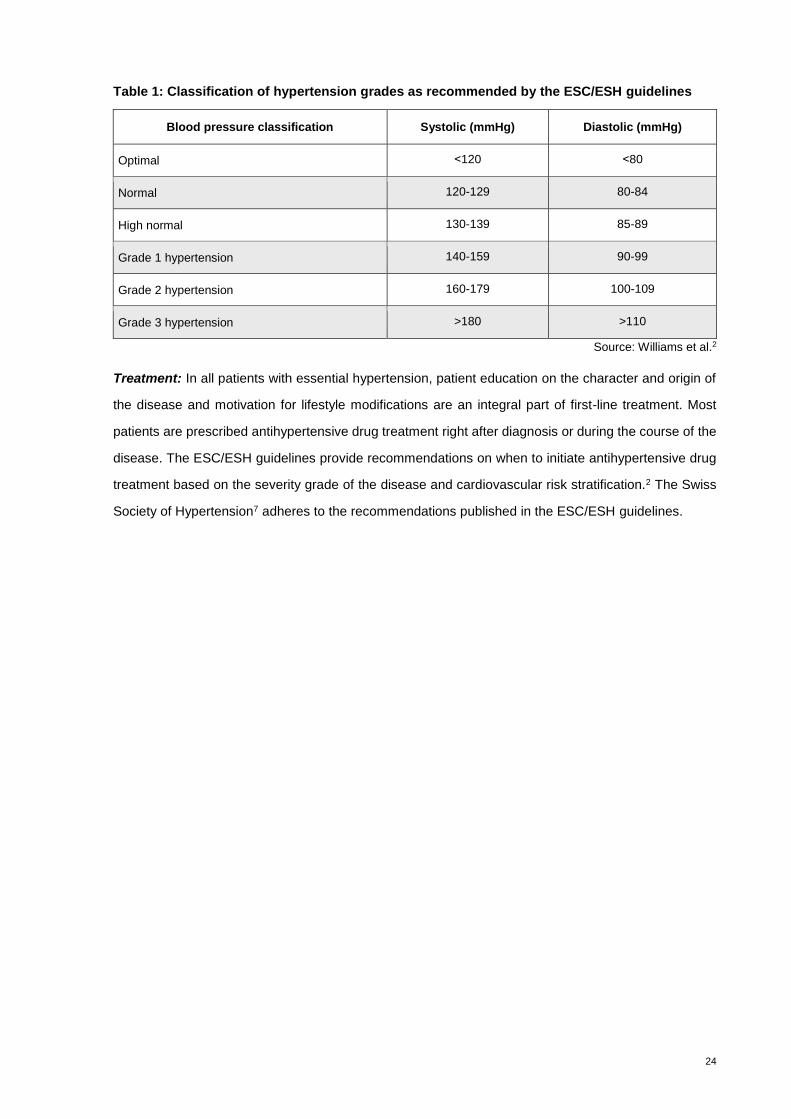
It is recommended to base the diagnosis of hypertension on repeated BP measurements. The guidelines
for the management of essential hypertension published by the European Society of Cardiology (ESC)
and the European Society of Hypertension (ESH) recommend classifying BP as optimal, normal, high-
normal or hypertension grades 1 to 3, see Table 1.2
24
Table 1: Classification of hypertension grades as recommended by the ESC/ESH guidelines
Blood pressure classification Systolic (mmHg) Diastolic (mmHg)
Optimal ˂120 ˂80
Normal 120-129 80-84
High normal 130-139 85-89
Grade 1 hypertension 140-159 90-99
Grade 2 hypertension 160-179 100-109
Grade 3 hypertension >180 >110
Source: Williams et al.2
Treatment: In all patients with essential hypertension, patient education on the character and origin of
the disease and motivation for lifestyle modifications are an integral part of first-line treatment. Most
patients are prescribed antihypertensive drug treatment right after diagnosis or during the course of the
disease. The ESC/ESH guidelines provide recommendations on when to initiate antihypertensive drug
treatment based on the severity grade of the disease and cardiovascular risk stratification.2 The Swiss
Society of Hypertension7 adheres to the recommendations published in the ESC/ESH guidelines.

25
4 Technology
4.1 Technology description
There are five major classes of drugs recommended for antihypertensive pharmacotherapy, including
angiotensin II receptor blockers (ARBs), angiotensin-converting enzyme inhibitors (ACE inhibitors), beta
blockers, calcium channel blockers (CCBs) and diuretics (hydrochlorothiazide and thiazide-like diuretics,
HCTZ).8 9 ARBs and ACE inhibitors are amongst the most widely used antihypertensive substances
worldwide. The core treatment algorithm for “uncomplicated” hypertension, focusing on the five major
antihypertensive classes of drugs, is presented in Figure 1 and can be adapted for patients with con-
comitant coronary artery disease, chronic kidney disease, heart failure and atrial fibrillation.2
Combination therapy (two or more pharmaceutical agents in a single pill) is recommended in the current
ESC/ESH guidelines for most hypertensive patients because the reduction in the number of pills taken
on a daily basis improves adherence and increases the rate of BP control (this recommendation is sup-
ported by data from RCTs).2
Figure 1: Core drug treatment strategy for uncomplicated hypertension
ACEi = angiotensin-converting enzyme inhibitor; ARB = angiotensin receptor blocker; CCB = calcium channel blocker; MI = myocardial infarction; o.d. = omni die (every day)
Source: Williams et al.2
Sartans: Sartans are ARBs that selectively block the binding of angiotensin II to the AT1 subtype of
angiotensin-II receptors.10 With respect to their BP-lowering effect, they mainly act by vasodilation (by
antagonising the vasoconstrictive effect of angiotensin) and reducing the secretion of vasopressin and
aldosterone.11 12 Despite the fact that all ARBs share a common mechanism of action, they differ with
respect to their pharmacological and dosing profiles.13
26
OLM was developed in 1995 and approved in Switzerland in 2005 as a mono- and combination therapy
in patients with essential hypertension.14 OLM is administered as a prodrug that is converted to its active
metabolite to achieve its BP-lowering effect. The half-life of OLM is between 10 and 15 hours. The
antihypertensive effect of regular therapy starts within 2 weeks of the drug first being administered and
reaches its maximum approximately 8 weeks after the start of therapy. Important contraindications for
treatment with OLM include pregnancy and biliary obstruction.15 The most frequently reported adverse
events include headaches (cephalea, 7.7%), influenza-like symptoms (4.0%) and vertigo (3.7%). Rare
adverse events include sprue-like enteropathy characterised by severe, chronic diarrhoea with signifi-
cant weight loss, nausea, vomiting, abdominal pain and anaemia.16
The recommended starting dose of OLM is 10 mg once daily. In patients whose BP cannot be ade-
quately controlled with a dose of 10 mg, the dose may be increased to 20 mg once daily. If a further
reduction in BP is desired, the dose can be increased to a maximum of 40 mg daily or an additional
therapy with hydrochlorothiazide (HCTZ) can be prescribed.16
4.2 Alternative technologies
Alternative pharmaceuticals to OLM mono- or combination therapy include all other mono- or combina-
tion therapies with other ARBs, ACE inhibitors, beta blockers, CCBs and HCTZ. Patients whose BP
cannot be controlled effectively by first-line pharmaceutical therapy can be prescribed alpha-receptor
blockers, spironolactone, centrally acting agents, mineral corticoid receptor antagonists or minoxidil
(second-line pharmaceutical therapy).2 17
4.3 Regulatory status/provider
Olmetec™ (holder of marketing authorisation: Daiichi Sankyo AG) was approved in 2005. Generic drugs
have been available for OLM since 2016.
In the group of sartans (ARBs), eight monoactive substances with 39 different brand names (without
differentiation by dosage or package size) have been authorised by the Swiss Agency for Therapeutic
Products (Swissmedic) and are reimbursable by the compulsory health insurance (as of 30 July 2019).
Alternative sartans for OLM monotherapy are losartan (LOS), eprosartan (EPR), valsartan (VAL),
irbesartan (IRB), candesartan (CAN), telmisartan (TEL) and azilsartan (AZI). For details, see Appendix
A, Table 20.
In total 13 substances with 56 different brand names (without differentiation by dosage or package size)
are available containing ARBs in combination with the diuretic hydrochlorothiazide (HCTZ) or calcium
channel blockers (CCBs) in fixed doses.
27
For combination therapy with HCTZ, OLM, LOS, EPR, VAL, IRB, CAN, TEL and AZI are provided; for
OLM combination therapy with CCBs, two substances – VAL with CCBs and TEL with CCBs – are
provided. For the OLM triple combination with CCBs and HCTZ, only VAL with CCBs and HCTZ is
available (See Appendix A, Table 21).
All pharmaceuticals approved by Swissmedic and listed in the so-called Spezialitätenliste (SL) are re-
imbursable. The cost share for patients is 10 per cent of the costs in excess of the annual deductible: If
the SL contains more than one pharmaceutical with the same substance, co-payment for patients can
be up to 20 per cent. The co-payments are normally limited to CHF 700 per year.
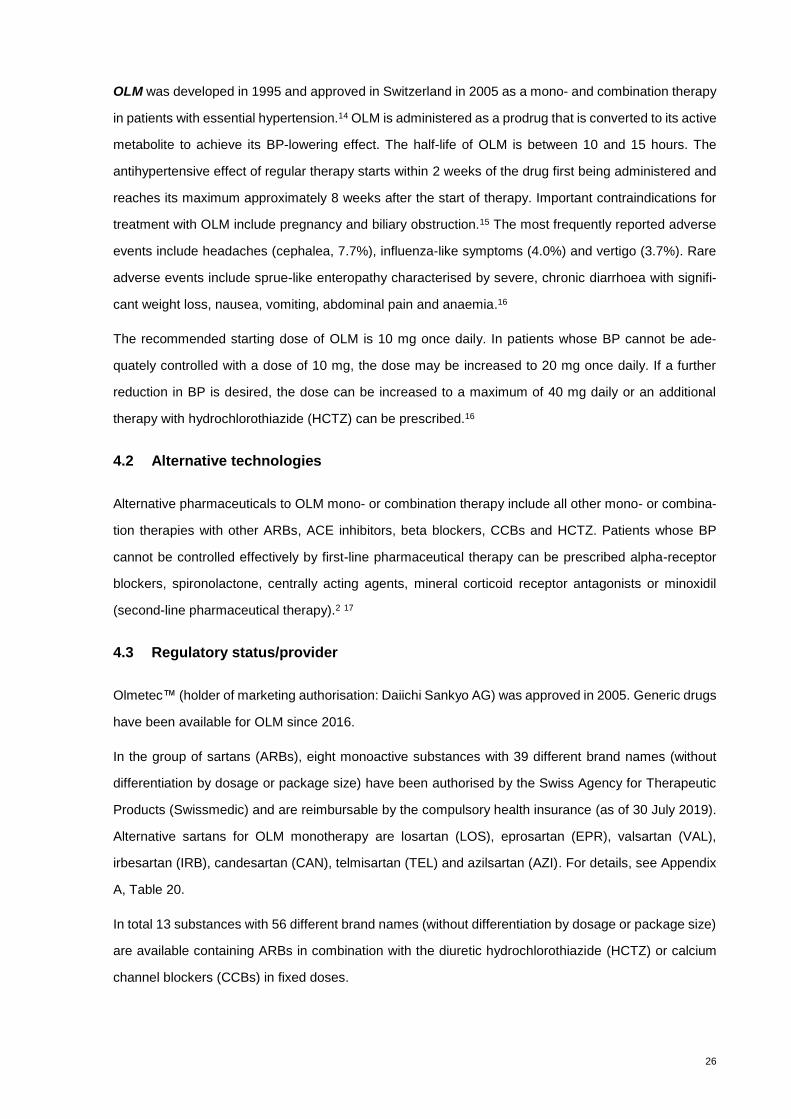
Table 2 presents the approved indications for sartans.
Table 2: Overview of the indications* for sartans in Switzerland approved by Swissmedic
ATC code Substance Essential hypertension
Heart failure
Diabetic nephropa-
thy
Prevention of stroke
Cardiovas-cular risk reduction
Following myocar-
dial infarc-tion
C09CA01 LOS Adults Yes Yes Yes No No
C09CA02 EPR Adults No No No No No
C09CA03 VAL Children, adults Yes** No No No Yes
C09CA04 IRB Adults No Yes*** No No No
C09CA06 CAN Children, adults Yes No No No No
C09CA07 TEL Adults No No No Yes No
C09CA08 OLM Adults No No No No No
C09CA09 AZI Adults No No No No No
ATC = anatomic therapeutic classification; AZI = azilsartan; CAN = candesartan; EPR = eprosartan; IRB = irbesartan; LOS = losartan; TEL = telmisartan; VAL = valsartan * According to information for medical professionals (“Fachbeilage”) of the first approved pharmaceutical ** For patients unable to take ACE inhibitors *** For the treatment of renal disease in patients with hypertension and type II diabetes mellitus with elevated
serum creatinine or micro-albuminuria or clinical albuminuria as part of antihypertensive treatment. Note: Regarding combination preparations in general, the information for medical professionals states that combination preparations should be given if monotherapy is not sufficient.
Source: www.swissmedicinfo.ch as of 30 July 2019
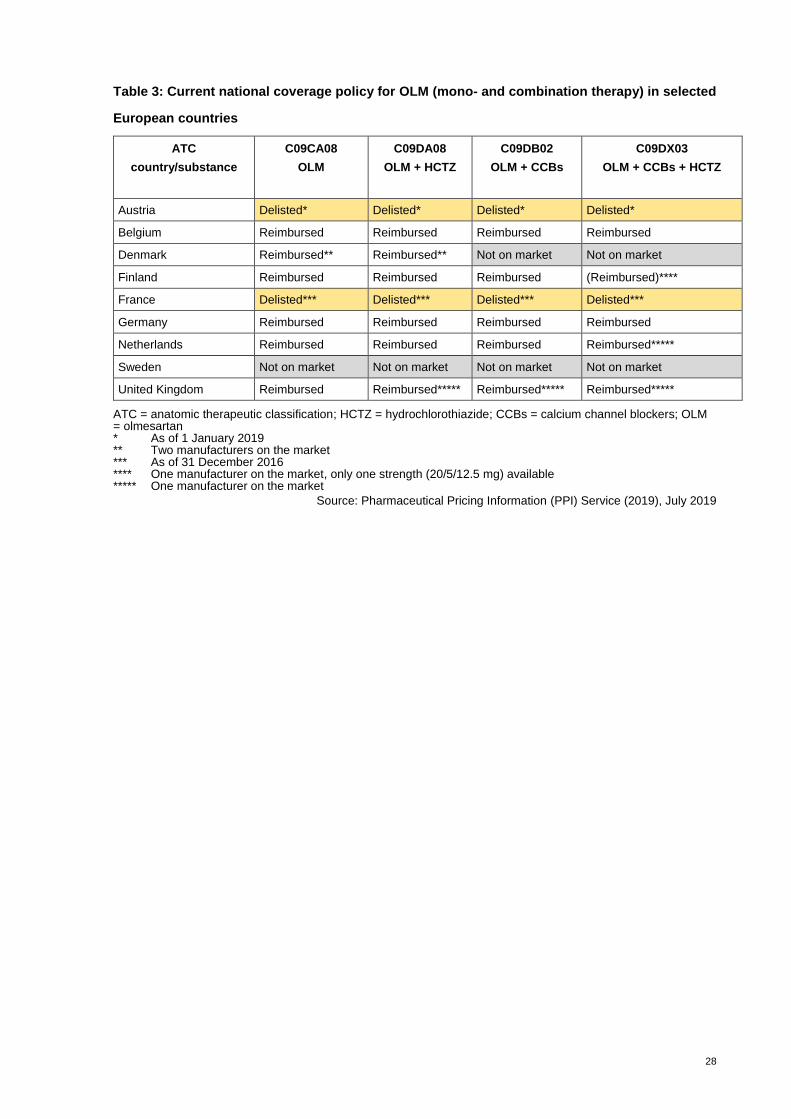
A compilation of national coverage policy for OLM in selected European countries is provided in Table 3.
The countries included are those named in Art. 34a KLV (Krankenpflege-Leistungsverordnung,
Healthcare Benefits Ordinance) with whom an external reference price (ERP) is determined during the
triennial review of all pharmaceuticals included in the Spezialitätenliste (SL) carried out by the Federal
Office of Public Health (FOPH).
28
Table 3: Current national coverage policy for OLM (mono- and combination therapy) in selected
European countries
ATC
country/substance
C09CA08
OLM
C09DA08
OLM + HCTZ
C09DB02
OLM + CCBs
C09DX03
OLM + CCBs + HCTZ
Austria Delisted* Delisted* Delisted* Delisted*
Belgium Reimbursed Reimbursed Reimbursed Reimbursed
Denmark Reimbursed** Reimbursed** Not on market Not on market
Finland Reimbursed Reimbursed Reimbursed (Reimbursed)****
France Delisted*** Delisted*** Delisted*** Delisted***
Germany Reimbursed Reimbursed Reimbursed Reimbursed
Netherlands Reimbursed Reimbursed Reimbursed Reimbursed*****
Sweden Not on market Not on market Not on market Not on market
United Kingdom Reimbursed Reimbursed***** Reimbursed***** Reimbursed*****
ATC = anatomic therapeutic classification; HCTZ = hydrochlorothiazide; CCBs = calcium channel blockers; OLM = olmesartan * As of 1 January 2019 ** Two manufacturers on the market *** As of 31 December 2016 **** One manufacturer on the market, only one strength (20/5/12.5 mg) available ***** One manufacturer on the market
Source: Pharmaceutical Pricing Information (PPI) Service (2019), July 2019
29
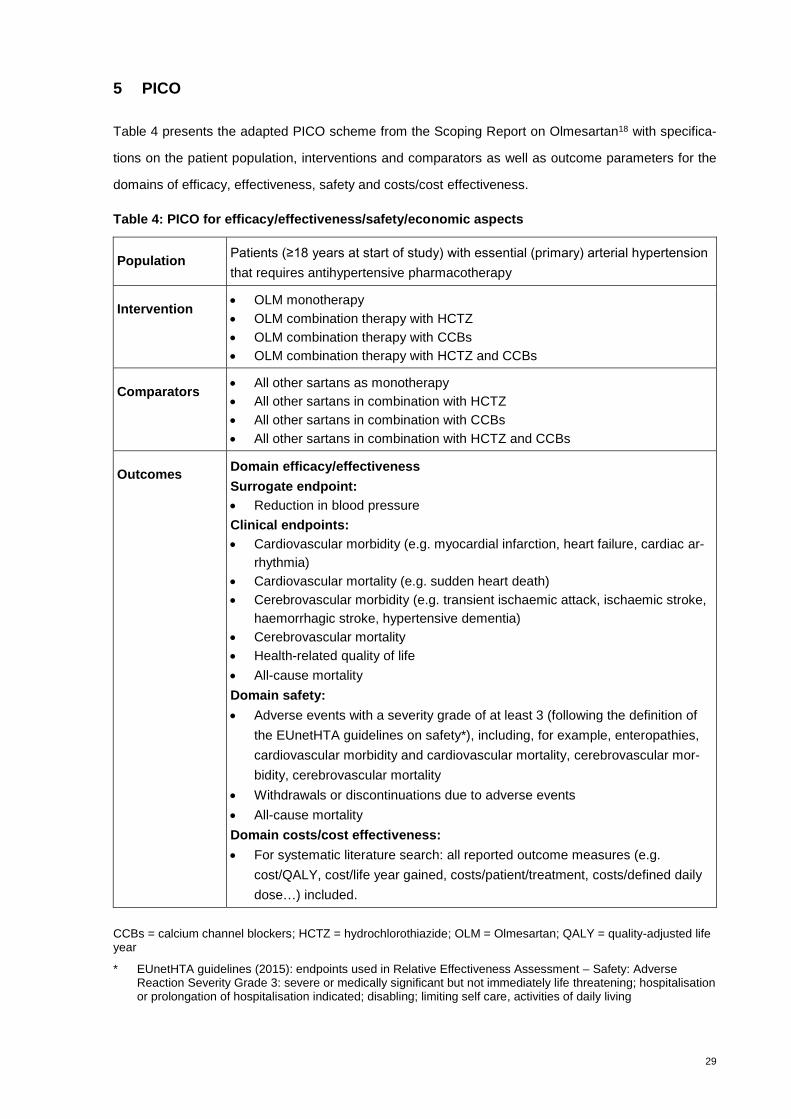
5 PICO
Table 4 presents the adapted PICO scheme from the Scoping Report on Olmesartan18 with specifica-
tions on the patient population, interventions and comparators as well as outcome parameters for the
domains of efficacy, effectiveness, safety and costs/cost effectiveness.
Table 4: PICO for efficacy/effectiveness/safety/economic aspects
Population Patients (≥18 years at start of study) with essential (primary) arterial hypertension
that requires antihypertensive pharmacotherapy
Intervention OLM monotherapy
OLM combination therapy with HCTZ
OLM combination therapy with CCBs
OLM combination therapy with HCTZ and CCBs
Comparators All other sartans as monotherapy
All other sartans in combination with HCTZ
All other sartans in combination with CCBs
All other sartans in combination with HCTZ and CCBs
Outcomes Domain efficacy/effectiveness
Surrogate endpoint:
Reduction in blood pressure
Clinical endpoints:
Cardiovascular morbidity (e.g. myocardial infarction, heart failure, cardiac ar-
rhythmia)
Cardiovascular mortality (e.g. sudden heart death)
Cerebrovascular morbidity (e.g. transient ischaemic attack, ischaemic stroke,
haemorrhagic stroke, hypertensive dementia)
Cerebrovascular mortality
Health-related quality of life
All-cause mortality
Domain safety:
Adverse events with a severity grade of at least 3 (following the definition of
the EUnetHTA guidelines on safety*), including, for example, enteropathies,
cardiovascular morbidity and cardiovascular mortality, cerebrovascular mor-
bidity, cerebrovascular mortality
Withdrawals or discontinuations due to adverse events
All-cause mortality
Domain costs/cost effectiveness:
For systematic literature search: all reported outcome measures (e.g.
cost/QALY, cost/life year gained, costs/patient/treatment, costs/defined daily
dose…) included.
CCBs = calcium channel blockers; HCTZ = hydrochlorothiazide; OLM = Olmesartan; QALY = quality-adjusted life year
* EUnetHTA guidelines (2015): endpoints used in Relative Effectiveness Assessment – Safety: Adverse Reaction Severity Grade 3: severe or medically significant but not immediately life threatening; hospitalisation or prolongation of hospitalisation indicated; disabling; limiting self care, activities of daily living
30
Population
The target population consists of adult patients (≥18 years) of any gender and ethnicity with essential
hypertension. In this population, co-morbidities such as cardiovascular disease (coronary and cerebro-
vascular disease, peripheral artery disease, diabetes, dyslipidaemia) or chronic kidney disease are com-
mon. Study populations with existing co-morbidities were not excluded from the analyses when the pri-
mary target of the study was the treatment of essential hypertension. In summary, co-morbities were
not systematically excluded.
Intervention
The interventions under assessment are all OLM mono- and combination preparations (OLM with HCTZ,
OLM with CCBs or OLM with HCTZ and CCBs).
Comparator
The above interventions are compared to all other sartans as monotherapy, all other sartans in double
combination with HCTZ or CCBs and all other sartans in triple combination with HCTZ and CCBs.
Outcomes
Critical and important outcomes for the domains of efficacy and effectiveness include cardiovascular
and cerebrovascular mortality, cardiovascular and cerebrovascular morbidity, health-related quality of
life outcomes and all-cause mortality. BP reduction is also taken into account but being a surrogate
outcome, it is considered an outcome of low importance.
Outcomes for safety are any adverse event with a severity grade of at least 3, withdrawals due to ad-
verse events and all-cause mortality.
In general, critical and important outcomes for the costs/cost effectiveness domain include costs, cost
per quality-adjusted life year (QALY), cost per life year gained, cost per event averted and budget im-
pact.
For effectiveness/efficacy, evidence from direct comparisons (head to head) is included while for the
safety domain, evidence from either RCTs (direct comparisons) or observational studies is incorporated.
For the latter, prospective and retrospective cohort studies (direct comparisons) and case-control stud-
ies as well as single-arm studies or single OLM study arms from RCTs or cohort studies are included to
assess the prevalence of adverse events (no comparison group).
31
6 HTA key questions
To evaluate the technology, the following key questions are addressed covering central HTA domains
as designated by the EUnetHTA core model (clinical effectiveness, safety, costs, cost effectiveness,
budget impact, legal, social, ethical and organisational aspects):
1. Is OLM effective/efficacious compared with other sartans?
2. Is OLM safe compared with other sartans?
3. What are the costs of OLM?
4. What would the budget impact be if OLM were to be substituted by other sartans?
5. How cost effective is OLM compared with other sartans?
6. Would there be any legal, social or ethical issues if OLM were to be delisted from the reimburse-
ment list?
7. Would there be any organisational issues to consider if OLM were to be delisted from the reim-
bursement list?
32
7 Effectiveness, efficacy and safety
7.1 Methodology effectiveness, efficacy and safety
7.1.1 Databases and search strategy
We conducted a systematic literature search in the databases MEDLINE, EMBASE, Cochrane System-
atic Reviews, Cochrane Central Register of Controlled Trials and the NHS Economic Evaluation data-
bases from their inception up to June 2019 (including an update of the literature search for the scoping
report). The (basic) search was performed for all domains. Search terms included a combination of
keywords and medical subject headings (MeSH) relating to the intervention (OLM mono- and combina-
tion therapy), disease (essential hypertension) and study type (e.g. randomised controlled trials, cohort
studies, case-control studies, economic evaluation, cost analysis). We conducted the search in English
and set no time restrictions concerning the year of publication. Both German and English publications
were eligible for inclusion. The detailed search strategies are outlined in Appendix B, Table 22 and Table
23.
Table 26 lists the study inclusion and exclusion criteria for each domain (efficacy, effectiveness, safety
and the economic domain). For the efficacy domain, we included evidence from RCTs (direct compari-
sons) with a follow-up of at least 8 weeks (according to drug information: “The antihypertensive effect of
olmesartan medoxomil occurs essentially within 2 weeks after the start of treatment and reaches its
maximum approximately 8 weeks after the start of therapy”). For the effectiveness domain, we included
evidence from RCTs as well as observational studies, specifically cohort studies (direct comparisons).
For the safety domain, we included evidence from either RCTs (direct comparisons) or observational
studies. For the latter, we included prospective and retrospective cohort studies (direct comparisons),
case-control studies and single-arm studies or single OLM study arms from RCTs or cohort studies to
assess the prevalence of adverse events (no comparison group). In order to identify potential safety
concerns, we included studies with a duration of more than 8 weeks (harms that have been suspected
of being associated with the use of OLM appear with a long latency period).
The search results were imported into Endnote X8. Two independent reviewers carried out the study
selection. Both authors independently reviewed all the records by title and abstract and then by full text.
Disagreements were resolved by discussion at each stage of the selection process. Studies were eligible
for inclusion if they met the inclusion criteria listed in Appendix B, Table 26.
33
7.1.2 Other sources
The websites of international organisations including AHRQ, CADTH, EMA, EUnetHTA, FDA, HAS,
HTAi, INAHTA, IQWIG, ISPOR, MSAC, NICE, PBAC, RePEc, WHO and ZIN were searched for addi-
tional relevant reports. We included information on ongoing clinical trials from the US National Library
of Medicine (ClinicalTrials.gov) and EU clinical trial registries. The last search was done on 2 July 2019.
The search results were imported into Endnote X8. Two reviewers carried out the study selection for the
domains of efficacy/effectiveness/safety and economy. For the other domains, one reviewer carried out
the study selection. In cases of uncertainty, a second reviewer was consulted.
7.1.3 Assessment of quality of evidence
The quality of the clinical studies was evaluated using the GRADE methodology as described in the
Cochrane Manual (https://gdt.gradepro.org/app/handbook/handbook.htmlh.9rdbelsnu4iy).
We considered the relative importance of outcomes as follows:
Domain effectiveness/efficacy
- Reduction in BP: low importance
- Cardiovascular morbidity (e.g. myocardial infarction, heart failure, cardiac arrhythmia): critical/im-
portant
- Cardiovascular mortality (e.g. sudden heart death): critical/important
- Cerebrovascular morbidity (e.g. transient ischaemic attack, ischaemic stroke, haemorrhagic
stroke, hypertensive dementia): critical/important
- Cerebrovascular mortality: critical/important
- Health-related quality of life: critical/important
- All-cause mortality: critical/important
Domain safety
- Adverse events with a severity grade of at least 3 (following the definition of the EUnetHTA guide-
lines on safety19), including, for example, enteropathies, cardiovascular morbidity and cardiovas-
cular mortality, cerebrovascular morbidity, cerebrovascular mortality: critical/Important
- Withdrawals or discontinuations due to adverse events: low importance
- All-cause mortality: critical/important
34
For details, see Appendix C, Table 28 and Table 29.
7.1.4 Methodology data analysis effectiveness, efficacy and safety
To assess the efficacy/effectiveness of OLM, we focused on patient-relevant endpoints such as cerebro-
and cardiovascular morbidity/mortality but also included the surrogate outcome blood pressure. The
antihypertensive effect of OLM compared with other sartans is well documented in the literature.20 21 To
verify these findings, we performed our own (meta-)analyses to determine the effect of OLM on BP in
comparison with other sartans. Meta-analyses were conducted whenever possible (at least two studies
including the same comparator). In general, evidence is presented as the mean difference in BP reduc-
tion. Brunner et al.22 assume a difference of 2 mmHg as a clinically relevant treatment difference. To
obtain confidence intervals, we conducted pooled variances of two-sample Welch t-tests.
For the long-term outcomes (reduction in cardiovascular and cerebrovascular events), we calculated he
absolute difference in the number of events per 1’000 participants per year comparing OLM with other
sartans where available.
To assess the safety profile of OLM, we focused on serious adverse events. Regarding withdrawals, we
identified only sparse data as well as inconsistencies in the reporting of this outcome in the studies
included. For this reason, we could only perform a rudimentary analysis based on one RCT – Giles
200723 – with sufficient data.
For the safety outcomes, the data are presented as the absolute difference in the number of serious
adverse events per 1'000 participants per year for direct comparisons (OLM versus another sartan). The
results from RCTs were presented with meta-analyses whenever possible (data from at least two RCTs
having the same comparator). Data from single-arm studies or single-study arms with OLM treatment
were expressed as serious adverse events projected for one year per 1’000 participants. The analysis
followed a step-wise approach, initially focusing on study designs yielding higher-quality evidence (lower
risk of bias).
7.2 Results effectiveness, efficacy and safety
7.2.1 Evidence base pertaining to effectiveness, efficacy and safety
The evaluation of the overall effectiveness of the technology encompasses its efficacy, its effectiveness
and its safety.
- Efficacy is the extent to which a specific health technology produces a beneficial, reproducible result
under study conditions compared with alternative technologies (internal validity).

35
- Effectiveness is the extent to which a specific health technology, when applied in real world circum-
stances in the target group, does what it is intended to do for a diagnostic or therapeutic purpose
regarding the benefits compared with alternative technologies (external validity).
- Safety is a judgement of the harmful effects and their severity when using the health technology.
Relevant adverse events are those that result in death, are life threatening, require inpatient hospi-
talisation or cause prolongation of existing hospitalisation (serious adverse events) and those that
occur repeatedly and the most frequently (highest rate).
36
7.2.2 PRISMA flow diagram
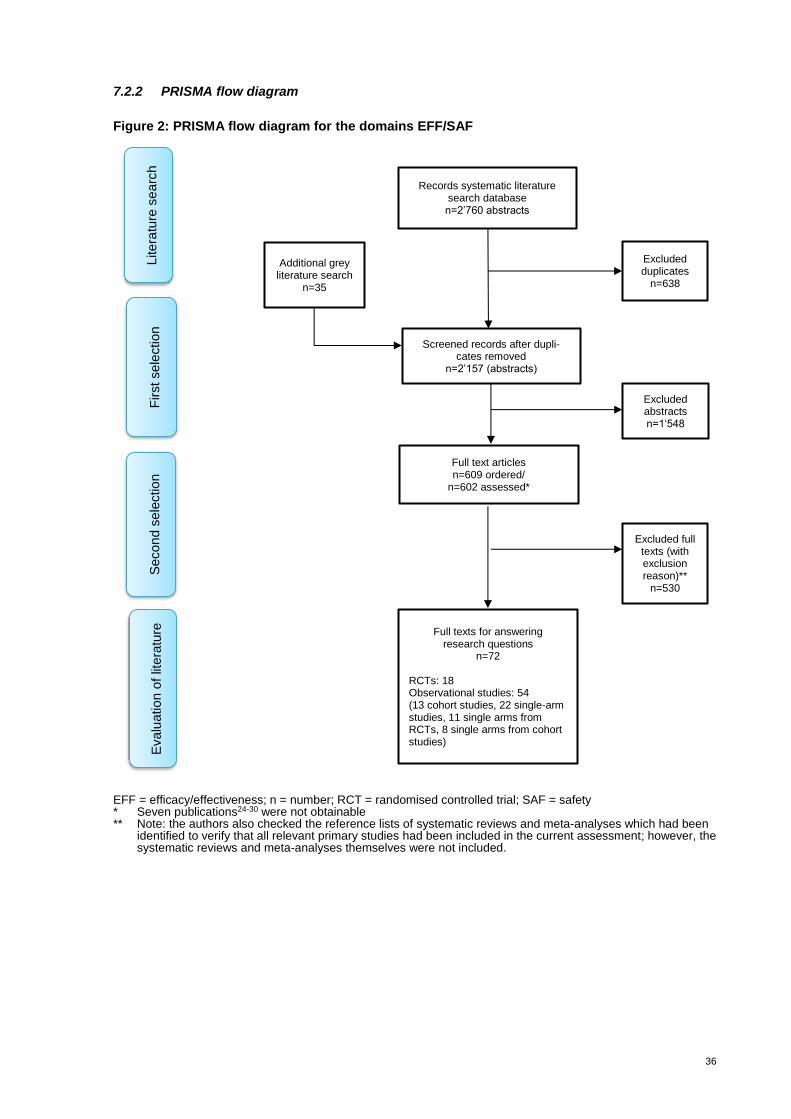
Figure 2: PRISMA flow diagram for the domains EFF/SAF
EFF = efficacy/effectiveness; n = number; RCT = randomised controlled trial; SAF = safety * Seven publications24-30 were not obtainable ** Note: the authors also checked the reference lists of systematic reviews and meta-analyses which had been
identified to verify that all relevant primary studies had been included in the current assessment; however, the systematic reviews and meta-analyses themselves were not included.
Records systematic literature search database n=2’760 abstracts
Additional grey literature search
n=35
Excluded duplicates
n=638
Screened records after dupli-cates removed
n=2’157 (abstracts)
Full text articles n=609 ordered/
n=602 assessed*
Litera
ture
se
arc
h
First sele
ction
Excluded abstracts n=1‘548
Excluded full texts (with exclusion reason)**
n=530
Full texts for answering research questions
n=72
RCTs: 18 Observational studies: 54 (13 cohort studies, 22 single-arm studies, 11 single arms from RCTs, 8 single arms from cohort studies)
Secon
d s
ele
ctio
n
Evalu
ation o
f lit
era
ture
37
7.2.3 Evidence table
Overview
In total, we included 72 studies that reported on the effectiveness, efficacy or safety (or any combination
of the three) of OLM compared with other sartans. The characteristics (including the references) of the
studies included are listed in Table 5 and Table 6. Seventeen RCTs22 23 31-45 (see Table 5) were ana-
lysed to assess the effect of OLM on BP compared with other sartans (efficacy). One retrospective
cohort study46 but no RCTs investigated the effect of OLM on cerebro- and cardiovascular outcomes
compared with other ARBs (effectiveness) from routine data (see Table 5). Regarding comparative
safety, we analysed five RCTs23 38 39 40 47 (one RCT that only focused on the safety evaluation and four
23 39 38 40that were also included in the analysis of BP reduction), one prospective48 and 11 retrospec-
tive cohort studies49-59 (see Table 6) to assess the absolute risk of serious adverse events for OLM
compared with other ARBs. We scanned 22 single-arm studies60-81 as well as the single arms (receiv-
ing OLM) of eleven RCTs82 83-92 and eight cohort studies93-100 (each with a comparator not defined by
the PICO framework applied) for any striking patterns in the occurrence of serious adverse events in
OLM users (non-comparative safety) (see Appendix C, Table 30). Due to the lack of (an appropriate)
comparison group, the data can only yield descriptive evidence.

38
Table 5: Study characteristics of comparative effectiveness/efficacy studies
Study/Year Study design Country Population Sample size OLM vs. compara-
tor(s)*
Interven-tion
Comparator(s) Outcome Statistical validation done by authors
Sponsor/COI
Ball et al. 200131 RCT Multicentre HT 158 vs. 152 OLM LOS BP MD Daiichi Sankyo
Oparil et al. 200141 RCT USA HT 145 vs. 433 OLM IRB, LOS, VAL BP MD NR
Brunner et al. 200322 RCT Multicentre HT 312 vs. 323 OLM CAN BP MD Daiichi Sankyo
Destro et al. 200534 RCT Italy HT 52 vs. 55 OLM VAL BP MD NR
Liau et al. 200539 RCT Taiwan HT 49 vs. 57 OLM LOS BP MD Daiichi Sankyo
Giles et al. 200723 RCT USA HT 199 vs. 380 OLM LOS, VAL BP MD Daiichi Sankyo
Fogari et al. 200836 RCT Italy HT 63 vs. 63 OLM TEL/HCTZ BP MD NR
Tsutamoto et al. 201044 RCT Japan HT 25 vs. 25 OLM CAN BP MD NR
De Luis et al. 2010a32 RCT Spain HT + obesity
17 vs. 17 OLM IRB BP MD NR
De Luis et al. 2010b33 RCT Spain HT + obesity
31 vs. 34 OLM TEL BP MD NR
CRUSH 201335 RCT USA HT 290 vs. 300 OLM LOS BP MD Daiichi Sankyo
Morii et al. 201240 RCT Japan HT 27 vs. 27 OLM IRB BP MD NR
Ushijima et al. 201545 RCT Multicentre HT + DM 12 vs. 11 OLM VAL BP MD No COI
Kakio et al. 201737 RCT Japan HT 40 vs. 44 OLM AZI BP MD NR
Kalikar et al. 201738 RCT India HT 20 vs. 37 OLM LOS, TEL BP MD No COI
Shiga et al. 201743 RCT Japan HT 28 vs. 28 OLM AZI BP MD Some COI
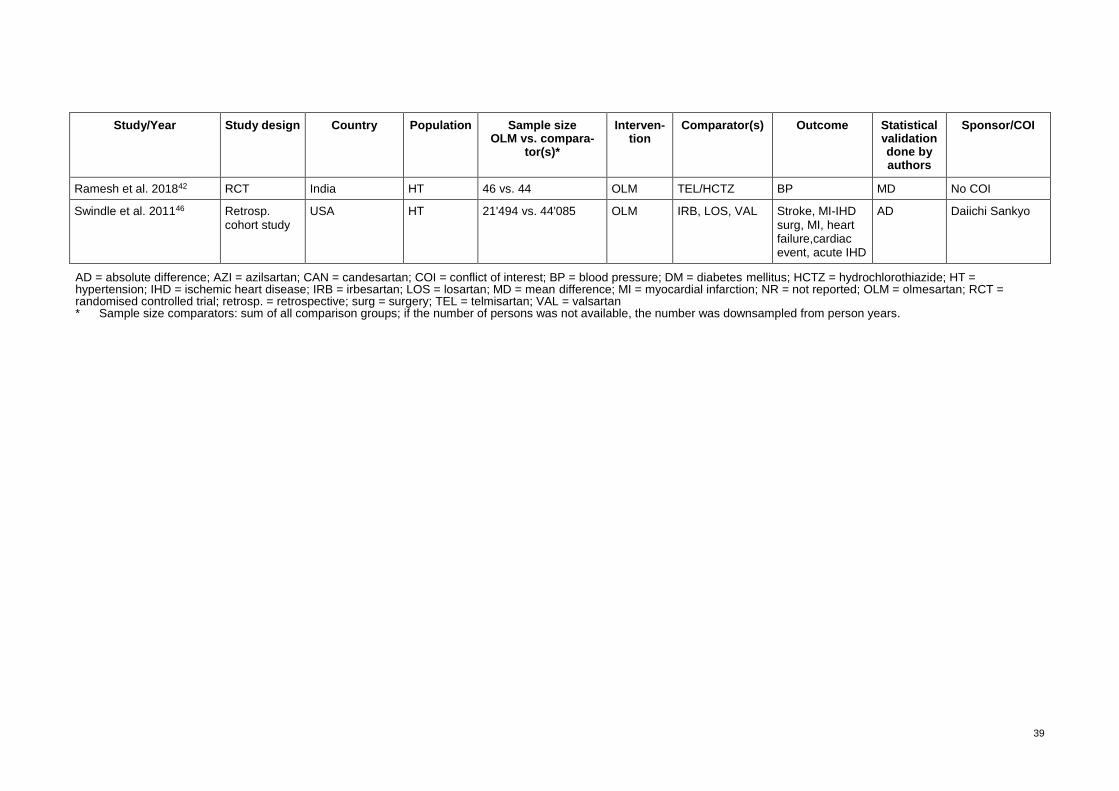
39
Study/Year Study design Country Population Sample size OLM vs. compara-
tor(s)*
Interven-tion
Comparator(s) Outcome Statistical validation done by authors
Sponsor/COI
Ramesh et al. 201842 RCT India HT 46 vs. 44 OLM TEL/HCTZ BP MD No COI
Swindle et al. 201146 Retrosp. cohort study
USA HT 21'494 vs. 44'085 OLM IRB, LOS, VAL Stroke, MI-IHD surg, MI, heart failure,cardiac event, acute IHD
AD Daiichi Sankyo
AD = absolute difference; AZI = azilsartan; CAN = candesartan; COI = conflict of interest; BP = blood pressure; DM = diabetes mellitus; HCTZ = hydrochlorothiazide; HT = hypertension; IHD = ischemic heart disease; IRB = irbesartan; LOS = losartan; MD = mean difference; MI = myocardial infarction; NR = not reported; OLM = olmesartan; RCT = randomised controlled trial; retrosp. = retrospective; surg = surgery; TEL = telmisartan; VAL = valsartan * Sample size comparators: sum of all comparison groups; if the number of persons was not available, the number was downsampled from person years.

40
Table 6: Study characteristics of comparative safety studies
Study/Year Study design Country Population Sample size OLM vs. compara-
tor(s)*
Interven-tion
Comparator(s) Outcome Statistical validation done by authors
Sponsor/COI
Liau et al. 200539 RCT Taiwan HT 62 vs. 64 OLM LOS SAE RR Daiichi Sankyo
Rump et al. 200647 RCT Europe HT 315 vs. 314 OLM/HCTZ LOS/HCTZ SAE RR NR
Giles et al. 200723 RCT USA HT 414 vs. 410 OLM LOS, VAL SAE RR Daiichi Sankyo
Morii et al. 201240 RCT Japan HT 31 vs. 31 OLM IRB SAE RR NR
Kalikar et al. 201738 RCT India HT 40 vs. 40 OLM LOS, TEL SAE RR No COI
Graham et al. 201448 Prosp. cohort study USA HT + DM 158'054 vs. 724'673 OLM Other ARBs** SAE RR No COI
Basson et al. 201549 Retrosp. cohort study
France HT 434'415 vs. 2'272'304 OLM Other ARBs** ENT RR French national
De Bortoli et al. 201750 Retrosp. cohort study
Germany, Italy
HT 735'836 vs. 771'806 OLM CAN, IRB, TEL, VAL
ENT RR A Menarini
Dong et al. 201851 Retrosp. cohort study
USA HT 350'430 vs. 1'504'562 OLM Other ARBs** ENT RR Some COI
Malfertheiner et al. 201854
Retrosp. cohort study
Germany, Italy
HT 25'591 vs. 104'901 OLM Other ARBs** ENT RR A Menarini
You et al. 201958 Retrosp. cohort study
Korea HT 23'610 vs. 76'462 OLM Other ARBs** ENT RR No COI
Padwal et al. 201455 Retrosp. cohort study
Canada HT + DM 10'370 vs. 34'815 OLM VAL, IRB Mor RR No COI
Walker et al. 201457 Retrosp. cohort study
USA HT 38'750 vs. 72'326 OLM Other ARBs** Mor RR Daiichi Sankyo
Zhou et al. 201459 Retrosp. cohort study
UK HT 3'946 vs. 54'653 OLM Other ARBs** Mor, SAE RR No COI
Khurshid et al. 201252 Retrosp. cohort study
India HT 6 vs. 17 OLM TEL SAE RR No COI
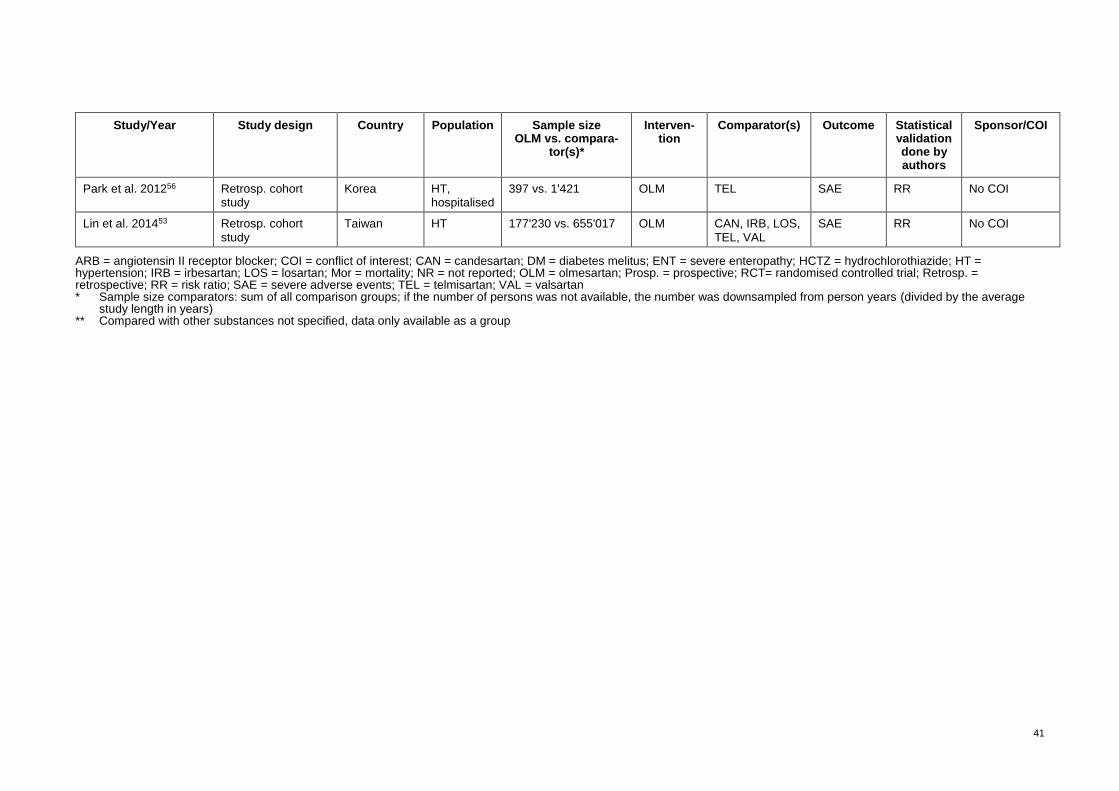
41
Study/Year Study design Country Population Sample size OLM vs. compara-
tor(s)*
Interven-tion
Comparator(s) Outcome Statistical validation done by authors
Sponsor/COI
Park et al. 201256 Retrosp. cohort study
Korea HT, hospitalised
397 vs. 1'421 OLM TEL SAE RR No COI
Lin et al. 201453 Retrosp. cohort study
Taiwan HT 177'230 vs. 655'017 OLM CAN, IRB, LOS, TEL, VAL
SAE RR No COI
ARB = angiotensin II receptor blocker; COI = conflict of interest; CAN = candesartan; DM = diabetes melitus; ENT = severe enteropathy; HCTZ = hydrochlorothiazide; HT = hypertension; IRB = irbesartan; LOS = losartan; Mor = mortality; NR = not reported; OLM = olmesartan; Prosp. = prospective; RCT= randomised controlled trial; Retrosp. = retrospective; RR = risk ratio; SAE = severe adverse events; TEL = telmisartan; VAL = valsartan * Sample size comparators: sum of all comparison groups; if the number of persons was not available, the number was downsampled from person years (divided by the average
study length in years) ** Compared with other substances not specified, data only available as a group
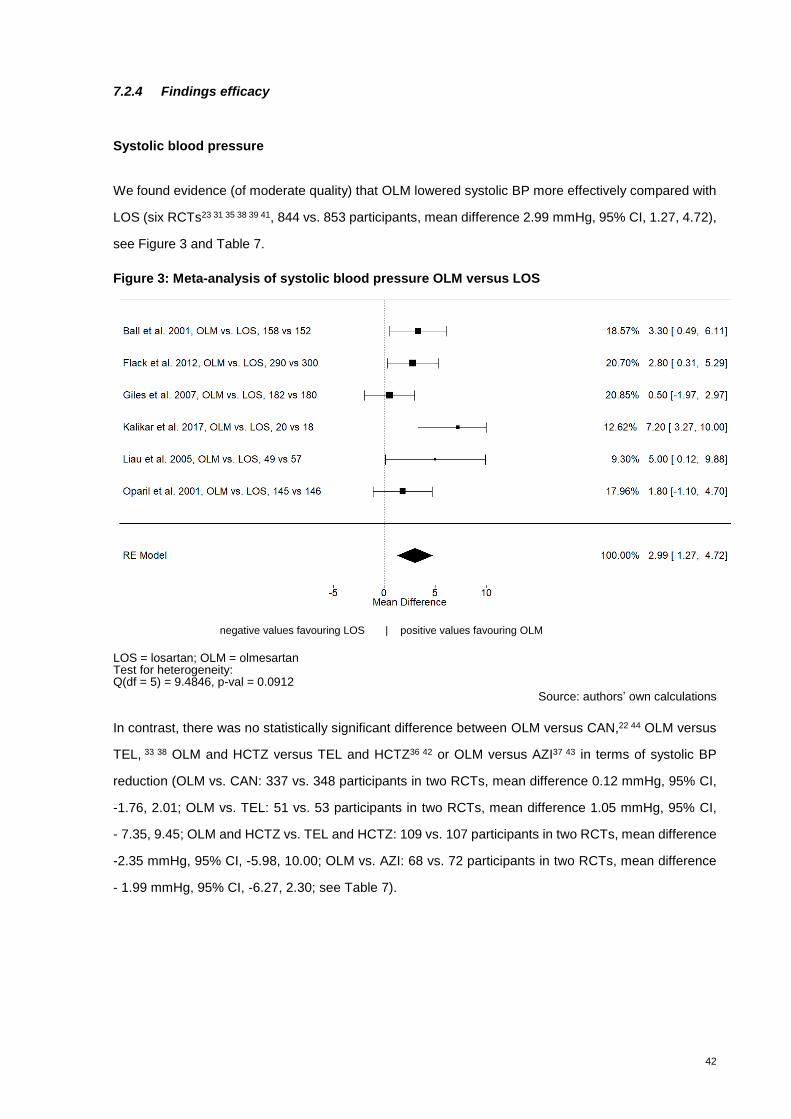
42
7.2.4 Findings efficacy
Systolic blood pressure
We found evidence (of moderate quality) that OLM lowered systolic BP more effectively compared with
LOS (six RCTs23 31 35 38 39 41, 844 vs. 853 participants, mean difference 2.99 mmHg, 95% CI, 1.27, 4.72),
see Figure 3 and Table 7.
Figure 3: Meta-analysis of systolic blood pressure OLM versus LOS
negative values favouring LOS | positive values favouring OLM
LOS = losartan; OLM = olmesartan Test for heterogeneity: Q(df = 5) = 9.4846, p-val = 0.0912
Source: authors’ own calculations
In contrast, there was no statistically significant difference between OLM versus CAN,22 44 OLM versus
TEL, 33 38 OLM and HCTZ versus TEL and HCTZ36 42 or OLM versus AZI37 43 in terms of systolic BP
reduction (OLM vs. CAN: 337 vs. 348 participants in two RCTs, mean difference 0.12 mmHg, 95% CI,
-1.76, 2.01; OLM vs. TEL: 51 vs. 53 participants in two RCTs, mean difference 1.05 mmHg, 95% CI,
- 7.35, 9.45; OLM and HCTZ vs. TEL and HCTZ: 109 vs. 107 participants in two RCTs, mean difference
-2.35 mmHg, 95% CI, -5.98, 10.00; OLM vs. AZI: 68 vs. 72 participants in two RCTs, mean difference
- 1.99 mmHg, 95% CI, -6.27, 2.30; see Table 7).
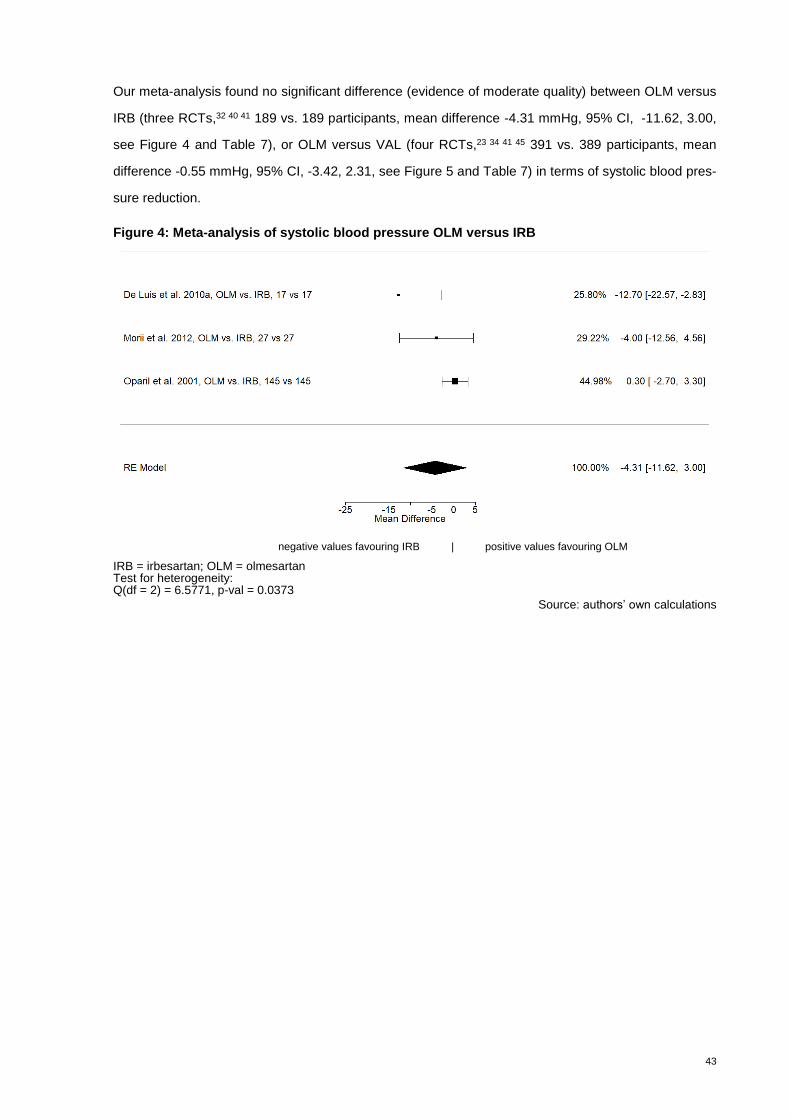
43
Our meta-analysis found no significant difference (evidence of moderate quality) between OLM versus
IRB (three RCTs,32 40 41 189 vs. 189 participants, mean difference -4.31 mmHg, 95% CI, -11.62, 3.00,
see Figure 4 and Table 7), or OLM versus VAL (four RCTs,23 34 41 45 391 vs. 389 participants, mean
difference -0.55 mmHg, 95% CI, -3.42, 2.31, see Figure 5 and Table 7) in terms of systolic blood pres-
sure reduction.
Figure 4: Meta-analysis of systolic blood pressure OLM versus IRB
negative values favouring IRB | positive values favouring OLM
IRB = irbesartan; OLM = olmesartan Test for heterogeneity: Q(df = 2) = 6.5771, p-val = 0.0373
Source: authors’ own calculations
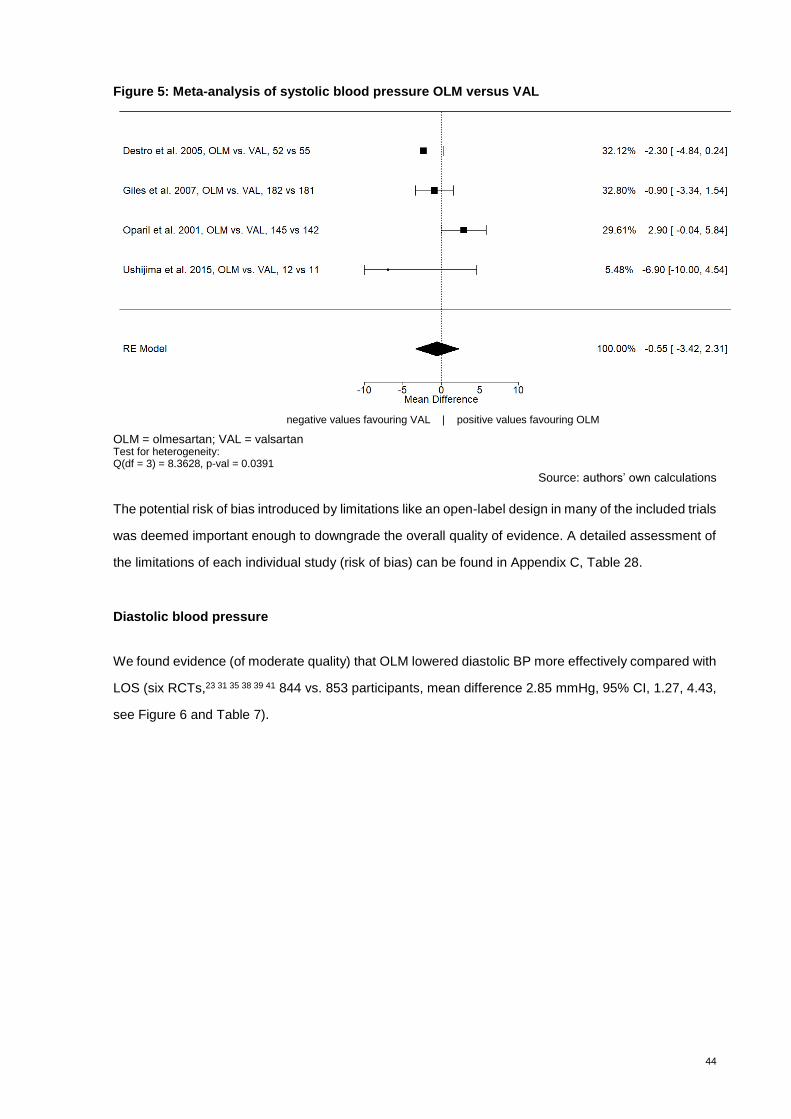
44
Figure 5: Meta-analysis of systolic blood pressure OLM versus VAL
negative values favouring VAL | positive values favouring OLM
OLM = olmesartan; VAL = valsartan Test for heterogeneity: Q(df = 3) = 8.3628, p-val = 0.0391
Source: authors’ own calculations
The potential risk of bias introduced by limitations like an open-label design in many of the included trials
was deemed important enough to downgrade the overall quality of evidence. A detailed assessment of
the limitations of each individual study (risk of bias) can be found in Appendix C, Table 28.
Diastolic blood pressure
We found evidence (of moderate quality) that OLM lowered diastolic BP more effectively compared with
LOS (six RCTs,23 31 35 38 39 41 844 vs. 853 participants, mean difference 2.85 mmHg, 95% CI, 1.27, 4.43,
see Figure 6 and Table 7).
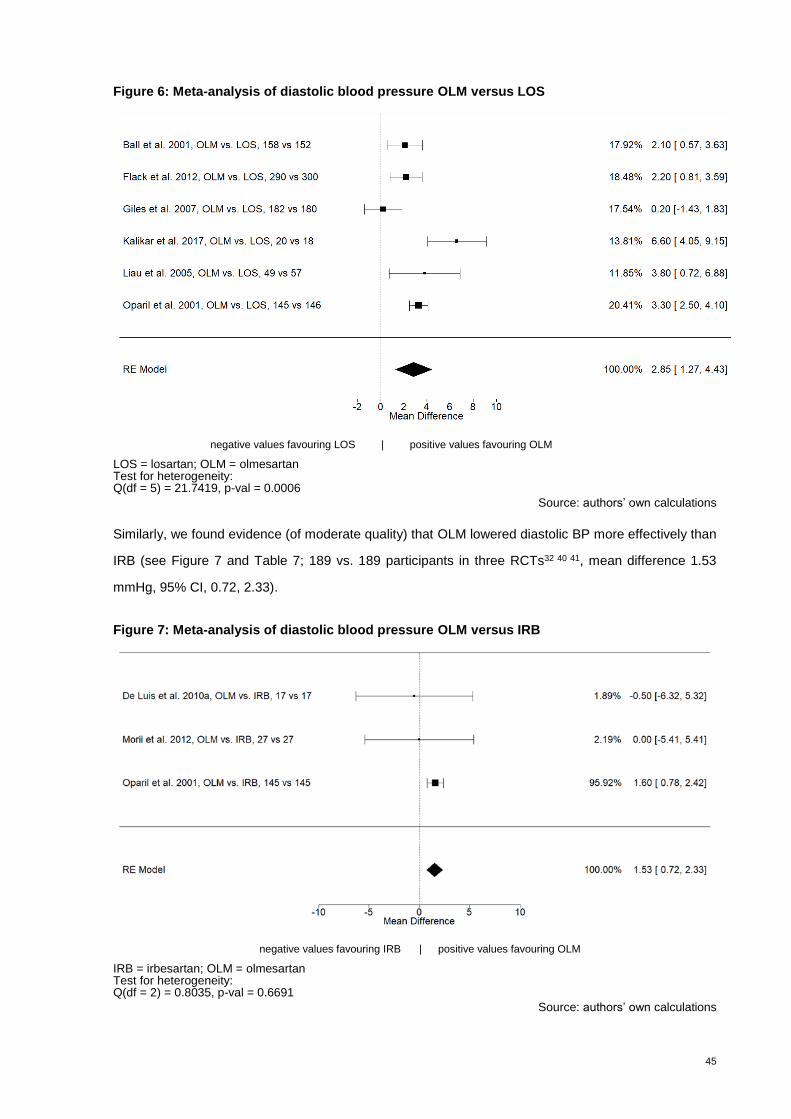
45
Figure 6: Meta-analysis of diastolic blood pressure OLM versus LOS
negative values favouring LOS | positive values favouring OLM
LOS = losartan; OLM = olmesartan Test for heterogeneity: Q(df = 5) = 21.7419, p-val = 0.0006
Source: authors’ own calculations
Similarly, we found evidence (of moderate quality) that OLM lowered diastolic BP more effectively than
IRB (see Figure 7 and Table 7; 189 vs. 189 participants in three RCTs32 40 41, mean difference 1.53
mmHg, 95% CI, 0.72, 2.33).
Figure 7: Meta-analysis of diastolic blood pressure OLM versus IRB
negative values favouring IRB | positive values favouring OLM
IRB = irbesartan; OLM = olmesartan Test for heterogeneity: Q(df = 2) = 0.8035, p-val = 0.6691
Source: authors’ own calculations
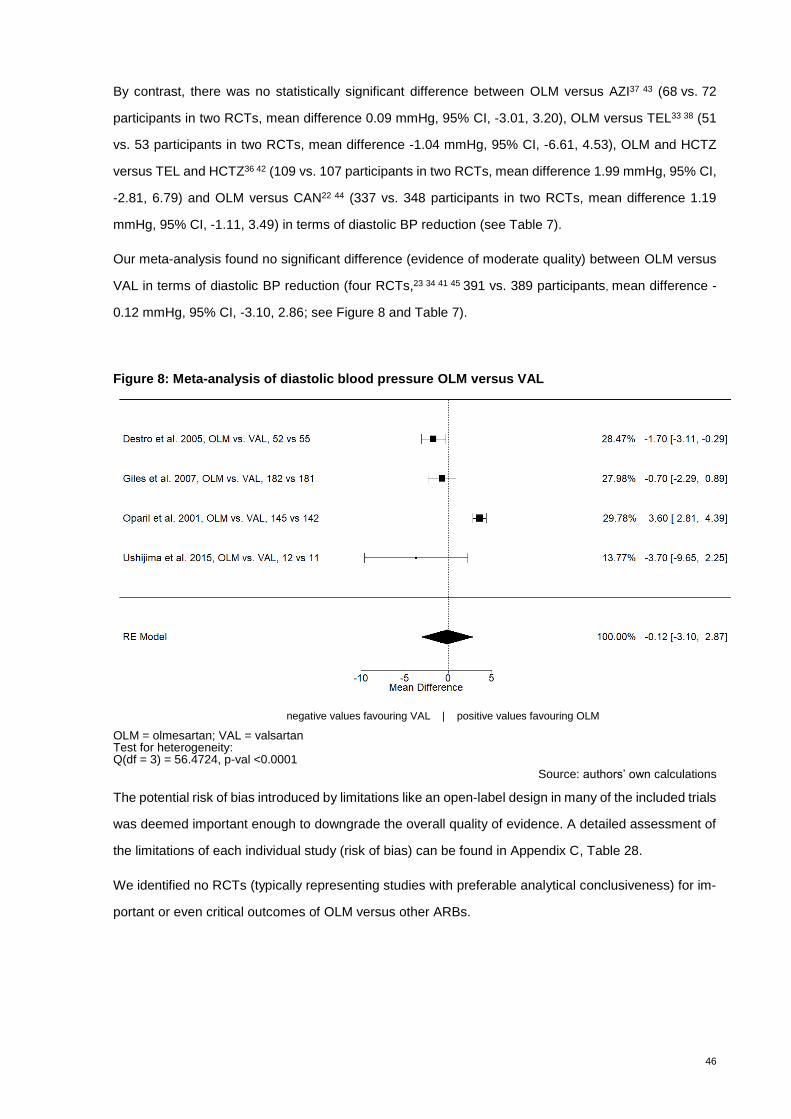
46
By contrast, there was no statistically significant difference between OLM versus AZI37 43 (68 vs. 72
participants in two RCTs, mean difference 0.09 mmHg, 95% CI, -3.01, 3.20), OLM versus TEL33 38 (51
vs. 53 participants in two RCTs, mean difference -1.04 mmHg, 95% CI, -6.61, 4.53), OLM and HCTZ
versus TEL and HCTZ36 42 (109 vs. 107 participants in two RCTs, mean difference 1.99 mmHg, 95% CI,
-2.81, 6.79) and OLM versus CAN22 44 (337 vs. 348 participants in two RCTs, mean difference 1.19
mmHg, 95% CI, -1.11, 3.49) in terms of diastolic BP reduction (see Table 7).
Our meta-analysis found no significant difference (evidence of moderate quality) between OLM versus
VAL in terms of diastolic BP reduction (four RCTs,23 34 41 45 391 vs. 389 participants, mean difference -
0.12 mmHg, 95% CI, -3.10, 2.86; see Figure 8 and Table 7).
Figure 8: Meta-analysis of diastolic blood pressure OLM versus VAL
negative values favouring VAL | positive values favouring OLM
OLM = olmesartan; VAL = valsartan Test for heterogeneity: Q(df = 3) = 56.4724, p-val <0.0001
Source: authors’ own calculations
The potential risk of bias introduced by limitations like an open-label design in many of the included trials
was deemed important enough to downgrade the overall quality of evidence. A detailed assessment of
the limitations of each individual study (risk of bias) can be found in Appendix C, Table 28.
We identified no RCTs (typically representing studies with preferable analytical conclusiveness) for im-
portant or even critical outcomes of OLM versus other ARBs.
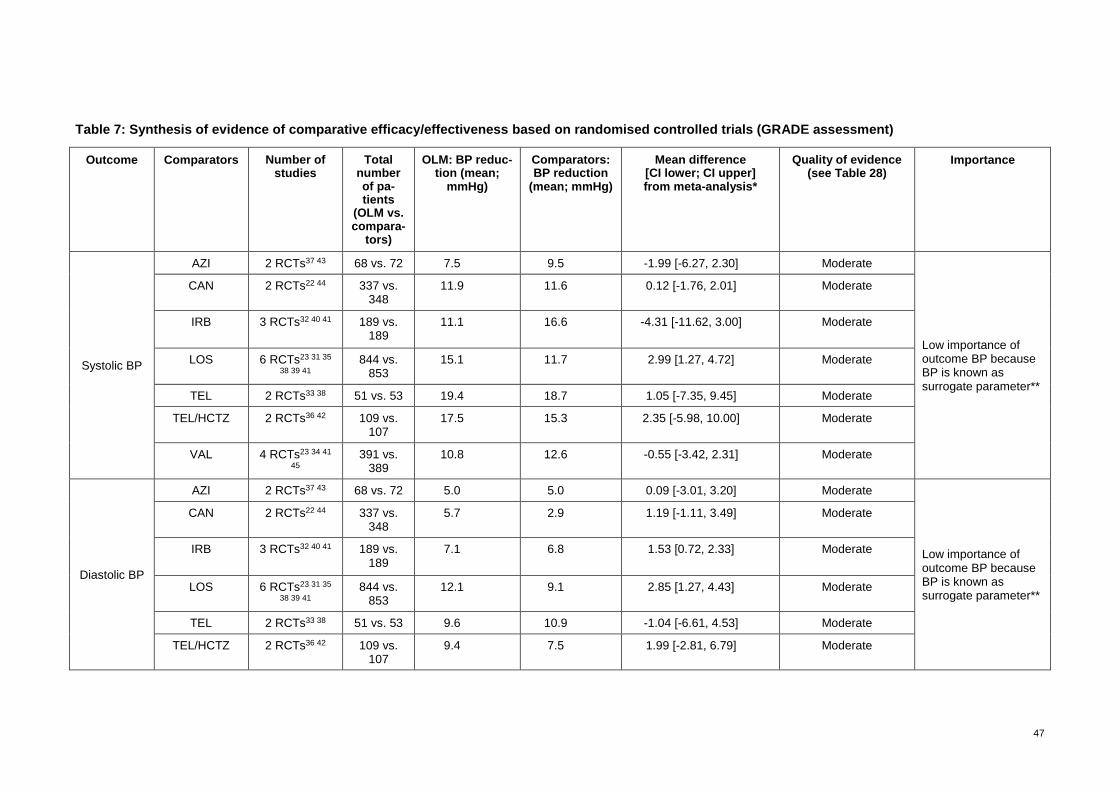
47
Table 7: Synthesis of evidence of comparative efficacy/effectiveness based on randomised controlled trials (GRADE assessment)
Outcome Comparators Number of studies
Total number of pa-tients
(OLM vs. compara-
tors)
OLM: BP reduc-tion (mean;
mmHg)
Comparators: BP reduction
(mean; mmHg)
Mean difference [CI lower; CI upper] from meta-analysis*
Quality of evidence (see Table 28)
Importance
Systolic BP
AZI 2 RCTs37 43 68 vs. 72 7.5 9.5 -1.99 [-6.27, 2.30] Moderate
Low importance of outcome BP because BP is known as surrogate parameter**
CAN 2 RCTs22 44 337 vs. 348
11.9 11.6 0.12 [-1.76, 2.01] Moderate
IRB
3 RCTs32 40 41 189 vs. 189
11.1 16.6 -4.31 [-11.62, 3.00] Moderate
LOS 6 RCTs23 31 35
38 39 41 844 vs.
853 15.1 11.7 2.99 [1.27, 4.72] Moderate
TEL 2 RCTs33 38 51 vs. 53 19.4 18.7 1.05 [-7.35, 9.45] Moderate
TEL/HCTZ 2 RCTs36 42 109 vs. 107
17.5 15.3 2.35 [-5.98, 10.00] Moderate
VAL 4 RCTs23 34 41
45 391 vs.
389 10.8 12.6 -0.55 [-3.42, 2.31] Moderate
Diastolic BP
AZI 2 RCTs37 43 68 vs. 72 5.0 5.0 0.09 [-3.01, 3.20] Moderate
Low importance of outcome BP because BP is known as surrogate parameter**
CAN 2 RCTs22 44 337 vs. 348
5.7 2.9 1.19 [-1.11, 3.49] Moderate
IRB
3 RCTs32 40 41 189 vs. 189
7.1 6.8 1.53 [0.72, 2.33] Moderate
LOS 6 RCTs23 31 35
38 39 41 844 vs.
853 12.1 9.1 2.85 [1.27, 4.43] Moderate
TEL 2 RCTs33 38 51 vs. 53 9.6 10.9 -1.04 [-6.61, 4.53] Moderate
TEL/HCTZ 2 RCTs36 42 109 vs. 107
9.4 7.5 1.99 [-2.81, 6.79] Moderate
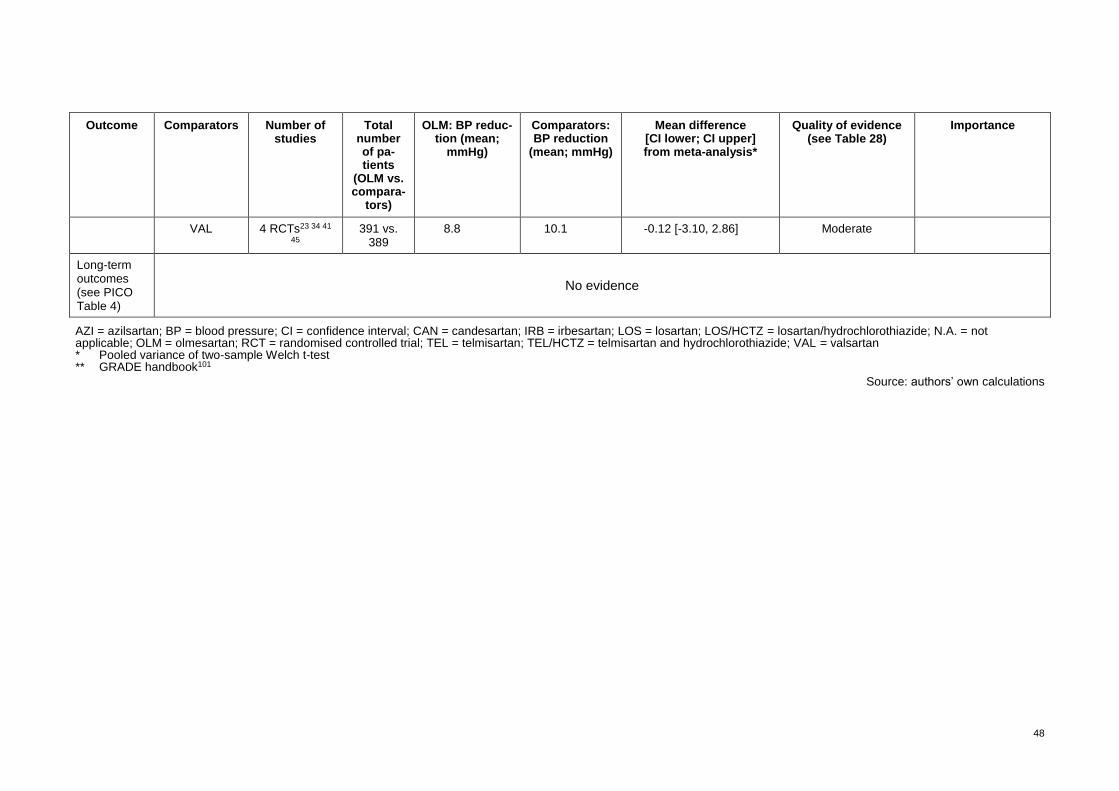
48
Outcome Comparators Number of studies
Total number of pa-tients
(OLM vs. compara-
tors)
OLM: BP reduc-tion (mean;
mmHg)
Comparators: BP reduction
(mean; mmHg)
Mean difference [CI lower; CI upper] from meta-analysis*
Quality of evidence (see Table 28)
Importance
VAL 4 RCTs23 34 41
45 391 vs.
389 8.8 10.1 -0.12 [-3.10, 2.86] Moderate
Long-term outcomes (see PICO Table 4)
No evidence
AZI = azilsartan; BP = blood pressure; CI = confidence interval; CAN = candesartan; IRB = irbesartan; LOS = losartan; LOS/HCTZ = losartan/hydrochlorothiazide; N.A. = not applicable; OLM = olmesartan; RCT = randomised controlled trial; TEL = telmisartan; TEL/HCTZ = telmisartan and hydrochlorothiazide; VAL = valsartan * Pooled variance of two-sample Welch t-test ** GRADE handbook101
Source: authors’ own calculations

49
7.2.5 Findings effectiveness
For the long-term outcomes of OLM versus other ARBs, we identified one study46 applying a retrospec-
tive cohort study design with data from US medical and pharmacy claims with a mean follow-up of 2.5
years. No other study evaluated comparable long-term outcomes. Due to the observational study de-
sign, we rated the overall quality of evidence as low.
This subsection describes the results from Swindle et al.46 relating to the absolute difference in the
number of events per 1’000 participants per year (Table 8). The largest absolute difference can be
observed for cardiac events (a composite measure consisting of heart failure, stroke, myocardial infarc-
tion, acute ischemic heart disease diagnosis [other than myocardial infarction] and surgery related to
myocardial infarction/ischemic heart disease) and heart failure, meaning a lower event rate for OLM.
The study authors used different analytical strategies. In a limited subsample excluding cases with rel-
evant comorbidities, OLM reduced the risk of the composite outcome of cardiac events (particularly
heart failure) more effectively than LOS and IRB in a multivariate analysis. There were no statistically
significant differences in the risk of stroke, myocardial infarction or myocardial infarction/ischemic heart
disease-related surgery between OLM and other ARBs. However, VAL was associated with a higher
adjusted risk of an acute ischemic heart disease event compared with OLM. We used this study as a
base for the cost-effectiveness analysis evaluation (Subsection 8) and calculated confidence intervals
for the differences in the aforementioned outcomes between the study groups. Using our own statistical
analyses, we found no significant differences between OLM, LOS, IRB and VAL in any of the outcomes.
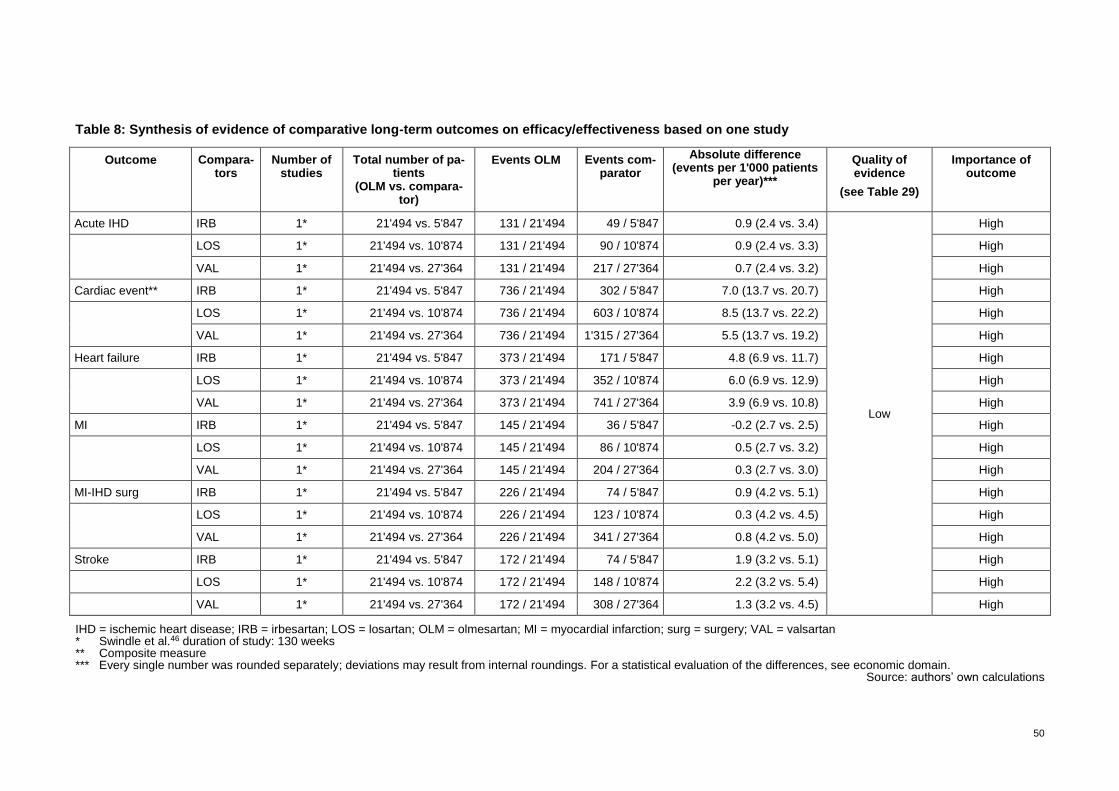
50
Table 8: Synthesis of evidence of comparative long-term outcomes on efficacy/effectiveness based on one study
Outcome Compara-tors
Number of studies
Total number of pa-tients
(OLM vs. compara-tor)
Events OLM Events com-parator
Absolute difference (events per 1'000 patients
per year)***
Quality of evidence
(see Table 29)
Importance of outcome
Acute IHD IRB 1* 21'494 vs. 5'847 131 / 21'494 49 / 5'847 0.9 (2.4 vs. 3.4)
Low
High
LOS 1* 21'494 vs. 10'874 131 / 21'494 90 / 10'874 0.9 (2.4 vs. 3.3) High
VAL 1* 21'494 vs. 27'364 131 / 21'494 217 / 27'364 0.7 (2.4 vs. 3.2) High
Cardiac event** IRB 1* 21'494 vs. 5'847 736 / 21'494 302 / 5'847 7.0 (13.7 vs. 20.7) High
LOS 1* 21'494 vs. 10'874 736 / 21'494 603 / 10'874 8.5 (13.7 vs. 22.2) High
VAL 1* 21'494 vs. 27'364 736 / 21'494 1'315 / 27'364 5.5 (13.7 vs. 19.2) High
Heart failure IRB 1* 21'494 vs. 5'847 373 / 21'494 171 / 5'847 4.8 (6.9 vs. 11.7) High
LOS 1* 21'494 vs. 10'874 373 / 21'494 352 / 10'874 6.0 (6.9 vs. 12.9) High
VAL 1* 21'494 vs. 27'364 373 / 21'494 741 / 27'364 3.9 (6.9 vs. 10.8) High
MI IRB 1* 21'494 vs. 5'847 145 / 21'494 36 / 5'847 -0.2 (2.7 vs. 2.5) High
LOS 1* 21'494 vs. 10'874 145 / 21'494 86 / 10'874 0.5 (2.7 vs. 3.2) High
VAL 1* 21'494 vs. 27'364 145 / 21'494 204 / 27'364 0.3 (2.7 vs. 3.0) High
MI-IHD surg IRB 1* 21'494 vs. 5'847 226 / 21'494 74 / 5'847 0.9 (4.2 vs. 5.1) High
LOS 1* 21'494 vs. 10'874 226 / 21'494 123 / 10'874 0.3 (4.2 vs. 4.5) High
VAL 1* 21'494 vs. 27'364 226 / 21'494 341 / 27'364 0.8 (4.2 vs. 5.0) High
Stroke IRB 1* 21'494 vs. 5'847 172 / 21'494 74 / 5'847 1.9 (3.2 vs. 5.1) High
LOS 1* 21'494 vs. 10'874 172 / 21'494 148 / 10'874 2.2 (3.2 vs. 5.4) High
VAL 1* 21'494 vs. 27'364 172 / 21'494 308 / 27'364 1.3 (3.2 vs. 4.5) High
IHD = ischemic heart disease; IRB = irbesartan; LOS = losartan; OLM = olmesartan; MI = myocardial infarction; surg = surgery; VAL = valsartan * Swindle et al.46 duration of study: 130 weeks ** Composite measure *** Every single number was rounded separately; deviations may result from internal roundings. For a statistical evaluation of the differences, see economic domain.
Source: authors’ own calculations
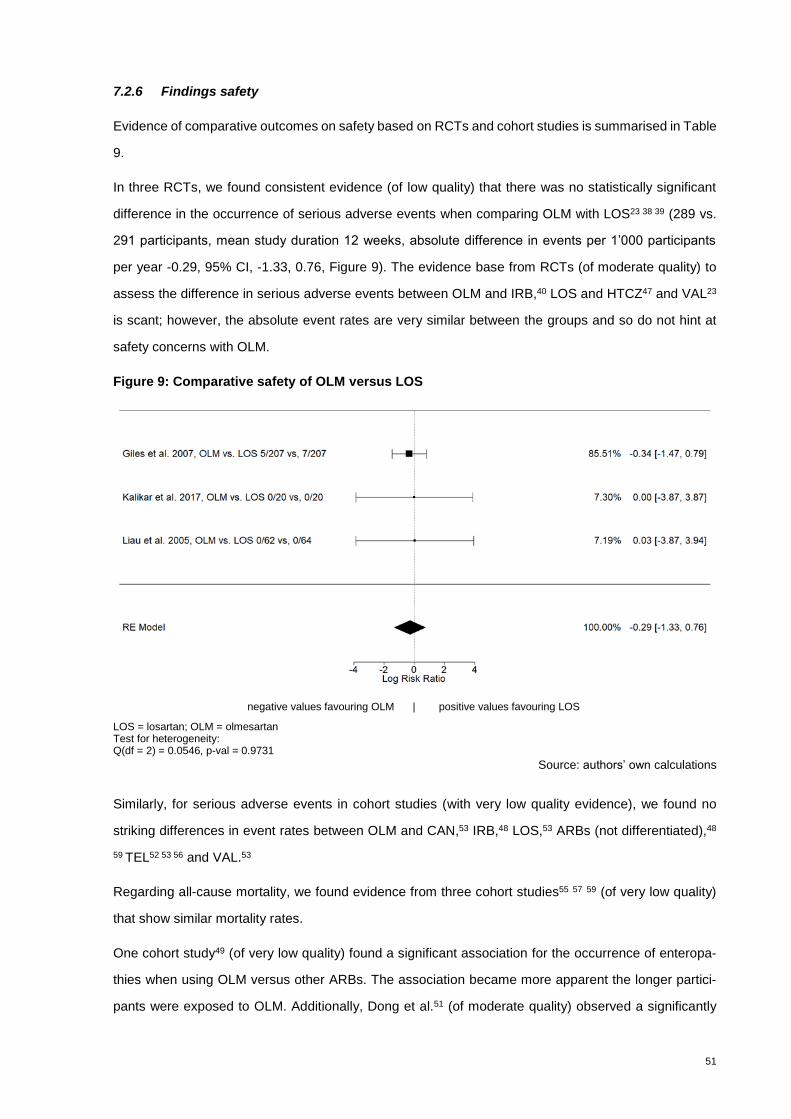
51
7.2.6 Findings safety
Evidence of comparative outcomes on safety based on RCTs and cohort studies is summarised in Table
9.
In three RCTs, we found consistent evidence (of low quality) that there was no statistically significant
difference in the occurrence of serious adverse events when comparing OLM with LOS23 38 39 (289 vs.
291 participants, mean study duration 12 weeks, absolute difference in events per 1’000 participants
per year -0.29, 95% CI, -1.33, 0.76, Figure 9). The evidence base from RCTs (of moderate quality) to
assess the difference in serious adverse events between OLM and IRB,40 LOS and HTCZ47 and VAL23
is scant; however, the absolute event rates are very similar between the groups and so do not hint at
safety concerns with OLM.
Figure 9: Comparative safety of OLM versus LOS
negative values favouring OLM | positive values favouring LOS
LOS = losartan; OLM = olmesartan Test for heterogeneity: Q(df = 2) = 0.0546, p-val = 0.9731
Source: authors’ own calculations
Similarly, for serious adverse events in cohort studies (with very low quality evidence), we found no
striking differences in event rates between OLM and CAN,53 IRB,48 LOS,53 ARBs (not differentiated),48
59 TEL52 53 56 and VAL.53
Regarding all-cause mortality, we found evidence from three cohort studies55 57 59 (of very low quality)
that show similar mortality rates.
One cohort study49 (of very low quality) found a significant association for the occurrence of enteropa-
thies when using OLM versus other ARBs. The association became more apparent the longer partici-
pants were exposed to OLM. Additionally, Dong et al.51 (of moderate quality) observed a significantly
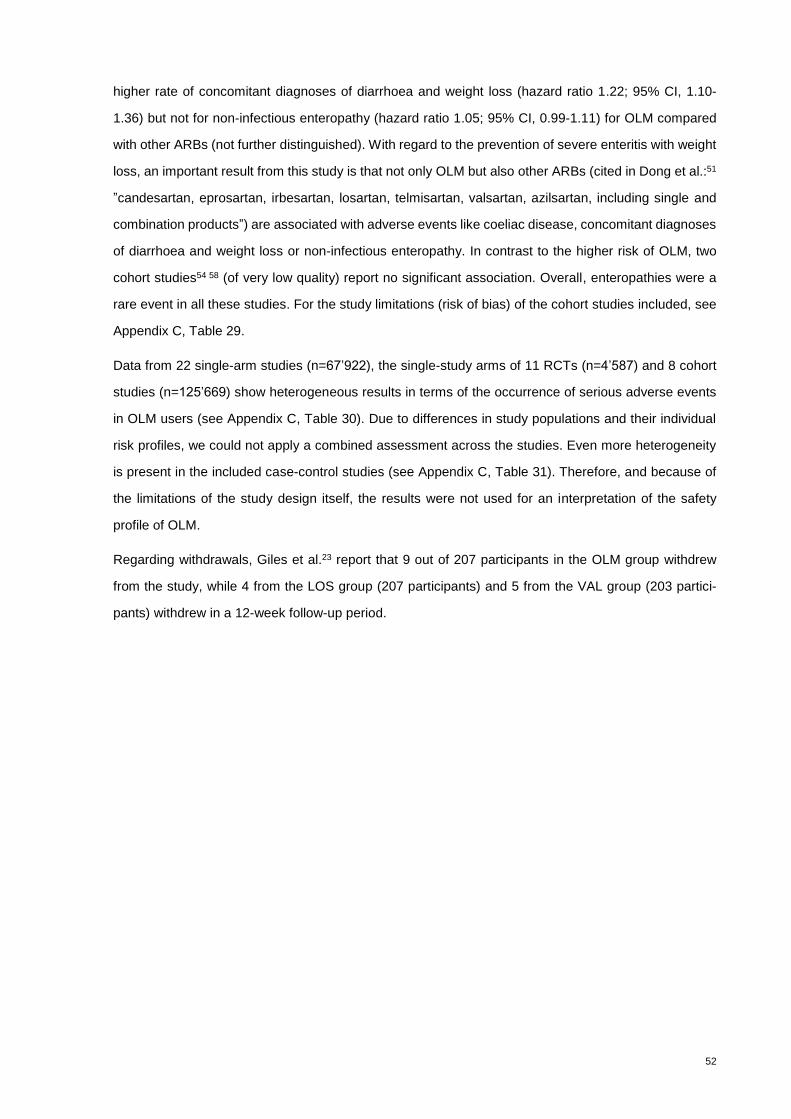
52
higher rate of concomitant diagnoses of diarrhoea and weight loss (hazard ratio 1.22; 95% CI, 1.10-
1.36) but not for non-infectious enteropathy (hazard ratio 1.05; 95% CI, 0.99-1.11) for OLM compared
with other ARBs (not further distinguished). With regard to the prevention of severe enteritis with weight
loss, an important result from this study is that not only OLM but also other ARBs (cited in Dong et al.:51
”candesartan, eprosartan, irbesartan, losartan, telmisartan, valsartan, azilsartan, including single and
combination products”) are associated with adverse events like coeliac disease, concomitant diagnoses
of diarrhoea and weight loss or non-infectious enteropathy. In contrast to the higher risk of OLM, two
cohort studies54 58 (of very low quality) report no significant association. Overall, enteropathies were a
rare event in all these studies. For the study limitations (risk of bias) of the cohort studies included, see
Appendix C, Table 29.
Data from 22 single-arm studies (n=67’922), the single-study arms of 11 RCTs (n=4’587) and 8 cohort
studies (n=125’669) show heterogeneous results in terms of the occurrence of serious adverse events
in OLM users (see Appendix C, Table 30). Due to differences in study populations and their individual
risk profiles, we could not apply a combined assessment across the studies. Even more heterogeneity
is present in the included case-control studies (see Appendix C, Table 31). Therefore, and because of
the limitations of the study design itself, the results were not used for an interpretation of the safety
profile of OLM.
Regarding withdrawals, Giles et al.23 report that 9 out of 207 participants in the OLM group withdrew
from the study, while 4 from the LOS group (207 participants) and 5 from the VAL group (203 partici-
pants) withdrew in a 12-week follow-up period.
53
Table 9: Synthesis of evidence of comparative long-term outcomes on safety based on RCTs/cohort studies
Outcome Comparators Number of stud-ies/design/mean
duration
Total number of pa-tients
(OLM vs. comparator)
Events OLM Events comparator Absolute difference (events per 1'000 par-
ticipants per year)* rounding method*****
Quality of evidence
(see Table 28 and Table 29)
Importance of
outcome
SAE short term
IRB 1 RCT / 12 weeks40 31 vs. 31 0 / 31 0 / 31 0.0 (0.1 vs. 0.1) Moderate High
SAE long term
IRB 1 CohSt / 146 weeks48
35'446 vs. 120'372 253 / 35'446 1'470 / 120'372 1.8 (2.5 vs. 4.4) Very low** High
SAE short term
LOS 3 RCTs / 12 weeks23 38 39
289 vs. 291 5 / 289 7 / 291 38.6 (96.9 vs. 135.6) Low**** High
SAE short term
LOS/HCTZ 1 RCT / 12 weeks47 315 vs. 314 8 / 315 8 / 314 0.3 (103.2 vs. 103.5) Moderate High
SAE long term
LOS 1 CohSt / 146 weeks53
35'446 vs. 175'668 253 / 35'446 1'809 / 175'668 1.1 (2.5 vs. 3.7) Very low** High
SAE short term
VAL 1 RCT / 13 weeks23 207 vs. 203 5 / 207 7 / 203 41.3 (96.6 vs. 137.9) Moderate High
Withdrawals short term
LOS, VAL 1 RCT / 13 weeks23 207 vs. 207/203 9/207 4/207, 5/203 79/75 (174 vs. 77, 174 vs. 99)
Moderate Low
SAE long term
VAL 1 CohSt / 146 weeks53
35'446 vs. 255'012 253 / 35'446 3'397 / 255'012 2.2 (2.5 vs. 4.8) Very low** High
Mor long term
VAL/IRB/TEL/LOS
1 CohSt / 120 weeks55
10'370 vs. 34'815 0 / 10'370 0 / 34'815 0.0 (0.0 vs. 0.0) Very low** High
Mor long term
Other ARBs 2 CohSt / 47 weeks57 59
42'696 vs. 126'979 85 / 42'696 809 / 126'979 3.8 (10.1 vs. 13.8) very low** High
SAE long term
CAN 1 CohSt / 146 weeks53
35'446 vs. 54'226 253 / 35'446 392 / 54'226 0.0 (2.5 vs. 2.6) Very low** High
SAE long term
Other ARBs 2 CohSt / 103 weeks48 59
162'000 vs. 779'326 33'573 / 162'000 182'427 / 779'326 19.1 (89.7 vs. 108.7) Very low** High
SAE long term
TEL 3 CohSt / 157 weeks52 53 56
35'849 vs. 51'177 256 / 35'849 433 / 51'177 -0.6 (4.3 vs. 3.7) Very low** High

54
Outcome Comparators Number of stud-ies/design/mean
duration
Total number of pa-tients
(OLM vs. comparator)
Events OLM Events comparator Absolute difference (events per 1'000 par-
ticipants per year)* rounding method*****
Quality of evidence
(see Table 28 and Table 29)
Importance of
outcome
ENT long term
CAN 1 CohSt / 52 weeks50
183'959 vs. 214'690 22 / 183'959 33 / 214'690 0.034 (0.120 vs. 0.154) Very low** High
ENT long term
IRB 1 CohSt / 52 weeks50
183'959 vs. 142'420 22 / 183'959 10 / 142'420 -0.049 (0.120 vs. 0.070) Very low** High
ENT long term
Other ARBs 4 CohSt / 72 weeks49 51 54 58
834'046 vs. 3'958'229
509 / 834'046 2'011 / 3'958'229 -0.031 (1.987 vs. 1.956) low*** High
ENT long term
TEL 1 CohSt / 52 weeks50
183'959 vs. 131'188 22 / 183'959 16 / 131'188 0.002 (0.120 vs. 0.122) Very low** High
ENT long term
VAL 1 CohSt / 52 weeks50
183'959 vs. 283'508 22 / 183'959 30 / 283'508 -0.014 (0.120 vs. 0.106) Very low** High
ARB = angiotensin II receptor blockers; CAN = candesartan; CohSt = cohort study; ENT = severe enteritis; HCTZ = hydrochlorthiazide; IHD = ischemic heart disease; IRB = irbesartan; LOS = losartan; OLM = olmesartan; Mor = mortality; MI = myocardial infarction; surg = surgery; SAE = severe adverse events; TEL = telmisartan; VAL = valsartan
** Only one study, multiple measures including combined measures, retrospective design, possible reporting bias, possible unbalanced study groups *** One study with moderate quality supports preferable evidence,51 the others have very low quality of evidence. Across all studies we rate the overall evidence as low **** Remarkable inconsistency: no events in two studies, few events ***** Every single number was rounded separately; deviations may result from internal roundings.
Source: authors’ own calculations
55
Summary statement on efficacy, effectiveness and safety
Seventeen RCTs evaluated the efficacy of OLM at lowering BP versus other ARBs. OLM lowered (sys-
tolic and diastolic) BP more effectively compared with LOS, and diastolic BP more effectively compared
with IRB. For OLM versus VAL, AZI, CAN and TEL as well as OLM and HCTZ versus TEL and HCTZ,
the results did not differ significantly. Overall, the differences in the effect on BP between different ARBs
were small (usually below 2 mmHg). No RCTs assessed critical/important outcomes such as cardiovas-
cular and cerebrovascular morbidity and mortality.
Based on one study of routine (real world) data, the differences in effectiveness in terms of absolute
numbers between OLM and other ARBs (VAL, LOS and IRB) were most striking for cardiac events
(composite outcome) and heart failure, showing a beneficial effect for OLM. In terms of the relative risk,
we could not confirm the findings of Swindle et al.,46 who reported that OLM use lowered the risk of
cardiac events (composite outcome) more effectively compared with other sartans (see Subsection 8.1.)
The comparisons regarding severe adverse events indicate similar risk profiles for OLM compared with
other sartans in short-term follow-up (based on the RCTs) and in the long-term follow-up (based on the
cohort studies).
In terms of safety, the data from two cohort studies suggest that OLM is associated with a (more or less
clearly defined) increased risk of enteropathies compared with other ARBs (but also indicate that not
only OLM is associated with a risk of enteropathies) while two other cohort studies found no significant
difference. The absolute risk (by different manifestations) is very small (between 0.05 and 2 events per
1'000 participants per year).
56
8 Costs, cost effectiveness and budget impact
8.1 Methodology costs, cost effectiveness and budget impact
8.1.1 Databases and search strategy
We conducted a systematic literature search (see Subsection 7.1.1) to retrieve relevant economic stud-
ies. The results are presented in Subsection 8.2.2 and Appendix D, Table 32.
8.1.2 Other sources
See Subsection 7.1.2. In addition, to identify cost and quantity data relevant for the calculation for Swit-
zerland, a manual literature search was done. Furthermore, the FOPH was consulted and provided
relevant information and data.
8.1.3 Assessment of quality of evidence
The quality of the economic studies retrieved from the systematic literature search was evaluated by
applying the Consensus Health Economic Criteria (CHEC) Checklist.102 For details on quality assess-
ment, see Appendix E, Subsection 14.5.
8.1.4 Methodology costs, cost efffectiveness and budget impact
Cost effectiveness
Estimating the effects
Based on the studies we identified in the literature search (see also Subsection 8.2.2), we did not find a
robust and reliable economic model to evaluate the cost effectiveness of OLM. There was a lack of
prospective comparative studies analysing adequate efficacy outcomes (that is, outcomes other than
surrogate parameters, like a reduction of BP). Therefore, the retrospective observational study by Swin-
dle et al.46 was used to estimate the clinical effects of OLM, meaning that the evidence base for estimat-
ing the clinical effects is low (for further details, see also Subsection 7.2).
The effects we used from Swindle et al.46 are the effects of OLM on cardiac events compared with
treatment using VAL, LOS and IRB. Cardiac events is a composite of different components including
myocardial infarction, stroke, heart failure and ischemic heart disease. These individual cardiac events
were also used for our effect estimation.
The effects in Swindle et al.46 are given as the number and proportion of patients with at least one event
(meaning that the composite outcome “cardiac event” is not the sum of its components). However, the
study by Swindle et al.46 only presented the numbers of cardiac events for each treatment group (OLM,
57
VAL, LOS, and IRB) at the end of follow-up (meaning that there was no before and after comparison).
Furthermore, the results of Swindle et al.46 did not show confidence intervals for the limited study sample
(=population without pre-existing conditions or risk factors); neither is the original study sample availa-
ble. Therefore, to increase the comparability between the event rates of the treatment groups and to
estimate their variation (by gaining confidence intervals), the results of the limited study sample were
bootstrapped in combination with the empirical Bayes methodology.a
Estimating the costs
The costs considered in the economic model cover direct treatment costs for the composite measure of
cardiac events including all its components (myocardial infarction, stroke, heart failure and ischemic
heart disease) and the costs for treatment with the individual sartan for one year (OLM, VAL, LOS and
IRB).
The costs for cardiac events and their related components (see “Estimating the effects” above) were
taken from Brändle et al.103 and converted into Swiss Francs (CHF) for the year 2018. For the cost
conversion, the online tool of the Campbell and Cochrane Economics Methods Group (CCEMG) and
the Evidence for Policy and Practice Information and Coordinating Centre (EPPI-Centre) was used (im-
plied inflation factor: 1.0337).104 The event costs included the costs for fatal events (considering, for
instance, emergency physicians, ambulance transport and hospitalisation) and non-fatal events (con-
sidering, for instance, inpatient treatment, rehabilitation and outpatient treatment), as well as for mainte-
nance (considering, for instance, phsyician visits). Brändle et al.103 was identified as the only compre-
hensive data source that considered comparable treatment costs for the outpatient and inpatient sector
due to cardiac events.b
The costs per year for treatment with each individual sartan were based on data from Swiss healthcare
insurances and the Spezialiltätenliste (SL).105,106
a Bootstrapping is a computing method intended to simulate virtual data when too few observations or repetitions of an experi-
ment are available for the law of large numbers to apply. The original method draws repetitively from the original sample and
data, creating new virtual samples in the process. Bootstrapping with the empirical Bayes methodology introduces a virtual prior
distribution to the model which is derived from the observed proportions reported in the paper by Swindle et al. This allows the
number of events occurring per 100’000 patients to be simulated for 50’000 virtual studies. In this way, we obtained an approxi-
mation for the differences in the number of events between the different drugs and also for the variation in these observations.
This corrects for the different sizes of patient populations in the original studies as well as for the lack of other studies to com-
bine information with.
b Even though we could have used more recent data (e.g. Swiss DRG data), the use of the data from Brändle et al. was consid-
ered a pragmatic approach to obtaining comprehensive treatment costs that occur in the outpatient and inpatient sector.
58
Calculating cost effectiveness
Cost effectiveness was calculated in two ways:
Costs per one more event averted by OLM, compared with VAL, LOS and IRB (comprising
cardiac events in general, myocardial infarction, stroke, heart failure and ischemic heart dis-
ease),
A crude incremental cost-effectiveness ratio of the cardiac events difference after treatment with
OLM compared with VAL, LOS and IRB.c
Cost perspective, time frame and discounting
The cost calculations (in CHF 2018) were performed from the perspective of the public health insurance
(public healthcare payer) and covered only direct treatment costs for the pharmaceutical and for cardiac
events (as stated above). Thus, potential co-payments by patients, which might reduce the costs for the
healthcare payer, were not considered.
The calculations were performed for a time frame of 1 year (and per patient).d Thus, discounting of the
costs was not applied. In Swindle et al. the patients in the limited study sample were followed up for at
least 1 year (mean 2.5 years).46
Sensitivity analysis
To control for the uncertainty of the calculated results, we applied two univariate sensitivity analyses for
an optimistic and pessimistic scenario respectively. However, the sensitivity analysis was applied exclu-
sively to the ICER results (an interpretation of the sensitivity analysis of the costs per event averted
would not be useful because the costs of harming patients or “negative” costs would occur due to the
above-mentioned issue of the wide confidence intervals). An overview of the scenarios of the sensitivity
analysis is shown in Table 10.
c Instead of QALYs, the rate of cardiac events and the corresponding components were used for estimating the incremental
effects.
d Due to the restricted clinical data from Swindle et al. which the calculations were based on, it was considered prudent to
choose the short time frame of 1 year.
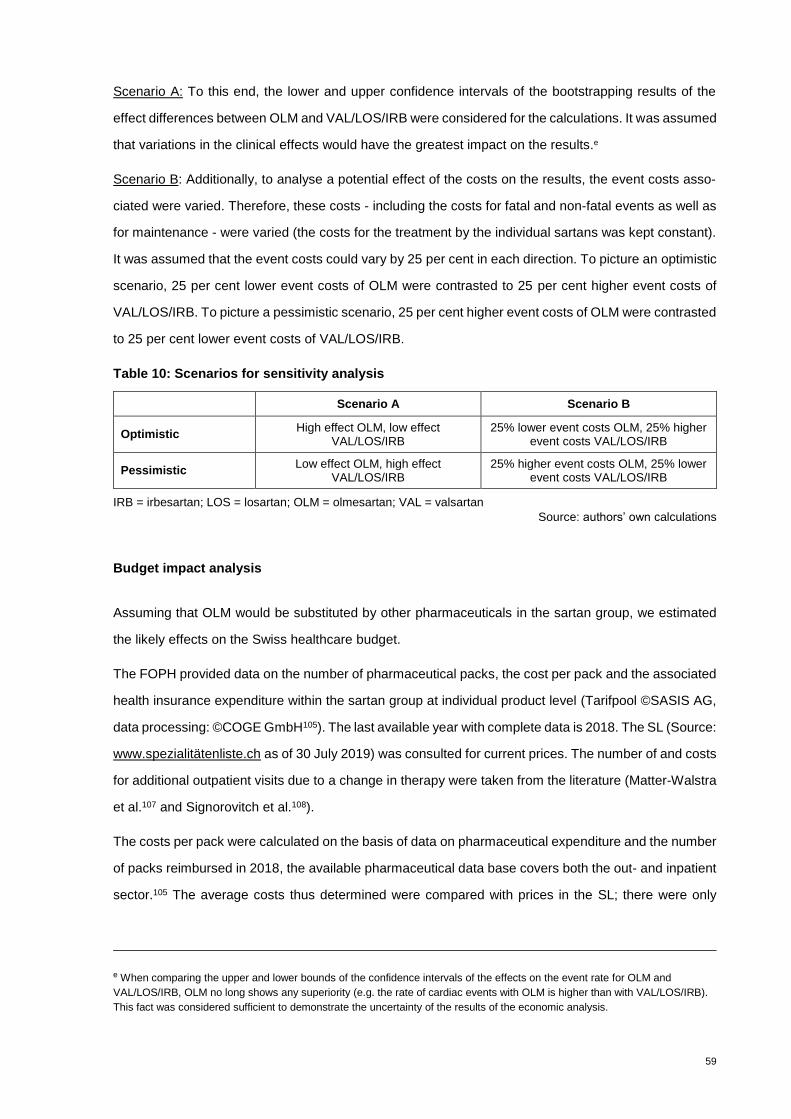
59
Scenario A: To this end, the lower and upper confidence intervals of the bootstrapping results of the
effect differences between OLM and VAL/LOS/IRB were considered for the calculations. It was assumed
that variations in the clinical effects would have the greatest impact on the results.e
Scenario B: Additionally, to analyse a potential effect of the costs on the results, the event costs asso-
ciated were varied. Therefore, these costs - including the costs for fatal and non-fatal events as well as
for maintenance - were varied (the costs for the treatment by the individual sartans was kept constant).
It was assumed that the event costs could vary by 25 per cent in each direction. To picture an optimistic
scenario, 25 per cent lower event costs of OLM were contrasted to 25 per cent higher event costs of
VAL/LOS/IRB. To picture a pessimistic scenario, 25 per cent higher event costs of OLM were contrasted
to 25 per cent lower event costs of VAL/LOS/IRB.
Table 10: Scenarios for sensitivity analysis
Scenario A Scenario B
Optimistic High effect OLM, low effect
VAL/LOS/IRB 25% lower event costs OLM, 25% higher
event costs VAL/LOS/IRB
Pessimistic Low effect OLM, high effect
VAL/LOS/IRB 25% higher event costs OLM, 25% lower
event costs VAL/LOS/IRB
IRB = irbesartan; LOS = losartan; OLM = olmesartan; VAL = valsartan
Source: authors’ own calculations
Budget impact analysis
Assuming that OLM would be substituted by other pharmaceuticals in the sartan group, we estimated
the likely effects on the Swiss healthcare budget.
The FOPH provided data on the number of pharmaceutical packs, the cost per pack and the associated
health insurance expenditure within the sartan group at individual product level (Tarifpool ©SASIS AG,
data processing: ©COGE GmbH105). The last available year with complete data is 2018. The SL (Source:
www.spezialitätenliste.ch as of 30 July 2019) was consulted for current prices. The number of and costs
for additional outpatient visits due to a change in therapy were taken from the literature (Matter-Walstra
et al.107 and Signorovitch et al.108).
The costs per pack were calculated on the basis of data on pharmaceutical expenditure and the number
of packs reimbursed in 2018, the available pharmaceutical data base covers both the out- and inpatient
sector.105 The average costs thus determined were compared with prices in the SL; there were only
e When comparing the upper and lower bounds of the confidence intervals of the effects on the event rate for OLM and
VAL/LOS/IRB, OLM no long shows any superiority (e.g. the rate of cardiac events with OLM is higher than with VAL/LOS/IRB).
This fact was considered sufficient to demonstrate the uncertainty of the results of the economic analysis.

60
minor differences between costs per pack and price per speciality in the SL due to possible discounts
in the inpatient sector. In addition to pharmaceutical expenditures, the costs for additional visits in the
course of switching from OLM to other sartans were included in the budget impact analysis.
The three scenarios mentioned below represent a range of possible budget impacts.
To estimate the implications of a potential substitution of OLM on the Swiss healthcare budget, the
allocation method was used. Three scenarios were simulated.
Scenario 1: OLM mono-preparations substituted by mono-preparations of alternative sartans, OLM
combination preparations substituted by combination preparations of alternative sartans, number of
packages prescribed in 2018 valued with costs per pack in 2018
In Scenario 1, the number of OLM preparations to be substituted was allocated to the other sartans
separately for mono- and combination preparations. The market share of packs of alternative sartan
preparations was used as the redistribution key. The assumption of redistribution according to the cor-
responding market share of the alternative preparations was made on the basis of experiences in Austria
(for details, see Appendix B, Table 27), where, after delisting OLM from the reimbursement list, it be-
came apparent that the prescriptions were not distributed equally amongst the alternative sartans. In-
stead, those preparations with a previously higher market share recorded a higher increase in prescrip-
tions than those with a lower market share (i.e. a trend towards the market leaders). The calculation
base for determining the new market share of the alternative sartans was the total number of packs of
mono- (2018: 1’155’282 packs) and combination preparations (2018: 221’001 packs) which were reim-
bursed in Switzerland in 2018 (see Appendix D, Table 34).
Table 11 illustrates the allocation method performed using a fictitious example.
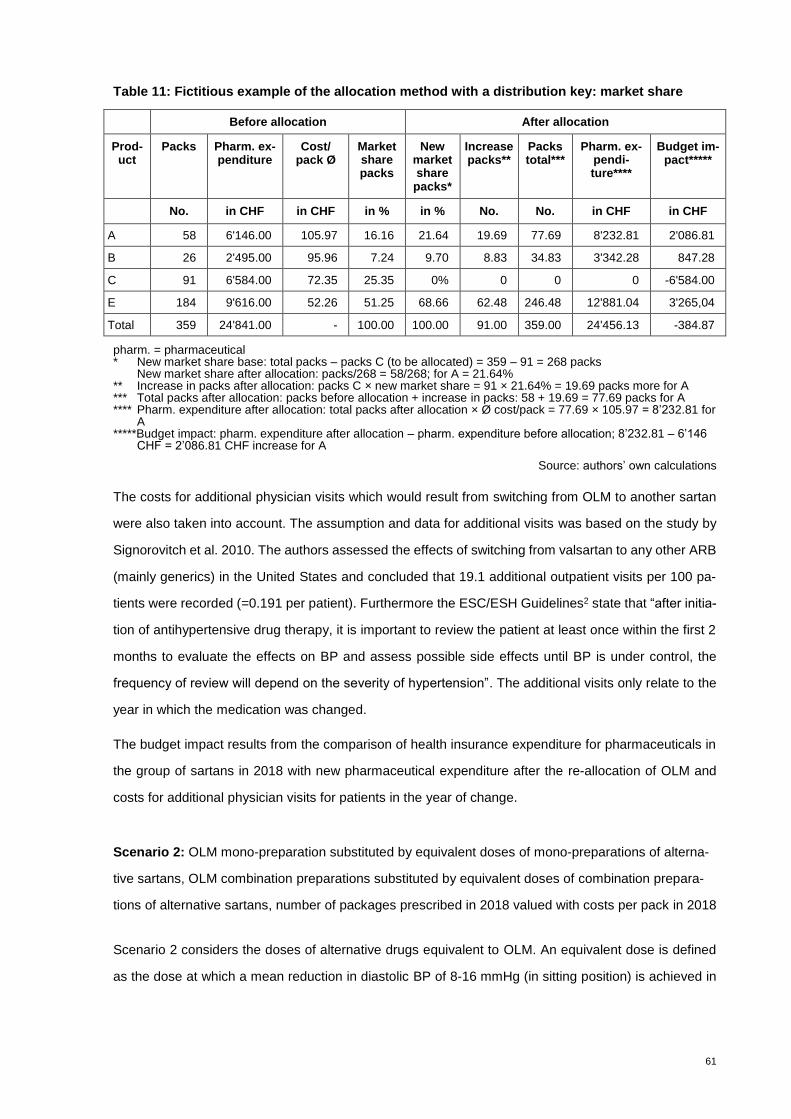
61
Table 11: Fictitious example of the allocation method with a distribution key: market share
Before allocation After allocation
Prod-uct
Packs Pharm. ex-penditure
Cost/ pack Ø
Market share packs
New market share
packs*
Increase packs**
Packs total***
Pharm. ex-pendi-ture****
Budget im-pact*****
No. in CHF in CHF in % in % No. No. in CHF in CHF
A 58 6'146.00 105.97 16.16 21.64 19.69 77.69 8'232.81 2'086.81
B 26 2'495.00 95.96 7.24 9.70 8.83 34.83 3'342.28 847.28
C 91 6'584.00 72.35 25.35 0% 0 0 0 -6'584.00
E 184 9'616.00 52.26 51.25 68.66 62.48 246.48 12'881.04 3'265,04
Total 359 24'841.00 - 100.00 100.00 91.00 359.00 24'456.13 -384.87
pharm. = pharmaceutical * New market share base: total packs – packs C (to be allocated) = 359 – 91 = 268 packs
New market share after allocation: packs/268 = 58/268; for A = 21.64% ** Increase in packs after allocation: packs C × new market share = 91 × 21.64% = 19.69 packs more for A *** Total packs after allocation: packs before allocation + increase in packs: 58 + 19.69 = 77.69 packs for A **** Pharm. expenditure after allocation: total packs after allocation × Ø cost/pack = 77.69 × 105.97 = 8’232.81 for
A *****Budget impact: pharm. expenditure after allocation – pharm. expenditure before allocation; 8’232.81 – 6’146
CHF = 2’086.81 CHF increase for A
Source: authors’ own calculations
The costs for additional physician visits which would result from switching from OLM to another sartan
were also taken into account. The assumption and data for additional visits was based on the study by
Signorovitch et al. 2010. The authors assessed the effects of switching from valsartan to any other ARB
(mainly generics) in the United States and concluded that 19.1 additional outpatient visits per 100 pa-
tients were recorded (=0.191 per patient). Furthermore the ESC/ESH Guidelines2 state that “after initia-
tion of antihypertensive drug therapy, it is important to review the patient at least once within the first 2
months to evaluate the effects on BP and assess possible side effects until BP is under control, the
frequency of review will depend on the severity of hypertension”. The additional visits only relate to the
year in which the medication was changed.
The budget impact results from the comparison of health insurance expenditure for pharmaceuticals in
the group of sartans in 2018 with new pharmaceutical expenditure after the re-allocation of OLM and
costs for additional physician visits for patients in the year of change.
Scenario 2: OLM mono-preparation substituted by equivalent doses of mono-preparations of alterna-
tive sartans, OLM combination preparations substituted by equivalent doses of combination prepara-
tions of alternative sartans, number of packages prescribed in 2018 valued with costs per pack in 2018
Scenario 2 considers the doses of alternative drugs equivalent to OLM. An equivalent dose is defined
as the dose at which a mean reduction in diastolic BP of 8-16 mmHg (in sitting position) is achieved in

62
patients with stages I to II of hypertension.109 Physicians should consider equivalent doses when switch-
ing from OLM to other sartans.
Firstly, the sartan preparations were grouped with regard to their equivalent dose for OLM. For example
20 mg OLM are equivalent to 80 mg VAL, 40 mg AZI, 8 mg CAN, 600 mg EPR, 150 mg IRB, 50 mg LOS
or 40 mg TEL. These alternative ARB doses form the equivalence group for OLM 20 mg. For details on
the equivalence groups, see the compilation published in the German Apothekerzeitung110 (Appendix
D, Table 32).
Within the equivalence groups, the OLM preparations were allocated to the equivalent alternative sar-
tans according to their market share (measured in packs) as in Scenario 1. However, in contrast to
Scenario 1, the basis for determining the new market share of packs was the total number of packs in
the specific equivalence group and not the total number of reimbursed packs of mono- or combination
preparations as in Scenario 1. The market shares and costs of the alternative sartans within the narrowly
defined equivalence groups used in Scenario 2 might differ from those assumed in Scenario 1. There-
fore, Scenario 2 might result in a different budget impact estimate than Scenario 1.
The new number of packs of alternative sartarns after re-allocation of OLM were also valued with the
costs per pack in 2018 as in Scenario 1. The costs for additional physician visits were the same as in
Scenario 1. Scenario 2 represents a more appropriate prescribing procedure from a medical point of
view.
Scenario 3: OLM mono-preparation substituted by equivalent doses of mono-preparations of alterna-
tive sartans, OLM combination preparations substituted by equivalent doses of combination prepara-
tions of alternative sartans, number of packages prescribed in 2018 valued with prices as of 1 August
2019.
Scenario 3 is like Scenario 2 except that the number of packs from 2018 are valued with the current
prices according to the SL106 as of 1 August 2019. The scenario is intended to illustrate the effects of
any price changes that may have taken place in 2019.
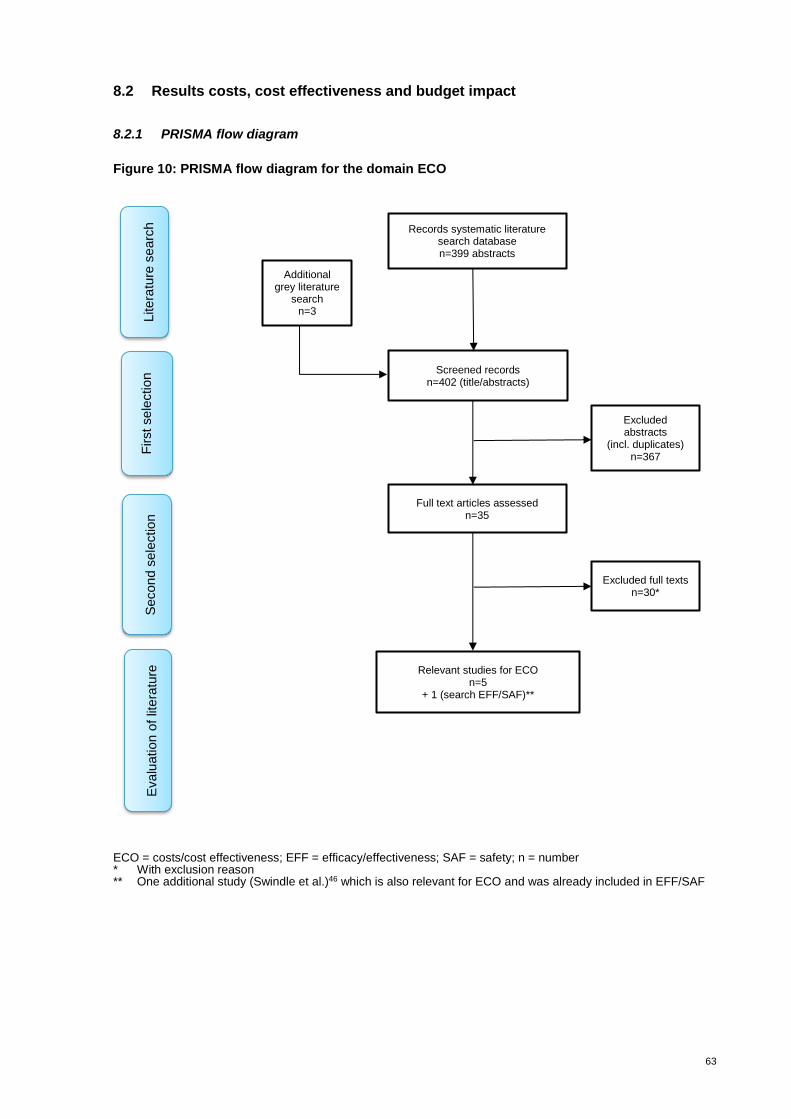
63
8.2 Results costs, cost effectiveness and budget impact
8.2.1 PRISMA flow diagram
Figure 10: PRISMA flow diagram for the domain ECO
ECO = costs/cost effectiveness; EFF = efficacy/effectiveness; SAF = safety; n = number * With exclusion reason ** One additional study (Swindle et al.)46 which is also relevant for ECO and was already included in EFF/SAF
Additional grey literature
search n=3
Records systematic literature search database n=399 abstracts
Screened records n=402 (title/abstracts)
Full text articles assessed n=35
Excluded full texts n=30*
Litera
ture
se
arc
h
First sele
ction
Secon
d s
ele
ctio
n
Excluded abstracts
(incl. duplicates) n=367
Relevant studies for ECO n=5
+ 1 (search EFF/SAF)**
Evalu
ation o
f lit
era
ture
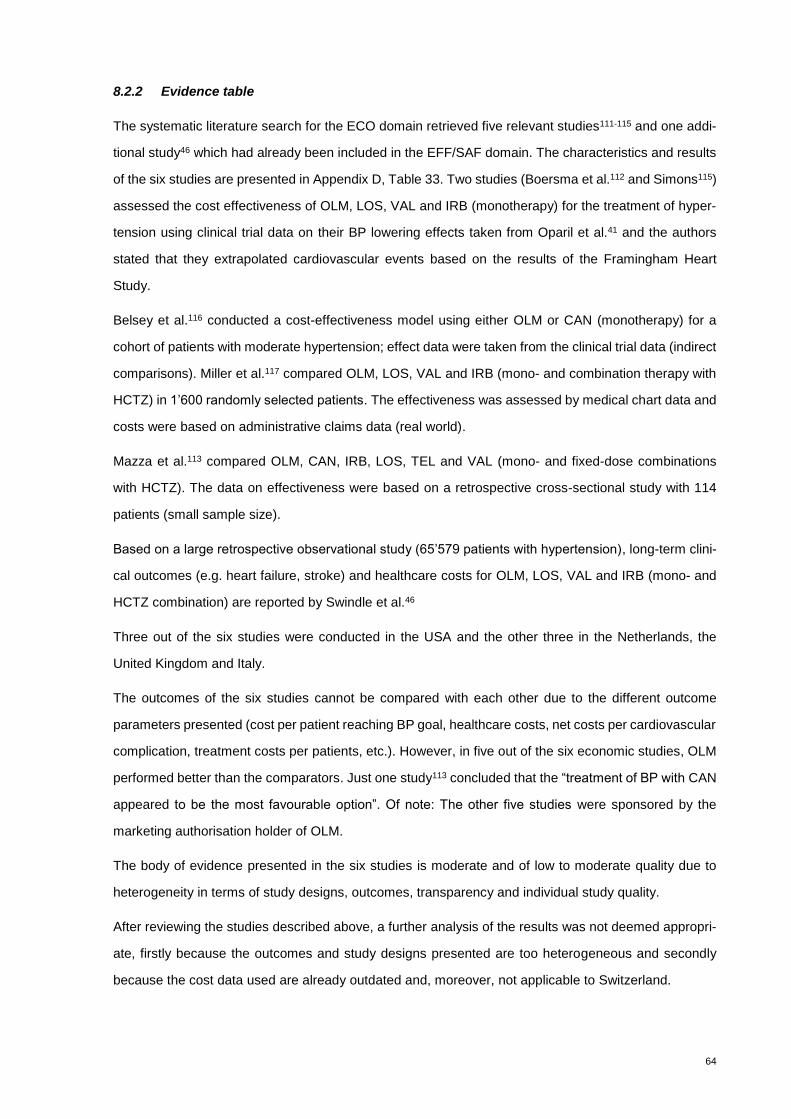
64
8.2.2 Evidence table
The systematic literature search for the ECO domain retrieved five relevant studies111-115 and one addi-
tional study46 which had already been included in the EFF/SAF domain. The characteristics and results
of the six studies are presented in Appendix D, Table 33. Two studies (Boersma et al.112 and Simons115)
assessed the cost effectiveness of OLM, LOS, VAL and IRB (monotherapy) for the treatment of hyper-
tension using clinical trial data on their BP lowering effects taken from Oparil et al.41 and the authors
stated that they extrapolated cardiovascular events based on the results of the Framingham Heart
Study.
Belsey et al.116 conducted a cost-effectiveness model using either OLM or CAN (monotherapy) for a
cohort of patients with moderate hypertension; effect data were taken from the clinical trial data (indirect
comparisons). Miller et al.117 compared OLM, LOS, VAL and IRB (mono- and combination therapy with
HCTZ) in 1’600 randomly selected patients. The effectiveness was assessed by medical chart data and
costs were based on administrative claims data (real world).
Mazza et al.113 compared OLM, CAN, IRB, LOS, TEL and VAL (mono- and fixed-dose combinations
with HCTZ). The data on effectiveness were based on a retrospective cross-sectional study with 114
patients (small sample size).
Based on a large retrospective observational study (65’579 patients with hypertension), long-term clini-
cal outcomes (e.g. heart failure, stroke) and healthcare costs for OLM, LOS, VAL and IRB (mono- and
HCTZ combination) are reported by Swindle et al.46
Three out of the six studies were conducted in the USA and the other three in the Netherlands, the
United Kingdom and Italy.
The outcomes of the six studies cannot be compared with each other due to the different outcome
parameters presented (cost per patient reaching BP goal, healthcare costs, net costs per cardiovascular
complication, treatment costs per patients, etc.). However, in five out of the six economic studies, OLM
performed better than the comparators. Just one study113 concluded that the “treatment of BP with CAN
appeared to be the most favourable option”. Of note: The other five studies were sponsored by the
marketing authorisation holder of OLM.
The body of evidence presented in the six studies is moderate and of low to moderate quality due to
heterogeneity in terms of study designs, outcomes, transparency and individual study quality.
After reviewing the studies described above, a further analysis of the results was not deemed appropri-
ate, firstly because the outcomes and study designs presented are too heterogeneous and secondly
because the cost data used are already outdated and, moreover, not applicable to Switzerland.

65
8.2.3 Findings costs
In 2018 the health insurances reimbursed a total of 2.4 million packs of ARBs resulting in expenditures
of around CHF 173 million. The average cost per pack (aggregated by substance class) was CHF 56.8
for mono-preparations and CHF 85.7 for combination preparations. Within the group of mono-prepara-
tions, EPR followed by AZI and then OLM had the highest average cost per pack in 2018. Within the
sartan-HCTZ combination preparations, EPR followed by TEL and AZI combination preparations
showed the highest costs per pack. Within the sartan-CCB combination preparations, the average costs
per pack for VAL and TEL combination preparations were higher than for OLM combination prepara-
tions. In the group of triple combinations with a sartan, HCTZ and CCBs, only VAL and OLM combination
preparations are available, the average cost per pack for the triple combination being slightly lower for
the OLM combination preparation. For details, see Appendix D, Table 34.
8.2.4 Findings cost effectiveness
The calculations in this section are based on limited clinical evidence from one single retrospective
observational study by Swindle et al.46 and are therefore purely explorative. Moreover, the costs con-
sidered in the economic model cover direct treatment costs for the composite measure of cardiac events
(including all its components) extracted from Brändle et al.103 and the costs for treatment with the indi-
vidual sartan for one year (based on data from Swiss healthcare insurances and the Spezialiltätenliste
SL105,106). Furthermore, in this section the results are rounded to two decimal places, whereas for the
calculations in the model no rounding was applied.
Please note that “cardiac event” is a composite outcome measure comprising the following components:
myocardial infarction (MI), stroke, heart failure and ischemic heart disease (IHD). Since a cardiac event
can comprise one or all of these components, the numbers, probabilities or costs of a cardiac event are
not necessarily the sum of these components (for further explanations, see Subsection 8.1.4.).
Cost supplemental data can be found in Appendix D, Table 35, Table 36, Table 37.
Effect estimation
The calculations to estimate the effects were based on the probability of the occurrence of cardiac
events, including MI, stroke, heart failure and IHD (see Table 12). For example, within a time frame of
at least one year, an MI occurred in 0.6 per cent of the patients and a cardiac event (composite outcome)
occurred in 3.25 per cent of the patients treated with OLM.
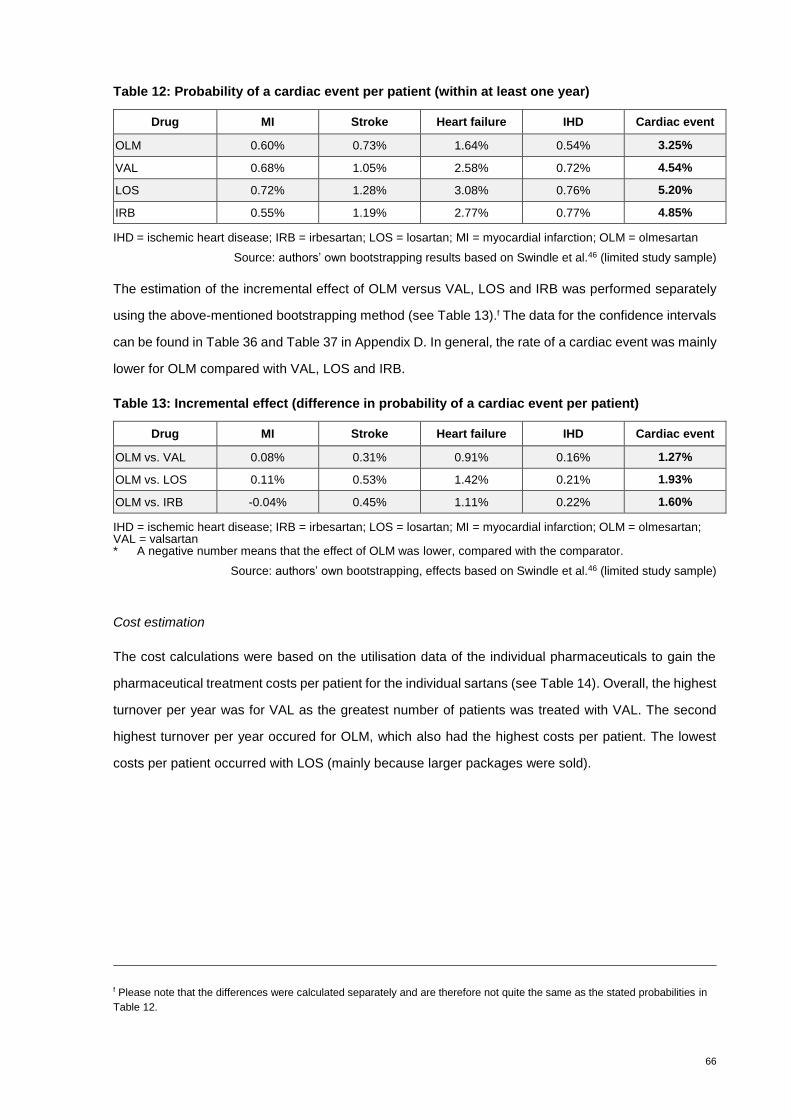
66
Table 12: Probability of a cardiac event per patient (within at least one year)
Drug MI Stroke Heart failure IHD Cardiac event
OLM 0.60% 0.73% 1.64% 0.54% 3.25%
VAL 0.68% 1.05% 2.58% 0.72% 4.54%
LOS 0.72% 1.28% 3.08% 0.76% 5.20%
IRB 0.55% 1.19% 2.77% 0.77% 4.85%
IHD= ischemic heart disease; IRB = irbesartan; LOS = losartan; MI = myocardial infarction; OLM = olmesartan
Source: authors’ own bootstrapping results based on Swindle et al.46 (limited study sample)
The estimation of the incremental effect of OLM versus VAL, LOS and IRB was performed separately
using the above-mentioned bootstrapping method (see Table 13).f The data for the confidence intervals
can be found in Table 36 and Table 37 in Appendix D. In general, the rate of a cardiac event was mainly
lower for OLM compared with VAL, LOS and IRB.
Table 13: Incremental effect (difference in probability of a cardiac event per patient)
Drug MI Stroke Heart failure IHD Cardiac event
OLM vs. VAL 0.08% 0.31% 0.91% 0.16% 1.27%
OLM vs. LOS 0.11% 0.53% 1.42% 0.21% 1.93%
OLM vs. IRB -0.04% 0.45% 1.11% 0.22% 1.60%
IHD = ischemic heart disease; IRB = irbesartan; LOS = losartan; MI = myocardial infarction; OLM = olmesartan; VAL = valsartan * A negative number means that the effect of OLM was lower, compared with the comparator.
Source: authors’ own bootstrapping, effects based on Swindle et al.46 (limited study sample)
Cost estimation
The cost calculations were based on the utilisation data of the individual pharmaceuticals to gain the
pharmaceutical treatment costs per patient for the individual sartans (see Table 14). Overall, the highest
turnover per year was for VAL as the greatest number of patients was treated with VAL. The second
highest turnover per year occured for OLM, which also had the highest costs per patient. The lowest
costs per patient occurred with LOS (mainly because larger packages were sold).
f Please note that the differences were calculated separately and are therefore not quite the same as the stated probabilities in
Table 12.

67
Table 14: Utilisation data on the use and costs per pharmaceutical and patient (in CHF 2018)
Drug* Turnover p.a. Patients treated p.a.** Costs per patient p.a.
OLM CHF 32'242'858.40 82’669 CHF 390.02
VAL CHF 52'214'745.08 150’223 CHF 347.58
LOS CHF 16'339'614.56 64’316 CHF 254.05
IRB CHF 22'587'169.48 76’514 CHF 295.20
CHF = Swiss Francs; IRB = irbesartan; LOS = losartan; OLM = olmesartan; p.a. = per annum; VAL = valsartan * Includes mono-preparations and fixed-dose combinations ** Rounded (for further calculations, non-rounded values were used)
Sources: authors’ own calculations based on Tarifpool ©SASIS AG, data processing: ©COGE GmbH;105 Spezialitätenliste, Schweizerische Eidgenossenschaft106
The cost calculations were also based on the treatment costs of a cardiac event. A cardiac event can
involve any one or a combination of the following: MI, stroke, heart failure or IHD. The event of a stroke
is associated with the highest costs (CHF 37’801), followed by MI (CHF 29’791), heart failure (CHF
19’606) and IHD (CHF 16’339).103 The total costs of a cardiac event are around CHF 27’485 (see Figure
11). These treatment costs comprise the costs for both fatal and non-fatal events as well as costs for
maintenance and were calculated using the weighted average costs of the individual components of a
cardiac event. Further information can be found in Table 35 in Appendix D.
Figure 11: Costs per event (in CHF 2018)
Source: Brändle et al.;103 including costs for fatal and non-fatal events and for maintenance
In a next step, the treatment costs per patient were calculated. These costs include the costs for the
pharmaceutical treatment with the sartan concerned, plus the proportionate costs for a cardiac event.
For example, in 2018 treatment with OLM cost CHF 390 (see Table 14), plus approx. CHF 29’791 for
MI in 0.6 per cent of the patients (see Figure 11), adding up to around CHF 569 (see Table 15).

68
Table 15: Treatment costs per patient (in CHF 2018)
Drug MI Stroke Heart failure IHD Cardiac event
OLM CHF 569.07 CHF 665.21 CHF 712.15 CHF 478.75 CHF 1'282.73
VAL CHF 550.46 CHF 745.25 CHF 852.64 CHF 465.55 CHF 1'594.16
LOS CHF 469.44 CHF 736.39 CHF 858.32 CHF 378.23 CHF 1'682.99
IRB CHF 459.35 CHF 746.17 CHF 838.49 CHF 421.18 CHF 1'628.49
IHD= ischemic heart disease; IRB = irbesartan; LOS = losartan; OLM = olmesartan; MI = myocardial infarction; VAL = valsartan
Source: authors’ own calculations
The estimation of the incremental costs of OLM versus VAL, LOS and IRB in Table 16 is based on the
costs from Table 15 above. Positive costs mean that the average treatment costs are higher for OLM
than the average treatment costs of the compared sartan (e.g. per patient, the treatment costs of OLM
are approx. CHF 19 higher compared with the treatment costs of VAL in the case of MI). Negative costs
mean that the average treatment costs are lower for OLM than with the compared sartan (e.g. per pa-
tient, the costs of OLM are around CHF 400 lower compared with LOS in the case of a cardiac event).
Table 16: Incremental costs per patient (difference in treatment costs, in CHF 2018)
Drug MI Stroke Heart failure IHD Cardiac event
OLM vs. VAL CHF 18.61 -CHF 80.03 -CHF 140.48 CHF 13.20 -CHF 311.42
OLM vs. LOS CHF 99.63 -CHF 71.18 -CHF 146.16 CHF 100.52 -CHF 400.26
OLM vs. IRB CHF 109.72 -CHF 80.95 -CHF 126.34 CHF 57.57 -CHF 345.76
IHD = ischemic heart disease; IRB = irbesartan; LOS = losartan; MI = myocardial infarction; OLM = olmesartan; VAL = valsartan * A negative number means that the costs of OLM were lower.
Source: authors’ own calculations from bootstrapping results based on Swindle et al.46 (limited study sample)
Costs per event averted
To estimate the costs per event averted, the number needed to treat (NNT) was calculated in a first
step. The NNT gives the number of patients that has to be treated with OLM to avert one additional
cardiac event compared with VAL, LOS and IRB. In this case, a positive NNT indicates a better effect
of OLM on events compared with VAL, LOS and IRB. The smaller this positive NNT, the higher the effect
of OLM.
Since the original study by Swindle et al.46 did not provide data on before and after comparisons, it was
not possible to calculate the NNT individually for the sartans.
For instance, compared with OLM there is an additional probability of 0.08 per cent for MI in patients
treated with VAL (see also Table 13). Consequently, a total of 1’266 patients have to be treated with
OLM to avert one additional MI than with VAL while 110 patients have to be treated with OLM to avert

69
one more heart failure than with VAL. To avert a cardiac event in general, 81, 76 and 75 patients have
to be treated with OLM compared with VAL, LOS and IRB respectively (see Table 17).
The calculated NNTs are based on the study by Swindle et al.46 The NNTs in Table 16 are mainly
positive, indicating a superiority of OLM compared with the other sartans. However, since the effect of
OLM on MI compared with IRB was worse (negative), this NNT is negative. In fact, this number repre-
sents the number needed to harm, meaning that 2’439 patients have to be treated with OLM to harm
one additional patient with MI.
Table 17: Number needed to treat per additional event averted (rounded)
Drug MI Stroke Heart failure IHD Cardiac event
OLM vs. VAL 1'266 319 110 613 79
OLM vs. LOS 917 187 71 488 52
OLM vs. IRB -2'439 223 90 460 63
IHD = ischemic heart disease; IRB = irbesartan; LOS = losartan; MI = myocardial infarction; OLM = olmesartan; VAL = valsartan
Source: authors’ own calculations from bootstrapping results based on Swindle et al.46 (limited study sample)
In a second step, the NNTs were multiplied by the treatment costs of OLM from Table 15. The results
are the costs of a treatment with OLM to avert one additional event (see Table 18).g
Overall, the data can be interpreted as follows: the lower the costs per event averted, the better the “cost
effectiveness” of OLM compared with the other sartans. For example, averting one additional cardiac
event with OLM costs around CHF 66’000 compared with LOS, CHF 80’000 compared with IRB and
CHF 101’000 compared with VAL. This indicates that OLM is more cost effective at averting cardiac
events compared with LOS and less cost effective compared with VAL.
However, the clinical data in the study by Swindle et al.46 indicated that IRB might be more effective at
averting MI than OLM. Thus, averting an additional MI with IRB compared with treatment with OLM
would cost nearly CHF 1.4 million (CHF 569 from Table 14 multiplied by 2’439). Consequently, the
relevant cell in the table below is declared as ‘n/a’.
g Please note that to estimate the costs per event averted, the exact NNT was used while the NNT presented in the report was
rounded.
70
Table 18: Costs of OLM per event averted per year and patient (comp. to VAL, LOS and IRB)
Drug MI Stroke Heart failure IHD Cardiac event
OLM vs. VAL CHF 720'339.37 CHF 212'528.38 CHF 78'517.49 CHF 293'709.30 CHF 101'321.60
OLM vs. LOS CHF 522'080.83 CHF 124'571.88 CHF 50'293.33 CHF 233'534.72 CHF 66'325.31
OLM vs. IRB n/a CHF 148'485.23 CHF 64'331.85 CHF 220'113.18 CHF 80'321.32
IHD = ischemic heart disease; IRB = irbesartan; LOS = losartan; MI = myocardial infarction; OLM = olmesartan; VAL = valsartan
Sources: authors’ own calculations based on Brändle et al.;103 Tarifpool ©SASIS AG, data processing: ©COGE GmbH;105 Spezialitätenliste, Schweizerische Eidgenossenschaft;106 authors’ own bootstrapping results, effects
based on Swindle et al.46 (limited study sample)
Incremental cost-effectiveness ratio (ICER)
To estimate the cost effectiveness per patient for the difference in rates of cardiac events (which is a
composite outcome measure comprising MI, stroke, heart failure and IHD) for treatment with OLM com-
pared with VAL, LOS and IRB, the results from Table 13 and Table 16 were considered. These results
are visualised in Figure 12 and can be summarised as follows:
- OLM is associated with higher effects and lower costs for cardiac events in general compared with
the other three sartans (VAL, LOS and IRB).
- In addition, OLM is associated with higher effects and lower costs for heart failure and stroke com-
pared with VAL, LOS and IRB (northwest quadrant).
- OLM is associated with higher effects but also higher costs for IHD compared with VAL, LOS and
IRB as well as for MI compared with VAL and LOS
- Conversely, OLM is associated with lower effects and higher costs for MI compared with IRB.

71
Figure 12: Cost-effectiveness ratio of OLM (compared with VAL, LOS and IRB)
ICER = incremential cost-effectiveness ratio; IRB = irbesartan; LOS = losartan; VAL = valsartan
Sources: authors’ own calculations based on Brändle et al.;103 Tarifpool ©SASIS AG, data processing: ©COGE
GmbH;105 Spezialitätenliste, Schweizerische Eidgenossenschaft;106 authors’ own bootstrapping results, effects
based on Swindle et al.46 (limited study sample)
The ICER in this report was calculated by dividing the cost difference (incremental costs) by the effect
difference (incremental effects) between OLM and the other sartans (VAL, LOS and IRB). The effect
difference is measured as the difference in the occurrence of events per patients (cardiac events, in-
cluding the components MI, stroke, heart failure and IHD). Thus, the ICER is not given in units (e.g. CHF
per QALY).h
Overall, the calculated ICER per patient for cardiac events was between -20’000 and -25’000 for OLM
compared with VAL, LOS and IRB. The incremental cost-effectiveness ratios (ICER) per patient are
summarised in Table 19 (results from Table 13 divided by results from Table 16).
h The ICER in this report would be CHF per occurence in cardiac events (or its composite).

72
Table 19: ICER (incremental costs per incremental effect)
Drug MI Stroke Heart failure IHD Cardiac event
OLM vs. VAL 23'556.72 -25'569.38 -15'488.79 8'095.23 -24'599.12
OLM vs. LOS 91'400.32 -13'329.09 -10'322.18 49'031.75 -20'695.86
OLM vs. IRB -267'601.57 -18'069.88 -11'412.57 26'467.71 -21'650.67
ICER = incremental cost-effectiveness ratio; IHD = ischemic heart disease; IRB = irbesartan; LOS = losartan; MI = myocardial infarction; OLM = olmesartan; VAL = valsartan
Sources: authors’ own calculations based on Brändle et al.;103 Tarifpool ©SASIS AG, data processing: ©COGE GmbH;105 Spezialitätenliste, Schweizerische Eidgenossenschaft;106 authors’ own bootstrapping results, effects
based on Swindle et al.46 (limited study sample)
Sensitivity analysis
The sensitivity analysis was calculated for four different scenarios and only for the costs and effects on
cardiac events (basic scenario are the above calculated results):
- Scenario A:
o Optimistic: OLM has a high effect while VAL, LOS and IRB have a relatively low
effect.
o Pessimistic: OLM has a low effect while VAL, LOS and IRB have a relatively high
effect.
- Scenario B:
o Optimistic: OLM is associated with 25 per cent lower event costs while VAL, LOS and
IRB are associated with 25 per cent higher event costs (compared with the basic sce-
nario).
o Pessimistic: OLM is associated with 25 per cent higher event costs while VAL, LOS
and IRB are associated with 25 per cent lower event costs (compared with the basic
scenario).
To assume a low effect of OLM, the lower bounds of the confidence intervals from the bootstrapping
results were applied to the economic model. To assume a high effect of OLM, the upper bounds of the
conficdence intervals were applied (see also Table 38 and Table 39 in Appendix D).
When assuming a high effect of OLM (Scenario A: optimistic), treatment with OLM is highly cost effective
for all considered events in the applied model (cardiac events in general, plus MI, stroke, heart failure
and IHD). When assuming a low effect of OLM (Scenario A: pessimistic), treatment with OLM is not cost
effective (higher costs and higher rates of events). Since the costs in our model depend on the event
rate, variation in the events (Scenario A) has an effect on the costs.

73
When assuming 25 per cent lower event costs for OLM and 25 per cent higher event costs for VAL, LOS
and IRB (Scenario B: optimistic), OLM is also cost effective for nearly all considered event models (car-
diac events in general, plus MI, stroke, heart failure and IHD). However, when assuming 25 per cent
higher event costs for OLM and 25 per cent lower event costs for VAL, LOS and IRB (Scenario B:
pessimistic), treatment with OLM can still be considered cost effective in the majority of the considered
events but at higher costs than for VAL, LOS and IRB.
The results of the sensitivity analysis of the costs and effects for all cardiac events are visualised in
Figure 13 (including the basic scenario calculated above). The numeric results of the sensitivity analysis
for the individual events are shown in Table 38 and Table 39 in Appendix D.
Nevertheless, the sensitivity analysis shows that the calculated cost-effectiveness results are not robust.
This is mainly due to the study results in Swindle et al.46 that did not show a statistically significant
difference in the occurrence of events and due to the wide confidence intervals from the bootstrapping
results.
Figure 13: Results of the sensitivity analysis
Sources: authors’ own calculations based on Brändle et al.;103 Tarifpool ©SASIS AG, data processing: ©COGE GmbH;105 Spezialitätenliste, Schweizerische Eidgenossenschaft;106 authors’ own bootstrapping results, effects
based on Swindle et al.46 (limited study sample)
74
8.2.5 Findings budget impact
In Scenario 1, the re-allocation of 111’470 packs of OLM mono- and 221’000 packs of combination
preparations to alternative sartans (allocated by individual market share, base: market share for mono-
or combination preparations) results in a total savings effect on pharmaceutical expenditure of around
CHF 7.4 million (CHF 2.9 million on mono- and CHF 4.5 million on combination preparations). Additional
physician visits account for around CHF 2.6 million so that the total net budget savings are around CHF
4.8 million. For details, see Appendix D, Table 42.
Additional physician visits due to a potential delisting of OLM will only occur for OLM patients and just
during the time after switching to an alternative ARB. Additional physician visits for patients starting a
new antihypertensive therapy after the delisting of OLM will not be necessary.
Scenario 2 (allocated to equivalent groups) indicates a different picture. In the case of mono-prepara-
tions, there is a saving potential of around CHF 2.0 million and additional pharmaceutical expenditure
of CHF 0.7 million for combination preparations. The budget impact on pharmaceutical expenditure thus
amounts to a saving potential of CHF 1.3 million. Including additional visits to physicians (CHF 2.6 mil-
lion), the total net budget impact in Scenario 2 results in additional expenses of around CHF 1.3 million
(Appendix D, Table 43).
The differences in the results of scenarios 1 and 2 are mainly for the following reasons:
Mono-preparations: In Scenario 2, for OLM 10 mg with pack sizes of 98 and 100 units, only two equiv-
alent alternative products were available in 2018: Edarbi™ 20 mg (AZI) and Actavis™ 25 mg (LOS).
The cost per pack for Edarbi™ (CHF 90.6) was significantly higher than for OLM preparations (the av-
erage costs per pack for OLM products ranged between CHF 63.0 and CHF 81.4). Although the cost
per pack for Actavis™, a generic, was considerably lower (CHF 37.8) than the cost of OLM products,
this did not have an impact on the budget because the market share of the LOS product was negligible
in 2018. Therefore, almost all OLM preparations (33’272 OLM packs in total) were allocated to the more
expensive AZI product, achieving a market share on packs of 99.8 per cent after re-allocation. This
resulted in additional expense of just under CHF 0.5 million for this group. However, if the market share
of LOS (Actavis™) increased in the future, this would reduce the additional expense.
In all other equivalence groups within the mono-preparations, budget savings were achieved but not to
the same extent as in Scenario 1.
Combination preparations: In Scenario 2 the equivalence group "sartans and HCTZ” resulted in budget
savings of about CHF 1.2 million while Scenario 1 for this subgroup showed a budget increase of CHF
75
5.5 million. This is due to the fact that Scenario 1 did not take into account whether combinations con-
tained two or three active substances; only the market share within the whole group of combination
products determined the distribution key.
In contrast, Scenario 1 showed budget savings of CHF 4.4 million for combination products with CCB
and CHF 5.6 million for triple combinations with CCB and HCTZ. In comparison, Scenario 2 resulted in
a budget increase of CHF 1.8 million for combination preparations with CCB. The increase in expendi-
ture is explained by the fact that the cost per pack for many combination preparations with the two
available comparator substances (VAL and CCBs as well as TEL and CCBs), especially those which an
already had a high market share (ExforgeTM), were significantly higher than those of the combination
preparations of OLM and CCBs. In the equivalence group of triple combinations with CCBs and HCTZ
there was a small budget increase of CHF 0.04 million.
In the equivalence group for OLM and CCBs (ATC code CDB01-04), the only available alternatives are
VAL and CCBs or TEL and CCBs. Before the re-allocation of OLM, VAL and CCBs already had a market
share of around 58 per cent, with OLM and CCBs at around 38 per cent and TEL and CCBs at 4 per
cent. The original preparations of VAL and CCBs (ExforgeTM) with the highest market share in this group
showed a higher cost per pack than the original comparator of OLM and CCBs (SevikarTM), which re-
sulted in additional expenditure of around CHF 1.8 million after re-allocation in this group.
Scenario 3 differs from Scenario 2 in that the number of reimbursed packs from 2018 were valued with
current prices (Spezialitätenliste as of 1 August 2019). For many preparations, the prices increased
compared with 2018, with the effect that a budget saving of about CHF 1.2 million for mono-preparations
and additional pharmaceutical expenditures of about CHF 1.2 million for combination preparations oc-
curred. Including additional doctor visits, the net budget impact for the health insurance results in an
increase of CHF 2.6 million. For details, see Appendix D, Table 44.
Figure 14 presents a comparison of the results of the three scenarios.
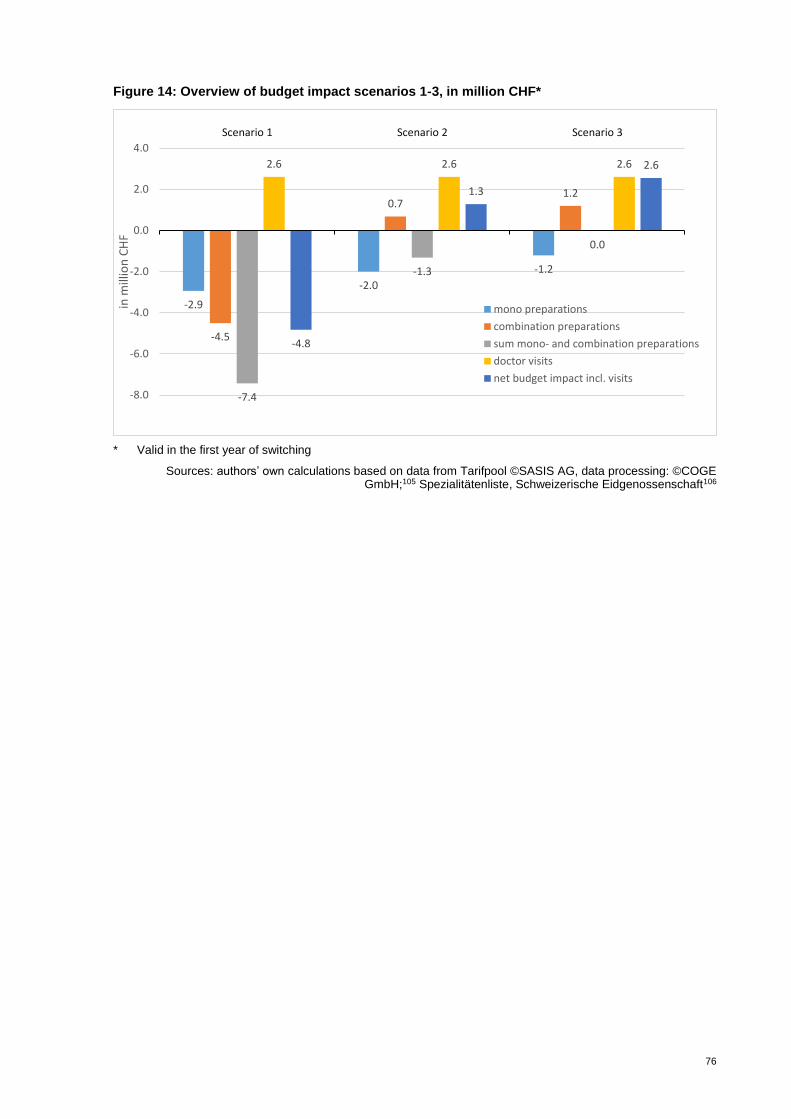
76
Figure 14: Overview of budget impact scenarios 1-3, in million CHF*
* Valid in the first year of switching
Sources: authors’ own calculations based on data from Tarifpool ©SASIS AG, data processing: ©COGE GmbH;105 Spezialitätenliste, Schweizerische Eidgenossenschaft106
-2.9
-2.0
-1.2
-4.5
0.71.2
-7.4
-1.3
0.0
2.6 2.6 2.6
-4.8
1.3
2.6
-8.0
-6.0
-4.0
-2.0
0.0
2.0
4.0
Scenario 1 Scenario 2 Scenario 3in
mill
ion
CH
F
mono preparations
combination preparations
sum mono- and combination preparations
doctor visits
net budget impact incl. visits
77
Summary statement on costs, cost effectiveness and budget impact
Costs
In 2018, 2.4 million packs of sartans were sold, amounting to pharmaceutical expenditures of CHF 173
million overall for the health insurance. The average costs per pack for mono-preparations for OLM were
the third highest (CHF 80.61) while EPR showed the highest costs per pack at CHF 95.68 followed by
AZI at CHF 92.24 (for details, see Appendix D, Table 28). There are no generic drugs available for EPR
and AZI. Within the group of combination preparations with HCTZ, the average costs per pack of EPR
and HCTZ, TEL and HCTZ as well as AZI and HCTZ were higher than that of OLM and HCTZ. Likewise
the average costs per pack for the comparator substance VAL and CCBs were higher than that of OLM
and CCBs. For the triple combination with HCTZ and CCBs, the average costs per pack for the VAL
triple combination were slightly higher than those for the OLM triple combination. For details, see Ap-
pendix D,Table 34.
Cost effectiveness
In general, our calculations suggest that OLM is associated with higher effects and lower costs for car-
diac events compared with VAL, LOS and IRB. The calculated ICER per patient for cardiac events was
between -20’000 and -25’000 for OLM compared with VAL, LOS and IRB. Nevertheless, the sensitivity
analysis has shown that in a pessimistic scenario, OLM is no longer cost effective. Thus, the results of
the cost-effectiveness calculations in the present report are not robust enough to draw any conclusion.
Budget impact
Considering only pharmaceutical expenditures, there would be budget savings for the health insurance
of CHF 7.4 million in Scenario 1, CHF 1.3 million in Scenario 2 and no savings in Scenario 3.
However, taking into account the additional outpatient visits, the net budget impact ranges between CHF
savings of 4.8 million (Scenario 1), further expenses of CHF 1.3 million (Scenario 2) and further ex-
penses of CHF 2.6 million (Scenario 3).
The budgetary effects of a substitution of OLM depend strongly on the alternative preparations available
within the equivalence group – their specific prices and market shares – as well as the expenditure for
additional visits to physicians in the course of changing medication. Therefore, if the physicians pre-
scribe equivalent doses for OLM, it is more likely that additional expenses will occur overall (Scenarios
2 and 3).

78
9 Legal, social and ethical issues
9.1 Methodology legal, social and ethical issues
9.1.1 Databases and search strategy
In the scoping report, no studies were identified that directly address legal, social or ethical issues re-
lated to OLM therapy in hypertensive patients in Switzerland. Therefore, a systematic and widened lit-
erature search on legal, social and ethical issues was conducted for the HTA in MEDLINE and EMBASE.
The search terms included a combination of keywords and medical subject headings (MeSH) relating to
ethical and social issues (e.g. health service accessibility, physician-patient communication, patient at-
titude) and organisational issues (e.g. medication switch, drug substitution). The search was conducted
in English and no time restrictions were set concerning the year of publication. The detailed search
strategies are outlined in Appendix B, Table 24.
9.1.2 Assessment of the quality of evidence
All potentially relevant studies and articles were included; no quality assessment was carried out.
9.1.3 Methodology data analysis legal, social and ethical issues
In order to identify and describe relevant legal, social and ethical issues, assessment elements from the
EUnetHTA core model118 were checked. Additionally, the four principles described by Beauchamp119
(as guiding principles for ethical aspects) and the “Morally Relevant Questions with Respect to As-
sessing Health Technology” by Hofmann120 were checked and additional ethical issues were added if
they did not overlap with the EUnetHTA checklist. These steps were done in an iterative process. The
results of the potentially relevant full texts identified in the systematic literature search are described
narratively to the extent that they are relevant to the questions.
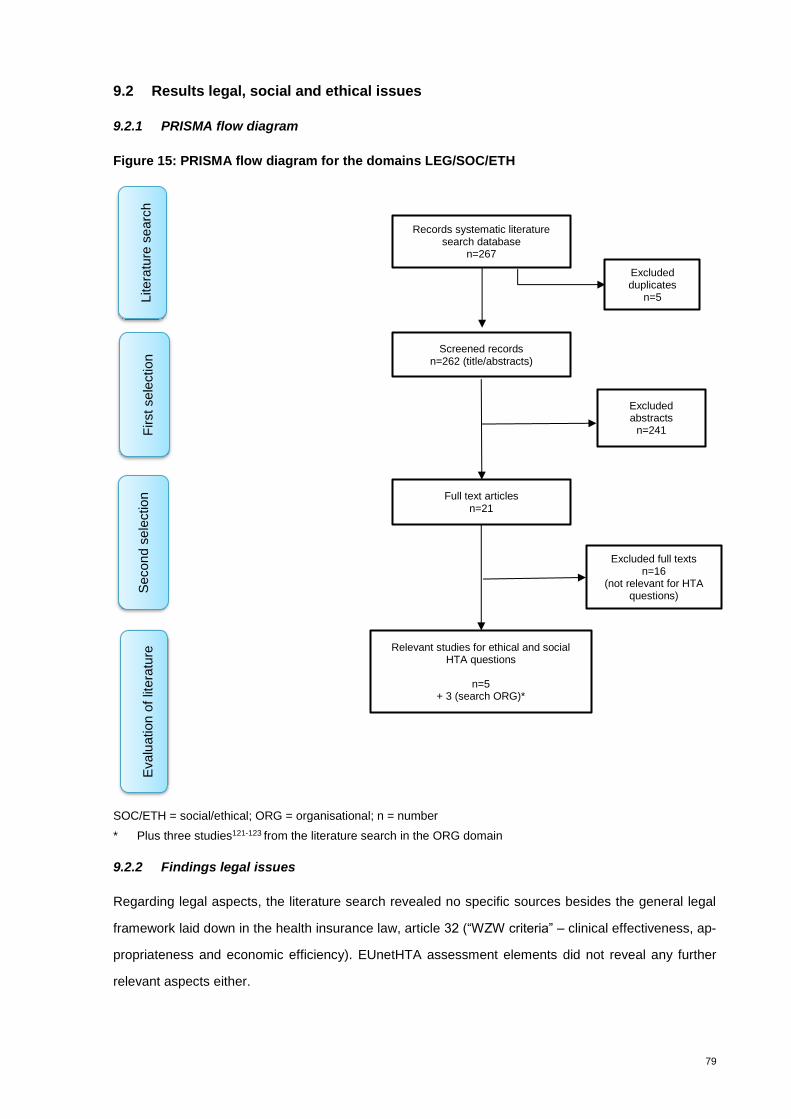
79
9.2 Results legal, social and ethical issues
9.2.1 PRISMA flow diagram
Figure 15: PRISMA flow diagram for the domains LEG/SOC/ETH
SOC/ETH = social/ethical; ORG = organisational; n = number
* Plus three studies121-123 from the literature search in the ORG domain
9.2.2 Findings legal issues
Regarding legal aspects, the literature search revealed no specific sources besides the general legal
framework laid down in the health insurance law, article 32 (“WZW criteria” – clinical effectiveness, ap-
propriateness and economic efficiency). EUnetHTA assessment elements did not reveal any further
relevant aspects either.
Records systematic literature search database
n=267
Screened records n=262 (title/abstracts)
Full text articles n=21
Excluded full texts n=16
(not relevant for HTA questions)
Relevant studies for ethical and social HTA questions
n=5
+ 3 (search ORG)*
Litera
ture
se
arc
h
First sele
ction
Secon
d s
ele
ctio
n
Evalu
ation o
f lit
era
ture
Excluded abstracts
n=241
Excluded duplicates
n=5
80
In total eight studies121-128 addressed some aspects of social or ethical issues:
9.2.3 Findings social issues
Checking the social domain in the EUnetHTA core model for relevant social aspects, we deemed ques-
tions relating to communication with patients to be most relevant. Drug adherence has an important
effect on treatment outcomes. Hence, ensuring that patients continue to take an antihypertensive agent
after a potential disinvestment decision is paramount. The literature search revealed information on
factors influencing drug adherence and the impact of drug switching on treatment outcomes. However,
we identified no studies that focused specifically on communication aspects to ensure adherence when
switching from OLM to another, broadly therapeutically equivalent hypertensive agent.
Amongst other factors, adherence to medication is influenced by patients’ expectations and views.
Switching may cause anxiety and confusion, especially in the elderly, or result in a “nocebo effect”,
where patients’ negative expectations lead to adherence problems and, subsequently, worse clinical
outcomes.121 123 This problem might be addressed by providing adequate patient education: A Greek
observational study found counselling to be effective in improving treatment adherence.123
In general, the patient-physician relationship is frequently cited as an important factor influencing adher-
ence to treatment. Specifically, communication skills, trust in the physician and overall patient satisfac-
tion have been found to be associated with greater adherence.127 Other factors that are believed to have
a positive effect on adherence include confidence in the health system, routine visits to the same service
or doctor and the number of visits.124 These findings should be taken into account to mitigate the poten-
tial negative consequences of delisting OLM from reimbursement.
The end of OLM reimbursement in France in 2017 was accompanied by decreased BP control in those
patients who were switched to an alternative ARB. However, it is worth noting that these results are
based on only two home BP monitorings on OLM and a single home BP monitoring 4 weeks after the
therapy switch.122 In contrast, a retrospective cohort study128 investigating compliance, persistence and
switching patterns did not detect any significant variations between different ARBs. In general, major
adherence problems are not anticipated in the case of drug substitution due to the variety of other avail-
able sartans and their favourable tolerability profile compared with other antihypertensive drugs such as
diuretics and beta blockers.125 126
In order to ensure the maintenance of BP control following drug substitution, physicians also need to
receive appropriate guidance and information on equivalent doses of drugs within the same therapeutic
class, which is currently not always the case.123
81
9.2.4 Findings ethical issues
The EUnetHTA checklists for relevant ethical aspects revealed that several questions – in principle –
are relevant, comprising issues regarding the benefit-harm balance (an issue overlapping with the EFF
and SAF domains), justice and equity (partly overlapping with the ECO domain) as well as potential
ethical consequences with regard to the chosen methodological approach (e.g. choice of endpoints, cut-
off values or assumptions in the economic evaluation). With regard to justice and equity, ethical consid-
erations include the question as to how access to OLM would be affected by a disinvestment decision.
In general, major access problems upon OLM disinvestment are not expected due to the variety of other
sartans available. They provide the same flexibility in terms of dose titration and therefore equivalent
dosage can be achieved. Regarding fixed-dose combinations, all sartans offer combination therapies
(for example, in combination with HCTZ, CCBs or both). However, the only other 3-drug fixed-dose
combination therapy currently available in Switzerland is for VAL, which might have a negative impact
on access for patients on multidrug regimes in case OLM reimbursement was ceased. Compared with
extemporaneous combinations, fixed-dose combinations are associated with improved adherence be-
cause they reduce the complexity of the therapeutic scheme.121
In terms of the methodological approach, it must be noted that studies evaluating OLM’s efficacy com-
pared with other sartans focus on BP, a surrogate outcome. The benefit for relevant clinical endpoints
such as cerebrovascular or cardiovascular events has not yet been firmly established. Hence, caution
is warranted when interpreting the results of OLM’s relative effectiveness.
Summary statement on legal, social and ethical issues
Patients’ adherence to BP medication may be negatively influenced by medication switching, which
could cause insufficient BP control and potentially poor clinical outcomes. Hence, adequate communi-
cation about the importance of adherence is a key factor influencing treatment success. The evidence
base for assessing communication aspects when switching from OLM to another compound appears to
be scant. In general, patients’ negative expectations towards a new drug might be managed by educa-
tion and motivation as well as a high-quality doctor-patient relationship built on trust. Overall, major
adherence problems are not expected as a result of a potential disinvestment decision because a variety
of other sartans is available in Switzerland; however for triple combinations and some double combina-
tions, the choice of comparator products may be somewhat limited. Apart from ensuring patients’ ad-
herence, physicians should prescribe equivalent doses to ensure BP control after drug substitution.
82
10 Organisational issues
10.1 Methodology organisational issues
10.1.1 Databases and search strategy
In the scoping report no studies were identified that directly addressed organisational issues in Switzer-
land. Therefore a systematic and widened literature search was conducted for the HTA in MEDLINE
and EMBASE. The search terms included a combination of keywords and medical subject headings
(MeSH) relating to organisational issues (e.g. medication switch, drug substitution). The search was
conducted in English and no time restrictions were set concerning the year of publication. The detailed
search strategies are outlined in Appendix B, Table 25.
10.1.2 Other sources
In addition to the systematic literature search, inquiries were made to various stakeholders regarding
their experiences with the withdrawal of OLM in Austria and France (for documentation, see Appendix
B, Table 27).
10.1.3 Assessment of quality of evidence
All potentially relevant studies and articles were included; no quality assessment was carried out.
10.1.4 Methodology data analysis organisation issues
The results are based on the widened literature search as well as on responses gathered from the
inquiries in Austria. Unfortunately we got no reply to our questions from France.
The studies identified in the systematic literature search are described narratively to the extent that they
are relevant to the question.
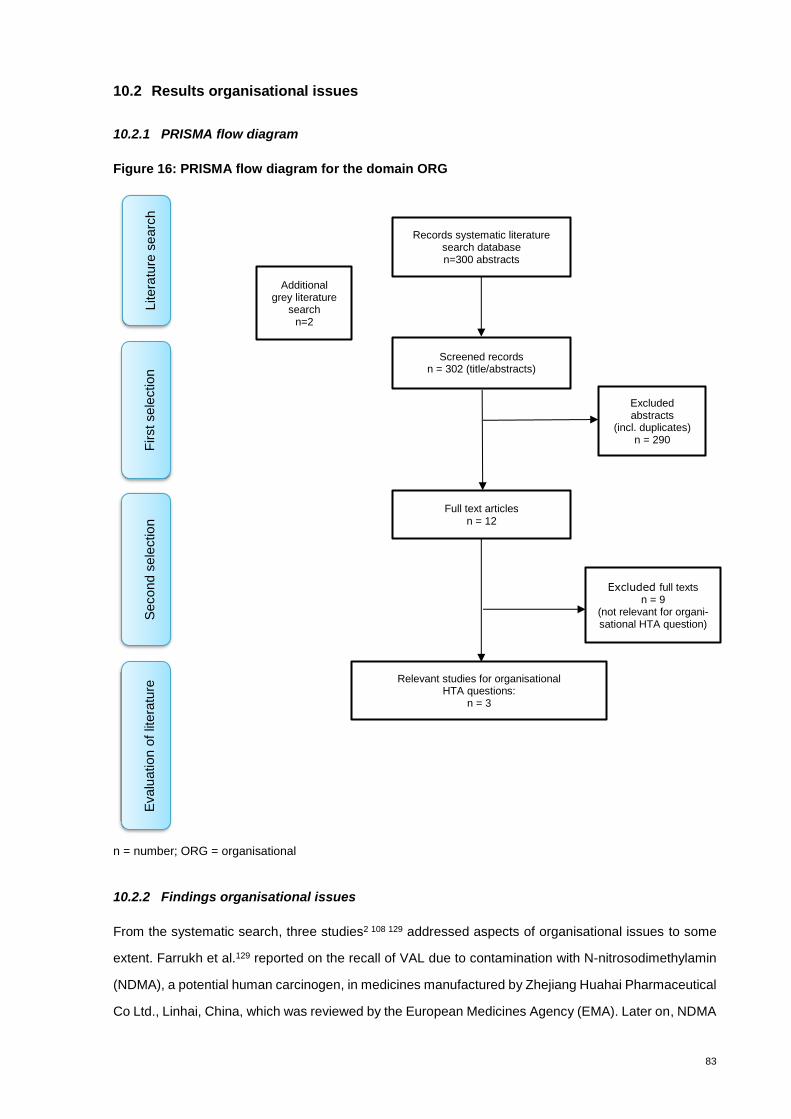
83
10.2 Results organisational issues
10.2.1 PRISMA flow diagram
Figure 16: PRISMA flow diagram for the domain ORG
n = number; ORG = organisational
10.2.2 Findings organisational issues
From the systematic search, three studies2 108 129 addressed aspects of organisational issues to some
extent. Farrukh et al.129 reported on the recall of VAL due to contamination with N-nitrosodimethylamin
(NDMA), a potential human carcinogen, in medicines manufactured by Zhejiang Huahai Pharmaceutical
Co Ltd., Linhai, China, which was reviewed by the European Medicines Agency (EMA). Later on, NDMA
Records systematic literature search database n=300 abstracts
Screened records n = 302 (title/abstracts)
Full text articles n = 12
Excluded full texts n = 9
(not relevant for organi-sational HTA question)
Relevant studies for organisational HTA questions:
n = 3
Litera
ture
se
arc
h
First sele
ction
Secon
d s
ele
ctio
n
Evalu
ation o
f lit
era
ture
Excluded abstracts
(incl. duplicates) n = 290
Additional grey literature
search n=2
84
impurity was also detected in a product from a second manufacturer (Zhejiang Tianyu, Taizhou, China).
After the EMA review, 24 European countries (Switzerland was not mentioned) recalled 2’300 batches
of VAL products. In September 2018, the EMA reported another impurity, N-Nitrosodiethylamin (NDEA),
also in a product manufactured by Zhejiang Huahai. On 31 January 2019, EMA recommended that
companies producing sartan BP medicines have to review their manufacturing processes so that they
do not produce nitrosamine impurities. Companies have a transition period of 2 years to make any
necessary changes, during which strict temporary limits on the levels of these impurities will apply. After
this period, companies have to demonstrate that their sartan products have no quantifiable levels of
these impurities before they can be used in the EU.130
These findings could affect a possible substitution of OLM insofar as VAL is an important alternative
ARB in Switzerland. However, so far no preparations containing VAL have been recalled by Swiss-
medic.131
Furthermore, if the triple combination OLM with HCTZ and CBBs was removed from the reimbursement
list, only VAL with HCTZ and CBBs would be available as a substitute. If there were future problems
with possible nitrosamine impurities in VAL products in Switzerland, no substitute would be availa-
ble.Therefore, it is recommended to monitor recalls of VAL products and whether there are any delivery
problems with this preparation.
Signorovitch et al.108 investigated the economic impact of switching from VAL (without medical reason)
to an alternative ARB by analysing claims data in the USA. “Switchers” were found to have higher
healthcare costs. However the study authors could not identify specific reasons for this association due
to a lack of information. The authors concluded that it is likely because of an increase in outpatient visits,
partly due to follow-up visits for dose titration and tolerability assessments. The study documented 19.1
additional outpatient visits per 100 patients. The ESC/ESH guidelines also state that “after initiation of
antihypertensive drug therapy, it is important to review the patient at least once within the first 2 months
to evaluate the effects on BP and assess possible side effects until BP is under control, the frequency
of review will depend on the severity of hypertension”.2
According to information from the Main Association of Austrian Social Security Institutions (Appendix D,
Table 27), patients asked why OLM had been delisted (as of 1 January 2019) and what the alternative
drugs were. A complaint by the manufacturing company to the Federal Administrative Court was dis-
missed. The doctors were informed that OLM was no longer reimbursed and alternative preparations
and the equivalent doses to OLM were pointed out.
85
Summary statement on organisational issues
Relevant organisational issues are timely information for physicians about a possible delisting of OLM
from the Spezialitätenliste, the reasons for the delisting and a list of alternative ARBs and equivalent
doses.
Furthermore, it should be monitored whether there are any problems with the delivery of VAL products
due to nitrosamine impurities and whether they can be provided in sufficient quantities (especially triple
combinations).
In addition, patients can expect more frequent visits to their physician during the first year after switching
from OLM to an alternative sartan.
86
11 Discussion
Numerous studies have compared the effect of OLM on BP compared with other sartans. However, the
assessment of health benefits should primarily consider clinically meaningful endpoints such as mortal-
ity, morbidity and quality of life (see the EUnetHTA guidelines on endpoints used in the relative effec-
tiveness assessments (REA) of pharmaceuticals – clinical endpoints132). To date, only one retrospective
study has compared OLM’s performance with regard to long-term outcomes versus other sartans.46 This
low-quality evidence hints at a superiority of OLM in averting certain cardiac events compared with other
sartans. By contrast, for some other sartans, including LOS and TEL, more evidence is available from
randomised controlled trials reporting on critical endpoints.133-135
Apart from investigating the effects of OLM on BP and long-term outcomes, we also examined its safety
profile in comparison with other sartans, using data from RCTs as well as observational studies and
country registries. Due to short trial durations and inconsistent reporting of adverse events amongst the
RCTs included, we could not obtain a complete estimate of the incidence of harms associated with OLM
versus other ARBs. Additional data from observational studies/country registries provided evidence on
rare adverse events that arise with a long latency period such as enteropathies. Due to the lack of
randomisation, the degree of certainty of these results is limited. Overall, the quality of evidence as-
sessing the risk of enteropathies associated with OLM use was low due to concerns regarding the meth-
ods used in most of the studies to make adequate statistical adjustment for confounding and selection
bias. Additionally, relatively short follow-up periods as well as low event rates hampered efforts to iden-
tify differences that might not just be due to random variations. Furthermore, the studies yielded incon-
sistent results, with some suggesting an increased risk for enteropathies in OLM users compared with
other ARBs while others did not find a significant difference. Certain subanalyses indicate that OLM
might be associated with a comparatively higher risk for enteropathies. However, future studies might
solidify or change the effect estimate.
Observational studies only including patients using OLM were analysed for an explorative investigata-
tion of any striking patterns regarding unexpected serious adverse events and all-cause mortality (com-
pared with baseline epidemiological rates). The results of the individual studies were heterogeneous,
with some studies finding a high incidence of serious adverse events in OLM users and others reporting
none at all. These differences might be predominately explained by heterogeneous study populations
(multimorbid patients versus patients with primary hypertension only) and are likely to be due to their
different risk profiles rather than attributable to the use of OLM itself.
87
In 2013, the FDA approved the addition of a warning about the risk of sprue-like enteropathy to OLM
labelling based on an evaluation of data from the Centers for Medicare and Medicaid Services (CMS),
the FDA Adverse Event Reporting System (FAERS) and a case series by Rubio-Tapia et al.136
In 2015, the French National Authority for Health (HAS)1 recommended discontinuation of the reim-
bursement of OLM due to a lack of evidence regarding its beneficial effect on outcomes other than BP
such as morbidity and mortality as well as evidence showing an increased risk of sprue-like enteropa-
thies for OLM, although the overall observed risk was small. Their findings regarding the safety profile
of OLM were based on case series and French pharmacovigilance data that showed the resolution or
improvement of sprue-like enteropathy symptoms as well as intestinal changes once OLM was discon-
tinued.137 136 Their evidence base also included an analysis of the French National Health Insurance
claim database (Basson et al. 2015)49 showing an increased risk of hospitalisation due to intestinal
malabsorption with OLM but not other sartans compared with ACE inhibitors. However, more recent
long-term studies could not clearly confirm an increased risk of enteropathies associated with OLM ver-
sus other sartans.51 54 58
In contrast, in 2019 the FDA138 denied a petition for the removal of drug products containing OLM from
the market for safety reasons, arguing that more recent evidence using the same core evidence base
(as used in this HTA report) from studies with long-term outcomes (Basson et al., Dong et al.)49 51 as
well as case series/case reports139 and one additional systematic review140 did not indicate a new, wors-
ened or more prevalent enteropathy-related risk than already described in the OLM labelling.138 The
FDA argued that due to the very low incidence of sprue-like enteropathy in OLM users described in the
literature and the reversibility of symptoms upon medication cessation, disrupting BP therapy for a vast
number of OLM users by removing this drug from the market was not warranted.138
In summary, by analysing a broad range of studies, we ensured that no significant new evidence re-
garding critical and important outcomes as well as potential harms associated with OLM versus other
sartans has been overlooked. Definite conclusions about the balance of benefits and harms associated
with OLM cannot be drawn due to the lack of high-quality evidence for important endpoints. Future
studies should try to fill this evidence gap by providing high-quality data on critical and important out-
comes and harms to enable a valid risk/benefit assessment of OLM compared with other sartans. We
did not identify any ongoing studies addressing these issues in our search of clinical trial registries.
Due to the lack of adequate comparative studies, cost effectiveness was estimated by calculating costs
per one additional event averted by OLM compared with VAL, LOS and IRB and by a crude incremental
cost-effectiveness ratio estimation of the event difference for treatment with OLM compared with VAL,
88
LOS and IRB.i The only comparative study analysing the effect of OLM on outcomes other than hyper-
tension was Swindle et al.46 Therefore, the results of the economic evaluation were mainly determined
by the effects based on Swindle et al.46 To correct for the different sizes of the patient populations in
Swindle et al.,46 empirical Bayesian bootstrapping was applied and confidence intervals were calculated.
However, the calculated confidence intervals were wide and when considering the lower bounds, the
cardiac event rates (including myocardial infarction, stroke, heart failure and ischemic heart disease)
were higher with OLM compared with VAL, LOS and IRB. Another disadvantage of the original study by
Swindle et al.46 was that it was a retrospective analysis conducted in the USA with a short follow-up time
and OLM was compared exclusively with VAL, LOS and IRB (i.e. there was no comparison with CAN,
EPR, TEL or AZI).
Under the assumption that OLM would be substituted by other sartans, three scenarios were calculated
for the possible budget impact on the health insurance.
In Scenario 1, OLM products were allocated to other sartans according to the market share of the dif-
ferent packs of the relevant alternatives separated into mono- and combination preparations. Scenario
2 bundled OLM and alternative preparations into equivalence groups and distributed them according to
their market share. Scenario 3 differs from Scenario 2 insofar as the number of reimbursed packs in
2018 were valued at prices as of 1 August 2019. In addition to the effects on pharmaceutical expendi-
ture, patients’ visits to physicians due to the medication switch were taken into account. A potential
weakness of these calculations is that the prices of the individual pharmaceuticals in Scenario 3 were
taken from the Spezialitätenliste of August 2019 for Switzerland and combined with the number of pack-
ages sold in 2018. This was done to take into account the actual list prices of reimbursed pharmaceuti-
cals for our calculations. However, the number of listed and reimbursed sartans was higher in 2018 than
in August 2019. Nevertheless, the turnover of the delisted pharmaceuticals was low and, therefore, the
impact on our results is negligible.
Considering just pharmaceutical expenditures, there would be budget savings of CHF 7.4 million in
Scenario 1, CHF 1.3 million in Scenario 2 and no savings in Scenario 3. However, taking the additional
outpatient visits into account, the net budget impact ranged between savings of CHF 4.8 million (Sce-
nario 1), additional expenses of CHF 1.3 million (Scenario 2) and additional expenses of CHF 2.6 million
(Scenario 3).
Scenario 2 and Scenario 3 probably present a more realistic picture as they take the specific market
situation in the equivalence groups into account. Since prices and volumes are not constant, the results
i This comparison applies exclusively to the cost-effectiveness calculation.

89
of the budget impact analysis are only valid for a limited period of time (first year after medication switch).
Further developments depend on the prescribing behaviour of physicians (e.g. prescribing more gener-
ics or originals) and future developments on the supplier side (e.g. changes in prices). For example,
after completion of this HTA report, a major price revision for all sartans took place in December 2019.
The price reductions for OLM preparations have been stronger than for the other sartans. Valued with
current prices as of April 1, 2020106 the pharmaceutical expenditures for OLM preparations would be
reduced by around 5.2 Mio. CHF and for the other sartans by around 6.3 Mio. CHF (assuming constant
prescription volume of 2018). For the scenarios presented in chapter 8.2.5, a valuation with the most
current prices of the Spezialitätenliste of April 1, 2020 would have the consequence that the savings
potential of the health insurance for pharmaceutical expenditures due to a potential substitution of OLM
would be somewhat lower.
Some evidence indicates that adherence to medication might be negatively influenced by drug substi-
tution, resulting in worse BP control. To mitigate the potentially negative effects of drug switching, pa-
tients’ negative expectations towards a new drug might be managed by education and motivation as
well as a high-quality doctor-patient relationships built on trust.
Relevant organisational issues are timely information for physicians about a possible disinvestment of
OLM, the reasons for this decision and information about equivalent doses of alternative ARBs.
It should also be clarified whether the manufacturers of VAL in Switzerland are affected by nitrosamine
impurities and whether they can provide sufficient quantities (especially triple combinations) as VAL is
the only alternative sartan available in the triple combination with HCTZ and CCBs. However until now
there have been no recalls of VAL in Switzerland.
Additional doctor visits due to a potential delisting of OLM will occur only for OLM patients and only in
the first year after switching medication. Additional doctor visits for patients starting a new antihyperten-
sive therapy after the delisting of OLM will not be necessary.

90
12 Conclusions
The available evidence is insufficient to clearly demonstrate a higher risk of the occurrence of sprue-like
enteropathies for OLM users compared with users of other sartans. However, safety concerns cannot
be ruled out. Although enteropathies are rare, clinicians should remain vigilant to this potential adverse
event even years after initiating medication.
Based on the data from Swindle et al.,46 our own calculations (bootstrapping) demonstrated non-statis-
tical differences between OLM and three other sartans in relation to the cardiac event rate. Thus, the
calculations are not robust enough to draw any conclusions regarding the cost effectiveness of OLM
compared with VAL, LOS and IRB.
Taking the costs for additional visits to physicians into account, a substitution of OLM with equivalent
alternatives would lead to additional expenses for the health insurance. Disregarding equivalent doses,
the substitution would result in budget savings.
To avoid medication adherence problems, timely information for physicians about the planned disinvest-
ment, the reasons for the decision and available equivalent doses of alternative sartans would be useful,
as would appropriate education of the patients by the doctors. Furthermore, as the availability of alter-
native double and triple combinations is limited and as some VAL products have been recalled in some
countries, the current market situation should be kept under observation.
91
13 References
1. HAS. Olmetec. L’avis de la Commission de la transparence adopté le 18 février 2015 a fait l’objet d’une
audition le 29 avril 2015. In: Haute Autrité de Santé, ed., 2015:37.
2. Williams B, Mancia G, Spiering W, et al. 2018 ESC/ESH Guidelines for the management of arterial
hypertension. Eur Heart J 2018;39(33):3021-104. doi: 10.1093/eurheartj/ehy339 [published
Online First: 2018/08/31]
3. Chow CK, Teo KK, Rangarajan S, et al. PURE Study Investigators. Prevalence, awareness, treatment,
and control of hypertension in rural and urban communities in high-, middle-, and low-income
countries. JAMA - Journal of the American Medical Association 2013;310:968.
4. Forouzanfar MH, Liu P, Roth GA, et al. Global burden of hypertension and systolic blood pressure of
at least 110 to 115mmHg, 1990-2015. JAMA - Journal of the American Medical Association
2017;317:182.
5. Gottesman RF, Albert MS, Alonso A, et al. Associations between midlife vascular risk factors and 25-
year incident dementia in the Atherosclerosis Risk in Communities (ARIC) cohort. JAMA Neurol
2017;74:1254.
6. Rovio SP, Pahkala K, Nevalainen J, et al. Cardiovascular risk factors from childhood and midlife
cognitive performance: the Young Finns study. J Am Coll Cardiol 2017;69:2289.
7. Swiss Society of Hypertension. Arterielle Hypertonie 2015 http://www.swisshypertension.ch/2015;
accessed 4 December 2018.
8. Ettehad D, Emdin CA, Kiran A, et al. Blood pressure lowering for prevention of cardiovascular disease
and death: a systematic review and meta-analysis Lancet 2016;387:967.
9. Emdin C, Rahimi K, Neal B, et al. Blood pressure lowering in type 2 diabetes: a systematic review and
meta-analysis. JAMA - Journal of the American Medical Association 2015;313:615.
10. Timmermans PB, Wong PC, Chiu AT, et al. Angiotensin II receptors and angiotensin II receptor
antagonists. Pharmacol Rev 1993;45(2):251.
11. Thomopoulos C, Parati G, A. Z. Effects of blood-pressure-lowering treatment on outcome incidence.
12. Effects in individuals with high-normal and normal blood pressure: overview and meta-
analyses of randomized trials. J Hypertension Research 2017;35:2160.
12. Thomopoulos C, Parati G, A. Z. Effects of blood pressure-lowering on outcome incidence in
hypertension: 5. Head-to-head comparisons of various classes of antihypertensive drugs -
overview and meta-analyses. J Hypertension Research 2015;33 [published Online First: 1341]
13. Siragy HM. Comparing Angiotensin II Receptor Blockers on Benefits Beyond Blood Pressure. Advances
in therapy 2010;27(5):284.
14. The Info List. Olmesartan Medoxomil
http://www.theinfolist.com/php/SummaryGet.php?FindGo=Olmesartan%20Medoxomil: RxList
Inc. ; 2007; accessed 3 November 2018.
15. Hünseler C, Paneitz A, Friedrich D, et al. Angiotensin II receptor blocker induced fetopathy: 7 cases
Klin Padiatr 2011;223(1):10.
16. Olmesartan F. Fachinformation Olmesartan: swissmedic; 2018; Available from:
http://www.swissmedicinfo.ch/ accessed 15 November 2018.
17. NICE. Clinical guideline. Hypertension in adults: diagnosis and management. In: National Institute for
Health and Care Excellence, ed., 2011:25.
18. BAG. HTA Scoping Report. Olmesartan Mono- and Combination Therapy in Patients with Essential
Hypertension
https://www.bag.admin.ch/bag/de/home/versicherungen/krankenversicherung/krankenversic
herung-bezeichnung-der-leistungen/re-evaluation-hta/scoping-berichte.html: Bundesamt für
Gesundheit; 2019; accessed 1 October 2019.
92
19. EUnetHTA. Guideline. Endpoints used in Relative Effectiveness Assessment. Safety. In: European
Network for Health Technology Assessment, ed. EUnetHTA JA2, WP 7, 2015:42.
20. Wang L, Zhao JW, Liu B, et al. Antihypertensive effects of olmesartan compared with other angiotensin
receptor blockers: a meta-analysis. Am J Cardiovasc Drugs 2012;12(5):335-44. doi:
https://dx.doi.org/10.2165/11597390-000000000-00000
21. Heran BS, Wong MM, Heran IK, et al. Blood pressure lowering efficacy of angiotensin receptor blockers
for primary hypertension. The Cochrane database of systematic reviews 2008(4):Cd003822. doi:
10.1002/14651858.CD003822.pub2 [published Online First: 2008/10/10]
22. Brunner HR, Stumpe KO, Januszewicz A. Antihypertensive efficacy of olmesartan medoxomil and
candesartan cilexetil assessed by 24-hour ambulatory blood pressure monitoring in patients
with essential hypertension. Clin Drug Invest 2003;23(7):419-30.
23. Giles TD, Oparil S, Silfani TN, et al. Comparison of increasing doses of olmesartan medoxomil,
losartan potassium, and valsartan in patients with essential hypertension. J Clin Hypertens
(Greenwich) 2007;9(3):187-95.
24. Barrios V, Escobar, C., Echarri, R., & De Alvaro, F. New therapeutic progress in cardiorenal protection
of the hypertensive patient with a focus on olmesartan. Hot Topics in Hypertension 2009;(8), 7-
15.
25. Nagata I, Shiga, Y., Miura, S. I., Norimatsu, K., Hidaka, Y., & Morii, S. . Comparison of the efficacy and
safety of single-pill fixed-dose combinations of olmesartan/azelnidipine and
valsartan/amlodipine in patients with hypertension (RENOVATE Study). . Experimental and
clinical cardiology 2014;20(1), 1920‐1938.
26. Schindler C, & Ferrario, C. M. Olmesartan for the treatment of arterial hypertension. . Future
Cardiology 2008;4(4), 357-372 doi: http://dx.doi.org/10.2217/14796678.4.4.357
27. Shiina K, Uchiyama, T., & Yamashina, A. Comparison of telmisartan and olmesartan on blood pressure
in hypertensive patients with Metabolic syndrome: TOP study. Therapeutic Research 2012;33(2),
229‐237.
28. Truong VT, & Boersma, C. Pharmacoeconomic aspects of angiotensin II receptor blockers in patients
with essential hypertension. Pharmacoepidemiology and Drug Safety 2014;(1), 78 doi:
http://dx.doi.org/10.1002/pds.3701
29. Volpe M. New options for therapeutic management of patients with cardiovascular disease. A closer
look at clinical trials with telmisartan. Hot Topics in Hypertension;(7), 7-26
30. Biskupiak J KJ. A comparison of blood pressure outcomes associated with the use of angiotensin-
receptor blockers (ARBS) in patients seen predominantly in primary care practices. Value in
Health 2009 2009;12 (7):A 314
31. Ball KJ, Williams PA, Stumpe KO. Relative efficacy of an angiotensin II antagonist compared with other
antihypertensive agents. Olmesartan medoxomil versus antihypertensives. J Hypertens Suppl
2001;19(1):S49-56.
32. De Luis DA, Conde R, Gonzalez Sagrado M, et al. Effects of olmesartan vs irbesartan on metabolic
parameters and visfatin in hypertensive obese women. Eur Rev Med Pharmacol Sci
2010;14(9):759-63.
33. De Luis DA, Conde R, Gonzalez-Sagrado M, et al. Effects of telmisartan vs olmesartan on metabolic
parameters, insulin resistance and adipocytokines in hypertensive obese patients. Nutr Hosp
2010;25(2):275-9.
34. Destro M, Scabrosetti R, Vanasia A, et al. Comparative efficacy of valsartan and olmesartan in mild-
to-moderate hypertension: results of 24-hour ambulatory blood pressure monitoring. Advances
in therapy 2005;22(1):32-43. [published Online First: 2005/06/10]
35. Flack JM, Graff A, Li W, et al. Efficacy/safety of olmesartan medoxomil versus losartan potassium in
patients by stage 1 or 2 hypertension. Postgrad Med 2012;124(3):59-70. doi:
https://dx.doi.org/10.3810/pgm.2012.05.2549
93
36. Fogari R, Zoppi A, Mugellini A, et al. Effectiveness of hydrochlorothiazide in combination with
telmisartan and olmesartan in adults with moderate hypertension not controlled with
monotherapy: a prospective, randomized, open-label, blinded end point (PROBE), parallel-arm
study. Current Therapeutic Research - Clinical and Experimental 2008;69(1):1-15. doi:
http://dx.doi.org/10.1016/j.curtheres.2008.02.003
37. Kakio Y, Uchida HA, Umebayashi R, et al. Practical efficacy of olmesartan versus azilsartan in patients
with hypertension: a multicenter randomized-controlled trial (MUSCAT-4 study). Blood Press
Monit 2017;22(2):59-67. doi: https://dx.doi.org/10.1097/MBP.0000000000000229
38. Kalikar M, Nivangune K, Dakhale G, et al. Efficacy and tolerability of olmesartan, telmisartan, and
losartan in patients of stage i hypertension: A randomized, open-label study. Journal of
Pharmacology and Pharmacotherapeutics 2017;8(3):106-11. doi:
http://dx.doi.org/10.4103/jpp.JPP_39_17
39. Liau CS, Lee CM, Sheu SH, et al. Efficacy and Safety of Olmesartan in the Treatment of Mild-to-
Moderate Essential Hypertension in Chinese Patients. Clin Drug Invest 2005;25(7):473-9.
40. Morii J, Miura S, Shiga Y, et al. Comparison of the efficacy and safety of irbesartan and olmesartan in
patients with hypertension (EARTH study). Clin Exp Hypertens 2012;34(5):342-9. doi:
https://dx.doi.org/10.3109/10641963.2012.683912
41. Oparil S, Williams D, Chrysant SG, et al. Comparative efficacy of olmesartan, losartan, valsartan, and
irbesartan in the control of essential hypertension.[Erratum appears in J Clin Hypertens
(Greenwich) 2001 Nov-Dec;3(6):395]. J Clin Hypertens (Greenwich) 2001;3(5):283-91, 318.
42. Ramesh R, Sarala N, Venkatarathnamma PN. Efficacy and safety of olmesartan and
hydrochlorothiazide versus telmisartan and hydrochlorothiazide in newly diagnosed patients
with mild-to-moderate hypertension. International Journal of Pharmaceutical Investigation
2018;8(1):38-43. doi: http://dx.doi.org/10.4103/jphi.JPHI_4_18
43. Shiga Y, Miura SI, Motozato K, et al. Comparison of efficacy and safety of azilsartan and olmesartan
in patients with essential hypertension: A randomized and prospective study (CANZONE study).
International Heart Journal 2017;58(3):416-21. doi: http://dx.doi.org/10.1536/ihj.16-285
44. Tsutamoto T, Nishiyama K, Yamaji M, et al. Comparison of the long-term effects of candesartan and
olmesartan on plasma angiotensin II and left ventricular mass index in patients with
hypertension. Hypertens Res 2010;33(2):118-22. doi: https://dx.doi.org/10.1038/hr.2009.192
45. Ushijima K, Nakashima H, Shiga T, et al. Different chronotherapeutic effects of valsartan and
olmesartan in non-dipper hypertensive patients during valsartan treatment at morning. J
Pharmacol Sci 2015;127(1):62-8. doi: https://dx.doi.org/10.1016/j.jphs.2014.09.004
46. Swindle JP, Buzinec P, Iorga SR. Long-term clinical and economic outcomes associated with
angiotensin II receptor blocker use in hypertensive patients. Curr Med Res Opin
2011;27(9):1719-31. doi: doi:10.1185/03007995.2011.589434
47. Rump LC, Ambrosioni E, Burnier M, et al. Initial combination therapy with
olmesartan/hydrochlorothiazide in moderate-to-severe hypertension. Journal of Human
Hypertension 2006;20(4):299-301.
48. Graham DJ, Zhou EH, McKean S, et al. Cardiovascular and mortality risk in elderly Medicare
beneficiaries treated with olmesartan versus other angiotensin receptor blockers.
Pharmacoepidemiology and Drug Safety 2014;23(4):331-39. doi:
http://dx.doi.org/10.1002/pds.3548
49. Basson M, Mezzarobba M, Weill A, et al. Severe intestinal malabsorption associated with olmesartan:
A French nationwide observational cohort study. Gut 2015;65(10):1664-69. doi:
http://dx.doi.org/10.1136/gutjnl-2015-309690
50. De Bortoli N, Ripellino C, Cataldo N, et al. Unspecified intestinal malabsorption in patients treated
with angiotensin-converting enzyme inhibitors or angiotensin receptor blockers: a retrospective
analysis in primary care settings. Expert Opinion on Drug Safety 2017;16(11):1221-25. doi:
http://dx.doi.org/10.1080/14740338.2017.1376647
94
51. Dong YH, Jin Y, Tsacogianis TN, et al. Use of olmesartan and enteropathy outcomes: a multi-database
study. Alimentary Pharmacology and Therapeutics 2018;47(6):792-800. doi:
http://dx.doi.org/10.1111/apt.14518
52. Khurshid F, Aqil M, Alam MS, et al. Monitoring of adverse drug reactions associated with
antihypertensive medicines at a university teaching hospital in New Delhi. DARU, Journal of
Pharmaceutical Sciences 2012;20 (1) (no pagination)(34) doi: http://dx.doi.org/10.1186/2008-
2231-20-34
53. Lin JW, Chang CH, Caffrey JL, et al. Examining the association of olmesartan and other angiotensin
receptor blockers with overall and cause-specific mortality. Hypertension 2014;63(5):968-76.
doi: https://dx.doi.org/10.1161/HYPERTENSIONAHA.113.02550
54. Malfertheiner P, Ripellino C, Cataldo N. Severe intestinal malabsorption associated with ACE inhibitor
or angiotensin receptor blocker treatment. An observational cohort study in Germany and Italy.
Pharmacoepidemiology and Drug Safety 2018;27(6):581-86. doi:
http://dx.doi.org/10.1002/pds.4402
55. Padwal R, Lin M, Etminan M, et al. Comparative effectiveness of olmesartan and other angiotensin
receptor blockers in diabetes mellitus: retrospective cohort study. Hypertension
2014;63(5):977-83. doi: https://dx.doi.org/10.1161/HYPERTENSIONAHA.113.02855
56. Park I, Sheen SS, Lim HS, et al. Comparison of hyperkalemic risk in hospitalized patients treated with
different angiotensin receptor blockers: A retrospective cohort study using a Korean clinical
research database. Am J Cardiovasc Drugs 2012;12(4):255-62. doi:
http://dx.doi.org/10.2165/11634470
57. Walker AM, Liang C, Clifford CR, et al. Cardiac mortality in users of olmesartan, other angiotensin-
receptor blockers and angiotensin-converting enzyme inhibitors. Pharmacoepidemiology and
Drug Safety 2014;23(4):348-56. doi: http://dx.doi.org/10.1002/pds.3558
58. You SC, Park H, Yoon D, et al. Olmesartan is not associated with the risk of enteropathy: A Korean
nationwide observational cohort study. Korean Journal of Internal Medicine 2019;34(1):90-98.
doi: http://dx.doi.org/10.3904/kjim.2017.002
59. Zhou EH, Gelperin K, Levenson MS, et al. Risk of acute myocardial infarction, stroke, or death in
patients initiating olmesartan or other angiotensin receptor blockers - a cohort study using the
clinical practice research datalink. Pharmacoepidemiology and Drug Safety 2014;23(4):340-47.
doi: http://dx.doi.org/10.1002/pds.3549
60. Bramlage P, Fronk EM, Wolf WP, et al. Safety and effectiveness of a fixed-dose combination of
olmesartan, amlodipine, and hydrochlorothiazide in clinical practice. Vasc Health Risk Manag
2015;11:1-8. doi: https://dx.doi.org/10.2147/VHRM.S75380
61. Bramlage P, Ketelhut R, Fronk EM, et al. Clinical impact of patient adherence to a fixed-dose
combination of olmesartan, amlodipine and hydrochlorothiazide. Clin Drug Invest
2014;34(6):403-11. doi: https://dx.doi.org/10.1007/s40261-014-0188-z
62. Buendia R, Zambrano M. Efficacy of olmesartan amlodipine in Colombian hypertensive patients (soat
study). BMC Res Notes 2017;10(1):164. doi: https://dx.doi.org/10.1186/s13104-017-2486-z
63. Dohi T, Narui K, Kasai T, et al. Effects of olmesartan on blood pressure and insulin resistance in
hypertensive patients with sleep-disordered breathing. Heart Vessels 2011;26(6):603-8. doi:
https://dx.doi.org/10.1007/s00380-010-0104-2
64. Germino FW, Neutel JM, Dubiel R, et al. Efficacy of olmesartan medoxomil and hydrochlorothiazide
fixed-dose combination therapy in patients aged 65 years and older with stage 1 and 2
hypertension or isolated systolic hypertension. Am J Cardiovasc Drugs 2012;12(5):325-33. doi:
https://dx.doi.org/10.2165/11635000-000000000-00000
65. Gomes MAM, Feitosa ADDM, Oigman W, et al. Based treatment algorithm for essenssial hypertension
with olmesartan medoxomil. [Portuguese, English]. Arquivos Brasileiros de Cardiologia
2008;91(3):168-76+85-93. doi: http://dx.doi.org/10.1590/S0066-782X2008001500008
95
66. Heagerty AM, Mallion JM. Olmesartan medoxomil in elderly patients with essential or isolated systolic
hypertension : efficacy and safety data from clinical trials. Drugs Aging 2009;26(1):61-76. doi:
https://dx.doi.org/10.2165/0002512-200926010-00005
67. Izzo JL, Jr., Neutel JM, Silfani T, et al. Efficacy and safety of treating stage 2 systolic hypertension with
olmesartan and olmesartan/HCTZ: results of an open-label titration study. J Clin Hypertens
(Greenwich) 2007;9(1):36-44.
68. Izzo JL, Jr., Neutel JM, Silfani T, et al. Titration of HCTZ to 50 mg daily in individuals with stage 2
systolic hypertension pretreated with an angiotensin receptor blocker. J Clin Hypertens
(Greenwich) 2007;9(1):45-8.
69. Jung HW, Kim KI, Park CG, et al. A multicenter, non-comparative study to evaluate the efficacy and
safety of fixed-dose olmesartan/amlodipine in Korean patients with hypertension who are naive
or non-responders to anti-hypertensive monotherapy (ACE-HY study). Clin Exp Hypertens
2015;37(6):482-9. doi: https://dx.doi.org/10.3109/10641963.2015.1013119
70. Kereiakes DJ, Neutel J. Efficacy of an olmesartan medoxomil-based treatment algorithm in patients
with hypertension and type 2 diabetes: analysis of diurnal blood pressure control as assessed
by 24-hour ambulatory blood pressure monitoring. Therapeutic Advances in Cardiovascular
Disease 2010;4(5):285-93. doi: https://dx.doi.org/10.1177/1753944710378675
71. Kumbla DK, Kumar S, Reddy YV, et al. WIN OVER study: Efficacy and safety of olmesartan in Indian
hypertensive patients: results of an open label, non-comparative, multi-centric, post marketing
observational study. Indian Heart J 2014;66(3):340-4. doi:
https://dx.doi.org/10.1016/j.ihj.2014.05.002
72. Neutel JM, Smith DH, Silfani TN, et al. Effects of a structured treatment algorithm on blood pressure
goal rates in both stage 1 and stage 2 hypertension. Journal of Human Hypertension
2006;20(4):255-62.
73. Punzi H, Neutel JM, Kereiakes DJ, et al. Efficacy of amlodipine and olmesartan medoxomil in patients
with hypertension: the AZOR Trial Evaluating Blood Pressure Reductions and Control (AZTEC)
study. Therapeutic Advances in Cardiovascular Disease 2010;4(4):209-21. doi:
https://dx.doi.org/10.1177/1753944710374745
74. Punzi H, Shojaee A, Maa JF. Efficacy and tolerability of fixed-dose amlodipine/olmesartan medoxomil
with or without hydrochlorothiazide in Hispanic and non-Hispanic patients whose blood
pressure is uncontrolled on antihypertensive monotherapy. Therapeutic Advances in
Cardiovascular Disease 2012;6(4):149-61. doi:
http://dx.doi.org/10.1177/1753944712452190
75. Saito I, Kario K, Kushiro T, et al. Home blood pressure and cardiovascular outcomes in very elderly
patients receiving antihypertensive drug therapy: a subgroup analysis of Home blood pressure
measurement with Olmesartan Naive patients to Establish Standard Target blood pressure
(HONEST) study. Clin Exp Hypertens 2018;40(5):407-13. doi:
https://dx.doi.org/10.1080/10641963.2016.1267194
76. Saito I, Kushiro T, Ishikawa M, et al. Early antihypertensive efficacy of olmesartan medoxomil. J Clin
Hypertens (Greenwich) 2008;10(12):930-5. doi: https://dx.doi.org/10.1111/j.1751-
7176.2008.00050.x
77. Sezai A, Soma M, Hata M, et al. Effects of olmesartan on the renin-angiotensin-aldosterone system
for patients with essential hypertension after cardiac surgery-investigation using a candesartan
change-over study. Annals of Thoracic and Cardiovascular Surgery 2011;17(5):487-93. doi:
http://dx.doi.org/10.5761/atcs.oa.11.01691
78. Tada Y, Yagi K, Uno M, et al. Improvement of Plasma Biomarkers after Switching Stroke Patients from
Other Angiotensin II Type I Receptor Blockers to Olmesartan. J Stroke Cerebrovasc Dis
2015;24(7):1487-92. doi: https://dx.doi.org/10.1016/j.jstrokecerebrovasdis.2015.03.015
79. Teramoto T, Kawamori R, Miyazaki S, et al. Lipid and blood pressure control for the prevention of
cardiovascular disease in hypertensive patients: a subanalysis of the OMEGA study. J Atheroscler
Thromb 2015;22(1):62-75. doi: https://dx.doi.org/10.5551/jat.25304
96
80. Wang JG, Sun NL, Ke YN, et al. Long-term efficacy of olmesartan medoxomil in Chinese hypertensive
patients as assessed by clinic, ambulatory and home blood pressure measurements. Clin Drug
Invest 2012;32(11):729-34. doi: https://dx.doi.org/10.1007/s40261-012-0003-7
81. Zemmrich C, Luders S, Gansz A, et al. Daytime systolic ambulatory blood pressure with a direct switch
between candesartan monotherapy and the fixed-dose combination olmesartan/amlodipine in
patients with uncontrolled essential hypertension (sevicontrol-1). J Clin Hypertens (Greenwich)
2013;15(11):815-19. doi: http://dx.doi.org/10.1111/jch.12202
82. Williams B, Cockcroft JR, Kario K, et al. Effects of Sacubitril/Valsartan Versus Olmesartan on Central
Hemodynamics in the Elderly With Systolic Hypertension: The PARAMETER Study. Hypertension
2017;69(3):411-20. doi: https://dx.doi.org/10.1161/HYPERTENSIONAHA.116.08556
83. Barrios V, Boccanelli A, Ewald S, et al. Efficacy and tolerability of olmesartan medoxomil in patients
with mild to moderate essential hypertension: the OLMEBEST Study. Clin Drug Invest
2007;27(8):545-58.
84. Fogari R, Derosa G, Zoppi A, et al. Effects of manidipine/delapril versus
olmesartan/hydrochlorothiazide combination therapy in elderly hypertensive patients with type
2 diabetes mellitus. Hypertens Res 2008;31(1):43-50. doi:
https://dx.doi.org/10.1291/hypres.31.43
85. Hirohata A, Yamamoto K, Miyoshi T, et al. Four-year clinical outcomes of the OLIVUS-Ex (impact of
Olmesartan on progression of coronary atherosclerosis: evaluation by intravascular ultrasound)
extension trial. Atherosclerosis 2012;220(1):134‐38. doi:
10.1016/j.atherosclerosis.2011.10.013
86. Malacco E, Omboni S, Mallion JM, et al. Antihypertensive efficacy of olmesartan medoxomil and
ramipril in elderly patients with mild to moderate hypertension grouped according to renal
function status : a retrospective analysis. High blood press 2012;19(4):213-22. doi:
https://dx.doi.org/10.1007/BF03297633
87. Mazza A, Schiavon L, Zuin M, et al. Effects of the Antihypertensive Fixed-Dose Combinations on an
Early Marker of Hypertensive Cardiac Damage in Subjects at Low Cardiovascular Risk. American
Journal of Hypertension 2016;29(8):969-75. doi: http://dx.doi.org/10.1093/ajh/hpw022
88. Nielsen PM, Grimm D, Wehland M, et al. The Combination of Valsartan and Sacubitril in the Treatment
of Hypertension and Heart Failure - an Update. Basic Clin Pharmacol Toxicol 2018;122(1):9-18.
doi: https://dx.doi.org/10.1111/bcpt.12912
89. Ogawa H, Kim-Mitsuyama S, Matsui K, et al. Angiotensin II receptor blocker-based therapy in
Japanese elderly, high-risk, hypertensive patients. Am J Med 2012;125(10):981-90. doi:
https://dx.doi.org/10.1016/j.amjmed.2011.12.010
90. Omboni S, Malacco E, Mallion JM, et al. Olmesartan vs ramipril in the treatment of hypertension and
associated clinical conditions in the elderly: A reanalysis of two large double-blind, randomized
studies at the light of the most recent blood pressure targets recommended by guidelines.
Clinical Interventions in Aging 2015;10:1575-86. doi: http://dx.doi.org/10.2147/CIA.S88195
91. Ruilope L, Schaefer A. The fixed-dose combination of olmesartan/amlodipine was superior in central
aortic blood pressure reduction compared with perindopril/amlodipine: a randomized, double-
blind trial in patients with hypertension. Advances in therapy 2013;30(12):1086-99. doi:
https://dx.doi.org/10.1007/s12325-013-0076-6
92. Sakata Y, Shiba N, Takahashi J, et al. Clinical impacts of additive use of olmesartan in hypertensive
patients with chronic heart failure: the supplemental benefit of an angiotensin receptor blocker
in hypertensive patients with stable heart failure using olmesartan (SUPPORT) trial. European
Heart Journal 2015;36(15):915-23. doi: https://dx.doi.org/10.1093/eurheartj/ehu504
93. Angeloni E, Vitaterna A, Lombardo P, et al. Single-pill combination therapy in the initial treatment of
marked hypertension: a propensity-matched analysis. Clin Exp Hypertens 2015;37(5):404-10.
doi: https://dx.doi.org/10.3109/10641963.2014.987395
94. Bramlage P, Wolf WP, Fronk EM, et al. [Fixed dose combination of an ARB calcium antagonist lowers
blood pressure effectively and improves quality of life]. [German]. MMW Fortschritte der Medizin
2011;153 Suppl 1:33-40.
97
95. Kawai T, Takei I, Shimada A, et al. Effects of olmesartan medoxomil, an angiotensin II type 1 receptor
antagonist, on plasma concentration of B-type natriuretic peptide, in hypertensive patients with
type 2 diabetes mellitus: a preliminary, observational, open-label study. Clin Drug Invest
2011;31(4):237-45. doi: https://dx.doi.org/10.2165/11586510-000000000-00000
96. Saito I, Kushiro T, Hirata K, et al. The use of olmesartan medoxomil as monotherapy or in combination
with other antihypertensive agents in elderly hypertensive patients in Japan. J Clin Hypertens
(Greenwich) 2008;10(4):272-9.
97. Saito I, Kushiro T, Zenimura N, et al. Olmesartan medoxomil and azelnidipine therapy in patients
with hypertension and chronic kidney disease in Japan. J Nephrol 2012;25(5):699-708. doi:
https://dx.doi.org/10.5301/jn.5000043
98. Scholze J, Weinstock A, Kirchner F, et al. Impact of socio-economic factors on the long-term
effectiveness of antihypertensive treatment with an angiotensin II receptor blocker: an
observational study. Curr Med Res Opin 2014;30(10):1947-55. doi:
https://dx.doi.org/10.1185/03007995.2014.929096
99. Teramoto T, Kawamori R, Miyazaki S, et al. Relationship between achieved blood pressure, dietary
habits and cardiovascular disease in hypertensive patients treated with olmesartan: The OMEGA
study. Hypertension Research 2012;35(12):1136-44. doi:
http://dx.doi.org/10.1038/hr.2012.93
100. Toh S, Reichman ME, Houstoun M, et al. Comparative risk for angioedema associated with the use
of drugs that target the renin-angiotensin-aldosterone system. Archives of Internal Medicine
2012;172(20):1582-89. doi: http://dx.doi.org/10.1001/2013.jamainternmed.34
101. Schünemann H, Brożek J, Guyatt G, et al. Handbook for grading the quality of evidence and the
strength of recommendations using the GRADE approach. 2013 [updated 2013]; Available from:
https://gdt.gradepro.org/app/handbook/handbook.html.
102. Evers S, Goossens M, De Vet H, et al. Criteria list for assessment of methodological quality of
economic evaluations: Consensus on Health Economic Criteria. International Journal of
Technology Assessment in Health Care 2005;21(2):245.
103. Brändle M, Azoulay MG, R.-A. Cost-effectiveness of insulin glargine versus NPH insulin for the
treatment of Type 2 diabetes mellitus, modeling the interaction between hypoglycemia and
glycemic control in Switzerland. International Journal of Clinical Pharmacology and Therapeutics
2011;49(3):230.
104. The Campbell and Cochrane Economics Methods Group (CCEMG) EfPaPIaCCE-C. CCEMG – EPPI-
Centre Cost Converter 2019; Available from: http://eppi.ioe.ac.uk/costconversion/default.aspx.
accessed 4 September 2019.
105. COGE GmbH. Tarifpool. 2.3.0.0 ed. Zurich: SASIS AG, 2018.
106. Schweizerische Eidgenossenschaft. Spezialitätenliste: Eidgenössisches Department des Inneren EDI,
Bundesamt für Gesundheit BAG; Available from: www.spezialitätenliste.ch accessed 1 August
2019, 16 April 2020.
107. Matter-Walstra K, Schwenkglenks M, Betticher D, et al. Bevacizumab Continuation Versus Treatment
Holidays After First-Line Chemotherapy With Bevacizumab in Patients With Metastatic Colorectal
Cancer: A Health Economic Analysis of a Randomized Phase 3 Trial (SAKK 41/06). Clinical
Colorectal Cancer 2016;15(4):320.
108. Signorovitch J, Zhang J, Wu EQ, et al. Economic impact of switching from valsartan to other
angiotensin receptor blockers in patients with hypertension. Current Medical Research and
Opinion 2010;26(4):849-60. doi: http://dx.doi.org/10.1185/03007991003613910
109. Dominiak P HW. Äquivalenzdosen der in Deutschland verfügbaren AT1-Rezeptor-Antagonisten
Dosage equivalents of AT1-receptor antagonists available in Germany. 2003(128 (44):2315-8)
110. DAZ.online. Wenn Valsartan-Patienten auf ein anderes Sartan umgestellt werden sollen
https://www.deutsche-apotheker-zeitung.de/news/artikel/2018/07/11/wenn-valsartan-
patienten-auf-ein-anderes-sartan-umgestellt-werden-sollen/chapter:all,%20: Deutsche
Apothekerzeitung,; 2018; accessed 23 July 2019.
98
111. Belsey JD. Choice of angiotensin receptor blocker in moderate hypertension: a UK-based costbenefit
comparison of olmesartan- and candesartan-based regimens. Journal of Medical Economics
2011;14(5):561.
112. Boersma C, Voors AA, Visser ST, et al. Cost effectiveness of angiotensin receptor blocker
monotherapy in patients with hypertension in the Netherlands: a comparative analysis using
clinical trial and drug utilization data. Am J Cardiovasc Drugs 2010;10(1):49-54. doi:
https://dx.doi.org/10.2165/11319570-000000000-00000
113. Mazza A, Sacco AP, Townsend DM, et al. Cost-benefit effectiveness of angiotensin-II receptor
blockers in patients with uncomplicated hypertension: A comparative analysis. Biomed
Pharmacother 2017;90:665-69. doi: https://dx.doi.org/10.1016/j.biopha.2017.04.008
114. Miller LA, Wade R, Dai D, et al. Economic evaluation of four angiotensin II receptor blockers in the
treatment of hypertension. Curr Med Res Opin 2010;26(6):1307-20. doi:
https://dx.doi.org/10.1185/03007991003711045
115. Simons WR. Comparative cost effectiveness of angiotensin II receptor blockers in a US managed
care setting: olmesartan medoxomil compared with losartan, valsartan, and irbesartan.
Pharmacoeconomics 2003;21(1):61-74.
116. Belsey JD. Choice of angiotensin receptor blocker in moderate hypertension. A UK-based cost-
benefit comparison of olmesartan- and candesartan-based regimens. Journal of Medical
Economics 2011;14(5):553-61. doi: https://dx.doi.org/10.3111/13696998.2011.595463
117. Miller LA, Wade R, Cziraky MJ, et al. Incremental cost-effectiveness analysis of angiotensin receptor
blockers in hypertensive patients in a US managed care population. Value in Health 2009;12
(3):A148. doi: http://dx.doi.org/10.1111/j.1524-4733.2009.00537-2.x
118. European Network for Health Technology Assessment. EUnetHTA Joint Action 2: work package 8;
HTA core model; version 3.0 [updated 25.01.2016]; Available from:
https://meka.thl.fi/htacore/model/HTACoreModel3.0.pdf accessed 3 August 2019.
119. Beauchamp TC, JF. Principles of biomedical ethics. New York: Oxford University Press 2013.
120. Hofmann B. Toward a procedure for integrating moral issues in health technology assessment.
International Journal of Technology Assessment in Health Care 2005;21(3):312-18. doi:
10.1017/S0266462305050415 [published Online First: 08/04]
121. Costa FV. Improving Adherence to Treatment and Reducing Economic Costs of Hypertension: The
Role of Olmesartan-Based Treatment. High Blood Pressure and Cardiovascular Prevention
2017;24(3):265-74. doi: http://dx.doi.org/10.1007/s40292-017-0221-4
122. Dufay A, Gallo A, Hanon O, et al. The repercussion of stopping reimbursement of olmesartan on
antihypertensive drugs prescription and blood pressure control of treated hypertensive patients
in France. Annales de Cardiologie et d'Angeiologie 2018;67(3):149-53. doi:
http://dx.doi.org/10.1016/j.ancard.2018.04.024
123. Johnston A. Challenges of therapeutic substitution of drugs for economic reasons: focus on CVD
prevention. Curr Med Res Opin 2010;26(4):871-8. doi:
https://dx.doi.org/10.1185/03007990903578462
124. Chor D, Pinho Ribeiro AL, Sa Carvalho M, et al. Prevalence, awareness, treatment and influence of
socioeconomic variables on control of high blood pressure: Results of the ELSA-Brasil study.
PLoS ONE 2015;10 (6) (no pagination)(e0127382) doi:
http://dx.doi.org/10.1371/journal.pone.0127382
125. Dusing R, Handrock R, Klebs S, et al. Impact of supportive measures on drug adherence in patients
with essential hypertension treated with valsartan: the randomized, open-label, parallel group
study VALIDATE. Journal of Hypertension 2009;27(4):894-901. doi:
http://dx.doi.org/10.1097/HJH.0b013e328323f9be
126. Moise N, Schwartz J, Bring R, et al. Antihypertensive drug class and adherence: An electronic
monitoring study. American Journal of Hypertension 2015;28(6):717-21. doi:
http://dx.doi.org/10.1093/ajh/hpu199
99
127. Sherman BW, Sekili A, Prakash ST, et al. Physician-specific variation in medication adherence among
diabetes patients. Am J Manag Care 2011;17(11):729-36.
128. Vegter S, Nguyen NH, Visser ST, et al. Compliance, persistence, and switching patterns for ACE
inhibitors and ARBs. Am J Manag Care 2011;17(9):609-16. doi: PMID: 21902446
129. Farrukh MJ, Tariq MH, Malik O, et al. Valsartan recall: global regulatory overview and future
challenges. Therapeutic Advances in Drug Safety 2019;10(no pagination) doi:
http://dx.doi.org/10.1177/2042098618823458
130. EMA. Angiotensin-II-receptor antagonists (sartans) containing a tetrazole group Share
https://www.ema.europa.eu/en/medicines/human/referrals/angiotensin-ii-receptor-
antagonists-sartans-containing-tetrazole-group: European Medicines Agency; 2019; accessed
30 September 2019.
131. Swissmedic. Healthcare Professional Communications
https://www.swissmedic.ch/swissmedic/en/home/humanarzneimittel/market-
surveillance/health-professional-communication--hpc-.html: Swissmedic; 2020; accessed 13
January 2020.
132. EUnetHTA. Guideline. Endpoints used for Relative Effectiveness Assessment: Clinical Endpoints. In:
European Network for Health Technology Assessment, ed. EUnetHTA JA2, WP 7, 2015:20.
133. Bohm M, Schumacher H, Teo KK, et al. Achieved blood pressure and cardiovascular outcomes in
high-risk patients: results from ONTARGET and TRANSCEND trials. Lancet 2017;389:2237.
134. Kjeldsen SE, Dahlof B, Devereux RB, et al. Effects of losartan on cardiovascular morbidity and
mortality in patients with isolated systolic hypertension and left ventricular hypertrophy: a
Losartan Intervention for Endpoint Reduction (LIFE) substudy. JAMA 2002;288(12):1491-8. doi:
10.1001/jama.288.12.1491
135. Thomopoulos C, Parati G, Zanchetti A. Effects ofblood pressure-lowering treatment.6. Prevention
ofheart failure and new-onset heart failure ^ meta-analyses ofrandomized trials. Journal
ofHypertension 2016;34(3):384.
136. Rubio-Tapia A, Herman ML, Ludvigsson JF, et al. Severe spruelike enteropathy associated with
olmesartan. Mayo Clin Proc 2012;87(8):732-8. doi: 10.1016/j.mayocp.2012.06.003 [published
Online First: 2012/06/26]
137. Marthey L, Cadiot G, Seksik P, et al. Olmesartan-associated enteropathy: results of a national survey.
Alimentary pharmacology & therapeutics 2014;40(9):1103-9. doi: 10.1111/apt.12937
[published Online First: 2014/09/10]
138. FDA. Response Docket No. FDA-2017-P-6513 https://www.citizen.org/wp-
content/uploads/191009_FDA-Final-Response-to-Olmesartan-Petition-Denied.pdf: U.S. Food
& Drug Administation; 2019; accessed 31 January 2020.
139. Marthey L, Cadiot G, Seksik P, et al. Olmesartan-associated enteropathy: Results of a national
survey. Alimentary Pharmacology and Therapeutics 2014;40(9):1103-09. doi:
http://dx.doi.org/10.1111/apt.12937
140. Burbure N, Lebwohl B, Arguelles-Grande C, et al. Olmesartan-associated sprue-like enteropathy: a
systematic review with emphasis on histopathology. Human pathology 2016;50:127-34. doi:
10.1016/j.humpath.2015.12.001 [published Online First: 2016/03/22]
141. Kung VL, Liu TC, Ma C. Collagenous Enteritis is Unlikely a Form of Aggressive Celiac Disease Despite
Sharing HLA-DQ2/DQ8 Genotypes. Am J Surg Pathol 2018;42(4):545-52. doi:
https://dx.doi.org/10.1097/PAS.0000000000001022
142. Viola E, Coggiola Pittoni A, Drahos A, et al. Photosensitivity with Angiotensin II Receptor Blockers:
A Retrospective Study Using Data from VigiBase(). Drug Saf 2015;38(10):889-94. doi:
https://dx.doi.org/10.1007/s40264-015-0323-7
143. Greywoode R, Braunstein ED, Arguelles-Grande C, et al. Olmesartan, other antihypertensives, and
chronic diarrhea among patients undergoing endoscopic procedures: A case-control study.
Mayo Clinic Proceedings 2014;89(9):1239-43. doi:
http://dx.doi.org/10.1016/j.mayocp.2014.05.012
100
144. Douros A, Bronder E, Andersohn F, et al. Drug-induced acute pancreatitis: Results from the
hospital-based Berlin case-control surveillance study of 102 cases. Alimentary Pharmacology
and Therapeutics 2013;38(7):825-34. doi: http://dx.doi.org/10.1111/apt.12461
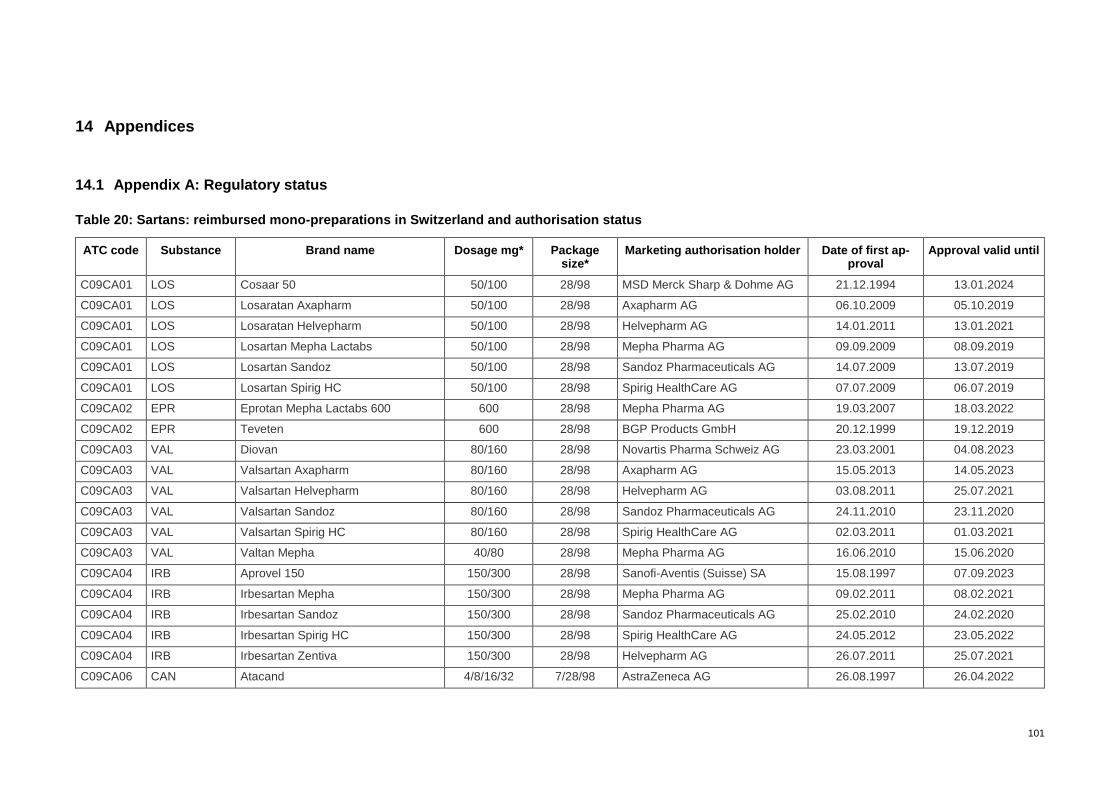
101
14 Appendices
14.1 Appendix A: Regulatory status
Table 20: Sartans: reimbursed mono-preparations in Switzerland and authorisation status
ATC code Substance Brand name Dosage mg* Package size*
Marketing authorisation holder Date of first ap-proval
Approval valid until
C09CA01 LOS Cosaar 50 50/100 28/98 MSD Merck Sharp & Dohme AG 21.12.1994 13.01.2024
C09CA01 LOS Losaratan Axapharm 50/100 28/98 Axapharm AG 06.10.2009 05.10.2019
C09CA01 LOS Losaratan Helvepharm 50/100 28/98 Helvepharm AG 14.01.2011 13.01.2021
C09CA01 LOS Losartan Mepha Lactabs 50/100 28/98 Mepha Pharma AG 09.09.2009 08.09.2019
C09CA01 LOS Losartan Sandoz 50/100 28/98 Sandoz Pharmaceuticals AG 14.07.2009 13.07.2019
C09CA01 LOS Losartan Spirig HC 50/100 28/98 Spirig HealthCare AG 07.07.2009 06.07.2019
C09CA02 EPR Eprotan Mepha Lactabs 600 600 28/98 Mepha Pharma AG 19.03.2007 18.03.2022
C09CA02 EPR Teveten 600 28/98 BGP Products GmbH 20.12.1999 19.12.2019
C09CA03 VAL Diovan 80/160 28/98 Novartis Pharma Schweiz AG 23.03.2001 04.08.2023
C09CA03 VAL Valsartan Axapharm 80/160 28/98 Axapharm AG 15.05.2013 14.05.2023
C09CA03 VAL Valsartan Helvepharm 80/160 28/98 Helvepharm AG 03.08.2011 25.07.2021
C09CA03 VAL Valsartan Sandoz 80/160 28/98 Sandoz Pharmaceuticals AG 24.11.2010 23.11.2020
C09CA03 VAL Valsartan Spirig HC 80/160 28/98 Spirig HealthCare AG 02.03.2011 01.03.2021
C09CA03 VAL Valtan Mepha 40/80 28/98 Mepha Pharma AG 16.06.2010 15.06.2020
C09CA04 IRB Aprovel 150 150/300 28/98 Sanofi-Aventis (Suisse) SA 15.08.1997 07.09.2023
C09CA04 IRB Irbesartan Mepha 150/300 28/98 Mepha Pharma AG 09.02.2011 08.02.2021
C09CA04 IRB Irbesartan Sandoz 150/300 28/98 Sandoz Pharmaceuticals AG 25.02.2010 24.02.2020
C09CA04 IRB Irbesartan Spirig HC 150/300 28/98 Spirig HealthCare AG 24.05.2012 23.05.2022
C09CA04 IRB Irbesartan Zentiva 150/300 28/98 Helvepharm AG 26.07.2011 25.07.2021
C09CA06 CAN Atacand 4/8/16/32 7/28/98 AstraZeneca AG 26.08.1997 26.04.2022
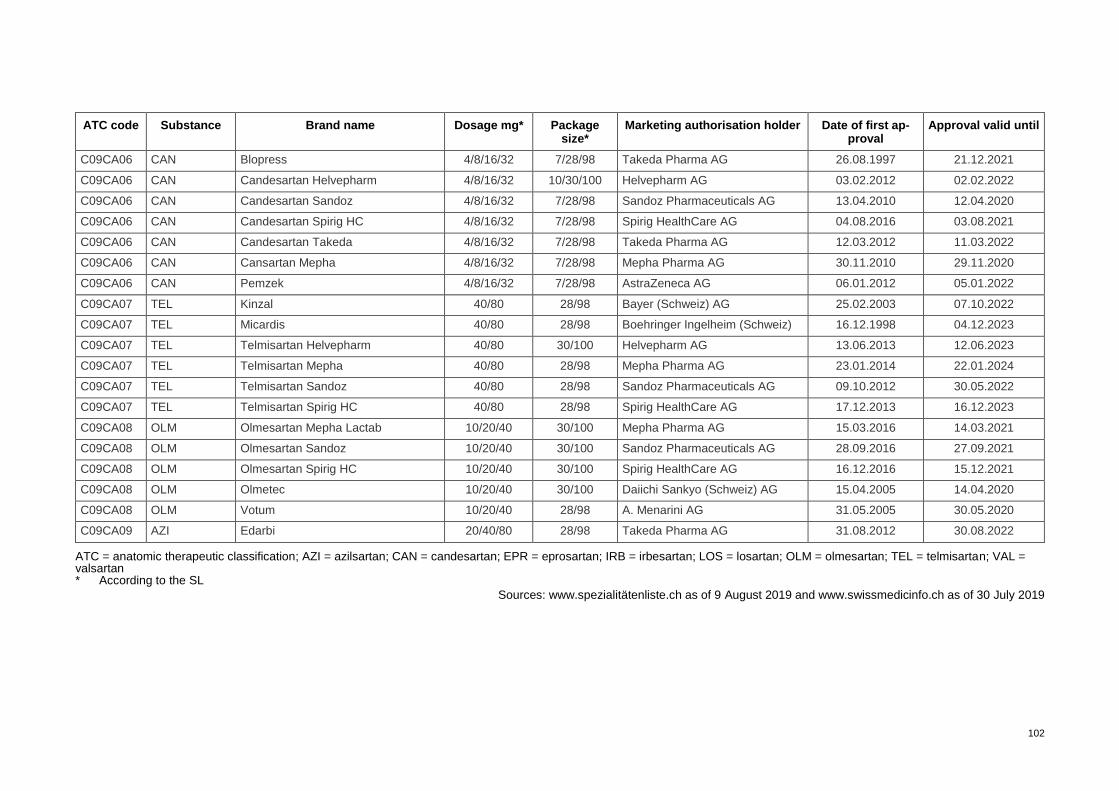
102
ATC code Substance Brand name Dosage mg* Package size*
Marketing authorisation holder Date of first ap-proval
Approval valid until
C09CA06 CAN Blopress 4/8/16/32 7/28/98 Takeda Pharma AG 26.08.1997 21.12.2021
C09CA06 CAN Candesartan Helvepharm 4/8/16/32 10/30/100 Helvepharm AG 03.02.2012 02.02.2022
C09CA06 CAN Candesartan Sandoz 4/8/16/32 7/28/98 Sandoz Pharmaceuticals AG 13.04.2010 12.04.2020
C09CA06 CAN Candesartan Spirig HC 4/8/16/32 7/28/98 Spirig HealthCare AG 04.08.2016 03.08.2021
C09CA06 CAN Candesartan Takeda 4/8/16/32 7/28/98 Takeda Pharma AG 12.03.2012 11.03.2022
C09CA06 CAN Cansartan Mepha 4/8/16/32 7/28/98 Mepha Pharma AG 30.11.2010 29.11.2020
C09CA06 CAN Pemzek 4/8/16/32 7/28/98 AstraZeneca AG 06.01.2012 05.01.2022
C09CA07 TEL Kinzal 40/80 28/98 Bayer (Schweiz) AG 25.02.2003 07.10.2022
C09CA07 TEL Micardis 40/80 28/98 Boehringer Ingelheim (Schweiz) 16.12.1998 04.12.2023
C09CA07 TEL Telmisartan Helvepharm 40/80 30/100 Helvepharm AG 13.06.2013 12.06.2023
C09CA07 TEL Telmisartan Mepha 40/80 28/98 Mepha Pharma AG 23.01.2014 22.01.2024
C09CA07 TEL Telmisartan Sandoz 40/80 28/98 Sandoz Pharmaceuticals AG 09.10.2012 30.05.2022
C09CA07 TEL Telmisartan Spirig HC 40/80 28/98 Spirig HealthCare AG 17.12.2013 16.12.2023
C09CA08 OLM Olmesartan Mepha Lactab 10/20/40 30/100 Mepha Pharma AG 15.03.2016 14.03.2021
C09CA08 OLM Olmesartan Sandoz 10/20/40 30/100 Sandoz Pharmaceuticals AG 28.09.2016 27.09.2021
C09CA08 OLM Olmesartan Spirig HC 10/20/40 30/100 Spirig HealthCare AG 16.12.2016 15.12.2021
C09CA08 OLM Olmetec 10/20/40 30/100 Daiichi Sankyo (Schweiz) AG 15.04.2005 14.04.2020
C09CA08 OLM Votum 10/20/40 28/98 A. Menarini AG 31.05.2005 30.05.2020
C09CA09 AZI Edarbi 20/40/80 28/98 Takeda Pharma AG 31.08.2012 30.08.2022
ATC = anatomic therapeutic classification; AZI = azilsartan; CAN = candesartan; EPR = eprosartan; IRB = irbesartan; LOS = losartan; OLM = olmesartan; TEL = telmisartan; VAL = valsartan * According to the SL
Sources: www.spezialitätenliste.ch as of 9 August 2019 and www.swissmedicinfo.ch as of 30 July 2019
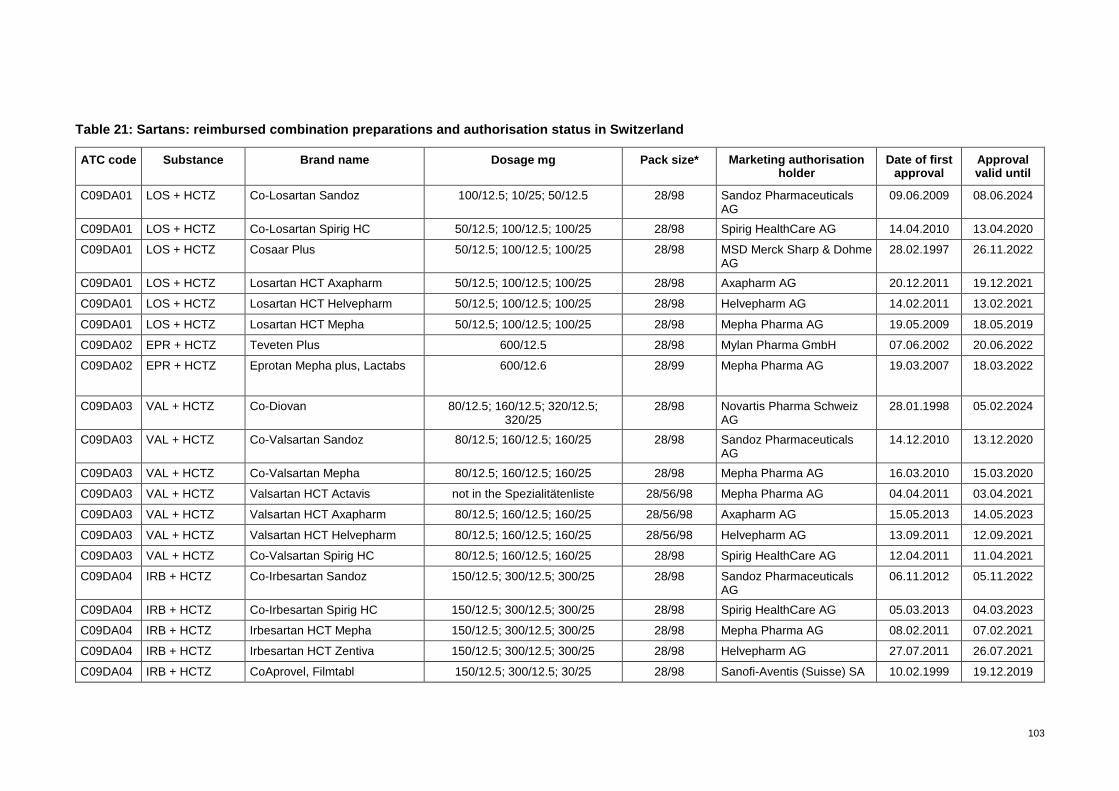
103
Table 21: Sartans: reimbursed combination preparations and authorisation status in Switzerland
ATC code Substance Brand name Dosage mg Pack size* Marketing authorisation holder
Date of first approval
Approval valid until
C09DA01 LOS + HCTZ Co-Losartan Sandoz 100/12.5; 10/25; 50/12.5 28/98 Sandoz Pharmaceuticals AG
09.06.2009 08.06.2024
C09DA01 LOS + HCTZ Co-Losartan Spirig HC 50/12.5; 100/12.5; 100/25 28/98 Spirig HealthCare AG 14.04.2010 13.04.2020
C09DA01 LOS + HCTZ Cosaar Plus 50/12.5; 100/12.5; 100/25 28/98 MSD Merck Sharp & Dohme AG
28.02.1997 26.11.2022
C09DA01 LOS + HCTZ Losartan HCT Axapharm 50/12.5; 100/12.5; 100/25 28/98 Axapharm AG 20.12.2011 19.12.2021
C09DA01 LOS + HCTZ Losartan HCT Helvepharm 50/12.5; 100/12.5; 100/25 28/98 Helvepharm AG 14.02.2011 13.02.2021
C09DA01 LOS + HCTZ Losartan HCT Mepha 50/12.5; 100/12.5; 100/25 28/98 Mepha Pharma AG 19.05.2009 18.05.2019
C09DA02 EPR + HCTZ Teveten Plus 600/12.5 28/98 Mylan Pharma GmbH 07.06.2002 20.06.2022
C09DA02 EPR + HCTZ Eprotan Mepha plus, Lactabs 600/12.6 28/99 Mepha Pharma AG 19.03.2007 18.03.2022
C09DA03 VAL + HCTZ Co-Diovan 80/12.5; 160/12.5; 320/12.5; 320/25
28/98 Novartis Pharma Schweiz AG
28.01.1998 05.02.2024
C09DA03 VAL + HCTZ Co-Valsartan Sandoz 80/12.5; 160/12.5; 160/25 28/98 Sandoz Pharmaceuticals AG
14.12.2010 13.12.2020
C09DA03 VAL + HCTZ Co-Valsartan Mepha 80/12.5; 160/12.5; 160/25 28/98 Mepha Pharma AG 16.03.2010 15.03.2020
C09DA03 VAL + HCTZ Valsartan HCT Actavis not in the Spezialitätenliste 28/56/98 Mepha Pharma AG 04.04.2011 03.04.2021
C09DA03 VAL + HCTZ Valsartan HCT Axapharm 80/12.5; 160/12.5; 160/25 28/56/98 Axapharm AG 15.05.2013 14.05.2023
C09DA03 VAL + HCTZ Valsartan HCT Helvepharm 80/12.5; 160/12.5; 160/25 28/56/98 Helvepharm AG 13.09.2011 12.09.2021
C09DA03 VAL + HCTZ Co-Valsartan Spirig HC 80/12.5; 160/12.5; 160/25 28/98 Spirig HealthCare AG 12.04.2011 11.04.2021
C09DA04 IRB + HCTZ Co-Irbesartan Sandoz 150/12.5; 300/12.5; 300/25 28/98 Sandoz Pharmaceuticals AG
06.11.2012 05.11.2022
C09DA04 IRB + HCTZ Co-Irbesartan Spirig HC 150/12.5; 300/12.5; 300/25 28/98 Spirig HealthCare AG 05.03.2013 04.03.2023
C09DA04 IRB + HCTZ Irbesartan HCT Mepha 150/12.5; 300/12.5; 300/25 28/98 Mepha Pharma AG 08.02.2011 07.02.2021
C09DA04 IRB + HCTZ Irbesartan HCT Zentiva 150/12.5; 300/12.5; 300/25 28/98 Helvepharm AG 27.07.2011 26.07.2021
C09DA04 IRB + HCTZ CoAprovel, Filmtabl 150/12.5; 300/12.5; 30/25 28/98 Sanofi-Aventis (Suisse) SA 10.02.1999 19.12.2019

104
ATC code Substance Brand name Dosage mg Pack size* Marketing authorisation holder
Date of first approval
Approval valid until
C09DA06 CAN + HCTZ Blopress plus 8/12.5; 16/12.5; 32/12.5; 32/25 28/98 Takeda Pharma AG 11.02.2000 05.09.2020
C09DA06 CAN + HCTZ Candesartan HCT Helvepharm 8/12.5; 16/12.5;32/12.5; 32/25 28/100 Helvepharm AG 30.01.2012 29.01.2022
C09DA06 CAN + HCTZ Candesartan Mepha plus 8/12.5; 16/12.5; 32/12.5; 32/25 28/98 Mepha Pharma AG 24.01.2011 23.01.2021
C09DA06 CAN + HCTZ Candesartan Plus Takeda 8/12.5; 16/12.5; 32/12.5; 32/25 28/98 Takeda Pharma AG 12.03.2012 11.03.2022
C09DA06 CAN + HCTZ Co-Candesartan Sandoz 8/12.5; 16/12.5; 32/12.5; 32/25 28/98 Sandoz Pharmaceuticals AG
18.07.2011 17.07.2021
C09DA06 CAN + HCTZ Co-Candesartan Spirig HC 8/12.5; 16/12.5; 32/12.5; 32/25 28/98 Spirig HealthCare AG 23.09.2016 22.09.2021
C09DA06 CAN + HCTZ Pemzek Plus 8/12.5; 16/12.5; 32/12.5; 32/25 28/98 AstraZeneca AG 06.01.2012 05.01.2022
C09DA06 CAN + HCTZ Atacand Plus 8/12.5; 16/12.5; 32/12.5; 32/26 28/99 AstraZeneca AG 24.03.1999 19.12.2019
C09DA07 TEL + HCTZ Co-Telmisartan Sandoz 80/12.5; 80/25 28/98 Sandoz Pharmaceuticals AG
27.02.2014 26.02.2024
C09DA07 TEL + HCTZ Co-Telmisartan Spirig HC 80/12.5; 80/25 28/98 Spirig HealthCare AG 05.09.2016 04.09.2021
C09DA07 TEL + HCTZ Kinzal Plus 80/12.5; 80/25 28/98 Bayer (Schweiz) AG 25.02.2003 07.10.2022
C09DA07 TEL + HCTZ Micardis Plus 80/12.5; 80/25 28/98 Boehringer Ingelheim (Schweiz) GmbH
30.08.2002 23.07.2022
C09DA07 TEL + HCTZ Telmisartan HCT Mepha 80/12.5; 80/25 28/98 Mepha Pharma AG 08.04.2015 07.04.2020
C09DA07 TEL + HCTZ Telmisartan HCT Zentiva 80/12.5; 80/25 28/98 Helvepharm AG 03.02.2016 02.02.2021
C09DA08 OLM + HCTZ Co-Olmesartan Spirig HC 20/12.5; 20/25; 40/12.5; 40/25 28/98 Spirig HealthCare AG 01.03.2017 28.02.2022
C09DA08 OLM + HCTZ Olmesartan HCT Mepha 20/12.5; 20/25; 40/12.5; 40/25 28/98 Mepha Pharma AG 22.09.2016 21.09.2021
C09DA08 OLM + HCTZ Olmesartan Plus Sandoz 20/12.5; 20/25; 40/12.5; 40/25 28/98 Sandoz Pharmaceuticals AG
08.02.2017 07.02.2022
C09DA08 OLM + HCTZ Olmetec Plus 20/12.5; 20/25; 40/12.5; 40/25 28/98 Daiichi Sankyo (Schweiz) AG
12.07.2005 11.07.2020
C09DA08 OLM + HCTZ Votum Plus 20/12.5; 20/25; 40/12.5; 40/25; 80/12.5; 80/25
28/98 A. Menarini AG 07.10.2005 06.10.2020
C09DA08 OLM + HCTZ Olmesartan HCT Mylan 20/12.5; 20/25; 40/12.5; 40/25 28/98 Mylan Pharma GmbH 19.07.2018 18.07.2023
C09DA09 AZI + HCTZ Edarbyclor 40/12.5; 40/25 28/98 Takeda Pharma AG 28.10.2014 27.10.2019
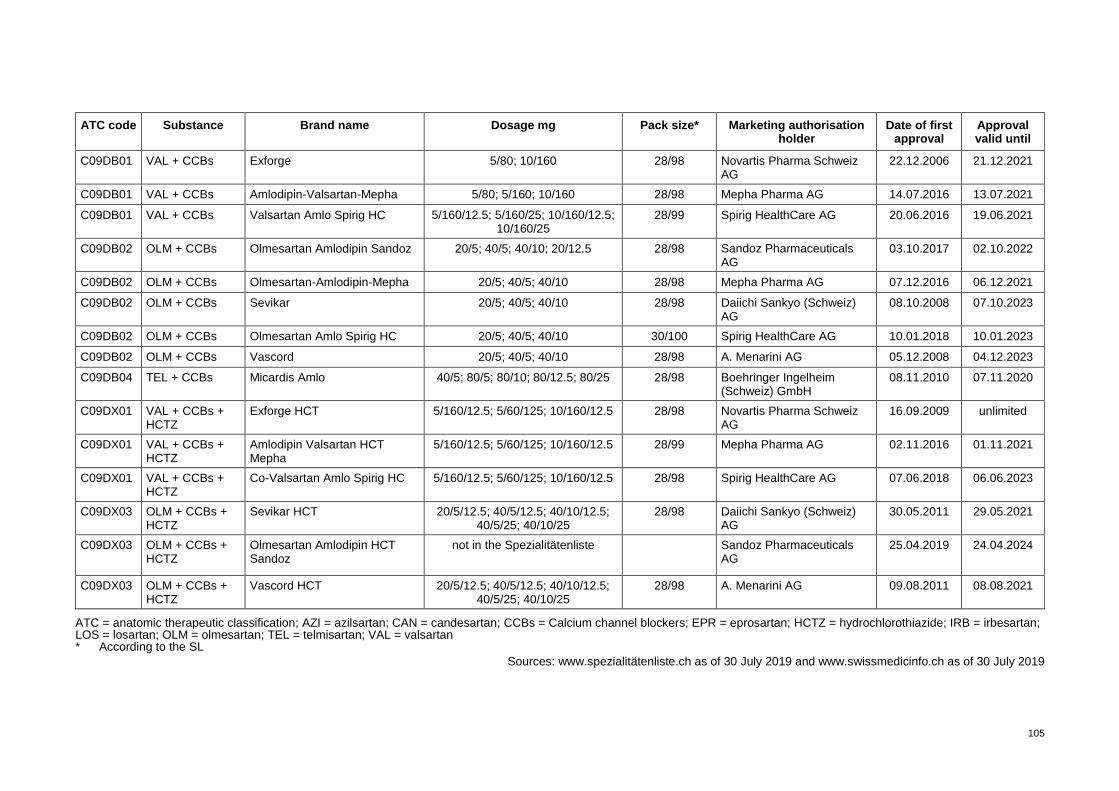
105
ATC code Substance Brand name Dosage mg Pack size* Marketing authorisation holder
Date of first approval
Approval valid until
C09DB01 VAL + CCBs Exforge 5/80; 10/160 28/98 Novartis Pharma Schweiz AG
22.12.2006 21.12.2021
C09DB01 VAL + CCBs Amlodipin-Valsartan-Mepha 5/80; 5/160; 10/160 28/98 Mepha Pharma AG 14.07.2016 13.07.2021
C09DB01 VAL + CCBs Valsartan Amlo Spirig HC 5/160/12.5; 5/160/25; 10/160/12.5; 10/160/25
28/99 Spirig HealthCare AG 20.06.2016 19.06.2021
C09DB02 OLM + CCBs Olmesartan Amlodipin Sandoz 20/5; 40/5; 40/10; 20/12.5 28/98 Sandoz Pharmaceuticals AG
03.10.2017 02.10.2022
C09DB02 OLM + CCBs Olmesartan-Amlodipin-Mepha 20/5; 40/5; 40/10 28/98 Mepha Pharma AG 07.12.2016 06.12.2021
C09DB02 OLM + CCBs Sevikar 20/5; 40/5; 40/10 28/98 Daiichi Sankyo (Schweiz) AG
08.10.2008 07.10.2023
C09DB02 OLM + CCBs Olmesartan Amlo Spirig HC 20/5; 40/5; 40/10 30/100 Spirig HealthCare AG 10.01.2018 10.01.2023
C09DB02 OLM + CCBs Vascord 20/5; 40/5; 40/10 28/98 A. Menarini AG 05.12.2008 04.12.2023
C09DB04 TEL + CCBs Micardis Amlo 40/5; 80/5; 80/10; 80/12.5; 80/25 28/98 Boehringer Ingelheim (Schweiz) GmbH
08.11.2010 07.11.2020
C09DX01 VAL + CCBs + HCTZ
Exforge HCT 5/160/12.5; 5/60/125; 10/160/12.5 28/98 Novartis Pharma Schweiz AG
16.09.2009 unlimited
C09DX01 VAL + CCBs + HCTZ
Amlodipin Valsartan HCT Mepha
5/160/12.5; 5/60/125; 10/160/12.5 28/99 Mepha Pharma AG 02.11.2016 01.11.2021
C09DX01 VAL + CCBs + HCTZ
Co-Valsartan Amlo Spirig HC 5/160/12.5; 5/60/125; 10/160/12.5 28/98 Spirig HealthCare AG 07.06.2018 06.06.2023
C09DX03 OLM + CCBs + HCTZ
Sevikar HCT 20/5/12.5; 40/5/12.5; 40/10/12.5; 40/5/25; 40/10/25
28/98 Daiichi Sankyo (Schweiz) AG
30.05.2011 29.05.2021
C09DX03 OLM + CCBs + HCTZ
Olmesartan Amlodipin HCT Sandoz
not in the Spezialitätenliste
Sandoz Pharmaceuticals AG
25.04.2019 24.04.2024
C09DX03 OLM + CCBs + HCTZ
Vascord HCT 20/5/12.5; 40/5/12.5; 40/10/12.5; 40/5/25; 40/10/25
28/98 A. Menarini AG 09.08.2011 08.08.2021
ATC = anatomic therapeutic classification; AZI = azilsartan; CAN = candesartan; CCBs = Calcium channel blockers; EPR = eprosartan; HCTZ = hydrochlorothiazide; IRB = irbesartan; LOS = losartan; OLM = olmesartan; TEL = telmisartan; VAL = valsartan * According to the SL
Sources: www.spezialitätenliste.ch as of 30 July 2019 and www.swissmedicinfo.ch as of 30 July 2019
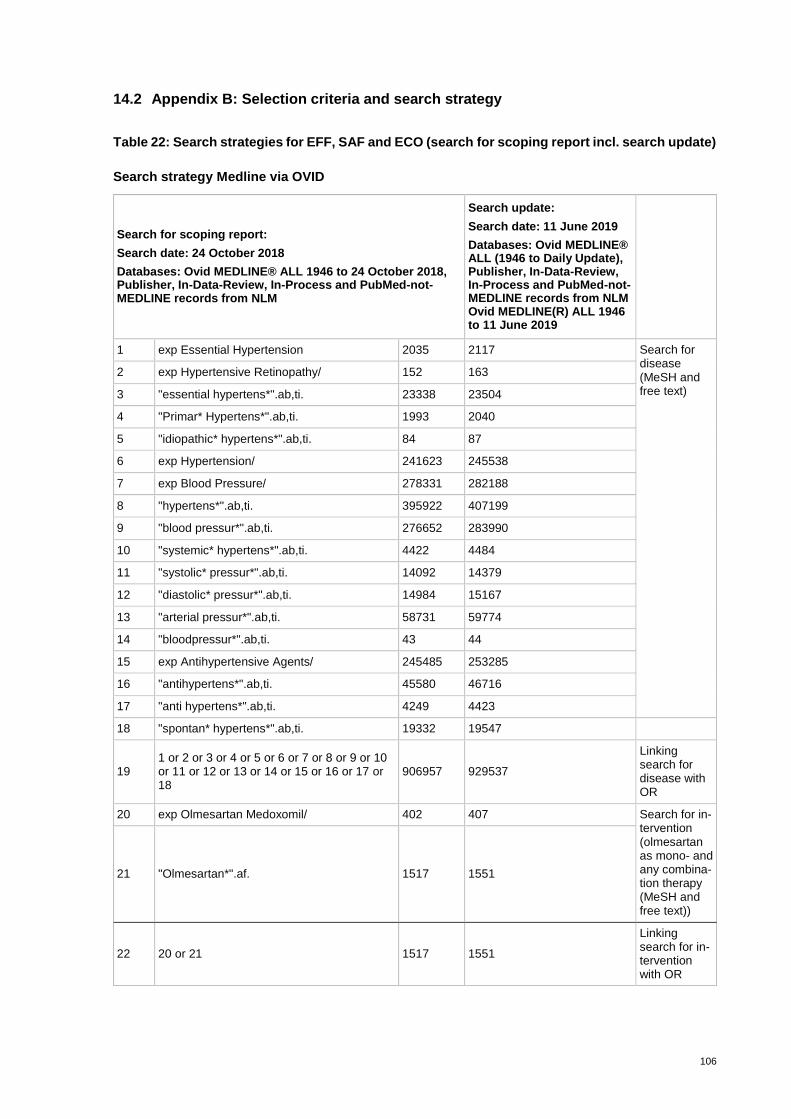
106
14.2 Appendix B: Selection criteria and search strategy
Table 22: Search strategies for EFF, SAF and ECO (search for scoping report incl. search update)
Search strategy Medline via OVID
Search for scoping report:
Search date: 24 October 2018
Databases: Ovid MEDLINE® ALL 1946 to 24 October 2018, Publisher, In-Data-Review, In-Process and PubMed-not-MEDLINE records from NLM
Search update:
Search date: 11 June 2019
Databases: Ovid MEDLINE® ALL (1946 to Daily Update), Publisher, In-Data-Review, In-Process and PubMed-not-MEDLINE records from NLM Ovid MEDLINE(R) ALL 1946 to 11 June 2019
1 exp Essential Hypertension 2035 2117 Search for disease (MeSH and free text)
2 exp Hypertensive Retinopathy/ 152 163
3 "essential hypertens*".ab,ti. 23338 23504
4 "Primar* Hypertens*".ab,ti. 1993 2040
5 "idiopathic* hypertens*".ab,ti. 84 87
6 exp Hypertension/ 241623 245538
7 exp Blood Pressure/ 278331 282188
8 "hypertens*".ab,ti. 395922 407199
9 "blood pressur*".ab,ti. 276652 283990
10 "systemic* hypertens*".ab,ti. 4422 4484
11 "systolic* pressur*".ab,ti. 14092 14379
12 "diastolic* pressur*".ab,ti. 14984 15167
13 "arterial pressur*".ab,ti. 58731 59774
14 "bloodpressur*".ab,ti. 43 44
15 exp Antihypertensive Agents/ 245485 253285
16 "antihypertens*".ab,ti. 45580 46716
17 "anti hypertens*".ab,ti. 4249 4423
18 "spontan* hypertens*".ab,ti. 19332 19547
19 1 or 2 or 3 or 4 or 5 or 6 or 7 or 8 or 9 or 10 or 11 or 12 or 13 or 14 or 15 or 16 or 17 or 18
906957 929537
Linking search for disease with OR
20 exp Olmesartan Medoxomil/ 402 407 Search for in-tervention (olmesartan as mono- and any combina-tion therapy (MeSH and free text))
21 "Olmesartan*".af. 1517 1551
22 20 or 21 1517 1551
Linking search for in-tervention with OR
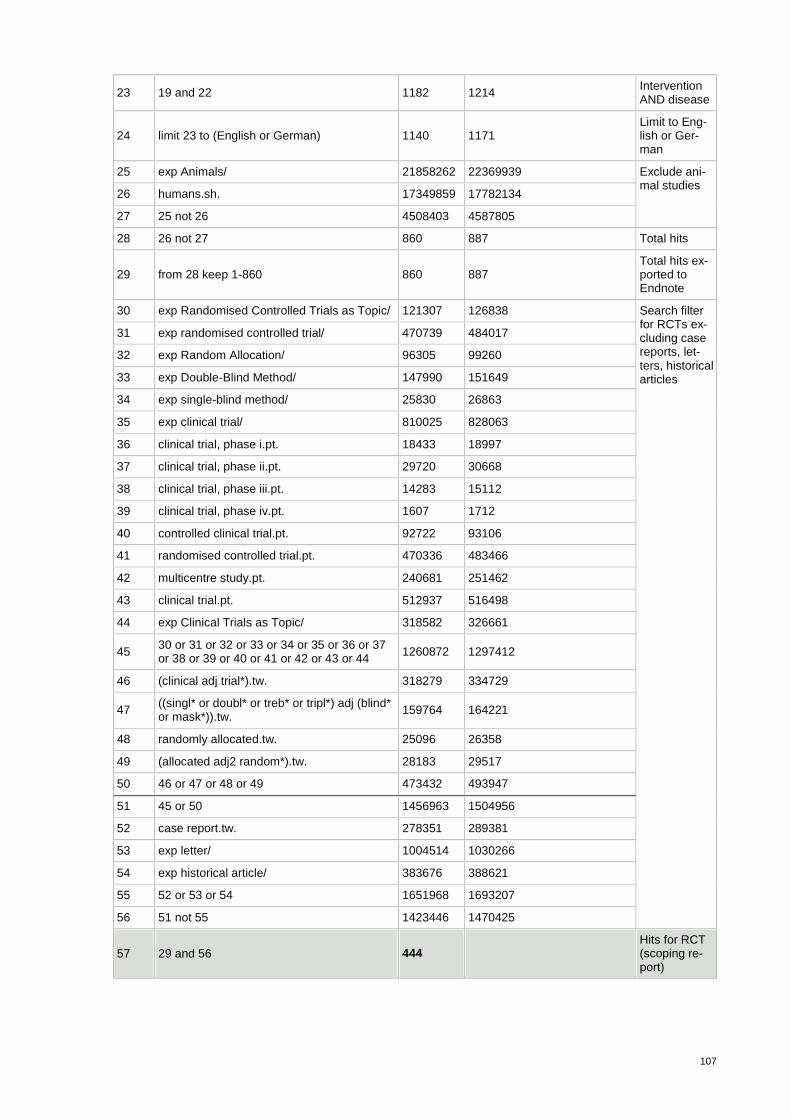
107
23 19 and 22 1182 1214 Intervention AND disease
24 limit 23 to (English or German) 1140 1171 Limit to Eng-lish or Ger-man
25 exp Animals/ 21858262 22369939 Exclude ani-mal studies
26 humans.sh. 17349859 17782134
27 25 not 26 4508403 4587805
28 26 not 27 860 887 Total hits
29 from 28 keep 1-860 860 887 Total hits ex-ported to Endnote
30 exp Randomised Controlled Trials as Topic/ 121307 126838 Search filter for RCTs ex-cluding case reports, let-ters, historical articles
31 exp randomised controlled trial/ 470739 484017
32 exp Random Allocation/ 96305 99260
33 exp Double-Blind Method/ 147990 151649
34 exp single-blind method/ 25830 26863
35 exp clinical trial/ 810025 828063
36 clinical trial, phase i.pt. 18433 18997
37 clinical trial, phase ii.pt. 29720 30668
38 clinical trial, phase iii.pt. 14283 15112
39 clinical trial, phase iv.pt. 1607 1712
40 controlled clinical trial.pt. 92722 93106
41 randomised controlled trial.pt. 470336 483466
42 multicentre study.pt. 240681 251462
43 clinical trial.pt. 512937 516498
44 exp Clinical Trials as Topic/ 318582 326661
45 30 or 31 or 32 or 33 or 34 or 35 or 36 or 37 or 38 or 39 or 40 or 41 or 42 or 43 or 44
1260872 1297412
46 (clinical adj trial*).tw. 318279 334729
47 ((singl* or doubl* or treb* or tripl*) adj (blind* or mask*)).tw.
159764 164221
48 randomly allocated.tw. 25096 26358
49 (allocated adj2 random*).tw. 28183 29517
50 46 or 47 or 48 or 49 473432 493947
51 45 or 50 1456963 1504956
52 case report.tw. 278351 289381
53 exp letter/ 1004514 1030266
54 exp historical article/ 383676 388621
55 52 or 53 or 54 1651968 1693207
56 51 not 55 1423446 1470425
57 29 and 56 444 Hits for RCT (scoping re-port)
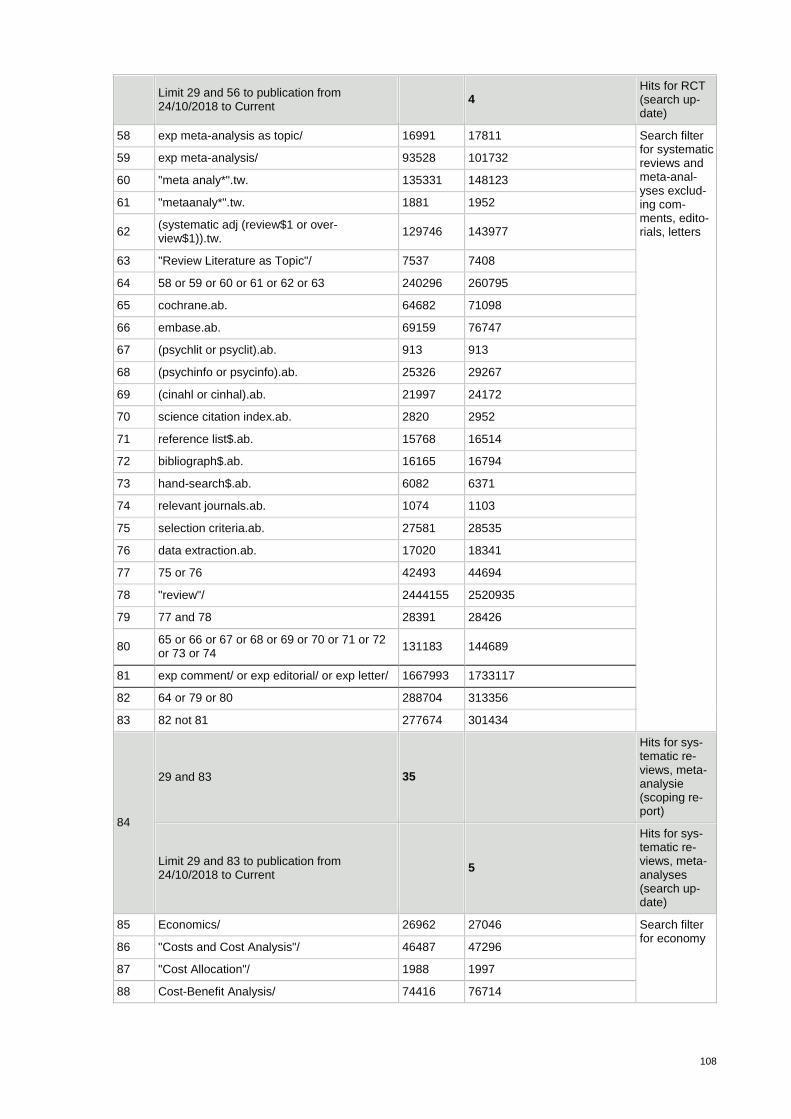
108
Limit 29 and 56 to publication from 24/10/2018 to Current
4 Hits for RCT (search up-date)
58 exp meta-analysis as topic/ 16991 17811 Search filter for systematic reviews and meta-anal-yses exclud-ing com-ments, edito-rials, letters
59 exp meta-analysis/ 93528 101732
60 "meta analy*".tw. 135331 148123
61 "metaanaly*".tw. 1881 1952
62 (systematic adj (review$1 or over-view$1)).tw.
129746 143977
63 "Review Literature as Topic"/ 7537 7408
64 58 or 59 or 60 or 61 or 62 or 63 240296 260795
65 cochrane.ab. 64682 71098
66 embase.ab. 69159 76747
67 (psychlit or psyclit).ab. 913 913
68 (psychinfo or psycinfo).ab. 25326 29267
69 (cinahl or cinhal).ab. 21997 24172
70 science citation index.ab. 2820 2952
71 reference list$.ab. 15768 16514
72 bibliograph$.ab. 16165 16794
73 hand-search$.ab. 6082 6371
74 relevant journals.ab. 1074 1103
75 selection criteria.ab. 27581 28535
76 data extraction.ab. 17020 18341
77 75 or 76 42493 44694
78 "review"/ 2444155 2520935
79 77 and 78 28391 28426
80 65 or 66 or 67 or 68 or 69 or 70 or 71 or 72 or 73 or 74
131183 144689
81 exp comment/ or exp editorial/ or exp letter/ 1667993 1733117
82 64 or 79 or 80 288704 313356
83 82 not 81 277674 301434
84
29 and 83 35
Hits for sys-tematic re-views, meta-analysie (scoping re-port)
Limit 29 and 83 to publication from 24/10/2018 to Current
5
Hits for sys-tematic re-views, meta-analyses (search up-date)
85 Economics/ 26962 27046 Search filter for economy
86 "Costs and Cost Analysis"/ 46487 47296
87 "Cost Allocation"/ 1988 1997
88 Cost-Benefit Analysis/ 74416 76714
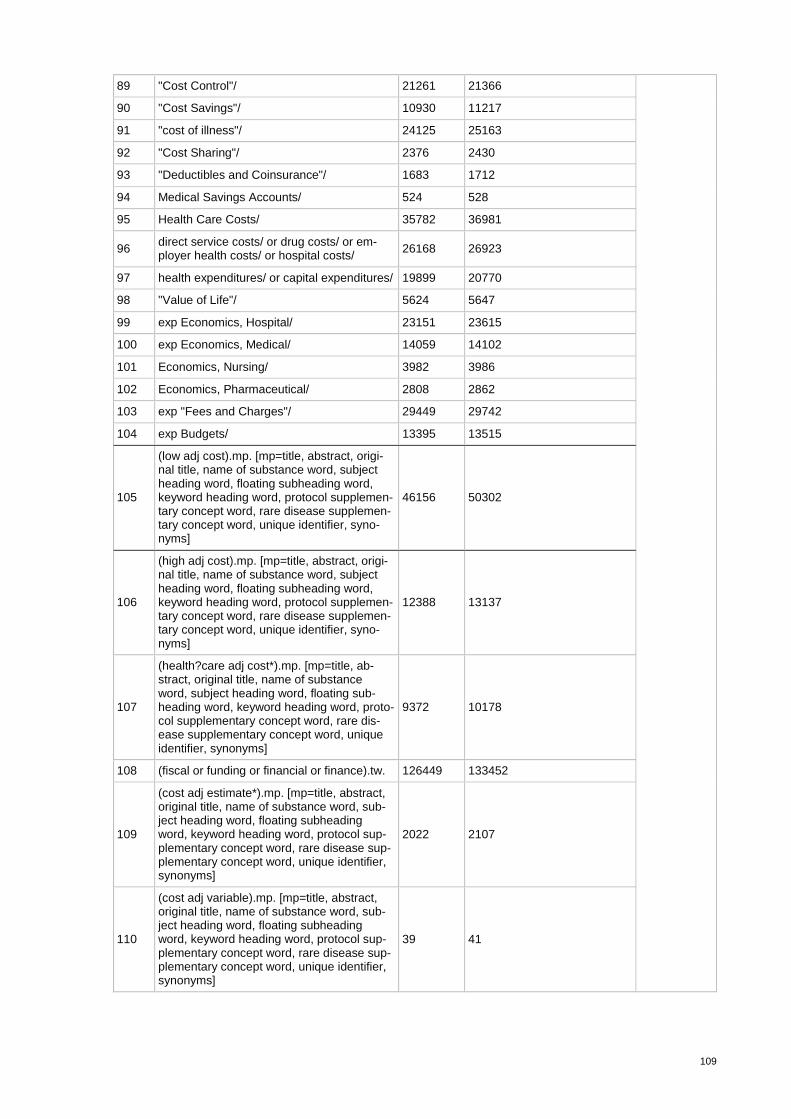
109
89 "Cost Control"/ 21261 21366
90 "Cost Savings"/ 10930 11217
91 "cost of illness"/ 24125 25163
92 "Cost Sharing"/ 2376 2430
93 "Deductibles and Coinsurance"/ 1683 1712
94 Medical Savings Accounts/ 524 528
95 Health Care Costs/ 35782 36981
96 direct service costs/ or drug costs/ or em-ployer health costs/ or hospital costs/
26168 26923
97 health expenditures/ or capital expenditures/ 19899 20770
98 "Value of Life"/ 5624 5647
99 exp Economics, Hospital/ 23151 23615
100 exp Economics, Medical/ 14059 14102
101 Economics, Nursing/ 3982 3986
102 Economics, Pharmaceutical/ 2808 2862
103 exp "Fees and Charges"/ 29449 29742
104 exp Budgets/ 13395 13515
105
(low adj cost).mp. [mp=title, abstract, origi-nal title, name of substance word, subject heading word, floating subheading word, keyword heading word, protocol supplemen-tary concept word, rare disease supplemen-tary concept word, unique identifier, syno-nyms]
46156 50302
106
(high adj cost).mp. [mp=title, abstract, origi-nal title, name of substance word, subject heading word, floating subheading word, keyword heading word, protocol supplemen-tary concept word, rare disease supplemen-tary concept word, unique identifier, syno-nyms]
12388 13137
107
(health?care adj cost*).mp. [mp=title, ab-stract, original title, name of substance word, subject heading word, floating sub-heading word, keyword heading word, proto-col supplementary concept word, rare dis-ease supplementary concept word, unique identifier, synonyms]
9372 10178
108 (fiscal or funding or financial or finance).tw. 126449 133452
109
(cost adj estimate*).mp. [mp=title, abstract, original title, name of substance word, sub-ject heading word, floating subheading word, keyword heading word, protocol sup-plementary concept word, rare disease sup-plementary concept word, unique identifier, synonyms]
2022 2107
110
(cost adj variable).mp. [mp=title, abstract, original title, name of substance word, sub-ject heading word, floating subheading word, keyword heading word, protocol sup-plementary concept word, rare disease sup-plementary concept word, unique identifier, synonyms]
39 41
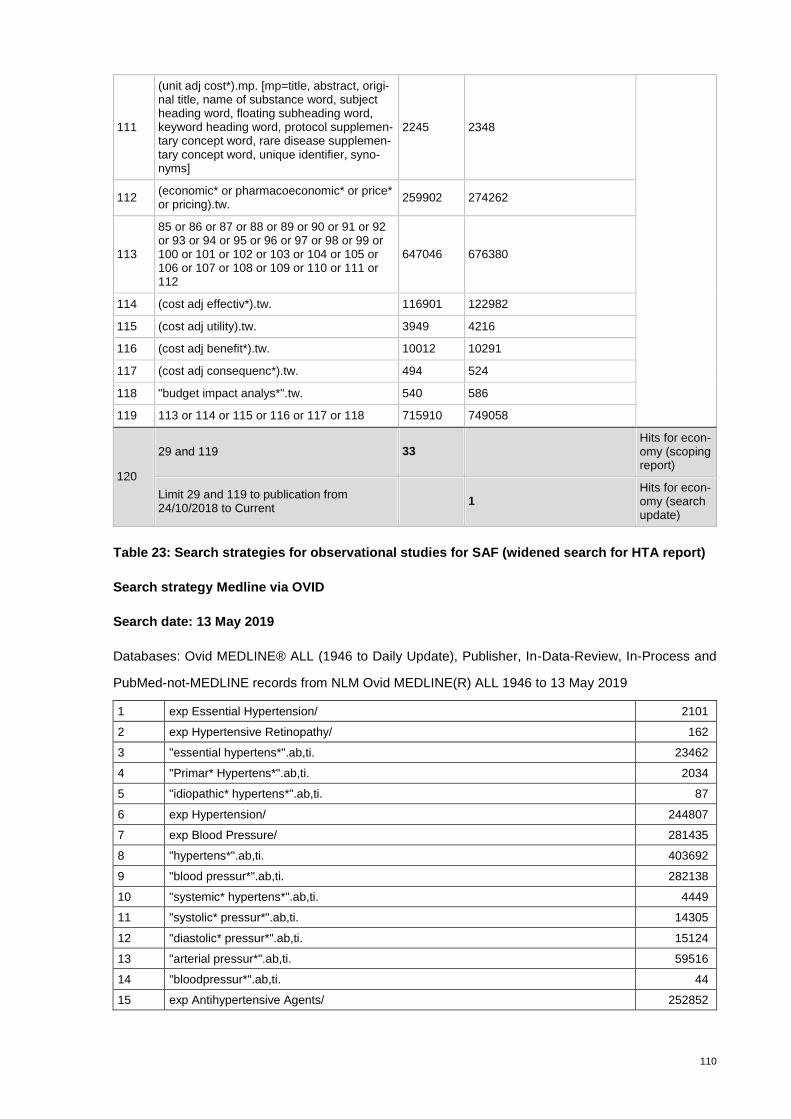
110
Table 23: Search strategies for observational studies for SAF (widened search for HTA report)
Search strategy Medline via OVID
Search date: 13 May 2019
Databases: Ovid MEDLINE® ALL (1946 to Daily Update), Publisher, In-Data-Review, In-Process and
PubMed-not-MEDLINE records from NLM Ovid MEDLINE(R) ALL 1946 to 13 May 2019
1 exp Essential Hypertension/ 2101
2 exp Hypertensive Retinopathy/ 162
3 "essential hypertens*".ab,ti. 23462
4 "Primar* Hypertens*".ab,ti. 2034
5 "idiopathic* hypertens*".ab,ti. 87
6 exp Hypertension/ 244807
7 exp Blood Pressure/ 281435
8 "hypertens*".ab,ti. 403692
9 "blood pressur*".ab,ti. 282138
10 "systemic* hypertens*".ab,ti. 4449
11 "systolic* pressur*".ab,ti. 14305
12 "diastolic* pressur*".ab,ti. 15124
13 "arterial pressur*".ab,ti. 59516
14 "bloodpressur*".ab,ti. 44
15 exp Antihypertensive Agents/ 252852
111
(unit adj cost*).mp. [mp=title, abstract, origi-nal title, name of substance word, subject heading word, floating subheading word, keyword heading word, protocol supplemen-tary concept word, rare disease supplemen-tary concept word, unique identifier, syno-nyms]
2245 2348
112 (economic* or pharmacoeconomic* or price* or pricing).tw.
259902 274262
113
85 or 86 or 87 or 88 or 89 or 90 or 91 or 92 or 93 or 94 or 95 or 96 or 97 or 98 or 99 or 100 or 101 or 102 or 103 or 104 or 105 or 106 or 107 or 108 or 109 or 110 or 111 or 112
647046 676380
114 (cost adj effectiv*).tw. 116901 122982
115 (cost adj utility).tw. 3949 4216
116 (cost adj benefit*).tw. 10012 10291
117 (cost adj consequenc*).tw. 494 524
118 "budget impact analys*".tw. 540 586
119 113 or 114 or 115 or 116 or 117 or 118 715910 749058
120
29 and 119 33 Hits for econ-omy (scoping report)
Limit 29 and 119 to publication from 24/10/2018 to Current
1 Hits for econ-omy (search update)
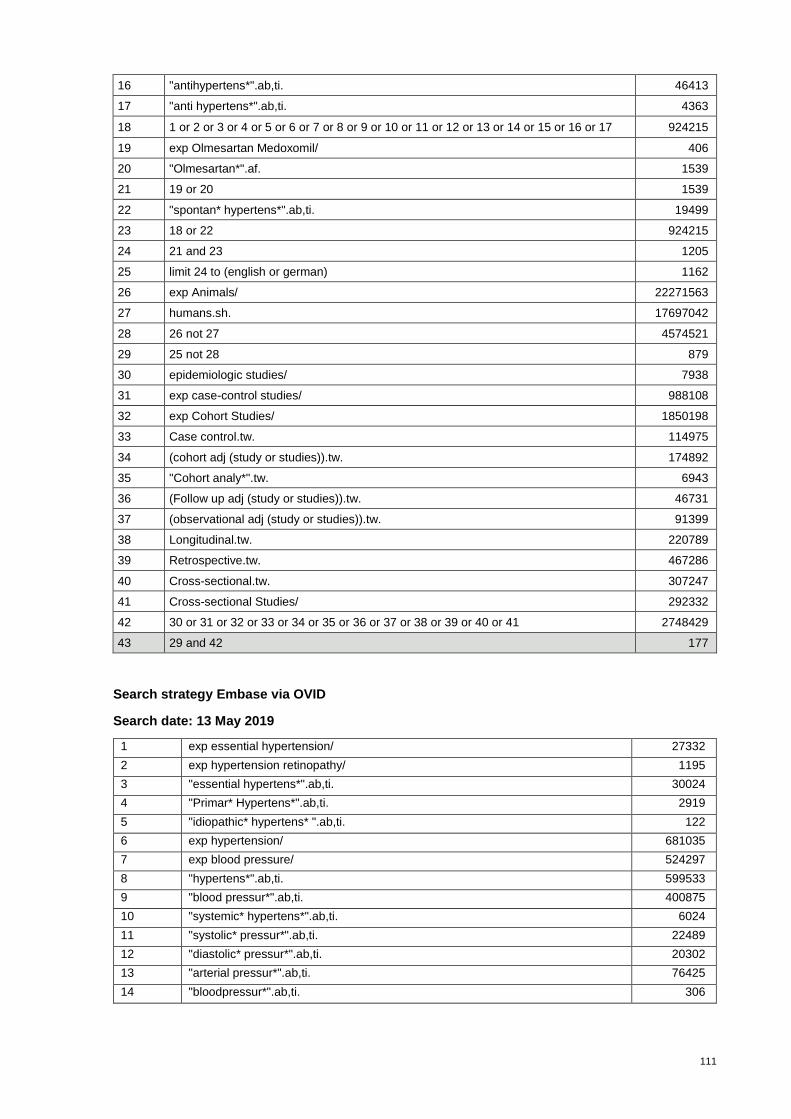
111
16 "antihypertens*".ab,ti. 46413
17 "anti hypertens*".ab,ti. 4363
18 1 or 2 or 3 or 4 or 5 or 6 or 7 or 8 or 9 or 10 or 11 or 12 or 13 or 14 or 15 or 16 or 17 924215
19 exp Olmesartan Medoxomil/ 406
20 "Olmesartan*".af. 1539
21 19 or 20 1539
22 "spontan* hypertens*".ab,ti. 19499
23 18 or 22 924215
24 21 and 23 1205
25 limit 24 to (english or german) 1162
26 exp Animals/ 22271563
27 humans.sh. 17697042
28 26 not 27 4574521
29 25 not 28 879
30 epidemiologic studies/ 7938
31 exp case-control studies/ 988108
32 exp Cohort Studies/ 1850198
33 Case control.tw. 114975
34 (cohort adj (study or studies)).tw. 174892
35 "Cohort analy*".tw. 6943
36 (Follow up adj (study or studies)).tw. 46731
37 (observational adj (study or studies)).tw. 91399
38 Longitudinal.tw. 220789
39 Retrospective.tw. 467286
40 Cross-sectional.tw. 307247
41 Cross-sectional Studies/ 292332
42 30 or 31 or 32 or 33 or 34 or 35 or 36 or 37 or 38 or 39 or 40 or 41 2748429
43 29 and 42 177
Search strategy Embase via OVID
Search date: 13 May 2019
1 exp essential hypertension/ 27332
2 exp hypertension retinopathy/ 1195
3 "essential hypertens*".ab,ti. 30024
4 "Primar* Hypertens*".ab,ti. 2919
5 "idiopathic* hypertens* ".ab,ti. 122
6 exp hypertension/ 681035
7 exp blood pressure/ 524297
8 "hypertens*".ab,ti. 599533
9 "blood pressur*".ab,ti. 400875
10 "systemic* hypertens*".ab,ti. 6024
11 "systolic* pressur*".ab,ti. 22489
12 "diastolic* pressur*".ab,ti. 20302
13 "arterial pressur*".ab,ti. 76425
14 "bloodpressur*".ab,ti. 306
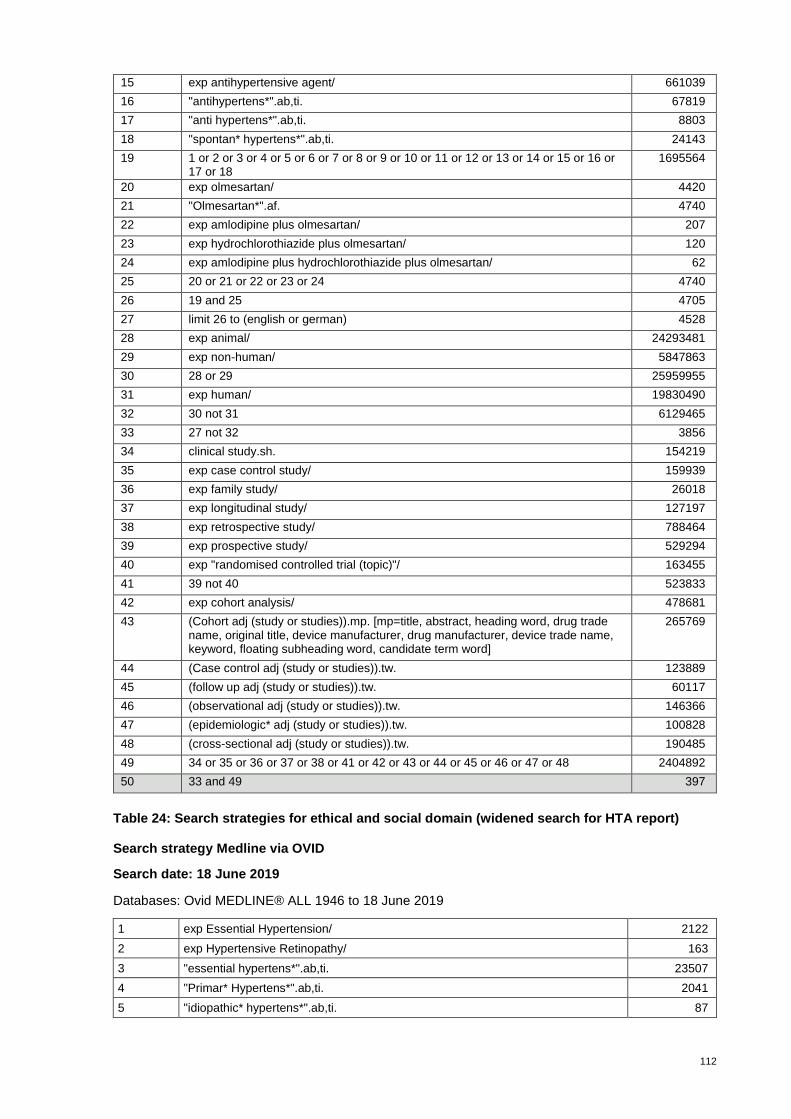
112
15 exp antihypertensive agent/ 661039
16 "antihypertens*".ab,ti. 67819
17 "anti hypertens*".ab,ti. 8803
18 "spontan* hypertens*".ab,ti. 24143
19 1 or 2 or 3 or 4 or 5 or 6 or 7 or 8 or 9 or 10 or 11 or 12 or 13 or 14 or 15 or 16 or 17 or 18
1695564
20 exp olmesartan/ 4420
21 "Olmesartan*".af. 4740
22 exp amlodipine plus olmesartan/ 207
23 exp hydrochlorothiazide plus olmesartan/ 120
24 exp amlodipine plus hydrochlorothiazide plus olmesartan/ 62
25 20 or 21 or 22 or 23 or 24 4740
26 19 and 25 4705
27 limit 26 to (english or german) 4528
28 exp animal/ 24293481
29 exp non-human/ 5847863
30 28 or 29 25959955
31 exp human/ 19830490
32 30 not 31 6129465
33 27 not 32 3856
34 clinical study.sh. 154219
35 exp case control study/ 159939
36 exp family study/ 26018
37 exp longitudinal study/ 127197
38 exp retrospective study/ 788464
39 exp prospective study/ 529294
40 exp "randomised controlled trial (topic)"/ 163455
41 39 not 40 523833
42 exp cohort analysis/ 478681
43 (Cohort adj (study or studies)).mp. [mp=title, abstract, heading word, drug trade name, original title, device manufacturer, drug manufacturer, device trade name, keyword, floating subheading word, candidate term word]
265769
44 (Case control adj (study or studies)).tw. 123889
45 (follow up adj (study or studies)).tw. 60117
46 (observational adj (study or studies)).tw. 146366
47 (epidemiologic* adj (study or studies)).tw. 100828
48 (cross-sectional adj (study or studies)).tw. 190485
49 34 or 35 or 36 or 37 or 38 or 41 or 42 or 43 or 44 or 45 or 46 or 47 or 48 2404892
50 33 and 49 397
Table 24: Search strategies for ethical and social domain (widened search for HTA report)
Search strategy Medline via OVID
Search date: 18 June 2019
Databases: Ovid MEDLINE® ALL 1946 to 18 June 2019
1 exp Essential Hypertension/ 2122
2 exp Hypertensive Retinopathy/ 163
3 "essential hypertens*".ab,ti. 23507
4 "Primar* Hypertens*".ab,ti. 2041
5 "idiopathic* hypertens*".ab,ti. 87

113
6 exp Hypertension/ 245671
7 exp Blood Pressure/ 282310
8 "hypertens*".ab,ti. 407431
9 "blood pressur*".ab,ti. 284181
10 "systemic* hypertens*".ab,ti. 4485
11 "systolic* pressur*".ab,ti. 14389
12 "diastolic* pressur*".ab,ti. 15166
13 "arterial pressur*".ab,ti. 59784
14 "bloodpressur*".ab,ti. 44
15 exp Antihypertensive Agents/ 253357
16 "antihypertens*".ab,ti. 46742
17 "anti hypertens*".ab,ti. 4429
18 "spontan* hypertens*".ab,ti. 19559
19 exp Animals/ 22384927
20 humans.sh. 17795451
21 19 not 20 4589476
22 exp Ethics/ 141774
23 "ethics*".ti. 25698
24 "ethical*".ti. 24777
25 "sociological* aspect*".ti. 160
26 "social* aspect*".ti. 1349
27 exp Socioeconomic Factors/ 427913
28 "patient* experience*".ti. 3632
29 "patient* attitude*".ti. 840
30 exp Physician-Patient Relations/ 70030
31 exp Practice Patterns, Physicians'/ 55414
32 exp Health Communication/ 1831
33 "physician* patient* communication*".ab,ti. 835
34 "doctor* patient* communication*".ab,ti. 1030
35 exp Health Services Accessibility/ 104801
36 22 or 23 or 24 or 25 or 26 or 27 or 28 or 29 or 30 or 31 or 32 or 33 or 34 or 35 767843
37 exp Angiotensin II Type 1 Receptor Blockers/ 17288
38 "sartan*".ab,ti. 294
39 "Azilsartan*".ab,ti. 179
40 "Candesartan*".ab,ti. 2572
41 "Irbesartan*".ab,ti. 1596
42 "Losartan*".ab,ti. 8306
43 "Telmisartan*".ab,ti. 2085
44 "Valsartan*".ab,ti. 3300
45 "olmesartan*".af. 1552
46 exp Olmesartan Medoxomil/ 408
47 37 or 38 or 39 or 40 or 41 or 42 or 43 or 44 or 45 or 46 23666
48 1 or 2 or 3 or 4 or 5 or 6 or 7 or 8 or 9 or 10 or 11 or 12 or 13 or 14 or 15 or 16 or 17 or 18
929976
49 47 and 48 18576
50 limit 49 to (english or german) 17361
51 50 not 21 10640
52 36 and 51 100
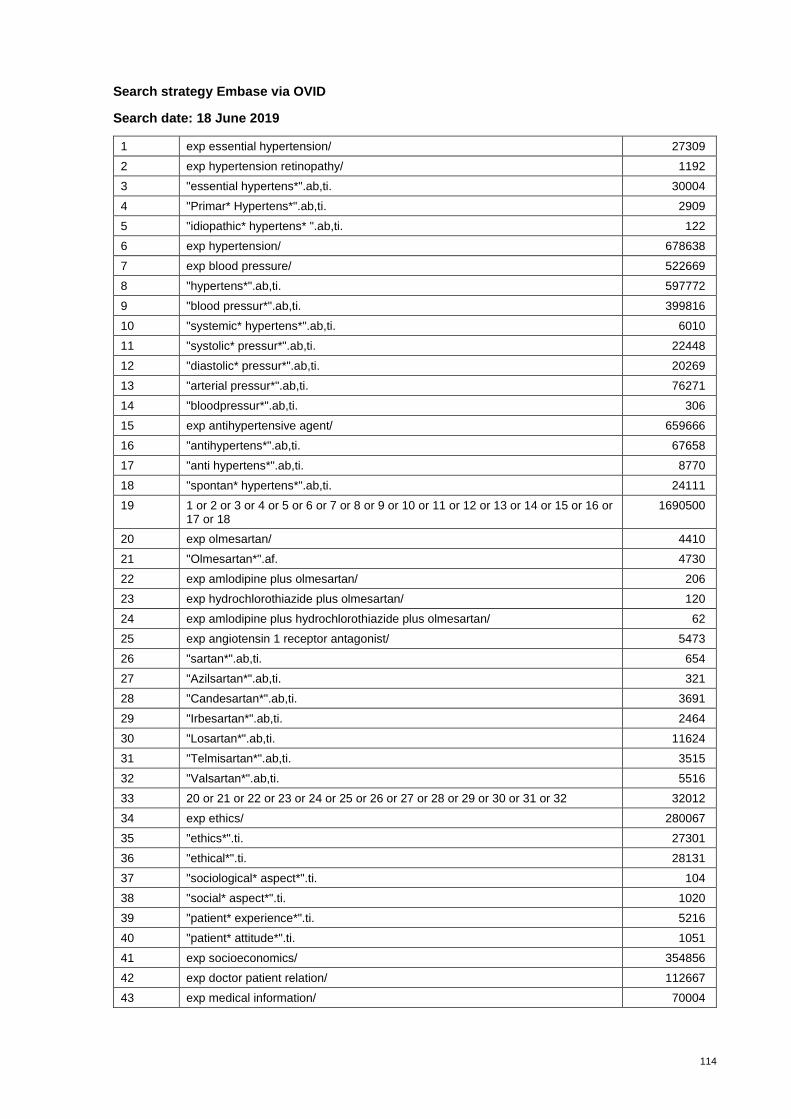
114
Search strategy Embase via OVID
Search date: 18 June 2019
1 exp essential hypertension/ 27309
2 exp hypertension retinopathy/ 1192
3 "essential hypertens*".ab,ti. 30004
4 "Primar* Hypertens*".ab,ti. 2909
5 "idiopathic* hypertens* ".ab,ti. 122
6 exp hypertension/ 678638
7 exp blood pressure/ 522669
8 "hypertens*".ab,ti. 597772
9 "blood pressur*".ab,ti. 399816
10 "systemic* hypertens*".ab,ti. 6010
11 "systolic* pressur*".ab,ti. 22448
12 "diastolic* pressur*".ab,ti. 20269
13 "arterial pressur*".ab,ti. 76271
14 "bloodpressur*".ab,ti. 306
15 exp antihypertensive agent/ 659666
16 "antihypertens*".ab,ti. 67658
17 "anti hypertens*".ab,ti. 8770
18 "spontan* hypertens*".ab,ti. 24111
19 1 or 2 or 3 or 4 or 5 or 6 or 7 or 8 or 9 or 10 or 11 or 12 or 13 or 14 or 15 or 16 or 17 or 18
1690500
20 exp olmesartan/ 4410
21 "Olmesartan*".af. 4730
22 exp amlodipine plus olmesartan/ 206
23 exp hydrochlorothiazide plus olmesartan/ 120
24 exp amlodipine plus hydrochlorothiazide plus olmesartan/ 62
25 exp angiotensin 1 receptor antagonist/ 5473
26 "sartan*".ab,ti. 654
27 "Azilsartan*".ab,ti. 321
28 "Candesartan*".ab,ti. 3691
29 "Irbesartan*".ab,ti. 2464
30 "Losartan*".ab,ti. 11624
31 "Telmisartan*".ab,ti. 3515
32 "Valsartan*".ab,ti. 5516
33 20 or 21 or 22 or 23 or 24 or 25 or 26 or 27 or 28 or 29 or 30 or 31 or 32 32012
34 exp ethics/ 280067
35 "ethics*".ti. 27301
36 "ethical*".ti. 28131
37 "sociological* aspect*".ti. 104
38 "social* aspect*".ti. 1020
39 "patient* experience*".ti. 5216
40 "patient* attitude*".ti. 1051
41 exp socioeconomics/ 354856
42 exp doctor patient relation/ 112667
43 exp medical information/ 70004
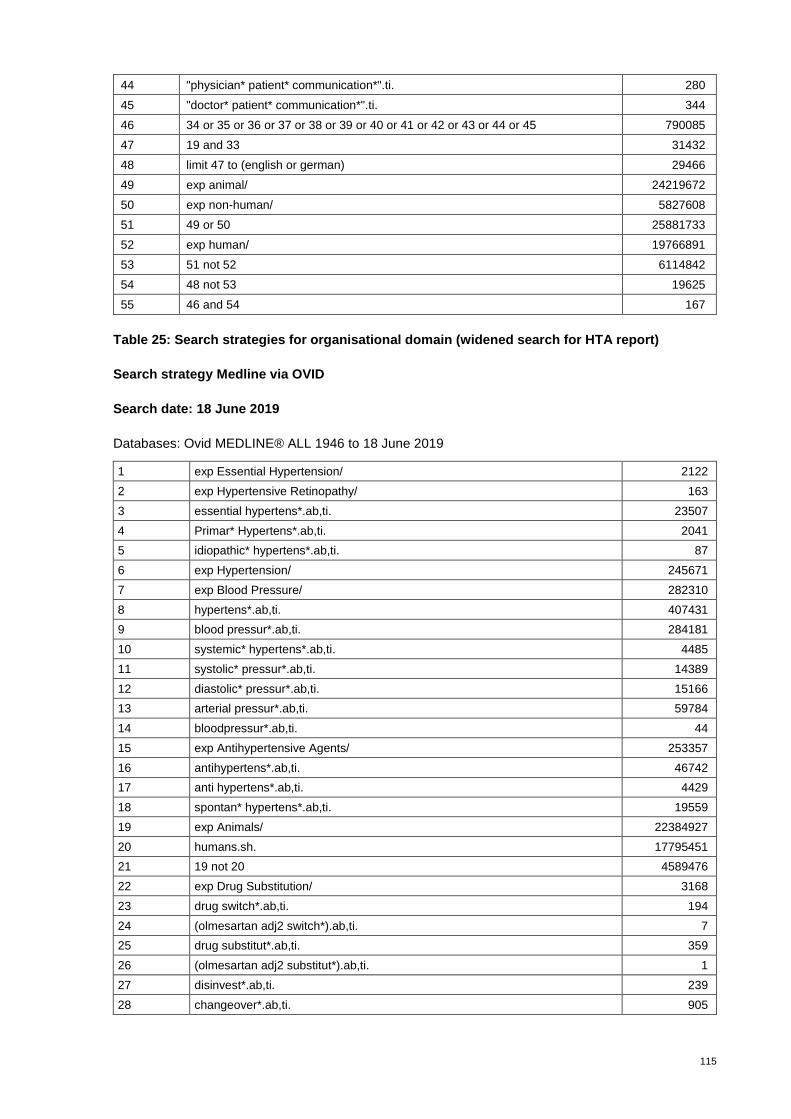
115
44 "physician* patient* communication*".ti. 280
45 "doctor* patient* communication*".ti. 344
46 34 or 35 or 36 or 37 or 38 or 39 or 40 or 41 or 42 or 43 or 44 or 45 790085
47 19 and 33 31432
48 limit 47 to (english or german) 29466
49 exp animal/ 24219672
50 exp non-human/ 5827608
51 49 or 50 25881733
52 exp human/ 19766891
53 51 not 52 6114842
54 48 not 53 19625
55 46 and 54 167
Table 25: Search strategies for organisational domain (widened search for HTA report)
Search strategy Medline via OVID
Search date: 18 June 2019
Databases: Ovid MEDLINE® ALL 1946 to 18 June 2019
1 exp Essential Hypertension/ 2122
2 exp Hypertensive Retinopathy/ 163
3 essential hypertens*.ab,ti. 23507
4 Primar* Hypertens*.ab,ti. 2041
5 idiopathic* hypertens*.ab,ti. 87
6 exp Hypertension/ 245671
7 exp Blood Pressure/ 282310
8 hypertens*.ab,ti. 407431
9 blood pressur*.ab,ti. 284181
10 systemic* hypertens*.ab,ti. 4485
11 systolic* pressur*.ab,ti. 14389
12 diastolic* pressur*.ab,ti. 15166
13 arterial pressur*.ab,ti. 59784
14 bloodpressur*.ab,ti. 44
15 exp Antihypertensive Agents/ 253357
16 antihypertens*.ab,ti. 46742
17 anti hypertens*.ab,ti. 4429
18 spontan* hypertens*.ab,ti. 19559
19 exp Animals/ 22384927
20 humans.sh. 17795451
21 19 not 20 4589476
22 exp Drug Substitution/ 3168
23 drug switch*.ab,ti. 194
24 (olmesartan adj2 switch*).ab,ti. 7
25 drug substitut*.ab,ti. 359
26 (olmesartan adj2 substitut*).ab,ti. 1
27 disinvest*.ab,ti. 239
28 changeover*.ab,ti. 905
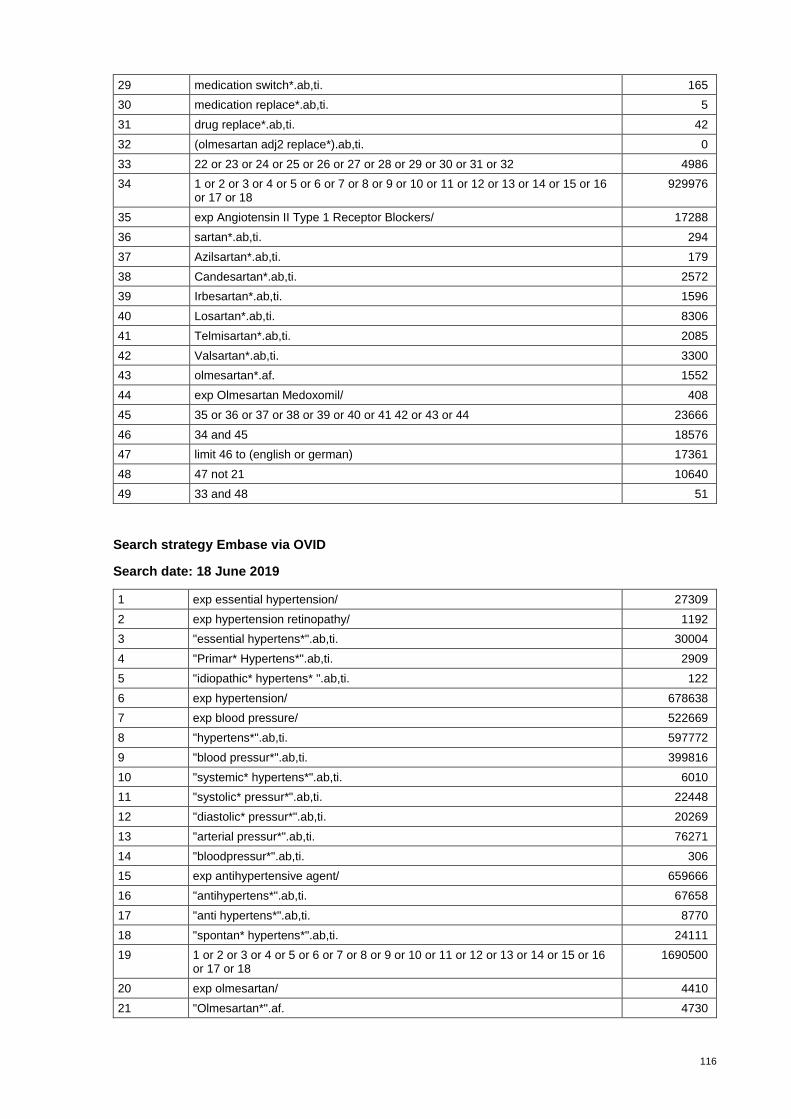
116
29 medication switch*.ab,ti. 165
30 medication replace*.ab,ti. 5
31 drug replace*.ab,ti. 42
32 (olmesartan adj2 replace*).ab,ti. 0
33 22 or 23 or 24 or 25 or 26 or 27 or 28 or 29 or 30 or 31 or 32 4986
34 1 or 2 or 3 or 4 or 5 or 6 or 7 or 8 or 9 or 10 or 11 or 12 or 13 or 14 or 15 or 16 or 17 or 18
929976
35 exp Angiotensin II Type 1 Receptor Blockers/ 17288
36 sartan*.ab,ti. 294
37 Azilsartan*.ab,ti. 179
38 Candesartan*.ab,ti. 2572
39 Irbesartan*.ab,ti. 1596
40 Losartan*.ab,ti. 8306
41 Telmisartan*.ab,ti. 2085
42 Valsartan*.ab,ti. 3300
43 olmesartan*.af. 1552
44 exp Olmesartan Medoxomil/ 408
45 35 or 36 or 37 or 38 or 39 or 40 or 41 42 or 43 or 44 23666
46 34 and 45 18576
47 limit 46 to (english or german) 17361
48 47 not 21 10640
49 33 and 48 51
Search strategy Embase via OVID
Search date: 18 June 2019
1 exp essential hypertension/ 27309
2 exp hypertension retinopathy/ 1192
3 "essential hypertens*".ab,ti. 30004
4 "Primar* Hypertens*".ab,ti. 2909
5 "idiopathic* hypertens* ".ab,ti. 122
6 exp hypertension/ 678638
7 exp blood pressure/ 522669
8 "hypertens*".ab,ti. 597772
9 "blood pressur*".ab,ti. 399816
10 "systemic* hypertens*".ab,ti. 6010
11 "systolic* pressur*".ab,ti. 22448
12 "diastolic* pressur*".ab,ti. 20269
13 "arterial pressur*".ab,ti. 76271
14 "bloodpressur*".ab,ti. 306
15 exp antihypertensive agent/ 659666
16 "antihypertens*".ab,ti. 67658
17 "anti hypertens*".ab,ti. 8770
18 "spontan* hypertens*".ab,ti. 24111
19 1 or 2 or 3 or 4 or 5 or 6 or 7 or 8 or 9 or 10 or 11 or 12 or 13 or 14 or 15 or 16 or 17 or 18
1690500
20 exp olmesartan/ 4410
21 "Olmesartan*".af. 4730
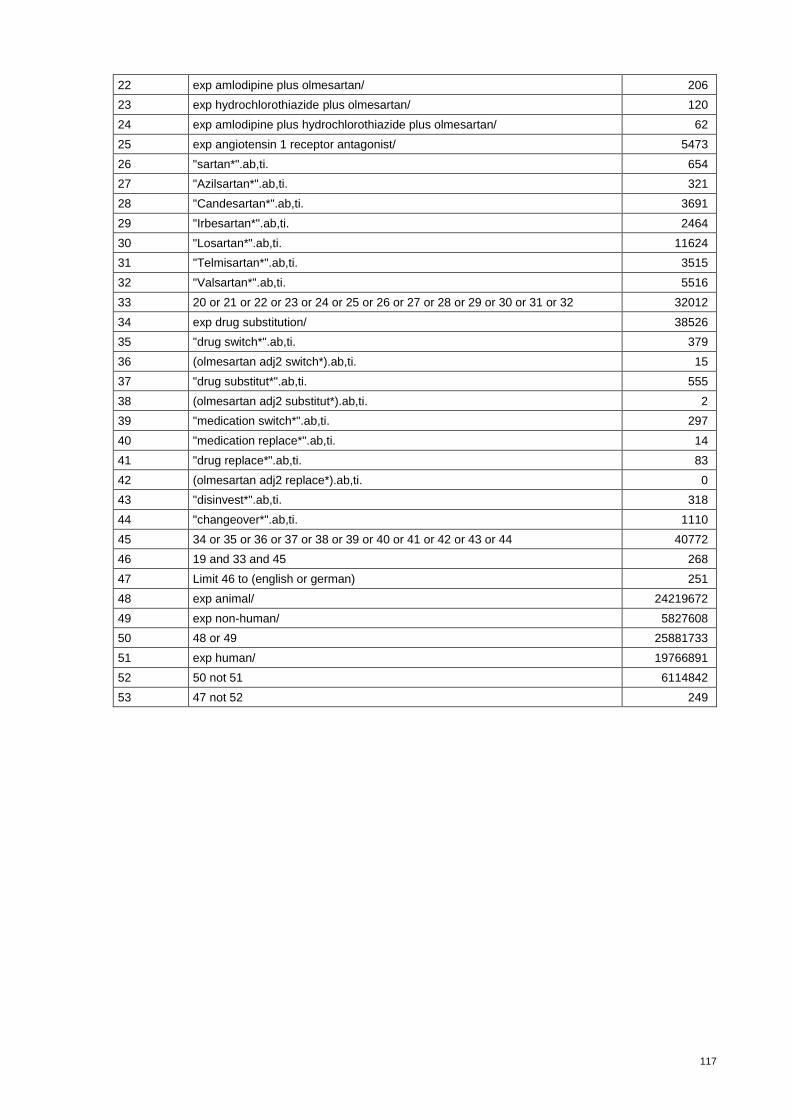
117
22 exp amlodipine plus olmesartan/ 206
23 exp hydrochlorothiazide plus olmesartan/ 120
24 exp amlodipine plus hydrochlorothiazide plus olmesartan/ 62
25 exp angiotensin 1 receptor antagonist/ 5473
26 "sartan*".ab,ti. 654
27 "Azilsartan*".ab,ti. 321
28 "Candesartan*".ab,ti. 3691
29 "Irbesartan*".ab,ti. 2464
30 "Losartan*".ab,ti. 11624
31 "Telmisartan*".ab,ti. 3515
32 "Valsartan*".ab,ti. 5516
33 20 or 21 or 22 or 23 or 24 or 25 or 26 or 27 or 28 or 29 or 30 or 31 or 32 32012
34 exp drug substitution/ 38526
35 "drug switch*".ab,ti. 379
36 (olmesartan adj2 switch*).ab,ti. 15
37 "drug substitut*".ab,ti. 555
38 (olmesartan adj2 substitut*).ab,ti. 2
39 "medication switch*".ab,ti. 297
40 "medication replace*".ab,ti. 14
41 "drug replace*".ab,ti. 83
42 (olmesartan adj2 replace*).ab,ti. 0
43 "disinvest*".ab,ti. 318
44 "changeover*".ab,ti. 1110
45 34 or 35 or 36 or 37 or 38 or 39 or 40 or 41 or 42 or 43 or 44 40772
46 19 and 33 and 45 268
47 Limit 46 to (english or german) 251
48 exp animal/ 24219672
49 exp non-human/ 5827608
50 48 or 49 25881733
51 exp human/ 19766891
52 50 not 51 6114842
53 47 not 52 249

118
Table 26: Selection criteria for EFF, SAF and ECO
I 1 Patients (≥18 years) with essential (primary) arterial hypertension that requires antihyper-tensive pharmacotherapy
The study focus is essential hypertension.However study populations with existing co-mor-bidities were not excluded from the analyses when the primary target of the study was the treatment of essential hypertension.
I 2 Intervention: olmesartan monotherapy, olmesartan combination therapy with thiazide diuret-ics, olmesartan combination therapy with calcium channel blockers or olmesartan combina-tion therapy with thiazide diuretics and calcium channel blockers
I 3 a Control: domain efficacy: all other sartans as monotherapy, all other sartans in combination with thiazide diuretics, all other sartans in combination with calcium channel blockers, all other sartans in combination with thiazide diuretics and calcium channel blockers
I 3 b Control: domain safety for comparative safety assessment same as I 3 a, no control for sin-gle-arm studies
I 4 Including one or more of the critical or important outcomes as formulated in PICO
I 5 Study design domain efficacy/effectiveness: randomised controlled trials (direct compari-sons), follow-up at least 2 months
I 5 a Study design domain efficacy/effectiveness: for long-term outcomes (morbidity, mortality) non-randomised controlled trials and observational studies: prospective cohort studies, ret-rospective cohort studies
I 6 Study design for domain safety: randomised controlled trial (direct comparisons)
I 6 a Study design for domain safety: non-randomised controlled trials, observational studies: prospective cohort studies, retrospective cohort studies, case-control studies, uncontrolled longitudinal studies (single-arm studies for prevalence of adverse events)
I 7 Study design for domain costs/cost effectiveness: cost-effectiveness analysis (CEA), cost-utility analysis (CUA), cost-minimisation analysis (CMA), cost-consequence analysis (CCA), cost-benefit analysis (CBA), budget-impact analysis, economic models
I 8 Geographical aspects for domain economic evaluation: Switzerland and high-income econ-omies as defined by the World Bank
I 9 Formal aspects: language (English, German), Search period: no restriction
I 10 Full publication available
I 11 Duration of treatment: a minimum of 8 weeks for the efficacy domain (according to drug in-formation: “The antihypertensive effect of olmesartan medoxomil occurs essentially within 2 weeks after the start of treatment and reaches its maximum approximately 8 weeks after the start of therapy” and more than 8 weeks for the safety domain
I 12 Study design/questions allows safety assessment
I = inclusion criteria with number

119
Table 27: Documentation of queries
Study/do-main
Content of query Reply re-ceived yes/no
Content of reply
Regulatory status/Organisational domain
- Inquiry Main Association of Austrian Social Security Institutions about experiences with withdrawal of OLM from reimbursement as of 1 January 2019
Yes - Massive decline in prescriptions for all preparations containing the active ingredient OLM from 1st quarter 2019 compared with 4th quarter 2018
- No statement possible on the exact figures within sartans
- Inquiries from patients (10 inquiries at Main Association of Austrian Social Security Institutions) regarding the reasons for delisting and possible alternatives
- Complaint by the manufacturing company to the Federal Administrative Court dismissed
Regulatory status/Organisational domain
- Inquiry Assurance Maladie/France 19 June 2019 about consequences in France regarding deleting OLM from reimbursement and if there were any organisational issues
No -
Regulatory status/Organisational domain
- Inquiry Haute Autorité de Santé/France 17 July 2019 about consequences in France regarding deleting OLM from reimbursement and if there were any organisational issues; 2nd inquiry 27 July 2019
No -
Regulatory status
- Inquiry TLV (The Dental and Pharmaceutical Benefits Agency) 19 June 2019 regarding market availability of olmesartan in Sweden
Yes - OLM was available between 2014 and 2019 – however only from time to time in very limited quantities (about 10 to 50 packs per year)
Budget impact
- Inquiry physician(s) experiences in Austria regarding delisting OLM, prescription behaviour
Yes - Substitution of mono- with mono-preparations and combi- with combi-preparations within sartans, no switching to ACE preparations; mainly substitution within mono-preparations to the Austrian market leader CAN followed by VAL and to a lesser extent to LOS and TEL. Combination preparations: VAL and HCTZ and CCBs (50%), 20% to CAN and HCTZ and 30% to VAL and HCTZ (these are also the market leaders in Austria).
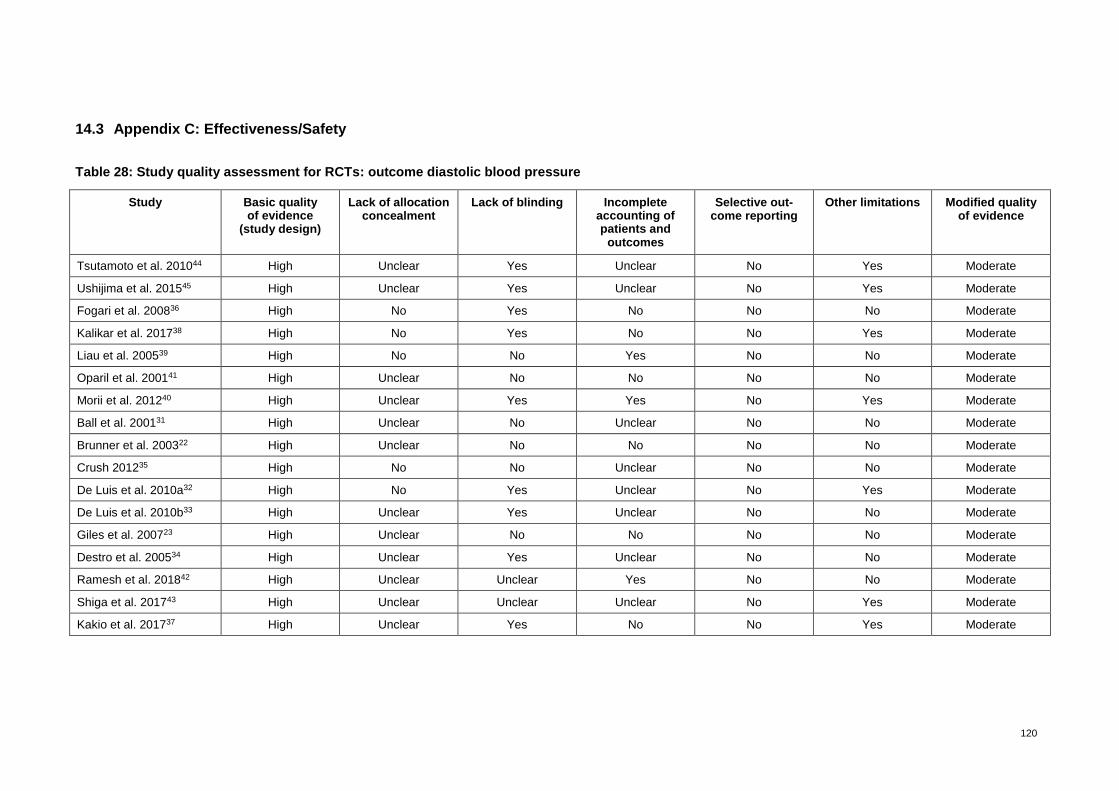
120
14.3 Appendix C: Effectiveness/Safety
Table 28: Study quality assessment for RCTs: outcome diastolic blood pressure
Study Basic quality of evidence
(study design)
Lack of allocation concealment
Lack of blinding Incomplete accounting of patients and
outcomes
Selective out-come reporting
Other limitations Modified quality of evidence
Tsutamoto et al. 201044 High Unclear Yes Unclear No Yes Moderate
Ushijima et al. 201545 High Unclear Yes Unclear No Yes Moderate
Fogari et al. 200836 High No Yes No No No Moderate
Kalikar et al. 201738 High No Yes No No Yes Moderate
Liau et al. 200539 High No No Yes No No Moderate
Oparil et al. 200141 High Unclear No No No No Moderate
Morii et al. 201240 High Unclear Yes Yes No Yes Moderate
Ball et al. 200131 High Unclear No Unclear No No Moderate
Brunner et al. 200322 High Unclear No No No No Moderate
Crush 201235 High No No Unclear No No Moderate
De Luis et al. 2010a32 High No Yes Unclear No Yes Moderate
De Luis et al. 2010b33 High Unclear Yes Unclear No No Moderate
Giles et al. 200723 High Unclear No No No No Moderate
Destro et al. 200534 High Unclear Yes Unclear No No Moderate
Ramesh et al. 201842 High Unclear Unclear Yes No No Moderate
Shiga et al. 201743 High Unclear Unclear Unclear No Yes Moderate
Kakio et al. 201737 High Unclear Yes No No Yes Moderate
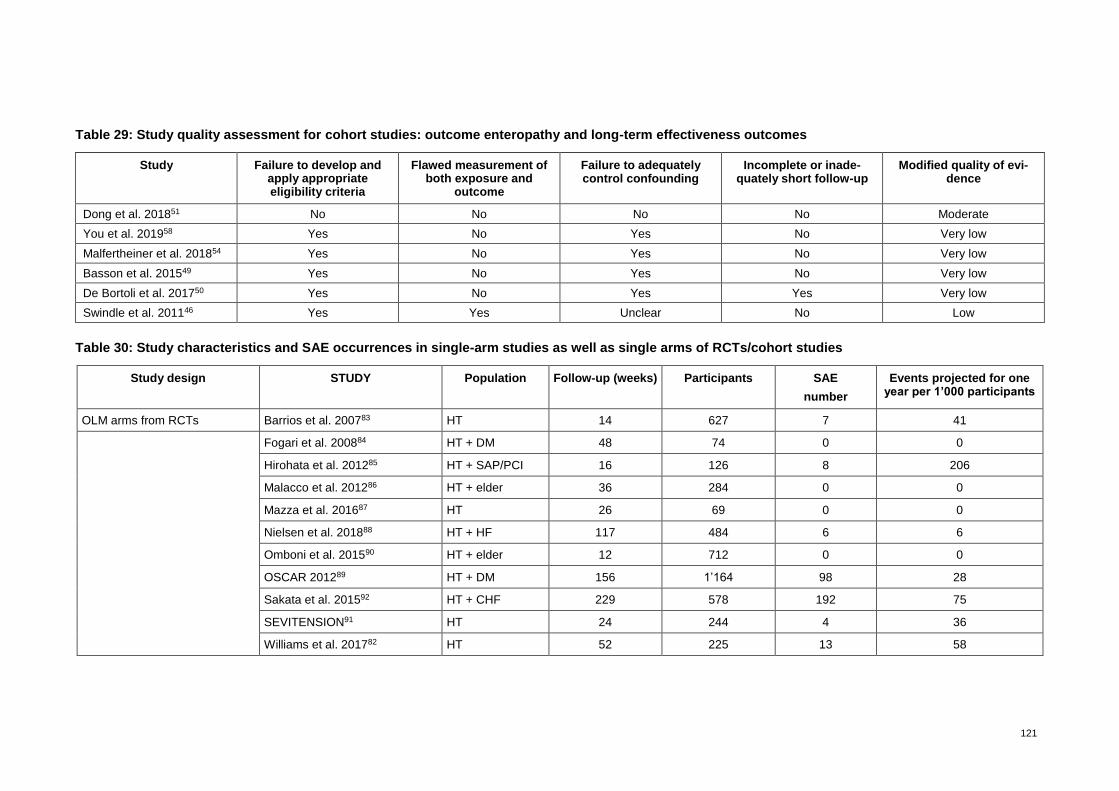
121
Table 29: Study quality assessment for cohort studies: outcome enteropathy and long-term effectiveness outcomes
Study Failure to develop and apply appropriate eligibility criteria
Flawed measurement of both exposure and
outcome
Failure to adequately control confounding
Incomplete or inade-quately short follow-up
Modified quality of evi-dence
Dong et al. 201851 No No No No Moderate
You et al. 201958 Yes No Yes No Very low
Malfertheiner et al. 201854 Yes No Yes No Very low
Basson et al. 201549 Yes No Yes No Very low
De Bortoli et al. 201750 Yes No Yes Yes Very low
Swindle et al. 201146 Yes Yes Unclear No Low
Table 30: Study characteristics and SAE occurrences in single-arm studies as well as single arms of RCTs/cohort studies
Study design STUDY Population Follow-up (weeks) Participants SAE
number
Events projected for one year per 1’000 participants
OLM arms from RCTs Barrios et al. 200783 HT 14 627 7 41
Fogari et al. 200884 HT + DM 48 74 0 0
Hirohata et al. 201285 HT + SAP/PCI 16 126 8 206
Malacco et al. 201286 HT + elder 36 284 0 0
Mazza et al. 201687 HT 26 69 0 0
Nielsen et al. 201888 HT + HF 117 484 6 6
Omboni et al. 201590 HT + elder 12 712 0 0
OSCAR 201289 HT + DM 156 1’164 98 28
Sakata et al. 201592 HT + CHF 229 578 192 75
SEVITENSION91 HT 24 244 4 36
Williams et al. 201782 HT 52 225 13 58

122
Study design STUDY Population Follow-up (weeks) Participants SAE
number
Events projected for one year per 1’000 participants
OLM arms from cohort studies
Angeloni et al. 201593 HT + elder 26 142 0 0
Bramlage et al. 201194 HT 14 8’241 3 1
Kawai et al. 201195 HT 24 68 0 0
OMEGA 201299 HT + DM 156 14’721 281 6
Saito et al. 200896 HT 26 554 0 0
Saito et al. 201297 HT 12 1’246 0 0
Scholze et al. 201498 HT + CKD 52 7’724 45 6
Toh et al. 2012100 HT 52 92’973 1 0
Single-arm studies with OLM Bramlage et al. 201461 HT 24 10’995 24 5
Bramlage et al. 201560 HT 24 5’831 5 2
Buendia et al. 201762 HT 12 428 0 0
CRUSH 201274 HT 12 999 12 52
Dohi et al. 201163 HT 12 25 0 0
Germino et al. 201264 HT 12 178 0 0
Gomes et al. 200865 HT + elder 9 144 0 0
Heagerty et al. 200966 HT 53 1’621 40 24
HONEST 201875 HT + elder 104 21’591 123 3
Izzo et al. 2007a67 HT + elder 17 170 8 141
Izzo et al. 2007b68 HT stage II 13 250 1 16
Jung et al. 201569 HT stage II 12 385 4 45
Kereiakes et al. 201070 HT 12 192 0 0
Neutel et al. 200672 HT 24 86 5 126
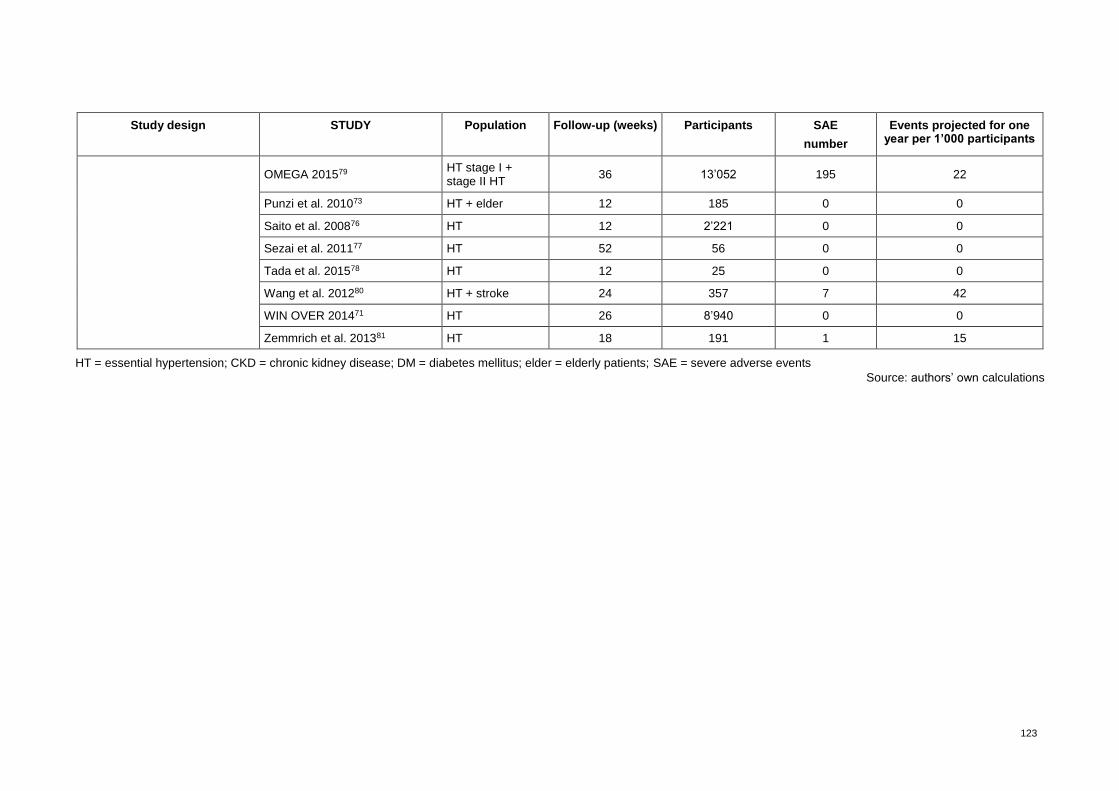
123
Study design STUDY Population Follow-up (weeks) Participants SAE
number
Events projected for one year per 1’000 participants
OMEGA 201579 HT stage I + stage II HT
36 13’052 195 22
Punzi et al. 201073 HT + elder 12 185 0 0
Saito et al. 200876 HT 12 2’221 0 0
Sezai et al. 201177 HT 52 56 0 0
Tada et al. 201578 HT 12 25 0 0
Wang et al. 201280 HT + stroke 24 357 7 42
WIN OVER 201471 HT 26 8’940 0 0
Zemmrich et al. 201381 HT 18 191 1 15
HT = essential hypertension; CKD = chronic kidney disease; DM = diabetes mellitus; elder = elderly patients; SAE = severe adverse events
Source: authors’ own calculations
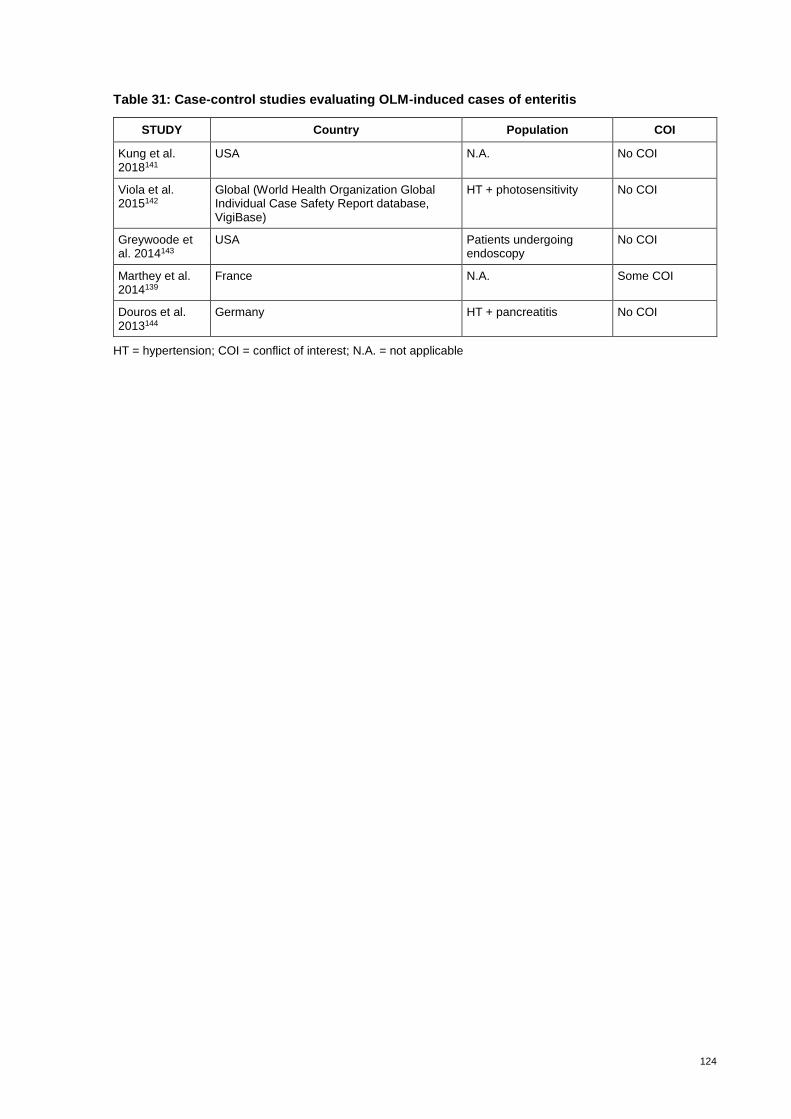
124
Table 31: Case-control studies evaluating OLM-induced cases of enteritis
STUDY Country Population COI
Kung et al. 2018141
USA N.A. No COI
Viola et al. 2015142
Global (World Health Organization Global Individual Case Safety Report database, VigiBase)
HT + photosensitivity No COI
Greywoode et al. 2014143
USA Patients undergoing endoscopy
No COI
Marthey et al. 2014139
France N.A. Some COI
Douros et al. 2013144
Germany HT + pancreatitis No COI
HT = hypertension; COI = conflict of interest; N.A. = not applicable
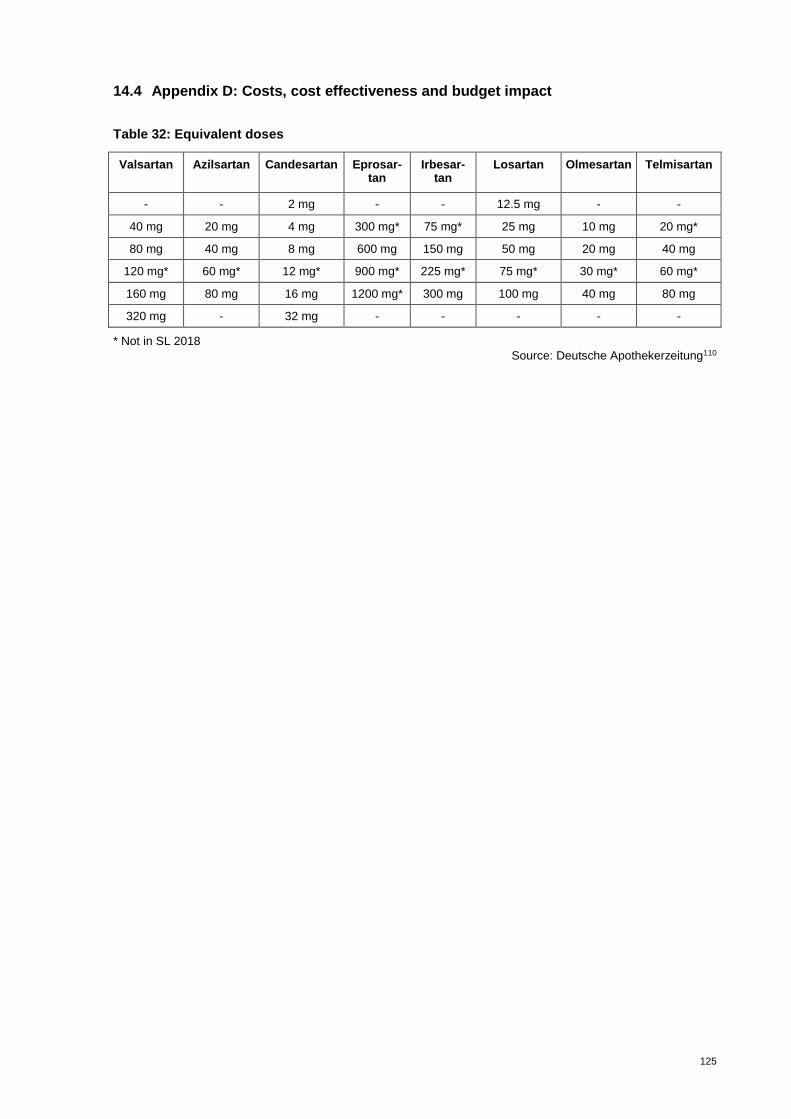
125
14.4 Appendix D: Costs, cost effectiveness and budget impact
Table 32: Equivalent doses
Valsartan Azilsartan Candesartan Eprosar-tan
Irbesar-tan
Losartan Olmesartan Telmisartan
- - 2 mg - - 12.5 mg - -
40 mg 20 mg 4 mg 300 mg* 75 mg* 25 mg 10 mg 20 mg*
80 mg 40 mg 8 mg 600 mg 150 mg 50 mg 20 mg 40 mg
120 mg* 60 mg* 12 mg* 900 mg* 225 mg* 75 mg* 30 mg* 60 mg*
160 mg 80 mg 16 mg 1200 mg* 300 mg 100 mg 40 mg 80 mg
320 mg - 32 mg - - - - -
* Not in SL 2018
Source: Deutsche Apothekerzeitung110

126
Table 33: Evidence table domain ECO (systematic literature search)
Study/country Study design Population Interven-tion
Compara-tor
Main outcomes Statistical validation
Sponsor Source clinical /cost data
Perspec-tive
Belsey 2011,116 UK
Probalistic cost-benefit simulation (Monte-Carlo) linked to blood pressure targets
Budget impact
Parent cohort patients (number not reported) with normally distributed BPs about mean values of 170 mmHg and 105 mmHg
No subclasses for age, sex or co-morbidity
OLM
CAN Lowering BP
Mean treatment cost per patient/year (2010)
Systolic target 150 mmHg:
OLM/CAN: ‘ GBD 171.36 vs. 189.91
Systolic target 140 mmHg: OLM/CAN GBD 304.50 vs. 441.96
Diastolic target 90 mmHg:
OLM/CAN GBD 156.11 vs. 189.13 OLM = cost saving
No Daiichi-Sankyo UK
Clinical trial data – indirect comparison:
Karlson et al. 2009; Chrysant et al. 2008, Oparil et al. 2010
Drug Tariff and British National Formulary
Payer: National Health Service
Boersma et al. 2010,112 NL
Cost-effectiveness simulation model,
Extrapolation 1 and 5 years BP control: <140/90 mmHg
Hypothetical cohort with essential hypertension combined with daily-practice prescription data
No subclasses analysed
OLM
LOS
VAL
IRB
Net costs/cardiovascular complication averted for cohort of 100’000 compared with do-nothing (2006), after 1 year:
OLM: EUR 39’100
LOS: EUR 77’100
VAL: EUR 70’700
IRB: EUR 50’900
OLM = cost saving
No Daiichi-Sankyo NL
Clinical trial data:
Oparil et al. 2001
Dutch drug prices
Payer

127
Study/country Study design Population Interven-tion
Compara-tor
Main outcomes Statistical validation
Sponsor Source clinical /cost data
Perspec-tive
Miller et al. 2010,114 USA
Cost-effectiveness model (decision analytic model) based on medical chart data
Cohort of 121 472 patients -> 1600 randomly selected with >140/90 mmHg for uncomplicated hypertension and >130/80 mmHg for patients with diabetes;
Average age 57.1 years
53.5% females
OLM
Mono- and with HCTZ
LOS
VAL
IRB
Mono- and with HCTZ
Cost per patient reaching BP goal (2006): all causes/ (hypertension attributable):
OLM: USD 8’964(2’704)
LOS: USD 10’484(3’291)
VAL: USD 10’557(3’577)
IRB: USD 13’335(4’325)
OLM = cost saving
Yes Daiichi-Sankyo, USA
Medical chart data
Administrative claims cost data
Payer
Mazza et al. 2017,113 I
“Cost-benefit analysis” stated by author, however no values cost/benefit/effectiveness shown
Retrospective cross-sectional study
114 patients (>18 years) with essential hyper-tension – target: <140 mmHg Excluded: severe hypertension >180/110 mmHg and cardiovascular events, severe obesity, dementia
OLM Mono- and with HCTZ
CAN IRB LOS TEL
VAL
Mono- and with HCTZ
BP lowering
Drug acquisition cost per day/cost per year, no combination with “effects”
Authors’ conclusion: “treatment of BP with candesartan appears to be the most favourable option in terms of cost effectiveness”
Data and conclusions partly contradictory and not comprehensible
No N/R Retrospective cross-sectional study
Pharmacy dispensing records
N/R
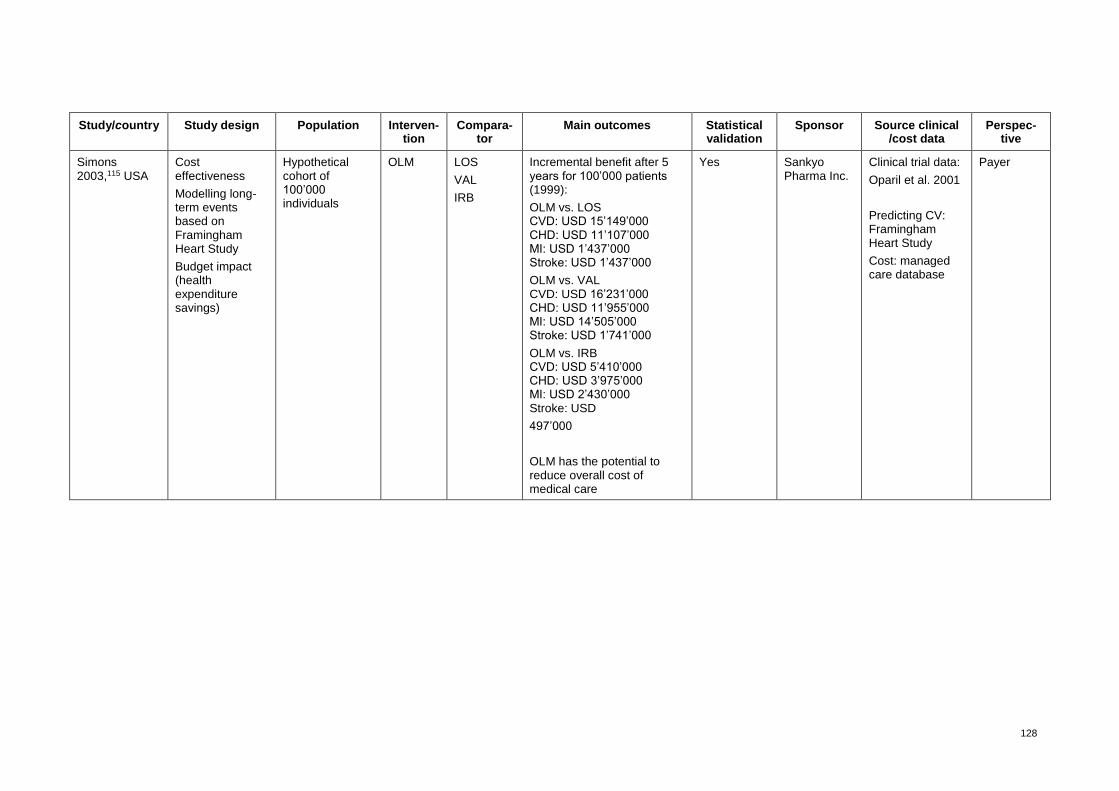
128
Study/country Study design Population Interven-tion
Compara-tor
Main outcomes Statistical validation
Sponsor Source clinical /cost data
Perspec-tive
Simons 2003,115 USA
Cost effectiveness
Modelling long-term events based on Framingham Heart Study
Budget impact (health expenditure savings)
Hypothetical cohort of 100’000 individuals
OLM
LOS
VAL
IRB
Incremental benefit after 5 years for 100’000 patients (1999):
OLM vs. LOS CVD: USD 15’149’000 CHD: USD 11’107’000 MI: USD 1’437’000 Stroke: USD 1’437’000
OLM vs. VAL CVD: USD 16’231’000 CHD: USD 11’955’000 MI: USD 14’505’000 Stroke: USD 1’741’000
OLM vs. IRB CVD: USD 5’410’000 CHD: USD 3’975’000 MI: USD 2’430’000 Stroke: USD
497’000
OLM has the potential to reduce overall cost of medical care
Yes Sankyo Pharma Inc.
Clinical trial data:
Oparil et al. 2001
Predicting CV: Framingham Heart Study
Cost: managed care database
Payer
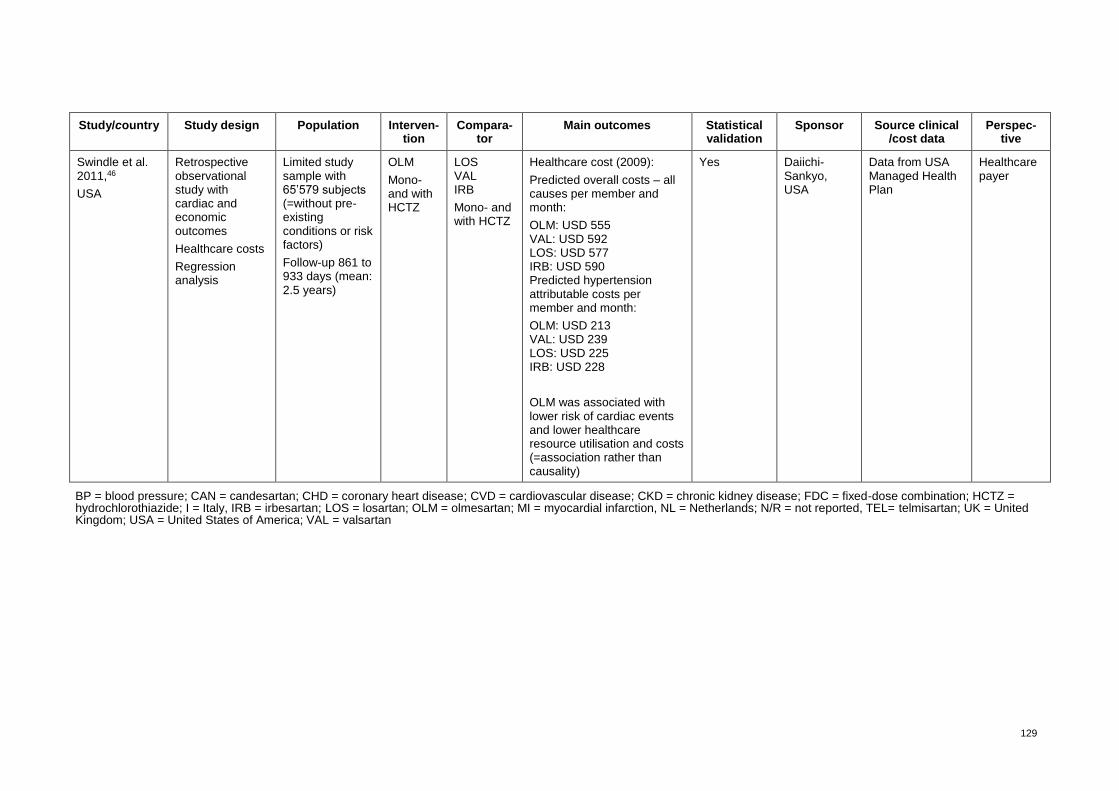
129
Study/country Study design Population Interven-tion
Compara-tor
Main outcomes Statistical validation
Sponsor Source clinical /cost data
Perspec-tive
Swindle et al. 2011,46
USA
Retrospective observational study with cardiac and economic outcomes
Healthcare costs
Regression analysis
Limited study sample with 65’579 subjects (=without pre-existing conditions or risk factors)
Follow-up 861 to 933 days (mean: 2.5 years)
OLM
Mono- and with HCTZ
LOS VAL IRB
Mono- and with HCTZ
Healthcare cost (2009):
Predicted overall costs – all causes per member and month:
OLM: USD 555 VAL: USD 592 LOS: USD 577 IRB: USD 590 Predicted hypertension attributable costs per member and month:
OLM: USD 213 VAL: USD 239 LOS: USD 225 IRB: USD 228
OLM was associated with lower risk of cardiac events and lower healthcare resource utilisation and costs (=association rather than causality)
Yes Daiichi-Sankyo, USA
Data from USA Managed Health Plan
Healthcare payer
BP = blood pressure; CAN = candesartan; CHD = coronary heart disease; CVD = cardiovascular disease; CKD = chronic kidney disease; FDC = fixed-dose combination; HCTZ = hydrochlorothiazide; I = Italy, IRB = irbesartan; LOS = losartan; OLM = olmesartan; MI = myocardial infarction, NL = Netherlands; N/R = not reported, TEL= telmisartan; UK = United Kingdom; USA = United States of America; VAL = valsartan
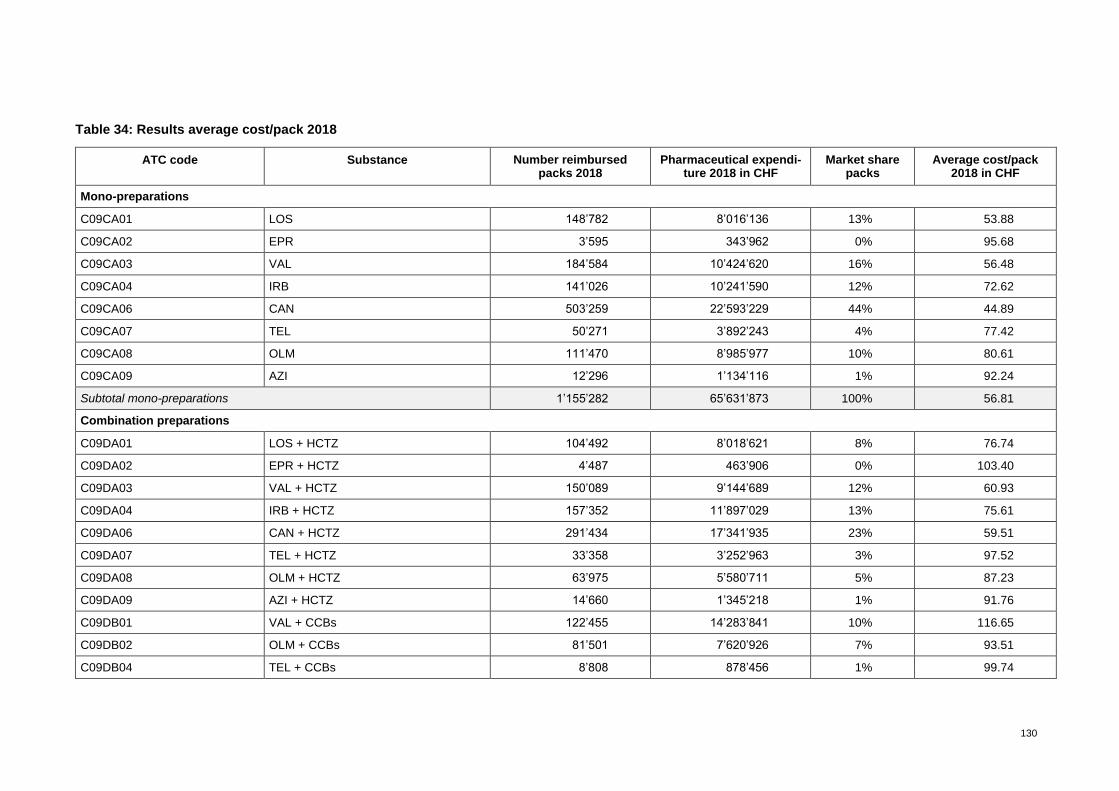
130
Table 34: Results average cost/pack 2018
ATC code Substance Number reimbursed packs 2018
Pharmaceutical expendi-ture 2018 in CHF
Market share packs
Average cost/pack 2018 in CHF
Mono-preparations
C09CA01 LOS 148’782 8’016’136 13% 53.88
C09CA02 EPR 3’595 343’962 0% 95.68
C09CA03 VAL 184’584 10’424’620 16% 56.48
C09CA04 IRB 141’026 10’241’590 12% 72.62
C09CA06 CAN 503’259 22’593’229 44% 44.89
C09CA07 TEL 50’271 3’892’243 4% 77.42
C09CA08 OLM 111’470 8’985’977 10% 80.61
C09CA09 AZI 12’296 1’134’116 1% 92.24
Subtotal mono-preparations 1’155’282 65’631’873 100% 56.81
Combination preparations
C09DA01 LOS + HCTZ 104’492 8’018’621 8% 76.74
C09DA02 EPR + HCTZ 4’487 463’906 0% 103.40
C09DA03 VAL + HCTZ 150’089 9’144’689 12% 60.93
C09DA04 IRB + HCTZ 157’352 11’897’029 13% 75.61
C09DA06 CAN + HCTZ 291’434 17’341’935 23% 59.51
C09DA07 TEL + HCTZ 33’358 3’252’963 3% 97.52
C09DA08 OLM + HCTZ 63’975 5’580’711 5% 87.23
C09DA09 AZI + HCTZ 14’660 1’345’218 1% 91.76
C09DB01 VAL + CCBs 122’455 14’283’841 10% 116.65
C09DB02 OLM + CCBs 81’501 7’620’926 7% 93.51
C09DB04 TEL + CCBs 8’808 878’456 1% 99.74

131
ATC code Substance Number reimbursed packs 2018
Pharmaceutical expendi-ture 2018 in CHF
Market share packs
Average cost/pack 2018 in CHF
C09DX01 VAL + HCTZ + CCBs 142’882 17’946’561 11% 125.60
C09DX03 OLM + HCTZ + CCBs 75’524 9’443’880 6% 125.04
Subtotal combination preparations 1’251’016 107’218’735 100% 85.71
Total mono- and combination preparations
2’406’298 172’850’608
71.83
ATC = anatomic therapeutic classification; AZI = azilsartan; CAN = candesartan; CCBs = calcium channel blocker; EPR = eprosartan; HCTZ = hydrochlorothiazide; IRB = irbesartan; LOS = losartan; OLM = olmesartan; TEL = telmisartan; VAL = valsartan
Sources: authors’ own calculations; data source: Tarifpool ©SASIS AG, data processing: ©COGE GmbH105
Table 35: Costs per event (in CHF 2018, per patient, per year)
Event
Costs per severity
Fatal Non-fatal Maintenance Total
Costs Probability Costs Probability
Myocardial infarction CHF 8'385 30% CHF 35'739 70% CHF 3'226 CHF 29'791
Stroke CHF 9'789 50% CHF 49'228 50% CHF 16'584 CHF 37'801
Heart failure CHF 8'499 70% CHF 33'778 30% CHF 11'744 CHF 19'606
Ischemic heart disease CHF 5'886 25% CHF 17'398 75% CHF 2'426 CHF 16'339
Cardiac event CHF 8'140 44% CHF 34'036 56% CHF 8'495 CHF 27'485
Source: authors’ own calculations based on Brändle et al.103

132
Table 36: Effects per pharmaceutical (part I)
Event
OLM VAL
Swindle et al. (2011)
Bootstrapped (based on Swindle 2011)
Swindle et al. (2011)
Bootstrapped (based on Swindle et al. 2011)
Probability Effect (Probability)
Probability Probability Incremental effect (OLM vs. VAL)
Average Minimum Maximum Average Minimum Maximum Average Minimum* Maximum**
Myocardial infarction 0.67% 0.60% 0.16% 1.55% 0.75% 0.68% 0.19% 1.67% 0.08% -0.98% 1.16%
Stroke 0.80% 0.73% 0.22% 1.74% 1.13% 1.05% 0.40% 2.21% 0.31% -0.87% 1.59%
Heart failure 1.74% 1.64% 0.77% 3.02% 2.71% 2.58% 1.43% 4.18% 0.91% -0.84% 2.77%
Ischemic heart disease 0.61% 0.54% 0.12% 1.46% 0.79% 0.72% 0.21% 1.73% 0.16% -0.86% 1.24%
Cardiac event 3.42% 3.25% 1.94% 5.02% 4.81% 4.54% 2.97% 6.55% 1.27% -1.09% 3.67%
OLM = Olmesartan; VAL = valsartan * 95% confidence interval lower bound (means a low effect for OLM) ** 95% confidence interval upper bound (means a high effect ****of OLM)
Sources: Swindle et al.46 and authors’ own bootstrapping results
Table 37: Effects per pharmaceutical (part II)
Event
LOS IRB
Swin-dle et
al. (2011)
Bootstrapped (based on Swindle et al. 2011)
Swindle et al. (2011)
Bootstrapped (based on Swindle et al. 2011)
Prob-ability
Effect (Probability) Incremental effect (OLM vs. LOS) Probability
Effect (Probability) Incremental effect (OLM vs. IRB)
Avg. Min Max Avg. Min* Max** Avg. Min Max Avg. Min* Max**
Myocardial infarction 0.79% 0.72% 0.21% 1.72% 0.11% -0.93% 1.21% 0.62% 0.55% 0.13% 1.46% -0.04% -1.07% 0.96%
Stroke 1.36% 1.28% 0.53% 2.52% 0.53% -0.70% 1.88% 1.27% 1.19% 0.48% 2.39% 0.45% -0.76% 1.78%
Heart failure 3.24% 3.08% 1.81% 4.80% 1.42% -0.41% 3.39% 2.92% 2.77% 1.59% 4.43% 1.11% -0.67% 3.01%
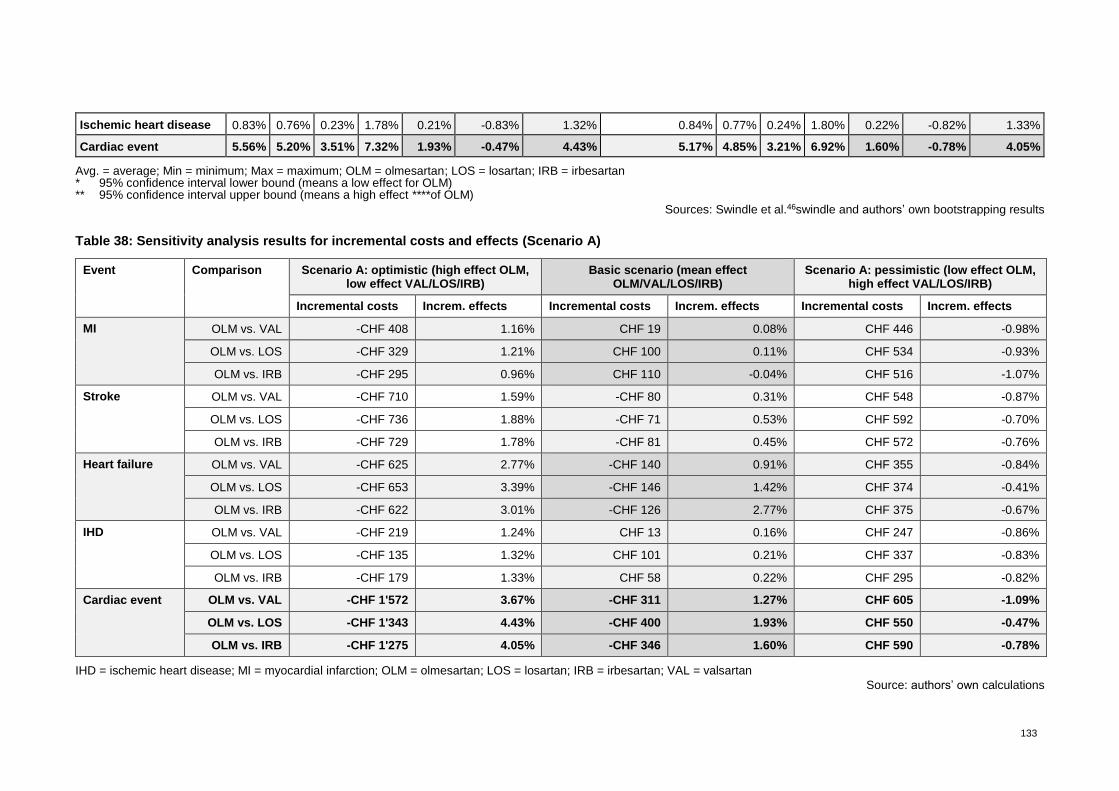
133
Ischemic heart disease 0.83% 0.76% 0.23% 1.78% 0.21% -0.83% 1.32% 0.84% 0.77% 0.24% 1.80% 0.22% -0.82% 1.33%
Cardiac event 5.56% 5.20% 3.51% 7.32% 1.93% -0.47% 4.43% 5.17% 4.85% 3.21% 6.92% 1.60% -0.78% 4.05%
Avg. = average; Min = minimum; Max = maximum; OLM = olmesartan; LOS = losartan; IRB = irbesartan * 95% confidence interval lower bound (means a low effect for OLM) ** 95% confidence interval upper bound (means a high effect ****of OLM)
Sources: Swindle et al.46swindle and authors’ own bootstrapping results
Table 38: Sensitivity analysis results for incremental costs and effects (Scenario A)
Event Comparison Scenario A: optimistic (high effect OLM, low effect VAL/LOS/IRB)
Basic scenario (mean effect OLM/VAL/LOS/IRB)
Scenario A: pessimistic (low effect OLM, high effect VAL/LOS/IRB)
Incremental costs Increm. effects Incremental costs Increm. effects Incremental costs Increm. effects
MI OLM vs. VAL -CHF 408 1.16% CHF 19 0.08% CHF 446 -0.98%
OLM vs. LOS -CHF 329 1.21% CHF 100 0.11% CHF 534 -0.93%
OLM vs. IRB -CHF 295 0.96% CHF 110 -0.04% CHF 516 -1.07%
Stroke OLM vs. VAL -CHF 710 1.59% -CHF 80 0.31% CHF 548 -0.87%
OLM vs. LOS -CHF 736 1.88% -CHF 71 0.53% CHF 592 -0.70%
OLM vs. IRB -CHF 729 1.78% -CHF 81 0.45% CHF 572 -0.76%
Heart failure OLM vs. VAL -CHF 625 2.77% -CHF 140 0.91% CHF 355 -0.84%
OLM vs. LOS -CHF 653 3.39% -CHF 146 1.42% CHF 374 -0.41%
OLM vs. IRB -CHF 622 3.01% -CHF 126 2.77% CHF 375 -0.67%
IHD OLM vs. VAL -CHF 219 1.24% CHF 13 0.16% CHF 247 -0.86%
OLM vs. LOS -CHF 135 1.32% CHF 101 0.21% CHF 337 -0.83%
OLM vs. IRB -CHF 179 1.33% CHF 58 0.22% CHF 295 -0.82%
Cardiac event OLM vs. VAL -CHF 1'572 3.67% -CHF 311 1.27% CHF 605 -1.09%
OLM vs. LOS -CHF 1'343 4.43% -CHF 400 1.93% CHF 550 -0.47%
OLM vs. IRB -CHF 1'275 4.05% -CHF 346 1.60% CHF 590 -0.78%
IHD = ischemic heart disease; MI = myocardial infarction; OLM = olmesartan; LOS = losartan; IRB = irbesartan; VAL = valsartan
Source: authors’ own calculations
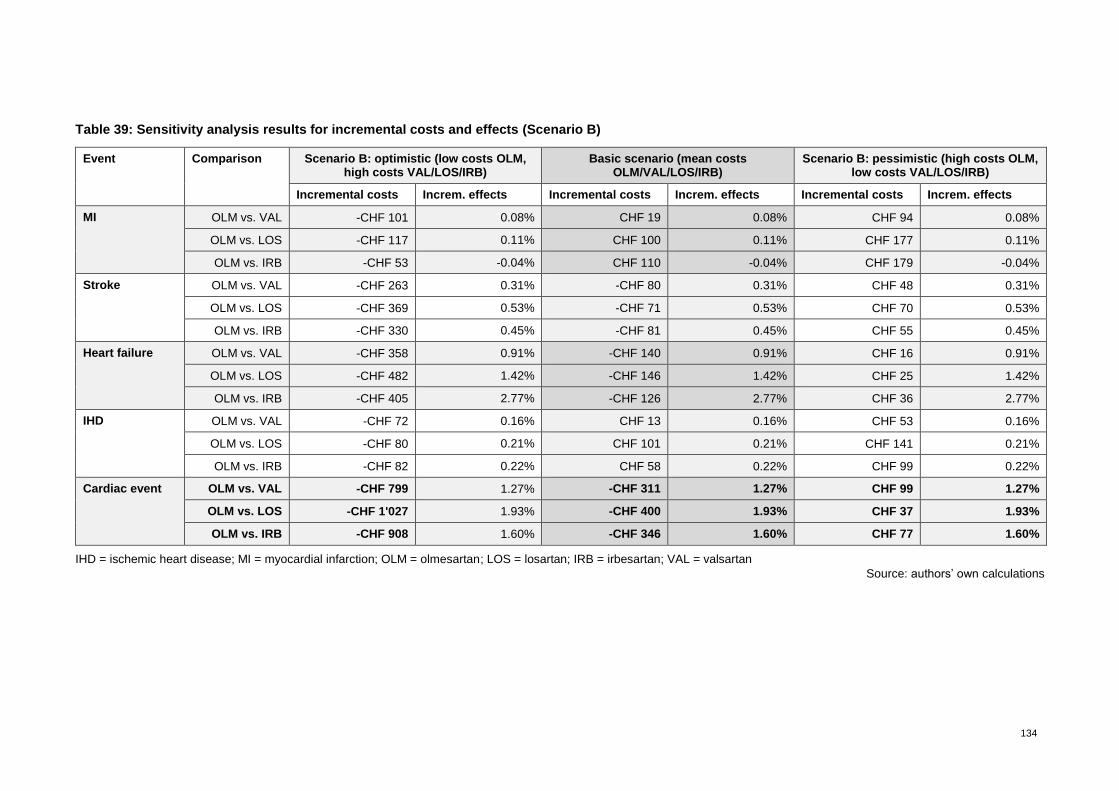
134
Table 39: Sensitivity analysis results for incremental costs and effects (Scenario B)
Event Comparison Scenario B: optimistic (low costs OLM, high costs VAL/LOS/IRB)
Basic scenario (mean costs OLM/VAL/LOS/IRB)
Scenario B: pessimistic (high costs OLM, low costs VAL/LOS/IRB)
Incremental costs Increm. effects Incremental costs Increm. effects Incremental costs Increm. effects
MI OLM vs. VAL -CHF 101 0.08% CHF 19 0.08% CHF 94 0.08%
OLM vs. LOS -CHF 117 0.11% CHF 100 0.11% CHF 177 0.11%
OLM vs. IRB -CHF 53 -0.04% CHF 110 -0.04% CHF 179 -0.04%
Stroke OLM vs. VAL -CHF 263 0.31% -CHF 80 0.31% CHF 48 0.31%
OLM vs. LOS -CHF 369 0.53% -CHF 71 0.53% CHF 70 0.53%
OLM vs. IRB -CHF 330 0.45% -CHF 81 0.45% CHF 55 0.45%
Heart failure OLM vs. VAL -CHF 358 0.91% -CHF 140 0.91% CHF 16 0.91%
OLM vs. LOS -CHF 482 1.42% -CHF 146 1.42% CHF 25 1.42%
OLM vs. IRB -CHF 405 2.77% -CHF 126 2.77% CHF 36 2.77%
IHD OLM vs. VAL -CHF 72 0.16% CHF 13 0.16% CHF 53 0.16%
OLM vs. LOS -CHF 80 0.21% CHF 101 0.21% CHF 141 0.21%
OLM vs. IRB -CHF 82 0.22% CHF 58 0.22% CHF 99 0.22%
Cardiac event OLM vs. VAL -CHF 799 1.27% -CHF 311 1.27% CHF 99 1.27%
OLM vs. LOS -CHF 1'027 1.93% -CHF 400 1.93% CHF 37 1.93%
OLM vs. IRB -CHF 908 1.60% -CHF 346 1.60% CHF 77 1.60%
IHD = ischemic heart disease; MI = myocardial infarction; OLM = olmesartan; LOS = losartan; IRB = irbesartan; VAL = valsartan
Source: authors’ own calculations

135
Table 40: Mono-preparations: pharmaceutical expenditures and packs reimbursed by health
insurance in Switzerland in 2018
ATC code Substance Market share pharmaceutical
expenditures
Market share packs
Number preparations (incl. different pack
size)
C09CA01 LOS 12.2% 12.9% 30
C09CA02 EPR 0.5% 0.3% 4
C09CA03 VAL 15.9% 16.0% 33
C09CA04 IRB 15.6% 12.2% 24
C09CA06 CAM 34.4% 43.6% 77
C09CA07 TEL 5.9% 4.4% 28
C09CA08 OLM 13.7% 9.6% 30
C09CA09 AZI 1.7% 1.1% 6
Total 100% 100% 232
ATC = anatomic therapeutic classification; AZI = azilsartan; CAN = candesartan; EPR = eprosartan; IRB = irbesartan; LOS = losartan; OLM = olmesartan; TEL = telmisartan; VAL = valsartan
Sources: Tarifpool ©SASIS AG, data processing: ©COGE GmbH105
Table 41: Fixed-dose combinations: pharmaceutical expenditures and packs reimbursed by
health insurance in Switzerland in 2018
ATC Code Substance Market share pharmaceutical
expenditures
Packs Number prepara-tions
(incl. diff. pack size)
C09DA01 LOS + HCTZ 7.5% 8.4% 42
C09DA02 EPR + HCTZ 0.4% 0.4% 4
C09DA03 VAL + HCTZ 8.5% 12.0% 50
C09DA04 IRB + HCTZ 11.1% 12.6% 36
C09DA06 CAN + HCTZ 16.2% 23.3% 76
C09DA07 TEL + HCTZ 3.0% 2.7% 24
C09DA08 OLM + HCTZ 5.2% 5.1% 48
C09DA09 AZI + HCTZ 1.3% 1.2% 8
C09DB01 VAL + HCTZ 13.3% 9.8% 18
C09DB02 OLM + CCBs 7.1% 6.5% 30
C09DB04 TEL + CCBs 0.8% 0.7% 6
C09DX01 VAL + HCTZ + CCBs 16.7% 11.4% 28
C09DX03 OLM + HCTZ + CCBs 8.8% 6.0% 20
Total 100.0% 100.0% 390
ATC = anatomic therapeutic classification; AZI = azilsartan; CAN = candesartan; CCB = calcium channel blocker; IRB = irbesartan; EPR = eprosartan; HCTZ = hydrochlorothiazide; LOS = losartan; OLM = olmesartan; TEL = telmisartan; VAL = valsartan
Sources: Tarifpool ©SASIS AG, data processing: ©COGE GmbH105
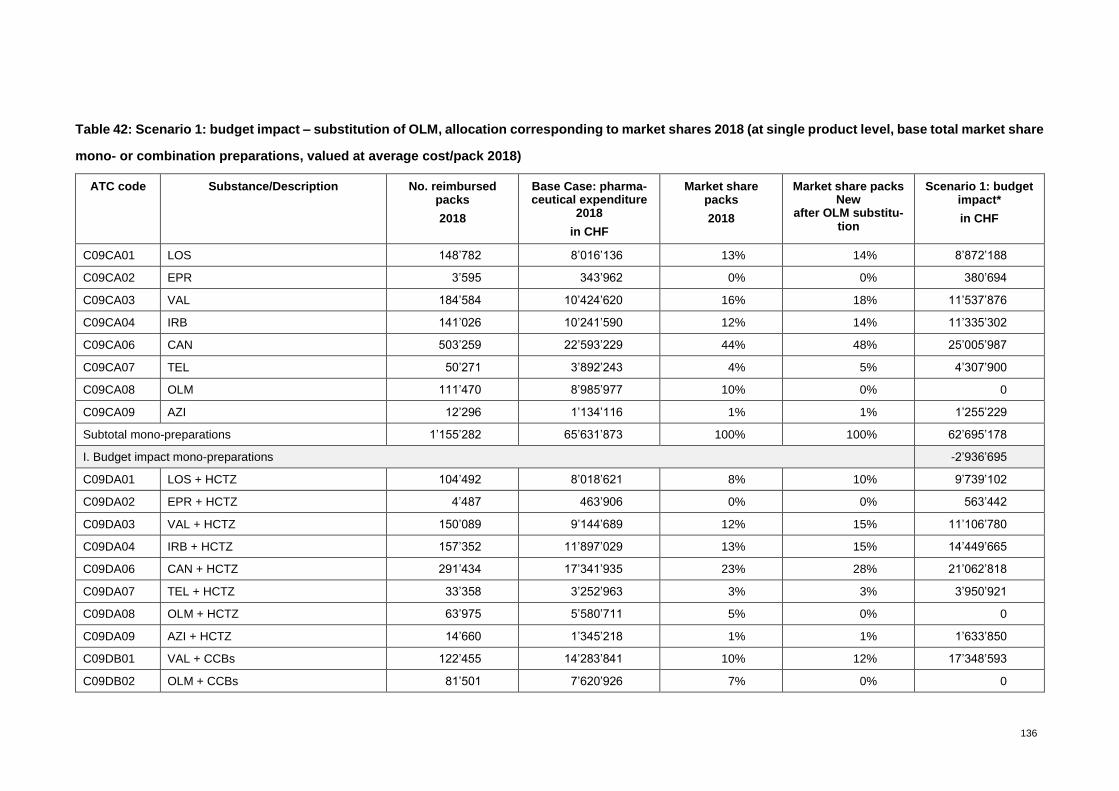
136
Table 42: Scenario 1: budget impact – substitution of OLM, allocation corresponding to market shares 2018 (at single product level, base total market share
mono- or combination preparations, valued at average cost/pack 2018)
ATC code Substance/Description No. reimbursed packs
2018
Base Case: pharma-ceutical expenditure
2018
in CHF
Market share packs
2018
Market share packs New
after OLM substitu-tion
Scenario 1: budget impact*
in CHF
C09CA01 LOS 148’782 8’016’136 13% 14% 8’872’188
C09CA02 EPR 3’595 343’962 0% 0% 380’694
C09CA03 VAL 184’584 10’424’620 16% 18% 11’537’876
C09CA04 IRB 141’026 10’241’590 12% 14% 11’335’302
C09CA06 CAN 503’259 22’593’229 44% 48% 25’005’987
C09CA07 TEL 50’271 3’892’243 4% 5% 4’307’900
C09CA08 OLM 111’470 8’985’977 10% 0% 0
C09CA09 AZI 12’296 1’134’116 1% 1% 1’255’229
Subtotal mono-preparations 1’155’282 65’631’873 100% 100% 62’695’178
I. Budget impact mono-preparations -2’936’695
C09DA01 LOS + HCTZ 104’492 8’018’621 8% 10% 9’739’102
C09DA02 EPR + HCTZ 4’487 463’906 0% 0% 563’442
C09DA03 VAL + HCTZ 150’089 9’144’689 12% 15% 11’106’780
C09DA04 IRB + HCTZ 157’352 11’897’029 13% 15% 14’449’665
C09DA06 CAN + HCTZ 291’434 17’341’935 23% 28% 21’062’818
C09DA07 TEL + HCTZ 33’358 3’252’963 3% 3% 3’950’921
C09DA08 OLM + HCTZ 63’975 5’580’711 5% 0% 0
C09DA09 AZI + HCTZ 14’660 1’345’218 1% 1% 1’633’850
C09DB01 VAL + CCBs 122’455 14’283’841 10% 12% 17’348’593
C09DB02 OLM + CCBs 81’501 7’620’926 7% 0% 0
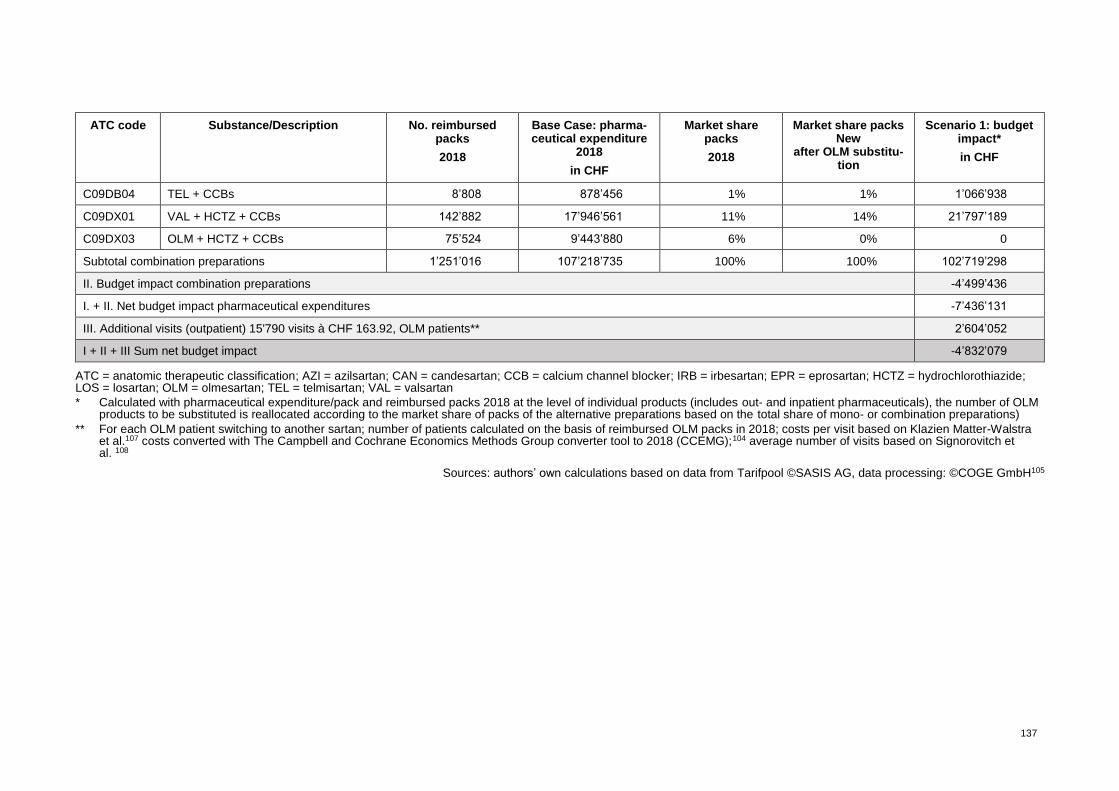
137
ATC code Substance/Description No. reimbursed packs
2018
Base Case: pharma-ceutical expenditure
2018
in CHF
Market share packs
2018
Market share packs New
after OLM substitu-tion
Scenario 1: budget impact*
in CHF
C09DB04 TEL + CCBs 8’808 878’456 1% 1% 1’066’938
C09DX01 VAL + HCTZ + CCBs 142’882 17’946’561 11% 14% 21’797’189
C09DX03 OLM + HCTZ + CCBs 75’524 9’443’880 6% 0% 0
Subtotal combination preparations 1’251’016 107’218’735 100% 100% 102’719’298
II. Budget impact combination preparations -4’499’436
I. + II. Net budget impact pharmaceutical expenditures -7’436’131
III. Additional visits (outpatient) 15'790 visits à CHF 163.92, OLM patients** 2’604’052
I + II + III Sum net budget impact -4’832’079
ATC = anatomic therapeutic classification; AZI = azilsartan; CAN = candesartan; CCB = calcium channel blocker; IRB = irbesartan; EPR = eprosartan; HCTZ = hydrochlorothiazide; LOS = losartan; OLM = olmesartan; TEL = telmisartan; VAL = valsartan
* Calculated with pharmaceutical expenditure/pack and reimbursed packs 2018 at the level of individual products (includes out- and inpatient pharmaceuticals), the number of OLM products to be substituted is reallocated according to the market share of packs of the alternative preparations based on the total share of mono- or combination preparations)
** For each OLM patient switching to another sartan; number of patients calculated on the basis of reimbursed OLM packs in 2018; costs per visit based on Klazien Matter-Walstra et al.107 costs converted with The Campbell and Cochrane Economics Methods Group converter tool to 2018 (CCEMG);104 average number of visits based on Signorovitch et al. 108
Sources: authors’ own calculations based on data from Tarifpool ©SASIS AG, data processing: ©COGE GmbH105
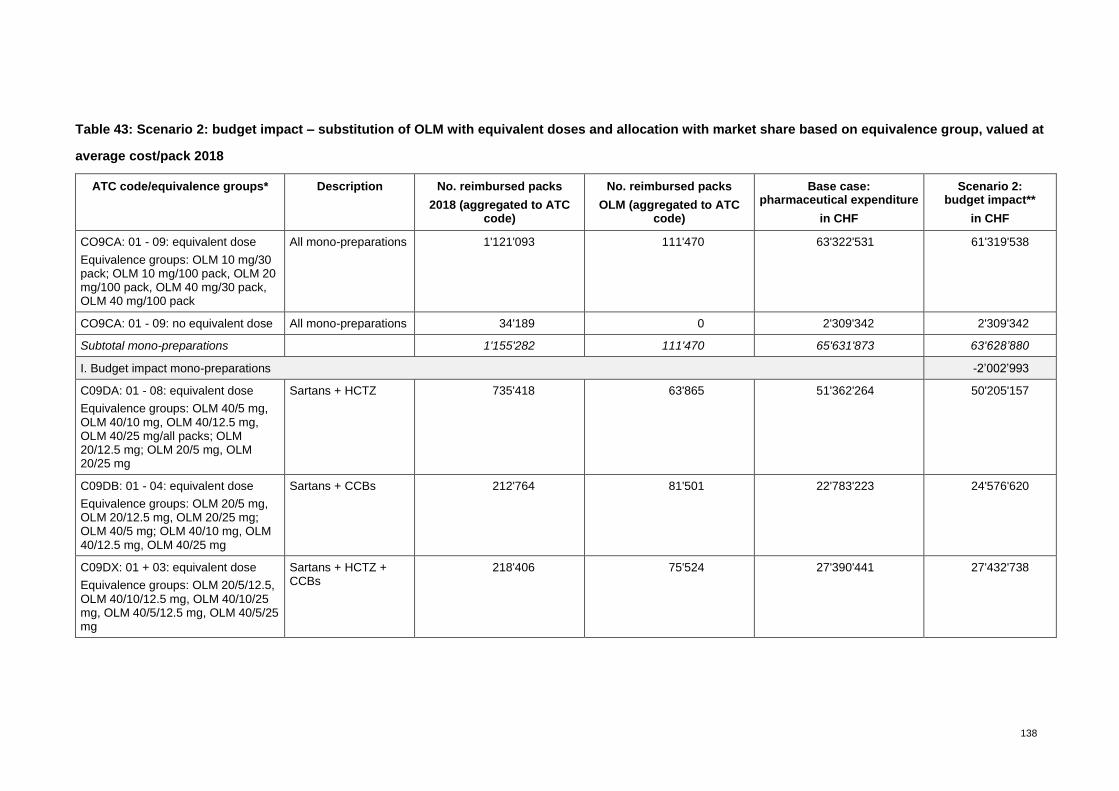
138
Table 43: Scenario 2: budget impact – substitution of OLM with equivalent doses and allocation with market share based on equivalence group, valued at
average cost/pack 2018
ATC code/equivalence groups* Description No. reimbursed packs
2018 (aggregated to ATC code)
No. reimbursed packs
OLM (aggregated to ATC code)
Base case: pharmaceutical expenditure
in CHF
Scenario 2: budget impact**
in CHF
CO9CA: 01 - 09: equivalent dose
Equivalence groups: OLM 10 mg/30 pack; OLM 10 mg/100 pack, OLM 20 mg/100 pack, OLM 40 mg/30 pack, OLM 40 mg/100 pack
All mono-preparations 1'121'093 111'470 63'322'531 61'319'538
CO9CA: 01 - 09: no equivalent dose All mono-preparations 34'189 0 2'309'342 2'309'342
Subtotal mono-preparations
1'155'282 111'470 65'631'873 63'628’880
I. Budget impact mono-preparations -2’002’993
C09DA: 01 - 08: equivalent dose
Equivalence groups: OLM 40/5 mg, OLM 40/10 mg, OLM 40/12.5 mg, OLM 40/25 mg/all packs; OLM 20/12.5 mg; OLM 20/5 mg, OLM 20/25 mg
Sartans + HCTZ 735'418 63'865 51'362'264 50'205'157
C09DB: 01 - 04: equivalent dose
Equivalence groups: OLM 20/5 mg, OLM 20/12.5 mg, OLM 20/25 mg; OLM 40/5 mg; OLM 40/10 mg, OLM 40/12.5 mg, OLM 40/25 mg
Sartans + CCBs 212'764 81'501 22'783'223 24'576'620
C09DX: 01 + 03: equivalent dose
Equivalence groups: OLM 20/5/12.5, OLM 40/10/12.5 mg, OLM 40/10/25 mg, OLM 40/5/12.5 mg, OLM 40/5/25 mg
Sartans + HCTZ + CCBs
218'406 75'524 27'390'441 27'432'738

139
ATC code/equivalence groups* Description No. reimbursed packs
2018 (aggregated to ATC code)
No. reimbursed packs
OLM (aggregated to ATC code)
Base case: pharmaceutical expenditure
in CHF
Scenario 2: budget impact**
in CHF
C09DA: 01 - 08: no equivalent dose Sartans + HCTZ 84'318 0 5'675'134 5'675'134
Subtotal combination preparations
1'250'906 '220'891 107'211'062 107'889'649
II. Budget impact combination preparations 678'586
I. + II. Net budget impact pharmaceutical expenditures -1’323’407
III. Additional visits (outpatient) 15'790 visits à CHF 163.92, OLM patients*** 2'604'052
I. + II. + III. Net budget impact pharmaceutical + visits 1’279’645
ATC = anatomic therapeutic classification; CCBs = calcium channel blocker: HCTZ = hydrochlorothiazidum,;OLM = olmesartan
* Equivalence groups summarised to ATC-code ** Calculated with pharmaceutical expenditure/pack and reimbursed packs 2018 at the level of single products (out- and inpatient pharmaceuticals), distributed to equivalent dose
and reallocated with new market share within the equivalence group *** For each OLM patient switching to another sartan; number of patients calculated on the basis of reimbursed OLM packs in 2018; costs per visit based on Klazien Matter-Walstra
et al.107 costs converted with The Campbell and Cochrane Economics Methods Group converter tool to 2018 (CCEMG);104 average number of visits based on Signorovitch et al. 108
Sources: authors’ own calculations based on data from Tarifpool ©SASIS AG, data processing: ©COGE GmbH105
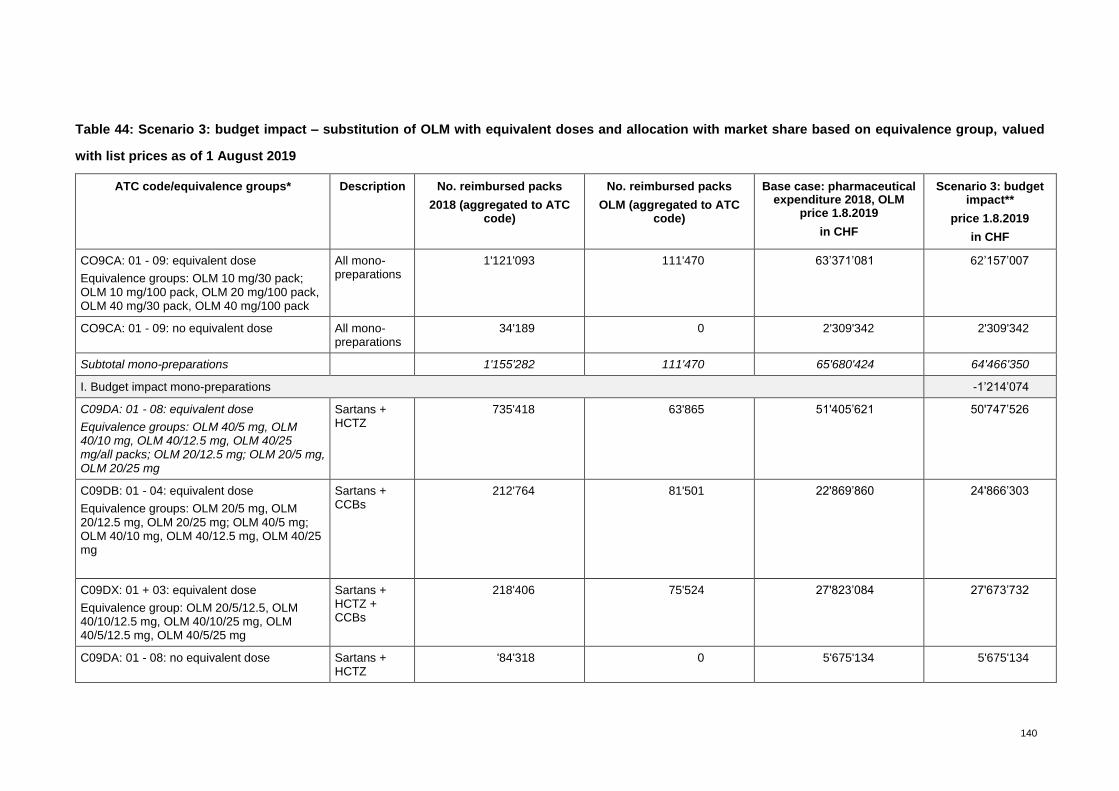
140
Table 44: Scenario 3: budget impact – substitution of OLM with equivalent doses and allocation with market share based on equivalence group, valued
with list prices as of 1 August 2019
ATC code/equivalence groups* Description No. reimbursed packs
2018 (aggregated to ATC code)
No. reimbursed packs
OLM (aggregated to ATC code)
Base case: pharmaceutical expenditure 2018, OLM
price 1.8.2019
in CHF
Scenario 3: budget impact**
price 1.8.2019
in CHF
CO9CA: 01 - 09: equivalent dose
Equivalence groups: OLM 10 mg/30 pack; OLM 10 mg/100 pack, OLM 20 mg/100 pack, OLM 40 mg/30 pack, OLM 40 mg/100 pack
All mono-preparations
1'121'093 111'470 63’371’081 62’157’007
CO9CA: 01 - 09: no equivalent dose All mono-preparations
34'189 0 2'309'342 2'309'342
Subtotal mono-preparations
1'155'282 111'470 65'680'424 64'466'350
I. Budget impact mono-preparations -1’214’074
C09DA: 01 - 08: equivalent dose
Equivalence groups: OLM 40/5 mg, OLM 40/10 mg, OLM 40/12.5 mg, OLM 40/25 mg/all packs; OLM 20/12.5 mg; OLM 20/5 mg, OLM 20/25 mg
Sartans + HCTZ
735'418 63'865 51'405’621 50'747’526
C09DB: 01 - 04: equivalent dose
Equivalence groups: OLM 20/5 mg, OLM 20/12.5 mg, OLM 20/25 mg; OLM 40/5 mg; OLM 40/10 mg, OLM 40/12.5 mg, OLM 40/25 mg
Sartans + CCBs
212'764 81'501 22'869’860 24'866’303
C09DX: 01 + 03: equivalent dose
Equivalence group: OLM 20/5/12.5, OLM 40/10/12.5 mg, OLM 40/10/25 mg, OLM 40/5/12.5 mg, OLM 40/5/25 mg
Sartans + HCTZ + CCBs
218'406 75'524 27'823’084 27'673’732
C09DA: 01 - 08: no equivalent dose Sartans + HCTZ
'84'318 0 5'675'134 5'675'134

141
ATC code/equivalence groups* Description No. reimbursed packs
2018 (aggregated to ATC code)
No. reimbursed packs
OLM (aggregated to ATC code)
Base case: pharmaceutical expenditure 2018, OLM
price 1.8.2019
in CHF
Scenario 3: budget impact**
price 1.8.2019
in CHF
Subtotal combination preparations
1'250'906 220'891 107'773’699 108'962’695
II. Budget impact combination preparations 1’188’997
I. + II. Net budget impact pharmaceutical expenditures -25’077
III. Additional visits (outpatient) 15'790 visits à CHF 163.92, OLM patients*** 2'604'052
I. + II. + III. Net budget impact pharmaceutical + visits 2’578’975
ATC = anatomic therapeutic classification; CCBs = calcium channel blocker; HCTZ = hydrochlorothiazidum; OLM = olmesartan * Equivalence groups summarised to ATC code ** Calculated with pharmaceutical expenditure/pack and reimbursed packs 2018 at the level of individual products (out- and inpatient pharmaceuticals), distributed to equivalent dose
and reallocated with new market share in the equivalence group, valued with prices as of 1 August 2019 (Source: Spezialitätenliste)106 *** For each OLM patient switching to another sartan; number of patients calculated on the basis of reimbursed OLM packs in 2018; costs per visit based on Klazien Matter-Walstra
et al.107 costs converted with The Campbell and Cochrane Economics Methods Group converter tool to 2018 (CCEMG);104 average number of visits based on Signorovitch et al. 108
Sources: authors’ own calculations based on data from Tarifpool ©SASIS AG, data processing: ©COGE GmbH;105 Spezialitätenliste106
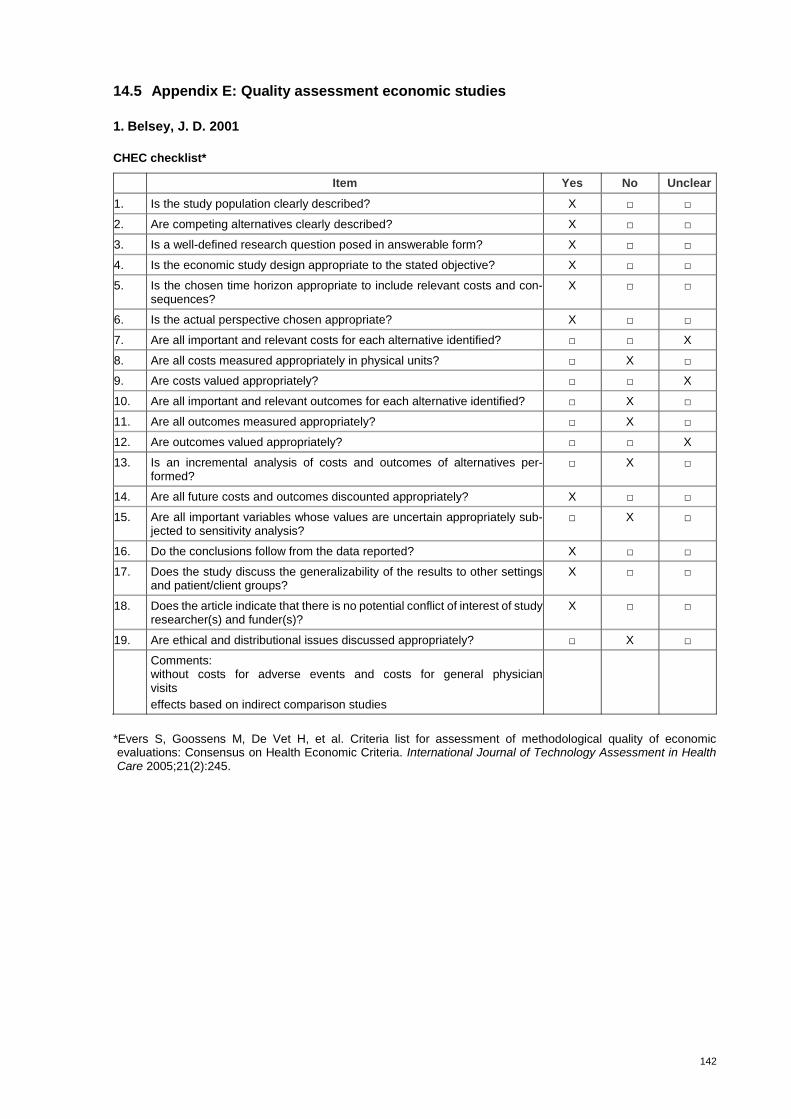
142
14.5 Appendix E: Quality assessment economic studies
1. Belsey, J. D. 2001
CHEC checklist*
Item Yes No Unclear
1. Is the study population clearly described? X □ □
2. Are competing alternatives clearly described? X □ □
3. Is a well-defined research question posed in answerable form? X □ □
4. Is the economic study design appropriate to the stated objective? X □ □
5. Is the chosen time horizon appropriate to include relevant costs and con-sequences?
X □ □
6. Is the actual perspective chosen appropriate? X □ □
7. Are all important and relevant costs for each alternative identified? □ □ X
8. Are all costs measured appropriately in physical units? □ X □
9. Are costs valued appropriately? □ □ X
10. Are all important and relevant outcomes for each alternative identified? □ X □
11. Are all outcomes measured appropriately? □ X □
12. Are outcomes valued appropriately? □ □ X
13. Is an incremental analysis of costs and outcomes of alternatives per-formed?
□ X □
14. Are all future costs and outcomes discounted appropriately? X □ □
15. Are all important variables whose values are uncertain appropriately sub-jected to sensitivity analysis?
□ X □
16. Do the conclusions follow from the data reported? X □ □
17. Does the study discuss the generalizability of the results to other settings and patient/client groups?
X □ □
18. Does the article indicate that there is no potential conflict of interest of study researcher(s) and funder(s)?
X □ □
19. Are ethical and distributional issues discussed appropriately? □ X □
Comments: without costs for adverse events and costs for general physician visits
effects based on indirect comparison studies
*Evers S, Goossens M, De Vet H, et al. Criteria list for assessment of methodological quality of economic evaluations: Consensus on Health Economic Criteria. International Journal of Technology Assessment in Health Care 2005;21(2):245.

143
2. Boersma, C. et al., 2010
CHEC checklist*
Item Yes No Unclear
1. Is the study population clearly described? □ X □
2. Are competing alternatives clearly described? X □ □
3. Is a well-defined research question posed in answerable form? X □ □
4. Is the economic study design appropriate to the stated objective? X □ □
5. Is the chosen time horizon appropriate to include relevant costs and con-sequences?
□ □ X
6. Is the actual perspective chosen appropriate? X □ □
7. Are all important and relevant costs for each alternative identified? □ X □
8. Are all costs measured appropriately in physical units? □ X □
9. Are costs valued appropriately? □ □ X
10. Are all important and relevant outcomes for each alternative identified? □ X □
11. Are all outcomes measured appropriately? X □ □
12. Are outcomes valued appropriately? □ □ X
13. Is an incremental analysis of costs and outcomes of alternatives per-formed?
□ □ X
14. Are all future costs and outcomes discounted appropriately? X □ □
15. Are all important variables whose values are uncertain appropriately sub-jected to sensitivity analysis?
□ □ X
16. Do the conclusions follow from the data reported? X □ □
17. Does the study discuss the generalizability of the results to other settings and patient/ client groups?
□ X □
18. Does the article indicate that there is no potential conflict of interest of study researcher(s) and funder(s)?
□ X □
19. Are ethical and distributional issues discussed appropriately? □ X □
Comments: Cardiovascular endpoints were extrapolated on BP decrease no adverse effects included
adherence data not available
low number of patients who received OLM
*Evers S, Goossens M, De Vet H, et al. Criteria list for assessment of methodological quality of economic evaluations: Consensus on Health Economic Criteria. International Journal of Technology Assessment in Health Care 2005;21(2):245.

144
3. Miller L. et al., 2010
CHEC checklist*
Item Yes No Unclear
1. Is the study population clearly described? X □ □
2. Are competing alternatives clearly described? X □ □
3. Is a well-defined research question posed in answerable form? X □ □
4. Is the economic study design appropriate to the stated objective? X □ □
5. Is the chosen time horizon appropriate to include relevant costs and con-sequences?
□ □ X
6. Is the actual perspective chosen appropriate? X □ □
7. Are all important and relevant costs for each alternative identified? □ □ X
8. Are all costs measured appropriately in physical units? □ □ X
9. Are costs valued appropriately? □ □ X
10. Are all important and relevant outcomes for each alternative identified? □ □ X
11. Are all outcomes measured appropriately? □ □ X
12. Are outcomes valued appropriately? □ □ X
13. Is an incremental analysis of costs and outcomes of alternatives per-formed?
X □ □
14. Are all future costs and outcomes discounted appropriately? X □ □
15. Are all important variables whose values are uncertain appropriately sub-jected to sensitivity analysis?
X □ □
16. Do the conclusions follow from the data reported? X □ □
17. Does the study discuss the generalizability of the results to other settings and patient/ client groups?
□ X □
18. Does the article indicate that there is no potential conflict of interest of study researcher(s) and funder(s)?
X □ □
19. Are ethical and distributional issues discussed appropriately? □ X □
Comments:
OLM group was younger and healthier
Proportion of diabetes patients was lower in OLM group
no detailed cost data shown
no adverse events calculated
no results for combination products shown
*Evers S, Goossens M, De Vet H, et al. Criteria list for assessment of methodological quality of economic evaluations: Consensus on Health Economic Criteria. International Journal of Technology Assessment in Health Care 2005;21(2):245.
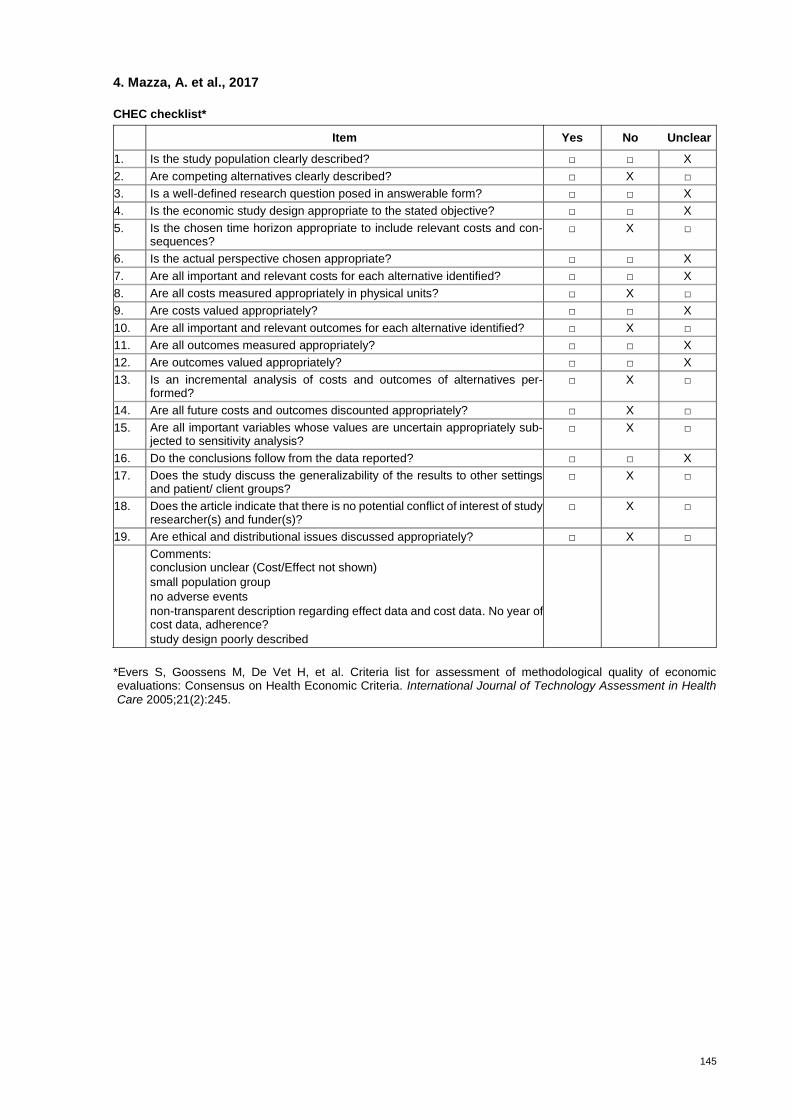
145
4. Mazza, A. et al., 2017
CHEC checklist*
Item Yes No Unclear
1. Is the study population clearly described? □ □ X
2. Are competing alternatives clearly described? □ X □
3. Is a well-defined research question posed in answerable form? □ □ X
4. Is the economic study design appropriate to the stated objective? □ □ X
5. Is the chosen time horizon appropriate to include relevant costs and con-sequences?
□ X □
6. Is the actual perspective chosen appropriate? □ □ X
7. Are all important and relevant costs for each alternative identified? □ □ X
8. Are all costs measured appropriately in physical units? □ X □
9. Are costs valued appropriately? □ □ X
10. Are all important and relevant outcomes for each alternative identified? □ X □
11. Are all outcomes measured appropriately? □ □ X
12. Are outcomes valued appropriately? □ □ X
13. Is an incremental analysis of costs and outcomes of alternatives per-formed?
□ X □
14. Are all future costs and outcomes discounted appropriately? □ X □
15. Are all important variables whose values are uncertain appropriately sub-jected to sensitivity analysis?
□ X □
16. Do the conclusions follow from the data reported? □ □ X
17. Does the study discuss the generalizability of the results to other settings and patient/ client groups?
□ X □
18. Does the article indicate that there is no potential conflict of interest of study researcher(s) and funder(s)?
□ X □
19. Are ethical and distributional issues discussed appropriately? □ X □
Comments: conclusion unclear (Cost/Effect not shown)
small population group
no adverse events
non-transparent description regarding effect data and cost data. No year of cost data, adherence?
study design poorly described
*Evers S, Goossens M, De Vet H, et al. Criteria list for assessment of methodological quality of economic evaluations: Consensus on Health Economic Criteria. International Journal of Technology Assessment in Health Care 2005;21(2):245.
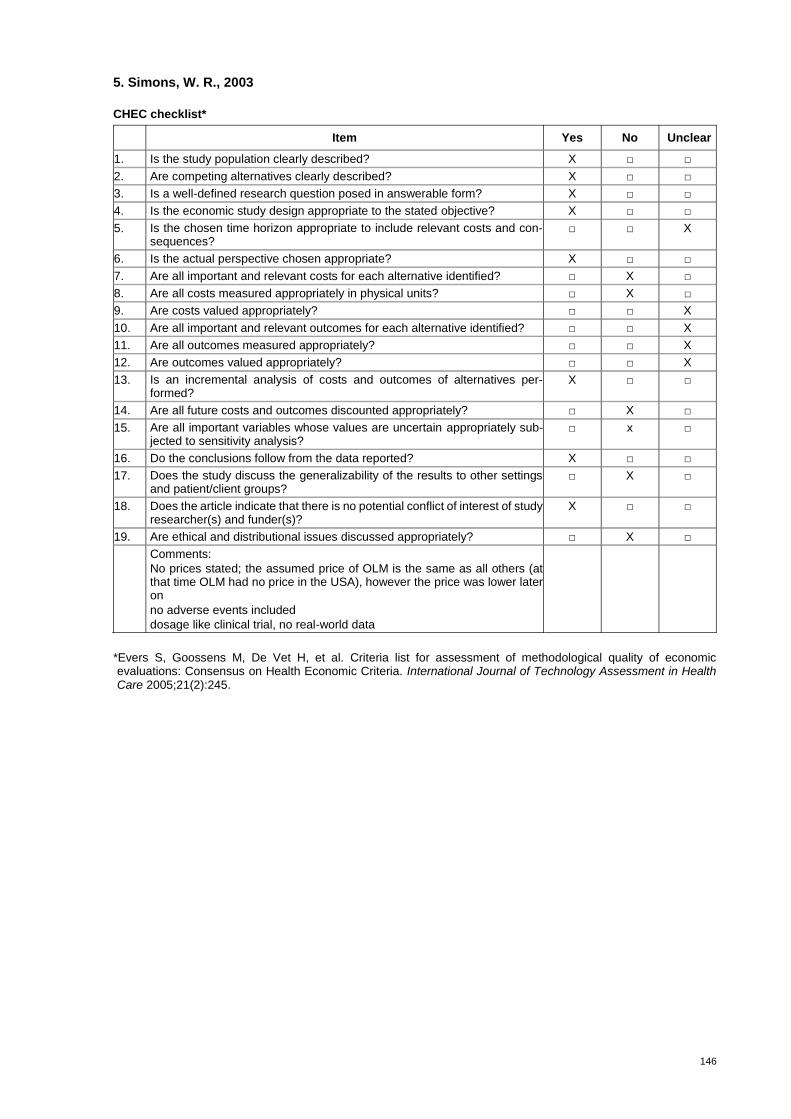
146
5. Simons, W. R., 2003
CHEC checklist*
Item Yes No Unclear
1. Is the study population clearly described? X □ □
2. Are competing alternatives clearly described? X □ □
3. Is a well-defined research question posed in answerable form? X □ □
4. Is the economic study design appropriate to the stated objective? X □ □
5. Is the chosen time horizon appropriate to include relevant costs and con-sequences?
□ □ X
6. Is the actual perspective chosen appropriate? X □ □
7. Are all important and relevant costs for each alternative identified? □ X □
8. Are all costs measured appropriately in physical units? □ X □
9. Are costs valued appropriately? □ □ X
10. Are all important and relevant outcomes for each alternative identified? □ □ X
11. Are all outcomes measured appropriately? □ □ X
12. Are outcomes valued appropriately? □ □ X
13. Is an incremental analysis of costs and outcomes of alternatives per-formed?
X □ □
14. Are all future costs and outcomes discounted appropriately? □ X □
15. Are all important variables whose values are uncertain appropriately sub-jected to sensitivity analysis?
□ x □
16. Do the conclusions follow from the data reported? X □ □
17. Does the study discuss the generalizability of the results to other settings and patient/client groups?
□ X □
18. Does the article indicate that there is no potential conflict of interest of study researcher(s) and funder(s)?
X □ □
19. Are ethical and distributional issues discussed appropriately? □ X □
Comments:
No prices stated; the assumed price of OLM is the same as all others (at that time OLM had no price in the USA), however the price was lower later on
no adverse events included
dosage like clinical trial, no real-world data
*Evers S, Goossens M, De Vet H, et al. Criteria list for assessment of methodological quality of economic evaluations: Consensus on Health Economic Criteria. International Journal of Technology Assessment in Health Care 2005;21(2):245.
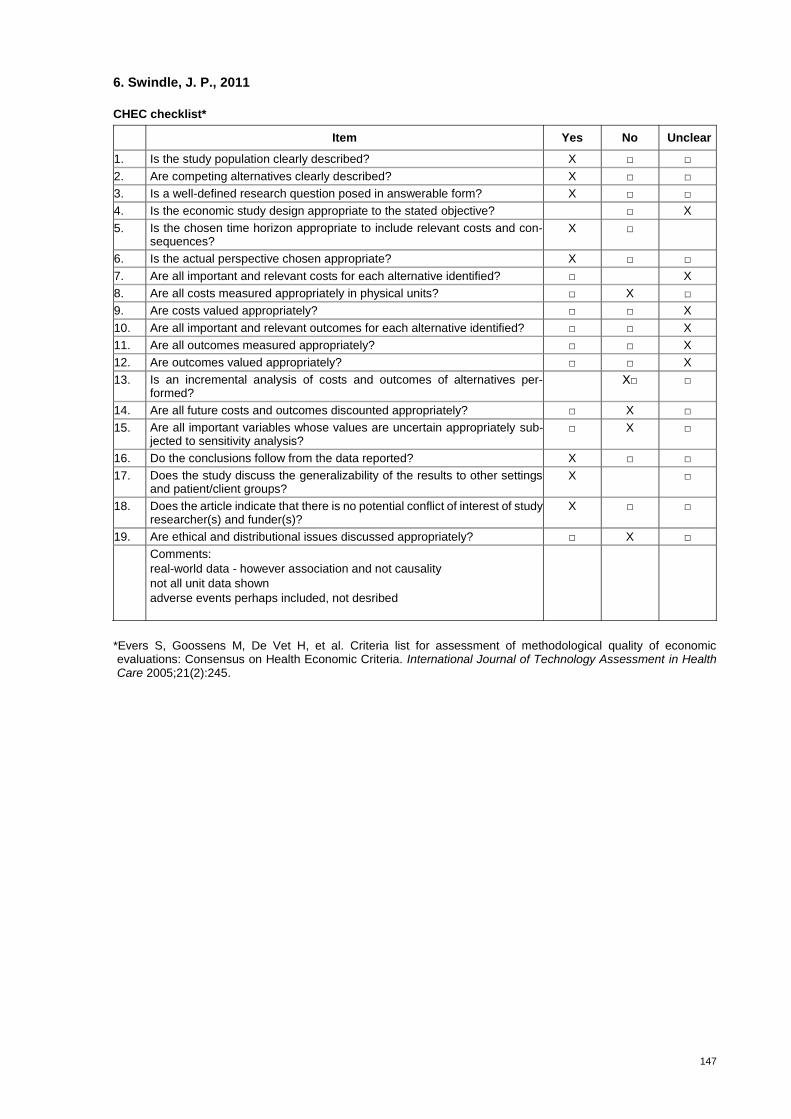
147
6. Swindle, J. P., 2011
CHEC checklist*
Item Yes No Unclear
1. Is the study population clearly described? X □ □
2. Are competing alternatives clearly described? X □ □
3. Is a well-defined research question posed in answerable form? X □ □
4. Is the economic study design appropriate to the stated objective? □ X
5. Is the chosen time horizon appropriate to include relevant costs and con-sequences?
X □
6. Is the actual perspective chosen appropriate? X □ □
7. Are all important and relevant costs for each alternative identified? □ X
8. Are all costs measured appropriately in physical units? □ X □
9. Are costs valued appropriately? □ □ X
10. Are all important and relevant outcomes for each alternative identified? □ □ X
11. Are all outcomes measured appropriately? □ □ X
12. Are outcomes valued appropriately? □ □ X
13. Is an incremental analysis of costs and outcomes of alternatives per-formed?
X□ □
14. Are all future costs and outcomes discounted appropriately? □ X □
15. Are all important variables whose values are uncertain appropriately sub-jected to sensitivity analysis?
□ X □
16. Do the conclusions follow from the data reported? X □ □
17. Does the study discuss the generalizability of the results to other settings and patient/client groups?
X □
18. Does the article indicate that there is no potential conflict of interest of study researcher(s) and funder(s)?
X □ □
19. Are ethical and distributional issues discussed appropriately? □ X □
Comments:
real-world data - however association and not causality
not all unit data shown
adverse events perhaps included, not desribed
*Evers S, Goossens M, De Vet H, et al. Criteria list for assessment of methodological quality of economic evaluations: Consensus on Health Economic Criteria. International Journal of Technology Assessment in Health Care 2005;21(2):245.
Top Related
Copyright © 2022 FDOKUMEN

