


Bahasa
Halaman
Hukum


這份刊物的 PDF 版本的文字是從印刷版掃描而成,再利用光學字符識別軟
件轉換成電子格式。由於原印刷版本已印製並保存多年,光學字符識別技
術未必能準確地識別某些文字或數字。因此,搜索或複製此 PDF 檔案內的
文字時應加以注意。 The text of this PDF publication was scanned from its printed version and then converted to electronic text using Optical Character Recognition (OCR) software. Because of the age and condition of the original printed copy, the OCR may not recognise certain characters or figures accurately. Caution should therefore be taken when searching or copying text from this PDF publication.

Bong Kong
Monthly Digest of Statistios
April 1987
Census and Statistics Department, Bong Kong-

PRINTED AND PuBLISHED BY THE GOVERNMENT PRINTl!ll, HONG KONG

INTRODUCTION
The Hong Kong Monthly Digest of Statistics is prepared by the Census and Statistics Department. It is designed to provide up-to-date statistical information about the social and economic characteristics of Hong Kong.
Statistical data are, wherever possible, presented in the form of monthly figures for the past twenty-five months together with annual figures for the latest complete six years. Detailed description of the scope and nature of the data and definitions of the terms used in the publication are provided in the Explanatory Notes.
Most of the statistics have been compiled by the Census and Statistics Department. Where other Government departments and organizations have contributed data, references are made in the Explanatory Notes. The Census and Statistics Department gratefully acknowledges such contributions.
Symbols
The following symbols are used throughout the Digest:
nil or not applicable N.A. not available * revised figures
Units of Measurement
1 terajoule (TJ) = 277 778 kilowatt hours
9 478.17 therms
1 tonne (t) = 2 204.62 pounds
0.984 207 ton
1 kilogram (kg) = 2.204 62 pounds
1.653 47 catties
1 square metre (m2) 10.763 9 square feet
1 cubic metre (m3) 219.969 imperial gallons
1 hectopascal millibar
1 km/h 0.54 knots
Values
All figures quoted are in Hong Kong dollars.
Exchange Rate
The Official rate for conversion to US dollars was HK$5.085 = US$1.00 until 25 November 1974. The Hong Kong dollar floated on 26 November 1974. As from 17 October 1983 the Hong Kong dollar was linked to US dollar, through a new arrangement in the note-issue mechanism, at a fixed exchange rate of HK$7 .80 =US$ l .OO.
Rounding of Figures
Some figures have been rounded off to the nearest final digit. This may result in a slight discrepancy between the sum of the individual items and the total as shown in the tables.
Hong Kong Monthly Digest of Statistics April 1987 iii

TABLE OF CONTENTS
Sections/tables
INTRODUCTION
PART I REGULAR TABLES
Section 1: Population ~ Vital Statistics 1.1 Estimated population, birth rate and death rate 1.2 Registered births, deaths and marriages
Section 2: Labour 2.1 Labour force, unemployment and underemployment 2.2 EstablishmentS and persons engaged : 2.3 Establishments and persons engaged by industry group 2.4 Reported vacancies by industry group 2.5 Establishments and persons engaged in selected major divisions by
employment size 2.6 Employment in Government service 2.7 Total monthly payroll by industry group 2.8 Nominal and real indexes of payroll per person engaged by industry
group 2.9 Wage indexes 2.10 Average daily wages of workers engaged in Government building and
construction projects 2.11 Stoppages of work by industry 2.12 Reported Occupational accidents 2.13 Industrial accidents in 4th quarter 1986
Section 3: External Trade 3.1 External trade statistics 3.2 Imports by area 3.3 Domestics exports by area 3.4 Imports by major tradin~ country 3.5 Domestic exports by major trading country 3.6 Re-exports by major country of origin 3. 7 Re-exports by major country of destination 3.8 Imports by commodity section 3.9 Domestic exports by commodity section 3.10 Re-exports by commodity section 3.11 Imports and re-exports by end-use category 3.12 Domestic exports of principal commodities 3.13 Trade index numbers 3.14 Trade in,dex numbers for imports 3.15 Trade index numbers for domestic exports 3.16 Trade index numbers for re-exports 3.17 Trade index numbers for main suppliers of imports 3.18 Trade index numbers for main markets of domestic exports
Section 4: Production 4.1. Index of industrial production 4.2 Index of textile production 4.3 Textile production 4.4 Cement and quarry production
Section 5: Land, Housing, Building and Construction 5.1 Stock of permanent living quarters 5.2 Stock and authorized population of public housing rental flats 5.3 Residential units/fiats completed by geographic area 5.4 Residential units/fiats completed by floor area 5.5 Residential units/fiats with consent to commence work by geographic
area 5.6 Residential units/fiats with consent to commence work by floor area 5. 7 Buildings completed by type 5.8 Buildings with consent to commence work by type 5.9 Price indexes by type of premises 5.10 Rental indexes by type of premises 5.11 Instruments registered in the Land Office 5.12 Gross value of construction work performed by building and civil
engineering contractors 5.13 Disposals of Government land
Section 6: Transport, Communications and Tourism 6.1 Aircraft movements 6.2 Ocean-going vessels entered and cleared 6.3 River vessels entered and cleared 6.4 International movements of commercial cargo 6.5 Commercial cargo carried by vessels 6.6 Containers carried by ocean-going vessels 6.7 Public transport: passenger journeys by undertaking 6.8 Motor vehicles licensed 6.9 Vehicular traffic through toll-charged tunnels and vehicular ferry
services 6.10 Traffic accidents and casualties
iv
•-flt! i!'iitflltllzl!'tit•
~-ftti:J..a.&~$l!'tit
.Aoililc~ilt·lll1:.1'·nt:1' :±11:. • nt~Hf!il!liltilltilc~
~-=tti: BI ~ilb.Ai:t , fk~.&iUt~Marfilt UU'U!!.trl'.ifcl3 .&&t~Uilc ll#tflltrl'.ilc 13 .&U~Uilc<t!HHitfill1J::SHJ1> lllfllllU:fl5!~(tiifi'~m131J:~Hl> ti-T±~1:.~•rn1J~l1Mfll&ilcl3 .&&t~.Ailc<tli&t~Uifcjt•O
~fHl.Ailc &~ fr~illi <t!iMtm!31JjtJ!li) &t~'i!f'FJ?!J~-.&'.!Olli'~mit<tlifi'~ti!31JjtJ!li)
I'fttliifc ~ffl~~Mm•IN~I.A->FJ?!Ja~
~JlffI~H'l'<tiifi'~j}--) ¥¥!l.~.JlillH:9~$-l't-JL/l..1'~$1!!1$I.t9HJ-f't-
~l!!llti: ~· I.1:.iiltliifc ~-·1:.iil:fliilc ~-~1:.iil 7J<llB.&1:11il1:.iil
~Jill! : ±:11!! , IHI , llii :*A1'£1t.l!Ji'folilc &1t0~¥&eHll!iiJJi!i~.Ailc liJiltz 1t~¥tri:/ j}-Jll!'¥iltl3 <tii:llfl~j}-Jlli> liJiltz 1t~¥tri:/ j}-Jll!'¥tl3 <l'!il!iliiiliiM*•> ml'!Ef#Jiz1t~¥&/ *!11!'¥ilt~ <tiiJ&lilj}-Jan
m:l'IE1Jiz1t!{;;fllf:fl/j}-J11!'¥iltl3 <l'!il!iliiiliifftj}-Jlli> liJiltl!'¥<l'!il!'¥UjtJ!li> ml'!EilJil!'¥<l'!il!'¥filJ!lij}-Jlli> 1!11fliifc(J'!i!(;J1tt0j}-Jlli) m~mit<l'!i'11ttOj}-Jlli> e.:tE111±ttillt1iH:iiazxl!l ~mifi1'fmINilm
~M±:1&m•.&mm
$1\lti : A · !HI · ~:jifti.&llillliltlllt~ :jlffti.&llttilltf!••~ :jlffti.&lltti~tAJ~ilc~ ifi1tt1ti!lril!!:±I J:l fllltilc tt•1tillrfllltilc liW<fa••••·~ ~~~m=*m*•*~~mIA.A~ ~AA!Qilcl3 ~ffli&•M:m.&~1fillltf/Nt:$'.~
~mu~.&•t:•~
Page '.Rile
iii
2 2-3 4-5
6 7
8 9-10
11-:12
13:_15 16
16 17 18
19 20 20 21 21 22 22 23 23 24 24 25 25 26 27 28 29 29
30 , 31
31-32 32
33 33 34 35
35-36
36 37 37 38 38 39 40
40--42
43 43-44
45 46 46 47 47
48-49 50
50
Hong Kong Monthly Digest of Statistics April 1987

Sections/tables
6.11 Telecommunication services 6.12 Postal services 6.13 Passenger arrivals 6.14 Passenger departures 6.15 Hong Kong resident departures by destination 6.16 Visitor arrivals by country of residence 6.17 Receipts from visitors 6.18 Per capita spending and length of stay of visitors 6.19 Hotel statistics
Section 7: Money, Banking and Finance 7.1 Currency in circulation and money supply 7.2 Deposits from customers 7.3 Balance sheets: banks 7.4 Balance sheets: deposit-taking companies 7 .5 Balance sheets: all deposit-taking institutions 7.6 Money markets 7. 7 Analysis of loans and advances for use in Hong Kong 7.8 Loans and advances analysed by type-banks 7.9 Loans and advances analysed by type-deposit.taking companies 7.10 Loans and advances analysed by deposit-taking institutions and by
currency denomination 7.11 Foreign currency positions 7.12 Interest rates paid and charged by principal banks 7.13 Hong Kong dollar inter-bank offer rates and bank cheques cleared 7.14 Banks: external liabilities and claims at 31December1986 7.15 Deposit-taking companies: external liabilities and claims at
31 December 1986 7.16 Exchange rates and the effective exchange rate indexes (average
figures) 7.17 Exchange rates and the effective exchange rate indexes (end of period
figures) 7.18 Exchange rates and the effective exchange rate indexes in March
1987 7.19 Index of share prices and value of stock exchange turnover 7.20 Index of share prices and value of stock exchange turnover in
March 1987 7.21 Closing prices of futures exchange and turnover in March 1987 7.22 Gold and silver exchange trading prices 7.23 Gold and silver exchange trading prices in March 1987
Section 8: Prices and Retailing 8.1 Average retail prices of selected foodstuffs 8.2 Average wholesale prices of selected foodstuffs 8.3 New Consumer Price Index (A) 8.4 New Consumer Price Index (B) 8.5 New Hang Seng Consumer Price Index 8.6 Month-to-month percentage changes in the seasonally adjusted new
consumer price indexes 8. 7 Consumer Price Index (A) 8.8 Consumer Price Index (B) 8.9 Hang Seng Consumer Price Index 8.10 Restaurant receipts 8.11 Retail sales
Section 9: Social Statistics 9.1 Crime 9.2 In-patient and out-patient statistics in Government and
Government-assisted institutions 9.3 Notified infectious diseases 9.4 Public assistance schemes 9.5 Special needs allowance schemes
Section 10: Energy JO.I Electricity consumption 10.2 Gas consumption 10.3 Petroleum products: releases from petroleum companies by type 10.4 Petroleum products: releases from petroleum companies, duty free
and duty paid
Section 11: Miscellaneous 11.1 Revenue and expenditure of the Hong Kong Government under the
General Revenue Account 11.2 Local and oversea companies registered and dissolved 11.3 Fire services 11.4 Water supplies 11.5 Meteorological observations
PART II PERIODIC TABLES
Section 12: Population and Mortality Statistics 12.1 Estimated population by age group at mid-1987 ... appears in August
issue 12.2 Deaths by cause ... appears in June issue
Hong Kong Monthly Digest of Statistics April 1987
fti!/*
11~.IJRJ* -~.IJRJ* ~limtf!:Al'X *Uih!£$Al'X *li.ii!H~MliAl'X (flt§ l'l<J:lt!!:SHfO Hfilimtf!: Al'X <tlt.%1til~:SH!f0 Hfilimtf!:ffllU\IJrt Hfilimtf!:4iA 'l'-!\JtH~& lil$~1flJ l'lfli!ifl!lftil~
m-tftl! : ·- , Mft , :Hl flltlUt!!l'&1tHJ!lli $?;ff~ t!Hrifilf:ft-IJ{~ fl~ff~~iijffJ!'li:ftfl~ tl~;:ff~llfft'ifilfjt il* ••-mia ilt'i!fliftlft :t:tUi:&~~:Stm' tHT:it~&~l>::<tltlftlHUl1J:Stm'>. tl~:ffli::~iiJitli::&fll>::<tltJD~l'illU:Stm'l :tr~&~li:: (:J'.iifl~;:ff~llfft&it!!l'fil-&:Stm')
tl~:ff~ll#t~~!!l'ffilf:ftil&iUJJl'.JlJtt~ j:Jt:flUr•i!t:t:ffli::&:trli::~J$ lHTliil•llf.\UH!i!Bi::m'.IC~ lHr: ~-JLJ\.t\&t:+=A.:::.+-ati~~:ftfrt&fJUfU\IJrt tl'.lf::ffli::~iiJ : ~-JLJ\.t;&t:+=A .:::.+-ati~~:ftil&-IJ{U • ~~!!l'Jtf~$&1l!!l'll$flitt('F-J?l:Jtt>
~~!!l'Jtf~$&1l!!l'li$tlitt<~Wltt>
-JLA-t&f:.:::.A fil~~!!I' Jt~$&$!!1'li$tlitlc
JN:~fl~fliUiiUi3C~Ji1t3Crt -JLA-t&f:.:::.A filJN:~tl~r.itlc&llll3'F3C~Ji1t3Crt
-1LA-t&f:.:::.Afil:llU1t3C~illcmfft&Ji1t3Cf!Jt
~--··· -JLJ\.-t&f:.:::.A fil~l{JU!fflfl
mAftl! : !fmil , •ff *'fk!Jt'F-J?l:J~ftil~ *'fk!Jt'F-!IJ~§tfft~ jiljll'(fflJt!Jttfr.itt iiZ.l'ifflft~ilfflitt iifti1:fflftWillflitt ~*fti!tt~miimft11tillt11tt:tt1tAa:St~~-
IJ!l'ifflft11tflmt1c z.•m•~flmtt ftij;_fflft~illflitt $.:k•M1!f ~1!f-M1!f
mnfti!=tt~ l!I!~ i!tJf,f&i!tJf,fffJ11J••••z-1t~&r,ttmAtt!f:
Bflli~Z.1'~\W ~::lt'tll!IJfltl!I ~!l1J3JH1tlllillt$J
m+fti!: Miii «JJffl*B l;!Ultffl*B 1'i"ldl0iiJ 11:11t:t1'i"ldl~ollr (r!Cilfollrl'i!ll]:S}I'() 1:i"ldf 0iiJ 11:11t:t1'i"ldl1\lollr (:J'.ii~llt& Bli:llt:Stl'i>
m+-w = nrcmi!tJf,f-ll!:lllcAll l'l :tlllcA&1111i:
*:lt!!&~Hii!il~iij~l'filtffifl ffll!IJ.IJRJ* Jft]j({l!;J!fli
~·fe•
fll=fll! ~ll!f•Jtl:lzrtita
m+=.fti! : At:l&JEt:ant -JLA-t&f:&f:.P Attfiliflt(:J'.ii&f:~:Stll> -J\.A filflJll:I
JEt::Att<tltJEl!il:Stl'i> -t;A filflJll:I
Page :Rtt
51 51 52 52 53 54 54 55 55
56 57
58-59 60-61 62-63 64--65
66 67 68 69
69-70 71 71
72-73 74-75
76
77
78
79 79
80 81 81
82 83 83 84 84 84
85 85 86 86 87
88-91 91
92 93 94
95 95 96 96
97
97 98 99 99
v

Sections/tables
Section 13: Education ... appears in February issue
13.1 Schools and enrolment
Section 14: Wages and Employee Benefits ... appears in December issues
14. l Salary indexes for managerial and professional employees , 14.2 Percentage of managerial and professional employees entitled to
various fringe benefits for June 1987
Section 15: National Accounts ... appears in February and August issues
15.1 Expenditure on the gross domestic product by components: at constant (1980) market prices
15.2 Expenditure on the gross domestic product by components: at current market prices
15.3 Contribution of economic sectors to the gross domestic product at current prices, 1981-1985
Section 16: Summary Statistics from Annual Economic Surveys ... appears once annually
March 1987: Summary statistics from the Annual Survey of Banks, Deposittaking Companies and Representative Offices of Foreign Banks for 1985
April 1987: Summary statistics from the 1985 Survey of Building, Construction and Real Estate Sectors
16.1 Principal statistics for all building and civil engineering contractors in the 1985 Survey of Building, Construction and Real Estate Sectors, analysed by trade group
16.2 Principal statistics for all building and civil engineering contractors in the 1985 Survey of Building, Construction and Real Estate Sectors, analysed by gross value of construction work performed
16.3 Principal statistics for all architectural, surveying and project engineering establishments in the 1985 Survey of Building, Construction and Real Estate Sectors, analysed by trade
16.4 Principal statistics for all real estate development, leasing, brokerage and maintenance management establishments in the 1985 Survey of Building, Construction and Real Estate Sectors, analysed by trade
16.5 Construction site statistics of building and civil engineering contractors in the 1985 Survey of Building, Construction and Real Estate Sectors, analysed by public/private sector
16.6 Construction site statistics of building and civil engineering contractors in the 1985 Survey of Building, Construction and Real Estate Sectors, analysed by nature of construction activity
16.7 Construction site statistics of building and civil engineering contractors in the 1985 Survey of Building, Construction and Real Estate Sectors, analysed by end use of building or structure
16.8 Project statistics of real estate developers in the 1985 Survey of Building, Construction and Real Estate Sectors, analysed by end use of building
PART III SPECIAL REVIEW ... appears in January, March, May, July, September and November issues
January 1987: Salary statistics of middle-level managerial and professional employees
March 1987: A review on the structure and operating characteristics of the construction sector
EXPLANATORY NOTES
vi
W/~
~+=:W: ~l!f-=JH?H!Jtl:l
.!Jtf:!ef!UI &.!Jl1=.Ali
~+~W:I•&~~m~-+=Affi~tl:l
~i:1u,rrn•~1Jii.Etzi»r~m• -1LA-t¥7'A ffi~:l!l!~&•~1Jii.El $:ff 4Hlllftl;fti~JZ. i3 ffi$
~+.n.W: lil~~-=A&J\.AffiflJflJ
:if>:flli1=.£t"'1-0lBIJJt7}~ (t(fi'[J)E (-JLJ\.0¥>111*\IT'.l't'.)
:if>:flli1=.£f<1l!{i[Jnl Jt7}~ ())), '1"¥111*\IT'.j$:) -
45-~lJ!fllllrHi'i:if>:flli1=.£f<1l!fil(:l'f('l"¥111*\IT~)Z.lt$, -JLA--JLJ\..li
-1LA-t¥~fl : -1LA.li¥@Jli&Jll!£~~1IT!lif*lltiJ!=
- JLJ\..li ¥ @Jli&Jll!£~~1IT 'F 19f 1f tl!P¥W ±*IWffe:ltil'!i llS .± J!=~ITT-tt"f' <*fi~7rm >
-JLJ\..li ¥:lt~&Jll!£~~1IT'F 19f1ftllt'i"W ±*IWffe:ltil'!i llS .± J!=~iIT:f!i"f'.(1'f,;19f@IWt"'1-0l7J-m>
-JLJ\..li ¥:ltJ/i&Jll!£~~1IT'F 19f:ff:lt~filtiIT ' llltl::l:&1$:f!JIW llifltllS ±J!=~ITT-tt"f' <*fi~7rm >
-1LA.n.¥mJ/i&lll!£~~1IT<Fl9f1flll!£V.llt. mm. ~l'.&ili! 1ftg:l!l!J1ifltllS±J!=~ITT-tt"f'<*fi~7rm>
-JLJ\..li¥@Jli&Jll!£~~1IT'Ftllt'i"W±*IWffe:ltil'!illS:ltJ!illl! ft~\IT(1'f,;0~lliflt/f!,.AJli1'7J-m>
-JLJ\..li¥:lt~&Jll!£~~1IT'Ftll!'i"W±*IWffe:ltiflillS:lt~Jll! fi~\IT(1'f,;IW•li:fl7J-m)
-1LA.li¥:lt~&Jll!£~~1IT'Ftll!'i"'fn±*IWffe:ltiflillS:lt~Jll! ft~\IT(1'f,;tllt'i"Jl)G:lt~!fmllSl't~~llSJH:@S:7J-m)
-1LA.li¥:lt~&Jll!£~~1IT'Flll!£V.lltiflillSIW~iIT(1'f(fll!'¥ l't~~llSYH:@S:7rm>
Page :R"li
100
100
100
101
101
101
102
102
I-IV
Hong Kong Monthly Digest of Statistics April 1987

SECTION 1 POPULATION AND VITAL STATISTICS
1.1 ESTIMATED POPULATION, BIRTH RATE AND DEATH RATE
Rate of Infant Crude Crude natural mortality
birth rate death rate increase rate per Estimated Growth per thousand per thousand per thousand thousand
Year population rate(%) population population population live births
1976Mid 4 518 OOO 1.3 17.4 5.0 12.4 13.7 End 4 551 OOO
1977Mid 4 583 700 1.5 17.5 5.1 12.4 13.5 End 4 631 500
1978 Mid 4 667 500 1.8 17.3 5.1 12.2 11.8 End 4 769 900
1979Mid 4929 700 5.6 16.8 5.2 11.7 12.3 End 5 024 700
1980Mid 5 063 100 2.7 17.0 5.0 12.0 11.2 End 5 145 100
1981 Mid 5 183 400 2.4 16.8 4.8 12.0 9.7 End 5 238 500
1982Mid 5 264 500 1.6 16.4 4.8 11.6 9.9 End 5 319 500
1983 Mid 5 345 100 1.5 15.6 5.0 10.6 9.9 End 5 377 400
1984 Mid 5 397 900 1.0 14.4 4.7 9.6 8.8 End 5 430 900
1985 Mid 5 456 200 1.1 14.0 4.6 9.3 7.5 End 5 500 400
1986 Mid 5 532 600 1.4 13.0t 4.7t 8.3t 7.5t End 5 588 OOO
Note: The above estimates have been revised in the light of a review takeo after the 1986 By-census. tProvisional figures.
1.2 REGISTERED BIRTHS, DEATHS AND MARRIAGES
Births Deaths Marriages
Year/month Male Female Total Male Female Totalt
1981 44 791 42 313 87104 13 855 11 116 24978 50756 1982 44277 41 759 86 036 14252 11 193 25460 51467 1983 42 161 39 854 82 015 14 864 11 606 26485 47784 1984 40030 37 605 77 635 14 333 11 231 25 580 53410 1985 39447 36986 76433 14073 11 241 25 325 45056 1986 37 283 34928 72 211 14 513 11 503 26030 43280 1985: Mar. 3 226 2954 6180 1422 1 143 2 568 3480
Apr. 2 869 2644 5 513 1 235 1 015 2250 3434 May 2976 2 787 5763 1 188 952 2142 3 530 June 2 704 2475 5 179 1 016 856 1872 3100 July 3 531 3 140 6 671 1 143 894 2038 2834 Aug. 3 379 3 198 6 577 1 101 871 1976 3230 Sept. 3 075 3 047 6122 1 003 686 1 689 3 595 Oct. 3 893 3 553 7 446 1 217 935 2 152 4211 Nov. 3 601 3 397 6998 1 112 839 1 951 4328 Dec. 3 594 3 523 7117 1 172 978 2150 4660
1986: Jan. 3 730 3 362 7092 1473 1 078 2 552 4467 Feb. 2 711 2498 5209 1209 970 2180 2 514 Mar. 2 792 2600 5 392 1 275 1 103 2 381 4184 Apr. 2970 2 793 5 763 1 332 1 150 2482 3 665 May 2 914 2 735 5 649 1 194 937 2132 3 784 June 2 638 2 508 5146 1 080 847 1929 3449 July 3 068 2 855 5923 1208 912 2120 2846 Aug. 2 938 2 792 5 730 1 084 868 1 953 2 786 Sept. 3 235 2987 6222 1080 840 1922 3 827 Oct. 3 373 3 196 6569 1 170 854 2025 3 671 Nov. 3 237 3 166 6403 1 054 886 1 941 4 188 Dec. 3 677 3436 7 113 1 354 1 058 2413 3 899
1987: Jan. 2 9i0 2 739 5 649 1203 965 2 169 2879 Feb. 2937 2 773 5 710 1 327 1 039 2368 3 387 Mar. 2 935 2 746 5 681 1 187 984 2174 5 341
tThe total figures include a small number of deaths of unknown sex.
Hong Kong Monthly Digest of Statistics April 1987

Period
1981 1982 1983 1984 1985 1986
Dec. 1984-Feb. 1985
Jan. 1985-Mar. 1985 Feb. 1985-Apr. 1985 Mar. 1985-May 1985 Apr. 1985-June 1985 May 1985-July 1985 June 1985-Aug. 1985 July 1985-Sept. 1985 Aug. 1985-0ct. 1985 Sept. 1985-"N"ov. 1985 Oct. 1985-Dec. 1985 "N"ov. 1985-Jan. 1986 Dec. 1985-Feb. 1986
Jan. 1986-Mar. 1986 Feb. 1986-Apr. 1986 Mar. 1986-May 1986 Apr. 1986-June 1986 May 1986-July 1986 June 1986-Aug. 1986 July 1986-Sept. 1986 Aug. 1986-0ct. 1986 Sept. 1986-"N"ov. 1986 Oct. 1986-Dec. 1986 "N"ov. 1986-Jan. 1987 Dec. 1986-Feb. 1987
SECTION 2 LABOUR
2.1 LABOUR FORCE, UNEMPLOYMENT AND UNDEREMPLOYMENT
Labour force ('OOO)
Male Female Total
l 602.2 887.3 2 489.5 l 600.3 897 .8 2 498.l l 623.6 916.9 2 540.5 l 646.5 959.7 2 606.2 1 671.5 955.4 2 626.9 1 714.9 986.6 2 701.5
1 656.0 976.0 2 632.0
1 649.4 945.0 2 594.4 1 644.8 931.l 2 576.0 1 657.0 935.8 2 592.8 1 677.1 955.2 2 632.2 1 681.5 975.0 2 656.5 1 683.8 969.9 2 653.7 1 681.0 956.l 2 637.1 l 678.4 942.6 2 621.0 1 674.l 960.0 2 634.1 1 678. 7 965.4 2 644.1 1 688.3 970.7 2 659.1 1 684.5 952.0 2 636.5
1 697.2 958.8 2 656.0 1 693.5 965.5 2 659.0 1 705.4 979.0 2 684.4 1 707.0 997.9 2 704.9 1 716.0 1 003.7 2 719.7 l 729.0 998.4 2 727.4 l 730.6 991.l 2 721.8 1 723.6 990.5 2 714.0 1 721.7 999.7 2 721.4 1 724.7 998.8 2 723.5 l 736.8 995.0 2 731.8 1 707.9 959.2 2 667.1
Labour force participation rate
(%) Unemployed
('OOO) Unemployment rate
(%)
Not seasonally Seasonally Not seasonally Seasonally Male Female Total adjusted adjusted adjusted adjusted
82.5 49.0 66.3 81.3 47.5 64.7 80.9 47.4 64.5 81.3 49.l 65.5 80.4 48.5 64.8 80.5 48.9 65.1
80.8 49.3 65.3
80.4 48.3 64.7 80.0 47.5 64.2 80.0 47.7 64.3 80.3 48.6 64.9 80.6 49.5 65.5 80.8 49.2 65.5 80.7 48.5 65.0 80.4 47.9 64.6 80.4 48.3 64.7 80.l 48.5 64.7 80. l 48. 7 64.8 79.8 48.0 64.4
79.8 48.3 64.6 79.8 48.5 64.6 80.0 49.l 65.l 80.4 49.7 65.4 80.8 49.8 65.7 81.2 49.4 65.7 81.2 48.7 65.3 80.7 48.7 65.1 80.5 48.9 65. l 80.4 48.8 65.0 80.6 48.5 65.0 80.3 47.2 64.l
96.4 91.l
113.9 101.0 83.6 76.3
82.0
77.6 77.3 77.0 74.5 82.1 91.9 95.1 92.9 94.1 87.3 81.4 78.5
83.2 84.0 78.2 80.9 82.6 87.2 81.3
76.2 67.9 59.0 51.9 49.5
82.1
81.1
81.2 80.8 75.l 78.3 85.6 86.9 85.4 86.4 83.3 80.8 79.9
85.0 85.4 80.3 80.6 79.9 81.7 75.0 70.7 65.l 59.4 54.6 52.6
3.9 3.6 4.5 3.9 3.2 2.8
3.1
3.0 3.0 3.0 2.8 3.1 3.5 3.6 3.5 3.6 3.3 3.1 3.0
3.1 3.2 2.9 3.0 3.0 3.2 3.0 2.8 2.5 2.2 1.9 1.9
3.1
3.1 3.2 3.1 2.9 2.9 3.2 3.3 3.3 3.3 3.1 3.0 3.0
3.2 3.2 3.0 3.0 2.9 3.0
2.8 2.6 2.4 2.2 2.0 2.0
Underemployed
('OOO)
47.2 27.7 49.4 45.9
31.8
39.7 34.5 34.6 40.4 47.6 53.4
55.4 55.5 59.6 62.l 67.l 53.9
61.7 57.7 64.2 52.2 45.7 39.9 36.6 35.4 33.l 31.8 31.7 27.4
Underemployment
rate (%)
1.9 1.1
1.9 1.7
1.2
1.5 1.3 1.3
1.5 1.8 2.0 2.1 2.1 2.3 2.3 2.5 2.0
2.3 2.2 2.4 1.9 1.7 1.5 1.3
1.3
1.2 1.2 1.2 1.0
Note: Figures for the moving quarter of Jan.-Mar. 85 onwards are based on the new General Household Survey definitions.
Year /quarter
1981 1982 1983 1984 1985 1986
1984: 4th qtr.
1985: lst qtr. 2nd qtr. 3rd qtr. 4th qtr.
1986: lst qtr. 2nd qtr. 3rd qtr. 4th qtr.
2
2.2 ESTABLISHMENTS AND PERSONS ENGAGED
Establishments
18
18 11 10 9
10
10
10 10 9 9
9 9
10 10
International Standard Industrial Classification (l.S.I.C.) Major Division 2
Mining and quarrying Persons engaged
Male Female
843 879 754 627 626 593
627
655 650 630 626
624 498 597 593
21 21
17 10
12 20
10
16 15 12 12
12 13 16 20
Total
864 900 771 637 638 613
637
671 665 642 638
636 511 613 613
Establishments
47996 46448 45 576 48038 45 915 46 816
48 038
47 495 46994 48065 45 915
46029 46 520 48 623 46 816
Major Division 3
Manufacturing Persons engaged
Male Female
454 896 423 446 424041 445 837 424 796 436 364
445 837
431 063 431 999 423 661 424 796
426 359 445 191 438 001 436 364
451 004 423 747 431 376 453 110 422 819 429 250
453 110
436 818 442 195 425 239 422 819
415 126 440 871 431 752 429 250
Total
905 899 847 194 855 417 898 947 847 615 865 614
898 947
867 881 874 194 848 900 847 615
841 485 886 062 869 753 865 614
Hong Kong Monthly Digest of Statistics April 1987

LABOUR
2.2 ESTABLISHMENTS AND PERSONS ENGAGED-contd.
International Standard Industrial Classification (l.S.l.C.)
Major Division 4 Major Division 5
Electricity and gas Construction work sites
Establish- Persons engaged Persons engaged
Year /quarter ments Male Female Total Sites Male Female
1981 4 9 558 1 004 10 562 1 306 84 845 4032 1982 4 10 460 998 11458 1243 78 596 3 459 1983 4 9 862 822 10 6.84 1 094 67 697 2 914 1984 3 9 702 841 10 543 1 046 66 317 2 286 1985 3 10 105 870 10 975 1 078 64060 2 253 1986 3 10 254 965 11 219 1 157 68 363 2445
1984: 4th qtr. 3 9 702 841 10 543 1 046 66 317 2 286
1985: lst qtr. 3 9 688 844 10 532 1 050 65 314 2 418 2nd qtr. 3 9 664 835 10499 1 066 61 712 2 544 3rd qtr. 3 10 155 877 11 032 1 062 62149 2 278 4th qtr. 3 10 105 870 10 975 1 078 64060 2 253
1986: 1 st qtr. 3 10 083 882 10 965 1112 63 701 2 321 2nd qtr. 3 10 135 878 11 013 1107 61 560 2432 3rd qtr. 3 10 167 891 11 058 1122 66 342 2 609 4th qtr. 3 10 254 965 11 219 1 157 68 363 2445
International Standard Industrial Classification (l.S.l.C.)
Major Division 6 Major Division 7t Wholesale, retail and import/export trades,
restaurants and hotels Transport, storage and communication
Establish- Persons engaged Establish- Persons engaged
Year /quarter ments Male Female Total meats Male Female
1981 76 181 330 067 153 751 483 818 3 311 65 847 19 221 1982 83 168 349 706 168 003 517 710 3 345 67 419 20 159 1983 87 778 355 429 176 529 531 959 3 090 69 167 20 560 1984 94 012 378 245 195 583 573 828 3 481 72 923 22 732 1985 99 916 391 201 209 205 600405 3 623 71 732 23 620 1986 102 704 397 175 222 906 620 081 3 635 74 257 24 389
1984: 4th qtr. 94 012 378 245 195 583 573 828 3 481 72 923 22 732
1985: lst qtr. 96 287 377 847 195 535 573 382 3 516 71 333 22279 2nd qtr. 101 854 386 923 201 755 588 678 3 497 71447 22 668 3rd qtr. 98 665 385 984 203 710 589 694 3 557 71 975 23 187 4th qtr. 99 916 391 201 209 205 600 405 3 623 71 732 23 620
1986: lst qtr. 98 913 386 534 208 745 595 278 3 691 72 321 23 349 2nd qtr. 105 110 395 467 215 297 610 764 3 674 72 750 23 957 3rd qtr. 102 699 396 577 218 288 614 865 3 616 73 350 24 314 4th qtr. 102 704 397 175 222 906 620 081 3 635 74257 24389
International Standard Industrial Classification (I.S.l.C.)
Major Division 8
Financing, insurance, real estate and business services
Establish-Year/quarter ments
1981 12 892 1982 13 660 1983 13 981 1984 14 757 1985 15 673 1986 16 965
1984: 4th qtr. 14 757
1985: lst qtr. 15 532 2nd qtr. 15 485 3rd qtr. 15 418 4th qtr. 15 673
1986: 1 st qtr. 16 959 2nd qtr. 16 684 3rd qtr. 16 788 4th qtr. 16 965
Note: Annual figures refer to the 4th quarter of the year. tThe coverage is as yet incomplete.
Hong Kong Monthly Digest of Statistics April 1987
Persons engaged Male Female
96 854 57 914 103 909 62 216 102 033 59 658 106 180 63 343 113 441 67 410 118 546 75 714
106 180 63 343
107 410 64 221 111 936 65 716 112 590 66 659 113 441 67 410
115 461 70 241 116 594 72 755 116 880 74229 118 546 75 714
Major Division 9t
Community, social and personal services
Establish- Persons engaged Total ments Male Female
154 769 16 040 100 749 80456 166 124 17 428 104 137 86 253 161 691 18 326 104 807 89 963 169 523 19 040 105 048 96 781 180 851 19 280 105 305 100 098 194 261 19 616 107 410 101 057
169 523 19 040 105 048 96 781
171 631 18 922. 104094 95 344 177 652 18 939 103 659 96266 179 249 19 170 104 687 98 568 180 851 19 280 105 305 100 098
185 702 19 642 106 463 100 352 189 349 19 486 106 811 100 118 191 108 19 548 106 832 100 437 194 261 19 616 107 410 101 057
Total
88 877 82 055 70 611 68 603 66 313 70 808
68 603
67 732 64256 64427 66 313
66022 63 992 68 951 70 808
Total
85 067 87 578 89 726 95 655 95 352 98 645
95 655
93 612 94115 95162 95 352
95 670 96708 97 664 98 645
Total
181 205 190 390 194 770 201 829 205 403 208 468
201 829
199 438 199 925 203 255 205 403
206 815 206 929 207 269 208 468
3

LABOUR
2.3 ESTABLISHMENTS AND PERSONS ENGAGED BY INDUSTRY GROUP
International Standard Industrial Classification (l.S.l.C.)
Major Division 2 Mining and quarrying
Metal ore mining
Other mining
Major Division 3 Manufacturing
Food
Beverages
Tobacco
Wearing apparel, except footwear
Leather and leather products, except footwear and wearing apparel
Footwear, except rubber, plastic and wooden footwear
Textiles
Wood and cork products except furniture
Furniture and fixtures, except primarily of metal
Paper and paper products
Printing, publishing and allied industries
Chemicals and chemical products
Products of petroleum and coal
Rubber products
Plastic products
Non-metallic mineral prOducts, except products of petroleum and coal
Basic metal industries
Fabricated metal products, except machinery and equipment
Machinery, except electrical
Electrical machinery, apparatus, appliances and supplies
Transport equipment
Scientific, measuring and controlling equipment not elsewhere classified, and photographic and optical goods
Other manufacturing industries
Major Division 4 Electricity and gas
Electric light and power
Gas manufacture and distribution
Major Division 5 Construction
Building and construction work sites by type of contracting party:
4
Housing Department
Other Government departmentst
Railway and tunnel construction
Private sector
Establishments
9
4th quarter 1985
Persons engaged Male Female Total
626 12 638
626 12 638
45 915 424 796 422 819 847 615
924 13 447 4 548 17 995
29 3 861 430 4 291
8 559
238
456
4 555
958
1261
I 394
3 246
818
268
5 031
358
254
6 360
3 806
1972
557
1629
3 234
3
2
1078
88
322
12
656
898 306 1204
79 678 184 891 264 569
2 045 I 224 3 269
5246 2268 7513
60 503 50 102 110 606
4 022 743 4 766
7 300 655 7 955
II 008 2 480 13 488
24 068 6 741 30 809
5 551 2 536 8 087
213
I 770
42489
3 447
3 395
42 II?
20263
42 978
II 855
18 813
19 830
10105
8 530
1575
64060
II 152
15 338
815
36 755
12 225
621 2 391
40028 82517
743 4 190
287 3 682
19 656 61 773
I 655 21 918
68 208 II I 186
772 12 627
23 317 42 130
10 597 30 427
870 10 975
680 9 210
190
2253
382
566
I 300
I 765
66313
II 534
15 904
820
38 055
Establishments
10
10
3rd quarter 1986
Persons engaged Male Female Total
597 16 613
597 16 613
48 623 438 001 431 752 869 753
964 13 676 4 364 18 040
30 4 205 462 4 667
4
9 21!
233
51!
5 049
961
I 31!
1516
3 375
835
4
274
5 460
365
268
6 677
4167
1979
574
1472
3 383
3
2
1122
92
31!
714
790 312 1102
80 322 183 226 263 548
2041 1170 321!
5 936 2 250 8 186
64 499 51 557 1!6 056
4 068 697 4 765
7 178 727 7 905
11 782 2 682 14 464
24 998 7 136 32 134
5 882 2 757 8 639
191
I 788
44 799
3 640
3 027
43 678
22037
43 445
II 840
17 521
20658
10167
8 496
1671
66342
10 852
16 136
572
38 782
192
649 2 437
44 648 89 447
822 4462
291 3 318
20 490 64 168
2 235 24 272
71 647 1!5 092
824 12 664
21 883 39 404
10 922 31 580
891 11 058
683 9179
208
2609
375
569
4
1661
1879
68951
II 227
16 705
576
40 443
Establishments
10
10
4th quarter 1986
Persons engaged Male Female Total
593 20 613
593 20 613
46 816 436 364 429 250 865 614
952 13 321 4 504 17 825
30 4 050 508 4 558
4
8 798
227
455
4809
901
1237
I 501
3 282
793
256
5 506
367
229
6243
4083
1921
547
1361
3 307
3
2
1157
IOI
314
6
736
819 295 1114
82 Oil 181 418 263 428
2017 1236 3253
6041 2452 8493
64 735 51 599 1!6 334
4 097 715 4 812
7 333 736 8 069
II 702 2 574 14 276
24 434 7 616 32 049
5 638 2 709 8 347
188
1682
45 869
3 681
3 236
41642
21909
42 984
12 091
16 612
20 272
10254
8 566
I 688
68363
12 839
15 727
631
39166
195
646 2 328
41 834 87 703
856 4 538
337 3 573
20 687 62 329
2318 24227
72 266 1!5 250
828 12 918
22215 38827
10 894 31 167
965 11219
747 9 313
218
2445
372
553
I 512
1906
70808
13 211
16 280
639
40678
Hong Kong Monthly Digest of Statistics April 1987

LABOUR
2.3 ESTABLISHMENTS AND PERSONS ENGAGED BY INDUSTRY GROUP-contd.
International Standard Industrial Classification (I.S.I.C.)
Major Division 6 Wholesale, retail and import/export trades, restaurants and hotels§
Wholesale
Retail
Import/export
Restaurants, cafes and bars
Hotels and boarding houses
Major Division 7t Transport, storage and communication
Land transport
Water transport
Air transport
Services allied to transport (including storage)
Communication
Major Division 8 Financing, insurance, real estate and business services
Financial institutions
Insurance
Real estate
Machinery and equipment rental and leasing
Business services except machinery and equipment rental and leasing
Major Division 9t Community, social and personal services
Sanitary and similar services
Education services
Research and scientific institutes
Medical, dental, other health and veterinary ser~ces
Welfare institutions
Business, professional and labour associations
Other social and related community services
Motion picture and other entertainment services
Libraries, museums, gardens, and other cultural services, n.e.c.
Amusement and recreational services, n.e.c.
Repair services, n.e.c.
Laundries, laundry services, and cleaning and dyeing plants
Miscellaneous personal services
tThe coverage is as yet incomplete.
4th quarter 1985 3rd quarter 1986
Establishments
Persons engaged Establish- Persons engaged Establish-
4th quarter 1986
Persons engaged Male Female Total ments Male Female Total ments Male Female Total
99 916 391 201 209 205 600 405 102699 396577 218288 614865 102 704 397175 222 906 620 081
11 554 46 412 14 386 60 798 11 380 42 486 13 019 55 505 II 441 42 876 13 398 56 274
48 204 103 474 70 887 174 361 47 829 98 108 66 052 164 160 48 019 96 826 68 752 165 578
32 890 120 641 71 211 191 852 36 028 131 019 83 136 214 155 35 753 132 114 84 111 216 225
6 388 103 934 45 111 149 045 6 522 107 234 47 331 154 565 6 634 107 327 48 352 155 678
881 16 740 7 610 24 350 939 17729 8751 26480 857 18 032 8 293 26 325
3 623 71 732 23 620 95 352 3 616 73 350 24 314 97 664 3 635 74 257 24 389 98 645
76 21 630 I 183 22 813 77 21 878 I 187 23 065 72 22 205 1 006 23 211
907 13 762 3 325 17 087 884 13886 3622 17508 925 13 751 3 709 17 460
119 3 949 3 674 7 623 117 4196 3 951 8147 117 4 229 4 049 8 278
2 361 18 680 9 204 27 884 2 358 19 603 9 298 28 901 2 342 20 020 9 365 29 385
161 13 710 6 235 19 945 181 13 787 6 256 20 043 180 14 052 6 261 20 313
IS 673 113 441 67 410 180 851 16 788 116880 74 229 191 108 16 965 118 S46 75 714 194 261
4 050 43 242 35 198 78 440 4 020 44 450 37 331 81 782 4 066 44 728 37 884 82 612
I 614 4 897 4 386 9 283 1 909 · 5 686 5 164 10 851 1 975 5 808 5 466 II 274
3 899 21 250 7 063 28 313 4 169 21 801 8 397 30 198 4 232 22 380 8 529 30 909
68 394 113 507 74 404 152 555 77 425 148 573
6 042 43 659 20 650 64 309 6 616 44 538 23 185 67 723 6 615 45 206 23 686 68 892
19 280 105 305 100 098 205 403 19 S48 106 832 100 437 207 269 19 616 107 410 101 057 208 468
815 9 290 8 700 17 990 711 9 088 8 184 17 272 703 9 017 7 548 16 565
2 102 27 797 43 617 71414 2 095 29 173 43 OOO 72 173 2 121 29 423 43 462 72 885
40 242 171 413 26 223 201 424 26 245 205 450
3 260 7 581 19 636 27 217 3 266 7 785 19 940 27 725 3 339 7 863 20 065 27 927
526 1 860 6 775 8 635 616 2 007 7 644 9 651 644 I 990 7 911 9 901
365 1 523 I 013 2 536 351 1 354 1 026 2 380 327 I 355 I 089 2 444
711 3 836 3 333 7169 726 3 804 3 638 7 442 718 3 923 3 668 7 591
975 7 657 2 844 10 501 990 8 065 3 204 II 269 1 028 8 019 3 295 II 313
31 158 158 316 43 211 207 418 43 215 232 446
247 5 915 2 868 8 783 224 6 005 2 531 8 536 216 5917 2569 8485
4 341 15 058 I 636 16 694 4 427 15 328 I 671 16 999 4 346 15 083 I 751 16 834
902 3 575 1 883 5 458 914 3 252 I 890 5 141 940 3 259 I 827 5 087
4 965 20 813 7 465 28 278 5 159 20 538 7 301 27 839 5 165 21 103 7 437 28 539
§Figures for ISIC Major Division 6 as from the second quarter of 1986 were based on the up-to-date industry codes obtained from the results of an industry updating exercise. (see Explanatory Notes). tincluding Architectural Services Department, Civil Engineering Services Department, Highways Department, Territory Development Department and Water Supplies Department.
Hong Kong Monthly Digest of Statistics April 1987 5

LABOUR
2.4 REPORTED VACANCIES BY INDUSTRY GROUP
International Standard Industrial Classification (I.S.I.C.) 4th quarter 1985 3rd quarter 1986 4th quarter 1986
Major Division 3 Manufacturing 15 081 32085 25764
Food 101 262 230
Beverages 11 112 112
Tobacco 2 4
Wearing apparel, except footwear 1 077 13 356 10 877
Leather and leather products, except footwear and wearing apparel 8 619 82 86
Footwear, except rubber, plastic and wooden footwear 37 120 78
Textiles 37 l 751 1 010
Wood and cork products except furniture 13 98 59
Furniture and fixtures, except primarily of metal 119 214 62
Paper and paper products 147 270 275
Printing, publishing and allied industries 214 510 518
Chemicals and chemical products 76 153 129
Products of petroleum and coal 3
Rubber products 53 44 24
Plastic products 733 2 589 l 544
Non-metallic mineral products, except products of petroleum and coal 24 88 116
Basic metal industries 19 105 82
Fabricated metal products, except machinery and equipment 475 2 119 l 502
Machinery, except electrical 405 973 803
Electrical machinery, apparatus, appliances and supplies 1 860 6 741 6 118
Transport equipment 37 44 65
Scientific, measuring and controlling equipment not elsewhere classified, and photographic and optical goods 614 l 596 999
Other manufacturing industries 407 856 l 070
Major Division 6 Wholesale, retail and import/export trades, restaurants and hotels§ 5527 8525 10848
Wholesale 733 665 955
Retail l 437 2 251 3 105
Import/ export 2 322 3 477 3 902
Restaurants, cafes and bars 824 1 784 2 389
Hotels and boarding houses 211 347 496
Major Division 1i Transport, storage and communication 574 1054 963
Land transport 84 144 118
Water transport 65 225 118
Air transport 21 43 56
Services allied to transport (including storage) 313 446 432
Communication 90 197 241
Major Division 8 Financing, insurance, real estate and business services 2352 2933 3299
Financial institutions 342 446 588
Insurance 341 274 314
Real estate 251 363 417
Machinery and equipment rental and leasing 8 3 7
Business services except machinery and equipment rental and leasing 1 411 1 847 1 972
§Figures for ISIC Major Division 6 as from the second quarter of 1986 were based on the up-to-date industry codes obtained from the results of an industry updating exercise. (see Explanatory Notes). tThe coverage is as. yet incomplete.
6 Hong Kong Monthly Digest of Statistics April 1987

LABOUR
2.5 ESTABLISHMENTS AND PERSONS ENGAGED IN SELECTED MAJOR DIVISIONS BY EMPLOYMENT SIZE
Size of establishment Establish-(number of persons engaged) ments
Major Division 3 Manufacturing
l-9
l()-19
2()-49
5()-99
10()-199
200-499
50()-999
l 00()-l 999
2000& over
48992
33 022
7 028
5 342
2095
942
424
104
31
4
Size of establishment Establish-(numberof persons engaged) ments
Major Division 6 Wholesale, retail and import/export trades, restaurants and hotels
Wholesale, retail and import/export trades:
l-4
5-9
ICl-19
20-49
5()-99
10()-199
200-499
50()-999
l 00()-1 999
Restaurants and hotels:
1-4
5-9
1()-19
20-49
5()-99
10()-199
200-499
50()-999
I OOCl-l 999
85 515
65 600
l3 434
4428
I 597
296
l!O
46
3
6832
I 939
1646
1437
1109
330
245
104
18
4
Size of establishment Establish-(numberof personsengaged) ments
Major Division 8 Financing, insurance, real estate and business services
1-4
5-9
lCl-19
20-49
5()-99
10()-199
200-499
50()-999
l 00()-1 999
2000 &over
14 651
8 621
2 756
I 813
969
280
123
67
17
3rd quarter 1984
Persons engaged
Male Female
448592
92155
57100
83 082
61 366
51960
54509
29215
14140
5 065
456117
32258
37 203
81396
80 986
76724
72402
42147
26 688
6 313
2nd quarter 1984
Persons engaged Male Female
244 542
87 702
57 270
39 515
29 866
12 311
8 839
7 474
1127
438
121844
3 112
7 920
14 708
25 065
16 535
23 460
18 078
9 296
3 670
131027
49100
27 200
17 630
15 309
7 734
6 226
6 054
844
930
51181
2 ll8
3 100
4908
8 279
6 300
ll 182
9908
4 297
l 089
I st quarter 1984
Persons engaged Male Female
103 939
ll 296
ll 359
14122
16 650
11 693
lO 826
l3 174
8 058
2406
4 355
61093
5 921
6 742
lO 287
ll 686
7 866
6 188
7 485
3 047
1182
689
Hong Kong Monthly Digest of Statistics April 1987
Total
904709
124 413
94 303
164 478
142 352
128 684
126 9ll
71 362
40 828
ll 378
Total
375 569
136 802
84470
57 145
45 175
20045
15 065
13 528
1971
l 368
173 025
5 230
ll 020
19 616
33 344
22 835
34642
27 986
13 593
4759
Total
165 032
17 217
18 101
24409
28 336
19 559
17 014
20 659
ll 105
3 588
5 044
Establishments
48065
32 827
6 760
5040
2016
904
393
99
23
Establishments
94545
72 837
14 584
4868
1 751
326
120
53
7309
2241
1 794
1 523
l 063
330
235
101
18
4
Establishments
15532
9 354
2 837
l 853
991
274
127
74
17
3rd quarter 1985
Persons engaged Male Female
423 661
90 513
54096
78 395
59451
49 338
50098
26 507
lO 316
4947
425239
30 778
36060
75 766
77 659
73 396
67 168
40 750
18 827
4 835
2nd quarter 1985
Persons engaged Male Female
265433
95 772
61 524
42422
32106
14164
9 173
8 420
1447
405
121490
3 479
8 559
15 384
23 864
16 576
22 386
18 274
9 321
3 647
148 746
54 834
30492
20 564
17934
8 362
6969
6 884
l 817
890
53009
2 376
3 437
5 103
7 963
6 862
ll 402
lO 310
4440
1116
lst quarter 1985
Persons engaged Male Female
107 410
12034
ll 488
14 335
17091
ll 286
ll 033
14146
8 621
2 544
4 832
64221
6448
7093
lO 661
12162
7714
6276
8 481
3 365
ll4
1907
Total
848900
121291
90 156 .
154161
137 110
122 734
ll7 266
67 257
29 143
9 782
Total
414179
150606
92 016
62986
50040
22 526
16142
15 304
3 264
1295
174 499
5 855
ll 996
20487
31827
23 438
33 788
28 584
13 761
4 763
Total
171631
18 482
18 581
24996
29 253
19 OOO
17 309
22 627
ll 986
2 658
6739
Establishments
48623
32 987
7010
5 084
2115
889
414
93
27
4
Establishments
97459
74 815
15 113
5161
1848
333
129
53
7651
2433
1908
l 541
l 051
339
246
lll
17
Establishments
16959
10440
3 036
l 879
l 071
298
129
84
15
4
3rd quarter 1986
Persons engaged Male Female
438 001
91570
56 430
80 038
62 951
49 726
52 256
26 814
12433
5 783
431 752
32 217
37 274
76419
80 925
70 523
68 690
37 534
21 927
6243
2nd quarter 1986
Persons engaged
Male Female
271552
97 408
62412
43 816
33 277
l3 953
lO 171
8176
2 339
123 915
3 845
9013
15 571
23 223
16253
22 722
19702
9 247
4 339
159 721
58 539
32 878
22 857
19641
8920
7 478
7 309
2099
55576
2 637
3 758
5 274
8134
7101
ll 685
ll 8ll
3 716
1460
lst quarter 1986
Persons engaged Male Female
115461
13 133
12 144
14498
17 799
12 710
lO 741
16481
7 753
4177
6025
70241
7 563
7 713
lO 818
l3 657
7 973
6647
9 OOO
2 758
643
3 469
Total
869753
123 787
93 704
156 457
143 876
120 249
120946
64 348
34 360
12026
Total
431273
155 947
95 290
66 673
52918
22 873
17 649
15 485
4438
179 491
6482
12 771
20 845
31 357
23 354
34407
31 513
12 963
5 799
Total
185 702
20 696
19 857
25 316
31456
20 683
17 388
25 481
lO 5ll
4820
9494
7

LABOUR
Purpose
General public services
General administration
Public order and safety
Police
Judiciary and correctional services
Fire protection
Defence
Education
Health
Social security and welfare services
Housing and community amenities
Housing
Community infrastructure
Sanitary services
Other community and social services
Recreation and related cultural serviCes
Economic services
8
Agriculture, fisheries and forestry
Mining, manufacturing
Water
Land transport
Water transport
Air transport
Commerce and industry
Post services
Total
2.6 EMPLOYMENT IN GOVERNMENT SERVICE
January 1986 April 1986 July 1986 October 1986 January 1987
Male Female Total Male Female Total Male Female Total Male Female Total Male Female Total
49 115 16 579 65 694 49 363 16 712 66 075 49 522 16 918 66 440 49 875 17 121 66 996 50 172 17 228 67 400
10417 9563 19980 10 474 9 658 20 132 10 512 9 780 20 292 10 822 9 739 20 561 10 747 10 OOO 20 747
38 698 7 016 45 714 38 889 7 054 45 943 39 010 7 138 46 148 39 053 7 382 46 435 39 425 7 228 46 653
25 771 4 793 30 564 25 950 4 822 30 772 25 982 4 880 30 862 26 176 4 927 31 103 26 289 4 982 31 271
6 546 2 007 8 553 6 541 2 014 8 555 6 509 2 038 8 547 6 495 2 037 8 532 6496 2011 8507
6 381 216 6 597 6 398 218 6 616 6 519 220 6 739 6 382 418 6 800 6 640 235 6 875
203 28 231 202 29 231 199 29 228 201 33 234 201 33 234
3 633 3 445 7 078 3631 3443 7074 3 726 3 341 7 067 3 766 3 441 7 207 3658 3517 7175
9 670 14 968 24 638 9 691 15 151 24 842 9-836 15 323 25 159 9 864 15 474 25 338 9 948 15 721 25 669
1 325 I 744 3 069 I 321 I 761 3 082 I 336 I 780 3 116 1360 1812 3172 I 390 I 837 3 227
35 960 7 306 43 266 35056 8217 43273 34 781 8 265 43 046 35 151 8 296 43 447 35 221 8 126 43 347
9139 1909 11048 9 117 I 973 11 090 9 286 2 003 11 289 9 395 2 019 11 414 9 616 I 830 11 446
12 238 I 905 14 143 12 188 I 903 14 091 11 932 I 906 13 838 II 907 1908 13 815 11 864 I 903 13 767
14 583 3 492 18 075 13 751 4 341 18 092 13563 4356 17919 13 849 4 369 18 218 13 741 4 393 18 134
3 943 1 563 5 506 3 880 I 592 5 472 3 899 I 607 5 506 3 838 I 646 5 484 3 919 I 649 5 568
3 943 I 563 5 506 3 880 I 592 5 472 3 899 I 607 5 506 3 838 I 646 5 484 3 919 I 649 5 568
21 620 3 789 25 409 21 635 3 797 25 432 21 962 3 790 25 752 21 648 3 827 25 475 21 618 3 856 25 474
2 145 252 2 397 2 138 248 2 386 2 120 238 2 358 2 078 241 2 319 2 088 239 2 327
4 640 240 4 880 4 630 244 4 874 4927 249 5176 4 588 251 4 839 4 518 244 4 762
4 213 577 4 790 4 222 580 4 802 4 274 563 4 837 4 267 566 4 833 4 279 579 4 858
1 269 376 1 645 1 253 393 I 646 I 249 394 I 643 I 243 389 1 632 I 234 390 I 624
711 149 860 717 149 866 721 149 870 721 147 868 718 149 867
429 157 586 434 160 594 427 165 592 426 169 595 418 170 588
4 034 I 792 5 826 4055 1776 5831 4068 I 779 5 847 4092 1801 5 893 4 105 1 824 5 929
4179 246 4425 4 186 247 4 433 4176 253 4 429 4 233 263 4 496 4 258 261 4 519
125 469 49 422 174 891 124 779 50 702 175 481 125 261 51 053 176 314 125 703 51 650 177 353 126127 51 967 178 094
Hong Kong Monthly Digest of Statistics April 1987

Industry
Major Division 2 Mining and quarrying
Metal ore mining
Other mining
Major Division 3 Manufacturing
Food
Beverages
Tobacco
Wearing apparel, except
LABOUR
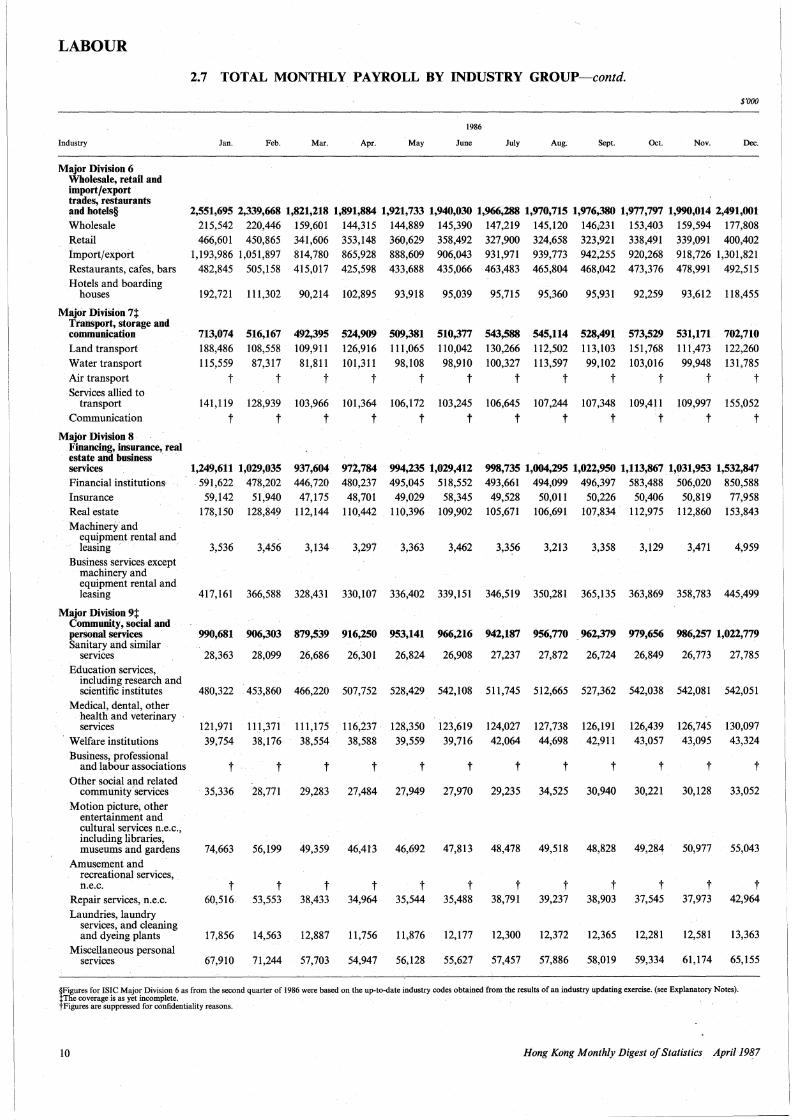
2.7 TOTAL MONTHLY PAYROLL BY INDUSTRY GROUP
$'000
1986
Jan. Feb. Mar. Apr. May June July Aug. Sept. Oct. Nov. Dec.
4,886 4,006 3,418 3,313 3,334 2,758 3,289 3,358 3,365 3,910 3,638 4,278
4,886 4,006 3,418 3,313 3,334 2,758 3,289 3,358 3,365 3,910 3,638 4,278
3,313,554 2,623,610 2,432,092 2,505,616 2,605,555 2,622,206 2,711,364 2,702,735 2,665,969 2,711,250 2,701,678 2,977,553
76,877
30,417
10,439
62,204
17,308
6,071
51,688
17,816
5,599
54,134 53,789 54,925 55,268
19,662 20,567 21,006 20,932
5,805 6, 138 5,492 5,596
55,364
21,396
5,793
57,652
21,798
5,834
56,411
20,876
6,491
56,629
19,419
5,988
65,345
24,900
8,377
footwear 949,575 685,558 728,320 727,299 752,379 750,886 786,368 778,671 765,689 790,830 807,768 895,378
Leather and leather products, except footwear and wearing apparel
Footwear, except rubber, plastic and wooden footwear
Textiles
Wood and cork products, except furniture
Furniture and fixtures, except primarily of metal
Paper and paper products
Printing, publishing and allied industries
Chemicals and chemical products, including products of petroleum and coal
Rubber products
Plastic products
Non-metallic mineral products, except products of petroleum and coal
Basic metal industries
Fabricated metal products, except machinery and equipment
Machinery, except electrical
Electrical machinery, apparatus, appliances and supplies
Transport equipment
Scientific, measuring and controlling equipment not elsewhere classified and photographic and
9,818 8,729 7,189 7,572 7,641 7,469
33,579 24,351 23,893 22,998 25,418 25,905
492,927 381,916 340,609 366,452 393,728 391,827
12,860
25,477
55,070
153,791
16,957
24,559
55,087
133,445
11,227
20,425
39,413
107,165
11,315 11,589
22,701 23,217
42, 779 44,225
115,944 119,275
11,217
23,168
46,278
119,725
8,118 8,185 8,313 9,457
27,846 25,828 25,267 28,441
398,485 402,680 393,902 409,923
11,559
23,218
47,675
116,837
11,626
24,050
47,205
117,269
11,417
23,734
45,737
117,561
11,661
24,304
44,999
114,321
9,629 10,584
29,756 30,163
399,707 449,620
11,725
24,911
43,811
112,740
12,969
25,467
47,905
126,921
33,897 27,391 26,198 26,827 27,393 26,989 28,631 28,137 27,448
6,663
258,215
28,410 27,712 36,072
7,826 6,984
305,906 255,943
20,270 16,623
19,875 12,680
198,123 203,057
90,773 80,115
6,118 6,113 6,237 6,182 6,640 6,482
228,695 234,276 246,082 254,054 267,647 263,873
14,881
12,860
157,436
68,206
17,736
13,033
160,242
70,333
17,906
13,399
166,679
72,376
17,728
13,120
168,670
71,801
17,258
12,290
178,090
78,972
17,633
12,363
177,131
79,960
17,415
12,965
174,506
78,397
6,680 6,678 6,775
239,122 231,407 239,769
15,754
13,260
172,032
76,613
15,975
13,569
171,669
76,868
20,012
14,231
183,469
88,938
428,162 321,876 301,170 314,057 322,434 328,262 357,845 356,353 350,158 355,598 352,041
66,522
398,402
85,996 60,649 61,211 62,905 62,468 60,685 62,727 62,719 65,329 68,138 69,627
optical goods 147,490 116,847 117,969 118,162 124,937 128,582 111,835 110,700 109,812 120,611 119,977 120,939
Other manufacturing industries 124,406 105,260 84,004 85,271 87,678 88,235 87,527 89,317 88,157 97,318 97,177 101,690
Major Division 4 Electricity and gas 76,642 69,065 66,782 67,085 70,059 70,176 73,783 75,742 107,494 78,136 74,737 101,444
9 Hong Kong Monthly Digest of Statistics April 1987
IL ____ _
LABOUR
2.7 TOTAL MONTHLY PAYROLL BY INDUSTRY GROVP~contd.
$'000
1986
Industry Jan. Feb. Mar. Apr. May June July Aug. Sept. Oct. Nov. Dec.
Major Division 6 Wholesale, retail and import/export trades, restaurants and hotels§ 2,551,695 2,339,668 1,821,218 1,891,884 1,921,733 1,940,030 1,966,288 1,970,715 1,976,380 1,977,797 1,990,014 2,491,001 Wholesale 215,542 220,446 159,601 144,315 144,889 145,390 147,219 145,120 146,231 153,403 159,594 177,808
Retail 466,601 450,865 341,606 353,148 360,629 358,492 327,900 324,658 323,921 338,491 339,091 400,402 Import/ export 1,193,986 1,051,897 814,780 865,928 888,609 906,043 931,971 939,773 942,255 920,268 918,726 1,301,821
Restaurants, cafes, bars 482,845 505,158 415,017 425,598 433,688 435,066 463,483 465,804 468,042 473,376 478,991 492,515 Hotels and boarding
192,721 houses 111,302 90,214 102,895 93,918 95,039 95,715 95,360 95,931 92,259 93,612 118,455
Major Division 7t Transport, storage and communication 713,074 516,167 492,395 524,909 509,381 510,377 543,588 545,114 528,491 573,529 531,171 702,710
Land transport 188,486 108,558 109,911 126,916 111,065 110,042 130,266 112,502 113,103 151,768 111,473 122,260
Water transport 115,559 87,317 81,811 101,311 98,108 98,910 100,327 113,597 99,102 103,016 99,948 131,785
Air transport t t t t t t t t t t t t Services allied to
transport 141,119 128,939 103,966 101,364 106,172 103,245 106,645 107,244 107,348 109,411 109,997 155,052
Communication t t t t t t t t t t t t Major Division 8
Financing, . insurance, real estate and business services 1,249,611 1,029,035 937,604 972,784 994,235 1,029,412 998,735 1,004,295 1,022,950 1,113,867 1,031,953 1,532,847
Financial institutions 591,622 478,202 446,720 480,237 495,045 518,552 493,661 494,099 496,397 583,488 506,020 850,588
Insurance 59,142 51,940 47,175 48,701 49,029 58,345 49,528 50,0ll 50,226 50,406 50,819 77,958 Real estate 178,150 128,849 112,144 ll0,442 ll0,396 109,902 105,671 106,691 107,834 112,975 112,860 153,843 Machinery and
equipment rental and leasing 3,536 3,456 3,134 3,297 3,363 3,462 3,356 3,213 3,358 3,129 3,471 4,959
Business services except machinery and equipment rental and leasing 417,161 366,588 328,431 330,107 336,402 339,151 346,519 350,281 365,135 363,869 358,783 445,499
Major Division 9t Community, social and personal services 990,681 906,303 879,539 916,250 953,141 966,216 942,187 956,770 962,379 979,656 986,257 1,022,779 Sanitary and similar
services 28,363 28,099 26,686 26,301 26,824 26,908 27,237 27,872 26,724 26,849 26,773 27,785
Education services, including research and scientific institutes 480,322 453,860 466,220 507,752 528,429 542,108 5ll,745 512,665 527,362 542,038 542,081 542,051
Medical, dental, other health and veterinary
121,971 services 111,371 111,175 ll6,237 128,350 123,619 124,027 127,738 126,191 126,439 126,745 130,097
Welfare institutions 39,754 38,176 38,554 38,588 39,559 39,716 42,064 44,698 42,9ll 43,057 43,095 43,324
Business, professional and labour associations t t t t t t t t t t t t
Other social and related community· services 35,336 28,771 29,283 27,484 27,949 27,970 29,235 34,525 30,940 30,221 30,128 33,052
Motion picture, other entertainment and cultural services n.e.c., including libraries, museums and gardens 74,663 56,199 49,359 46,413 46,692 47,813 48,478 49,518 48,828 49,284 50,977 55,043
Amusement and recreational services, n.e.c. t t t t t t t t t t t t
Repair services, n.e.c. 60,516 53,553 38,433 34,964 35,544 35,488 38,791 39,237 38,903 37,545 37,973 42,964
Laundries, laundry services, and cleaning and dyeing plants 17,856 14,563 12,887 ll,756 ll,876 12,177 12,300 12,372 12,365 12,281 12,581 13,363
Miscellaneous personal services 67,910 71,244 57,703 54,947 56,128 55,627 57,457 57,886 58,019 59,334 61,174 65,155
§Figures for ISIC Major Division 6 as from the second quarter of 1986 were based on the up-to-date industry codes obtained from the results of an industry updating exercise. (see Explanatory Notes). tThe coverage is as yet incomplete. tFigutes are suppressed for coi1fidentiality reasons.
10 Hong Kong Monthly Digest of Statistics April 1987

2.8 NOMINAL AND REAL INDEXES OF PAYROLL PER PERSON ENGAGED BY INDUSTRY GROUP
Industry
Major Division 2 Mining and quarrying
Metal ore mining
Other mining
Major Division 3 Manufacturing
Food
Beverages
Tobacco
Wearing apparel, except footwear
Leather and leather products, except footwear and wearing apparel
Footwear, except rubber, plastic and wooden footwear
Textiles
Wood and cork products, except furniture
Furniture and fixtures, except primarily of metal
Paper and paper products
Printing, publishing and allied industries
Chemicals and chemical products
Rubber products
Plastic products
Non-metallic mineral products, except products of petroleum and coal
Basic metal industries
Fabricated metal products, except machinery and equipment
Machinery, except electrical
Electrical machinery, apparatus, appliances and supplies
Transport equipment
Scientific, measuring and controlling equipment not elsewhere classified and photographic and optical goods
Other manufacturing industries
Major Division 4 Electricity and gas
Dec. 85
176.8
176.2
212.2
222.3
179.6
228.3
232.9
153.5
190.6
202.4
190.8
198.l
199.6
217.2
213.1
158.8
219.3
240.7
161.7
201.0
164.4
210.4
198.6
174.6
213.9
299.6
Mar. 86
181.3
180.7
203.6
197.6
167.6
218.3
215.0
153.l
197.0
193.5
195.3
190.7
194.0
204.6
175.6
147.7
216.l
216.4
160.5
202.l
169.6
204.5
201.9
181.4
211.5
219.2
Hong Kong Monthly Digest of Statistics April 1987
Nominal Index
June 86
182.1
181.4
208.5
206.0
194.2
206.0
216.3
161.3
210.6
211.4
189.6
206.6
213.0
218.4
169.9
142.l
210.4
233.1
167.3
207.3
174.l
208.6
208.5
179.0
213.6
229.3
(June 1980= 100)
Sept. 86
185.0
184.3
215.9
214.5
202.7
222.8
222.3
171.0
198.6
215.2
196.2
211.6
210.5
214.2
180.2
158.2
227.6
239.4
176.6
215.0
182.4
227.0
216.0
173.1
215.9
349.9
Dec. 86
235.2
234.3
242.4
246.0
237.1
316.3
259.9
215.0
228.6
244.9
220.7
222.5
223.5
231.8
244.8
168.5
215.5
270.3
180.2
232.6
207.3
258.1
225.9
193.4
252.2
325.6
Dec. 85
111.3
111.0
133.6
140.0
113.1
143.8
146.7
96.7
120.0
127.5
120.2
124.7
125.7
136.8
134.2
100.0
138.1
151.6
101.8
126.6
103.5
132.5
125.l
109.9
134.7
188.7
Real Index
Mar. 86
113.0
112.6
126.9
123.2
104.5
136.l
134.0
95.4
122.8
120.6
121.7
118.9
120.9
127.5
109.5
92.1
134.7
134.9
100.0
126.0
105.7
127.5
125.8
113.l
131.8
136.6
June 86
112.0
111.6
128.2
126.7
119.4
126.7
133.0
99.2
129.5
130.0
116.6
127.l
131.0
134.3
104.5
87.4
129.4
143.4
102.9
127.5
107.l
128.3
128.2
110.1
131.4
141.0
LABOUR
Sept. 86
112.9
112.5
131.8
131.0
123.7
136.0
135.7
104.4
121.2
131.4
119.8
129.2
128.5
130.8
110.0
96.6
138.9
146.2
107.8
131.3
111.4
138.6
131.9
105.7
131.8
213.6
Dec. 86
142.8
142.3
147.2
149.4
144.0
192.0
157.8
130.5
138.8
148.7
134.0
135,1
135.7
140.7
148.6
102.3
130.8
164.1
109.4
141.2
125.9
156.7
137.2
117.4
153.1
197.7
11

LABOUR
2:s NOMINAL AND REAL INDEXES OF PAYROLL PER PERSON ENGAGED BY INDUSTRY' GROUP-contd.
Industry
Major Division 6 Wholesale, r:etail and import/export trades, restaurants and hotels Wholesale
Retail
Import/export Restaurants, cafes, bars
Hotels and boarding houses
Major Division 1i Transport, storage and communication Land transport
Water transport Air transport
Services allied to transport
Communication
Major Division 8 Financing, insurance, real estate and business services
Financial institutions
Insurance Real estate
Machinery and equipment rental and leasing
Business services except machinery and equipment rental and leasing
Major Division 9* Community, social and personal services Sanitary and similar
services Education services,
including research and scientific institutes
Medical, dental, other health and veterinary services
Welfare institutions
Business, professional and labour associations
Other social and related community services
Motion picture, other entertainment and cultural services n.e.c., including libraries, museums and gardens
Amusement and recreational· services, n.e.c.
Repair services, n.e.c. Laundries, laundry
services, and cleaning and dyeing plants
Miscellaneous personal services
Dec. 85
229.2
218.1 209.8
242.7
186.7
312.0
241.6
184.0 232.9
t
249.8
t
279.3 348.0
295.3
285.0
334.0
199.7
222.2
155.1
241.1
210.4
220.4
t
275.3
238.9
t 171.1
158.3
176.4
tTue coverage is as yet incomplete. tFigures are suppressed for confidentiality reasons.
Mar. 86
201.8 193.0
190.3 199.9
185.7
233.1
198.0
190.1
169.4
t
199.8
t
195.7
213.4
184.5 219.8
249.8
171.7
218.3
157.5
240.9
216.0
213.5
t
234.6
233.8
t 155.0
154.7
176.0
Nominal Index
June 86
209.5 194.7
202.0 210.2
185.8
235.7
203.1 191.8
203.8
t
193.0
t
210.8
245.6
224.1 208.9
246.2
172.5
239.8
152.2
280.7
239.2
224.2
t
227.0
223.5
t 147.9
151.9
168.6
(June 1980=100)
Sept. 86
212.0 198.2
185.7 212.5
198.2
234.9
208.2 194.6
204.7
t
198.4
t
·207.5
231.6
183.0
210.5
235.8
183.6
238.4
158.6
270.7
242.3
237.6
t
251.5
219.9
t 159.4
153.8
177.7
Dec. 86
264.9 237.6
227.6
~90.8
207.2
291.7
274.1 209.0
273.0
t
281.9
t
305.8 392.8
273.3
293.3
337.3
220.3
251.9
171.9
275.4
248.0
233.8
t
263.3
246.4
t 177.8
168.0
194.6
Dec.85
144.3 137.3
132.1
152.8
117.6
196.5
152.1
115.9 146.7
t
157.3
t
175.9 219.1
186.0
179.5
210.3
125.8
139.9
97.7
151.8
132.5
138.8
t
173.4
150.4
t 107.7
99.7
111.1
Real Index
Mar. 86
125.8 120.3
118.6
124.6
115.8
145.3
123.4
118.5
105.6
t
124.5
t
122.0
133.0
115.0 137.0
155.7
. 107.0
136.1
98.2
150.2
134.6
133.l
t
146.2
145.7
t 96.6
96.4
109.7
June86
128.8 119.7
124.2
129.3
114.3
145.0
124.9
118.0 125.3
t
118.7
t
129.6
151.0
137.8 128.5
151.4
106.l
147.5
93.6
172.6
147.1
137.9
t
139.6
137.5
t 91..0
93.4
103.7
Sept. 86
129.4.
121.0
113.4 129.7
121.0
143.4
127.1
118:8
125.0
t
121.2
t
126.7
141.4
111.7 128.5
144.0
112.l
145.5
96.8
165.3
147.9
' 145.l
t
153.5
134.3
t 97.3
93.9
108.5
Dec. 86
·160.8 144.3
138.2 176.6
125.8
177.l
166.4
126.9
165.8
t
171.2
t
185.7 238.5
165.9
178.l
204.8
133.7
152.9
104.4
167.2
150.6 142.0
t
159.9
149.6
t 107.9
102.0
118.2
12 Hong Kong Monthly Digest of Statistics April 1987

Nominal wage index
Overall
Manufacturing
Bakery products
Garments
Gloves
Handbags
Footwear
Cotton spinning and weaving
Knitting
Bleaching and dyeing
Wooden furniture and fixtures
Paper boxes
Printing
Plastic products
Metal products
Wrist watch bands
Electrical appliances
Electronics
Boatyards and shipyards
Photographic and optical goods
Watches and clocks
Jewellery
Wholesale/retail trades, restaurants and hotels
Wholesale
Retail
Import/ export
Restaurants, exclusively Chinese
Restaurants, other than Chinese
Hotels
Transport services
Air freight forwarder/travel agency
Business services
Banks
Insurance
Technical consultancy firms
Personal services
Sanitary and similar services
Motor vehicle repairing
Real wage index
Overall
tData suppressed for confidentiality reasons.
1984
Dec.
120.6
119.4
117.8
114.6
131.4
114.3
106.2
118.1
121.5
121.4
102.8
120.7
125.2
119.3
119.5
114.7
133.3
124.6
129.7
136.9
121.5
112.1
t
108.0
108.0
97.5
2.9 WAGE INDEXES
(Mar. 82 = 100)
Mar.
124.1
122.9
123.6
117.2
133.8
116.5
106.2
123.0
123.1
126.0
106.2
121.9
127.3
121.7
122.0
120.1
140.5
128.2
136.1
152.6
126.9
116.2
t
1985
June
126.0
124.5
124.5
117.6
135.7
118.5
105.9
126.0
125.7
131.0
111.0
131.2
133.7
123.9
125.0
125.5
141.5
130.0
137.2
154.3
128.9
117.0
t
Sept.
127.0
125.3
125.8
117.5
138.7
120.7
105.6
126.4
125.3
131.7
112.8
131.4
134.6
123.1
126.7
125.7
143.2
132.5
142.2
155.5
131.7
116.5
t
Dec.
127.7
126.0
137.6
118.0
139.1
122.1
106.3
127.2
126.3
132.1
113.5
130.8
134.3
123.5
127.7
124.6
142.l
133.3
144.0
160.4
131.8
116.5
t
114.2 118.6 124.7 123.7
114.2 118.6 124.7 123.7
98.7 99.8 98.8 100.5
Craftsmen and other operatives
Mar.
130.4
128.7
135.2
119.4
140.9
122.3
106.7
132.7
128.6
137.5
115.4
132.7
136.5
127.4
132.3
128.3
150.2
136.3
144.l
167.5
139.7
117.4
t
1986
June
132.6
130.8
139.5
122.0
141.9
123.3
106.9
136.4
131.4
144.0
113.4
138.7
139.7
128.8
134.0
128.7
152.5
136.9
145.0
169.0
142.0
119.4
t
Sept.
134.3
132.3
141.4
122.3
144.6
126.4
107.0
140.8
132.7
148.6
116.5
144.4
141.1
13004
137.3
133.6
154.8
139.9
150.l
170.4
141.8
116.7
t
Dec.
135.9
133.9
140.7
123.2
146.0
128.3
107.6
143.5
132.2
149.7
119.7
145.4
142.2
131.4
138.8
133.6
158.7
144.4
151.3
168.2
145.5
115.9
t
124.0 132.4 134.7 136.l
124.0 132.4 134.7 136.1
101.7 101.9 102.4 103.2
Hong Kong Monthly Digest of Statistics April 1987
LABOUR
Daily wages in Dec. 1986
($)
Male Female
132
128
126
127
101
106
134
112
119
138
138
145
135
120
122
123
104
115
138
110
134
189
t
162
162
100
101
101
t 110
85
92
109
103
107
104
t 114
104
78
81
79
84
93
93
93
119
t
77
Total
112
109
117
112
89
96
126
108
110
136
138
142
132
89
104
101
93
96
138
99
105
183
t
162
162
85
13

LABOUR
Nominal wage index
Overlill'
Manufacturing
Bakery products
Garments
Gloves
Handbags
Footwear
Cotton spinning and weaving
Knitting
Bleaching and dyeing
Wooden furniture and fixtures
PaperboJ1:es
Printing
Plastic products
Metal products
Wrist watch bands
Electrical appliances
Electronics
Boatyards and shipyards
Photographic and optical goods
Watches and clocks
Jewellery
Wholesale/retail trades, restaurants and hotels
Wholesall)
Retail
lmport/ell:port ·
Restaurants, eJ1:clusively Chinese
Restaurants, other than Chinese
Hotels
Transport services
Air freight forwarder/travel agency
Business services
Banks
Insurance
Technical consultancy firms
Personal services
Sanitary and similar services
Motor vehicle repairing
Real wage index
Overall
14
1984
Dec.
121.S
125.4
140.9
124.0
128.6
122.6
116.0
125.7
128.9
122.5
121.2
130.5
120.7
135.7
131.0
122.6
115.8
122.8
122.3
117.6
132.4
132.9
117.1
127.1
126.1
140.1
110.5
117.0
122.8
124.3
122.3
121.1
120.8
127.3
116.4
118.3
119.4
111.8
98.2
2.9 WAGE INDEXES-contd.
(Mar. 82 = 100)
S\J.pervisory, technical, clerical and miscellaneous non-production workers
Mar.
125.6
130.0
147.4
129.1
134,5
127.2
118.9
130.8
134.4
126.7
127.2
134.4
124.2
139.3
133.5
127.6
121.6
126.1
123.9
127.9
138.6
141.7
120.2
132.4
134.8
146.3
111.6
119.8
131.3
132.3
131.8
126.1
125.3
136.4
120.4
121.7
122.l
119.6
1985
June
127.4
133.6
149.9
133.2
135.5
130.7
120.2
133.5
139.5
133.8
131.2
143.4
129,2
142.6
134,8
129.3
122.7
129.6
126.7
129.1
142.0
144.5
120.0
137.2
132.2
150.6
110.7
121.3
132.7
133.6
134.3
129.9
129.0
142.7
122.5
123.0
123.5
119.7
99.9 100.9
Sept.
128.S
134.4
153.8
133.8
135.5
130.5
120.7
134.1
139,8
135.6
130.6
142.8
131.4
143,9
136.6
129.1
123.0
130.7
125.4
129.1
142.0
145.3
120.8
136.6
132.8
151.9
111.7
121.3
132.2
136.4
135.9
130.3
129.6
142.7
122.4
124.5
124.5
125.l
Dec.
129.S
134.7
163.4
133.9
137.3
131.0
120.6
135.0
140.6
137.4
132.1
141.8
131.6
143.4
135.9
129.9
123.0
131.3
125.5
129.8
141.9
144.1
122.6
137.1
138.9
156,0
112.9
121.4
132.2
136.7
135.6
131.0
130.1
144.5
122.7
124.7
124.9
123.5
99.9 102.0
Mar.
132.8
139.2
170.1
138.0
140.1
133.5
121.9
141.6
146.6
142.0
135.6
144.0
134.5
149.4
140.9
135.4
126.8
135.8
126.5
134.7
146.9
152.4
124.1
140.8
142.6
164.9
111.7
12_5.2
141.8
144.9
142.8
1986
June
135.4
142.8
170.3
141.8
142.6
133.7
124.6
147.0
15Q.4
146.4
135.2
151.5
140.4
153.2
143.3
137.0
129.3
137.8
130.3
135.6
152.2
159.5
125.4
145.7
145.4
167.9
112.0
128.4
145.4
145.8
143.7
135.4 139.8
134.5 · 139.4
149.5 150.7
126.7 131.9
126.1
126.0
127.2
129.9
129.4
133.2
Sept.
138.1
144.5
170.7
142.5
143.3
137.1
123.9
151.9
152.2
147,7
136.3
150.7
142.3
154.4
142.8
140.1
132.2
141.3
132.8
135.7
152.2
158.5
128.3
148.l
148.l
169.8
114.9
132.l
146.2
147.8
144.3
143.7
143.9
155.0
131.7
129.3
128.2
137.7
Dec.
139,S
146.0
169.0
143.4
143.6
143.4
125.8
157.9
152.4
150.3
137.7
152.7
143.3
155.9
144.4
139.2
134.0
140.8
133.1
141.9
153.7
161.1
130.1
149.5
152.7
170.6
116.8
132.8
146.3
148.5
145.0
143.6
143.8
155.6
131.7
132.6
131.7
139.4
103.S 104.1 105.3 105.9
Monthly salaries in Dec. 1986
($)
Male Female
3,882
3,764
3,101
3,530
3,542
3,626
3,284
3,732
3,786
4,465
3,187
3,515
3,885
3,862
3,233
3,687
3,495
3,878
4,576
4,230
3,732
4,949
3,894
3,544
5,120
5,123
3,829
3,763
3,251
4,142
3,388
2,960
3,016
2,656
2,991
2,645
2,951
2,717
2,488
3,117
3,041
2,737
3,232
3,077
3;086
2,793
2,642
2,929
3,229
3,567
3,110
2,930
\218
2,824
3,091
2,924
3,800
2,604
3,113
3,321
3,515
3,303
Total
3,504
3,433
3,027
3,225
3,107
3,277
3,076
3,285
3,497
4,136
3,061
3,440
3,634
3,581
3,080
3,308
3,329
3,560
4,437
3,760
3,284
3,905
3,493
3,453
3,711
4,595
3,382
3,593
3,274
4,002
3,360
4,819
4,610
4,543
5,936
4,283 4,541
2,137
1,819
4,022
4,404 4,499
3,687 4,042
4,346 . 5,464
1,411
l,323
2,858
1,773
1,559
3,690
2,948 2,248 2,661
Hong Kong Monthly Digest of Statistics April 1987

LABOUR
2.9 WAGE INDEXES-contd.
(Mar. 82 = 100)
All employees
1984 1985 1986
Dec. Mar. June Sept. Dec. Mar. June Sept. Dec.
Nominal wage index
Overall 121.l 124.9 126.7 127.8 128.6 131.6 134.0 136.2 137.7
Manufacturing 120.8 124.6 126.7 127.5 128.1 131.2 133.7 135.2 136.8 Bakery products 127.2 133.4 134.9 137.1 148.3 149.1 152.1 153.5 152.4 Garments 116.S 119.5 120.6 120.6 121.0 122.9 125.7 126.1 127.0 Gloves 131.1 133.9 135.7 138.3 138.9 140.8 142.0 144.4 145.7 Handbags 116.3 119.0 121.4 123.0 124.2 124.9 125.8 128.9 131.9 Footwear 107.9 108.3 108.3 108.l 108.7 109.2 109.8 109.8 110.6 Cotton spinning and weaving 120.5 125.5 128.4 128.8 129.6 135.5 139.8 144.3 148.1 Knitting 124.0 126.7 130.1 129.9 130.8 134.2 137.4 138.8 138.S Bleaching and dyeing 121.8 126.3 132.0 133.l 134.0 139.l 144.9 148.4 150.0 Wooden furniture and fixtures 105.4 109.2 113.9 115.5 116.3 118.4 116.6 119.S 122.4 Paper boxes 124.6 126.9 136.1 136.0 135.2 137.2 143.8 147.0 148.4 Printing 123.5 126.l 132.0 133.4 133.3 135.7 139.9 141.5 142.6 Plastic products 122.9 125.6 128.0 127.7 127.9 132.2 134.l 135.6 136.7 Metal products 123.3 125.8 128.3 130.1 130.5 135.3 137.2 139.3 140.8 Wrist watch bands 116.6 121.8 126.4 126.5 125.9 130.0 130.7 135.2 135.0 Electrical appliances 128.2 135.0 136.0 137.3 136.5 143.3 145.7 148.2 151.5 Electronics 124.1 127.7 130.0 132.1 132.8 136.2 137.2 140.3 143.5 Boatyards and shipyards 128.0 133.2 134.8 138.3 139.7 140.0 141.6 146.0 147.1 Photographic and optical
goods 132.8 147.2 148.8 149.8 153.6 160.2 161.5 162.6 162.6 Watches and clocks 124.6 130.3 132.6 134.6 134.7 141.8 145.0 144.8 147.9 Jewellery 117.3 122.S 123.7 123.S 123.3 125.8 128.9 126.6 126.5
Wholesale/retail trades, restaurants and hotels 117.1 120.2 120.0 120.8 122.6 124.l 125.4 128.3 130.l Wholesale 127.1 132.4 137.2 136.6 137.l 140.8 145.7 148.l 149.5 Retail 126.1 134.8 132.2 132.8 138.9 142.6 145.4 148.1 152.7 Import/ export 140.l 146.3 150.6 151.9 156.0 164.9 167.9 169.8 170.6 Restaurants, exclusively
Chinese 110.5 111.6 110.7 111.7 112.9 111.7 112.0 114.9 116.8 Restaurants, other than
Chinese 117.0 119.8 121.3 121.3 121.4 125.2 128.4 132.l 132.8 Hotels 122.8 131.3 132.7 132.2 132.2 141.8 145.4 146.2 146.3
Transport services 132.6 138.4 142.5 145.4 145.6 151.7 154.4 156.4 157.3 Air freight forwarder/travel
agency 122.3 131.8 134.3 135.9 135.6 142.8 143.7 144.3 145.0
Business services 121.1 126.l 129.9 130.3 131.0 135.4 139.8 143.7 143.6 Banks 120.8 125.3 129.0 129.6 130.1 134.5 139.4 143.9 143.8 Insurance 127.3 136.4 142.7 142.7 144.5 149.5 150.7 155.0 155.6 Technical consultancy firms 116.4 120.4 122.5 122.4 122.7 126.7 131.9 131.7 131.7
Personal services 116;8 120.6 122.4 124.6 124.5 125.8 130.2 130.0 133.1 Sanitary and similar services 119.4 122.1 123.5 124.5 124.9 126.0 129.4 128.2 131.7 Motor vehicle repairing 109.7 116.7 119.2 125.0 123.7 125.5 132.9 136.1 137.7
Real wage index
Overall 97.9 99.3 100.4 99.4 101.3 102.6 103.0 103.9 104.5
Hong Kong Monthly Digest of Statistics April 1987 IS

LABOUR
2.10 AVERAGE DAILY WAGES OF WORKERS ENGAGED IN GOVERNMENT BUILDING AND CONSTRUCTION PROJECTS
$
1985 1986
Occupation Nov. Dec. Jan. Feb. Mar. Apr. May June July Aug. Sept. Oct. Nov.
Male labourer 128.9 129.7 130.6 132.5 132.2 133.9 133.9 134.5 136.0 137.1 137.4 139.6 140.6 female labourer 102.5 103.3 104.8 104.9 105.7 106.9 107.9 108.3 108.3 111.0 110.9 110.8 114.l Concretor /Bricklayer /Drainla yer 184.8 185.5 188.9 191.l 189.4 192.1 193.6 194.0 193.0 194.6 197.2 199.6 201.0 Mason 197.4 199.2 192.3 194.3 193.8 195.0 193.5 189.4 187.7 187.1 182.8 189.6 181.3 Steel bender 236.5 237.9 238.9 238.9 238.6 239.5 239.9 241.8 245.4 256.4 263.5 265.6 266.6 Blacksmith 184.8 186.l 183.3 185.5 182.6 193.1 194.3 193.5 196.4 195.4 194.4 198.2 195.5 Carpenter and joiner 191.8 192.1 191.7 191.4 192.0 192.8 192.1 192.8 193.6 196.0 198.1 199.7 200.4 Plumber 173.7 176.0 178.8 180.0 179.6 186.4 184.6 187.7 192.3 193.0 196.3 197.1 198.7 Fitter 163.0 162.0 161.3 162.3 161.7 165.0 164.7 165.1 167.0 167.6 169.7 169.7 170.9 Plasterer 195.9 198.2 200.l 201.6 200.8 202.6 201.8 199.2 202.5 206.2 203.2 205.8 209.6. Terrazzo and granolithic worker 209.9 217.l 214.2 214.6 207.0 208.9 210.1 205.9 187.0 216.6 215.9 215.5 216.6 Glazier 181.9 179.8 187.7 183.7 182.8 181.6 182.6 191.0 209.6 204.7 205.8 208.0 201.0 Painter 173.4 177.0 178.0 178.3 176.3 180.8 181.1 179.4 180.5 183.6 188.4 194.6 192.1 Electrician 169.8 171.5 171.4 175.6 174.3 178.5 173.3 174.9 173.9 173.1 172.6 175.5 176.2 Plant operator 167.3 167.7 165.6 166.3 165.5 167.8 168.6 169.9 168.8 169.5 169.2 172.0 173.l Truck driver 150.8 151.7 152.6 152.3 151.6 154.7 153.5 155.0 146.7 153.7 156.1 159.0 158.3 Coolie 166.6 168.4 169.1 169.9 166.5 170.6 171.9 172.3 174.3 177.8 172.8 172.8 173.0 Pneumatic driller 178.5 179.5 178.2 183.0 183.0 181.7 188.9 188.1 183.6 188.4 195.1 195.4 196.7 Bamboo worker and scaffolder 223.9 223.2 224.7 221.4 222.0 227.9 223.8 227.0 229.1 231.5 230.1 235.6 234.5 Structural steel erector 205.8 219.7 196.6 193.4 201.2 208.6 213.6 212.8 212.8 211.9 211.4 213.9 211.7 Diver 336.8 332.9 327.7 345.5 356.6 361.7 364.3 332.7 329.7 342.4 367.0 368.8 371.6 Diver's linesman 145.3 148.7 156.6 162.5 154.0 156.0 158.9 161.2 159.9 158.8 164.5 160.2 162.9
2.11 STOPPAGES OF WORK BY INDUSTRY
1985 1985 1985 1985 1986 1986 1986 1986 1987 lst 2nd 3rd 4th lst 2nd 3rd 4th lst
1981 1982 1983 1984 1985 1986 qtr. qtr. qtr. qtr. qtr. qtr. qtr. qtr. qtr.
Number of work stoppages
Agriculture, forestry, fishing Mining and quarrying Manufacturing 28 27 4 4 2 3 1 1 Electricity, gas, water Construction 11 3 3 3 2 Wholesale and retail trades,
restaurants and hotels 3 2 Transport, storage,
communication 4 3 2 4 2 2 Financing, insurance, real
estate and business services 3 Community, social and
personal services Total 49 34 11 11 3 9 4 4 3
Working days lost Agriculture, forestry, fishing Mining and quarrying Manufacturing 8 536 16 975 I 300 2 185 I 080 2046 180 900 150 1 870 26 580 Electricity, gas, water Construction 880 530 66 102 Bit 28 103t Wholesale and retail trades,
restaurants and hotels 375 36 780 54 80 80 510 Transport, storage,
communication 4953 419 220 780! 2645 2645 25 Financing, insurance, real
estate and business services 575 164 85 85 Community, social and
personal services
Total 15 319 17 960 2 530 3121! 1160 4907!- 180 80 900 2 823 I 870 214!- 1 115
16 Hong Kong Monthly Digest of Statistics April 1987

Year/quarter
1981
1982
1983
1984
1985
1986
1984: 4th qtr.
1985: lstqtr. 2nd qtr. 3rd qtr. 4th qtr.
1986: lstqtr. 2nd qtr. 3rd qtr. 4th qtr.
Year/quarter
1981
1982
1983
1984
1985
1986
1984: 4th qtr.
1985: lst qtr. 2nd qtr. 3rd qtr. 4th qtr.
1986: 1 st qtr. 2nd qtr. 3rd qtr. 4th qtr.
Year/quarter
1981
1982
1983
1984
1985
1986
1984: 4th qtr.
1985: lst qtr. 2nd qtr. 3rd qtr. 4th qtr.
1986: I st qtr. 2nd qtr. 3rd qtr. 4th qtr.
Machinery: power driven
Fatal Nonfatal Total
18 13 236 13 254
20 12 562 12 582
25 11 871 11 896
8 12 812 12 820
10 9 969 9 979
14 10 440 10 454
3 774 3 775
I 505 2 2 731 2 2 399 2 2 676
6 1 166 2 2 613 2 2 572 4 4 089
I 505 2 733 2 401 2 678
I 172 2 615 2 574 4 093
Gassing, poisoning and other toxic substances
Fatal
4
I
4
3 I
Nonfatal
19
18
182
38
24
28
8
8 12 3 I
1 10 3
14
Fall of ground
Non-
Total
23
19
182
39
24
32
8
8 12 3 I
I 10 6
15
Fatal fatal Total
8 4
2
5 2
4 I
35
22
22 26
14
11
2
3 l 2 6
2 I 2 6
35
30
26
28
19
13
2
3 I 6 7
3 I 3 6
2.12 REPORTED OCCUPATIONAL ACCIDENTS
Machinery: non power driven
Fatal
3
Fatal
14
12
11
8
13
9
3
5 5 3
I 3 2 3
Nonfatal
644
530
469
437
322
328
115
52 84 68 91
29 70 96
133
Electricity
Nonfatal
170
190
141
131
88 164
35
7 15 31 32
15 42 49 58
Total
644
530
472
438
322
328
115
52 84 68 91
29 70 96
133
Total
184
202
152
139
101
173
38
7 20 36 35
16 45 51 61
Handling without machinery
Non-Fatal fatal Total
2 8 423 8 425
2 7 870 7 872
7 10 285 10 292
11 645 11 646
3 10 363 10 366
7 768 7 768
3 163 3 163
2 I 629 I 2 988 I 2 466
2 914
619 I 871 2 108 3 170
I 631 2 989 2467 2 914
619 I 871 2 108 3 170
Fatal
Transport
Nonfatal
64 2 687
47 2 780
Total
2 751
2 827
46 3 074 3 120
32 3 279 3 311
26 2 881 2 907
37 3 120 3 157
4
4 6 6
10
8 15 7 7
Fatal
973
438 758 716 821
372 798 871
I 079
Fall of person
Nonfatal
977
442 764 722 831
380 813 878
I 086
Total
68 5 900 5 968
70 7 116 7 186
50 7 701 7 751
47 7 874 7 921
39 7 994 8 033
49 11381 11430
12 2 375 2 387
4 I 192 9 1 907
12 I 749 17 2 397
11 1 507 15 2 900 9 2 769
14 4 205
Hand tool
Non-
1 196 I 916 I 761 2 414
I 518 2 915 2 778 4 219
Fatal fatal Total
6489
6 957
7 086
8 123
8 111
8 063
6489
6 957
7 086
8 123
8 Ill
8 063
2 478 2 478
I 272 2 118 I 903 2 267
995 2 063 I 972 3 033
1272 2 118 I 903 2267
995 2 063 I 972 3 033
Fatal
20
11
6
7 2
17
2
1 2
14
Explosion or fire
Nonfatal
393
460
521
569
584
519
206
92 144 126 162
57 149 119 194
Total
413
471
527
576
586
536
208
92 145 126 162
58 151 119 208
Stepping on or striking against object
Fatal Nonfatal Total
14 147 14 147
2 16 171 16 173
5 13 252 13 257
I 17 667 17 668
6 18 839 18 845
6 14 374 14 380
3 3
2 2 1 1
6 213 6 214
2450 4075 5 035 5 757
I 850 3 160 3 151 6 213
2450 4075 5 038 5 760
I 852 3 162 3 152 6 214
Miscellaneous or causes not yet assessed
Non-Fatal fatal Total
65 10 444 10 509
60 9 020 9 080
77 9 837 9 914
92 10 515 10 607
100 11 622 11 722
75 19 777 19 852
30 I 755 I 785
19 21 31 13
738 I 190 I 761 1 890
757 I 211 I 792 I 903
12 I 259 1 271 27 3 409 3 436 14 3 812 3 826 23 11 297 11 320
LABOUR
Hot or corrosive substance
Fatal
2
2
Nonfatal
3 161
3 444
Total
3 163
3 446
3 3 810 3 813
5 4 179 4 184
4 555 4 556
4918 4918
2 I 242 1 244
Fatal
604 I 120 I 168 I 395
441 I 147 I 375 I 955
Falling object
Nonfatal
13 3 410
10 3 739
9 2 644
12 3 659
11 3 974
8 5 989
604 I 120 I 169 1 395
441 I 147 I 375 I 955
Total
3 423
3 749
2 653
3 671
3 985
5 997
2 I 113 l 115
2 4 4 2
490 897 967
I 303
2 694 I I 436 2 1469 2 2 390
Grand total
Non-
492 901 971
1 305
696 1 437 I 471 2 392
Fatalt fatal Total
270 69 158 69 428
245 70 879 71 124
246 70 895 71 141
217 80954 81171
216 79 340 79 556
221 86 880 87 101
57 23 452 23 509
31 10480 10511 49 18 040 18 089 69 18 394 18 463 51 21 712 21 763
44 9 007 9 051 67 19 669 19 736 41 20 368 20 409 69 37 836 37 905
Note: The quarterly figures refer to cases reported to the Labour Department during the reference period. They also include late reported cases which occurred during the previous quarters. The annual figures have been revised with the inclusion of late reported cases which have not been reported during the reference year.
tincluding cases in which the employees died of natural causes.
Hong Kong Monthly Digest of Statistics April 1987 17

LABOUR
2.13 INDUSTRIAL ACCIDENTS IN 4ffi QUARTER 1986
Machinery Transport Gassing, poison- Miscel·
Prime Hot or ingand Stepping Hand- laneous mover Work· corro~ other on or ling &causes
and ingand Non Ex~lo- sive toxic Fall striking Fall without not yet trans- other Power power SI On sub• sub- Electri- of against Fal\filg of machin- Hand ascer- Grand
mission parts driven driven or fire stance stances city person · object obJect ground ery tool tained total
Food, beverages and tobacco 55 22 22 57 80 32 51 45 69 442
Textiles 30 381 115 4 160 165 368 99 181 Ill 289 1914
Wearing apparel, leather products and footwear 6 1294 20 36(13) 22 61 119 54 68 169 114 1964(13)
Furniture and wood products 134 2 14 40 30 41 35 33 331
Paper products, printing and allied industries 9 194 4 19 4 10 23 69 22 64 61 71 551
Products ?f'Chemicals, petroleum and rubber 12 6 10 7 16 8 6 72
Plastic products 287 13 4 38 36 136 70 116 92 118 916
Non-metallic otineral products 2 23 2 28(1) 40 21 32 15 39 211(1)
Basic metal industries 2 20 13 21 6 5 4 26 105
Fabricated metal products 10 549 13 4(1) 77 63 370(1) 161 293 85 355 1988(2)
Machinery, transport, scientific and other equipments 12 457 4 47 12 103 7 10 197 578 174 253 160 383 2 397
Other manufacturing industries 41 2 11 13 14 18 27 133
Electricity and gas 4 28(1) 21 10 2 II 9 7 93(1)
Construction 421(3) 25(1) 16 43 137 34(2) 1486(7) 2621 972 830 343 1473 8 410(13)
Land transport and allied industries 54 38 68 23 2 214 242 161 327 29 197 1356
Repair services not elsewhere specified 2 25 2 2 21 36 77 33 28 23 80 335
Other non-manufacturing industries 10 4(1) 9 10 65 40 17 42 17 24 239(1)
Industries not ascertained
Total 82 3 946(3) 95(2) 352 120(14) 670 12 56(2) 2497(9) 4 845(l) 187() 2372 1224 3 311 21457(31)
Note: Figures refer to'ibe total number of accidents with the number of fatalities given in brackets.
18 Hong Kong Monthly Digest of Statistics April 1987 ·

SECTION 3 EXTERNAL TRADE
3.1 EXTERNAL TRADE STATISTICS
$million
Imports Domestic Re- Total Merchan- Cumulative totals exports exports exports dise
trade Imports balance
% change % change on on
Year to previous 12 months previous Year/month date year to date 12 months
1981 138,374.78 80,423.21 41,739.47 122,162.68 -16,212.10 +23.94
1982 142,892.64 83,031.92 44,352.73 127,384.66 -15,507.98 +3.26
1983 175,442.38 104,405.17 56,294.22 160,699.40 -14,742.98 +22.78
1984 223,370.20 137,936.46 83,504.35 221,440.82 -1,929.38 +27.32
1985 231,419.71 129,881.86 105,270.41 235,152.27 +3,732.55 +3.60
1986 275,954.55 153,983.44 122,546.37 276,529.81 +575.26 +19.24
1985: Mar. 19,915.37 8,429.99 9,078.15 17,508.14 -2,407.23 53,999.90 +10.69 228,586.26 +20.25 Apr. 19,798.42 9,659.70 9,499.41 19,159.10 -639.32 73,798.45 +9.64 229,856.22 +17.82 May 19,215.82 10,816.06 9,328.03 20,144.09 +928.28 93,014.27 +7.93 230,205.06 +15.09 June 19,758.01 10,956.06 8,341.12 19,297.19 -460.82 112,772.28 +6.84 230,588.24 +12.53 July 18,862.03 11,576.58 8,914.73 20,491.31 +l,629.29 131,632.21 +5.00 229,641.52 +9.59 Aug. 19,116.49 11,982.37 8,817.52 20,799.89 + 1,683.41 150,748.34 +4.34 229,633.63 +7.53 Sept. 18,176.66 10,979.99 8,286.61 19,266.61 +1,089.94 168,957.08 +3.61 229,255.59 +5.82 Oct. 19,966.35 11,164.34 8,433.38 19,597.73 -368.63 188,923.43 +3.41 229,600.54 +5.01 Nov. 20,332.81 11,449.56 8,724.18 20,173.74 -159.07 209,240.17 +3.36 230,170.10 +3.98 Dec. 22,179.55 12,325.60 9,465.24 21,790.83 -388.72 231,419.71 +3.60 231,419.71 +3.60
1986: Jan. 18,806.24 10,529.84 8,562.98 19,092.82 +286.58 18,806.24 -1.63 231,107.14 +1.99 Feb. 16,982.81 8,346.73 6,876.40 15,223.13 -1,759.68 35,789.05 +5.00 233,124.24 +2.78 Mar. 19,882.74 10,269.29 8,565.66 18,834.94 -1,047.79 55,672.03 +3.10 233,091.85 +1.97 Apr. 22,477.31 11,348.10 9,560.00 20,908.09 -1,569.22 78,149.10 +5.90 235,770.37 +2.57 May 22,349.66 12,333'90 9,869.25 22,203.15 -146.50 100,498.76 +8.05 238,904.21 +3.78 June 22,836.01 12,545.75 9,598.62 22,144.36 -691.65 123,333.95 +9.37 241,981.39 +4.94 July 24,159.78 14,270.06 10,563.55 24,833.61 +673.83 147,493.73 +12.05 247,281.23 +7.68 Aug. 23,494.59 14,798.18 10,630.16 25,428.34 + 1,933.75 170,988.32 +13.43 251,659.69 +9.59 Sept. 23,450.82 13,939.85 11,130.74 25,070.59 +1,619.76 194,436.52 +15.08 256,899.15 +12.06 Oct. 28,005.66 15,359.55 12,291.68 27,651.23 -354.43 222,441.04 +17.74 264,937.33 +15.39 Nov. 26,046.24 14,869.59 12,275.09 27,144.67 +l,098.44 248,487.28 +18.76 270,666.83 +17.59 Dec. 27,467.96 15,364.94 12,626.47 27,991.42 +523.46 275,954.55 +19.24 275,954.55 +19.24
1987: Jan. 23,516.16 14,052.72 12,004.63 26,057.35 +2,541.20 23,516.16 +25.04 280,664.47 +21.44 Feb. 24,118.32 9,992.05 10,615.84 20,607.89 -3,510.42 47,634.47 +33.10 287,799.97 +23.45 Mar. 30,731.23 14,482.99 13,864.17 28,347.16 -2,384.06 78,365.70 +40.76 298,648.22 +28.12
$million
Cumulative totals
Domestic exports Re-exports Total exports
% change % change % change % change % change % change on on on on on on
Year to previous 12months previous Year to previous 12 months previous Year to previous 12 months previous Year/month date year to date 12 months date year to date 12months date year to date 12 months
1981 +17.97 +38.80 +24.35
1982 +3.24 +6.26 +4.27
1983 +25.74 +26.92 +26.15
1984 +32.12 +48.34 +37.80
1985 -5.84 +26.07 +6.19
1986 +18.56 +16.41 +17.60
1985: Mar. 28,975.78 +3.06 138,796.78 +21.87 25,473.19 +43.74 91,255,76 +45.16 54,448.97 +18.79 230,052.54 +30.15 Apr. 38,635.48 +0.19 138,008.77 +18.23 34,972.85 +46.87 94,665.53 +46.13 73,608.33 +18.01 232,674.31 +28.19 May 49,451.54 -1.64 137,113.01 +13.84 44,300.88 +45.40 97,336.41 +44.90 93,752.43 +16.11 234,449.42 +24.96 June 60,407.61 -3.56 135,703.35 +9.54 52,642.01 +41.39 98,915.38 +42.22 113,049.61 +13.19 234,618.73 +21.29 July 71,983.94 -4.95 134,184.95 +5.55 61,554.76 +39.05 100,789.49 +40.24 133,538.70 +11.28 234,974.44 +18.08 Aug. 83,966.31 -6.16 132,427.89 + 1.17 70,361.84 +36.79 102,426.79 +38:07 154,328.16 +9.52 234,854.68 +14.52 Sept. 94,942.33 -6.82 130,989.90 -2.00 78,648,16 +34.25 103,570.49 +35.81 173,590.49 +8.18 234,560.40 +11.74 Oct. 106,106.68 -7.22 129,681.35 -4.42 87,081.54 +30.99 104,108.08 +32.72 193,188.22 +6.83 233,789.43 +9.19 Nov. 117,556.26 -6.75 129,429.41 -5.52 95,805.72 +28.63 104,825.66 +29.89 213,361.98 +6.39 234,255.07 +7.61 Dec. 129,881.86 -5.84 129,881.86 -5.84 105,270.41 +26.07 105,270.41 +26.07 235,152.27 +6.19 235,152.27 +6.19
11 1986: Jan. 10,529.84 -5.70 129,245.92 -6.55 8,562.98 -4.41 104,875.40 +21.26 19,092.82 -5.12 234,121.32 +4.15
Feb. 18,876.57 -8.12 128,212.62 -8.98 15,439.38 -5.83 104,314.76 +17.43 34,315.95 -7.11 232,527.38 +1.23
1 I Mar. 29,145.85 +0.59 130,051.92 -6.30 24,005.04 -5.76 103,802.26 +13.75 53,150.89 -2.38 233,854.19 +1.65 Apr. 40,493.95 +4.81 131,740.32 -4.54 33,565.04 -4.03 103,862.60 +9.72 74,058.98 +0.61 235,602.92 +1.26
rl
May 52,827.85 +6.83 133,258.16 -2.81 43,434.29 -1.96 104,403.82 +7.26 96,262.14 +2.68 237,661.98 +1.37 June 65,373.59 +8.22 134,847.84 -0.63 53,032.89 +0.74 105,661.29 +6.82 118,406.48 +4.74 240,509.13 +2.51 July 79,643.65 +10.64 137,541.57 +2.50 63,596.44 +3.32 107,312.09 +6.47 143,240.09 +7.26 244,853.66 +4.20 Aug. 94,441.83 + 12.48 140,357.37 +5.99 74,226.60 +5.49 109,135.17 +6.55 168,668.43 +9.29 249,492.54 +6.23 Sept. 108,386.35 +14.16 143,325.88 +9.42 85,352.53 +8.52 111,974.78 +8.11 193,738.88 +11.61 255,300.66 +8.84 Oct. 123,745.90 +16.62 147,521.08 +13.76 97,644.22 +12.13 115,833.08 +11.26 221,390.12 +14.60 263,354.16 +12.65 Nov. 138,615.49 +17.91 150,941.09 +16.62 109,919.32 +14.73 119,384.01 +13.89 248,534.81 +16.49 270,325.09 +15.40
I Dec. 153,983.44 +18.56 153,983.44 +18.56 122,546.37 +16.41 122,546.37 +16.41 276,529.81 + 17.60 276,529.81 + 17.60
1987: Jan. 14,052.72 +33.46 157,506.33 +21.87 12,004.63 +40.19 125,988.01 +20.13 26,057.35 +36.48 283,494.34 +21.09 Feb. 24,044.TI +27.38 159,151.65 +24.13 22,620.47 +46.51 129,727.46 +24.36 46,665.24 +35.99 288,879.11 +24.23 Mar. 38,527.76 +32,19 163,365.36 +25.62 36,484.64 +51.99 135,025.97 +30.08 75,012.41 +41.13 298,391.33 +27.60
.i Hong Kong Monthly Digest of Statistics April 1987 19
11

EXTERNAL TRADE
3.2 IMPORTS BY AREA
$million
Soviet Central Union and and Australasia
North Western Eastern South Middle and Postal Total Year/month America Europe Europe America East Asia Africa Oceania packages merchandise
1981 15,336.62 19,825.14 434.88 887.27 1,393.90 96,076.57 1,467.73 2,524.27 428.40 138,374.78
1982 16,579.12 20,978.38 395.05 930.54 1,748.04 97,795.66 1,101.86 2,939.49 424.51 142,892.64
1983 20,445.95 24,711.84 751.83 1,465.33 1,321.77 121,450.91 1,645.75 3,349.04 299.97 175,442.38
1984 25,707.61 29,982.88 929.68 1,863.49 1,390.36 156,985.62 2,096.38 4,092.83 321.35 223,370.20
1985 23,473.36 32,027.89 889.44 1,835.54 1,780.01 164,378.70 2,524.04 4,132.07 378.67 231,419.71
1986 24,724.48 39,310.66 970.63 1,690.44 2,703.62 198,371.22 2,976.45 4,810.05 397.00 275,954.55
1985: Mar. 1,992.29 2,760.64 105.15 115.57 186.74 14,220.05 148.01 369.16 17.77 19,915.37 Apr. 1,888.54 2,790.85 61.36 155.84 109.15 14,212.77 234.17 306.64 39.10 19,798.42 May 1,910.50 2,481.17 107.55 192.74 150.91 13,832.24 181.89 323.59 35.23 19,215.82 June 2,543.93 2,514.29 94.35 205.31 180.33 13,556.02 211.84 415.52 36.42 19,758.01 July 1,570.32 2,610.56 92.20 99.13 174.51 13,688.88 249.40 350.42 26.61 18,862.03 Aug. 2,060.97 2,934.78 78.91 156.74 131.78 13,138.88 188.01 399.21 27.21 19,116.49 Sept. 1,722.56 2,460.00 79.70 144.74 129.33 12,927.22 328.97 345.82 38.33 18,176.66 Oct. 1,811.33 2,831.79 73.38 203.70 155.61 14,258.80 217.88 381.04 32.82 19,966.35 Nov. 2,018.91 2,958.09 54.79 114.76 166.o3 14,452.83 216.22 322.78 28.39 20,332.81 Dec. 1,931.53 3,163.80 59.07 183.22 173.55 15,977.33 257.12 381.10 52.82 22,179.55
1986: Jan. 1,678.64 2,515.44 71.89 91.16 241.70 13,696.69 163.19 310.34 37.20 18,806.24 Feb. 2,229.01 2,571.35 83.30 103.99 184.14 11,259.53 236.60 281.96 32.94 16,982.81 Mar. 1,770.46 3,126.03 119.13 137.94 265.99 13,836.71 253.83 352.13 20.50 19,882.74 Apr. 2,005.35 3,207.97 73.19 221.70 168.49 16,107.85 247.75 419.92 25.09 22,477.31 May 1,859.98 3,297.63 45.68 103.89 236.77 16,052.98 299.76 415.53 37.42 22,349.66 June 1,951.19 3,113.54 47.05 147.39 203.55 16,702.92 232.44 395.73 42.20 22,836.01 July 1,986.89 3,649.97 75.28 192.05 283.31 17,317.50 169.69 440.08 45.01 24,159.78 Aug. 2,101.52 3,343.53 110.05 120.85 162.43 16,888.27 306.13 426.10 35.71 23,494.59 Sept. 1,987.28 3,140.10 45.23 113.71 218.69 17,355.79 188.30 373.58 28.15 23,450.82 Oct. 2,912.20 3,907.78 82.77 158.19 247.35 19,834.90 359.49 471.41 31.57 28,005.66 Nov. 2,197.30 3,787.92 116.76 122.96 279.60 18,825.34 265.79 421.45 29.13 26,046.24 Dec. 2,044.66 3,648.43 101.14 176.61 211.59 20,498.14 253.48 501.82 32.08 27,467.96
1987: Jan. 1,898.66 3,184.02 91.00 94.16 255.95 17,485.61 161.04 322.94 22.79 23,516.16 Feb. 2,806.45 3,490.68 100.38 140.31 244.25 16,747.29 189.09 373.42 26.46 24,118.32 Mar. 2,682.33 4,518.10 136.47 146.87 370.05 21,965.57 351.85 535.84 24.14 30,731.23
3.3 DOMESTIC EXPORTS BY AREA
$million
Soviet Central Union and and Australasia
North Western Eastern South Middle and Postal Total Year/month America Europe Europe America East Asia Africa Oceania packages merchandise
1981 31,555.43 23,701.63 220.69 2,641.59 3,225.32 11,969.85 3,709.24 3,229.81 169.66 80,423.21
1982 33,860.27 23,703.78 190.94 2,031.76 3,507.70 13,397.39 2,548.23 3,420.60 371.26 83,031.92
1983 47,573.27 27,113.22 273.24 1,209.06 3,506.05 18,270.87 2,440.34 3,572.96 446.19 104,405.17
1984 65,934.65 33,021.48 429.84 1,615.53 3,368.99 26,190.81 2,200.16 4,627.87 547.12 137,936.46
1985 62,132.83 28,415.69 534.20 1,632.05 2,765.09 27,884.28 1,654.11 4,084.06 779.56 129,881.86
1986 69,162.86 37,223.02 411.04 2,269.73 3,022.02 34,846.72 2,051.65 4,149.78 846.63 153,983.44
1985: Mar. 3,659.25 1,647.75 30.97 88.17 191.85 2,426.43 92.65 253.41 39.51 8,429.99 Apr. 4,354.06 1,911.85 53.19 110.69 267.48 2,490.97 121.86 277.47 72.13 9,659.70 May 5,203.43 2,179.52 45.36 137.78 253.17 2,486.53 128.70 299.05 82.53 10,816.06 June 5,507.28 2,361.48 35.04 139.11 213.24 2,164.24 131.97 339.95 63.76 10,956.06 July 5,709.89 2,580.71 51.59 150.70 202.76 2,316.33 145.48 352.12 66.99 11,576.58 Aug. 5,984.05 2,514.09 52.30 183.50 254.76 2,372.45 157.55 397.29 66.37 11,982.37 Sept. 5,703.03 2,100.24 53.66 154.21 240.94 2,192.08 140.05 332.65 63.13 10,979.99 Oct. 5,621.20 2,269.09 56.79 156.35 216.43 2,232.17 154.72 370.22 87.38 11,164.34 Nov. 5,472.98 2,644.99 48.87 156.18 199.85 2,327.19 149.84 357.44 92.23 11,449.56 Dec. 5,590.45 3,390.67 26.24 135.49 239.85 2,368.34 153.11 344.04 77.39 12,325.60
1986: Jan. 4,896.57 2,540.08 33.49 114.24 218.40 2,214.03 112.25 323.33 77.44 10,529.84 Feb. 3,878.98 2,053.84 42.99 111.94 175.21 1,643.40 119.21 268.58 52.58 8,346.73 Mar. 4,685.48 2,390.24 40.13 115.04 233.62 2,357.59 121.73 260.33 65.12 10,269.29 Apr. 5,126.50 2,563.05 35.38 149.97 296.64 2,632.96 160.46 309.89 73.25 11,348.10 May 5,641.74 2,862.24 33.02 148.72 319.36 2,789.12 157.82 302.47 79.41 12,333.90 June 5,822.11 3,077.34 21.40 171.60 248.36 2,651.90 167.68 319.91 65.45 12,545.75 July 6,463.74 3,625.33 29.93 207.11 286.17 3,036.04 183.33 373.86 64.54 14,270.06 Aug. 6,733.25 3,688.79 32.85 267.83 255.58 3,180.90 183.30 403.12 52.56 14,798.18 Sept. 6,378.74 3,128.57 29.49 278.88 235.03 3,233.43 203.83 396.97 54.91 13,939.85 Oct. 6,964.14 3,449.13 44.41 253.16 256.69 3,688.82 241.20 378.01 83.98 15,359.55 Nov. 6,264.69 3,642.42 42.42 246.51 217.89 3,721.69 210.88 434.98 88.11 14,869.59 Dec. 6,306.93 4,201.97 25.53 204.74 279.08 3,689.15 189.95 378.31 89.29 15,364.94
1987: Jan. 5,775.93 3,832.21 29.04 182.54 246.70 3,382.07 176.12 353.17 74.95 14,052.72 Feb. 3,930.80 2,499.63 17.45 140.57 182.38 2,755.02 131.38 268.90 65.90 9,992.05 Mar. 5,454.29 3,733.50 28.74 188.76 266.84 4,146.91 202.93 382.91 78.11 14,482.99
20 Hong Kong Monthly Digest of Statistics April 1987

EXTERNAL TRADE
3.4 IMPORTS BY MAJOR TRADING COUNTRY
$million
Supplier
Rep. of Fed. Korea Rep. of
Year/month China Japan Taiwan U.S.A. (South Korea) Singapore U.K. Germany Switzerland Italy
1981 29,509.73 32,129.91 10,762.05 14,441.82 5,494.68 10,627.05 6,282.85 3,382.70 2,848.15 1,846.04
1982 32,934.94 31,539.91 10,198.03 15,459.22 4,555.47 10,206.66 6,891.59 3,505.85 2,669.38 2,037.62
1983 42,821.31 40,333.06 12,448.25 19,178.80 5,049.71 10,481.52 7,455.65 4,556.32 3,287.03 2,314.28
1984 55,753.08 52,619.56 17,347.12 24,376.94 7,289.10 12,229.44 8,702.65 5,510.23 3,346.15 2,971.55
1985 58,962.78 53,349.53 20,898.45 21,895.60 8,293.34 11,281.33 8,449.66 6,671.97 3,637.31 3,581.52
1986 81,632.64 56,397.66 23,976.78 23,198.48 10,969.89 10,882.41 9,346.63 8,041.21 5,542.58 4,412.92
1985: Mar. 4,038.66 5,410.66 1,994.01 1,915.87 863.42 999.78 718.15 538.35 283.42 334.82 Apr. 4,504.97 5,058.70 2,015.97 1,722.99 931.22 730.44 714.89 592.83 266.18 354.45 May 4,566.99 4,554.47 1,856.84 1,798.09 721.05 1,102.94 629.23 537.80 276.20 266.34 June 4,499.88 4,577.19 1,817.05 2,401.18 823.88 961.55 655.35 539.75 270.89 252.75 July 5,023.8!1 4,396.42 1,799.32 1,449.71 600.01 776.74 623.02 597.41 328.98 278.98 Aug. 4,996.76 4,070.05 1,614.42 1,875.17 560.70 998.39 847.64 586.81 270.21 389.83 Sept. 5,069.80 3,808.07 1,556.93 1,596.75 602.16 972.15 652.26 544.50 314.94 255.60 Oct. 5,577.10 4,642.39 1,639.82 1,725.17 541.98 823.66 746.26 556.00 385.53 355.36 Nov. 5,937.70 4,286.35 1,779.90 1,874.49 662.79 739.97 780.32 585.12 396.05 315.14 Dec. 6,691.00 4,502.79 1,848.84 1,751.12 696.19 1,165.48 863.76 632.65 392.62 364.05
1986: Jan. 5,891.83 3,726.05 1,533.43 1,552.88 629.77 901.61 583.75 585.77 344.27 227.65 Feb. 3,963.65 3,641.82 1,198.09 2,117.78 562.79 1,123.59 646.38 479.69 381.49 280.08 Mar. 5,384.94 4,205.38 1,728.69 1,650.89 722.47 714.14 735.69 585.70 375.39 377.40 Apr. 6,216.23 4,983.58 1,937.82 1,854.76 868.85 809.06 833.56 654.24 420.21 340.75 May 6,571.74 4,622.35 1,987.82 1,750.02 842.54 787.99 848.97 678.31 463.60 352.13 June 6,862.53 4,681.43 2,025.13 1,819.98 986.26 966.43 699.52 659.06 439.34 334.49 July 7,131.28 5,049.49 2,046.09 1,871.25 1,057.35 796.29 842.40 734.58 529.54 421.80 Aug. 7,241.20 4,590.40 2,037.87 1,991.79 924.89 851.21 814.86 728.76 412.17 470.77 Sept. 7,401.24 4,747.67 2,022.48 1,833.96 978.61 925.71 715.66 672.17 496.74 358.61 Oct. 8,197.48 5,671.02 2,475.24 2,810.87 1,139.16 910.51 871.35 765.80 600.50 448.48 Nov. 8,024.99 4,846.40 2,392.16 2,008.81 1,018.49 1,149.20 902.86 787.77 561.43 423.05 Dec. 8,745.79 5,636.92 2,591.94 1,935.48 1,238.85 946.67 851.62 708.41 517.90 377.73
1987: Jan. 7,868.43 4,232.63 2,203.06 1,767.25 1,052.39 828.27 745.01 657.15 305.34 326.04 Feb. 6,443.96 4,830.79 2,040.04 2,625.62 1,076.16 1,078.44 787.20 669.15 533.71 397.45 Mar. 8,860.08 5,997.93 2,772.70 2,486.74 1,365.31 1,173.71 1,042.38 822.89 550.64 615.78
3.5 DOMESTIC EXPORTS BY MAJOR TRADING COUNTRY
$million
Market
Fed. Rep. of
Year/month U.S.A. China Germany U.K. Japan Canada Australia Netherlands Singapore France
1981 29,200.24 2,924.19 7,047.69 7,709.67 2,939.70 2,355.19 2,710.19 1,597.60 1,731.96 1,483.27
1982 31,223.40 3,806.31 7,031.25 7,168.55 3,166.93 2,636.87 2,831.74 1,692.18 1,964.49 1,507.21
1983 43,801.52 6,223.33 8,042.64 8,537.55 3,910.19 3,730.92 2,927.34 1,963.39 2,227.55 1,660.42
1984 61,374.39 11,283.47 9,521.53 10,496.67 5,150.70 4,509.69 3,823.64 2,417.70 2,626.96 2,007.32
1985 57,687.23 15,189.36 7,998.01 8,546.39 4,480.26 4,404.73 3,349.43 2,083.09 2,233.09 1,818.17
1986 64,218.88 18,022.28 11,002.79 9,918.46 6,212.08 4,880.01 3,376.03 2,802.54 2,794.49 2,640.42
1985: Mar. 3,431.70 1,377.18 448.59 506.50 378.51 225.96 210.14 140.95 178.10 110.93 Apr. 4,069.31 1,419.00 479.57 624.74 375.47 282.79 223.66 152.48 183.65 149.60 May 4,850.72 1,391.08 601.87 670.83 336.38 346.40 220.89 137,08 205.79 145.89 June 5,094.12 1,195.88 656.88 711.51 354.51 409.37 281.75 161.27 172.00 154.01 July 5,244.24 1,283.79 754.62 758.54 382.39 460.62 288.68 193.81 168.13 149.43 Aug. 5,546.16 1,214.68 667.21 744.05 467.73 431.89 335.20 180.59 191.55 147.84 SepL 5,298.22 1,105.46 573.71 676.96 433.94 400.96 265.73 135.20 189.59 142.67 Oct. 5,251.00 1,164.42 576.91 730.17 393.38 366.09 297.93 156.28 185.58 165.76 Nov. 5,105.17 1,199.85 763.65 742.47 396.27 364.46 291.53 178.34 205.24 191.45 Dec. 5,121.70 1,303.16 1,090.15 996.08 353.94 466.30 284.87 268.44 187.20 209.48
1986: Jan. 4,537.87 1,162.21 765.10 688.51 360.76 355.50 280.77 175.43 198.74 180.11 Feb. 3,532.39 807.80 645.70 522.91 292.85 345.30 230.33 151.80 137.79 139.75 Mar. 4,340.83 1,166.14 709.48 647.70 413.88 342.37 220.13 202.45 197.65 174.01 Apr. 4,780.03 1,368.18 709.18 735.55 419.08 341.14 241.30 173.32 224.07 190.78 May 5,271.61 1,441.28 828.24 798.39 448.98 363.97 237.04 186.82 261.27 225.05 June 5,373.43 1,403.58 916.05 831.08 440.18 442.56 259.06 210.26 209.67 237.35 July 5,942.28 1,555.68 1,078.65 972.23 515.12 514.95 301.40 277.32 256.72 219.72 Aug. 6,220.60 1,608.79 1,099.72 983.59 610.15 504.60 328.86 299.99 263.74 235.23 Sept. 5,948.29 1,690.19 909.62 841.25 620.39 422.36 311.85 231.00 259.45 221.87 Oct. 6,535.41 1,930.66 962.95 951.65 698.02 422.30 306.95 235.35 257.37 263.67 Nov. 5,907.09 1,884.04 1,035.57 902.ll 725.97 353.25 331.53 299.91 293.25 265.23 Dec. 5,829.05 2,003.56 1,342.54 1,043.50 659.21 471.69 326.82 358.88 234.77 287.66
1987: Jan. 5,312.83 1,725.66 1,201.57 891.49 648.63 457.57 265.31 341.39 246.57 257.05 Feb. 3,638.59 1,593.20 860.36 534.71 400.00 290.93 222.62 234.43 198.39 154.38 Mar. 5,054.99 2,232.86 1,160.61 927.05 743.41 395.51 294.72 323.94 280.35 283.72
Hong Kong Monthly Digest of Statistics April 1987 21

EXTERNAL TRADE
3.6 RE-EXPORTS BY MAJOR COUNTRY OF ORIGIN
$million
Rep. of Fed. Korea Rep. of
Year/month China Japan U.S.A. Taiwan (South Korea) Germany U.K. Switzerland France Italy
1981 12,834.15 8,393.55 4,041.17 3,378.80 1,953.97 707.07 595.53 966.97 347.87 297.18
1982 14,693.73 9,083.83 4,940.48 2,499.75 1,363.30 819.71 694.03 1,074.69 483.53 347.25
1983 19,680.48 11,629.05 6,037.70 2,573.26 1,360.06 1,220.83 871.29 1,160.88 681.96 362.50
1984 28,106.87 18,694.73 8,516.01 5,110.69 2,314.37 1,573.00 1,161.37 1,297.98 1,033.44 605.82
1985 34,628.39 22,504.40 9,473.90 9,560.77 3,667.22 2,039.29 1,731.27 1,417.28 1,252.38 1,078.85
1986 51,596.93 18,578.74 10,411.45 8,680.74 3,596.02 2,423.79 1,919.86 1,861.66 1,475.61 1,099.60
1985: Mar. 2,413.47 2,418.05 841.96 995.48 371.95 159.96 148.17 124.68 110.08 109.93 Apr. 2,804.09 2,386.84 727.77 978.58 461.19 165.07 151.66 107.07 110.96 101.78 May 2,878.43 2,216.41 792.22 873.41 367.07 189.54 123.70 119.30 95.83 92.84 June 2,598.42 1,787.17 845.15 851.39 375.75 155.45 134.58 123.45 99.60 81.97 July 3,032.93 1,881.60 752.18 844.40 290.65 182.17 127.94 111.65 108.18 84.92 Aug. 2,961.23 1,674.54 836.17 818.65 249.49 175.31 160.75 117.52 85.00 94.70 Sept. 3,074.54 1,501.81 735.07 666.31 240.47 155.07 166.33 122.18 102.81 80.24 Oct. 3,162.17 1,412.02 741.24 693.79 230.31 179.85 145.09 104.66 95.11 83.04 Nov. 3,278.99 1,493.07 770.05 696.87 226.04 181.77 150.32 135.59 104.19 89.31 Dec. 3,373.95 1,648.89 881.80 790.19 235.96 202.29 167.55 140.80 94.10 114.67
1986: Jan. 3,514.43 1,308.41 730.73 613.86 239.52 156.70 171.11 122.20 111.11 75.35 Feb. 2,707.88 1,098.73 646.77 498.37 220.89 124.73 116.22 107.44 111.93 74.94 Mar. 3,266.81 1,535.31 721.50 629.63 237.19 178.86 132.18 134.95 117.60 80.02 Apr. 3,620.42 1,449.62 1,150.97 664.82 267.84 205.00 140.79 147.48 118.71 89.44 May 4,133.25 1,442.02 847.90 684.47 288.28 223.97 141.51 167.52 112.27 90.10 June 4,023.91 1,469.86 807.60 694.07 294.04 195.04 161.02 144.71 103.65 79.96 July 4,425.64 1,567.42 884.87 756.65 359.66 219.79 169.87 182.54 136.55 107.95 Aug. 4,806.76 1,556.24 857.68 703.84 302.64 187.74 163.67 167.07 121.47 102.64 Sept. 4,914.73 1,758.11 866.98 723,67 285.89 208.80 173.29 160.19 130.02 96.50 Oct. 5,383.29 1,717.60 945.16 892.15 359.94 236.58 183.73 169.92 131.88 94.29 Nov. 5,459.00 1,710.34 901.42 898.83 340.51 254.46 186.63 180.19 148.61 103.73 Dec. 5,345.03 1,964.92 1,049.86 920.37 399.61 232.11 179.85 177.46 131.82 104.70
1987: Jan. 5,703.84 1,485.77 996.62 827.74 368.00 192.86 207.49 157.13 140.32 85.52 Feb. 4,668.97 1,487.60 869.39 728.33 362.78 204.41 147.52 169.90 144.93 100.42 Mar. 6,126.28 1,963.76 1,076.91 937.68 494.12 230.62 195.70 217.66 143.62 112.94
3.7 RE-EXPORTS BY MAJOR COUNTRY OF DESTINATION
$million
Rep. of Fed. Korea Rep. of
Year/month China U.S.A. Japan Taiwan (South Korea) Singapore Germany Macau U.K. Indonesia
1981 8,044.17 4,784.81 2,791.55 2,419.58 1,400.70 3,243.04 624.13 1,406.91 908.04 4,272.43
1982 7,992.03 5,614.58 2,565.72 2,661.74 1,699.35 3,648.06 685.24 1,587.84 655.21 4,615.20
1983 12,182.57 8,028.07 3,175.75 3,454.41 2,439.99 4,523.13 760.87 1,885.28 761.72 3,884.39
1984 28,064.08 12,109.46 4,633.06 4,867.58 3,440.25 4,511.06 1,072.99 2,353.64 976.13 3,654.08
1985 46,023.14 14,705.14 5,486.23 4,324.52 3,872.28 4,387.65 1,553.89 2,555.91 1,233.16 2,300.83
1986 40,893.60 22,361.99 6,676.31 5,938.81 5,843.32 5,258.68 2,687.81 2,583.64 2,489.29 2,406.58
1985: Mar. 4,389.66 996.99 463.64 421.27 318.03 314.91 91.17 266.38 64.47 286.63 Apr. 4,646.39 1,110.82 445.80 454.91 292.27 354.35 81.32 248.80 99.79 215.43 May 4,288.03 1,235.59 397.21 378.86 298.50 364.62 106.33 244.89 83.12 389.88 June 3,891.21 1,167.68 404.50 358.04 254.89 322.47 124.58 204.65 107.80 117.35 July 3,938.72 1,358.06 452.69 311.85 325.66 379.44 120.97 224.71 104.08 121.40 Aug. 3,75\.38 1,274.73 435.47 348.98 348.43 394.33 131.55 205.70 100.22 120.81 Sept. 3,251.77 1,275.02 409.94 368.65 385.80 408.71 165.00 180.93 115.13 123.28 Oct. 3,275.27 1,317.79 503.80 331.46 279.80 420.97 156.82 188.13 130.90 155.44 Nov. 3,303.58 1,362.84 495.56 380.41 420.91 384.81 166.87 176.30 138.17 160.75 Dec. 3,866.26 1,400.33 513.31 344.25 401.37 442.39 216.66 202.35 136.51 180.40
1986: Jan. 2,775.76 1,501.87 503.42 451.98 369.15 435.26 175.13 200.35 139.93 159.00 Feb. 2,237.86 1,127.13 383.93 335.21 349.40 345.69 134.71 150.92 114.95 145.28 Mar. 2,950.36 1,308.88 486.98 489.22. 441.57 425.13 161.24 237.79 162.68 162.81 Apr. 3,105.39 1,545.20 477.55 531.77 478.21 397.86 167.93 220.81 132.03 199.17 May 3,289.78 1,815.12 501.48 510.11 483.23 446.85 206.45 222.75 144.43 225.09 June 3,268.41 1,826.22 434.50 442.92 508.32 420.97 218.89 212.95 164.73 236.53 July 3,469.67 2,005.22 527.95 503.50 563.87 455.92 247.62 257.37 194.98 220.47 Aug. 3,330.50 2,286.72 500.95 490.04 451.90 482.16 236.08 191.97 269.86 224.96 Sept. 3,475.68 2,288.63 571.32 471.09 493.71 486.77 274.73 190.99 344.56 220.31 Oct. 4,216.98 2,260.21 776.55 575.05 538.74 448.38 287.04 238.61 292.75 229.02 Nov. 4,115.11 2,229.25 842.46 576.28 592.80 448.71 258.92 222.04- 234.24 196.25 Dec. 4,658.08 2,167.66 673.71 561.68 572.02 464.98 319.11 237.09 294.16 187.69
1987: Jan. 3,789.67 2,545.46 575.62 601.65 584.45 452.85 311.38 214.70 220.59 194.78 Feb. 3,464.74 1,999.43 515.77 604.14 611.95 407.93 255.60 225.81 154.67 158.42 Mar. 4,554.04 2,523.60 655.93 795.97 725.71 525.76 336.43 301.44 303.67 231.69
22 Hong Kong Monthly Digest of Statistics April 1987

EXTERNAL TRADE
3.8 IMPORTS BY COMMODITY SECTION
$million
Standard International Trade Classification (Revision 2) Commodi-
ties and Food Mineral Animal Manufac-t Miscel-t transac-
and live Crude fuels, and Chemicalst lured goods Machineryt laneous tions not animals Beverages materials, lubricants vegetable and related classified and manufac- classified
chiefly and inedible, and related oils, fats products, chiefly by transport tured according Total Year/month for food tobacco except fuels materials and waxes n.e.s. material equipment articles to kind merchandise
1981 13,993.19 2,059.78 5,615.82 10,965.52 426.75 9,059.00 40,149.02 32,298.24 23,179.38 628.07 138,374.78
1982 16,172.44 2,327.43 5,581.07 11,477.49 436.28 9,486.09 39,733.68 32,029.17 24,977.96 671.03 142,892.64
1983 18,910.72 2,671.94 7,344.83 11,657.16 596.34 12,942.45 49,499.57 39,424.22 31,783.38 611.77 175,442.38
1984 20,134.41 3,241.30 9,310.18 12,263.20 688.45 15,523.12 63,844.46 57,741.00 39,715.26 908.84 223,370.20
1985 19,965.21 3,852.19 8,990.10 10,825.85 731.34 16,112.88 64,623.71 59,280.11 45,667.96 1,370.35 231,419.71
1986 22,480.58 3,943.91 9,863.40 8,859.90 683.66 21,226.71 80,240.85 66,246.73 60,875.79 1,533.03 275,954.55
1985: Mar. 1,507.26 276.72 818.42 908.30 56.82 1,301.45 5,299.17 6,326.77 3,328.13 92.33 19,915.37 Apr. 1,585.25 240.22 759.34 750.96 68.03 1,332.30 5,614.02 5,835.90 3,497.29 115.10 19,798.42 May 1,557.87 256.91 787.10 1,090.61 50.33 1,280.61 5,439.77 4,966.51 3,670.11 116.00 19,215.82 June 1,562.86 243.82 668.25 937.38 86.20 1,481.87 5,563.87 5,311.99 3,782.37 119.42 19,758.01 July l,637.24 279.54 751.66 860.12 49.60 1,313.84 5,420.62 4,437.61 4,001.14 110.66 18,862.03 Aug. 1,738.78 299.38 634.83 1,077.68 40.46 1,436.73 5,286.42 4,542.52 3,940.21 119.46 19,116.49 Sept. 1,742.65 281.16 674.58 975.56 70.01 1,310.48 5,236.23 3,927.73 3,834.56 123.70 18,176.66 Oct. 1,865.51 350.16 731.73 820.81 70.48 1,388.88 5,469.22 4,748.93 4,396.36 124.28 19,966.35 Nov. 1,858.98 394.86 740.32 707.80 67.90 1,465.74 6,029.54 4,441.78 4,499.09 126.79 20,332.81 Dec. 1,977.75 469.75 891.63 944.31 57.21 1,628.42 6,812.60 4,549.ll 4,704.86 143.92 22,179.55
1986: Jan. 1,901.13 342.50 822.78 753.76 75.66 1,345.06 5,507.07 3,979.65 3,955.90 122.72 18,806.24 Feb. 1,368.91 276.15 656.09 1,188.75 34.38 1,245.49 4,379.57 4,339.53 3,392.92 101.00 16,982.81 Mar. 1,706.20 274.37 930.25 723.97 47.46 1,560.20 5,800.36 4,593.66 4,142.50 103.76 19,882.74 Apr. 1,774.45 230.89 793.42 853.89 65.68 1,658.24 6,808.ll 5,347.66 4,828.70 116.26 22,477.31 May 1,808.84 362.26 701.10 696.41 34.59 1,705.90 6,879.41 5,330.18 4,702.90 128.06 22,349.66 June 1,840.92 312.61 791.22 659.54 54.33 1,743.90 6,895.22 5,343.61 5,061.17 133.49 22,836.01 July 1,893.05 306.23 758.49 509.91 57.82 2,070.63 7,143.63 5,742.85 5,530.37 146.81 24,159.78 Aug. 1,946.21 319.23 734.82 714.83 56.84 1,985.52 6,540.30 5,593.90 5,469.02 133.93 23,494.59 Sept. 1,913.12 288.06 693.22 603.73 61.21 1,821.82 6,641.46 5,665.15 5,636.48 126.58 23,450.82 Oct. 2,177.03 390.38 942.52 744.42 77.70 2,072.81 7,789.15 7,249.24 6,423.55 138.87 28,005.66 Nov. 2,056.27 377.23 963.35 849.49 57.57 1,970.54 7,698.45 6,217.73 5,717.76 137.85 26,046.24 Dec. 2,094.45 464.00 1,076.99 561.20 60.42 2,046.60 8,158.52 6,844.66 6,017.42 143.69 27,467.96
1987: Jan. 1,927.66 391.02 1,067.62 512.65 60.60 1,732.64 6,639.12 5,761.41 5,287.52 135.91 23,516.16 Feb. 1,570.25 493.69 934.38 800.63 48.71 1,820.39 6,854.95 6,504.62 4,955.68 135.01 24,118.32 Mar. 1,991.00 407.79 1,436.41 866.75 70.24 2,448.33 9,302.22 7,322.30 6,720.18 166.01 30,731.23
tValues from 1986 onwards are not strictly comparable to those in the past due to re-classification of commodity items.
3.9 DOMESTIC EXPORTS BY COMMODITY SECTION
$million
Standard International Trade Classification (Revision 2) Commodi-
ties and Food Mineral Animal Manufac-t Miscel-t transac-
and live Crude fuels, and Chemicalst tured goods Machineryt laneous tionsnot animals Beverages materials, lubricants vegetable and related classified and manufac- classified
chie:lly and inedible, and related oils, fats products, chiefly by transport tured according Total Year/month for food tobacco except fuels materials and waxes n.e.s. material equipment articles to kind merchandise
1981 1,017.72 190.81 984.93 99.24 8.04 754.94 8,605.78 15,042.91 53,380.62 338.23 80,423.21
1982 1,149.83 191.01 834.74 106.56 7.80 784.50 8,313.31 15,073.67 55,996.41 574.10 83,031.92
1983 1,360.41 403.53 1,880.41 160.00 10.32 1,016.30 ll,069.31 23,328.19 64,399.93 776.78 104,405.17
1984 1,372.40 655.39 1,919.85 312.35 10.58 1,312.46 13,883.77 33,300.44 84,040.60 1,128.61 137,936.46
1985 1,345.89 1,115.65 1,492.47 443.37 9.07 1,276.75 12,912.28 28,554.12 81,090.03 1,642.20 129,881.86
1986 1,620.41 1,146.30 1,234.92 463.03 9.90 1,501.77 17,042.27 33,305.69 95,783.05 1,876.10 153,983.44
1985: Mar. 102.08 77.47 113.09 32.27 0.76 125.29 855.28 2,498.54 4,522.30 102.91 8,429.99 Apr. 105.67 92.20 154.58 30.53 1.65 124.46 1,048.76 2,292.43 5,672.52 136.91 9,659.70 May 122.51 104.86 144.26 28.48 1.23 119.83 1,082.54 2,558.56 6,498.64 155.14 10,816.06 June 101.31 85.10 122.82 32.68 0.49 107.98 l,038.22 2,310.89 7,025.50 131.07 10,956.06 July 113.08 99.08 125.98 35.19 0.55 107.89 l,089.28 2,231.59 7,629.84 144.09 ll,576.58 Aug. 126.42 106.47 123.93 47.51 0.74 96.30 1,131.28 2,430.85 7,773.66 145.22 11,982.37 Sept. 107.16 105.44 113.18 39.24 0.29 100.23 1,065.71 2,204.40 7,107.53 136.83 10,979.99 Oct. 116.55 103.33 107.56 41.91 0.54 109.58 1,143.52 2,271.27 7,105.03 165.07 11,164.34 Nov. 129.22 98.02 112.95 39.07 0.85 88.55 l,188.03 2,462.77 7,159.68 170.43 ll,449.56 Dec. 119.70 96.22 107.40 47.88 0.60 105.62 1,305.51 2,359.90 8,024.77 157.99 12,325.60
1986: Jan. 115.52 113.85 114.08 52.35 1.06 97.19 1,058.85 2,183.74 6,635.80 157.39 10,529.84 Feb. 85.39 77.03 76.54 38.69 0.44 82.57 877.16 l,643.09 5,354.31 111.49 8,346.73 Mar. 122.53 87.29 91.51 40.15 0.70 131.25 1,124.65 2,416.85 6,114.46 139.90 10,269.29 Apr. 132.10 89.24 91.85 42.12 0.72 135.36 1,309.83 2,541.72 6,854.31 150.86 ll,348.10 May 146.03 77.41 109.43 34.74 1.14 122.30 1,361.33 2,714.71 7,602.38 164.42 12,333.90 June 136.30 70.37 94.71 29.44 0.81 105.90 1,335.30 2,686.55 7,941.53 144.84 12,545.75 July 152.01 86.78 110.46 4.92 1.00 141.07 1,510.45 2,915.74 9,190.08 157.57 14,270.06 Aug. 149.44 82.29 97.60 34.54 0.75 138.80 1,552.60 3,160.69 9,434.51 146.94 14,798.18 Sept. 139.87 101.77 100.34 48.51 0.58 130.99 1,521.95 2,989.60 8,761.39 144.83 13,939.85 Oct. 137.97 107.78 124.28 49.94 0.86 137.60 1,751.58 3,458.90 9,406.71 183.94 15,359.55 Nov. 150.56 89.07 106.01 40.32 0.68 141.44 l,845.78 3,405.35 8,907.88 182.49 14,869.59 Dec. 152.68 163.41 118.11 47.30 1.17 137.27 1,788.32 3,188.58 9,576.69 191.43 15,364.94
1987: Jan. 137.93 180.33 123.98 49.05 0.91 130.50 1,599.60 3,033.06 8,613.55 183.80 14,052.72 Feb. 104.53 118.50 92.83 44.23 0.74 126.30 1,285.95 2,458.44 5,598.63 161.90 9,992.05 Mar. 160.23 95.30 143.47 53.56 1.26 166.71 1,981.08 3,380.49 8,292.87 208.01 14,482.99
tValues from 1986 onwards are not strictly comparable to those in the past due to r~-classification of commodity items.
Hong Kong Monthly Digest of Statistics April 1987 23

EXTERNAL TRADE
3.10 RE-EXPORTS BY COMMODITY SECTION
$million
Standard International Trade Classification (Revision 2) Commodi-
ties and Food Mineral Animal Manufac-t Miscel-t transac-
and live Crude fuels, and Chemicalst lured goods Machineryt laneous tions not animals Beverages materials, lubricants vegetable and related classified and manufac- classified
chiefly and inedible, and related oils, fats products, chiefly by transport tured according Total Year/month for food tobacco except fuels materials and waxes n.e.s. material equipment articles to kind merchandise
1981 2,127.64 466.50 3,249.00 443.51 58.86 3,580.73 12,232.79 10,414.87 8,787.61 377.96 41,739.47
1982 2,882.55 524.02 3,001.80 505.86 106.96 3,908.62 12,000.23 10,904.91 10,385.49 132.29 44,352.73
1983 3,646.86 788.99 3,641.79 621.86 163.37 4,940.40 14,168.41 13,630.62 14,449.00 242.94 56,294.22
1984 4,054.63 1,131.60 5,185.28 715.68 147.65 6,430.92 21,045.21 23,952.50 20,494.13 346.74 83,504.35
1985 4,808.70 1,497.15 5,626.08 690.89 123.47 7,975.84 27,433.93 31,284.17 25,304.77 525.42 105,270.41
- 1986 6,524.81 1,591.13 5,806.66 1,153.95 266.09 10,254.20 32,473.83 28,083.14 35,825.06 567.51 122,546.37
1985: Mar. 396.86 116.79 501.46 54.48 9.03 601.86 2,055.45 3,577.99 1,721.62 42.62 9,078.15 Apr. 436.38 127.45 568.30 53.16 7.90 660.98 2,319.83 3,347.52 1,932.95 44.92 9,499.41 May 349.96 88.81 462.57 65.36 9.00 662.95 2,536.05 2,953.97 2,152.87 46.49 9,328.03 June 319.64 78.66 393.66 60.10 6.21 657.22 2,244.11 2,493.22 2,047.78 40.52 8,341.12 July 356.35 69.44 429.23 61.23 7.27 652.10 2,471.12 2,435.96 2,388.06 43.98 8,914.73 Aug. 373.88 130.24 473.98 70.27 10.59 730.83 2,354.59 2,312.26 2,317.30 43.57 8,817.52 Sept. 375.22 139.45 447.63 53.24 12.42 667.15 2,284.34 2,019.13 2,244.96 43.07 8,286.61 Oct. 411-.27 134.15 453.54 55.44 11.65 695.77 2,431.50 1,966.50 2,227.48 46.09 8,433.38 Nov. 491.74 103.55 473.56 53.49 13.11 742.39 2,487.46 2,089.23 2,220.28 49.35 8,724.18 Dec. 569.26 144.24 473.21 69.16 13.17 854.03 2,613.97 2,349.78 2,329.82 48.59 9,465.24
1986: Jan. 551.18 170.73 522.37 73.56 11.83 703.68 2,284.12 1,909.24 2,294.89 41.39 8,562.98 Feb. 435.12 136.82 344.34 54.28 6.91 632.00 1,819.02 1,522.89 1,892.99 32.03 6,876.40 Mar. 536.52 106.68 490.62 75.33 16.94 781.20 2,352.57 2,012.90 2,150.81 42.08 8,565.66 Apr. 518.13 112.15 449.77 95.55 33.50 845.69 2,531.45 2,465.00 2,462.28 46.47 9,560.00 May 488.57 134.41 504.14 117.83 25.77 783.42 2,700.21 2,244.78 2,822.84 47.28 9,869.25 June 439.40 92.96 484.93 94.46 18.71 784.07 2,561.49 2,128.42 2,950.92 43.26 9,598.62 July 489.49 103.54 444.14 100.31 19.73 900.48 2,808.00 2,385.15 3,260.98 51.73 10,563.55 Aug. 479.75 121.67 426.79 105.31 13.95 853.82 2,612.76 2,293.58 3,672.86 49.67 10,630.16 Sept. 528.99 141.47 423.96 91.72 28.53 905.73 2,835.01 2,538.45 3,589.08 47.79 11,130.74 Oct. 668.46 129.78 546.47 123.32 31.76 999.52 3,286.75 2,802.19 3,648.12 55.30 12,291.68 Nov. 780.36 129.88 550.08 128.71 33.07 1,069.50 3,304.70 2,703.34 3,520.16 55.29 12,275.09 Dec. 608.83 211.04 619.04 93.57 25.38 995.22 3,381.86 3,077.17 3,559.15 55.22 12,626.47
1987: Jan. 577.79 224.16 557.58 101.44 28.22 891.54 2,881.77 2,747.71 3,941.93 52.49 12,004.63 Feb. 433.35 134.08 532.88 105.86 21.00 891.90 2,703.83 2,483.59 3,257.67 51.69 10,615.84 Mar. 558.40 148.65 693.99 103.39 25.77 1,205.19 3,647.47 3,244.61 4,168.03 68.65 13,864.17
tValues from 1986 onwards are not strictly comparable to those in the past due to re-classification of commodity items.
3.11 IMPORTS AND RE-EXPORTS BY END-USE CATEGORY
$million
Imports Re-exports
Raw Raw materials materials
Consumer and semi- Capital Consumer and semi- Capital Year/month Foodstuffs goodst manufacturest Fuels goodst Foodstuffs goodst manufacturest Fuels goodst
1981 14,659.84 37,069.82 57,234.93 10,587.89 18,822.30 2,575.49 17,281.53 16,748.04 272.01 4,862.40
1982 16,784.79 38,614.03 56,444.34 11,106.73 19,942.75 3,241.44 18,073.81 16,795.88 337.16 5,904.43
1983 19,731.71 46,659.08 75,257.70 11,253.46 22,540.42 4,021.70 22,830.92 21,410.85 435.09 7,595.66
1984 20,681.08 58,380.27 99,740.48 11,787.61 32,780.77 4,255.42 30,647.86 34,682.81 497.80 13,420.46
1985 20,752.17 66,730.31 97,385.18 10,324.36 36,227.69 5,076.56 38,405.37 42,793.10 422.44 18,572.94
1986 23,484.09 85,180.87 119,517.70 8,270.53 39,501.37 6,860.82 49,479.49 49,160.62 786.90 16,258.54
1985: Mar. 1,534.16 5,749.19 8,414.30 858.69 3,359.03 401.15 3,261.97 3,558.05 30.09 1,826.90 Apr. 1,574.87 5,538.67 8,568.70 710.84 3,405.33 390.13 3,368.35 3,856.61 30.51 1,853.82 May 1,601.74 5,211.19 8,273.07 1,052.00 3,077.81 372.60 3,282.36 3,798.49 45.24 1,829.33 June 1,684.13 5,150.94 8,462.50 886.21 3,574.23 347.29 2,921.75 3,503.79 36.45 1,531.85 July 1,688.50 5,423.10 8,161.74 824.19 2,764.49 400.63 3,203.09 3,672.84 39.75 1,598.42 Aug. 1,769.85 5,405.63 7,984.75 1,013.47 2,942.79 420.06 3,176.70 3,737.14 45.37 1,438.25 Sept. 1,810.49 5,255.07 7,716.33 946.66 2,448.11 413.37 3,068.03 3,531.94 29.49 1,243.79 Oct. 1,947.89 5,921.19 8,161.54 777.83 3,157.90 437.39 3,271.42 3,491.73 33.18 1,199.65 Nov. 1,986.09 6,225.97 8,608.25 666.74 2,845.75 523.76 3,156.75 3,701.64 31.76 1,310.27 Dec. 2,103.07 6,784.57 9,431.00 903.93 2,956.98 612.13 3,379.15 3,844.85 41.14 1,587.97
1986: Jan. 1,979.85 5,748.46 7,802.58 708.66 2,566.71 574.21 3,264.33 3,456.78 46.36 1,221.30 Feb. 1,430.10 4,803.59 6,653.01 1,137.11 2,959.01 428.62 2,721.49 2,745.93 32.83 947.52 Mar. 1,811.40 5,858.65 8,774.79 688.02 2,749.88 517.27 3,193.76 3,650.90 48.66 1,155.07 Apr. 1,772.27 6,627.68 10,024.40 802.44 3,250.53 498.00 3,456.21 3,950.86 70.51 1,584.41 May 1,849.80 6,694.90 10,023.07 645.83 3,136.07 539.16 3,941.83 4,008.56 88.86 1,290.85 June 1,940.76 6,938.18 10,245.71 620.91 3,090.46 490.78 3,879.30 3,922.39 73.17 1,232.98 July 1,947.89 7,671.51 10,811.77 458.09 3,270.51 524.40 4,360.13 4,215.85 67.81 1,395.36 Aug. 1,984.96 7,392.28 10,279.16 661.39 3,176.80 506.63 4,784.33 3,990.03 69.01 1,280.16 Sept. 1,997.22 7,794.69 10,004.19 548.69 3,106.04 559.35 4,925.26 4,231.81 56.88 1,357.44 Oct. 2,317.87 8,824.04 11,637.68 698.22 4,527.85 719.55 5,022.41 4,907.67 88.79 1,553.27 Nov. 2,198.19 8,121.23 11,267.56 802.00 3,657.26 830.45 4,866.10 5,043.17 87.44 1,447.92 Dec. 2,253.78 8,706.88 11,997.86 499.17 4,010.26 672.40 5,064.22 5,040.84 56.59 1,792.43
1987: Jan. 2,095.72 7,552.00 10,045.84 468.25 3,354.35 616.21 5,357.92 4,379.88 68.87 1,581.75 Feb. 1,652.40 7,322.36 10,455.25 764.76 3,923.53 479.89 4,389.19 4,251.71 78.84 1,416.21 Mar. 2,076.02 9,655.38 14,084.61 803.80 4,111.43 589.78 5,703.47 5,751.15 61.76 1,758.02
tValues are not strictly comparable throughout the periods presented due to major re-classification of commodity items in 1981 and 1986.
24 Hong Kong Monthly Digest of Statistics April 1987

EXTERNAL TRADE
3.12 DOMESTIC EXPORTS OF PRINCIPAL COMMODITIES
Year/month
1981 1982
1983· 1984
1985 1986
1985: Mar. Apr. May June July Aug. Sept. Oct. Nov. Dec.
1986: Jau. Feb. Mar. Apr. May June July Aug. Sept. Oct. Nov. Dec.
1987: Jau. Feb. Mar.
Articles of apparel aud
clothing accessories
28,288.01
28,823.85 34,364.88 46,713.71 44,912.12
52,161.66
2,217.78 2,886.19 3,479.69 3,880.38 4,105.66 4,089.30 3,769.28 3,958.50 3,936.42 5,028.41
3,819.12 3,210.80 3,178.38 3,527.76 3,967.04 4,422.47 4,982.01 5,121.50 4,631.03 4,782.73 4,667.14 5,848.67
4,968.99 3,083.28 4,358.50
Watchest audclocks
7,104.30
7,167.73 8,259.33
8,875.25 9,236.52
11,323.48
606.60 629.52 737.98 737.01 805.76 859.71 896.35 904.20
1,011.73 816.50
701.42 615.18 817.48 915.14 943.43 857.53
1,045.54 1,039.76 1,002.72 1,176.42 1,251.07
957.80
891.80 647.19 964.17
Toysaud dolls
6,685.07
8,288.80 8,001.87
10,801.95 9,235.22
10,493.55
549.41 714.55 842.66 916.24
1,130.72 1,135.94
947.32 661.79 575.00 572.01
615.67 369.00 601.72 726.51 855.71 898.05
1,160.71 1,227.03 1,177.70 1,192.75
873.27 795.42
736.88 495.73 798.00
Household type
electrical and
Textile non-electrical fabrics equipment
4,115.78 2,996.65
3,898.19 2,727.96 5,461.04 3,673.19
6,758.54 5,218.45 6,195.07 4,551:29
9,014.05 4,871.28
415.21 484.49 501.52 473.96 498.19 523.58 500.90 575.16 604.17 684.27
503.35 463.48 592.66 664.08 686.61
~m? 816.84 838.37 958.89
1,031.63 982.75
883.17 761.59
1,117.29
412.62 371.41 440.68 367.04 391.98 369.21 355.77 331.45 363.72 335.12
335.91 248.20 363.96 353.15 360.29 397.28 427.16 492.60 434.13 516.82 492.35 449.45
408.49 322.71 461.34
Electronic components
aud parts for
computers
2,125.59
1,694.41 3,833.48
6,147.00 4,427.11
4,327.34
417.87 313.37 373.40 398.97 334.60 399.94 352.82 428.85 351.87 392.50
361.19 262.50 414.51 414.16 402.11 364.93 392.79 357.58 320.53 353.95 383.38 299.72
357.19 293.78 380.02
Jewellery, gi>ldsmiths'
and silversmiths'
wares
1,208.27
1,367.18 1,718.08
2,457.38 2,878.46 3,611.28
193.66 224.34 219.56 225.91 246.86 278.10 246.01 313.24 328.98 257.23
238.52 189.98 264.89 290.91 299.70 294.99 297.03 319.66 304.47 401.31 386.51 323.31
335.15 209.17 438.15
Articles oft artificial
resins and plastic
materials
1,156.08
1,244.64 1,720.72
2,509.04 2,594.08 3,572.90
143.90 197.11 198.21 223.72 241.21 245.80 227.33 243.67 228.57 267.74
237.41 177.57 253.06 272.25 300.06 281.24 332.83 342.89 308.01 362.66 356.31 348.60
357.37 258.12 409.21
tValue from 1986 onw;.,ds are not strictly comparable to those in the past due to re-classification of commodity items.
Year/month
1981
1982 1983 1984 1985 1986
1985: Feb. Mar. Apr. May June July Aug. Sept. Oct. Nov. Dec.
1986: Jau. Feb. Mar. Apr. May June July Aug. Sept. Oct. Nov. Dec.
1987: Jan. Feb.
Value
100
104 132 181 192
226
165 172 188 198 190 201 204 189 193 198 214
188 150 185 205 218 218 244 250 246 272 267 275
256 202
Total exports
Unit value Quautum
100 107
118 133 134 137
134 135 135 135 135 135 135 134 133 133 132
133 135 135 136 136 137-137 138 138 139 138 138
137 139
100
97 lll 136 144 165
123 127 140 147 141 149 151 141 144 149 162
141 Ill 137 151 160 159 178 181 178 196 193 199
187 146
3.13 TRADE· INDEX NUMBERS
Value
100
103 130 172 161 191
140 126 144 161 163 173 179 164 167 171 184
157 125 153 169 184 187 213 221 208 229 222 229
210 149
Domestic exports
Unit
(1981=100)
value Quantum
100
106 117 131 131 133
131 131 130 131 131 133 133 131 130 128 128
130 131 131 131 132 133 133 135 135 136 135 135
134 135
100
97 Ill 131 124 143
107 96
Ill 123 125 130 134 125 128 133 144
121 95
117 129 139 141 160 164 154 168 164 170
157 110
Value
100
103 127
161 167 199
130 173 172 167 171 164 166 158 173 176 192
163 147 172 195 194 198 210 204 203 243 226 238
204 209
Imports
Unit value Quantum
IOO I06
118 131 128 134
129 128 128 128 127 127 127 127 128 129 129
130 132 133 134 134 134 136 136 136 136 135 135
135 137
100
98 I07 123 131 148
101 135 134 131 135 128 130 124 136 137 150
125 lll 130 146 144 148 154 150 150 179 167 176
151 153
Note: The terms of trade index is derived from the ratio of unit value index for total exports to that for imports.
Hong Kong Monthly Digest of Statistics April 1987
Mauufactures of
metal (largely
cutlery and household
utensils)
2,027.43
2,044.19
2,478.02 3,151.73 2,935.56 3,474.30
173.41 244.04 254.84 244.12 260.57 280.26 261.76 245.41 240.75 259.00
247.45 181.32 231.16 282.70 288.95 291.93 321.49 338.14 290.99 343.36 325.24 331.58
314.53 210.59 358.49
Value
100
I06 135
200 252 294
214 261 273 268 240 256 254 238 242 251 272
246 198 246 275 284 276 304 306 320 353 353 363
345 305
Radio broadcast
receivers of all kinds
2,815.29
2,790.16
2,758.44 3,496.02 2,577.78
3,007.73
182.38 187.30 230.13 215.48 231.65 236.03 211.27 210.97 221.14 211.87
181.90 153.42 198.00 215.37 246.59 232.84 261.08 275.02 288.26 335.92 320.86 298.46
291.84 226.91 309.14
Re-exports
Unit
Travel goods,
handbags and similar containers
1,629.33 1,540.92
1,734.02 2,033.72 1,601.99
1,601.56
102.36 141.57 136.85 140.97 124.89 141.21 125.87 129.61 129.47 135.40
133.37 100.58 109.68 129.24 139.94 131.92 135.32 140.46 146.46 152.58 152.57 129.45
146.47 84.21
136.72
value Quantum
100
110 121 137
139 142
139 140 140 139 139 138 138 138 138 138 138
138 140 139 142 142 143 143 143 142 142 142 142
141 142
100 97
112
146 182 207
154 187 196 193 173 185 183 173 176 181 198
179 141 177 194 200 193 213 214 225 249 248 256
244 215
$ mlllion
Artificial flowers
894.53 888.63
953.81 1,153.86
853.90 695.65
~g:~~ 76.55 74.84 80.95 78.13 66.86 60.96 64.81 63.30
68.76 38.97 53.36 62.08 65.49 54.13 68.09 62.05 55.37 55.40 51.84 60.10
54.39 30.49 56.04
Terms of trade
100 . I02
100 102 I05
I02
104 I05 I05 I05 I06 106 I06 I05 104 I03 I03
I02 I02 102 I02 IOI I02 IOI 101 I02 I02 102 I02
IOI 102
25

EXTERNAL TRADE
Year/month
SITC section or division
Weights
1981
1982
1983
1984
1985
1986
1985: Feb. Mar. Apr. May June July Aug. Sept. Oct. Nov. Dec.
1986: Jan. Feb. Mar. Apr. May June July Aug. Sept. Oct. Nov. Dec.
1987: Jan. Feb.
Year/mQnth
SITC section or division
1981
1982
1983
1984
1985
1986
1985: Feb. Mar. Apr. May June July Aug. Sept. Oct. Nov. Dec.
1986: Jan. Feb. Mar. Apr. May June July Aug. Sept .. Oct. Nov. Dec.
1987: Jan. Feb.
Food, beverages
and tobacco
O&l
116
100
110
124
135
127
130
131 129 128 128 128 127 125 126 126 126 125
127 128 129 129 129 130 130 131 130 130 131 130
129 131
Food, beverages
and tobacco
O&I
100
105
109
108
116
127
89 103 106 106 105 113 121 120 132 134 146
132 96
115 117 125 124 126 130 127 147 138 147
134 118
3.14 TRADE INDEX NUMBERS FOR IMPORTS
Fuels
79
100
100
109
116
109
74
114 113 112 111 109 107 106 108 106 105 107
106 103 88 78 72 66 64 61 62 66 67 67
70 74
Fuels
100
105
97
96
90
109
53 88 74
108 94 88
Ill 99 84 73 97
78 127 90
120 106 109 87
127 106 124 140 91
80 119
Basic materials
2&4
44
100
106
119
142
139
129
144 142 143 142 141 139 138 137 136 133 131
132 132 131 131 132 129 129 128 127 127 125 126
127 125
Basic materials
2&4
100
94
110
116
116
136
108 122 115 117 107 114 97
108 117 120 144
135 104 149 131 111 130 126 123 118 160 163 179
177 157
UNIT VALUE INDEX NUMBERS (1981=100)
Industrial materials
Chemi- Other semi-manufactures cals
Metals and mis
cellaneous metal
Textiles products Total
65
100
107
128
142
137
143
140 138 138 138 136 135 136 139 136 136 138
139 139 140 143 144 142 144 144 144 144 144 144
142 143
65
140
100
102
Ill 132
127
131
129 129 128 128 128 128 127 127 125 124 122
125 126 128 131 132 132 133 133 132 132 132 132
130 131
67, 68 &.69
62
100
106
117
139
137
141
140 138 138 137 136 137 137 135 134 135 134
140 143 141 140 141 141 141 141 141 142 142 142
146 146
QUANTUM INDEX NUMBERS (1981=100)
Industrial materials
290
100
102
114
133
128
132
130 130 129 129 129 129 129 127 127 126 125
128 129 130 131 132 132 133 133 134 133 134 134
133 134
Chemi- Other semi-manufactures cals
100
97
112
121
129
163
90 125 128 123 144 129 140 125 135 143 156
127 117 147 153 156 161 189 181 166 189 180 187
160 168
Metals and mis
cellaneous metal
Textiles products
65
100
93
112
129
137
168
88 127 142 129 140 133 133 137 141 168 191
143 110 146 176 182 177 172 162 163 189 191 208
164 165
67, 68 &69
100
102
113
116
122
129
74 126 135 140 137 125 118 112 122 113 144
113 92
122 135 125 131 132 125 116 154 149 158
131 130
Total
100
97
108
120 126
151
81 122 130 126 129 126 123 123 129 143 162
129 102 133 155 155 156 160 147 149 174 172 182
149 153
Total
2,4, 5&6
399
100
103
116
135
131
133
133 133 132 132 131 131 131 130 129 128 128
130 131 131 133 134 134 134 134 134 134 134 135
134 134
Total
2,4, 5&6
100
97
109
120
125
152
86 123 128 125 129 125 123 122 129 141 160
130 105 138 152 151 154 162 150 149 176 173 183
154 156
Finished manufactures
Machinery and
transport equipment§
233
100
106
120
127
124
143
122 122 124 122 122 123 123 123 127 131 131
133 136 139 140 142 141 146 148 147 146 144 144
146 147
Other
168
100
104
116
129
130
138
131 130 129 129 130 131 132 133 131 130 130
133 135 136 138 139 140 140 140 140 139 140 139
139 141
Finished manufactures
Machinery and
transport equipment§
100
94
102
140
148
144
147 192 176 151 162 134 137 119 139 126 129
111 118 123 141 139 140 146 140 143 184 160 177
146 164
Other
100
103
118
133
151
191
106 132 140 147 151 158 155 149 174 179 188
155 131 159 183 176 188 206 203 210 240 213 225
198 183
Total§
7&8
401
100
105
119
128
126
142
125 125 125 124 125 125 126 126 128 131 131
133 136 138 140 141 141 144 146 145 144 143 143
144 146
7&8
100
98
108
137
150
162
130 167 161 150 158 146 146 133 155 148 153
129 123 137 158 154 160 169 164 169 205 181 195
166 170
i,' Merchandise total
Oto 9
l OOO
100
106
118
131 128
134
129 128 128 128 127 127 127 127 128 129 129
130 132 133 134 134 134 136 136 136 136 135 135
135 137
Merchandise total
Oto9
100
98
107
123
131 148
IOI 135 134 131 135 128 130 124 136 137 150
125 111 130 146 144 148 154 150 150 179 167 176
151 153
Note: Indexes from January 1982 onwards are based on the SITC (Revision 2). Earlier years' indexes are based on SITC (Revised) for comparison with the previous base year of 1973. §Unit value and quantum indexes for January 1982 onwards have been revised using market price survey data. These indexes are not strictly comparable to those in the past due to expansion of item
coverage as well as the change in method of pricing.
26 Hong Kong Monthly Digest of Statistics. April 1987

EXTERNAL TRADE
3.15 TRADE INDEX NUMBERS FOR DOMESTIC EXPORTS
Year/month
Weights
1981
1982
1983
1984
1985
1986
1985: Feb. Mar. Apr. May June July Aug. Sept. Oct. Nov. Dec.
1986: Jan. Feb. Mar. Apr. May June July Aug. Sept. Oct. Nov. Dec.
1987: Jan. Feb.
Year/month
1981
1982
1983
1984
1985
1986
1985: Feb. Mar. Apr. May June July Aug. Sept. Oct. Nov. Dec.
1986: Jan. Feb. Mar. Apr. May June July Aug. Sept. Oct. Nov. Dec.
1987: Jan. Feb.
Clothing#
35.2
IOO
110
123
146
148
152
150 147 146 148 149 151 151 150 148 147 144
145 146 144 146 148 150 152 155 156 157 156 156
155 156
Clothing#
IOO
93
99
113
I07
122
97 64 84
IOO Ill 116 115 I07 113 114 148
112 93 93
I03 113 125 139 140 126 129 127 159
136 84
Textile fabrics
5.1
100
I05
114
133
127
126
131 129 128 128 127 128 126 125 125 122 123
124 127 125 124 125 125 125 126 126 126 127 127
128 129
Textile fabrics
100
90
116
123
119
174
91 94
111 114 I08 113 121 117 134 144 162
118 107 139 156 160 158 185 189 194 222 238 225
201 172
Textile yam and
thread
0.7
IOO
94
IOO
112
115
115
120 118 116 117 117 116 117 116 115 112 I08
111 114 116 114 116 117 118 115 120 115 114 114
114 114
Textile yarn and
thread
IOO
112
157
150
123
154
85 I09 117 132 IOI 126 137 130 141 137 152
123 88
135 146 170 137 152 153 164 189 218 176
145 131
Textile made-ups
and related articles
0.7
IOO
114
132
155
163
169
169 170 168 165 162 162 159 156 157 162 160
161 164 164 168 171 166 165 170 173 172 174 176
174 170
Textile made-ups
and related articles
IOO
79
89
98
87
94
98 68 87 88
I07 90 79 78 74 90
I05
87 80 84
I05 115 IOO 89 78 75 94
112 110
90 74
UNIT VALUE INDEX NUMBERS (1981~100)
Commodity groups
Radiost of all Electronic@ kinds components Footwear
4.8
IOO
99
101
Ill
I06
97
109 llO I08 I08 110 I07 104 I02 IOI 98
IOl
I03 100 100 96 96 96 97 96 96 96 96 96
97 99
4.2
IOO
103
112
114
114
115
Ill llO 112 112 Ill 116 117 117 118 119 120
120 122 123 113 113 114 Ill 113 113 114 113 115
112 112
1.0
100
I08
115
128
122
123
118 116 119 119 120 122 125 126 125 123 123
121 119 118 122 123 123 123 125 126 126 124 124
122 124
Metalf manufactures
2.8
100
I08
115
133
137
137
135 137 138 136 138 140 141 139 136 132 130
133 135 138 138 138 138 137 137 136 137 138 138
136 139
QUANTUM INDEX NUMBERS (1981 ~JOO)
Commodity groups
Radiost of all Electronic@ kinds components Footwear
IOO
92
92
110
82
104
81 64 69 85 79 89 94 84 86 90 80
72 61 78 89
I03 101 110 118 120 137 136 124
119 87
IOO
84
133
205
154
149
140 185 141 160 173 143 160 142 163 144 147
138 IOI 157 177 169 153 167 149 137 148 158 128
149 123
100
83
81
101
104
119
Ill 84
I04 IOl I03 103 I06 91 91
I07 132
135 I02 115 I06 122 114 133 114 114 118 133 124
157 96
Metal' manufactures
100
94
I08
119
I09
126
95 81
110 113 107 Ill 120 114 I09 I09 125
I09 80
IOI 121 125 127 138 146 126 151 140 144
139 91
#Indexes from 1984 onwards are not strictly comparable to those in the past due to re-classification of commodity items. tindexes before and after January 1982 arc not comparable due to re-classification of commodity items.
Metal<1 ores and
scrap
0.8
100
93
113
I09
91
86
95 94 93 92 93 92 91 91 90 87 85
86 90 90 88 88 85 83 83 83 83 85 89
84 83
Metal; ores and
scrap
100
82
198
196
184
136
168 155 236 216 181 185 184 168 159 170 163
179 I06 123 116 153 116 137 122 134 168 139 136
158 113
Watches@ and
clocks
8.8
IOO
92
95
94
86
92
88 87 87 87 86 84 84 84 85 87 86
87 88 90 91 93 93 95 93 94 93 91 90
91 92
Watches@ and
clocks
100
110
123
133
151
177
113 118 123 144 145 161 173 180 179 197 161
139 120 157 173 175 158 190 192 184 217 235 182
168 122
Travel§ goods
handbags and
similar articles
2.0
100
I09
121
146
154
164
151 152 150 153 150 152 155 156 157 154 157
160 163 163 163 162 163 163 164 167 166 167 166
166 166
Travel§ goods
handbags and
similar articles
100
87
88
85
64
60
71 49 69 66 69 60 67 59 61 62 63
61 46 50 58 63 59 61 63 65 68 67 57
65 37
Domestic§; electrical
appliances
3.7
IOO
IOI
I07
116
I07
I02
110 Ill I08 I05 I07 I07 I06 I05 I04 I03 I02
I03 IOI IOO IOO 100 100 I02 103 I03 I04 104 I02
I02 I05
Domestic§' electrical
appliances
100
90 114
150
142
159
134 149 138 167 137 147 140 136 127 142 131
130 98
146 141 144 159 168 192 169 199 189 176
160 123
Otherjlf exports
30.2
IOO
112
124
136
136
141
133 135 135 137 138 140 140 138 135 132 134
137 140 141 139 140 140 139 141 141 143 142 141
138 141
Other#; exports
100
I02
119
146
142
169
118 124 141 148 142 151 159 144 142 152 145
134 96
135 152 166 164 189 198 190 211 195 192
185 137
@Unit value and quantum indexes for January 1982 onwards have been revised using market price survey data. These indexes are not strictly comparable to those in the past due to expansion of item coverage as well as the change in method of pricing.
§Grouped under 'other domestic exports' before January 1982. ' Indexes from 1986 onwards are not strictly comparable to those in the past due to re-classification of commodity items.
Hong Kong Monthly Digest of Statistics April 1987 27

EXTERNAL TRADE
Year/month
SITC section or division
Weights
1981
1982
1983
1984
1985
1986
1985: Feb. Mar. Apr. May June July Aug. Sept. Oct. Nov. Dec.
1986: Jan. Feb. Mar. Apr. May June July Aug. Sept. Oct. Nov. Dec.
1987: Jan. Feb.
Year/month
SITC section or division
1981
1982
1983
1984
1985
1986
1985: Feb. Mar. Apr. May June July Aug. Sept. Oct. Nov. Dec.
1986: Jan. Feb. Mar. Apr. May June July Aug. Sept. Oct. Nov. Dec.
1987: Jan. Feb.
Food, beverages
and tobacco
O&l
62
100
119
134
152
150
154
151 151 152 150 150 152 149 149 146 147 148
148 151 153 156 156 156 155 153 154 155 155 153
149 152
Food, beverages
and tobacco
O&l
100
lll
127
132
162
204
154 157 172 135 123 130 157 160 172 187 223
226 175 194 187 185 158 177 182 202 239 271 248
249 173
3.16 TRADE INDEX NUMBERS FOR RE-EXPORTS
Fuels
11
100
106
123
136
143
114
140 144 148 142 142 142 143 143 145 141 141
140 140 127 122 114 lll 108 106 104 109 107 108
112 ll5
Fuels
100
108
114
119 109 .
229
67 102 97
125 114 117 133 100 103 102 133
142 105. 160 211 281 231 251 268 238 305 325 234
246 250
Basic materials
2&4
79
100
105
ll3
128
136
123
141 139 142 139 137 138 136 136 132 127 127
125 124 126 122 122 123 126 124 120 120 118 125
127 127
Basic materials
2&4
100
89
102
126
128
149
105 133 147 123 106 ll5 130 123 127 139 139
155 103 146 143 157 149 134 129 136 175 179 187
168 158
UNIT VALUE INDEX NUMBERS (1981=100)
Industrial materials
Che.mi- Other semi-manufactures cals
Metals and mis
cellaneous metal
Textiles products Total
86
100
llO 124
136
139
143
144 140 144 144 142 139 138 136 134 134 136
140 140 141 142 147 145 145 144 146 144 143 143
149 147
65
167
100
105
lll 130
127
128
128 130 127 126 128 128 127 127 125 125 124
126 128 126 130 129 129 129 128 129 128 128 128
127 127
67, 68 &69
43
100
llO 127
148
151
152
153 154 151 150 149 148 151 148 150 152 149
147 154 158 154 154 152 151 150 151 151 152 150
155 157
QUANTUM INDEX NUMBERS (1981=100)
Industrial materials
6
293
100
107
115
132
130
132
132 133 131 131 131 130 129 129 129 128 127
129 132 131 133 134 133 133 132 133 132 132 132
131 132
Che.mi- Other semi-manufactures cals
100
100
Ill 132
160
200
105 144 154 154 155 158 177 165 174 185 211
168 151 186 200 179 181 208 199 208 232 251 233
200 203
Metals and miscellaneous
metal Textiles products
65
100
87
!Oi' 140
181
224
125 160 177 188 176 192 188 182 188 209 221
186 143 200 2ll 223 210 235 217 229 270 286 285
236 225
67,68 &69
100
ll4
121
153
231
215
138 201 260 319 252 278 230 239 228 207 233
209 171 184 199 205 219 208 215 212 257 242 261
232 201
Total
6
100
91
IOI 131
172
201
119 151 174 190 168 187 178 . 173 186 190 201
174 135 176 186 198 189 207 194 210 244 245 251
215 202
Total
2,4, 5&6
458
100
107
116
132
132
133
135 135 135. 134 134 132 132 131 130 129 128
130 132 132 133 134 134 134 133 133 132 132 133
134 133
Total
2,4, 5&6
100
93
103
130
163
192
114 147 166 172 155 169 170 163 174 181 193
170 133 173 182 188 181 196 185 198 231 235 237
205 195
Finished manufactures
Machinery and
transport equipment
7
250
100
113
124
143
144
147
144 145 145 142 143 142 142 142 143 147 145
144 144 141 147 147 149 149 149 147 147 147 147
144 146
Other
211
100
109
122
139
143
149
140 142 142 143 144 144 145 145 146 144 143
142 146 147 147 148 149 148 151 151 151 151 151
149 152
Finished manufactures
Machinery and
transport equipnient
100
93
105
161
209
184
214 284 267 239 201 198 187 164 159 164 186
153 122 164 193 177 165 184 177 199 219 212 242
220 196
Other
100
108
135
168
201
274
169 166 186 206 195 227 218 212 209 211 222
220 177 200 228 261 271 301 333 325 329 318 323
360 293
Total
7&8
460
100
Ill
123
141
143
147
142 144 143 143 143 143 143 143 144 146 144
143 145 143 147 147 149 148 150 148 149 149 148
146 149
Total
7&8
100
100
119
164
206 226
194 231 230 224 198 2ll 202 186 182 185 202
184 148 182 209 216 214 238 249 258 271 262 280
286 241
Merchandise total
Oto9
1000
100
110
121
137
139
142
139 140 140 139 139 138 138 138 138 138 138
138 140 139 142 142 143 143 143 142 142 142 142
141 142
Merchandise total .
.oto9
100
97
112
146
182
207
154 187 196 193 173 185 183 173 176 181 198
179 141 177 194 200 193 213 214 225 249 248 256
244 215
Note: Indexes f,.;,m January 1982 onwards are based on the SITC (Revision 2). Earller years' indexes are based on SITC (Revised) for comparison.with the previous base year of 1973.
28 Hong_ Kong Monthly Digest of Statistics April 1987

~ I 'i
Year/month
1981 1982 1983 1984 1985 1986
1985: Feb. Mar. Apr. May June July Aug. Sept. Oct. Nov. Dec.
1986: Jan. Feb. Mar. Apr. May June July Aug. Sept. Oct. Nov. Dec.
1987: Jan. Feb.
Year/month
1981 1982 1983 1984 1985 1986
1985: Feb. Mar. Apr. May June July Aug. Sept. Oct. Nov. Dec.
1986: Jan. Feb. Mar. Apr. May June July Aug. Sept. Oct. Nov. Dec.
1987: Jan. Feb.
EXTERNAL TRADE
3.17 TRADE INDEX NUMBERS FOR MAIN SUPPLIERS OF IMPORTS (1981=100)
China
100 106 112 128 125 121
126 125 125 125 126 126 125 125 125 123 121
122 122 121 121 121 121 121 121 120 120 120 120
121 121
U.S.A.
100 118 141 156 156 158
159 157 157 156 155 155 155 154 154 153 153
155 156 157 155 157 156 158 158 159 161 160 159
161 163
Unit value index
Japan
100 99
114 125 120 135
120 120 119 118 118 118 119 118 121 123 124
126 129 131 134 135 136 138 139 138 138 137 137
136 136
United Kingdom
100 113 124 132 132 139
131 130 131 130 130 131 132 133 135 135 136
138 139 139 138 139 138 139 141 140 140 141 139
140 142
Taiwan
100 107 113 127 126 128
129 129 128 127 126 125 125 125 125 124 124
125 125 127 126 127 127 128 129 129 130 130 129
129 130
China
100 106 129 148 160 229
104 131 146 148 146 162 162 164 182 196 225
197 132 181 210 221 231 240 244 250 278 272 296
264 216
U.S.A.
100 91 94
108 97
102
89 101 91 96
128 78
101 86 93
102 95
83 113 87 99 92 97 99
105 96
145 104 101
91 134
Quantum index
Japan
100 99
110 131 138 130
123 169 159 144 145 139 128 120 144 130 135
110 106 120 139 127 129 137 123 129 154 132 154
116 133
United Kingdom
100 97 96
105 102 107
69 105 104 92 97 91
123 94
105 110 121
81 89
101 115 117 97
116 111 98
119 122 117
102 106
3.18 TRADE INDEX NUMBERS FOR MAIN MARKETS OF DOMESTIC EXPORTS (1981=100)
China
100 108 118 134 136 139
135 135 136 136 137 138 138 137 136 137 136
138 139 138 138 138 140 140 140 140 141 139 139
139 141
U.S.A.
100 108 121 140 141 144
140 141 140 141 141 143 143 142 141 140 140
141 143 143 143 143 144 143 145 146 147 146 147
145 147
Unit value index
Japan
100 114 129 136 134 142
135 135 135 134 133 133 134 133 133 134 135
138 139 139 139 140 140 141 142 145 144 145 146
145 148
United Kingdom
100 104 110 125 124 127
123 123 123 124 124 125 125 124 123 122 123
124 125 125 125 126 127 128 130 130 129 128 128
127 128
F.R.of Germ.any
100 103 109 121 119 121
121 118 117 118 118 119 120 119 118 117 116
117 118 118 117 119 120 121 123 124 124 125 125
124 126
China
100 120 181 288 382 442
342 420 428 419 359 382 361 332 351 359 394
346 239 346 406 428 412 456 471 494 563 557 590
511 463
U.S.A.
100 99
124 150 140 152
114 100 120 142 148 151 159 153 153 150 150
132 102 125 137 151 154 171 176 167 183 166 163
150 102
Quantum index
Japan
100 95
103 129 114 149
84 114 114 102 109 117 143 133 121 120 107
107 86
122 123 131 129 149 175 175 197 204 185
182 110
United Kingdom
100 90
101 109 90
101
80 64 79 84 89 94 92 85 92 95
126
87 65 81 92 99
102 118 118 101 115 109 127
109 65
Taiwan
100 89
102 127 154 174
117 173 175
'164 161 160 144 139 147 160 167
136 106 152 171 175 178 178 176 174 212 206 224
190 175
F.R. of Germany
100 97
105 111 96
129
93 65 70 87 95
108 95 82 83
111 159
111 93
103 103 119 130 151 152 124 132 141 183
165 116
Hong Kong Monthly Digest of Statistics April 1987 29
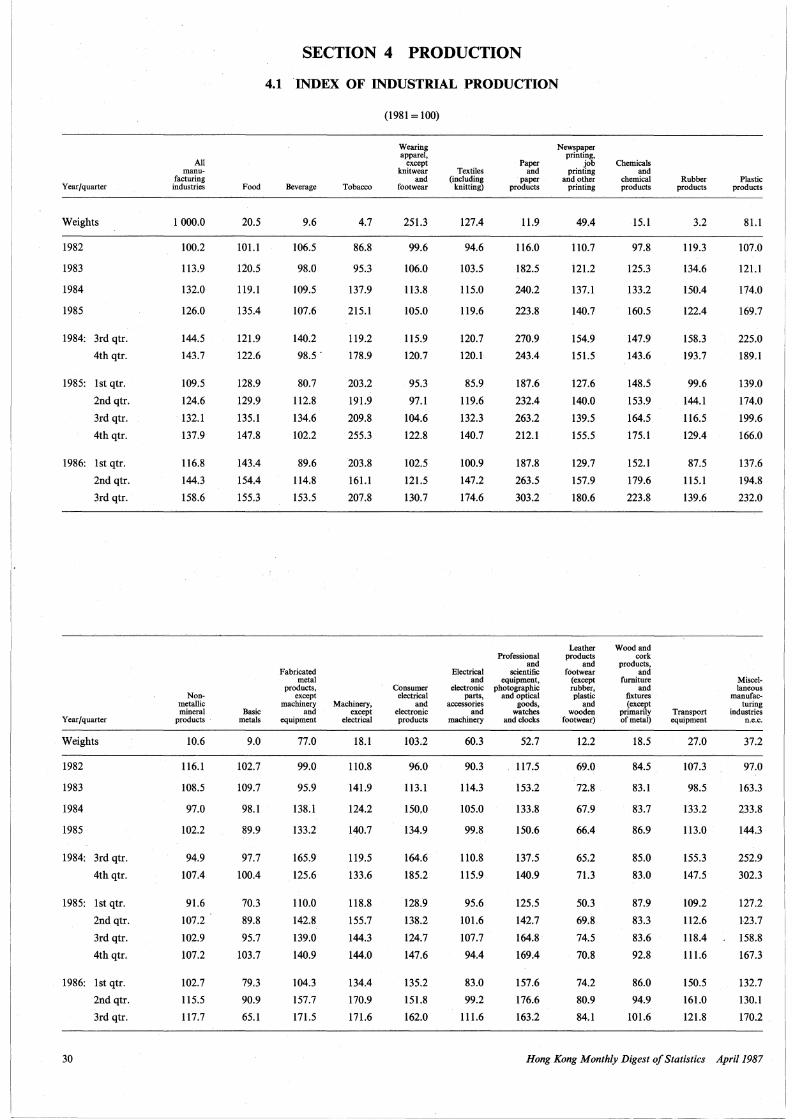
Year/quarter
Weights
1982
1983
1984
1985
1984: 3rd qtr.
4th qtr.
1985: lst qtr.
2nd qtr.
3rd qtr.
4th qtr.
1986: lst qtr.
2nd qtr.
3rd qtr.
Year/quarter
Weights
1982
1983
1984
1985
1984: 3rd qtr.
4th qtr.
1985: lst qtr.
2nd qtr.
3rd qtr.
4th qtr.
1986: lst qtr.
2nd qtr.
3rd qtr.
30
All manu
facturing industries
1 000.0
100.2
113.9
132.0
126.0
144.5
143.7
109.5
124.6
132.1
137.9
116.8
144.3
158.6
Nonmetallic mineral
products
10.6
116.1
108.5
97.0
102.2
94.9
107.4
91.6
107.2
102.9
107.2
102.7
115.5
117.7
Food
20.5
101.1
120.5
119.1
135.4
121.9
122.6
128.9
129.9
135.1
147.8
143.4
154.4
155.3
Basic metals
9.0
102.7
109.7
98.l
89.9
97.7
100.4
70.3
89.8
95.7
103.7
79.3
90.9
65.l
SECTION 4 PRODUCTION
4.1 INDEX OF INDUSTRIAL PRODUCTION
Beverage
9.6
106.5
98.0
109.5
107.6
140.2
98.5.
80.7
112.8
134.6
102.2
89.6
114.8
153.5
Fabricated metal
products, except
machinery and
equipment
77.0
99.0
95.9
138.l
133.2
165.9
125.6
110.0
142.8
139.0
140.9
104.3
157.7
171.5
Tobacco
4.7
86.8
95.3
137.9
215.l
119.2
178.9
203.2
191.9
209.8
255.3
203.8
161.1
207.8
Machinery, except
electrical
18.1
110.8
141.9
124.2
140.7
119.5
133.6
118.8
155.7
144.3
144.0
134.4
170.9
171.6
(1981=100)
Wearing apparel,
except knitwear
and footwear
251.3
99.6
106.0
113.8
105.0
115.9
120.7
95.3
97.l
104.6
122.8
102.5
121.5
130.7
Consumer electrical
and electronic products
103.2
96.0
113.l
150.0
134.9
164.6
185.2
128.9
138.2
124.7
147.6
135.2
151.8
162.0
Textiles (including
knitting)
127.4
94.6
103.5
115.0
119.6
120.7
120.l
85.9
119.6
132.3
140.7
100.9
147.2
174.6
Electrical and
electronic parts,
accessories and
machinery
60.3
90.3
114.3
105.0
99.8
110.8
115.9
95.6
101.6
107.7
94.4
83.0
99.2
111.6
Paper and
paper products
11.9
116.0
182.5
240.2
223.8
270.9
243.4
187.6
232.4
263.2
212.l
187.8
263.5
303.2
Professional and
scientific equipment,
photographic and optical
goods, watches
and clocks
52.7
117.5
153.2
133.8
150.6
137.5
140.9
125.5
142.7
164.8
169.4
157.6
176.6
163.2
Newspaper printing,
job printing
and other printing
49.4
110.7
121.2
137.1
140.7
154.9
151.5
127.6
140.0
139.5
155.5
129.7
157.9
180.6
Leather products
and footwear
(except rubber, plastic
and wooden
footwear)
12.2
69.0
72.8
67.9
66.4
65.2
71.3
50.3
69.8
74.5
70.8
74.2
80.9
84.l
Chemicals and
chemical products
15. l
97.8
125.3
133.2
160.5
147.9
143.6
148.5
153.9
164.5
175.1
152.1
179.6
223.8
Woodand cork
products, and
furniture and
fixtures (except
primarily of metal)
18.5
84.5
83.1
83.7
86.9
85.0
83.0
87.9
83.3
83.6
92.8
86.0
94.9
101.6
Rubber products
3.2
119.3
134.6
150.4
122.4
158.3
193.7
99.6
144.1
116.5
129.4
87.5
115.1
139.6
Transport equipment
27.0
107.3
98.5
133.2
113.0
155.3
147.5
109.2
112.6
118.4
111.6
150.5
161.0
121.8
Plastic products
81.1
107.0
121.1
174.0
169.7
225.0
189.l
139.0
174.0
199.6
166.0
137.6
194.8
232.0
Miscellaneous
manufacturing
industries n.e.c.
37.2
97.0
163.3
233.8
144.3
252.9
302.3
127.2
123.7
158.8
167.3
132.7
130.l
170.2
Hong Kong Monthly Digest of Statistics April 1987

4.2 INDEX OF TEXTILE PRODUCTION
Year/quarter
Weights
1982
1983
1984
1985
1986
1984: 4th qtr.
1985: lst qtr.
2nd qtr.
3rd qtr.
4th qtr.
1986: lst qtr.
2nd qtr.
3rd qtr.
4th qtr.
Spinning and
weaving industries
1 OOO
90
99
95
94
114
93
79
93
98
107
94
111
120
133
§Including yarns/fabrics of pure MMF material.
Sector index
380
90
93
89
88
105
89
74
91
90
96
88
104
108
120
All types
243
100
106
105
108
135
108
89
112
109
123
112
133
141
154
l. Number of spinning and weaving establishments
2. Number of persons engaged
Operatives Male
Female
Other employees Male
Female
(1981=100)
Spinning sector
Cotton yarn
Under 15's and 15's over
168
94
113
109
114
147
ll4
89
121
116
128
121
143
155
170
75
112
92
96
96
108
93
89
90
95
112
93
110
111
119
Cotton/ Woollen MMF and yarn§ worsted
yarn
101
71
71
54
39
36
50
38
39
46
34
33
37
37
36
36
76
64
76
82
100
73
72
92
82
84
85
101
85
129
4.3 TEXTILE PRODUCTION
1985 4th qtr.
789
28 137
13 189
11406
2429
1 113
3. Total estimated man-hours worked by operatives ('OOO) 15 715
4. Machinery by type
Spindles
Looms
No. installed
No. in operation
No. installed
No. in operation
Hong Kong Monthly Digest of Statistics April 1987
414 033
350 718
20 563
18 716
Sector index
620
89
103
99
99
120
96
82
95
103
114
98
114
128
140
All types
556
92
107
104
105
129
100
88
102
109
122
104
122
137
153
1986 3rd qtr.
809
28286
13 458
11 468
2 310
1 050
17 018
410 915
355 743
22293
21 419
PRODUCTION
Weaving sector
Cotton piecegoods Cotton/ MMF piece
goods§ Yarn
Grey dyed
235
91
97
115
99
110
120
92
97
94
114
103
109
114
115
321
93
114
95
110
143
86
85
106
120
128
105
132
154
180
1986 4th qtr.
777
28 730
13 901
11 319
2 377
1133
17146
392 033
377 230
21 416
20 507
64
66
68
60
41
43
56
30
37
52
44
43
47
47
35
31
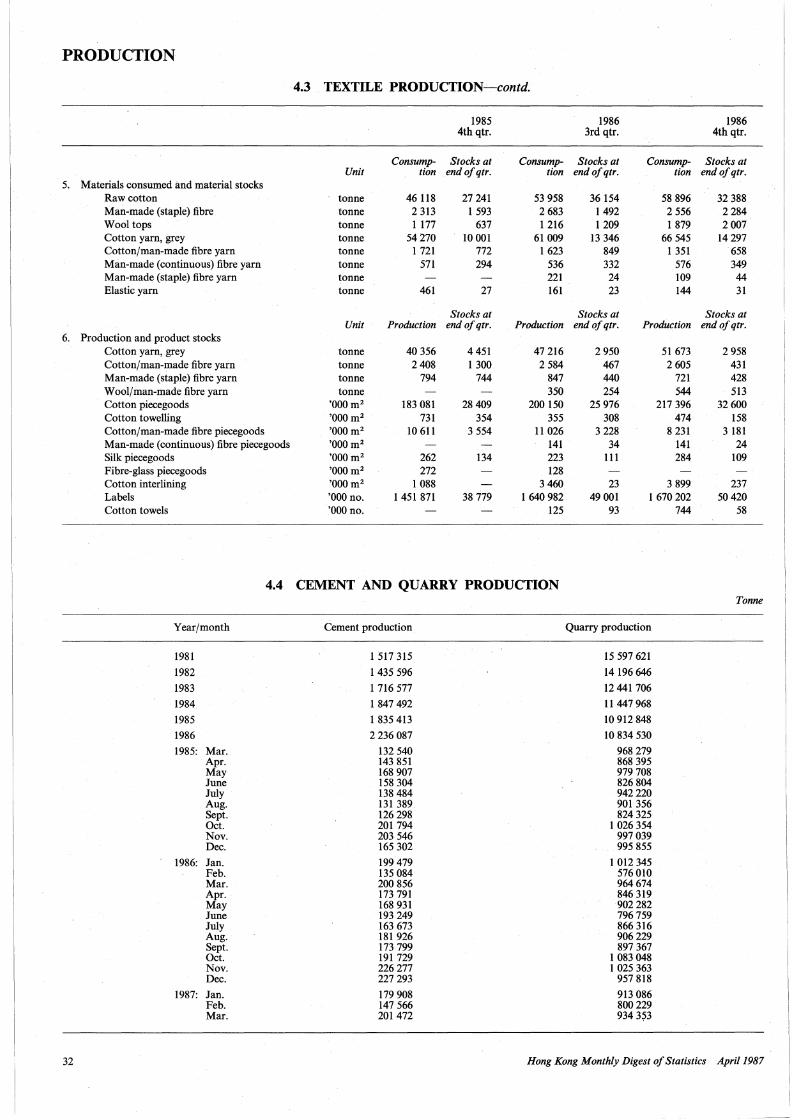
PRODUCTION
4.3 TEXTILE PRODUCTION-contd.
1985 1986 1986 4th qtr. 3rd qtr. 4th qtr.
Consump- Stocks at Consump- Stocks at Consump- Stocks at Unit tion end of qtr. tion end of qtr. tion end of qtr.
5. Materials consumed and material stocks Raw cotton tonne 46 118 27 241 53 958 36 154 58 896 32 388 Man-made (staple) fibre tonne 2 313 I 593 2 683 1492 2 556 2284 Wool tops tonne I 177 637 I 216 1209 I 879 2007 Cotton yarn, grey tonne 54270 10 001 61 009 13 346 66 545 14 297 Cotton/man-made fibre yarn tonne I 721 772 I 623 849 I 351 658 Man-made (continuous) fibre yarn tonne 571 294 536 332 576 349 Man-made (staple) fibre yarn tonne 221 24 109 44 Elastic yarn tonne 461 27 161 23 144 31
Stocks at Stocks at Stocks at Unit Production end of qtr. Production end ofqtr. Production endofqtr.
6. Production and product stocks Cotton yarn, grey tonne 40 356 4451 47 216 2 950 51 673 2 958 Cotton/man-made fibre yarn tonne 2408 I 300 2 584 467 2 605 431 Man-made (staple) fibre yarn tonne 794 744 847 440 721 428 Wool/man-made fibre yarn tonne 350 254 544 513 Cotton piecegoods '000m2 183 081 28 409 200 150 25 976 217 396 32600 Cotton towelling '000m2 731 354 355 308 474 158 Cotton/man-made fibre piecegoods '000m2 10 611 3 554 11 026 3 228 8 231 3 181 Man-made (continuous) fibre piecegoods 'OOO m2 141 34 141 24 Silk piecegoods '000m2 262 134 223 111 284 109 Fibre-glass piecegoods '000m2 272 128 Cotton interlining '000m2 I 088 3 460 23 3 899 237 Labels 'OOO no. I 451 871 38 779 I 640 982 49 001 I 670 202 50420 Cotton towels 'OOO no. 125 93 744 58
4.4 CEMENT AND QUARRY PRODUCTION Tonne
Year/month Cement production Quarry production
1981 I 517 315 15 597 621
1982 I 435 596 14 196 646
1983 I 716 577 12 441 706
1984 I 847 492 11447968
1985 I 835 413 10 912 848
1986 2 236 087 10 834 530
1985: Mar. 132 540 968 279 Apr. 143 851 868 395 May 168 907 979 708 June 158 304 826 804 July 138 484 942 220 Aug. 131 389 901 356 Sept. 126 298 824 325 Oct. 201 794 I 026 354 Nov. 203 546 997039 Dec. 165 302 995 855
1986: Jan. 199 479 I 012 345 Feb. 135 084 576 010 Mar. 200 856 964674 Apr. 173 791 846 319 May 168 931 902 282 June 193 249 796 759 July 163 673 866 316 Aug. 181 926 906229 Sept. 173 799 897 367 Oct. 191 729 I 083 048 Nov. 226 277 I 025 363 Dec. 227 293 957 818
1987: Jan. 179 908 913 086 Feb. 147 566 800229 Mar. 201 472 934 353
32 Hong Kong Monthly Digest of Statistics April 1987

Year/ quarter
1982: 3rd qtr.
1983: lst qtr. 3rd qtr.
1984: l st qtr. 3rd qtr.
1985: lst qtr. 3rd qtr.
1986: lst qtr. 3rd qtr.
SECTION 5 LAND, HOUSING, BUILDING AND CONSTRUCTION
Hong Kong Island
281.1
290 .. 0 288.5
295.l 296.0
309.8 316.9
323.0 332.0
5.1 STOCK OF PERMANENT LIVING QUARTERS
Kowloon and New Kowloon
557.5
560.6 559.9
570.7 572.0
586.9 592.5
595.6 594.7
Tsuen Wan
N.A.
N.A. N.A.
N.A. N.A.
152.4 150.7
154.5 158.l
Sha Tin
N.A.
N.A. N.A.
N.A. N.A.
80.7 90.7
95.4 101.3
Tuen Mun
N.A.
N.A. N.A.
N.A. N.A.
63.3 65.l
74.3 74.3
Tai Po
N.A.
N.A. N.A.
N.A. N.A.
25.3 27.9
34.3 37.3
Fanling/ Sheung
Shui
N.A.
N.A. N.A.
N.A. N.A.
20.6 21.8
22.6 22.6
Rest of New
Territories
N.A.
N.A. N.A.
N.A. N.A.
108.8 109.8
110.4 112.6
Thousand
Total
1 175.0
1 210.9 1 214.l
l 266.0 1 279.5
l 347.8 l 375.4
l 410.l l 432.9
5.2 STOCK AND AUTHORIZED POPULATION OF PUBLIC HOUSING RENTAL FLATS
As at end of year /quarter
1981
1982
1983
1984
1985
1986
1985: lst qtr.
2ndqtr.
3rd qtr.
4th qtr,
1986: lst qtr.
"2nd qtr.
3rd qtr.
4th qtr.
1987: lst qtr.
Hong Kong Island
Flats Persons
Kowloon and New Kowloon
Flats Persons
Tsuen Wan
Flats Persons
Sha Tin
Flats Persons
TuenMun Tai Po Fanling/
SheungShui
Flats Persons Flats Persons Flats Persons
57 814 293 300 271 945 I 207 100 89 378 441 800 17 905 83 200 20 322 86 800 4 868 19 300
Rest of New Territories
Flats Persons
Total
Flats Persons
5 830 20 700 468 062 2 152 200
60 486 295 900 275 268 I 190 800 92 555 450 700 25 667 126 300 28 949 122 800 4 868 22 500 4 OOO 12 100 5 830 22 500 497 623 2 243 700
60 677 301 200 277 092 1183 300 93 024 449 OOO 31 942 154 OOO 36 611 150 500 7 290 30 OOO 5 082 20 400 5 830 23 200 517 548 2 311 600
60 657 299 400 282 431 I 158 100 94 790 444 OOO 40 329 191 500 39 137 167 400 8 738 39 200 9 384 31 500 6 384 25 500 541 850 2 356 600
60 773 295 700 290 297 I 155 400 97 416 446 800 45 510 206 900 39 138 170 500 13 328 48 900 9 384 38 600 6 487 25 800 562 333 2 388 600
60 808 291 800 283 790 I 130 500 99 733 445 200 48 520 225 500 45 203 194 700 16 245 65 200 II 261 45 600 8 148 32 100 573 708 2 430 600
60 654 298 600 287 677 I 166 600 98 252 448 500 41 855 195 100 39 137 167 600 10 252 39 500 9 384 35 300 6 384 25 500 553 595 2 376 600
60 643 297 900 286 339 I 169 700 97 373 451 400 42 341 198 600 39 127 169 300 II 060 46 800 9 384 37 100 6 487 26 OOO 552 754 2 396 700
60 748 296 900 287 181 I 155 500 97 471 447 OOO 43 888 202 300 39 139 169 700 II 060 48 300 9 384 37 900 6 487 25 900 555 358 2 383 400
60 773 295 700 290 297 I 155 400 97 416 446 800 45 510 206 900 39 138 170 500 13 328 48 900 9 384 38 600 6 487 25 800 562 333 2 388 600
60 782 295 300 288 760 I 147 300 99 715 446 700 45 471 209 300 45 194 185 700 14 133 55 800 10 173 40 200 8 147 26 300 572 375 2 406 700
60 785 293 600 287 352 I 144 800 98 908 452 300 46 279 214 800 45 202 191 700 14 208 59 900 10 173 42 OOO 8 147 26 300 571 054 2 425 400
60 77 5 292 300 285 085 I 140 I 00 98 640 446 600 48 312 220 300 45 203 193 I 00 14 929 62 500 10 173 42 400 8 148 28 300 571 265 2 425 600
60 808 291 800 283 790 I 130 500 99 733 445 200 48 520 225 500 45 203 194 700 16 245 65 200 11 261 45 600 8 148 32 100 573 708 2 430 600
63 226 295 700 281 857 I 123 700 99 589 443 200 50 382 229 400 -45 210 195 600 16 561 69 900 12 564 50 300 9 948 33 500 579 337 2 441 300
Hong Kong Monthly Digest of Statistics April 1987 33

HOUSING
Year/quarter
1981
1982
1983
1984
1985
1986
1985: lst qtr.
2nd qtr.
3rd qtr.
4th qtr.
1986: 1 st qtr.
2nd qtr.
3rd qtr.
4th qtr.
1987: lst qtr.
Year /quarter
1981
1982
1983
1984
1985
1986
1985: lst qtr.
2nd qtr.
3rd qtr.
4th qtr.
1986: lst qtr.
2nd qtr.
3rd qtr.
4th qtr.
1987: lst qtr.
5.3 RESIDENTIAL UNITS/FLATS COMPLETED BY GEOGRAPHIC AREA
Hong Kong Island
62
Kowloon and
New Kowloon
9 858
3 361 10 208
2 383
60
6020
7 873
80 13 836
17
80
17
6200
5 089
6202
1 526
2 229
3 879
2 577
1 350
1 162
420
Tsuen Wan
2 334
5 817
411
3 466
4 257
4462
4257
4462
Sha Tin
4 616
9477
5 889
8 841
5 196
5 084
2002
778
2 416
3 232
1 852
4080
Public
Tuen Mun
3 696
8 098
8 741
1462
1 632
4440
1 632
4440
Home Ownership Scheme---rcontinued
Rest Fanling/ of New
Tai Sheung Terri-Po Shui tories Total
Hong Kong Island
395
1 984
1 408
1 680
1460
1 680
1460
1 248
1 584
528
528
7 546 10 493
7 620 5 290
8 523 10 979
13 195 4 799
20 206 10 596
6 480 12 268
1 616
9112
2900
6 578
1 043
3 714
2450
3 389
2 170
3 140 4 261
3 340
6 698
4 106
1 731
2 779
Tai Po
2246
2482
1462
4 597
3 240
2 329
2268
816
792
1 632
Kowloon and
New Kowloon
9477
3 189
4 291
7 237
6478
5 164
2 692
1 423
1 432
931
298
632
1443
Fanling/ Sheung
Shui
4000
1 082
4 304
3 264
816
2448
Tsuen Wan
Rest of New
Territories Total
2 136 24 948
40 961
27008
472 27 940
29 598
2 836 28 432
14 790
2 384
4645
7 779
1 848 14 976
988
4024
1 350
8 082
3 299 13 999
Sha Tin
Private
Tuen Mun
2 907 4 042 909
3 253 3 148
2 146 3 052
1 749
5 186
5 863
2
4190
748
246
1 347
1 756
269
3 647
7 390
5 757
527
3 459
1 233
2 171
1 720
1 931
3 208
473
246
584
894
3 361
220
45
2 791 2 491
697
1409 849
672 554 221 343
Hong Kong Island
1 716
760
304
3 078
2100
978
2 180
Tai Po
407
385
291
1 006
2693
1 816
30
1 214
152
1 297
744
27
44
1 001
419
Home Ownership Scheme
Kowloon and
New Kowloon
1 508
2 576
922
3 371
6 504
5 020
6 504
1 680
3 340
3 178
Fanling/ Sheung
Shui
294
205
356
160
43
42
9
10
14
10
10
16
8 8
30
Tsuen Wan
1 614
1 920
800
1 120
1 340
Rest of New
Territories
Sha Tin
992
2136
3 264
2 176
816
560
800
Total
Tuen Mun
2 313
2044
3 177
3 568
4320
1 520
2800
Grand total
1 896 30 425 62 919
2 225 20 903 69 484
1 934 23 522 59 053
1 757 20 601 61 736
1 643 34 613 84 417
1 209 33 013 67 925
88 4 394 20 800
575 14 946 26 442
620 6 649 14 194
360 8 624 22 981
121
95
441
6 455 21 431
8 718 15 882
7 008 8 358
552 10 832 22 254
914 5 932 26 629
Note: Home Ownership Scheme includes Private Sector Participation Scheme (P.S.P.S.) and Middle Income Housing (MIH).
34 Hong Kong Monthly Digest of Statistics April 1987

HOUSING
5.4 RESIDENTIAL UNITS/FLATS COMPLETED BY FLOOR AREA
Public Home Ownership Scheme Private
Under 40m2 Under 40m2 70m2 Under 40m2 70m2 100m2 160m2
Year/quarter 40m2 --69.9 m' 40m2 --69.9 m 2 -99.9 m' 40m' --69.9 m' -99.9 m 2 -159.9 m' and above
1981 23 962 986 3 500 4046 23 260 4 271 698 859 1 337
1982 37 051 3 910 2 224 5 396 14 212 3 993 978 719 I 001
1983 25 010 1 998 179 8 344 15 060 4 535 I 593 I 175 I 159
1984 23 985 3 955 5 648 7 547 17 207 1 433 930 448 583
1985 26 415 3 183 16 942 3 164 100 27 409 4 597 I 343 678 586
1986 23 701 4 731 6 316 164 25 148 5 391 579 I 324 571
1985: lst qtr. 13 863 927 I 212 404 3 933 34 120 126 181 2nd qtr. I 922 462 8 840 272 11 771 2 543 387 87 158 3rd qtr. 3 750 895 1 850 I 050 5 101 582 662 185 119 4th qtr. 6 880 899 5 040 I 438 100 6604 I 438 174 280 128
1986: lst qtr. 12 830 2 146 5 996 146 94 100 119 2nd qtr. 3 018 I 006 2 976 164 5 533 2 658 276 117 134 3rd qtr. I 350 4 819 1 543 147 294 205 4th qtr. 6 503 I 579 3 340 8 800 I 044 62 813 113
1987: lst qtr. 10 835 3 164 5 654 I 044 4334 I 393 108 18 79
Note: Home Ownership Scheme includes Private Sector Participation Scheme (P.S.P.S.) and Middle Income Housing (MIR). Under public, Housing Authority rental flats are classified by lettable floor area and Housing Society flats by usable floor area. Under Home Ownership Scheme, Home Ownership Scheme flats are classified by saleable floor area and Private Sector Participation Scheme/Middle Income Hoµsing flats by usable floor area. Under private, all fiats are classified by usable floor area except small village-type houses by gross floor area.
5.5 RESIDENTIAL UNITS/FLATS WITH CONSENT TO COMMENCE WORK BY GEOGRAPHIC AREA
Public Home Ownership Scheme
Kowloon Rest Kowloon Hong and Fanling/ of New Hong and Kong New Tsuen Sha Tuen Tai Sheung Terri- Kong New Tsuen Sha Tuen
Year /quarter Island Kowloon Wan Tin Mun Po Shui tories Total Island Kowloon Wan Tin Mun
1981 3 959 411 8 914 8 010 4466 25 760 760 3 371 2 142
1982 12 821 8 402 14 091 3 129 3 782 4286 472 46983 298 560 3 672
1983 7 644 4 394 3 961 6072 3 900 816 26 787 2 800 I 120 2800
1984 5 838 7 512 9 148 I 612 5 042 9 220 38 372 3 078 11 878 I 340 I 850 I 520
1985 3 437 6 051 4 398 7 680 3 136 2 934 6908 34 544 4140 2 180 3 700
1986 2 737 7 048 10 132 4430 3 920 4 748 2 856 35 871 2 100
1985: lst qtr. 3 265 3 276 3 426 2644 2440 15 051 2nd qtr. 3rd qtr. 172 I 328 2204 2 244 2492 8440 2 180 2 180 I 680 4th qtr. 1447 972 2 832 892 2934 I 976 11 053 I 960 2020
1986: lst qtr. 2 928 I 396 4324 2nd qtr. 2230 7 540 I 836 3 116 2436 17 158 I 050 3rd qtr. 2 345 1890 480 2 594 420 7 729 4th qtr. 392 716 3 920 I 632 6660 I 050
1987: lst qtr. 2 304 3 768 3 458 I 224 192 10946 660 I 890 2100
Hong Kong Monthly Digest of Statistics April 1987 35

HOUSING
5.5 RESIDENTIAL UNITS/FLATS WITH CONSENT TO COMMENCE WORK BY GEOGRAPHIC AREA-contd.
Home Ownership Scheme-continued Private Grand total
Rest Kowloon Rest Fanling/ of New Hong and Fanling/ of New
Tai Sheung Terri- Kong New Tsuen Sha Tuen Tai Sheung Terri-Year/quarter Po Shui tories Total Island Kowloon Wan Tin Mun Po Shui tories Total
1981 6 273 7 552 2 346 5 762 613 2 520 692 325 2 372 22 182 54 215
1982 I 584 6 114 5072 3 929 571 4227 328 799 229 2 061 17 216 70 313
1983 2 512 528 9 760 5 110 5 743 2144 7 313 2 111 742 132 2119 25 414 61 961
1984 ,. 19 666 13 638 2 928 l 727 3 612 518 3 475 120 976 26994 85 032
1985 720 I 050 11 790 12 079 5 867 6 358 4206 2 560 I 838 276 1478 34662 80996
1986 I 750 3 850 10 379 5 954 5492 3 627 5 530 I 686 60 3 302 36 030 75 751
1985: lst qtr. 720 720 4 364 I 081 881 672 455 779 11 52 8 295 24066 2nd qtr. I 598 470 2 279 I 507 5 36 15 361 6271 6 271 3rd qtr. 1 050 7090 3 005 1 237 I 768 98 118 564 19 644 7 453 22 983 4th qtr. 3 980 3 112 3 079 1 430 1929 I 982 459 231 421 12 643 27 676
1986: lst qtr. I 825 1 898 I 363 1472 1 483 31 299 8 371 12 695 2nd qtr. I 050 2 485 1 550 360 868 1645 104 3 873 7 888 26096 '3rd qtr. I 750 I 750 1 968 1 412 426 137 1 515 20 20 562 6060 15 539 4th qtr. I 050 4 101 1 094 3 343 1150 2 370 79 6 I 568 13 711 21421
1987: lst qtr. 4 650 3 018 607 829 10 563 893 26 281 6 227 21 823
Note: Home Ownership Scheme includes Private Sector Participation Scheme (P.S.P.S.) and Middle Income Housing (MIH).
5.6 RESIDENTIAL UNITS/FLATS WITH CONSENT TO COMMENCE WORK BY FLOOR AREA
Public Home Ownership Scheme Private
Under 40m2 Under 40m2 70m2 Under 40m12 70m2 100m2 160m2
Year/quarter 40m2 -69.9 m' 40m2 -69.9 m2 -99.9 m' 40m2 -69.9 m2 -99.9 m2 -159.9 m2 and above
1981 21 431 4 329 2647 3 626 12 718 4 759 1 103 939 2 663
1982 39 345 7 638 1984 4130 12 673 I 837 888 783 I 035
1983 24 034 2 753 8 228 I 532 21404 I 179 724 l 115 992
1984 32 039 6 333 14 872 4 695 99 20 870 3 756 738 1 033 597
1985 23 216 II 328 6 212 5 578 25 899 6499 I 199 486 579
1986 25 694 10 177 I 540 2 310 24056 7 974 2 555 643 802
1985: lst qtr. II 977 3 074 720 5 945 1 723 313 193 121 2nd qtr. 5 556 347 72 74 222 3rd qtr. 3 314 5 126 3 472 3 618 5 094 1417 721 80 141 4th qtr. 7 925 3 128 2020 1960 9 304 3 012 93 139 95
1986: lst qtr. 2 697 I 627 5 648 I 382 746 143 452 2nd qtr. 12 380 4 778 420 630 5 030 2 133 392 202 131 3rd qtr. 6 014 I 715 700 I 050 4046 I 314 491 89 120 4th qtr. 4 603 2 057 420 630 9 332 3 145 926 209 99
1987: lst qtr. 8 567 2 379 2994 1 656 4144 1 487 317 44 235
Note: Home Ownership Scheme includes Private Sector Participation Scheme (P.S.P.S.) and Middle Income Housing (MIH). Under public, Housing Authority rental flats are classified by lettable floor area and Housing Society flats by usable floor area. Under Home Ownership Scheme, Home Ownership Scheme flats are classified by saleable floor area and Private Sector Participation Scheme/Middle Income Housing flats by usable floor area. Under private, all flats are classified by usable floor area except small village-type houses by gross floor area.
3() Hong Kong Monthly Digest of Statistics April 1987

5.7 BUILDINGS COMPLETED BY TYPE
Year/month
1981
1982
1983
1984 198S
1986
198S: Mar. Apr. May June July Aug. Sept. Oct. Nov. Dec.
1986: Jan. Feb. Mar. Apr. May June July Aug. Sept. Oct. Nov. Dec.
1987: Jan. Feb. Mar.
Residential
Usable lloor
No. area
86S
S12 494
280
439
778
28 3
25 117
16 32 24 28 S5 78
71 S1 IS 44 32 70 60 28 8S 66
111 139
138 44 14
'000m2
48S
291 386
188
488 701
3S 9
88 54 91 68 48 s 4
68
SI s s
78 46 34
IS5 17 S9 s
62 182
102 16 4
tLess than SOO square metres.
Residenti!'I/ commerc1al
Usable ftoor area Non-
Residen- residen-No. tial tial
2S8
254 188
190 24S
166
16 44 IS so 12 11 19 22 19 18
14 14 13 7
30 16 14 12 6
10 20 10
11 7
30
'OOO m2 'OOO m2
S86 483
6S9
427 962
471
48 272 42
199 39 16 62 91 69
104
17 3S 33 12
171 31 31 13 3
28 73 24
21 18
106
184
202
330
143 193
12S
36 17 9
39 6 7
26 13 22 11
8 8 5 3
29 26 10 s 2 8
IS 6
8 4
12
Commercial
Usable lloor
No. area
88 102
118
80
4S
32
3 3 4 3 s 2 3 4 7 6
I 2 2 I 3 7 s 3 2 I 2 3
'000m2
402
666
801
319 2S3
22S
11 7 7 4
23 28 4
11 16 9
t s 3
78 2
98 8
13 3 I s
11
3 17
Industrial
Usable lloor
No. area
104
118
64
62 S6
S9
s s s 3 3 s 2 4
9
s 7 4 4 4 4 9 3 6 I 6 6
3 4 4
'000m2
1370
1363
727
686 819
810
268 30
121 20 29
107 11 27
132
S2 134 39 48 40 47 71 6
104 38
102 129
36 30 73
Others
Usable lloor area Non-
Rcsiden- rcsiden-No. tial tial
83
107 124
146 137
112
IS 9 8 6
18 IS IS 6
11 8
23 7
10 s 9 2 s
IS 9 8
13 6
IS 5
16
'OOO m2 'OOO m2
13
11
S7
10 11
6
t
i I 2 t s t
t
t 2
i I t
t t
ISI
204
131
IS7 179
192
2 4
17 t
4S S3 18 s
28 3
10 9 4
61 6
1i 9
28 4 8
40
6 3 3
5.8 BUILDINGS WITH CONSENT TO COMMENCE WORK BY TYPE
Year/month
1981
1982 1983
1984 198S
1986
198S: Mar. Apr. May June July Aug. Sept. Oct. Nov. Dec.
1986: Jan. Feb. Mar; Apr. May June July Aug. Sept. Oct. Nov. Dec.
1987: Jan. Feb. Mar.
Residential
Usable floor
No. area
696
297
268
418 337
792
3S 16 12 3
7S 10 9
.3S 41 14
46 22 14 61
124 SS 60 14
179 71
107 39
S2 27 24
'000m2
42S
383 334
781 785
762
121 24 SI 33 61 80 48
ISS 30
116
87 26 68 76 43 4S 69
8 3S
128 43
13S
90 38 59
tLess than 500 square metres.
Residential/ commercial
Usable floor area · Non-
Residen- residen-No. tial tial
178
134
IS2
161 201
IS8
9 10 11 8 9
17 2
24 69 11
21 s
14 7 7
IS 20
8 11 8
16 26
13 18 7
'OOO m2 '000 m2
733 2S7
447 427
sso 636
29 28 13 13 31
137 s
109 21 54
S7 16 S9 48 44 SS 24 4S 38 S3 S3
142
47 64 6
186
Ill
127
103 9S
203
9 7 4 4
12 IS I 9 7 9
14 s
18 13 29 11 IS 12 4
S4 13 13
10 16 2
Hong Kong Monthly Digest of Statistics April 1987
Commercial
Usable floor
No. area
118
110
78
46 36
so 4 7 3 s 2 I
4 s
2 3 3 2 7 4 8
10 2 2
3 6 8
'000m2
928
S98 342
136
120 4SO
16 12 17 9
11 10
14 2S
36
34 46 3S 13 IS 90 32
140 8 3
8 3S 50
Industrial
Usable floor
No. area
IOI
77 S4
38
S7 79
3 3 4 4 7 2 4 3 8
10
8 6 3 s 3 s 9 9
12 3
10 6
3 4 6
'OOOm' 1743
I S88 660
SOS
868 I 043
40 S6 54 4S
168 39
!OS 4
ISS 76
136 S8 so
IOI 40 68 88 80
103 12
254 S3
21 4S 98
Others
Usable floor area Non-
Residen- residen-No. tial tial
131
121 110
129 120
180
12 9 8
12 9 9 7
13 IS 7
9 6
14 9
11 6
12 20 19 18 43 13
9 11 IS
'OOO m2 'OOO m2
29 80 16
48 12
22
3 t
t
t
~ I 8
~
i t
103 128
262
2S6
164
273
9 29 IS 13 7
38 2
17 7
14
14 9
29. 4
S6 JO 20 S6 26 12 32 6
I 8
67
BUILDING
Total
Usable lloor area Non-
Residen- residen-No. tial tial
1398
I 093
988
7S8 922
1147
67 64 S7
179 54 6S 63 64 92
119
114 87 44 61 78 99 93 61
108 86
IS2 164
170 63 64
'000m2 '000m2
I 084
78S
1103
62S 1461
1178
83 281 129 2S4 131 87
110 101 74
172
68 40 38 90
220 66
187 31 63 34
13S 207
123 34
109
Total
2108
2436
1989
1304 1443
1352
316 S7
IS3 64
103 19S S8 56 66
ISS
71 IS6 51
190 77
171 100 32
136 so
130 18S
S3 54 88
Usable lloor area Non-
Residen- residen-No. tial tial
1224
739
662
792 7Sl
I 2S9
63 4S 38 32
102 39 22 79
138 42
91 39 47 8S
148 83
108 SS
229 110 178 86
80 66 60
'OOO m2 'OOO m2
1188
1io 797
l.2S6
1347
1420
ISI S2 67 46 92
217 S3
264 SI
171
144 42
127 124 89
108 93 61 74
181 99
277
138 102 6S
29S9
2424
1390
1000
1247
1969
74 104 91 71
198 102 108 44
194 99
199 72
131 164 160 101 138 238 16S 218 306
7S
40 104 217
37

PROPERTY
5.9 PRICE INDEXES BY. TYPE OF PREMISES
(4th Quarter 1979= 100)
Private domestic premises Shops Offices Flatted factories
under 40-- 70-- 100m2
Year/quarter 40m2 69.9m2 99.9m2 and above Overall (Grades Band C) (Urban area only)
1981: lst qtr. 147 149 150 146 148 139 178 162 2nd qtr. 149 147 153 147 150 144 179 164 3rd qtr. 150 149 150 145 148 156 171 169 4th qtr. 146 146 143 147 145 150 169 159
1982: I st qtr. 140 134 136 135 136 144 168 139 2nd qtr. 133 132 129 125 129 114 164 135 3rd qtr. 127 124 125 120 124 111 158 128 4th qtr. 120 120 117 107 115 100 165 114
1983: lst qtr. 116 111 105 93 105 96 108 117 2nd qtr. 117 111 105 93 105 98 98 101 3rd qtr. 114 107 98 90 100 90 92 103 4th qtr. 107 102 92 78 93 82 93 93
1984: lst qtr. 110 105 92 80 94 84 84 92 2nd qtr. 111 104 90 81 94 86 66 97 3rd qtr. 106 100 86 74 90 77 75 94 4th qtr. 107 101 90 76 91 80 68 91
1985: lst qtr. 110 106 96 80 95 84 72 106 2nd qtr. 114 113 101 89 99 88 76 100 3rd qtr. 119 117 111 98 105 91 74 101 4th qtr. 123 119 116 105 107 95 84 107
1~86: lst qtr. 124 119 115 103 109 101 82 104 2nd qtr. 126 118 115 104 108 101 89 104 3rd qtr.t 131 123 118 103 t 102 83 105 4th qtr.t 133 125 113 107 t 105 85 106
Note: Price indexes are based on an analysis of all transactions scrutinized by the Rating and Valuation Department for stamp duty purposes with an agreement date within the quarter, but exclude 'forward sale' transactions and transactions of premises in the New Territories. The number and loCation of transactions analysed may vary from quarter to quarter, consequently the price indexes should be regarded as providing a broad indication of price trends only.
tProvisional figures. tThe basis for calculating this index is currently under revision
5.10 RENTAL INDEXES BY TYPE OF PREMISES
(4th Quarter 1979= 100)
Priyate domestic premises Shops Offices Flatted factories
under 40-- 70-- 100-- 160m2
Year/quarter 40m' 69.9m2 99.9m2 159.9m' and above Overall (Grades A, B and C) Urban area New Territories
1981: lst qtr. 149 141 137 157 160 145 146 189 146 134 2nd qtr. 167 147 148 157 181 155 176 196 174 141 3rd qtr. 171 149 154 174 179 162 181 210 187 154 4th qtr. 171 148 153 172 179 160 196 213 190 136
1982: lst qtr. 165 150 152 169 178 159 183 220 176 147 2nd qtr. 172 151 154 163 180 161 204 204 177 158 3rd qtr. 170 152 154 159 175 159 193 196 171 174 4th qtr. 174 152 153 158 148 156 196 173 152 146
1983: lst qtr. 163 145 142 155 156 150 191 158 136 133 2nd qtr. 158 142 142 139 142 144 184 153 137 128 3rd qtr. 159 139 135 136 133 140 183 147 135 138 4th qtr. 160 137 123 126 124 132 179 144 133 132
1984: lst qtr. 153 137 126 124 118 131 172 143 129 130 2nd qtr. 156 137 127 124 123 132 178 136 129 139 3rd qtr. 156 141 128 124 126 134 170 133 137 135 4th qtr. 159 142 127 126 125 135 163 128 132 137
1985: lst qtr. 157 142 133 132 135 137 176 128 140 137 2nd qtr. 160 143 137 134 143 139 176 133 143 141 3rd qtr. 160 149 139 141 154 142 182 139 146 143 4th qtr. 162 148 147 146 162 145 176 144 149 143
1986: lst qtr. 163 150 150 152 170 147 186 154 152 145 2nd qtr. 165 152 150 158 170 147 189 156 152 152 3rd qtr. 168 157 155 165 175 t 190 158 152 151 4th qtr.t 168 157 153 165 179 t 179 166 150 161
Note: Rental indexes are based on rental information recorded in the Rating and Valuation Department for new and fresh lettings effective in the quarter. For non-domestic premises, rentals negotiated on renewal are also included. Although all rentals are analysed on a net basis, i.e. exclusive of rates, management and other charges, no attempt is made to adjust for other contractual terms. The number and location of rents analysed may vary from quarter to quarter, consequently the rental indexes should be regarded as providing a broad indication of rental trends only.
tProvisional figures. tThe basis for calculating this index is currently under revision.
38 Hong Kong Monthly Digest of Statistics April 1987

PROPERTY
5.11 INSTRUMENTS REGISTERED IN THE LAND OFFICE
Assignments of properties Mortgages/legal charges
Building Mortgages/legal charges
other than building Assignments Assignments Assignments Assignments of mortgages/building mortgages/building
oflot of share of lot of section share of section legal charges legal charges
Year/month No. Value No. Value No. Value No. Value No. Value No. Value
$Mn. $Mn. $Mn. $Mn. $Mn. $Mn.
1981 460 10,580.90 17 939 17,709.73 508 10,063.06 33 608 19,276.12 130 1,366.88 56974 48,760.26
1982 255 3,848.81 17 365 12,723.21 275 3,368.75 30 650 18,822.44 119 1,483.27 49 709 38,148.25
1983 201 2,032.08 17 888 10,028.74 247 2,750.34 30 376 13,927.55 54 608.35 41022 40,615.00
1984 201 683.31 19 816 9,364.00 217 1,490.62 32 542 13,014.61 46 286.09 43 857 15,362.74
1985 293 3,168.49 28 931 13,216.58 301 3,751.07 44 860 18,091.98 52 974.10 64 602 25,147.89
1986 338 16,475.02 26 504 21,464.90 315 11,647.37 53 983 24,036.45 49 908.61 76004 33,085.76
1985: Mar. 22 159.08 1603 804.65 19 126.19 3 521 1,372.42 2 5.60 4392 1,486.20 Apr. 16 169.52 1276 642.68 18 61.91 3 563 1,366.20 5 74.25 3 887 1,221.08 May 27 1,096.87 I 695 766.45 16 383.97 3 245 1,229.88 3 35.20 4103 1,677.64 June 23 162.78 l 634 957.70 20 100.69 3 023 1,171.20 I 25.00 4639 1,836.26 July 25 136.38 7 624 2,451.41 35 327.64 4037 1,739.89 3 35.00 10026 3,235.40 Aug. 21 173.07 2433 1,140.76 35 610.91 4 754 1,838.45 15 300.40 6059 2,601.69 Sept. 29 112.49 2069 926.45 26 674.64 4114 1,780.87 10 208.70 5 697 2,535.77 Oct. 39 604.83 I 844 999.59 30 204.84 4323 1,709.02 2 114.25 6045 2,752.75 Nov. 38 225.90 2 765 1,647.82 31 695.99 4440 1,746.98 4 112.00 6687 2,927.09 Dec. 21 140.93 3 088 1,412.98 32 210.69 3 361 1,321.93 3 14.00 6010 2,401.65
1986: Jan. 42 5,952.55 2 242 1,090.97 39 3,819.85 4 411 2,292.59 5 51.50 6148 2,501.57 Feb. 23 7,082.89 1648 1,041.39 26 3,493.89 3 135 1,282.39 4 32.40 4438 1,437.10 Mar. 23 157.12 1648 1,176.38 26 683.02 3 530 1,592.73 5 206.30 4 911 2,213.19 Apr. 27 562.77 2 223 1,355.16 30 253.60 3 452 1,479.28 5 114.93 5 249 3,003.89 May 29 132.68 2 058 1,253.78 23 628.75 4648 1,880.20 6 101.50 6 114 2,599.22 June 26 153.52 I 532 5,115.68 20 96.00 4498 1,710.21 4 45.60 5 527 3,215.05 July 24 332.65 2106 1,457.86 31 190.24 5 478 2,208.15 5 139.60 6 524 2,711.75 Aug. 35 403.06 2477 1,807.17 30 143.04 4 791 2,272.42 2 25.50 7004 2,675.28 Sept. 30 1,141.52 2 713 1,594.65 13 190.82 4415 2,115.20 3 49.10 8 388 3,251.85 Oct. 35 151.64 3 370 2,348.99 23 1,468.14 5 653 2,688.08 1 16.00 8 732 3,463.21 Nov. 13 139.18 I 925 1,507.63 13 404.48 4979 2,358.84 2 80.00 5 913 2,401.81 Dec. 31 265.44 2 562 1,715.24 41 275.52 4993 2,156.37 7 46.18 7056 3,611.83
1987: Jan. 14 1,114.91 2252 2,165.84 22 507.83 5 399 3,204.19 2 19.00 8 292 3,471.69 Feb. 22 332.33 2 604 1,400.20 33 1,072.55 4241 2,673.33 4 65.50 6 748 3,619.88 Mar. 33 375.58 3 043 2,257.41 27 295.81 5 291 3,217.46 I 30.00 8 291 3,706.87
Exclusion Reassignments/ orders
receipts/discharges/ issued under releases and Agreements Landlord
certificates of for sale Tenancy and Tenant satisfaction and purchase agreements Ordinance Miscellaneous Total
Year/month No. Value No. Value No. No. No. Value No. Valuet
$Mn. $Mn. $Mn. $Mn.
1981 35 462 18,218.29 24998
} N.A.
2 329 27 17 310 14.60 189 745 125,989.84
1982 30 072 21,011.26 17 436 2 831 15 16499 62.48 165 226 99,468.48
1983 26 957 12,255.23 24447 2179 4 17 008 261.02 160 383 82,478.30
1984 26 726 14,586.35 29 959 ll,934.64t 2 580 4 20 677 148.59 176 625 54,936.30
1985 36 633 22,735.10 54 405 36,965.12 2 349 3 30 505 50.31 262 934 87,135.51
1986 41 061 22,182.20 56 549 48,954.29 2 588 4 35401 83.72 292 796 129,884.03
1985: Mar. 2 873 1,170.19 4 865 2,670.85 193 2 786 0.94 20 277 5,125.27 Apr. 2 633 1,142.26 7 857 3,123.76 214 2 394 9.06 21 863 4,686.97 May 3 014 1,357.37 4072 2,930.04 230 2 540 0.25 18 945 6,547.63 June 2 590 2,578.42 3 976 3,463.35 175 2 519 6.46 18 600 6,838.51 July 3 187 1,360.63 4483 3,127.62 252 2 388 0.94 32061 9,287.29 Aug. 3 270 1,826.18 4 118 2,686.22 195 2 316 3.10 23 216 8,494.57 Sept. 3 498 3,354.50 4 637 2,817.36 175 3 333 0.01 23 588 9,593.44 Oct. 3 932 3,776.21 6 677 5,526.78 183 2 843 2.96 25 918 10,164.45 Nov. 3 823 1,887.98 4 610 4,318.42 216 2 822 0.01 25 436 9,243.76 Dec. 3 203 1,390.27 4139 2,558.82 175 2261 0.40 22 293 6,892.85
1986: Jan. 3 334 1,389.22 3 526 4,479.28 229 2 861 16.56 22 837 17,114.82 Feb. 2 869 1,599.42 2 305 2 455.88 184 2 326 3.88 16 958 15,973.36 Mar. 2 937 3,059.27 3 894 3,640.50 183 2450 19 609 9,088.01 Apr. 3 171 1,926.48 4194 3,334.24 204 3 086 51.72 21641 8,747.83 May 3 587 1,820.53 5 273 3,714.03 239 3 782 0.11 25 759 8,416.75 June 3 139 1,220.77 3 476 2,420.59 182 2 626 4.21 21 030 11,561.04 July 3 705 2,901.80 4337 4,621.32 224 4064 26498 9,942.04 Aug. 3 217 1,384.48 5 724 3,881.06 188 3410 26 878 8,710.97 Sept. 3 590 1,936.18 6 674 4,284.59 174 2 669 28 670 10,279.32 Oct. 4 688 1,968.76 6 210 4,682.51 370 3 082 6.08 32 165 12,110.89 Nov. 3 190 1,225.83 5 207 4,806.47 179 2430 23 851 8,117.77 Dec. 3 634 1,749.47 5 729 6,633.81 232 2 615 l.17 26900 9,821.22
1987: Jan. 3 814 1,544.32 5 579 5,788.76 226 2631 0.02 28 231 12,027.80 Feb. 3 934 2,033.80 3 771 3,624.87 232 2 330 0.01 23 919 11,197.60 Mar. 3 978 2,296.42 5 353 6,482.78 252 2 635 11.13 28 904 12,190.68
tFigures do not include the value of agreements for sale and purchase. jFigures for April to December.
Hong Kong Monthly Digest of Statistics April 1987 39

CONSTRUCTION AND LAND
5.12 GROSS VALUE OF CONSTRUCTION WORK PERFORMED BY BUILDING AND CIVIL ENGINEERING CONTRACTORS
All contractors by broad trade group Main contractors by work location
At other minor work
New construction locations work and At building and erected
renovation and Special and construe- buildings and Year/quarter maintenance trades Total tion sites structures Total
1983 28,924 6,437 35,361 21,248 3,557 24,805
1984 28,743 7,564 36,307 20,707 4,543 25,250
1985 28,416 9,257 37,674 19,156 5,514 24,672
1984: 3rd qtr. 7,178 1,963 9,141 5,125 1,234 6,359 4th qtr. 7,368 2,143 9,511 5,105 1,218 6,323
1985: lst qtr. 7,188 2,167 9,355 4,832 1,427 6,259 2nd qtr. 6,977 2,418 9,396 4,778 1,265 6,044 3rd qtr. 6,793 2,219 9,012 4,483 1,399 5,883 4th qtr. 7,458 2,453 9,911 5,063 1,423 6,486
1986: lst qtr. 7,366 1,957 9,323 4,806 1,347 6,153 2nd qtr. 7,359 2,067 9,426 4,751 1,333 6,085 3rd qtr. 7,848 2,333 10, 181 5,091 1,315 6,406
5.13 DISPOSALS OF GOVERNMENT LAND
Public auction/tender
Urban area
Industrial/ Commercial/ godown Commercial residential Residential Other uses
Realised Realised Realised Realised Realised Year/ quarter Area premium Area premium Area premium Area premium Area premium
m' $Mn. m' $Mn. ID' $Mn. m' $Mn. m' $Mn.
1981 88 875 1,539.19 4 358 258.60 182 966 2,652.08 4269 399.11
1982 29 033 173.00 2489 376.50 15 699 2,884.50 144420 1,095.29
1983 11 286 49.30 10 706 228.80 1148 18.62 8 029 42.10 912 10.80
1984 10 023 79.80 9 433 390.30 13 512 151.23 3 528 36.52 (345.00)
1985 5 590 58.20 3 429 302.00 47 468 1,921.08 9 855 325.50 (I. 72)
1986 4020 64.50 10 875 99.80 18 611 1,192.90 83 961 1,469.00
1985: lst qtr. 26 935 491.90 2 843 20.00 2nd qtr. 500 9.00 3 429 302.00 13 886 788.78 2243 51.00
3rd qtr. 2 169 22.00 198 (!. 72)
4.40 91 0.50 4th qtr. 2 921 27.20 6449 636.00 4678 254.00
1986: lst qtr. 10 875 99.80 5 285 102.00 2nd qtr. 1 020 13.00 16 271 1,008.20 2 781 57.00 3rd qtr. 123 3.20 4 755 114.00 4th qtr. 3 OOO 51.50 2 217 181.50 71140 1, 196~00
1987: Ist qtr. 8 487 195.00 444 27.50
Note: Figures in brackets indicate payments made in Monetised Letter B, i.e. revenue foregone.
$million
Index of value of construction
work performed by main contractors
(quarterly average of 1982 = 100)
94.1
95.8
93.6
96.5 96.0
95.0 91.7 89.3 98.4
93.4 92.4 97.2
Total
Realised Area premium
m' $Mn.
280468 4,848.98
191 641 4,529.29
32 081 349.62
36496 657.85 (345.00)
66 342 2,606.78 (1.72)
117 467 2,826.20
29 778 511.90 20058 1,150.78
(1.72) 2458 26.90
14048 917.20
16 160 201.80 20072 1,078.20
4 878 117.20 76 357 1,429.00
8 931 222.50
40 Hong Kong Monthly Digest of Statistics April 1987
i
I
I
I
I

LAND
5.13 DISPOSALS OF GOVERNMENT LAND-contd.
Year/ quarter
1981
1982
1983
1984
1985
1986
1985: lst qtr.
2nd qtr.
3rd qtr. 4th qtr.
1986: lst qtr. 2nd qtr. 3rd qtr. 4th qtr.
1987: lst qtr.
Year/ quarter
1981
1982
1983
1984
1985
1986
1985: lst qtr. 2nd qtr.
3rd qtr. 4th qtr.
1986: lst qtr.
2ndqtr. 3rd qtr.
Industrial/ god own
Realised Area premium
38 333
83 478
17 532
36472
16 034
23 775
3 834
9 646
2 554
20056
3 719
6694
$Mn.
305.00
162.83
26.90
50.10 (10.45)
28.60 (7.80)
68.40
0.20 (5.80) 21.40 (2.00)
7.00
57.40
11.00
44.50
Industrial/ godown ·
Realised Area premium
24 575
3 210
$Mn.
92.22
13.82
1 685 0.10 (11.90)
I 685 0.10 (11.90)
Commercial
Realised Area premium
m•
1 956
7405
15 627
7 918 7709
$Mn.
8.88
5.38
114.68
102.68 12.00
Commercial
Realised Area premium
4270
5 005
$Mn.
4.76
14.22
Public auction/tender-continued
New Territories
Commercial/ residential Residential
Realised Realised Area premium
20564
2625
24407
12 658
$Mn.
465.00
19.85
31.98
43.30
Area premium
192 154
72696
46 501
28226
$Mn.
712.17
.33.71
150.10
17.85 (104.00)
10050 71.65 136 420 514.15
4574
6498
3 552
4 574
315
29.20
41.65
30.00
29.20
2.94
23450
1 875
134 545
520 22930
34706
175.49
1.55
512.60
2.60 172.89
403.20
Letter A/B tender (New Territories only)
Commercial/ residential
Realised Area premium
44970
31 536
$Mn.
146.20
90.22
29 323 51.84
32 596 56.61 (15.77)
28 776 70.61
11 341 27.18
Residential
Realised Area premium
m• 33900
35 745
$Mn.
86.77
17.47
12 490 12.04
33 239 56.41 (34.67)
17 580 15.55 (14.50)
65 575 131.57 (28.80)
5 320 11.93 12 260 3,62
(14.50)
13 054 11.19 (18.90)
50 521 116.86
Other uses
Realised Ai:ea premium
124602
19 795
411 190t
708
$Mn.
241.40
62.95
20.67
19.80
Total
Realised Area premium
m• 375 653
180 550
507 035
78 064
$Mn.
1,723.57
288.22
235.03
131.05 (114.45)
1425 0.14 163 929 614.54 (7.80)
6 591 111.20
1 425 0.14
6 591 111.20
Other uses
Realised Area premium
74017
5 709
152 114
3 552'' 2554
39 139 7709'
520 26649
41 715
498.97
1.75 (5.80)
575.79 (2.00) 30.00 7.00
300.48 12.00 2.60
183.89
450.64
Total
Realised Area premium
m• $Mn. m• $Mn.
329.95
121.51
5 219 15.98
107 715
70491
52037 94.08
65 835 113.02 (50.44)
17 580 15.55 (14.50)
96 036 202.28 (40.70)
5 320 11.93 12 260 3.62
(14.50)
26080 38.47 (30.80)
53 483 123.27 2962
14473
13 660
6.41
37.02
34.58
(9.90) • (9.90) 4th qtr.
1987: lst qtr.
Note: Figures in brackets indicate payments made in Monetised Letter B, i.e. revenue foregone. tincluding 210 OOO square metres of sea area.
Hong Kong Monthly Digest of Statistics April 1987
2000 3.52 16473 40.54
1 596 13.71 15 256 48.29
41

LAND
5.13
Industrial/ god own
Year/ quarter Area
m2
1981 1982 10000 1983 16 980 1984 179 1985 1986
1985: lst qtr. 2nd qtr. 3rd qtr. 4th qtr.
1986: lst qtr. 2nd qtr. 3rd qtr. 4th qtr.
New series 1986 l 057 1986: lst qtr.
2nd qtr. 3rd qtr. 4th qtr. l 057
1987: lst qtr.
Industrial/ god own
Year/quarter Area
m2
1981 676 600 1982 1983 1984 1985 1986
1985: lst qtr. 2nd qtr. 3rd qtr. 4th qtr.
1986: lst qtr'. 2nd qtr. 3rd qtr. 4th qtr.
New series 1986 1986: lst qtr.
2nd qtr. 3rd qtr. 4th qtr.
1987: lst qtr.
DISPOSALS OF GOVERNMENT LAND-contd.
Residential
Area
m2
79429 44000
3 053 326 558 117 640
13 588
117 640
12 500
l 088
3 394
3 394 8 514
Residential
Area
m2
162 930 158 230 84 150 46429
130 230 34 650
31 130 99100
13 250 21400
36 580
36 580
72 708
Private treaty grant
Urban areas
Public utilities/ institutional uses
Area
m2
66234 39 383
101 311 21480 51 954 52 797
22440 29 514
2 163 2014
48 620
67429 8029 l 001
51 871 6 528
23 560
Private treaty grant-continued
New Territories
Public utilities/ institutional uses
Area
m2
76 685 43 522 35 632
273 333 98 454 18 760
2200 61970 21484 12 800
2 905
675 15 180
40 619 28 641
2 310 1642 8026
9993
Other uses Total
Area Area
m2 m2
16 700 162 363 218 718 312 101 116 700 238 044 43 687 391 904
187 800 357 394 21 597 87 982
2 880 25 320 184 776 331 930
144 144
4 151 18 814 8040 10054 l 033 l 033 8 373 58 081
11 739 83 619 4 151 12 180
l 001 l 048 52 919 6540 17 519
32074
Other uses Total
Area Area
m2 m2
323 535 1239750 59 330 261 082 2097 121 879 1 681 321 443
l 382 615 1611299 167 644 221 054
36600 69930 l 058 815 1 219 885
21 484 287 200 300 OOO
158 650 161 555
4572 18 497 4422 41 002
l 461 78 660 28 641 2310
l 165 2807 296 44902
219 572 302 273
Note: Anew series of 'Private treaty grant' statistics has been adopted since January 1986. Figures for the new series are on 'Agreement' basis, i.e. land disposal based on the date on which the offer of a grant of land by Government is accepted by the grantee; whereas those for the old series refer to the 'Approval' basis, i.e. land disposal based on the date on which a grant is approved by Executive Council or its delegated function. To facilitate comparison with past data, the old series will be published in parallel with the new series until the 4th quarter of 1986 after which it will be discontinued.
42 Hong Kong Monthly Digest of Statistics April 1987

SECTION 6 TRANSPORT, COMMUNICATIONS AND TOURISM
Year/month
1981 1982 1983 1984 1985 1986
1985: Mar. Apr. May June July Aug. Sept. Oct. Nov. Dec.
1986: Jan. Feb. Mar. Apr. May June July Aug. Sept. Oct. Nov. Dec.
1987: Jan. Feb. Mar.
6.1 AIRCRAFT MOVEMENTS
Arrivals
27 699 27 312 27 140 28 505 29 849 32 438
2407 2453 2497 2403 2 5IO 2 558 2 443 2 605 2 563 2615
2 569 2 519 2 600 2 534 2 684 2 639 2 753 2 863 2 725 2 867 2 815 2 870
2946 2662 2 881
Departures
27 694 27 323 27 141 28 511 29 852 32 436
24IO 2 447 2 499 2 407 2 509 2 558 2439 2 609 2 557 2 618
2 567 2 521 2 596 2 535 2 680 2 639 2 761 2 860 2 720 2 869 2812 2 876
2 951 2 655 2 887
Total
55 393 54635 54281 57016 59 701 64 874
4817 4900 4996 48IO 5019 5 116 4 882 5 214 5 120 5 233
5 136 5040 5196 5069 5 364 5 278 5 514 5 723 5 445 5 736 5 627 5 746
5 897 5 317 5 768
6.2 OCEAN-GOING VESSELS ENTERED AND CLEARED
British American Chinese Taiwanese
Year/month
1981 1982 1983 1984 1985 1986
1985: Mar. Apr. May June July Aug. Sept. Oct. Nov. Dec.
1986: Jan. Feb. Mar. Apr. May June July Aug. Sept. Oct. Nov. Dec.
1987: Jan. Feb. Mar.
Entered
'OOO No. N.R.T.
429 3 843 561 5 230 557 5 284 483 5 003 504 4 932 712 4 222
27 71 28 43 33 34 25 35 37 49
46 87 51 61 41 53 54 64 70 55 76 54
97 66 66
453 519 339 518 387 459 282 506 301 456
346 356 420 406 252 368 356 318 383 411 301 304
315 321 287
N.R. T. ~Net Registered Tons.
Cleared
'OOO No. N.R.T.
478 3 913 598 5 194 579 5111 482 5 042 577 4 936 798 4 208
27 73 31 59 35 40 29 36 44 56
49 110 96 46 42 56 49 65 80 60 82 63
127 53 71
417 492 375 483 406 499 288 465 341 432
350 346 396 432 258 376 324 311 375 408 305 328
311 308 308
Entered
'OOO No. N.R.T.
306 4 597 283 4 148 328 4 870 317 4 783 352 6 533 322 6 777
33 31 25 32 29 26 28 32 29 32
26 23 33 30 31 29 24 25 22 30 28 21
22 21 18
576 498 402 581 542 540 596 576 588 673
556 470 633 562 606 538 560 602 526 604 638 481
450 379 327
Hong Kong Monthly Digest of Statistics April 1987
Cleared
'OOO No. N.R.T.
Entered
'OOO No. N.R.T.
Cleared
'OOO No. N.R.T.
Entered
'OOO No. N.R.T.
Cleared
'OOO No. N.R.T.
313 4 582 I 148 3 791 I 142 3 878 817 I 735 812 I 660 296 4158 I 288 4156 I 316 4192 870 I 862 863 1 843 323 4883 1372 4418 1379 4400 972 3190 964 3163 318 4 791 I 613 5 251 1 627 5 384 I 082 4 136 1 084 4 155 360 6438 2121 6849 2145 6846 1175 4966 1173 4954 333 6 795 2 794 9 469 2 814 9 459 I 157 5 238 I 155 5 207
32 30 27 37 28 26 26 38 27 33
29 23 36 26 34 27 24 27 23 29 28 27
22 17 21
544 156 497 166 430 165 581 150 527 177 523 186 569 182 581 177 561 199 665 227
598 229 464 221 655 231 521 228 604 219 580 213 524 220 615 - 238 551 231 582 262 622 248 480 254
450 243 350 233 363 227
507 480 499 434 552 588 653 570 681 768
723 708 874 752 710 706 773 805 813 834 945 826
850 896 830
152 158 168 154 180 186 181 186 202 224
227 230 236 223 224 210 214 241 237 269 260 243
262 220 229
503 460 532 438 547 560 612 654 677 758
738 759 851 702 730 688 745 837 801 831 950 826
952 765 870
I04 97 98
I03 I09 99 98 99 98 98
97 75
I07 94
I02 96 97 94 94
108 94 99
88 85
111
425 402 418 500 446 412 458 450 438 387
403 347 433 395 446 433 426 435 429 561 440 489
425 400 581
I02 94
IOI IOI llO IOI 96
I02 95
IOO
95 74
I08 95
100 95 96 97 94
I07 95 99
90 85
I08
400 402 412 481 479 416 445 463 434 390
377 347 415 399 455 403 430 443 446 564 430 498
425 4IO 579
Danish
Entered
'OOO No. N.R.T.
323 4 445 350 4 962 391 5 099 362 4449 401 5 035 374 4 768
38 35 38 33 34 34 29 29 34 32
33 28 33 28 35 31 34 29 29 32 32 30
27 28 30
471 427 490 427 444 425 373 352 433 4IO
428 360 428 347 436 356 440 390 396 385 439 364
361 387 400
Cleared
'OOO No. N.R.T.
322 4423 349 4 918 393 5 143 360 4 425 399 5 035 370 4 764
38 35 35 35 33 35 30 29 33 33
31 28 35 28 34 30 32 31 30 31 31 29
27 29 31
464 434 441 464 429 432 391 352 417 425
394 359 462 347 418 398 400 425 410 366 427 358
365 393 408
43
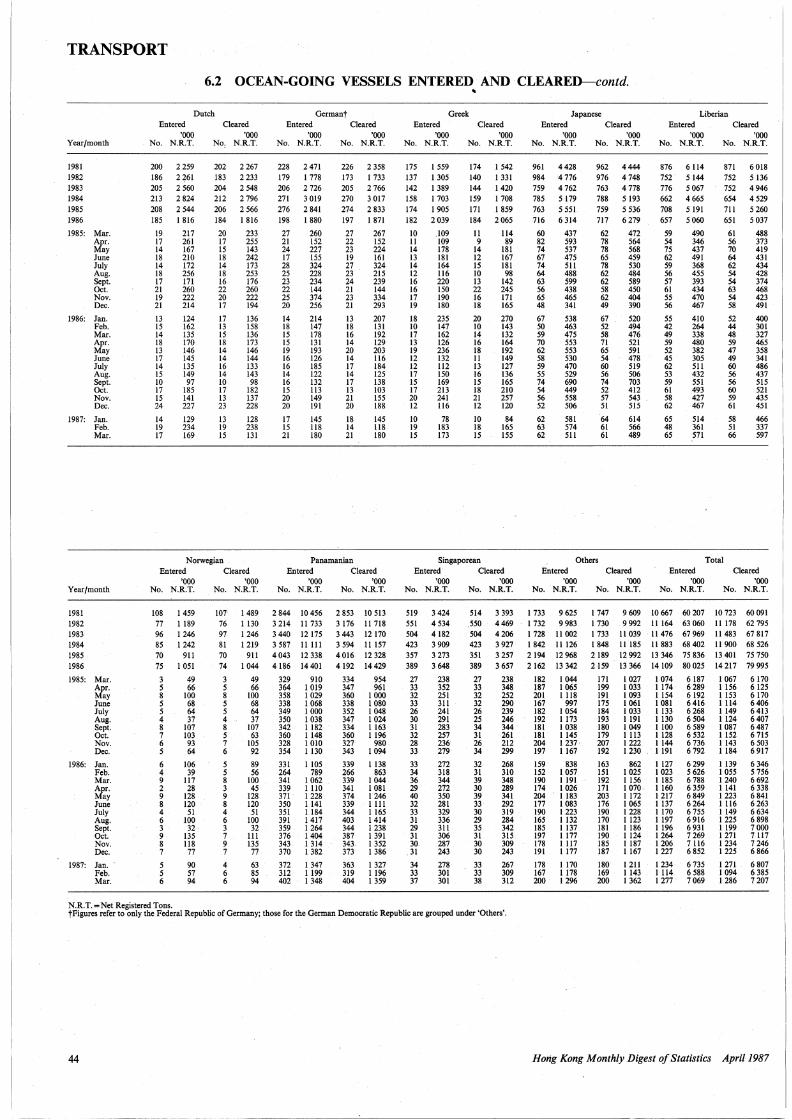
TRANSPORT
6.2 OCEAN-GOING VESSELS ENTERED AND CLEARED-contd .
Year/month
1981 1982 1983 1984 1985 1986
1985: Mar. Apr. May June July Aug. Sept. Oct. Nov. Dec.
1986: Jan. Feb. Mar. Apr. May June July Aug. Sept. Oct. Nov. Dec.
1987: Jan. Feb. Mar.
Year/month
1981 1982 1983 1984 1985 1986
1985: Mar. Apr. May June July Aug. Sept. Oct. Nov. Dec.
1986: Jan. Feb. Mar. Apr. May June July Aug. Sept. Oct. Nov. Dec.
1987: Jan. · Feb. Mar.
Dutch Entered
'OOO No. N.R.T.
200 2 259 186 2 ~61 205 2 560 213 2 824 208 2 544 185 1 816
19 217 17 261 14 167 18 210 14 172 18 256 17 171 21 260 19 222 21 214
13 15 14 18 13 17 14 15 10 17 15 24
14 19 17
124. 162 135 170 146 145 135 149 97
185 141 227
129 234 169
Cleared 'OOO
No, N.R.T.
202 2 267 183 2 233 204 2 548 212 2 796 206 2 566 184 1816
20 233 17 255 15 143 18 242 14 173 18 253 16 176 22 260 20 222 17 194
17 13 15 18 14 14 16 14 10 17 13 23
13 19 15
136 158 136 173 146 144 133 143 98
182 137 228
128 238 131
Norwegian Entered Cleared
'OOO 'OOO No. N.R.T. No. N.R.T.
108 77 96 85 70 75
3 5 8 5 5 4 8 7 6 5
6 4 9 2 9 8 4 6 3 9 8 7
5 5 6
1459 1189 1246 1242
911 I 051
49 66
100 68 64 37
107 103 93 64
106 39
117 28
128 120
51 100 32
135 118 77
90 57 94
107 76 97 81 70 74
3 5 8 5 5 4 8 5 7 6
5 5 8 3 9 8 4 6 3 7 9 7
4 6 6
1489 1130 1246 1219
911 I 044
49 66
100 68 64 37
107 63
105 92
89 56
100 45
128 120
51 100 32
111 135 77
63 85 94
Germant Entered Cleared
'OOO 'OOO No. N.R.T. No. N.R.T.
228 2 471 179 1 778 206 2 726 271 3 019 276 2 841 198 1 880
27 260 21 152 24 227 17 155 28 324 25 228 23 234 22 144 25 374 20 256
14 18 15 15 19 16 16 14 16 15 20 20
17 15 21
214 147 178 131 193 126 185 122 132 113 149 191
145 118 180
226 2 358 173 1 733 205 2 766 270 3 017 274 2 833 197 1 871
27 267 22 152 23 224 19 161 27 324 23 215 24 239 21 144 23 334 21 293
13 18 16 14 20 14 17 14 17 13 21 20
18 14 21
207 131 192 129 203 il6 184 125 138 103 155 188
145 118 180
Panamanian Entered Cleared
'OOO 'OOO No. N.R.T. No. N.R.T.
2 844 10 456 3 214 II 733 3 440 12 175 3 587 11111 4043 12 338 4186 14401
329 910 364 1 019 358 I 029 338 1 068 349 I OOO 350 1 038 342 I 182 360 1148 328 1 010 354 1130
331 1105 264 789 341 I 062 339 1110 371 I 228 350 1141 351 1184 391 1417 359 I 264 376 I 404 343 I 314 370 I 382
372 I 347 312 1199 402 I 348
2 853 10 513 3 176 II 718 3 443 12170 3 594 II 157 4 016 12 328 4192 14429
334 954 347 961 360 1 OOO 338 1 080 352 I 048 347 1 024 334 1163 360 1196 327· 980 343 I 094
339 1 138 266 863 339 1 044 341 1081 374 1246 339 1 Ill 344 I 165 403 1414 344 1238 387 1 391 343 1 352 373 1 386
363 1 327 319 1196 404 I 359
.. Greek Japanese Liberian
Entered 'OOO
No. N.R.T.
175 I 559 137 I 305 142 1 389 158 1 703 174 1905 182 2 039
10 .109 II 109 14 178 13 181 14 164 12 116 16 220 16 150 17 190 19 180
18 10 17 13 19 12 12 17 15 17 20 12
10 19 15
235 147 162 126 236 132 112 150 169 213 241 116
78 183 173
Cleared 'OOO
No. N.R.T.
174 I 542 140 1331 144 1420 159 I 708 171 1859 184 2 065
II 114 9 89
14 181 12 167 15 181 10 98 13 142 22 245 16 171 18 165
20 10 14 16 18 II 13 16 15 18 21 12
10 18 15
270 143 132 164 192 149 127 136 165 210 257 120
84 165 155
Entered Cleared 'OOO 'OOO
No. N.R.T. No. N.R.T.
961 4428 984 4 776 759 4 762 785 5 179 763 5 551 716 6 314
60 437 82 593 74 537 67 475 74 511 64 488 63 599 56 438 65 465 48 341
67 50 59 70 62 58 59 55 74 54 56 52
62 63 62
538 463 475 553 553 530 470 529 690 449 558 506
581 574 511
962 4444 976 4 748 763 4 778 788 5 193 759 5 536 717 6 279
62 472 78 564 78 568 65 459 78 530 62 484 62 589 58 450 62 404 49 390
67 52 58 71 65 54 60 56 74 52 57 51
64 61 61
520 494 476 521 591 478 519 506 703 412 543 515
614 566 489
Entered Cleared 'OOO 'OOO
No. N.R.T. No. N.R.T.
876 6114 752 5 144 776 5 067 662 4 665 708 5 191 657 5 060
59 490 54 346 75 437 62 491 59 368 56 455 57 393 61 434 55 470 56 467
55 42 49 59 52 45 62 53 59 61 58 62
65 48 65
410 264 338 480 382 305 511 432 551 493 427 467
514 361 571
871 6018 752 5 136 752 4 946 654 4 529 711 5 260 651 5 037
61 488 56 373 70 419 64 431 62 434 54 428 54 374 63 468 54 423 58 491
52 44 48 59 47 49 60 56 56 60 59 61
58 51 66
400 301 327 465 358 341 486 437 515 521 435 451
466 337 597
Singaporean Others Total Entered Cleared Entered
'OOO No. N.R.T.
'OOO No. N.R.T.
519 551 504 423 357 389
27 33 32 33 26 30 31 32 28 33
33 34 36 29 40 32 33 31 29 31 30
. 31
34 33 37
3 424 4534 4182 3909 3273 3 648
238 352 251 311 241 291 283 257 236' 279
272 318 344 272 350 281 329 336 311 306 287 243
278 301 301
'OOO No. N.R.T.
514 .550 504 423 351 389
27 33 32 32 26 25 34 31 26 34
32 31 39 30 39 33 30 29 35 31 30 30
33 33 38
3 393 I 733 9 625 4469 . 1732 9983 4 206 I 728 11 002 3 927 I 842 II 126 3 257 2 194 12 968 3 657 2 162 13 342
238 182 1 044 348 187 1 065 252 201 1118 290 167 997 239 182 1 054 246 192 1 173 344 181 1 038 261 181 1 145 212 204 1237 299 197 1 167
268 159 838 310 152 1 057 348 190 1191 289 174 1 026 341 204 1 183 292 177 1083 319 190 1223 284 165 1 132 342 185 1 137 315 197 1 177 309 178 1 117 243 191 1177
267 178 1170 309 167 1178 312 200 1296
Cleared 'OOO
No. N.R.T.
Entered Cleared 'OOO 'OOO
No. N.R.T. No. N.R.T.
I 747 9 609 10 667 60 207 10 723 60 091 I 730 9 992 II 164 63 060 11 178 62 795 1 733 II 039 II 476 67 969 11 483 67 817 1 848 11 185 II 883 68 402 II 900 68 526 2 189 12 992 13 346 75 836 13 401 75 750 2159 . 13 366 14 109 80 025 14 217 79 995
171 1027 199 1 033 191 1093 175 1061 184 1 033 193 1191 180 1049 179 1 113 207 1 222 192 1230
163 151 192 171 203 176 190 170 181 190 185 187
180 169 200
862 1 025 1156 1070· 1172 1 065 1228 1 123 I 186 1124 1187 1167
1211 1143 1362
1074 6187 1174 6289 1 154 6 192 1081 6416 1133 6268 1 130 6 504 1100 6 589 1 128 6 532 1 144 6 736 1 191 6 792
1 127 6 299 1 023 5 626 1 185 6 788 1160 6359 1217 6849 1137 6264 1170 6755 1197 6916 I 196 6931 1 264 7 269 1 206 7 116 1 227 6 852
1 234 6 735 1 114 6 588 1277. 7069
1067 6170 1 156 6125 1 153 6 170 1 114 6 406 1 149 6 413 1124 6407 1 087 6 487 1 152 6 715 1 143 6 503 1184 6917
1139 1055 1240 1141 1223 1116 1149 1225 1199 1271 1234 1225
1271 1094 1286
6 346 5 756 6 692 6 338 6 841 6263 6 634 6 898 7000 7117 7 246 6866
6807 6385 7207
N.R.T.=Net Registered Tons. tFigures refer to only the Federal Republic of Germany; those for the German Democratic Republic are grouped under 'Others'.
44 Hong Kong Monthly .Digest of Statistics April 1987

TRANSPORT
6.3 RIVER VESSELS ENTERED AND CLEARED
Steamers Catamarans Hydrofoil vessels
Entered Cleared Entered Cleared Entered Cleared
'OOO 'OOO 'OOO 'OOO 'OOO 'OOO Year/month No. N.R.T. No. N.R.T. No. N.R.T. No. N.R.T. No. N.R.T. No. N.R.T.
1981 I 991 2 396 I 990 2 393 21 044 2 878 21 044 2 877
1982 2 133 2 588 2 133 2 588 615 76 613 76 24045 3 902 24047 3 903
1983 I 631 2 011 I 627 2 006 I 981 255 I 982 255 24 574 4 347 24 572 4 348
1984 I 679 I 904 I 683 I 907 2 749 340 2 749 340 25 265 4643 25 266 4 643
1985 2 374 2 030 2 373 2029 4 155 507 4 155 507 24 514 4622 24 515 4 622
1986 3 091 2 214 3 091 2 213 4974 595 4975 595 24039 4 577 24039 4 577
1985: Mar. 141 157 138 154 357 44 354 44 2 005 382 2005 382 Apr. 141 150 143 152 365 46 367 46 2 011 382 2 013 383 May 188 159 186 157 353 43 352 43 2059 389 2 059 389 June 209 170 212 173 318 39 317 39 I 934 362 I 934 362 July 205 173 203 171 384 48 384 48 2 131 403 2 130 402 Aug. 318 214 320 215 426 51 426 51 2 201 412 2 202 412 Sept. 307 208 306 207 343 40 345 40 I 962 366 I 960 366 Oct. 219 158 215 155 341 41 341 41 2094 393 2092 392 Nov. 116 119 119 122 302 38 304 38 2 018 376 2 018 376 Dec. 222 179 220 177 379 46 377 46 2 041 387 2042 387
1986: Jan. 253 186 253 186 357 42 357 42 2022 392 2 021 392 Feb. 298 226 299 227 454 55 456 55 1 951 367 I 950 367 Mar. 267 193 267 194 390 48 388 48 2 014 387 2 013 386 Apr. 281 198 283 199 427 51 429 51 I 931 375 I 933 376 May 227 149 224 146 353 43 352 42 I 997 382 I 997 382 June 264 186 267 190 395 47 395 47 I 984 376 I 985 376 July 274 196 273 196 414 48 413 48 I 986 378 1 985 378 Aug. 291 205 290 203 458 53 459 53 2 237 420 2 237 420 Sept. 242 182 244 183 433 51 435 51 I 966 372 I 966 372 Oct. 193 155 189 152 417 51 414 50 I 998 376 I 998 376 Nov. 242 162 245 165 429 52 430 52 I 956 367 1 957 368 Dec. 259 175 257 173 447 54 447 54 I 997 385 1 997 385
1987: Jan. 287 200 289 202 493 58 490 58 2067 395 2067 395 Feb. 259 184 259 184 447 53 449 53 I 920 364 I 920 364 Mar. 205 151 204 140 454 54 453 54 2002 379 2 001 379
Hoverferries River trading vessels Total
Entered Cleared Entered Cleared Entered · Cleared
'OOO 'OOO 'OOO 'OOO 'OOO 'OOO Year/month No. N.R.T. No. N.R.T. No. N.R.T. No. N.R.T. No. N.R.T. No. N.R.T.
1981 1 189 54 I 189 54 27 500 4 804 27 578 4 823 51 724 10 132 51 801 10 148
1982 1 518 69 I 518 69 29 865 5 092 30 115 5 121 58 176 11 727 58 426 11 756
1983 2 847 184 2 848 184 33 753 5 944 33 699 5 942 64786 12 741 64 728 12 734 1984 4684 417 4 686 417 37 564 6423 37 562 6 431 71 941 13 727 71 946 13 740
1985 5 277 493 5 278 493 43 931 7 377 43 959 7 423 80 251 15 028 80 280 15 074
1986 5 759 573 5 759 573 44096 7 807 43 940 7 697 81 959 15 766 81 804 15 655
1985: Mar. 412 38 412 38 3 795 598 3 771 609 6 710 I 219 6 680 I 227 Apr. 431 39 431 39 3 661 608 3 594 605 6 609 I 225 6 548 I 224 May 416 40 416 40 4133 653 4061 666 7 149 I 284 7 074 I 295 June 403 38 403 38 3 606 560 3 725 559 6470 I 169 6 591 I 171 July 433 41 434 41 3 921 661 3 786 633 7 074 I 325 6 937 1 295 Aug. 461 43 462 43 3 482 600 3 489 600 6 888 I 320 6 899 1 321 Sept. 394 37 393 37 3 198 565 3 209 584 6204 I 216 6 213 · I 235 Oct. 461 42 461 42 3 654 638 3 668 645 6 769 1 272 6 777 1 275 Nov. 421 40 420 40 3 669 650 3 714 659 6 526 1 222 6 575 I 235 Dec. 475 44 477 45 4 033 745 4063 751 7 150 1 401 7 179 I 405
1986: Jan. 426 42 424 41 3 820 679 3 829 683 6 878 I 342 6 884 I 345 Feb. 498 48 500 48 2 327 423 2 213 407 5 528 I 119 5 418 1 105 Mar. 510 50 510 50 3 601 643 3 668 669 6 782 I 321 6 846 I 348 Apr. 490 49 490 49 3 647 678 3 648 651 6 776 I 351 6 783 1 326 May 487 49 487 49 3 734 671 3 728 665 6 798 1 294 6 788 1 285 June 475 48 475 48 3 638 658 3 640 649 6 756 1 314 6 762 1 309 July 463 47 463 47 3 734 638 3 613 639 6 871 1 308 6 747 1 307 Aug. 539 54 540 54 3 622 649 3 615 633 7 147 1 380 7 141 1 363 Sept. 457 46 456 46 3 754 648 3 770 655 6 852 1 299 6 871 1 307 Oct. 480 48 480 48 3 865 685 3 907 579 6 953 1 314 6 988 1 205 Nov. 437 44 437 44 3 997 660 3 956 701 7 061 1 285 7 025 I 330 Dec. 497 49 497 49 4 357 775 4 353 765 7 557 I 439 7 551 I 426
1987: Jan. 519 52 520 52 3 679 647 3 764 664 7045 I 353 7 130 I 371 Feb. 493 50 493 50 3 422 659 3 337 645 6 541 I 309 6 458 1294 Mar. 486 49 485 49 4 106 740 4079 743 7 253 I 373 7 222 I 366
N.R.T. =Net Registered Tons.
Hong Kong Monthly Digest of Statistics April 1987 45

TRANSPORT
6.4 INTERNATIONAL MOVEMENTS OF COMMERCIAL CARGO
By sea By air By railway By road (tonne) (tonne) (tonne)
Import Export
Tonne Tonne Year/month Import Export Total Import Export Total Tonne kilometres Tonne kilometres Import Export Total
1981 26 448 318 9170 622 35 618 940 121405 168900 290 305 1032466 34805144 40595 1380216 225 289 299 686 524975
1982 28 018 911 9 077 010 37 095 921 133148 172609 305 757 1035676 35 196 930 34038 1157 301 394 339 446 622 840961
1983 31554689 11794759 43 349 448 144890 223216 368 166 1253 432 42317862 72039 2449 326 702004 810 677 1512681
1984 33 497 640 13 982 784 47 480424· 162457 254689 417146 1343152 43 546964 104267 3 545 078 1134476 1 061 039 2195 515
1985 37 226 087 16 429 296 53 655 383 182 842 247141 429 983 I 384136 44991808 203 273 6 764402 1435 617 1249 392 2 685 069
1986 42 979 168 19 499.858 62479026 204446 332 314 536 760 1804 756 56 689 301 366 706 12440412 2 124 651 I 702 SS! 3 827 532
1985: Mar. 2 912 103 1226 758 4138 861 16952 17 765 34717 94929 3 209 658 10499 349058 107 242 95 551 202 793 Apr. 3 120 549 1356884 4 477 433 17158 18964 36122 91 703 3 076 857 12445 418.006 107 542 101 371 208 919 May 3 207 965 1392 700 4600665 17 703 16843 34546 99726 3 367 689 12 730 419 728 123 701 112 893 236 594 June 3 403 268 I 336 260 4739 528 14939 16739 .31 678 105 413 3 501 131 19192 621 592 113 959 99 727 213 686 July 3 281 739 1427 469 4709 i08 15 630 19 599 35229 123 396 4018 005 19155 633 618 129 526 112 701 242227 Aug. 3 103 916 1471 647 4 575 563 13 818 20 382 34200 124091 4046 899 18 712 619 828 125 780 108 720 234 500 Sept. 3 278 525 1430 386 4 708 911 14252 22745 36997 129 957 4168 574 19 728 642612 120 649 102 229 222 878 Oct. 3 237 875 1464 892 4702 767 15 593 26234 41827 142884 4 525 319 22555 739 222 128 801 108 796 237 597 Nov. 3 209 691 1286 989 4 496 680 15 606 28 555 44161 151671 4708 132 27409 931906 J.39164 110 445 249609 Dec. 3 195 730 I 530 474 4726204 15 563 24412 39975 158 850 4964394 26089 887026 141130 119 403 260 533
1986: Jan. 3 361 855 1463 755 4 825 610 13 329 21989 35 318 132 732 4210 692 29584 I 005 856 144159 117 777 261936 Feb. 2 666 288 1 118 344 3 784 632 13 167 19 871 33 038 82167 2 710 944 17900 603 356 89293 66413 155 706 Mar. 3 283 137 1481156 4 764 293 17 347 27244 44 591 141021 4517 594 27369 925 290 153 619 123 482 277161 Apr. 3 634 385 1451417 5 085 802 17212 26932 44144 145445 '4601 712 26 523 891294 160104 124 597 284 701 May 3 825 243 1616 288 5 441 531 20410 24219 44629 148 997 . 4669987 31601 I 074434 166070 139 367 305 437 June 3469244 1608 971 5 078 215 18129 23 367 42096 159120 4974744 33 323 1132 982 163 315 133 460 296 775 July 3 700 955 1688 105 5 389 060 19232 27 852 47084 168446 5 212 834 25 792 876 928 177 720 146860 324 580. Aug. 3 711 532 1952 420 5 663 952 18081 29 981 48062 163 526 5 099 322 41882 1423 988 189 600 154 550 344150 Sept. 3 734 627 I 715 748 5 510 375 16252 31 563 41815 172064 5 382 837 25916 881144 203 609 161383 364992 Oct. 4 170 931 I 840 901 6 011 832 16869 33 758 50627 170921 5 339 062 38 307 I 302 438 214802 168 650 383 452 Nov. 3162 642 I 738 663 5 SOI 305 16971 36 279 53 250 162 936 5 085 906 34948 1188 232 224 752 177193 401945 Dec. 3 658 329 I 764090 5 422419 16 848 29259 46107 157 381 4883 667 33 561 1134470 237 548 189149 426 697
1987: Jan. 3 616 980 I 784 578 5 401 558 14607 21868 42415 137100 4239012 34483 1164 502 232 907 155 513 388 420 Feb. 3 411 690 I 527 345 4939 035 15 802 21 713 37 575 131120 4140 932 27230 925 820 221625 140 387 362 012 Mar. 4112127 1848121 5 960 848 19 899 34929 54 828 172178 5 341 875 37843 I 283 972 228 126 188 835 416961
6.5 COMMERCIAL CARGO CARRIED BY VESSELS Tonne
Cargo discharged Cargo loaded
Oceal!•goittg River Ocean-going River Year/month vessels vessels Total vessels vessels Total
'1981 23374 531 3 073 787 26 448 318 .s 594279 S76 343 9 170 622
1982 24619082 3 399 829 28 018 911 8 345 079 731931 9077010
1983 27 310 859 4243 830 31554689 10620929 1173830 II 794 759
1984 29 239 530 4 258 110 33497 640 12 301 102 I 681 682 13 982 784
1985 31. 961 964 5 264123 37 226087 13 829014 2600282 16429296
1986 36664 592 6 314 576 42 979 168 16993950 2505908 19 499 858
1985: Mar. 2 528 137 383966 2 912 103 I 020 148 206 610 1226 758 Apr. 2 688 675 431874 3120 549 1140 824 216060 1356884 May 2 744 864 463 IOI 3 207 965 1190 583 202117 1392 700 June 2998 7% 404472 .3 403 268 1150 574 185 686 1336260 July 2 804 065 477674 3 281 739 1194 555 232914 1427469 Aug, 2 639 283 464633 3 103 916 1272 253 199394 1471 647 Sept. 2 888 528 389 997 3 278 525 1199136 231250 1430 386 Oct. 2 771020 466 855 3 237 875 1143 232 321660 1464892
·Nov. 2 737 775 471916 3 209 691 I 091287 195702 1286 989 Dec. 2 579 589 616141 3 195 730 1321275 209199 1530474
1986: Jan. 2 834 748 527107 3 361 855 1260 851 202904 1463 755 Feb. 2 379 236 . 287052 2 666 288 946 505 171839 I 118 344 Mar. 2 767 323 515814 3 283 137 1279933 201223 1481156 Apr. 3 114 619 ~~rn~ 3 634 385 l 242931 208486 1451417 May 3 284 854 3 825 243 1431072 185216 1616288 June 2 985 326 483 918 3469244 1428 379 180 592 I 608 971 July 3193 983 506 972 3 700 955 I 523 852 164 253 I 688 105 Aug. 3 202 017 509 515 3 711 532 I 755 215 197205 1952420 Sept. 3 111 739 562 888 3 734 627 I 577 983 197765 I 775 748 Oct 3 593 933 576 998 4170931 I 569 193 271 708 1840901 Nov. 3138 589 624053 3 762642 1500861 237 802 I 738 663 Doc. 2.998 225 660104 3 658 329 1477 175 286 915 I 764090
1987: Jan. 3 094 962 522018 3616980 I 543 012 241566 I 784 578 Feb. 2 850 070 561620 3 411690 1250 481 276 864 I 527 345 Mar. 3 512 866 599 861 4112 727 I 558 613 289 508 1848121
46 Hong Kong Monthly Digest of Statistics April 1987

TRANSPORT
6.6 CONTAINERS CARRIED BY OCEAN-GOING VESSELS
Year/month
1981
1982
1983
1984
1985
1986
1985: Mar. Apr. May June July Aug. Sept. Oct. Nov. Dec.
1986: Jan. Feb. Mar. Apr. May June July Aug. Sept. Oct. Nov. Dec.
1987: Jan. Feb. Mar.
Full
T.E.U.s
Tranship-Local ment
395 655
384 813
389 933
430 290
501 028
526 437
47 546 43 112 42 623 44 401 42 OOO 43 573 40 384 41207 40 029 44486
38 620 30948 42 764 39 433 47 017 43 187 47 078 50 411 44 769 48 360 46 040 47 810
41 585* 41 595 52 615
235 405
209 466
229 910
239 906
242 497
273 930
21 702 18 598 18 352 19 664 19 334 20 588 19 825 19 040 21 060 24 526
24 854 19 759 24 579 23 095 22 758 21413 23 339 26036 20 387 22251 20 992 24467
25 738* 24 909 27 649
Discharged
Empty
T.E.U.s
Tranship-Local ment
127 388
145 478
177 211
212 337
179 395
247 999
9 914 10 712 16187 18 456 17 005 19 162 18 133 14484 II 881 14 886
19 173 12057 13 206 12 196 20 659 22 297 26 294 28 847 24 689 23 517 26165 18 899
25 185 22426 19 752
12 665
13 157
14 841
19 690
22 026
17 942
1401 I 957 2190 2 023 2 347 2078 I 592 1439 I 917 I 593
1225 660
I 372 I 024 2420 1540 1471 1476 1642 1565 I 776 I 771
I 121 I 131 1418
Kwai Chung Terminals
Cargo
Tonne
5 851 384
5 696 195
5 816 400
6 319 031
6 986 664
7 632 907
647 569 567 795 560 613 606 387 568 254 611283 572 757 559 944 597 263 649 922
605 082 480 206 634 503 608 076 672 902 612815 676 523 731 978 628 178 668 110 632 043 682 491
639 230 635 730 766 686
Full
T.E.U.s
Tranship-Local ment
456 814 230 875
461 088 204 414
499 896 225 771
566 721 235 762
594 794 229 044
756 140 273 929
40146 43 902 52055 51 357 55 505 58 736 51 911 47 722 48 102 57 484
55408 39 029 54 768 53 077 65 323 63 518 72174 75 252 68 493 69012 67 401 72 685
72093 49 382 69066
20122 18 455 18 303 17 885 17 271 19 941 18 704 18 491 19 799 22 306
25 771 21 382 24 619 22 219 23 308 21 514 21873 25 211 21901 22 275 20132 23 724
24 350 24 734 28 582
Loaded
Empty
T.E.U.s
Tranship-Local ment
88 422
75 130
83 648
78 053
103 907
75 393
12 082 10 901 10 561 8 893 7 666 7 539 8 326 8 402 7 517 7 313
5 442 5 762 8 059 6 503 6 601 5 583 6090 6447 5 775 6 655 6409 6067
5 Oil 7 543 8 229
12 595
13 738
14 531
19 084
22136
17 681
1590 1852 1917 2456 2188 2 367 l 701 l 119 2279 l 322
l 182 803
1366 l 061 2143 1 727 1481 1341 1679 1415 l 836 1647
1436 1330 1306
Note: 'T.E.U.s' refers to Twenty-Foot Equivalent Units (based on a standardised container size of 20 ft. x 8 ft. x 8 ft.). 'Local' means containers wiµi Hong Kong as the country of origin or destinatio:n. 'Full' includes containers partially filled with cargo.
Cargo
Tonne
4 984 690
4 846 610
5 129 347
5 562 621
5 799 573
7 085 292
446 387 454 294 484 217 476 879 478 360 548 579 493 752 483 853 492 600 547 105
577 803 430 628 566431 523 443 616 610 575 947 626 999 668 748 612 671 625 196 607 966 652 850
652 728 545 231 687 731
Elsewhere in Hong Kong
Discharged Loaded
Full Empty Full Empty
T.E.U.s T.E.U.s T.E.U.s T.E.U.s
N.A.
57 177
81 084
132 236
187 739
237 917
17 837 17 634 15 785 15 945 17 634 15 195 16 245 14976 15 435 15 885
14902 12 850 17 337 18 756 18 207 20 634 21 689 19915 21 626 24270 21 500 26231
23 441 22 331 27 153
N.A.
16 085
25 510
30 739
21432
35 007
l 508 1 573 1656 l 541 1667 2044 1617 1820 I 800 2 670
2 135 l 898 l 324 l 582 3 068 3 110 3 396 2 390 4309 6156 2 956 2 683
2 637 4216 3 013
N.A.
60 241
68 467
96 825
114 813
160 315
9 254 10606 9 575 8 892 9113
10164 11 269 8 688 9461
10 966
10 643 9141
10 487 II 651 12 806 II 900 14 598 14256 16 677 15 829 15 961 16 366
18 604 13 695 21271
N.A.
19 156
26245
46 940
70 142
77 277
5932 7618 7 157 6734 6678 5 700 5 617 5 981 5 408 6066
5 485 4 508 5 788 6988 6 583 7 422 6 662 6948 6172 8 368 5 988 6 365
6450 5 592 7004
6.7 PUBLIC TRANSPORT: PASSENGER JOURNEYS BY UNDERTAKING
Year/month
1981
1982
1983
1984
1985
1986
1985: Mar. Apr. May June July Aug. Sept. Oct. Nov. Dec.
1986: Jan. Feb. Mar. Apr. May June July Aug. Sept. Oct. Nov. Dec.
1987: Jan. Feb. Mar.
Kowloon Motor
Bus
933 025
940 396
981 823
I 069 322
I 079 045
l 108 286
92 653 87 922 91 885 83 795 90 038 87 019 88 IOI 94 502 93 005 94 594
95 664 82 469 94 456 93 083 95 032 88 306 90 578 89 827 91979 96 733 94183 95 976
97024 85 302 94 610
China Motor
Bus
287 461
311909
348 084
362 633
344 031
318 397
31 936 30 119 31 815 25 077 27 166 25 809 26 339 28 942 28 515 28 732
29 288 25 154 27 999 27125 27 424 24 577 25 330 24421 25 447 27 370 26 848 27 415
27 334 25 047 27 586
New Lantao
Bus
3 140
3 370
3 153
3 164
3 187
3 028
215 266 243 276 360 396 257 245 244 275
188 255 266 238 213 257 293 366 249 237 211 255
229 265 215
tFigures also include passenger journeys on Through Train. :f:Provisional figure.
Mass Transit
Railway
222 914
351 082
411 955
410 556
462 894
532 074
34460 31 596 34 357 39 199 44255 43 617 41 861 42 736 41549 43 429
42122 39 498 41 067 39 266 42 594 42 572 48 309 48 544 47 722 46490 45 580 48 311
47 971 42676 47 233
Hong Kong Monthly Digest of Statistics April 1987
Kowloon-Canton Hongkong
Railwayt Tramways
17 123
22215
48 110
79 973
103 270
115 866
8981 8290 8 093 8 008 8 963 8 934 8 599 8 997 9 064 9 594
9140 8 960 9 363 8 899 9 049 8 821 9 888
10 359 9 954
10480 10 222 10 731
10 926 10021 II 073
160 442
143 371
131 093
122 502
120 831
122 245
10 397 9 908
10 820 9 440
10427 9 972 9 765
10 950 10 264 10 365
10 135 8 687 9 697
10 171 10 485 9 716
10 474 10432 10425 10 843 10 483 10 697
10 592 9 323
10 522
Peak Tramways
2097
l 765
I 744
2054
2 318
2 602
173 180 184 182 215 217 199 233 218 222
181 160 171 225 223 238 255 255 228 252 219 194
213 202 190
Green Minibus Services
50 780
69 947
104 082
138 349
170418
189 511
14097 13 451 14129 13 530 14 786 14 708 14 581 15162 15055 15444
15 591 14 133 15494 15 347 15 827 15 138 15 653 16 116 16 309 16 744 16 325 16 833
16912 15 786 17 590t
Residential Coach
Services
556
1905
2 409
4 762
5 588
400 354 404 374 401 387 413 431 428 441
450 387 438 444 467 443 477 464 496 517 503 500
522 489 535
Hongkong and
Yaumati Ferry
126 557
114 765
100 132
90 511
83 727
76474
7 263 7 265 7 653 6511 7 309 7183 6484 6974 6822 6 848
6 375 5 523 6361 6447 6559 6307 6637 6743 6283 6 510 6278 6452
5 654 5 607 6 200
Star Ferry
41 359
38 113
37 406
41 593
43 285
40 808
3 791 3 687 3881 3 284 3 726 3 601 3 344 3 719 3 681 3 902
3 584 2 896 3 398 3463 3 465 3191 3444 3 358 3 261 3 510 3 513 3 726
3 251 2982 3 321
Minor Ferry
Services
5 823
6 140
6 918
6790
6255
6075
502 524 545 512 572 527 486 544 522 539
522 488 492 483 499 508 504 510 517 516 498 538
515 436 476t
Ocean Park
Cable Car
Thousand
Total
I 169 l 851 890
I 058 2 004 687
954 2177 359
I 479 2 331 335
I 126 2 425 149
I 112 2 522 066
90 102 95 89
118 118 74 80 86
107
73 119 78 90 76 90
107 120 79 83 84
113
113 126 82
204 958 193 664 204104 190 277 208 336 202 488 200 503 213 515 209 453 214492
213 313 188 729 209 280 205 281 211 913 200 164 211949 211 515 212 949 220 285 214 947 221 741
221255 198 263 219 634
47

TRANSPORT
6.8 MOTOR VEHICLES LICENSED
Motor Motor Private Taxis cycles tricycles cars
New Urban Territoriest
Total New Total New Total New Total New Total New Year/month licensed registration licensed registration licensed registration licensed registration licensed registration
1981 21 106 4 391 190 307 33 761 lO 165 2076 880 238
1982 19 515 2683 184 585 19 624 ll 342 2049 1376 596
1983 16 836 l 533 159 488 7108 12 403 1909 1907 605
1984 15 345 l 010 147 616 6 569 13 499 1 819 2 290 513
1985 14060 1 028 144 723 ll 119 13 795 2006 2428 271
1986 13 314 1100 2 139 053 13 816 14004 2165 2 534 226
1985: Mar. 14 823 78 146148 704 13 556 127 2 365 10 Apr. 14 808 92 145 642 759 13 590 157 2 378 28 May 14 764 96 145 612 1024 13 6ll 153 2437 65 June 14 666 105 145104 777 13 630 151 2439 4 July 14 583 99 145019 949 13 658 172 2433 2 Aug. 14476 106 145 OOO 1100 13 700 199 2426 lO Sept. 14 359 87 144 888 1 131 13 782 234 2429 lO Oct. 14 304 75 144 689 l 076 13 788 203 2424 6 Nov. 14 232 ll7 144 673 l 022 13 786 205 2408 6 Dec. 14060 43 144 723 875 13 795 265 2428 lO
1986: Jan. 13 958 79 144 750 1 510 13 790 143 2417 9 Feb. 13 808 91 144 319 [ 067 13 788 66 2405 5 Mar. 13 638 41 143 781 783 13 813 206 2 395 6 Apr. 13 606 79 142 353 [ 081 13 843 204 2415 14 May l3 585 94 141 139 1083 13 866 225 2457 27 June l3 570 104 140 484 1 129 13 878 183 2475 15 July l3 528 81 140 245 [ 210 l3 889 192 2 491 19 Aug. l3 479 103 2 140 256 [ 256 l3 893 175 2 521 33 Sept. l3 465 ll8 139 959 [ 171 l3 951 188 2 537 28 Oct. l3 460 108 139 618 l 171 l3 994 221 2 551 27 Nov. l3 359 llO 139 456 [ 149 l3 999 202 2 530 14 Dec. l3 314 92 139 053 [ 206 14004 160 2 534 29
1987: Jan. 13 296 104 9 139 136 l 826 14018 176 2 541 26 Feb. l3 242 100 9 138 271 [ 229 14003 215 2 520 24 Mar. 13 230 107 9 138 303 [ 460 14003 297 2 509 23
Public buses
China Motor Kowloon Motor NewLantao Bus Co. Ltd. Bus Co. Ltd. Bus Co. Ltd.
Single Double Single Double Single Double deck deck deck deck deck deck
New New New New New New Total registra- Total registra- Total registra- Total registra- Total registra- Total registra-
Year/month licensed tion licensed tion licensed tion licensed tion licensed tion licensed tion
1981 935 ll5 347 2028 413 47 6 4
1982 4 985 81 288 2084 160 44 8
1983 4 l 036 88 202 2144 105 45 9
1984 2 959 28 167 2 245 179 44 9
1985 891 138 13 2 373 188 43 4 ll 2
1986 923 132 7 2 581 363 43 ll
1985: Mar. 2 950 137 2 262 24 44 11 2 Apr. l 951 136 2262 6 43 ll May [ 945 134 2270 21 44 ll June 1 935 122 2264 3 38 ll July 1 900 123 2 264 9 42 ll Aug. 1 898 ll8 2 285 20 40 ll Sept. 894 ll8 2 329 32 41 ll Oct. 898 122 2 342 13 41 ll Nov. 880 124 2 2 362 16 42 ll Dec. 891 138 ll 2 373 14 43 4 ll
1986: Jan. 885 136 2 2408 42 45 lO Feb. 890 141 5 2419 27 45 ll Mar. 867 141 2413 17 47 ll Apr. 880 141 2414 ll 45 ll May 893 140 2437 42 43 ll June 906 138 2444 23 43 ll July 927 137 2496 45 45 ll Aug. .;.., .;,, 935 137 2 535 46 45 ll Sept. 936 136 2 568 36 45 ll Oct. 932 137 2 584 30 45 ll Nov. 928 134 2 571 14 43 ll Dec. 923 132 2 581 30 43 ll
1987: Jan. 933 133 2 646 79 43 ll Feb. 917 127 2 652 20 42 11 Mar. 946 127 2 683 32 44 ll
tincluding Lantau Island from March 1983.
48 Hong Kong Monthly Digest of Statistics April 1987

6.8 MOTOR VEHICLES LICENSED-contd.
Public buses - continued Others
Single deck
New
Double deck
New Total registra-
Single deck
New Total registra-
Private buses
Double deck
New Total registra-
Public light buses
New Total registra-
TRANSPORT
Private light buses
New Total registra-
Special:j: purpose vehicles
New Total registra-Total registra_-
Year/month licensed tion licensed tion licensed tion licensed tion licensed tion licensed tion licensed tion
1981
1982
1983
1984
1985
1986
1985: Mar. Apr. May June July Aug. Sept. Oct. Nov. Dec.
1986: Jan. Feb. Mar. Apr. May June July Aug. Sept. Oct. Nov: Dec.
1987: Jan. Feb. Mar.
Year/month
1981
1982
1983
1984
1985
1986
1985: Mar. Apr. May June July Aug. Sept. Oct. Nov. Dec.
1986: Jan. Feb. Mar. Apr. May June July Aug. Sept. Oct. Nov. Dec.
1987: Jan. Feb. Mar.
1914
l 971
1961
2001
2041
2129
2026 2018 2009 2005 2015 2027 2 031 2 036 2 037 2041
2 057 2 067 2 075 2 079 2078 2071 2081 2090 2110 2121 2126 2129
2145 2 152 2160
246
134
78
94
126
133
9 3 3 4
11 12 21 II 15 18
18 11 II 13 5 3
11 13 16 11 15 6
15 9 9
Light goods
vehicles
New Total registra-
licensed tion
48 610
54 648
2 782§
IO 306
63 149 12 815
49 299 49 829 50 303 50 781 51 373 52 119 52 795 53 494 54 118 54 648
55177 55 380 55 927 56 841 57 595 58 274 59 054 59 786 60 662 61447 62446 63 149
63 911 64432 65 612
678 857 829 823 915
1104 I 069 I 051
989 837
886 594 875
1285 I 125 I 008 I 117 l I06 1279 1160 1290 I 090
I 087 885
I 530
tRevised classifications. §Figures for September to December.
26
32
56
72
82
87
17
28
18
15
8
73 73 75 75 76 78 76 79 81 82
82 81 82 82 83 85 85 87 87 87 88 87
94 94 94
Goods vehiclest
Medium goods
vehicles
New Total registra-
licensed tion
13 342
14492
15 846
13 186 13 329 13 370 13 515 13 641 13 779 13 846 13 949 14 203 14 492
14 622 14 601 14 719 14 878 14 965 15 004 15 112 15 270 15 440 15 605 15 733 15 846
16 025 16140 16 290
447§
2251
2 321
118 165 132 184 221 215 269 223 255 269
170 I06 149 229 147 144 219 225 251 250 218 213
255 175 245
2 2
4 l l
175
175
157
126
108
I02
119 119 118 116 ll5 116 114 113 114 I08
IOI I02 IOI IOI IOI IOI IOI 99
IOO 99
IOI I02
IOI I03 I06
Heavy goods
vehicles
New Total registra-
licensed tion
188
182
188
179 180 179 179 177 178 178 177 180 182
188 187 190 196 204 202 198 189 179 180 185 188
192 195 197
52
2
4 8 8 2 3 2 3 4 7 5
6 3 4
Hong Kong Monthly Digest of Statistics April 1987
23
17
23
11
2 3 2 I
28
53
47
33
26
19
33 33 33 32 31 28 27 27 27 26
17 17 17 12 8 8 7 8 8
18 19 19
19 19 19
Sub-total (goods vehicles
and special purpose vehicles)
New Total registra-
licensed tion
54 785 IO 194
59 511 IO I09
59 399 8 199
62491
69 673
9494
12 604
79 257 15 211
63 016 63 692 64204 64 822 65 539 66425 61168 67 972 68 856 69 673
70 343 70 516 71 190 71988 72 838 73 553 74437 75 314 76 353 77 306 78 439 79 257
80 203 80 841 82174
806 I 029
961 I 007 1140 1322 I 339 1278 1249 I l IO
I 069 701
I 028 I 528 1281 I 155 1341 I 333 1534 1416 I 516 1309
1348 I 063 I 779
16
38
4
4
IO
10
4348
4340
4327
4 332
4 344
4 348
4 343 4 338 4 336 4 335 4 342 4341 4340 4346 4346 4344
4 348 4347 4348 4345 4 346 4 345 4343 4 347 4 347 4 343 4349 4 348
4350 4 349 4 348
264
233
851
I 504
778
262
52 77 91
I07 92 87 32 32 36 35
27 16 43 22 25 22 33 19 15 15 18 7
12 IO 9
Crown vehicles (Excluding vehicles
ofH.M. Forces)
Motor cycles
New Total registra-
licensed tion
I 067
1206
I 184
I 160
I 331
1174
I 150 1150 I 126 1214 1244 1201 I 176 I 176 1251 I 331
I 355 1276 1299 1214 I 183 1180 1172 1167 1162 1162 I 187 1174
1193 I 189 I 175
268
281
238
223
358
156
5 4
IO 91 42 6
23 85 92
45
47 2
26 3
33
37 12
Other vehicles
New Total registra-
licensed tion
3 974
4174
4 513
4626
4791
4875
4 671 4677 4665 4 725 4 833 4824 4833 4832 4802 4 791
4 821 4878 4920 4884 4830 4799 4853 4857 4850 4818 4858 4875
4896 4872 4 874
388
556
652
323
472
431
52 34
I 73
125 45 28 36 20 15
51 83 51 20 15
3 65 39
6 58 40
74 24 29
796
I 213
1600
I 782
2025
2183
I 819 I 835 I 858 I 862 I 868 1943 1971 I 988 20IO 2025
2051 2057 2074 2082 2 097 2 I06 2093 2124 2156 2165 2177 2183
2199 2 205 2 217
100
514
566
371
458
427
17 29 39 21 19
124 50 33 42 33
47 19 51 39 32 17 16 93 57 20 19 17
27 15 16
Grand total
New Total registra-
licensed lion
292 940 52 515
292 906 37 083
267 318 21 988
258 799
262 890
22 158
29 452
266 777 34 330
257 548 257 757 258 253 258 396 259 097 259 938 260 587 261 195 262 049 262 890
263 581 263 174 263 219 262 502 262 142 262 204 262 947 263 912 264 788 265 458 266 383 266 777
267 967 267 619 269 033
I 886 2 218 2467 2 343 2 662 3 033 2964 2 797 2 816 2 526
3 042 2092 2286 3 014 2 831 2 656 3 013 3114 3 192 3042 3 151 2 897
3 732 2 723 3 767
351
351
74
352 354 352 347 348 349 349 352 355 351
356 348 354
73 74 73 73 69 72 74 75 74
75 74 75
16§
41
23
IO 7
4 I I 4 3 2
Total registered
All Private vehicles cars
330 309 211 556
339 567 214 849
327 803 200 923
311850 182985
300 561 168 200
300 995 161 279
307 I04 178 257 305451 176390 303 865 174 717 303 005 173 447 302 474 172 490 302 360 171 860 302 060 171 016 301 482 170 023 301 144 169 165 300 561 168 200
300 408 167 745 299 812 167 057 299 196 166 073 298 534 165 086 298 093 164 051 297 931 163 427 298 145 162 877 298 791 162 645 299 339 162 166 299 740 161 702 300 463 161 445 300 995 161 279
302 226 161 671 302 541 161 529 303 726 161 530
49

TRANSPORT
6.9 VEHICULAR TRAFFIC THROUGH TOLL-CHARGED TUNNELS AND ,VEHICULAR FERRY SERVICES
Year/month
1981
1982
1983
1984
1985
1986
1985: Mar. Apr. May June July Aug. Sept. Oct. Nov. Dec.
1986: Jan. Feb. Mar. Apr. May June July Aug. Sept. Oct. Nov. Dec.
1987: Jan. Feb. Mar.
tToll-free.
Private cars and
motor cycles
12 658
15 747
15 648
16 288
16 745
18 485
1480 1306 1324 1264 I 377 I 399 I 385 1449 1420 1486
1457 I 483 I 500 1439 1 531 I 488 I 545 I 600 I 592 I 597 I 582 1671
1 769 1 554 1660
Lion Rock Tunnel
Single deck buses, light
buses and goods vehicles
of 5.5 tonnes and less
I 726
2 659
3 332
4 250
5 174
6 674
426 403 426 392 443 432 436 482 480 489
507 392 506 511 531 512 563 599 609 639 631 675
678 564 718
Double deck buses and goods
vehicles above
5.5 tonnes
2197
2135
2288
2 675
3 384
4079
272 270 285 256 287 289 288 328 315 310
316 242 315 315 338 323 347 358 366 390 376 395
379 335 412
Total
16 581
20 541
21268
23 213
25 303
29 238
2 178 1979 2035 1912 2107 2 i20 2109 2 259 2 215 2 285
2280 2 117 2 321 2265 2400 2323 2 455 2 557 2 567 2 626 2 589 2 741
2 826 2452 2 790
Aberdeen Tunnel
6 371
10 723
12 262
12 520
13 587
I 072 965
I 068 991
1090 I 086 I 031 1075 1060 I 088
I 066 I 020 I 092 I 067 1148 1132 1179 1202 1160 1177 1145 1 198
1201 I 055 1184
Airport Tunnelt
4 306
10 180
11 982
13 645
15 049
1112 I 062 I 131 I 080 I 198 1206 1163 1200 1177 1222
1247 I 090 1247 I 195 1260 1222 1280 1284 1266 I 288 1276 1396
1405 1232 1409
Private cars,
taxis and motor cycles
31 859
32 969
32192
29 024
27 789
28 364
2408 2 269 2 374 2 157 2 335 2 327 2257 2 393 2 337 2427
2 376 2166 2 368 2 320 2 387 2285 2 387 2406 2 363 2432 2 383 2493
2 531 2228 2463
Cross Harbour Tunnel
Buses and
light Goods buses vehicles
2 432
2 420
2 392
2614
2693
2 813
235 225 233 208 222 225 216 233 229 231
233 211 230 224 234 225 237 242 232 248 248 248
253 233 254
4354
5023
5 637
6230
6900
8 263
556 554 593 533 610 605 576 622 615 626
667 496 652 662 699 663 725 727 723 746 728 776
746 634 798
Total
38 645
40 412
40 221
37 868
37 382
39 440
3 199 3 048 3 200 2 898 3 167 3 157 3 049 3 248 3 181 3 284
3 276 2 873 3 250 3 206 3 320 3 173 3 349 3 375 3 318 3 426 3 359 3 517
3 530 3095 3 514
6.10 TRAFFIC ACCIDENTS AND CASUAL TIES
Year/month
1981
1982
1983
1984
1985
1986t
1985: Mar. Apr. May June July Aug. Sept. Oct. Nov. Dec.
1986: Jan. Feb. Mar. Apr. May June July Aug. Sept. Oct. Nov. Dec.
1987: Jan. Feb. Mar,t
t Adjusted annual figures.
Hong Kong
Island§
4901
4 725
4208
3 596
3 505
3 336
269 277 349 294 315 310 281 303 312 267
295 227 247 263 328 268 270 281 310 292 261 282
267 267 325
§In~luding marine and Lantau Island. tProvisional figures.
Accidents Casualties
Kowloon
9003
9102
8 580
7 792
7 921
7 843
664 620 693 656 675 708 684 645 645 648
568 538 600 584 665 671 743 697 643 718 687 711
655 588 667
New Territories
4130
4 510
4050
3 732
3 492
3 556
288 260 317 277 360 318 304 294 268 287
265 250 306 271 291 303 268 333 329 328 308 292
326 270 319
Total
18 034
18 337
16 838
15 120
14918
14 735
1221 1157 I 359 1227 1350 I 336 1269 1242 1225 1202
I 128 I 015 1153 1118 1284 1242 1281 I 311 1282 I 338 1256 1285
1248 1125 I 311
Hong Kong Island§
Fatal Serious Slight
109 I 575 4 407
104 2 016 3 889
63 I 579 3 712
46 1185 3 299
56 1144 3 206
59 1150 2 972
7 3 3 5 6 3 4
10 4 3
3 7 5 6 7 3 I 7 4 3 4 9
6 4 3
93 88
111 94 85 89
103 92
106 96
89 81 78 99
I18 103 99 82
JOO 87 98
113
80 84
I14
247 282 300 277 316 287 257 256 274 234
254 229 225 215 295 251 250 253 257 272 225 238
258 208 280
Fatal
177
182
127
130
126
I16
7 13 11 12 11 10 II 11 14 10
II 10 12 8 9
11 12 10 10 9 7 8
9 15 9
Kowloon
Serious
3 430
4070
2 947
2279
2419
2121
203 205 205 190 207 223 217 191 208 189
176 163 153 171 167 175 183 164 179 205 201 178
170 175 204
Slight
7 676
7136
7 557
7 463
7 714
7 784
611 632 696 659 641 698 658 635 576 642
552 510 579 574 701 663 761 721 620 732 662 695
679 555 649
Thousand
Private cars and
motor cycles
I 881
I 876
I 530
2 290
2195
I 805
197 195 209 170 181 171 166 176 176 176
155 129 153 153 165 150 154 147 148 155 151 148
142 124 153
Hongkong and Yaumati Ferry Vehicular Services
Buses and
light Goods buses vehicles
59
45
44
50
44
40
4 4 4 4 4 3 3 4 4 4
3 3 4
1618
I 713
I 769
2136
2 279
2455
187 188 207· 176 200 194 185 210 203 198
200 132 193 195 215 198 217 215 216 226 222 228
204 176 239
New Territories
Fatal Serious Slight
192 2 441 3 595
171 3 548 3 163
150 2 559 3 306
146 I 905 3 682
127 I 475 ' 3 597
135 I 433 3 664
5 9
14 6 8 6
II 4
16 13
8 10 10 15 8
10 8
10 8
17 20 II
13 6 6
121 103 142 138 155 115 106 133 116 108
95 Ill 115 Il5 98
108 90
121 134 163 141 135
136 103 148
303 253 312 274 374 350 299 279 3J3 272
274 284 345 285 284 360 259 344 342 -301 321 254
302 299 322
Total
3 558
3 634
3 343
4476
4 518
4300
388 387 420 350 385 368 354 390 383 378
358 264 349 351 383 351 374 365 367 384 376 379
350 303 395
Total
23 602
24279
22000
20 135
19864
19434
1597 I 588 I 794 1 655 I 803 I 781 1666 I 6Il I 637 1567
1462 1405 1522 1488 1687 1684 1663 I 712 1654 I 789 1679 1641
1 653 1449 1 735
50 Hong Kong Monthly Digest of Statistics April 1987

COMMUNICATIONS
6.11 TELECOMMUNICATION SERVICES
Telephone service Major telecommunication services
Effectivet FAX No. of No. of Outward Public telegraph capacity (Facsimile) telex International Internal leased intemation~.l traffic
Lines (exchange lines subscribers telex traffic telex circuits telephone (thousand working Jines) in service (as at (thousand minutes) traffic (as at traffic messages)
end of (thousand end of (thousand Inland Year/month (As at end of period) period) Outward Inward Transit minutes) period) minutes) Outward Inward telegrams
1981 1 383 667 1 590 753 386 16 635 30 663 37 290 11 865 16 804 1 550 57 759 1 443 1 616 13 133
1982 1 476 965 1749247 689 18 863 35 036 37 565 12 607 20495 I 630 72 509 1 313 1426 12 190
1983 1 554 106 1870044 1 074 20 868 36 395 40 542 16 516 23 769 I 621 89443 1 242 I 233 9 IJ5
1984 1640722 I 905 231 I 978 23 657 41 160 45 482 18 013 27 936 I 674 110 681 I 286 I 172 9 569
1985 I 741 585 I 997 635 4 978 26 993 43 993 50 545 19 491 31 521 I 734 144 761 I 165 I 135 7 256
1986 I 844 403 2 107 843 12 673 28 813 46 985 53 349 18 130 36 607 I 744 184 203 940 956 7 596
1985:Mar. I 664 372 I 940 484 2 396 24 555 3 788 4 367 I 783 2 599 I 694 II 956 108 102 613 Apr. I 672 403 I 947 112 2 562 24 890 3 640 4 186 1 657 2 593 1 697 11 548 98 94 512 May 1 681 479 I 950 155 2 818 25 257 3 936 4420 I 713 2 870 I 713 12 401 106 100 710 June I 689 704 1 951 625 3 073 25 49,4 3318 3900 I 524 2 355 I 711 JI 459 91 94 577 July 1 700 891 1 960 021 3 374 25 766 3 884 4348 I 618 2 857 I 710 12449 103 99 559 Aug. I 71J 381 I 961 908 3 649 26097 3 690 4237 I 640 2 732 I 734 12 140 98 95 517 Sept. I 720 971 I 972 852 3 915 26 379 3 635 4 232 I 589 2625 I 729 12 364 90 89 489 Oct. 1 729 975 1 981 589 4282 26 658 4094 4 736 I 744 2 932 I 718 13 734 95 90 585 Nov. I 737 021 I 989 865 4 647 26 858 3 836 4346 I 590 2 844 I 735 13 302 91 91 740 Dec. I 741 585 I 997 635 4 978 26 993 3 424 3 879 I 488 2 555 I 734 12 681 89 92 821
1986: Jan. I 750 075 I 997 919 5 406 27 227 3 955 4609 I 699 2922 I 730 13 689 89 86 601 Feb. I 754 710 I 999 866 5 7ll 27 347 3 293 3 845 I 527 2466 I 728 11 454 71 67 455 Mar. I 764 338 2 018 956 6 225 27 370 3 801 4 398 1 659 2 737 I 732 14 064 81 83 523 Apr. l 770 961 I 997 168 6 824 27 590 4 237 4 713 1668 3 074 I 731 14 952 81 78 629 May 1 778 805 2 002 887 7 555 27 772 4 162 4 586 1 397 3 059 1 736 15 297 84 85 693 June l 785 990 2 034 969 7 866 27 930 3 780 4255 1 334 2 826 1 741 14462 76 81 ' 629 July 1796917 2 034 943 8 507 28 127 4 261 4 830 I 474 3 406 I 742 16 126 84 84 622 Aug. l 806 532 2 041 695 9 223 28 228 3800 4 309 1 380 3 163 l 734 15 659 76 81 667 Sept. I 816 773 2 043 655 9 924 28 416 4028 4 561 I 436 3 263 1 732 16 471 76 78 695 Oct. 1 825 763 2 062 362 JO 779 28 512 4 101 4792 l 567 3 597 I 744 17770 76 76 750 Nov. 1 834 767 2 086 744. 11 621 28 705 3 846 4 311 I 457 3 105 I 741 17 164 71 76 608 Dec. 1844403 2 107 843 12 673 28 813 3 722 4140 I 533 2 989 I 744 17 092 75 81 724
1987: Jan. I 856 823 2 112 385 13 508 28 905 3 554 4 161 I 589 2 886 I 745 16 971 67 69 646 Feb. I 864 540 2 120 569 14 536 28 997 3 697 4 Ill l 534 3 163 l 754 16 499 66 67 580 Mar. 1 877 322 2 114 545 15 135 29 102 4 173 4 655 1 666 3 421 1 765 20213 72 77 547
tFigures from April 1986 onwards are not strictly comparable to those in the past due to changes in calculation introduced in April 1986.
6.12 POSTAL SERVICES
Letter mail Parcels (million articles) (thousand)
Articles Overseas Parcels Overseas posted articles Articles posted parcels Parcels
Local to other for local in Local to other for local in Year /quarter articles countries deliveryt transitt parcels countries delivery transit
1981 265.6 97.1 91.6 4.0 227 1 709 642 59
1982 294.1 97.5 97.6 4.6 193 1 509 616 55
1983 293.6 97.1 81.8 3.8 94 1 528 568 55
1984 319.9 108.0 82.0 3.8 104 1 491 572 48
1985 358.4 115.3 85.0 3.8 203 1490 636 52
1986 404.9 124.6 81.6 3.8 142 1 485 613 49
1985: lst qtr. 82.7 26.4 20.4 0.9 35 321 151 11 2nd qtr. 84.2 26.5 19.7 0.9 57 330 148 12 3rd qtr. 90.5 27.5 20.7 0.9 49 344 149 13 4th qtr. 101.0 35.0 24.4 1.1 61 495 187 16
1986: Jst qtr. . 91.4 29.4 19.9 0.9 30 332 147 11 2nd qtr. 99.7 28.4 19.0 0.9 53 360 152 12 3rd qtr. 99.0 29.7 19.4 0.9 31 341 148 12 4th qtr. 114.8 37.1 23.3 1.1 28 452 166 14
1987: lst qtr. 102.6 31.8 19.6 0.9 20 338 137 12
t New series as from 1983 onwards.
Hong Kong Monthly Digest of Statistics April 1987 51

TOURISM
Year/month
1981
1982
1983
1984
1985
1986
1985: Mar. Apr. May June July Aug. Sept. Oct. Nov. Dec.
1986: Jan. Feb. Mar. Apr. May Ju;ne July Aug. Sept. Oct. Nov. Dec.
1987: Jan. Feb. Mar.
Airport
China Elsewhere
228 249 3 280 779
253 274 3 408 609
248 743
299 515
383 629
3 518 417
3778 II7
3 879 393
449 124 4 164 021
27 972 35 170 34 105 32 517 34015 36 355 32 455 38 598 36 537 30 242
22 285 32 240 31 849 34 734 37 486 39 571 40 191 44 556 37 673 48 328 42 709 37 502
28 269 43 792 37 749
340 469 331 556 299 381 327 573 326 386 384 969 317 452 337 466 302 873 341166
298 353 307 644 313 467 327 414 306 064 347 803 349 997 426161 349 280 386146 359 248 391 844
348 475 385 128 370 321
Ocean Going Vessel
21 585
22 531
24 722
22 758
25 489
25 892
3 6II 2600 2 703 1257
987 I 033 2210 2083 2 585 I 781
2 686 2 660 2 629 1860 2 789 I 996
675 1170 2093 2 844 3 024 1466
1498 2 743 I 953
6.13 PASSENGER ARRIVALS
Shamshuipo Macao Macao
Ferry Ferry Terminal Terminal
3 662 773
4 058 512
4 037 327
3 905 399
3998911
4 059 457
348 080 325 273 294 974 327 679 392 887 474 770 317 126 323 415 276 335 313 115
276 927 336 681 313 077 326 303 287 256 340 010 371 373 472 431 338 643 321 083 322 051 353 622
307 850 401 250 338 056
118 553
532 247
666 236
670 584
53 141 61454 50 342 54 870 67 561 72 376 49 945 56 462 57 374 57 840
47 726 55 972 56154 59 757 49174 55 OOO 58 673 75 450 56 834 53 120 49 305 53 419
40 904 61 301 53 820
Sha tin Meisha
Terminal
4 555
5 071
694 1225 1437
823 892
Control Point
HongKongTaikoktsui China Ferry China Pier Terminal
210 397
377 780
565229
633 689
875 802
548 396
82 978 90 II7 59 075 56 632 79 856
102 309 55045 83 497 68 617 79 343
43 969 61440 35 927 46634 32082 35 851 43 032 60232 42 964 49 562 45 479 51 224
36 544 82217 44691
413 840
13 386 48 428 37 393 51930 29 655 33 650 30 213 39098 28 262 31 535 33 762 36 528
25 460 48 529 34991
Note: Excluding refused landing passengers and cruise passengers.
Year/month
1981
1982
1983
1984
1985
1986
1985: Mar. Apr. May June July Aug. Sept. Oct. Nov. Dec.
1986: Jan. Feb. Mar. Apr. May June July Aug. Sept. Oct. Nov. Dec.
1987: Jan.
52
Feb. Mar.
Airport
China Elsewhere
249 294 3 370 394
273 029 3 504 456
301 566
339 063
394 029
3 615 669
3 867 513
3 979 467
457 I 04 4 290 700
30 700 37 549 33 389 33 692 33 722 33 988 35 080 39 264 32 643 26 601
26 063 39 342 35 813 35 265 35 603 39 645 39 546 42 608 41 988 47965 39 148 34 II8
45 079 36 927 41 746
317 012 331 465 315 539 340 575 358 154 382 629 315 986 348 628 324 537 339 862
309 834 309 730 333 931 317 078 324 953 359 684 384 349 421 769 357 091 398 965 385 805 387 5II
422 186 329 147 371 495
Ocean Going Vessel
14 763
20415
24199
25 762
26 680
28 042
3 871 2 636 2084 I 258 I 398
899 2003 2904 2 539 2269
2 366 2 604 3 614 1984 3 622 1606 I 138 I 189 1684 3 701 2 898 I 636
I 853 2 720 2 143
6.14 PASSENGER DEPARTURES
Macao Ferry
Terminal
3 697 581
4 071 723
3 987 009
3 806 605
3864211
3 897 889
315 054 327 283 288 304 315 945 388 354 451 631 305 603 303 383 273 385 299 939
258 982 332 409 318 446 302 546 281 327 316 841 359 739 443 627 323 IOI 307 496 308 406 344 969
360 634 339 564 319 300
Shamshuipo Macao
Ferry Terminal
125 948
579 890
729 784
753 791
56 915 60 002 52 716 60 466 74 558 78 740 55 187 57 574 63 760 63 934
53 939 66 095 61923 61 767 57 954 62 369 70 124 85 225 62 803 58 546 54 751 58 295
54426 53 506 52 857
Sha tin Meisha
Terminal
5 951
6 082
I 056 1509 1560 I 062
895
Control Point
HongKongTaikoktsui China Ferry China Pier Terminal
307 044
518 563
773 497
971 670
I 286 463
856 9II
94 622 122 239 83 472 89 776
123 646 133 312 97 943
112 810 102 541 II8 304
64 060 93 314 64478 64188 51 187 56221 76971 81208 74 334 77 854 72 838 80258
104 769 66127 73 466
550 217
18 115 59 561 56965 58 774 42105 44312 45 266 50 872 38 460 40057 45019 50 7II
52 371 41405 49001
Hung Hom
Station
493 516
521 215
493 656
670 327
850 295
I 005 310
73 436 78 862 67 635 66159 70 362 78 905 67 682 91 189 70993 67 832
56 532 74242 66 325 92 909 80 248 75 515 83 500
114910 92 710
106 804 84 717 76 898
62 240 86 232 77 957
Hung Hom
Station
515 933
537 247
515401
973 979
1196 184
I 280 575
99 386 109 817 81 903 87 283
105 596 113 963 90 619
103 039 89 390
109 611
76683 123 333 108 377 II2 280 84 OII 90 842
II5 955 131 726 102 698 II8 422 98 565
II7 683
120 271 84 175 87 859
Lowu Mankamto Terminal Terminal
3 994 134
3 709 957
4 596 634
6816220
9 377 569
9 900 127
942 384 846 560 665 457 730 073 848 072 791 368 652 682 797 780 712 828 859 448
738 988 934 409 795 452 892 886 697 717 784 202 843 046 903 198 744 OOO 823 357 827 734 915 138
770 532 I 146 792
863 910
Lowu Terminal
3 745 819
3 441 822
4 323 077
6 062 259
8 383 518
8 917 354
745 936 764 339 601482 670 941 760 981 690 630 637 150 638 706 653 163 772 665
653 276 798 351 755 435 746 733 659 685 711 562 787 341 786 846 679 807 739 050 756 442 842 826
I 048 676 680 567 794 216
19 732
104 989
130 039
179 260
290 853
374 897
24 318 25 276 22 140 22 855 32064 30243 21 029 25 102 23 657 28 581
23 461 27 403 27 755 29 876 27 953 32 345 37 296 40 283 27 686 32 207 32168 36 464
25 048 36 666 29 429
Mankamto Terminal
22108
145 978
191 776
249 448
371 996
485 690
28 219 ·32 298 26 397 26 572 40 333 39 662 27 904 30408 29 813 36 287
28 200 39 905 36444 35 406 33 627 40 134 51 313 50 127 37020 42 133 40469 50912
54 399 35 203 38 602
Sha Tau Kok Terminal Total
II 9II 165
12 456 867
13 733 320
16 842 087
107 423 20 460 671
214 893 21 826 541
I 029 3 546 2 764 6 820
14 217 18 036 II 122 14 393 14166 21 330
12 612 19 498 18 381 16 721 15430 18 674 20 998 25 734 13 440 17 361 16 551 19 493
II 858 18 407 13 845
Sha Tau Kok Terminal
I 897 418 I 800 414 I 498 576 I 627 129 I 867 632 1991 801 I 527 571 I 770 877 I 565 965 I 800 678
I 536 925 I 900 617 I 698 409 I 881 024 I 565 854 1764617 I 878 994 2 203 823 I 733 585 I 872 347 I 816 748 I 973 598
I 658 678 2313057 I 866 722
Total
II 922 936
12 513 233
13 858 142
16 882 140
!17 600 20 356 014
242 057 21 760 330
I 026 4889 3 230 6960
16 566 19 195 10 953 14 633 15 639 24 509
13 214 27 442 20 596 16499 17 326 20031 25 425 27 369 13 604 19 721 17 140 23 690
27912 12 588 14 361
I 692 741 I 792 517 1488 516 I 634 524 I 904 817 l 946 209 I 579 490 I 652 244 I 587 410 I 793 981
I 504 732 l 892 086 I 796 022 I 752 520 l 591 400 I 743 247 I 957 167 2 122 566 I 732 590 l 853 910 1821481 I 992 609
2 292 576 I 681 929 I 845 046
Hong Kong Monthly Digest of Statistics April 1987

TOURISM
6.15 HONG KONG RESIDENT DEPARTURES BY DESTINATION
West Year/month Japan Philippines Singapore Taiwan Thailand U.K. Germany
1981 136 188 111 954 59 071 306 961 149 035 70 896 5 282 1982 174 480 99 543 63 784 306 824 160 337 67 957 5 100 1983 199 348 97 245 70 817 288 202 134 258 73 523 5 329
1984 184 296 96484 81 llO 294 231 137 743 78 139 ll Oil 1985 198 612 88 801 76 358 270 872 139 504 78 626 14 870 1986 149 281 113 706 80 023 276 616 175 343 77 763 13 022
1985:Mar. 13 055 6 333 5 760 20 524 10 276 5 201 991 Apr. 16 442 7 149 5 601 22129 12 588 6644 I 050 May 12 657 5 609 5 014 18 197 7 829 5 354 I 063 June 15 738 6 760 6 869 20038 10260 7 825 I 916 July 25 743 8 181 8 604 25 551 14 451 9 332 I 870 Aug. 28 860 8 261 7 416 26 217 16 408 7 912 I 560 Sept. 13 407 5 319 5 762 19 677 7 917 10 995 I 343 Oct. 11 383 5 867 4964 25 886 8 237 5 183 870 Nov. 10474 5 711 4 851 17 280 9 656 3 677 781 Dec. 16 349 II 392 6 816 23 251 14 729 4 715 986
c 1986: Jan. 10 785 4999 4 813 17 609 7 816 7909 872 Feb. 21 001 7 678 9 071 29 171 23 133 4622 I 642 Mar. 14 642 8 464 6 620 24192 17 497 5 376 I 125 Apr. 10 164 6 241 4 701 17 897 10 423 6 314 930 May 9 919 6 981 5 197 17 929 9 545 5 454 I 073 June 10 397 9 769 6 270 21 443 12 407 7 405 I 487 July 14 606 11 775 8 971 25 975 17 686 8 230 I 171 Aug. 15 027 13 611 8 315 27 824 20 288 8 028 I 335 Sept. 9 961 9 339 6 617 21 265 11 953 10 852 I 182 Oct. 9 712 10 663 6 187 28 639 12 175 5 140 681 Nov. 9 715 9 254 5 700 19 631 13 081 3 941 801 Dec. 13 352 14 932 7 561 25 041 19 339 4492 723
1987: Jan. 18 167 14 772 11 415 28 535 22 692 9 255 I 113 Feb. 10 025 9 619 6429 20 921 15 907 4047 1 045 Mar. 11 739 10 286 6490 19 712 17 448 4978 1 087
Australia & People's Republic Year/month U.S.A. Canada New Zealand of China Macao Others Total
1981 68 756 27 667 20 612 4 537 463 3 015 910 116 748 8 626 543 1982 76409 28 281 23 904 4 615 784 3 355 578 131 849 9 109 830 1983 83 670 34092 25 386 5 724 418 3 341 945 127 665 10 205 898 1984 80 737 34 973 26 838 8 036 452 3 519 ll5 118 365 12 699 494 1985 77 369 33 306 30 469 10 960 747 3 716 413 127 013 15 812 960 1986 93 060 40 879 41 114 11 867 886 3 742 Oil 150 362 16 821 066
1985: Mar. 4 502 1 853 2 207 936 377 294 924 9 241 I 311 244 Apr. 4 542 I 928 2 180 995 607 315 585 9 192 I 400 637 May 5 179 2486 I 756 759 984 272 373 7 721 I 105 222 June 7080 3 233 I 897 844 930 306 155 10 701 I 243 402 July 10 529 4 835 2 852 I 013 927 390 155 14 706 I 530 736 Aug. ll 415 6 243 2 534 963 501 445 729 12 983 I 539 039 Sept. 6 556 3 299 I 942 822 193 292 735 9 242 I 200 387 Oct. 4 237 1 605 2 047 851 371 282 825 9 763 I 214 238 Nov. 3 969 I 409 2 301 858 273 265 537 8 830 I 192 749 Dec. 6209 2 391 3 964 I 029 710 283 069 12 648 I 416 229
1986: Jan. 5 941 2 312 3 333 823 102 238 599 8 619 I 136 709 Feb. 7 370 2 194 6 065 I 134 296 338 084 17 567 I 601 894 Mar. 5 204 2 060 3 702 I 008 321 310 708 13 837 I 421 748 Apr. 3 992 I 988 2047 990 359 295 861 9 512 I 360 429 May 6 166 2 815 2 265 847 698 271 371 9 358 I 195 771 June 9 032 3 921 2367 923 348 300 257 12 851 I 320 954 July 15 164 6727 3 924 I 061 813 358 999 17 069 I 552 llO Aug. 14 597 8 077 3 775 I 086 459 437 247 16 141 I 660 724 Sept. 7 931 3 842 2 832 894 962 308 123 10904 I 299 763 Oct. 4720 2 158 2 514 981 585 287 074 9 625 I 360 873 Nov. 5 205 I 824 2 859 989 065 282 265 9 958 I 353 299 · Dec. 7 738 2 961 5 431 I 126 878 313 423 14 921 I 556 792
1987: Jan. II 408 4 271 7 Oil I 385 348 333 109 20453 I 867 549 Feb. 4 498 I 937 4 736 891 983 319 607 11 655 I 302 409 Mar. 5 197 2 951 2 978 I 008 761 293 144 II 277 I 396 048
Note: Hong Kong residents may tra.vel to more than one country other than the destination claimed.
Hong Kong Monthly Digest of Statistics April 1987 53

TOURISM
6.16 VISITOR ARRIVALS BY COUNTRY OF RESIDENCE
S.E. West Australia and Year/month Japan Asiat U.S.A. Europe New Zealand Canada Otherst Total
1981 507 960 557 574 372 133 408 578 228 602 64455 395 901 2 535 203
1982 515 697 594 669 377 853 389 113 239 290 61 413 431 065 2 609 100
1983 502 175 642 563 451 566 402 890 250 792 73 672 451 356 2 775 014
1984 584 013 664 780 562 764 436 552 304 615 94177 504 771 3 151 672
1985 635 767 706 180 638 168 500 959 298 713 113 545 549 841 3443173
1986 727 219 735 609 704 428 573 425 304 019 127 736 616 059 3 788 495
1985:Mar. 72 897 47 243 51 094 45404 24409 9 247 47 379 297 673 Apr. 45 770 72902 52 629 44442 25 333 10 924 45445 297 445 May 46 733 68 410 56 884 38 799 29096 9064 46943 295 929 June 49 115 89 992 52 955 34077 24468 7 417 44 524 302 548 July 46 548 56 630 56 012 39 848 22 291 10467 50 342 282 138 Aug. 63 889 52 765 50462 44956 26 630 7 921 51 598 298 221 Sept. 56 164 58 627 53 323 40 962 29 750 8 235 45027 292 088 Oct. 50046 67 864 82429 57 760 26 879 12 978 45 874 343 830 Nov. 51 196 55 761 63 110 55 020 20 713 11 397 42 142 299 339 Dec. 52 438 66 058 49 387 39 119 23 642 11 425 47 988 290 057
1986: Jan. 55 980 36 236 44 441 36 057 29 193 9 340 45 515 256 762 Feb. 47 433 36 870 35 413 33 582 12 779 8 487 43 305 217 869 Mar. 68 426 44 387 51 999 47 294 20 585 11 359 45 335 289 385 Apr. 49 787 69 053 54 271 49 197 23 983 10 291 46 410 302 992 May 46 586 68 598 60262 45 507 28 234 9 239 48484 306 910 June 52 325 93 412 59 452 38 082 28 549 8 106 45 940 325 866 July 52 454 56 514 64 171 45 983 27 500 10 171 58 508 315 301 Aug. 79 783 55 675 54254 51 600 32 881 8 871 58 680 341 744 Sept. 66 502 69 474 58 940 46 089 30 018 8 987 52 221 332 231 Oct. 69 897 74 727 89 918 68 360 26 398 15 119 56 594 401 013 Nov. 67 942 60 192 72 555 65 736 20 873 14 205 54 390 355 893 Dec. 70 104 70 471 58 752 45 938 23 026 13 561 60677 342 529
1987: Jan. 74 010 41 093 47 856 43 458 25 956 12 391 55 098 299 862 Feb. 70 463 38 737 44790 43 204 15 750 11 800 66 841 291 585 Mar. 93 309 53 131 57 907 55 526 20 623 13 638 57 834 351 968
tS.E. Asia excludes Taiwan. +Including the People's Republic of China.
6.17 RECEIPTS FROM VISITORSi $million
S.E. West Australia and Year/month Japan Asiat U.S.A. Europe New Zealand Canada Others Total
1981 1,553.50 1,482.27 1,138.35 1,192.80 908.15 206.22 1,180.52 7,661.81
1982 1,428.30 1,743.88 1,291.12 1,199.32 966.92 163.89 1,392.39 8,185.82
1983 1,624.06 2,292.71 2,154.15 1,348.80 1,317.20 298.51 1,822.23 10,857.66
1984 2,060.51 2,561.61 2,996.38 1,597.45 1,772.77 425.59 2,143.62 13,557.93
1985 2,511.09 2,457.58 3,416.12 1,729.02 1,561.95 445.21 2,159.13 14,280.10
1986 3,612.72 3,073.95 3,736.00 2,257.60 1,700.13 523.28 2,340.25 17,243.93
1984: July-Dec. 1,063.14 1,232.98 1,765.36 866.54 942.69 225.79 1,189.67 7,286.17
1985: Jan.-June 1,240.82 1,242.67 1,589.94 769.23 859.20 198.04 1,090.34 6,990.24 July-Dec. 1,270.27 1,214.91 1,826.18 959.79 702.75 247.17 1,068.79 7,289.86
1986: Jan.-June 1,551.14 1,389.75 1,630.09 976.35 808.80 241.00 1,017.52 7,614.65 July-Dec. 2,061.58 1,684.20 2,105.91 1,281.25 891.33 282.28 1,322.73 9,629.28
tS.E. Asia excludes Taiwan. tFigures as from 1986 onwards do not include visitors from the People's Republic of China.
54 Hong Kong Monthly Digest of Statistics April 1987

TOURISM
6.18 PER CAPITA SPENDING AND LENGTH OF STAY OF VISITORSi
Per capita spending ($) Length of stay (nights)
Australia Australia S.E. West and New S.E. West andNew
Year/month Japan Asiat U.S.A. Europe Zealand canada Others Total Japan Asiat U.S.A. Europe Zealand Canada Others Total
1981 3,058 2,658 3,059 2,919 3,973 3,199 2,982 3,022 2.59 3.58 3.74 4.04 4.68 4.20 3.57 3.59 1982 2,770 2,933 3,417 3,082 4,041 2,669 3,230 3,137 2.37 3.75 3.77 4.10 4.67 3.81 3.46 3.57 1983 3,234 3,568 4,770 3,348 5,252 4,052 4,037 3,913 2.48 3.64 3.87 4.16 4.83 4.18 3.34 3.62 1984 3,528 3,853 5,324 3,659 5,820 4,519 4,247 4,302 2.50 3.56 3.87 3.88 4.98 4.27 3.57 3.62 1985 3,950 3,480 5,353 3,451 5,229 3,921 3,927 4,147 2.58 3.51 3.64 3.75 4.98 4.31 3.50 3.55 1986 4,968 4,179 5,304 3,937 5,592 4,097 4,172 4,619 2.72 3.57 3.49 3.65 5.02 3.95 ' 3.39 3.51
1984: July-Dec. 3,504 3,527 5,497 3,568 5,761 4,379 4,302 4,264 2.48 3.47 3.99 . 3.86 4.86 4.14 3.57 3.61 1985: Jan.-June 3,933 3,566 5,609 3,445 5,774 3,874 4,086 4,269 2.67 3.64 3.69 3.78 5.18 4.64 3.51 3.63
July-Dec. 3,966 3,396 5,148 3,457 4,688 3,960 3,777 4,037 2.49 3.38 3.60 3.73 4.78 4.04 3.49 3.48
1986: Jan.-June 4,839 3,987 5,330 3,910 5,643 4,241 4,140 4,558 2.77 3.54 3.54 3.69 5.04 4.01 3.32 3.53 July-Dec. 5,069 4,351 5,283 3,958 5,547 3,981 4,198 4,668 2.68 3.60 3.45 3.62 5.00 3.90 3.45 3.49
tS.E. Asia excludes Taiwan. tFigures as from 1986 onwards do not include visitors from the People's Republic of China.
6.19 HOTEL STATISTICS
High tariff hotels Medium tariff hotels Hostels and guest houses All types
No.of hostels
Room Room and Room Room No.of No.of occupancy No.of No.of occupancy guest No.of occupancy No.of No.of occupancy
Year/month hotels rooms rate(%) hotels rooms rate(%) houses rooms rate(%) hotels rooms rate(%)
1981 25 13 837 88 17 1 753 85 5 733 86 47 16 323 87 1982 26 14 935 83 16 1 796 81 5 684 82 47 17 415 82 1983 27 14 999 83 15 1 752 79 6 819 86 48 17 570 83 1984 28 15 377 89 15 1 785 84 7 869 87 50 18 031 89 1985 28 15 311 88 15 1680 90 8 1189 85 51 18 180 88 1986 29 16 762 87 17 2060 80 11 1408 73 57 20230 85
1985: Mar. 28 15 377 94 16 1 845 95 7 869 87 51 18 091 94 Apr. 28 15 377 91 16 1 845 95 7 869 88 51 18 091 92 May 28 15 377 89 16 1 845 95 7 869 87 51 18 091 90 June 28 15 356 91 16 1 845 95 7 869 87 51 18 070 I 91 July 28 15 356 82 16 1 845 87 7 869 85 51 18 070 83 Aug. 28 15 356 85 16 1845 83 7 869 84 51 18 070 85 Sept. 28 15 356 89 16 1 845 90 7 869 82 51 18 070 89 Oct. 28 15 356 97 16 1 845 99 7 869 91 51 18 070 97 Nov. 28 15 356 93 16 1 845 96 7 869 84 51 18 070 93 Dec. 28 15 311 84 15 1 680 88 8 1189 79 51 18 180 84
1986: Jan. 26 15 181 86 17 1 810 80 8 1189 64 51 18 180 84 Feb. 27 15 531 74 17 1 810 63 8 1189 60 52 18 530 72 Mar. 27 15 531 85 17 1 810 81 8 1189 66 52 18 530 83 Apr. 27 15 531 87 17 1 810 84 8 1189 71 52 18 530 85 May 27 15 531 86 17 1 810 81 8 1189 70 52 18 530 84 June 29 17 209 88 18 2162 78 11 1 386 69 58 20757 86 July 29 17 209 84 18 2162 75 11 1 386 68 58 20 757. 82 Aug. 29 17209 86 18 2162 75 11 1 386 71 58 20757 84 Sept. 29 17 209 88 18 2162 81 11 1 386 75 58 20757 86 Oct. 29 17209 96 17 2060 92 11 1 386 88 57 20655 95 Nov. 29 17 209 95 17 2060 90 11 1 386 86 57 20655 94' Dec. 29 16 762 84 17 2060 81 11 1408 77 57 20 230. 84
1987: Jan. 29 16 762 82 16 2 157 71 9 980 75 54 19 899 80 Feb. 29 16 762 86 16 2 157 74 9 980 73 54 19 899 84 Mar. 29 16 762 89 16 2 157 86 9 980 83 54 19 899 88
Hong Kong Monthly Digest of Statistics April 1987 55

SECTION 7 MONEY~ BANKING AND FINANCE
7.1 CURRENCY IN CIRCULATION AND MONEY SUPPLY
$million
Legal tender notes and Banks' and deposit- Legal tender notes coins in circulation taking companies' and coins in hands
holdings of legal of public tender notes and coins
Commercial Government Total As at end of bank issues issues year/month HK$ HK$ HK$ HK$ HK$
1981 ll,066 1,241 12,307 2,480 9,827
1982 12,646 1,282 13,928 2,486 ll,442
1983 13,930 1,413 15,343 2,629 12,714
1984 14,246 1,375 15,621 2,347 13,273
1985 17,966 1,493 19,458 2,601 16,857
1986 20,626 1,786 22,412 3,117 19,295
1985: Mar. 15,766 1,550 17,315 2,385 14,930 Apr. 15,756 1,478 17,234 2,564 14,670 May 15,956 1,433 17,388 2,648 14,740 June 16,506 1,429 17,935 2,757 15,178 July 16,746 1,419 18,164 2,828 15,337 Aug. 17,036 1,418 18,454 2,465 15,989 Sept. 17,636 1,431 19,067 2,462 16,605 Oct. 17,356 1,431 18,787 2,597 16,190 Nov. 17,466 1,441 18,906 2,347 16,560 Dec. 17,966 1,493 19,458 2,601 16,857
1986: Jan. 20,826 1,837 22,663 4,298 18,364 Feb. 19,836 1,745 21,581 2,966 18,615 Mar. 19,706 1,624 21,329 2,825 18,504 Apr. 18,596 1,569 20,165 2,818 17,347 May 18,536 1,537 20,073 2,539 17,534 June 18,546 1,534 20,080 2,832 17,248 July 18,636 1,529 20,165 2,664 17,501 Aug. 19,356 1,529 20,885 2,767 18,119 Sept. 19,726 1,535 21,260 2,810 18,451 Oct. 19,846 1,545 21,391 2,820 18,571 Nov. 19,956 1,593 21,549 2,737 18,813 Dec. 20,626 1,786 22,412 3,117 19,295
1987: Jan. 27,306 1,988 29,294 3,927 25,367 Feb. 22,066 1,848 23,914 2,916 20,998 Mar. 21,676 1,736 23,411 3,002 20,410
Money supply Money supply Money supply definition I definition 2 definition 3
As at end of Foreign Foreign Foreign year/month HK$ currency Total HK$ currency Total HK$ currencyt Totalt
1981 23,748 1,446 25,194 96,761 19,995 ll6,756 145,933 30,885 176,818
1982 26,086 1,399 27,485 120,956 85,732 206,688 149,254 100,985 250,240
1983 28,277 2,619 30,896 138,818 ll8,867 257,685 168,020 138,919 306,939
1984 33,351 3,440 36,791 172,547 141,533 314,081 208,266 166,613 374,879
1985 41,806 3,460 45,266 194,641 195,597 390,239 233,230 224,573 457,803
1986 51,600 4,494 56,094 237,776 280,355 518,131 270,517 31!,691 582,208
1985: Mar. 36,131 3,186 39,316 178,409 154,297 332,706 215,017 178,005 393,022 Apr. 36,075 3,303 39,378 179,936 156,646 336,582 217,191 180,050 397,241 May 36,792 3,547 40,339 182,463 161,617 344,080 219,926 184,842 404,768 June 38,616 3,739 42,356 184,272 164,205 348,477 222,094 187,702 409,796 July 39,405 3,553 42,959 185,415 169,81! 355,226 223,543 195,669 419,212 Aug. 40,257 3,891 44,147 186,868 175,164 362,031 224,892 202,022 426,824 Sept. 41,363 4,316 45,679 187,396 178,975 366,371 225,785 205,744 431,529 Oct. 41,139 3,584 44,723 190,041 184,375 374,416 228,582 210,791 439,373 Nov. 41,293 3,760 45,054 191,746 190,255 382,001 229,941 217,094 447,034 Dec. 41,806 3,460 45,266 194,641 195,597 390,239 233,230 224,573 457,803
1986: Jan. 43,721 3,722 47,442 200,986 202,913 403,900 241,030 233,132 474,162 Feb. 42,690 4,433 47,123 201,422 211,938 413,360 241,476 243,055 484,530 Mar. 41,850 4,021 45,871 200,196 212,897 413,093 239,171 242,937 482,108 Apr. 92,189 3,917 96,106 248,716 220,781 469,497 285,463 249,399 534,862 May 42,341 3,820 46,161 204,831 226,471 431,301 240,273 254,575 494,848 June 42,854 4,167 47,021 206,836 229,438 436,274 242,432 257,674 500,107 July 42,474 4,946 47,420 210,350 238,903 449,253 245,513 266,863 512,376 Aug. 45,521 5,109 50,630 213,21! 248,122 461,332 248,329 276,474 524,802 Sept. 45,603 4,293 49,896 218,419 259,447 477,866 253,152 288,097 541,248 Oct. 47,649 4,417 52,066 225,138 267,120 492,258 258,889 296,036 554,925 Nov. 48,581 4,821 53,403 228,167 272,526 500,693 261,551 302,194 563,745 Dec. 51,600 4,494 56,094 237,776 280,355 518,131 270,517 3ll,691 582,208
1987: Jan. 57,967 4,875 62,842 249,029 286,233 535,262 280,358 316,368 596,727 Feb. 54,473 5,046 59,519 251,490 294,225 545,714 282,105 323,041 605,145 Mar. 54,193 5,190 59,383 257,310 303,553 560,863 287,802 331,799 619,601
tFigures for the period July 1982 to February 1987 have been revised to rectify mis-classification of bonds and notes issued as deposits by some deposit-taking companies.
56 Hong Kong Monthly Digest of Statistics April 1987

7.2 DEPOSITS FROM CUSTOMERS
As at end of year/month
1981
1982
1983
1984
1985
1986
1985: Mar. Apr. May June July Aug. Sept. Oct. Nov. Dec.
1986: Jan. Feb. Mar. Apr. May June July Aug. Sept. Oct. Nov. Dec.
1987: Jan. Feb. Mar.
As at end of year/month
1981
1982
1983
1984
1985
1986
1985:
1986:
1987:
Mar. Apr. May June July Aug. Sept. Oct. Nov. Dec.
Jan. Feb. Mar. Apr. May June July Aug. Sept. Oct. Nov. Dec.
Jan. Feb. Mar.
HK$
13,921
14,644
15,564
20,078
24,949
32,305
21,201 21,404 22,052 23,439 24,069 24,268 24,758 24,950 24,734 24,949
25,356 24,076 23,346 74,842 24,807 25,606 24,973 27,403 27,152 29,078 29,769 32,305
32,601 33,476 33,784
Demand
Foreign currency
1,446
1,399
2,619
3,440
3,460
4,494
3,186 3,303 3,547 3,739 3,553 3,891 4,316 3,584 3,760 3,460
3,722 4,433 4,021 3,917 3,820 4,167 4,946 5,109 4,293 4,417 4,821 4,494
4,875 5,046 5,190
Total
15,367
16,043
18,182
23,518
28,409
36,799
24,386 24,707 25,599 27,178 27,622 28,158 29,074 28,533 28,494 28,409
29,078 28,509 27,367 78,759 28,627 29,772 29,919 32,511 31,445 33,495 34,590 36,799
37,475 38,521 38,974
Licensed deposit-taking companies
Foreign HK$· currencyt
NA NA
3,455 5,755
5,264 10,142
7,734 10,997
6,948 13,999
6,496 16,105
7,129 7,220 7,068 7,019 7,025 6,956 7,178 7,443 7,000 6,948
7,107 6,801 6,811 6,647 6,282 6,429 6,668 6,692 6,536 6,348 6,405 6,496
6,453 6,660 6,664
11,463 11,335 11,118 11,371 13,039 13,714 13,850 14,228 13,806 13,999
14,160 14,718 13,484 13,114 12,724 13,410 13,525 14,244 14,125 14,577 13,977 16,105
15,095 14,327 14,192
Totalt
NA
9,210
15,407
18,731
20,947
22,601
18,591 18,554 18,186 18,390 20,064 20,670 21,027 21,671 20,806 20,947
21,267 21,519 20,295 19,762 19,005 19,839 20,192 20,936 20,660 20,925 20,382 22,601
21,548 20,987 20,856
HK$
48,073
61,907
58,704
66,241
81,216
97,949
71,503 71,670 72,514 76,075 78,190
"80,450 79,944 80,941 80,682 81,216
83,047 83,208 81,893 78,421 82,766 83,243 82,969 86,928 89,464 93,353 94,452 97,949
102,585 106,863 107,536
Savings
Foreign currency
4,779
7,683
12,452
14,909
17,549
27,527
15,294 15,644 15,520 16,257 16,534 16,310 16,463 17,001 17,381 17,549
17,527 17,768 18,119 18,596 20,389 21,228 22,492 23,298 23,755 25,273 26,475 27,527
27,656 29,678 29,668
Total
52,852
69,590
71,156
81,150
98,765
125,476
86,797 87,314 88,034 92,331 94,723 96,760 96,407 97,942 98,063 98,765
100,574 100,976 100,013 97,017
103,156 104,471 105,460 110,225 113,219 118,625 120,926 125,476
130,241 136,541 137,204
Registered deposit-taking companies
HKS
48,489
24,053
23,463
27,450
31,063
25,269
28,925 29,474 29,833 30,217 30,521 30,351 30,631 30,528 30,632 31,063
32,354 32,641 31,553 29,458 28,596 28,578 27,827 27,565 27,351 26,492 26,001 25,269
23,900 22,994 22,992
Foreign currencyt. Totalt
10,678 59,167
9,243 . 33,296
9,300 32,763
12,680 40,131
11,577 42,640
11,428 36,697
10,036 9,887 9,911 9,721
10,464 10,676 10,490 9,766
10,509 11,577
12,818 13,242 13,360 12,370 12,255 11,690 11,229 11,065 11,487 11,315 11,901 11,428
11,210 11,451 11,062
38,961 39,361 39,745 39,937 40,986 41,027 41,121 40,293 41,141 42,640
45,172 45,883 44,913 41,827 40,851 40,269 39,055 38,630 38,838 37,806 37,901 36,697
35,110 34,444 34,054
Banks
HKS
23,876
31,324
50,406
71,686
67,955
83,083
69,340 70,657 71,590 67,850 65,675 63,669 63,346 65,034 66,656 67,955
70,684 71,849 72,691 74,099 75,717 76,554 80,450 76,447 78,790 79,139 80,557 83,083
82,938 84,216 89,385
Time
Foreign currency
12,363
73,302
100,129
119,750
172,095
245,995
131,813 133,789 138,679 140,639 146,330 151,626 155,111 161,020 166,342 172,095
179,134 187,385 188,134 195,882 200,074 201,990 209,546 217,625 229,084 235,257 238,812 245,995.
251,451 257,191 266,326
Total
36,239
104,626
150,535
191,436
240,050
329,078
201,153 204,446 210,270 208,489 212,005 215,295 218,457 226,053 232,997 240,050
249,818 259,234 260,825 269,981 275,791 278,543 289,997 294,072 307,873 314,396 319,369 329,078
334,388 341,407 355,711
All deposit-taking companies
Foreign HK$
48,489
27,508
28,728
35,185
38,011
31,766
36,054 36,693 36,901 37,236 37,546 37,307 37,809 37,971 37,631 38,011
39,461 39,442 38,364 36,105 34,878 35,007 34,494 34,257 33,886 32,840 32,406 31,766
30,353 29,654 29,656
currencyt
10,678
14,998
19,442
23,677
25,576
27,533
21,498 21,222 21,029 21,092 23,504 24,389 24,340 23,994 24,315 25,576
26,978 27,960 26,844 25,484 24,978 25,101 24,753 25,309 25,612 . 25,892 25,878 27,533
26,305 25,778 25,254
Totalt
59,167
42,506
48,170
58,861
63,587
59,298
57,552 57,915 57,930 58,327 61,049 61,697· 62,149 61,965· 61,947 63,587
66,439 67,401 65,208
• 61,589 59,856 60,108 59,248 59,566 59,498 58,731 58,284 59,298
56,658 55,432 54,910
tFigures for the period July 1982 to February 1987 have been revised to rectify mis-classification of bonds and notes issued as deposits by some <leposit-taking companies.
Hong Kong Monthly Digest of Statistics April 1987
HK$
85,870
107,876
124,674
158,005
174,121
213,337
162,044 163,731 166,156 167,363 167,934 168,386 168,048 170,924 172,071 174,121
179,087 179,132 177,930 227,362 183,290 185,402 188,392 190,778 195,406 201,570 204,778 213,337
218,123 224,554 230,705
BANKING
Total
Foreign currency
18,588
82,384
115,200
138,099
193,104
278,016
150,293 152,736 157,746 160,635 166,417 171,827 175,891 181,605 187,483 193,104
200,383 209,586 210,275 218,396 224,284 227,384 236,984 246,031 257,132 264,947 270,107 278,016
283,982 291,915 301,184
$million
Total
104,457
190,259
239,874
296,103
367,224
491,353
312,337 316,467 323,902 327,998 334,350 340,213 343,939 352,529 359,554 367,224
379,469 388,719 388,205 445,757 407,573 412,787 425,376 436,808 452,538 466,517 474,885 491,353
502,105 516,469 531,889
All deposit-taking institutions
Foreign HKS
134,359
135,384
153,401
193,190
212,132
245,103
198,097 200,424 203,057 204,599 205,480 205,693 205,851 208,895 209,703 212,132
218;548 218,574 216,294 263,466 218,168 220,409 222,886 225,035 229,292 234,410 237,184 245,103
248,477 254,208 260,361
currencyt Totalt
29,266 163,625
97,381 232,765
134,642 288,044
161,776 354,965
218,680 430,811
305,549 550,651
171,791 173,957 178,775 181,727 189,920 196,217 200,231 205,599 211,798 218,680
227,361 237,546 237,119 243,879 249,262 252,485 261,737 271,340 282,744 290,839 295,985 305,549
310,286 317,693 326,438
369,889 374,382 381,832 386,326 395,400 401,910 406,087 414,493 421,501 430,811
445,909 456,120 453,413 507,346 467,429 472,894 484,623 496,375 512,036 525,248 533,169 550,651
558,763 571,901 586,798
57

BANKING
As at eild of year/month
1981
1982
1983
1984
1985
1986
1985: Mar. Apr. May June July Aug. Sept. Oct. Nov. Dec.
1986: Jan. Feb. Mar. Apr. May June July Aug. Sept. Oct. Nov. Dec,
1987: Jan. Feb. Mar.
As at end of year /month
1981
1982
1983
1984
1985
1986
1985:
1986:
1987:
58
Mar. Apr. May June July Aug. Sept. Oct. NOv. Dec.
Jan. Feb. Mar.
.Apr. May June July Aug. Sept. Oct Nov. Dec.
Jan." Feb. Mar.
7.3 BALANCE SHEETS: BANKS
Amount due to banks and deposit-taking
companies in Hong Kong
HK$
61,524
58,898
69,ll8
79,622
89,769
101,526
83,302 82,861 90,161 87,180 86,500 89,748 92,582 91,724 95,206 89,769
92,443 89,507 93,609
130,225 102,466 89,952 92,150 99,646 94,641 99,754 98,824
101,526
105,450 99,031
103,995
Foreign currency
26,724
38,814
62,618
81,860
94,227
175,084
84,862 80,637 84,353 90,127 86,064 89,701 91,388 85,926 87,704 94,227
96,136 93,783
ll 1,214 ll2,908 ll9,l44 118,212 126,239 138,430 151,461 151,216 163,886 175,084
170,355 163,281 182,461
Other liabilities
Foreign HK$ currency
36,258
51,563
57,556
44,846
54,207
50,047
44,881 44,929 45,637 45,087 45,454 46,lll 49;152 47,833 50,095 54,207
53,099 54,608 56,261 54,387 53,995 56,019 53,392 54,155 55,867 52,978 52,243 50,047
50,424 50,745 53,946
10,355
14,271
24,219
16,534
17,191
25,676
17,791 18,152 17,132 16,837 17,756 16,981 18,846 19,521 18,965 17,191
18,676 20,718 20,308 22,037 24,176 23,239 24,055 23,320 23,826 20,425 23,496 25,676
26,204 27,762 31,527
Total
88,248
97,712
131,736
161,482
183,996
276,610
168,164 163,498 174,514 177,307 172,563 179,450 183,970 177,650 182,9ll 183,996
188,579 183,289 204,823 243,133 221,610 208,164 218,389 238,076 246,102 250,970 262,709 276,610
275,805 262,312 286,456
Total
46,613
65,833
81,774
61,380
71,398
75,723
62,673 63,080 62,768 61,924 63,210 63,091 67,998 67,354 69,060 71,398
71,775 75,325 76,569 76,424 78,171 79,257 77,447 77,476 79,693 73,403 75,739 75,723
76,628 78,508 85,473
Liabilities
HK$
6,089
6,129
8,870
8,586
13,691
19,973
10,169 10,893 10,402 10,694 10,850 ll,123 10,754 10,987 ll,128 13,691
14,081 14,422 14,763 15,699 15,448 15,851 16,697 17,126 18,179 16,773 18,270 19,973
19,420 17,llO 18,025
Amount due to banks abroad
Foreign currency
164,134
226,725
315,006
364,415
450,473
811,068
398,932 391,915 402,178 392,480 401,292 414,258 428,962 410,186 447,170 450,473
456,160 457,715 482,886 519,335 538,989 538,501 586,954 614,042 668,306 666,640 741,265 8ll,068
894,019 908,009 976,562
Total liabilities
Foreign HK$ currency Total
192,308 222,039 414,346
228,642 367,946 596,588
264,766 523,859 788,625
295,897 607,671 903,568
341,216 759,806 l,101,021
402,735 l,294,789 l,697,524
305,546 308,053 318,100 316,289 317,214 322,724 328,872 329,886 337,016 341,216
348,326 347,805 352,961 439,651 367,490 360,000 364,579 375,799 379,581 387,250 391,065 402,735
658,821 650,294 668,261 666,439 677,601 698,875 720,716 702,433 746,520 759,806
776,162 786,398 830,144 877,664 9ll,255 911,765 978,659
l,026,796 l,105,578 l,107,976 l,203,885 l,294,789
964,367 958,348 986,361 982,728 994,815
1,021,599 l,049,588 1,032,318 l,083,536 l,101,021
l,124,489 1,134,203 l,183,105 1,317,315 l,278,745 l,271,765 l,343,238 l,402,595 l,485,159 l,495,225 l,594,950 l,697,524
412,330 l,379,622 l,791,952 411,137 l,396,230 l,807,368 427,925 1,497,285 l,925,2ll
Total
170,223
232,854
323,875
373,001
464,163
831,041
409,101 402,808 412,580 403,173 412,142 425,381 439,716 421,173 458,297 464,163
470,241 472,137 497,649 535,034 554,437 554,352 603,651 631,168 686,485 683,413 759,535 831,041
913,439 925,119 994,587
Liabilities
Hong Kong notes and
coins
2,473
2,474
2,621
2,340
2,594
3,108
2,378 2,557 2,640 2,751 2,821 2,459 2,456 2,592 2,341 2,594
4,291 2,958 2,818 2,809 2,532 2,826 2;658 2,755 2,801 2,8ll 2,724 3,108
3,921 2,906 2,996
HK$
85,870
107,876
124,674
158,005
174,121
213,337
162,044 163,731 166,156 167,363 167,934 168,386 168,048 170,924 172,071 174,121
179,087 179,132 177,930 227,362 183,290 185,402 188,392 190,778 195,406 201,570 204,778 213,337
218,123 224,554 230,705
Deposits from customers
Foreign currency
18,588
82,384
115,200
138,099
193,104
278,016
150,293 152,736 157,746 160,635 166,417 l7l,827 175,891 181,605 187,483 193,104
200,383 209,586 210,275 218,396 224,284 227,384 236,984 246,031 257,132 264,947 270,107 278,016
283,982 291,915 301,184
Total
104,457
190,259
239,874
296,103
367,224
491,353
312,337 316,467 323,902 327,998 334,350 340,213 343,939 352,529 359,554 367,224
379,469 388,719 388,205 445,757 407,573 412,787 425,376 436,808 452,538 466,517 474,885 491,353
502,105 516,469 531,889
Amount due from banks and deposit-taking companies
inHohgKong
Foreign HK$ currency Total
37,300 37,174 74,474
56,774 59,699 116,473
66,439 98,696 165,135
74,877 120,447 195,323
83,308 142,127 225,434
104,229 236,657 340,886
77,229 76,895 85,097 81,141 80,175 82,338 85,500 86,4ll 88,829 83,308
85,319 81,940 86,575
130,663 99,247 87,806 89,640 96,891 94,522 98,501 99,790
104,229
lll,024 105,786 ll3,39l
128,371 125,932 128,575 133,631 128,484 132,ll9 132,793 129,662 136,976 142,127
139,273 138,974 156,809 154,113 162,380 161,264 173,935 187,787 204,283 2l3,ll2 230,682 236,657
234,248 228,037 243,690
205,600 202,827 213,672 214,771 208,659 214,457 218,294 216,072 225,805 225,434
224,592 220,914 243,384 284,777 261,626 249,070 263,575 284,677 298,805 311,613 330,472 340,886
345,272 333,823 357,081
$million
Negotiable certificates of deposit outstanding
HK$
2,568
4,177
4,549
4,838
9,429
17,853
5,150 5,640 5,745 5,966 6,477 7,356 8,336 8,417 8,516 9,429
9,617 10,137 10,398 11,979 12,292 12,776 13,947 14,094 15,488 16,175 16,951 17,853
18,912 19,697 21,255
Assets
Foreign currency
2,237
5,752
6,817
6,765
4,811
4,945
6,943 6,855 6,851 6,361 6,072 6,108 5,630 5,196 5,198 4,811
4,808 4,597 5,462 4,988 4,663 4,429 4,428 4,972 4,854 4,748 5,131 4,945
5,062 5,263 5,551
Total
4,805
9,929
ll,366
11,602
14,240
22,798
12,093 12,495 12,596 12,326 12,549 13,464 13,966 13,613 13,714 14,240
14,425 14,733 15,860 16,966 16,954 17,205 18,375 19,067 20,342 20,923 22,082 22,798
23,975 24,960 26,806
Amount due from banks abroad
Foreign HK$ currency Total
6,499 ll2,l60 ll8,659
7,997 187,647 195,644
12,88 l 258, 707 271,588
13,808 315,018 328,826
24,598 419,365 443,963
28,255 790,042 818,297
16,319 17,541 17,708 18,177 19,931 21,446 22,102 23,469 23,867 24,598
25,447 25,866 26,ll3 27,719 25,892 26,064 26,872 28,261 27,771 29,154 27,922 28,255
27,900 25,176 25,587
356,082 345,630 356,223 347,928 360,484 380,672 397,551 378,586 413,385 419,365
433,755 438,255 458,586 504,889 518,927 514,775 558,165 587,188 626,567 631,408 712,443 790,042
858,572 880,861 948,147
372,401 363,171 373,931 366,104 380,414 402,ll7 419,652 402,055 437,252 443,963
459,202 464,121 484,700 532,608 544,819 540,839 585,037 615,450 654,339 660,562 740,365 818,297
886,472 906,037 973,733
Hong Kong Monthly Digest of Statistics April 1987

7.3 BALANCE SHEETS: BANKS-contd.
As at end of year/month
1981
1982
1983
1984
1985
1986
1985:
1986:
Mar. Apr. May June July Aug. Sept. Oct. Nov. Dec.
Jan. Feb. Mar. Apr. May June July Aug. Sept. Oct. Nov. Dec.
1987: Jan. Feb. Mar.
As at end of year/month
1981
1982
1983
1984
1985
1986
1985:
1986:
1987:
Mar. Apr. May June July Aug. Sept. Oct. Nov. Dec.
Jan. Feb. Mar. Apr. May June July Aug. Sept. Oct. Nov. Dec.
Jan. Feb. Mar.
Issued by banks in Hong Kong
Foreign HK$ currency Total
565
1,067
1,371
1,661
2,804
7,138
1,821 2,109 2,099 2,082 2,211 2,480 2,723 2,790 2,792 2,804
3,003 3,175 3,149 3,978 4,327 4,420 5,036 5,323 5,918 6,108 6,821 7,138
7,311 7,859 8,377
190
683
1,086
1,349
991
1,467
1,239 1,303 l,301 1,199 1,1.74 1,1.81 1,076
999 1,023
991
1,045 1,045 1,165 1,038
997 919 974
1,184 1,195 1,285 1,470 1,467
1,524 1,583 1,755
756
1,749
2,457
3,010
3,794
8,606
3,060 3,412 3,400 3,281 3,385 3,661 3,799 3,789 3,815 3,794
4,048 4,219 4,315 5,016 5,325 5,339 6,009 6,507 7,114 7,393 8,290 8,606
8,836 9,442
10,131
Floating rate notes and commercial
paper held
Foreign HK$ currency
934
753
900
1,064
3,516
6,395
1,036 1,144 1,564 1,881 2,020 1,882 2,065 2,395 2,459 3,516
3,884 4,040 4,139 4,554 4,814 5,471 5,976 5,853 6,542 6,501 6,243 6,395
6,534 6,382 6,635
3,480
4,384
6,409
10,976
20,799
27,419
12,474 13,230 13,874 14,649 16,147 16,245 16,328 17,713 18,137 20,799
21,431 21,125 20,545 20,874 21,501 21,448 21,026 22,772 25,145 25,387 26,163 27,419
27,140 28,108 28,222
Total
4,414
5,137
7,309
12,040
24,314
33,814
13,509 14,375 15,438 16,530 18,167 18,127 18,394 20,109 20,596 24,314
25,314 25,165 24,684 25,428 26,315 26,919 27,002 28,625 31,687 31,888 32,406 33,814
33,674 34,491 34,857
Negotiable certificates of deposit held
Issued by deposit-taking companies in Hong Kong
Foreign HK$ currency Total
55
88
118
212
438
791
229 269 278 238 254 313 334 349 389 438
436 490 507 568 583 604 594 563 575 580 728 791
795 857 968
99
31
63
351
249
222 261 261 260 326 343 327 351 351 351
273 273 273 288 289 289 242 195 195 195 210 249
241 242 257
155
88
149
274
789
1,040
451 530 539 498 580 655 661 699 740 789
709 763 780 857 872 893 836 758 770 775 938
1,040
1,037 1,099 1,226
Assets
Treasury bills, securities, share-holdings and interests
in land and buildings
Foreign HK$ currency
7,739
9,885
11,282
13,309
23,360
23,857
13,367 13,508 13,619 13,462 13,433 13,590 13,618 13,907 14,360 23,360
23,419 23,375 23,490 23,453 23,495 23,710 23,828 23,855 23,967 23,571 23,750 23,857
23,725 23,783 24,132
947
1,314
1,574
2,243
4,995
8,973
2,521 2,911 3,858 4,060 4,221 4,195 4,611 4,530 4,342 4,995
5,120 6,162 5,214 6,264 6,907 7,085 7,209 6,986 9,690 8,727 9,057 8,973
9,171 11,677 11,857
Total
8,686
11,199
12,856
15,552
28,355
32,831
15,888 16,419 17,477 17,522 17,653 17,785 18,228 18,437 18,702 28,355
28,539 29,537 28,704 29,716 30,401 30,795 31,037 30,840 33,658 32,298 32,808 32,831
32,896 35,460 35,989
Hong Kong Monthly Digest of Statistics April 1987
Assets
Issued by banks outside Hong Kong
Foreign HK$ currency
12
2
75 74 74
5,749
3,612
6,350
8,090
8,711
9,173
8,582 8,837 9,004 8,887 8,685 8,733 8,452 8,961 8,893 8,711
8,494 8,391 8,081 8,269 7,949 8,110 7,878 8,298
10,450 9,156 9,036 9,173
9,161 9,159 9,766
Other assets
Foreign HK$ currency
14,503
20,780
23,074
16,470
16,194
14,137
14,059 13,947 14,419 13,775 14,741 14,056 15,808 14,607 14,420 16,194
14,078 14,288 15,554 16,565 14,721 14,569 14,208 15,544 17,433 15,299 14,686 14,137
18,231 17,762 19,164
12,683
21,162
31,395
25,206
23,918
30,849
26,100 25,893 24,850 25,169 26,020 24,690 26,468 26,191 24,837 23,918
26,346 28,673 27,825 29,287 29,939 30,327 30,815 31,546 35,996 30,499 29,419 30,849
32,929 33,891 34,559
Total
5,754
3,624
6,350
8,090
8,711
9,175
8,582 8,837 9,004 8,887 8,685 8,733 8,452 8,961 8,893 8,711
8,494 8,391 8,081 8,269 7,949 8,110 7,878 8,298
10,450 9,156 9,036 9,175
9,237 9,233 9,840
Total
27,187
41,942
54,469
41,676
40,113
44,986
40,159 39,840 39,269 38,944 40,761 38,746 42,276 40,798 39,258 40,113
40,424 42,961 43,379 45,851 44,660 44,896 45,024 47,090 53,429 45,799 44,105 44,986
51,160 51,653 53,724
Loans and advances to customers
Foreign HK$ currency Total
109,276 52,523 161,799
139,348 69,353 208,702
156,332 98,833 255,165
166,820 119,457 286,277
184,135 128,808 312,942
212,398 178,349 390, 747
171,593 174,316 176,632 178,220 178,621 179,631 181,157 179,631 183,205 184,135
186,285 187,934 189,571 225,082 193,450 196,846 198,355 200,729 202,099 206,619 208,948 212,398
121,846 293,439 122,908 297,224 124,303 300,935 125,984 304,204 125,420 304,042 125,517 305,149 126,019 307,176 129,489 309,120 133,333 316,538 128,808 312,942
132,315 318,600 137,905 325,839 142,388 331,959 145,830 370,912 149,752 343,202 153,662 350,508 163,357 361,713 163,474 364,203 176,177 378,276 172,017 378,636 171,509 380,457 178,349 390,747
218,488 185,792 404,280 223,326 186,175 409,501 228,308 200,928 429,237
Total assets
Foreign HK$ currency
180,414 233,932
240,094 356,494
275,965 512,661
291,611 611,957
341,812 759,209
401,331 1,296,194
298,887 303,074 314,837 312,482 315,041 319,018 326,581 326,897 333,445 341,812
347,049 344,890 352,697 436,226 369,940 363,255 368,147 380,778 382,681 390,096 392,600 401,331
419,255 414,848 430,580
665,480 655,273 671,524 670,246 679,774 702,581 723,007 705,421 750,091 759,209
777,440 789,313 830,407 881,088 908,806 908,510 975,091
1,021,817 1,102,478 1,105,129 1,202,350 1,296,194
1,372,697 1,392,520 1,494,630
Total
414,346
596,588
788,625
903,568
1,101,021
1,697,524
964,367 958,348 986,361 982,728 994,815
1,021,599 1,049,588 1,032,318 1,083,536 1,101,021
1,124,489 1,134,203 1,183,105 1,317,315 1,278,745 1,271,765 1,343,238 1,402,595 1,485,159 1,495,225 1,594,950 1,697,524
1,791,952 1,807,368 1,925,211
BANKING
$million
Bank acceptances and bank bills of exchange held
Foreign HK$ currency Total
1,064
917
941
1,052
867
1,020
857 788 781 756 834 823 818 748 783 867
889 823 783 835 880 940 979
l,004 l,053
952 989
1,020
1,250 935 949
Number of reporting
licensed banks
121
128
134
140
143
148
140 140 140 141 141 141 141 141 143 143
143 147 147 149 150 149 149 149 149 148 148 148
149 148 149
8,927
8,640
9,581
9,109
9,145
13,016
8,044 8,369 9,276 8,480 8,815 8,887 9,382 8,940 8,813 9,145
9,387 8,510 9,520
10,238 10,165 10,630 11,491 12,387 12,778 13,343 12,361 13,016
13,918 12,787 15,450
9,991
9,557
10,528
10,160
10,012
14,036
8,901. 9,157
10,057 9,236 9,650 9,710
10,200 9,688 9,596
10,012
10,276 9,334
10,303 11,073 11,045 11,570 12,470 13,391 13,831 14,295 13,350 14,036
15,168 13,723 16,399
Number of branches of banks
I 181
1346
I 397
1407
1394
I 386
1405 1408 1416 1412 I 411 1409 1406 1402 1395 I 394
1394 1391 1390 I 389 I 393 I 392 1392 1 394 1394 I 391 I 393 1386
I 389 1392 I 388
59

BANKING
As at end of year/month
1981
1982
1983
1984
1985
1986
1985: Mar. Apr. May June July Aug: Sept. Oct. Nov. Dec.
1986: Jan. Feb. Mar. Apr. May June July Aug. Sept. Oct. Nov. Dec.
1987: Jan. Feb. Mar.
As at end of year/month
1981
1982
1983
1984
1985
1986
1985: Mar. Apr. May June July Aug. Sept. Oct. Nov. Dec.
1986: Jan. Feb. Mar. Apr. May June July Aug. Sept. Oct. Nov. Dec.
1987: Jan. Feb. Mar.
7.4 BALANCE SHEETS: DEPOSIT-TAKING COMPANIES
Amount due to banks and deposittaking companies in Hong Kong
HK$
14,842
24,359
27,864
34,654
39,419
47,793
35,432 35,877 36,568 36,565 37,441 38,159 39,196 39,606 40,641 39,419
39,094 38,398 40,103 44,640 44,213 42,013 40,852 42,291 45,626 43,229 45,121 47,793
48,954 48,224 48,622
Foreign currency
31,219
48,419
67,061
72,538
84,952
102,325
75,602 75,257 76,211 77,878 75,945 76,531 83,568 76,920 82,473 84,952
81,714 80,219 83,681 82,658 87,068 80,201 84,588 84,448 93,968
104,152 106,047 102,325
103,360 103,427 106,165
Total
46,062
72,778
94,924
107,191
124,371
150,118
111,034 111,134 112,779 114,442 113,385 114,690 122,764 116,526 123,114 124,371
120,808 118,617 123,785 127,298 131,281 122,213 125,440 126,739 139,594 147,381 151,168 150,118
152,314 151,650 154,787
Liabilities
HK$
14,208
14,8'16
17,031
16,279
16,100.
16,621
15,864 16,041 16,435 16,624 15,900 16,115 16,152 16,011 15,994 16,100
15,704 15,638 15,936 15,635 15,348 15,549 15,363 15,670 15,547 15,617 15,586 16,621
15,988 16,034 15,939
Other liabilities
Foreign currencyt
9,840
15,213
23,075
37,106
57,215
65,077
42,496 43,893 46,639 48,052 50,177 54,456 56,311 58,997 58,820 57,215
58,774 58,310 59,052 59,560 60,860 63,841 64,842 65,667 65,954 65,749 64,901 65,077
65,54o 69,458 70,736
Totalt
24,048
30,029
40,106
53,385
73,315
81,697
58,359 59,933 63,074 64,677 66,076 70,571 72,462 75,008 74,813 73,315
74,478 73,947 74,987 75,195 76,208 79,389 80,205 81,337 81,501 81,366 80,487 81,697
81,528 85;492 86,676
HK$
79,215
68,879
76,389
88,826
96,440
100,437
90,288 91,315 93,117 93,188 93,590 94,406 95,896 96,316 97,323 96,440
98,098 97,325 98,331
100,462 98,345 96,307 94,633 96,248 99,528 96,294 98,071
100,437
99,427 97,984 98,342
Amount due to banks abroad
HK$
700
1,056
1,899
1,586
1,392
1,675
1,840 1,583 1,960 1,470 1,404 1,437 1,425 1,389 1,659 1,392
2,135 2,090 2,093 2,104 2,017 1,841 1,927 1,882 2,342 2,339 2,413 1,675
1,553 1,492 1,568
Foreign currency
87,030
118,597
139,809
141,869
185,957
152,992
156,061 151,171 155,248 156,891 164,649 160,145 168,633 162,339 168,873 185,957
177,040 175,299 183,266 192,169 185,881 173,909 171,986 174,373 175,739 161,789 155,386 152,992
158,439 158,831 163,285
Total liabilities
Foreign currency Total
139,221
197,640
250,447
277,263
358,161
352,330
218,436
266,519
326,837
366,089
454,602
452,767
298,770 294,649 302,224 307,210 317,675 319,089 336,346 325,755 338,064 358,161
348,514 345,672 356,754 363,725 362,636 346,912 350,036 353,405 364,891 361,175 356,571 352,330
358,049 361,155 369,071
389,058 385,965 395,341 400,397 411,265 413,495 432;242 422,070 435,387 454,602
446,612 442,998 455,085 464,187 460,981 443,219 444,669 449,653 464,420 457,469 454,642 452,767
457,476 459,139 467,414
Total
87,730
119,653
141,709
143,454
187,349
154,667
157,901 152,754 157,208 158,361 166,053 161,582 170,058 163,728 170,531 187,349
179,175 177,389 185,359 194,273 187,899 175,750 173,913 176,255 178,081 164,128 157,799 154,667
159,992 160,323 164,853
Liabilities
Hong Kong notes and
coins
12
9
9
7 7 8 6 7 6 6 6 5 7
7 8 8 9 7 6 7
II 9 9
12 9
6 10 6
HK$
48,489
27,508
28,728
35,185
38,011
31,766
36,054 36,693 36,901 37,236 37,546 37,307 37,809 37,971 37,631 38,011
39,461 39,442 38,364 36,105 34,878 35,007 34,494 34,257 33,886 32,840 32,406 31,766
30,353 29,654 29,656
Deposits from customers
Foreign currencyt
10,678
14,998
19,442
23,677
25,576
27,533
21,498 21,222 21,029 21,092 23,504 24,389 24,340 23,994 24,315 25,576
26,978 27,960 26,844 25,484 24,978 25,101 24,753 25,309 25,612 25,892 25,878 27,533
26,305 25,778 25,254
Totalt
59,167
42,506
48,170
58,861
63,587
59,298
57,552 57,915 57,930 58,327 61,049 61,697 62,149 61,965 61,947 63,587
66,439 67,401 65,208 61,589 59,856 60,108 59,248 59,566 59,498 58,731 58,284 59,298
56,658 55,432 54,910
Amount due from banks and deposit-taking
companies in Hong Kong
HK$
39,609
26,493
30,296
39,626
45,792
44,929
41,309 42,051 41,850 42,893 44,321 45,510 46,014 45,412 46,648 45,792
46,787 46,393 47,523 44,382 47,118 44,370 42,399 45,362 45,903 43,410 44,106 44,929
43,069 41,561 39,974
Foreign currency
17,986
23,605
29,459
31,721
36,319
40,648
31,726 29,570 30,424 32,267 31,361 33,236 43,268 31,991 33,004 36,319
37,923 33,469 38,045 39,652 41,820 36,331 36,954 36,986 41,687 42,381 40,634 40,648
38,048 37,295 43,645
Total
57,596
50,098
59,755
71,347
82,110
85,577
73,035 71,621 72,273 75,160 75,682 '78,746 89,282 77,403 79,652 82,110
84,710 79,862 85,569 84,034 88,938 80,702 79;353 82,348 87,590 85,791 84,740 85,577
81,117 78,856 83,619
$million
Negotiable certificates of deposit outstanding
HK$
975
1,141
868
1,124
. 1,519
2,582
1,099 1,122 1,253 1,293 1,300 1,388 1,315 1,340 1,398 1,519
1,704 1,758 1,836 1,978 1,889 1,898 1,997 2,148 2,127 2,269 2,546 2,582
2,579 2,580 2,557
Assets
HK$
944
1,047
1,247
1,035
894
1,013
853 1,011 1,224 1,067
973 1,020 1,021
825 906 894
971 893 693
1,277 750
1,018 819 771
1,139 981 847
1,013
678 954
1,155
Foreign currency
454
413
1,060
2,074
4,461
4,404
3,112 3,107 3,097 3,297 3,401 3,567 3,494 3,504 3,583 4,461
4,007 3,885 3,910 3,855 3,848 3,861 3,867 3,608 3,618 3,594 4,358 4,404
4,405 3,662 3,632
Total
1,430
1,554
1,928
3,197
5,979
6,985
4,211 4,229 4,350 4,590 4,700 4,956 4,809 4,845 4,982 5,979
5,712 5,643 5,746 5,833 5,737 5,758 5,863 5,755 5,745 5,863 6,905 6,985
6,984 6,242 6,189
Amount due from banks abroad
Foreign currency
38,000
50,636
76,992
84,500
117,165
115,017
91,359 89,776 92,014 94,382 99,724
103,284 102,735 103,281 105,263 117,165
104,338 105,843 106,710 113,637 107,936 107,178 104,336 109,197 108,013 107,429 106,873 115,017
106,488 110,052 111,738
Total
38,944
51,683
78,240
85,535
118,059
116,030
92,212 90,787 93,237 95,449
100,697 104,304 103,755 104,106 106,170 118,059
105,309 106,736 107,402 114,914 108,686 108,196 105,155 109,968 109,152 108,410 107,719 116,030
107,166 111,006 112,892
tFigures for the period July 1982 to February 1987 have been revised to rectify mis-classification of bonds and notes issued as deposits by some deposit-taking companies.
60 Hong Kong Monthly Digest of Statistics April 1987
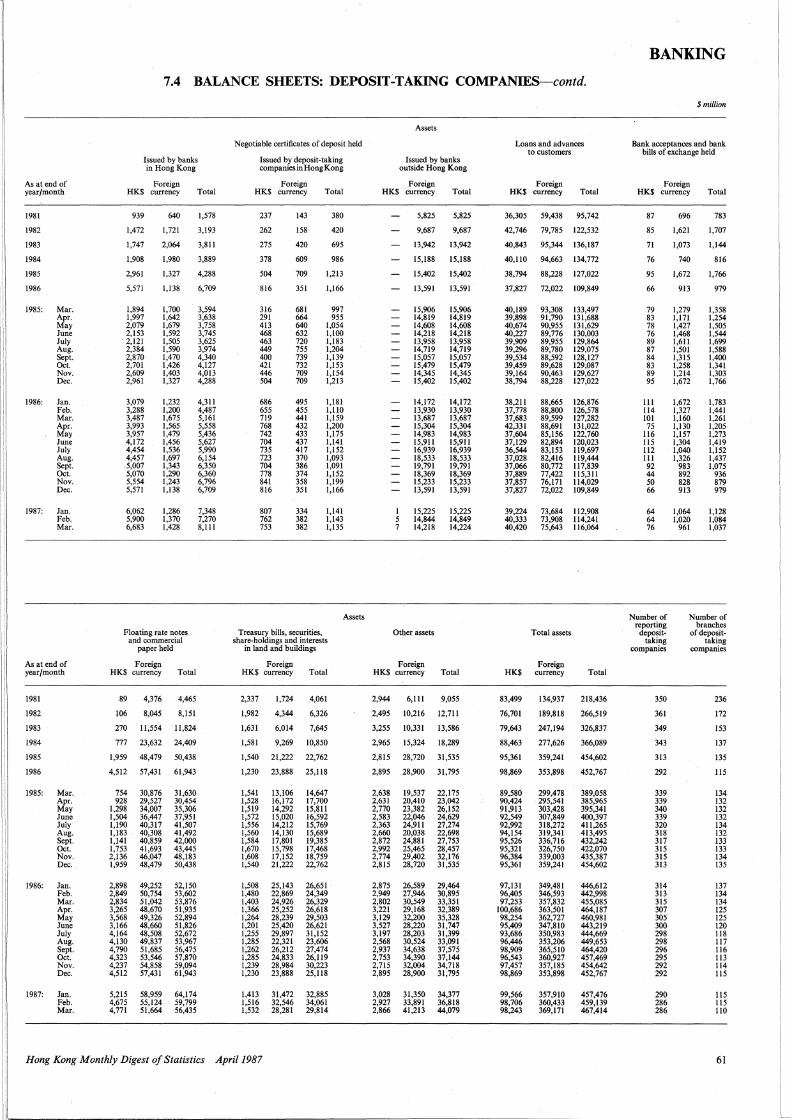
! I
i
II ,I
ii
!\
'
7.4 BALANCE SHEETS: DEPOSIT-TAKING COMPANIES-contd.
As at end of year/month
1981
1982
1983
1984
1985
1986
1985:
1986:
1987:
Mar. Apr. May June July Aug. Sept. Oct. Nov. Dec.
Jan. Feb. Mar. Apr. May June July Aug. Sept. Oct. Nov. Dec.
Jan. Feb. Mar.
As at end of year/month
1981
1982
1983
1984
1985
1986
1985:
1986:
1987:
Mar. Apr. May June July Aug. Sept. Oct. Nov. Dec.
Jan. Feb. Mar. Apr. May June July Aug. Sept. Oct. Nov. Dec.
Jan. Feb. Mar.
Issued by banks in Hong Kong
Foreign HK$ currency Total
939
1,472
1,747
1,908
2,961
5,571
1,894 1,997 2,079 2,153 2,121 2,384 2,870 2,701 2,609 2,961
3,079 3,288 3,487 3,993 3,957 4,172 4,454 4,457
.5,007 5,070 5,554 5,571
6,062 5,900 6,683
640
1,721
2,064
1,980
1,327
1,138
1,700 1,642 1,679 1,592 1,505 1,590 1,470 1,426 1,403 1,327
1,232 1,200 1,675 1,565 1,479 1,456 1,536 1,697 1,343 1,290 1,243 1,138
1,286 1,370 1,428
Floating rate notes and commercial
paper held
Foreign HK$ currency Total
89 4,376 4,465
106 8,045 8,151
270 11,554 11,824
777 23,632 24,409
1,959 48,479 50,438
4,512 57,431 61,943
754 928
1,298 1,504 1,190 1,183 1,141 1,753 2,136 1,959
2,898 2,849 2,834 3,265 3,568 3,166 4,164 4,130 4,790 4,323 4,237 4,512
5,215 4,675 4,771
30,876 29,527 34,007 36,447 40,317 40,308 40,859 41,693 46,047 48,479
49,252 50,754 51,042 48,670 49,326 48,660 48,508 49,837 51,685 53,546 54,858 57,431
58,959 55,124 51,664
31,630 30,454 35,306 37,951 41,507 41,492 42,000 43,445 48,183 50,438
52,150 53,602 53,876 51,935 52,894 51,826 52,672 53,967 56,475 57,870 59,094 61,943
64,174 59,799 56,435
1,578
3,193
3,811
3,889
4,288
6,709
3,594 3,638 3,758 3,745 3,625 3,974 4,340 4,127 4,013 4,288
4,311 4,487 5,161 5,558 5,436 5,627 5,990 6,154 6,350 6,360 6,796 6,709
7,348 7,270 8,111
Negotiable certificates of deposit held
Issued by deposit-taking companies in Hong Kong
Foreign HK$ currency Total
237
262
275
378
504
816
316 291 413 468 463 449 400 421 446 504
686 655 719 768 742 704 735 723 704 778 841 816
807 762 753
143
158
420
609
709
351
681 664 640 632 720 755 739 732 709 709
495 455 441 432 433 437 417 370 386 374 358 351
334 382 382
380
420
695
986
1,213
1,166
997 955
1,054 1,100 1,183 1,204 1,139 1,153 1,154 1,213
1,181 1,110 1,159 1,200 1,175 1,141 1,152 1,093 1,091 1,152 1,199 1,166
1,141 1,143 1,135
Assets
Treasury bills, securities, share-holdings and interests
in land and buildings
Foreign HK$ currency Total
2,337 1,724 4,061
1,982 4,344 6,326
1,631 6,014 7,645
1,581 9,269 10,850
1,540 21,222 22,762
1,230 23,888 25,118
1,541 1,528 1,519 1,572 1,556 1,560 1,584 1,670 1,608 1,540
1,508 1,480 1,403 1,366 1,264 1,201 1,255 1,285 1,262 1,285 1,239 1,230
1,413 1,516 1,532
13,106 16,172 14,292 15,020 14,212 14,130 17,801 15,798 17,152 21,222
25,143 22,869 24,926 25,252 28,239 25,420 29,897 22,321 26,212 24,833 28,984 23,888
31,472 32,546 28,281
14,647 17,700 15,811 16,592 15,769 15,689 19,385 17,468 18,759 22,762
26,651 24,349 26,329 26,618 29,503 26,621 31,152 23,606 27,474 26,119 30,223 25,118
32,885 34,061 29,814
Hong Kong Monthly Digest of Statistics April 1987
Assets
Issued by banks outside Hong Kong
Foreign HK$ currency Total
5,825 5,825
9,687 9,687
13,942 13,942
15,188 15,188
15,402 15,402
13,591 13,591
15,906 14,819 14,608 14,218 13,958 14,719 15,057 15,479 14,345 15,402
14,172 13,930 13,687 15,304 14,983 15,911 16,939 18,533 19,791 18,369 15,233 13,591
15,225 14,844 14,218
Other assets
15,906 14,819 14,608 14,218 13,958 14,719 15,057 15,479 14,345 15,402
14,172 13,930 13,687 15,304 14,983 15,911 16,939 18,533 19,791 18,369 15,233 13,591
15,225 14,849 14,224
Foreign HK$ currency Total
2,944 6,111 9,055
2,495 10,216 12,711
3,255 10,331 13,586
2,965 15,324 18,289
2,815 28,720 31,535
2,895 28,900 31,795
2,638 2,631 2,770 2,583 2,363 2,660 2,872 2,992 2,774 2,815
2,875 2,949 2,802 3,221 3,129 3,527 3,197 2,568 2,937 2,753 2,715 2,895
3,028 2,927 2,866
19,537 20,410 23,382 22,046 24,911 20,038 24,881 25,465 29,402 28,720
26,589 27,946 30,549 29,168 32,200 28,220 28,203 30,524 34,638 34,390 32,004 28,900
31,350 33,891 41,213
22,175 23,042 26,152 24,629 27,274 22,698 27,753 28,457 32,176 31,535
29,464 30,895 33,351 32,389 35,328 31,747 31,399 33,091 37,575 37,144 34,718 31,795
34,377 36,818 44,079
Loans and advances to customers
Foreign HK$ currency Total
36,305 59,438 95,742
42,746 79,785 122,532
40,843 95,344 136,187
40, 110 94,663 134, 772
38,794 88,228 127,022
37,827 72,022 109,849
40,189 39,898 40,674 40,227 39,909 39,296 39,534 39,459 39,164 38,794
38,211 37,778 37,683 42,331 37,604 37,129 36,544 37,028 37,066 37,889 37,857 37,827
39,224 40,333 40,420
93,308 91,790 90,955 89,776 89,955 89,780 88,592 89,628 90,463 88.228
88,665 88,800 89,599 88,691 85,156 82,894 83,153 82,416 80,772 77,422 76,171 72,022
73,684 73,908 75,643
Total assets
Foreign HK$ currency
83,499
76,701
79,643
88,463
95,361
98,869
89,580 90,424 91,913 92,549 92,992 94,154 95,526 95,321 96,384 95,361
97,131 96,405 97,253
100,686 98,254 95,409 93,686 96,446 98,909 96,543 97,457 98,869
99,566 98,706 98,243
134,937
189,818
247,194
277,626
359,241
353,898
299,478 . 295,541
303,428 307,849 318,272 319,341 336,716 326,750 339,003 359,241
349,481 346,593 357,832 363,501 362,727 347,810 350,983 353,206 365,510 360,927 357,185 353,898
357,910 360,433 369,171
133,497 131,688 131,629 130,003 129,864 129,075 128,127 129,087 129,627 127.022
126,876 126,578 127,282 131,022 122,760 120,023 119,697 119,444 117,839 115,311 114,029 109,849
112,908 114,241 116,064
Total
218,436
266,519
326,837
366,089
454,602
452,767
389,058 385,965 395,341 400,397 411,265 413,495 432,242 422,070 435,387 454,602
446,612 442,998 455,085 464,187 460,981 443,219 444,669 449,653 464,420 457,469 454,642 452,767
457,476 459,139 467,414
I! i~-------------
BANKING
$million
Bank acceptances and bank bills of exchange held
Foreign HK$ currency Total
87
85
71
76
95
66
79 83 78 76 89 87 84 83 89 95
Ill 114 IOI 75
116 115 112 Ill 92 44 50 66
64 64 76
Number of reporting
deposittaking
companies
350
361
349
343
313
292
339 339 340 339 320 318 317 315 315 313
314 313 315 307 305 300 298 298 296 295 292 292
290 286 286
696
1,621
1,073
740
1,672
913
1,279 1,171 1,427 1,468 1,611 1,501 1,315 1,258 1,214 1,672
1,672 1,327 1,160 1,130 1,157 1,304 1,040 1,326
983 892 828 913
1,064 1,020
961
783
1,707
1,144
816
1,766
979
1,358 1,254 1,505 1,544 1,699 1,588 1,400 1,341 1,303 1,766
1,783 1,441 1,261 1,205 1,273 1,419 1,152 1,437 1,075
936 879 979
1,128 1,084 1,037
Number of branches
of deposittaking
companies
236
172
153
137
135
115
134 132 132 132 134 132 133 133 134 135
137 134 134 125 125 120 118 117 116 113 114 115
115 ll5 110
61
I I
L_

BANKING
As at end of year/month
1981
1982
1983
1984
1985
1986
1985: Mar. Apr. May June July Aug. Sept. Oct. Nov. Dec.
1986: Jan. Feb. Mar. Apr. May June July Aug. Sept. Oct. Nov. Dec.
1987: Jan. Feb. Mar.
As at end of year/month
1981
1982
1983
1984
1985
1986
1985:
1986:
1987:
Mar. Apr. May June July Aug. Sept. Oct. Nov. Dec.
Jan. Feb. Mar. Apr. May June July Aug. Sept. Oct. Nov. Dec.
Jan. Feb. Mar.
7.5 BALANCE SHEETS: ALL DEPOSIT-TAKING INSTITUTIONS
Amount due to banks and deposittaking companies in Hong Kong
HK$
76,366
83,256
96,982
114,276
129,188
149,319
118,734 118,738 126,729 123,745 123,940 127,907 131,778 131,329 135,848 129,188
131,537 127,905 133,712 174,865 146,679 131,965 133,002 141,937 140,267 142,983 143,945 149,319
154,404 147,254 152,617
Foreign currency
57,944
87,234
129,679
154,397
179,179
277,409
160,464 155,894 160,564 168,004 162,008 166,233 174,956 162,846 170,178 179,179
177,850 174,002 194,896 195,566 206,213 198,413 210,826 222,878 245,429 255,368 269,933 277,409
273,715 266,708 288,626
Total
134,310
170,490
226,660
268,673
308,367
426,728
279,198 274,632 287,293 291,749 285,948 294,140 306,734 294,176 306,025 308,367
309,387 301,907 328,608 370,431 352,891 330,377 343,829 364,815 385,696 398,351 413,877 426,728
428,119 413,962 441,243
HK$
6,789
7,185
10,769
10,172
15,082
21,648
12,009 12,476 12,362 12,164 12,254 12,559 12,179 12,376 12,786 15,082
16,216 16,512 16,856 17,803 17,465 17,692 18,624 19,008 20,522 19,112 20,683 21,648
20,974 18,602 19,593
Amount due to banks abroad
Foreign currency
251,164
345,322
454,815
506,284
636,430
964,060
554,993 543,086 557,426 549,370 565,942 574,403 597,594 572,524 616,043 636,430
633,200 633,014 666,152 711,504 724,870 712,410 758,940 788,415 844,045 828,429 896,651 964,060
1,052,458 l,066,839 1,139,847
Total
257,953
352,507
465,584
516,455
651,512
985,709
567,003 555,562 569,788 561,534 578,196 586,962 609,774 584,900 628,829 651,512
649,416 649,526 683,008 729,307 742,336 730,102 777,564 807,423 864,566 847,541 917,334 985,709
1,073,431 1,085,442 1,159,440
Liabilities
HK$
134,359
135,384
153,401
193,190
212,132
245,103
198,097 200,424 203,057 204,599 205,480 205,693 205,857 208,895 209,703 212,132
218,548 218,574 216,294 263,466 218,168 220,409 222,886 225,035 229,292 234,410 237,184 245,103
248,477 254,208 260,361
Liabilities
Other liabilities
Foreign HK$ currencyt
50,466
66,378
74,587
61,125
70,307
66,668
60,745 60,969 62,072 61,711 61,354 62,225 65,304 63,844 66,088 70,307
68,803 70,245 72,197 70,022 69,343 71,567 68,755 69,826 71,414 68,595 67,828 66,668
66,412 66,780 69,885
20,195
29,484
47,293
53,640
74,406
90,753
60,287 62,044 63,771 64,889 67,933 71,437 75,156 78,518 77,785 74,406
77,450 79,027 79,359 81,597 85,036 87,079 88,897 88,987 89,779 86,174 88,398 90,753
91,744 97,220
102,263
Totalt
70,661
95,862
121,880
114,765
144,713
157,420
121,032 123,013 125,842 126,600 129,287 133,662 140,460 142,362 143,873 144,713
146,253 149,273 151,556 151,619 154,379 158,646 157,652 158,813 161,194 154,769 156,226 157,420
158,156 164,000 172,149
HK$
Total liabilities
Foreign currency Total
271,522 361,260 632,782
297,521 565,586 863,107
341,155 774,307 1,115,462
384,723 884,935 1,269,658
437,656 1,117,967 1,555,623
503,172 1,647,119 2,150,291
395,834 399,369 411,216 409,477 410,804 417,130 424,768 426,202 434,339 437,656
446,425 445,130 451,292 540,113 465,835 456,307 459,211 472,047 479,109 483,544 489,136 503,172
511,757 509,121 526,268
957,591 944,944 970,485 973,649 995,276
1,017,964 1,057,062 l,028,187 1,084,584 1,117,967
1,124,676 1,132,070 1,186,898 l,241,389 1,273,891 1,258,677 1,328,695 1,380,201 1,470,470 1,469,151 1,560,456 1,647,119
1,737,671 1,757,385 1,866,357
1,353,425 1,344,312 1,381,701 1,383,125 1,406,079 1,435,094 1,481,831 1,454,389 1,518,922 1,555,623
l,571,101 l,577,200 1,638,190 1,781,502 1,739,726 l,714,984 1,787,906 1,852,247 1,949,579 1,952,695 2,049,592 2,150,291
2,249,428 2,266,506 2,392,625
Hong Kong notes and
coins
2,480
2,486
2,629
2,347
2,601
3,117
2,385 2,564 2,648 2,757 2,828 2,465 2,462 2,597 2,347 2,601
4,298 2,966 2,825 2,818 2,539 2,832 2,664 2,767 2,810 2,820 2,737 3,117
3,927 2,916 3,002
Deposits from customers
Foreign currencyt Totalt
29,266
97,381
134,642
161,776
218,680
305,549
163,625
232,765
288,044
354,965
430,811
550,651
171,791 173,957 178,775 181,727 189,920 196,217 200,231 205,599 211,798 218,680
369,889 374,382 381,832 386,326 395,400 401,910 406,087 414,493 421,501 430,811
227,361 237,546 237,119 243,879 249,262 252,485 261,737 271,340 282,744 290,839 295,985 305,549
445,909 456,120 453,413 507,346 467,429 472,894 484,623 496,375 512,036 525,248 533,169 550,651
310,286 317,693 326,438
558,763 571,901 586,798
Amount due from banks and deposit-taking
companies in Hong Kong
Foreign HK$ currency
76,910
83,266
96,735
114,503
129,099
149,158
118,538 118,946 126,947 124,033 124,496 127,848 131,514 131,823 135,477 129,099
132,105 128,333 134,098 175,046 146,364 132,176 132,039 142,253 140,425 141,910 143,895 149,158
154,093 147,347 153,365
55,160
83,304
128,155
152,168
178,445
277,305
160,097 155,502 158,999 165,898 159,845 165,355 176,061 161,652 169,981 178,445
177,196 172,443 194,854 193,765 204,199 197,595 210,889 224,772 245,970 255,493 271,317 277,305
272,295 265,332 287,334
Total
132,070
166,571
224,890
266,671
307,545
426,463
278,635 274,448 285,945 289,931 284,341 293,203 307,575 293,475 305,457 307,545
309,301 300,776 328,952 368,810 350,564 329,772 342,928 367,025 386,395 397,404 415,212 426,463
426,388 412,679 440,699
$million
Negotiable certificates of deposit outstanding
HK$
3,543
5,318
5,417
5,961
10,947
20,435
6,249 6,762 6,998 7,258 7,777 8,745 9,651 9,758 9,914
10,947
11,321 11,894 12,234 13,957 14,181 14,674 15,944 16,242 17,614 18,444 19,497 20,435
21,491 22,278 23,812
Assets
Foreign currency
2,691
6,165
7,877
8,838
9,272
9,349
10,055 9,962 9,949 9,658 9,473 9,675 9,124 8,700 8,781 9,272
8,816 8,482 9,372 8,843 8,510 8,289 8,295 8,580 8,472 8,341 9,490 9,349
9,468 8,924 9,183
Total
6,235
11,483
13,294
14,800
20,219
29,783
16,304 16,724 16,946 16,917 17,249 18,420 18,775 18,458 18,695 20,219
20,137 20,376 21,606 22,799 22,691 22,963 24,239 24,822 26,086 26,786 28,987 29,783
30,958 31,202 32,995
Amount due from banks abroad
Foreign HK$ currency Total
7,443
9,044
14,128
14,843
25,492
29,268
17,172 18,552 18,931 19,244 20,904 22,466 23,122 24,294 24,774 25,492
26,418 26,759 26,806 28,996 26,642 27,083 27,691 29,033 28,910 30,136 28,769 29,268
28,578 26,130 26,742
150,160
238,282
335,699
399,519
536,530
905,059
447,441 435,406 448,237 442,310 460,207 483,955 500,285 481,867 518,648 536,530
538,093 544,098 565,296 618,526 626,863 621,953 662,501 696,385 734,580 738,837 819,316 905,059
965,060 990,913
1,059,884
157,603
247,327
349,827
414;362
562,021
934,327
464,613 453,958 467,168 461,553 481,111 506,421 523,407 506,160 543,422 562,021
564,510 570,857 592,102 647,522 653,504 649,035 690,192 725,418 763,491 768,972 848,085 934,327
993,638 1,017,043 1,086,626
tFigures for the period July 1982 to February 1987 have been revised to rectify mis-classification of bonds and notes issued as deposits by some deposit~taking companies.
62 Hong Kong Monthly Digest of Statistics April 1987

BANKING
7.5 BALANCE SHEETS: ALL DEPOSIT-TAKING INSTITUTIONS-contd.
As at end of year/month
1981
1982
1983
1984
1985
1986
1985:
1986:
1987:
Mar. Apr. May June July Aug. Sept. Oct. Nov. Dec.
Jan. Feb. Mar. Apr. May June July Aug. Sept. Oct. Nov. Dec.
Jan. Feb. Mar.
As at end of year/month
198!
1982
1983
1984
1985
1986
1985:
1986:
1987:
Mar. Apr. May June July Aug. Sept. Oct. Nov. Dec.
Jan. Feb. Mar. Apr. May June July Aug. Sept. Oct. Nov. Dec.
Jan. Feb. Mar.
Issued by banks in Hong Kong
Foreign HK$ currency Total
1,504
2,539
3,119
3,569
5,765
12,709
3,715 4,106 4,178 4,235 4,332 4,864 5,592 5,490 5,401 5,765
6,082 6,462 6,636 7,971 8,285 8,591 9,490 9,780
10,925 11,178 12,374 12,709
13,373 13,759 15,059
830
2,404
3,150
2,334
4,942
6,268
3,330 6,899
2,317 8,082
2,606 15,315
2,939 2,945 2,980 2,791 2,678 2,771 2,546 2,425 2,426 2,317
2,277 2,245 2,840 2,603 2,476 2,375 2,510 2,881 2,539 2,575 2,713 2,606
2,811 2,953 3,182
6,654 7,050 7,158 7,026 7,010 7,635 8,139 7,916 7,827 8,082
8,359 8,707 9,476
10,574 10,760 10,966 11,999 12,661 13,464 13,753 15,087 15,315
16,184 16,713 18,242
Floating rate notes and commercial
paper held
Foreign HK$ currency Total
1,023
859
1,169
1,841
5,475
10,907
1,789 2,072 2,862 3,385 3,210 3,065 3,206 4,148 4,595 5,475
6,781 6,888 6,973 7,819 8,382 8,637
10,140 9,983
11,332 10,825 10,479 10,907
11,749 11,057 11,407
7,856
12,429
17,963
34,609
69,277
84,850
43,350 42,757 47,881 51,096 56,463 56,553 57,187 59,406 64,184 69,277
70,683 71,878 71,587 69,544 70,827 70,107 69,534 72,609 76,830 78,933 81,021 84,850
86,099 83,232 79,886
8,879
13,288
19,132
36,450
74,752
95,757
45,139 44,829 50,743 54,481 59,673 59,618 60,393 63,554 68,779 74,752
77,464 78,767 78,560 77,362 79,209 78,745 79,674 82,592 88,162 89,758 91,500 95,757
97,848 94,290 91,293
Negotiable certificates of deposit held
Issued by deposit-taking companies in Hong Kong
Foreign HK.$ currency
293
350
393
589
941
1,607
544 559 691 706 718 762 735 769 835 941
1,122 1,145 1,225 1,336 1,325 1,308 1,328 1,286 1,280 1,357 1,569 1,607
l,602 1,619 1,721
242
158
451
671
1,061
600
903 925 901 892
l,046 1,098 1,065 1,083 1,059 1,061
768 728 714 720 721 725 659 566 581 569 568 600
575 623 639
Total
535
508
844
l,260
2,002
2,207
l,447 1,484 1,592 1,599 1,764 1,860 1,800 1,852 1,894 2,002
1,889 1,873 1,939 2,057 2;046 2,033 1,988 1,852 1,861 1,927 2,137 2,207
2,178 2,242 2,360
Treasury bills, securities, share-holdings and interests
in land and buildings
Foreign HK$ currency
10,076
11,867
12,913
14,890
24,900
25,088
14,908 15,036 15,138 15,034 14,989 15,150 15,202 15,577 15,967 24,900
24,926 24,855 24,894 24,818 24,758 24,911 25,083 25,139 25,229 24,856 24,989 25,088
25,137 25,299 25,664
2,670
5,658
7,588
ll,512
26,217
32,861
15,627 19,083 18,150 19,079 18,433 18,325 22,412 20,329 21,494 26,217
30,263 29,031 30,140 31,516 35,146 32,506 37,106 29,307 35,903 33,561 38,041 32,861
40,644 44,222 40,138
Total
12,747
17,525
20,501
26,402
51,117
57,949
30,535 34,119 33,288 34,114 33,422 33,474 37,613 35,905 37,461 51,117
55,189 53,886 55,033 56,334 59,905 57,416 62,189 54,446 61,132 58,417 63,030 57,949
65,781 69,521 65,802
Hong Kong Monthly Digest of Statistics April 1987
Assets
Issued by banks outside Hong Kong
Foreign HK$ currency Total
11,573 11,578
12 13,299 13,311
2
20,291 20,291
23,278 23,278
24,113 24,113
22,764 22,766
24,488 23,656 23,612 23,105 22,643 23,452 23,509 24,439 23,239 24,113
22,666 22,321 21,768 23,573 22,932 24,021 24,817 26,832 30,241 27,524 24,269 22,764
24,488 23,656 23,612 23,105 22,643 23,452 23,509 24,439 23,239 24,113
22,666 22,321 21,768 23,573 22,932 24,021 24,817 26,832 30,241 27,524 24,269 22,766
76 24,386 24,462 24,082 24,064
79 24,003 81 23,983
Assets
Other assets
Foreign HK$ currency
17,447
23,275
26,328
19,435
19,010
17,033
16,697 16,579 17,189 16,357 17,104 16,716 18,680 17,599 17,194 19,010
16,953 17,237 18,356 19,785 17,849 18,096 17,405 18,112 20,370 18,053 17,400 17,033
21,259 20,689 22,030
18,794
31,378
41,726
40,530
52,638
59,748
45,637 46,303 48,232 47,215 50,931 44,728 51,349 51,655 54,240 52,638
52,936 56,619 58,374 58,455 62,139 58,548 59,018 62,070 70,634 64,890 61,423 59,748
64,279 67,782 75,772
Loans and advances to customers
Foreign HK$ currency Total
145,581 111,960 257,541
182,095 149,138 331,233
197,175 194,177 391,352
206,930 214,119 421,049
222,929 217,035 439,964
250,226 250,371 500,596
211,782 215,154 426,935 214,214 214,698 428,912 217,306 215,258 432,564 218,447 215,760 434,208 218,530 215,375 433,905 218,927 215,297 434,224 220,692 214,611 435,303 219,090 219,117 438,207 222,369 223,796 446,165 222,929 217,035 439,964
224,496 220,980 225,712 226,705 227,254 231,987 267,413 234,521 231,054 234,908 233,975 236,556 234,900 246,510 237,757 245,890 239,165 256,949 244,508 249,439 246,805 247,680 250,226 250,371
445,476 452,417 459,241 501,934 465,962 470,531 481,410 483,647 496,114 493,947 494,485 500,596
257,712 259,476 517,188 263,659 260,084 523, 743 268, 729 276,572 545,300
Total assets
Foreign Total HK$ currency
$million
Bank acceptances and bank bills of exchange held
Foreign HK$ currency Total
l,150 9,623 10,774
1,003 10,261 11,264
1,018 10,654 11,672
1,128 9,849 10,976
961 10,817 11,778
l,086 13,929 15,015
936 872 859 832 923 910 903 831 872 961
!,OOO 937 884 910 996
1,055 1,091 1,115 1,145
996 1,040 l,086
1,314 999
1,025
Total
9,323 9,540
10,703 9,948
10,426 10,388 10,698 10,198 10,027 10,817
ll,060 9,837
10,680 11,368 ll,322 11,934 12,531 13,712 13,761 14,235 13,189 13,929
14,982 13,808 16,410
10,259 10,411 11,562 10,780 11,349 11,298 11,600 11,029 10,899 11,778
12,059 10,775 11,564 12,278 12,318 12,989 13,622 14,828 14,906 15,231 14,228 15,015
16,296 14,807 17,435
Number of reporting
deposittaking
institutions
36,241
54,653
68,055
59,965
71,648
76,781
263,913 368,869 632,782 471
489
483
483
456
440
62,335 62,882 65,421 63,573 68,035 61,444 70,029 69,255 71,434 71,648
69,888 73,856 76,730 78,240 79,988 76,643 76,423 80,181 91,004 82,942 78,823 76,781
85,538 88,472 97,803
316,795 546,312 863,107
355,608 759,854 1,115,462
380,074 889,584 1,269,658
437,173 1,118,450 1,555,623
500,200 1,650,092 2,150,291
388,467 393,498 406,749 405,031 408,033 413,172 422,108 422,218 429,829 437,173
444,180 441,295 449,951 536,913 468,193 458,664 461,832 477,224 481,591 486,639 490,057 500,200
518,821 513,553 528,823
964,958 950,814 974,952 978,095 998,047
l,021,922 1,059,723 1,032,171 1,089,094 1,118,450
1,126,921 l,135,906 1,188,239 1,244,589 1,271,533 1,256,320
. 1,326,074 1,375,023 1,467,988 1,466,056 1,559,535 1,650,092
l,353,425 1,344,312 1,381,701 l,383,125 l,406,079 l,435,094 1,481,831 1,454,389 1,518,922 1,555,623
l,571,101 l,577,200 1,638,190 1,781,502 1,739,726 1,714,984 1,787,906 1,852,247 1,949,579 1,952,695 2,049,592 2,150,291
1,730,607 2,249,428 l,752,953 2,266,506 1,863,802 2,392,625
479 479 480 480 461 459 458 456 458 456
457 460 462 456 455 449 447 447 445 443 440 440
439 434 435
63

BANKING
As at end of year/month
1981
1982
1983
1984
1985
1986
1985: Mar. Apr. May June July Aug. Sept. Oct. Nov. Dec.
1986: Jan. Feb. Mar. Apr. May June July Aug. Sept. Oct. Nov. Dec.
1987: Jan. Feb. Mar.
As at end of year/month
1981
1982
1983
1984
1985
1986
1985: Mar. Apr. May June July Aug. Sept. Oct. Nov. Dec.
1986: Jan. Feb. Mar. Apr. May June July Aug. Sept. Oct. Nov. Dec.
1987: Jan.
64
Feb. Mar.
HK$
5,622
4,528
4,060
4,904
4,635
4,142
6,048 9,686 4,776 5,070 9,294 3,314 4,596 9,948 3,630 4,635
3,981 4,652 6,496
15,569 4,317
10,852 10,389 4,062 9,966 3,860 3,634 4,142
4,426 3,390 9,950
HK$
11,009
6,123
7,420
7,408
9,232
6,363
8,106 9,401 8,192 8,327 9,411 8,324 8,982 9,981 8,946 9,232
9,665 9,577 9,233 9,738
ll,385 10,803 10,068 7,523
10,165 6,515 6,488 6,363
6,127 5,939 7,453
Demand and call
Foreign currency
1,000
1,156
2,055
1,980
2,109
1,198
3,441 8,333 1,719 4,443 8,927 2,097 2,699 8,863 2,004 2,109
2,730 3,195 4,109
11,632 2,540
10,914 10,616
l,955 16,226 1,994 6,525 1,198
6,662 3,531
14,753
Demand and call
Foreign currency
1,474
1,590
1,650
1,017
1,573
2,176
2,015 4,128 1,222 1,677 5,040
963 l,ll6 3,876 l,261 1,573
l,509 1,486 1,730 8,899 2,567 7,583 7,797 2,060 9,200 l,659 3,036 2,176
4,558 1,666 6,935
Total
6,622
5,684
6,115
6,884
6,744
5,339
9,489 18,019 6,495 9,513
18,221 5,4ll 7,295
18,811 5,634 6,744
6,711 7,847
10,605 27,201
6,857 21,766 21,004
6,017 26,192
5,854 10,160 5,339
ll,089 6,921
24,703
Total
12,483
7,713
9,071
8,425
10,804
8,540
10,121 13,529 9,414
10,004 14,451 9,288
10,098 13,857 10,207 10,804
ll,173 ll,063 10,963 18,637 13,952 18,386 17,866 9,583
19,365 8,174 9,523 8,540
10,686 7,605
14,388
7.6 MONEY MARKETS
HK$
5,117
8,793
9,829
10,564
13,349
18,737
7,499 5,728
13,466 10,506 5,570
13,196 12,408 7,083
13,757 13,349
12,193 13,958 10,438 12,445 15,982 6,526 6,253
10,169 6,031
14,721 13,891 18,737
14,037 16,286 9,036
Short notice
Foreign currency
3,564
4,614
10,676
14,642
14,367
25,594
9,489 7,287
13,152 ll,868 4,265
12,704 14,418 6,602
13,202 14,367
14,922 14,207 16,764 9,308
15,229 10,481 7,687
17,245 ll,670 24,927 26,038 25,594
22,300 25,952 22,071
Inter-bank liabilities
Total
8,681
13,408
20,505
25,206
27,716
44,331
16,988 13,015 26,618 22,375
9,835 25,899 26,826 13,685 26,958 27,716
27,115 28,164 27,202 21,752 31,212 17,007 13,940 27,414 17,701 39,647 39,929 44,331
36,337 42,238 31,106
HK$
15,982
23,090
27,654
36,875
39,697
47,369
40,649 37,509 42,400 41,406 40,703 41,605 43,372 42,965 44,905 39,697
43,326 37,419 41,836 70,847 47,766 40,746 45,503 53,349 45,853 51,295 50,534 47,369
57,313 51,337 58,181
Time deposits
Foreign currency
14,412
20,299
30,559
44,199
53,863
116,622
52,607 45,678 48,602 51,545 51,205 53,076 51,178 49,810 51,038 53,863
54,839 54,251
• 64,463 61,614 70,038 68,557 78,360 90,003 90,217 89,885 98,377
116,622
109,995 103,647 ll0,777
Total
30,394
43,389
58,213
81,074
93,559
163,992
93,256 83,187 91,003 92,950 91,908 94,681 94,550 92,775 95,943 93,559
98,165 91,670
106,299 132,461 117,805 109,303 123,863 143,352 136,070 141,181 148,911 163,992
167,307 154,984 168,958
HK$
26,721
36,4ll
41,543
52,343
57,680
70,248
54,196 52,923 60,642 56,982 55,567 58,ll5 60,377 59,995 62,292 57,680
59,500 56,029 58,770 98,861 68,065 58,124 62,144 67,580 61,850 69,876 68,059 70,248
75,776 71,012 77,167
Total
Foreign currency
18,977
26,069
43,289
60,820
70,338
143,414
65,537 61,299 63,473 67,856 64,397 67,877 68,294 65,275 66,243 70,338
72,492 71,652 85,335 82,553 87,808 89,952 96,662
109,202 118,113 116,806 130,941 143,414
138,957 133,131 147,601
$million
Total
45,698
62,481
84,833
113,164
128,019
213,662
119,734 114,221 124,116 124,838 119,964 125,992 128,671 125,270 128,535 128,019
131,991 127,681 144,105 181,414 155,873 148,076 158,807 176,782 179,963 186,682 199,000 213,662
214,733 204,143 224,768
Banks' liabilities to deposit-taking companies
HK$
2,328
2,717
2,724
2,473
3,729
4,001
2,156 1,412 2,744 2,321 1,386 3,486 2,681 1,881 3,666 3,729
3,485 4,307 5,342 2,410 3,620 l,853 1,317 3,160 2,661 3,398 2,796 4,001
2,216 2,519 1,810
Short notice
Foreign currency
2,007
4,121
3,996
5,025
7,088
7,780
. 3,360 2,088 5,657 5,030 l,310 5,228 5,856 1,919 5,729 7,088
6,753 5,659 7,744 4,020 9,229 l,822 2,083 8,239 3,524
10,388 6,793 7,780
5,846 7,863 2,585
Total
4,335
6,837
6,720
7,498
10,817
ll,781
5,516 3,500 8,401 7,351 2,696 8,714 8,537 3,800 9,395
10,817
10,238 9,966
13,085 6,430
12,849 3,675 3,400
ll,399 6,184
13,785 9,589
11,781
8,062 10,382 4,395
HK$
21,466
13,647
17,431
17,398
19,129
20,914
18,844 19,125 18,583 19,551 20,135 19,823 20,542 19,867 20,303 19,129
19,794 19,593 20,263 19,217 19,396 19,172 18,621 21,383 19,965 19,965 21,481 20,914
21,332 19,560 17,565
Time deposits
Foreign currency
4,266
7,034
13,682
14,998
15,228
21,714
13,950 13,123 14,001 15,564 15,317 15,633 16,123 14,856 14,471 15,228
15,383 14,986 16,406 17,436 19,541 18,854 19,696 18,930 20,625 22,364 23,ll7 21,714
20,994 20,623 25,341
Total
25,732
20,681
31,113
32,396
34,357
42,628
32,794 32,248 32,583 35,114 35,452 35,456 36,664 34,723 34,774 34,357
35,176 34,579 36,669 36,653 38,936 38,027 38,317 40,312 40,590 42,329 44,598 42,628
42,326 40,182 42,906
HK$
34,803
22,486
27,575
27,279
32,089
31,278
29,106 29,938 29,518 30,198 30,932 31,633 32,205 31,729 32,914 32,089
32,943 33,477 34,839 31,364 34,401 31,828 30,006 32,066 32,791 29,878 30,765 31,278
29,675 28,018 26,828
Total
Foreign currency
7,747
12,745
19,329
21,040
23,889
31,670
19,325 19,339 20,880 22,271 21,667 21,825 23,094 20,651 21,461 23,889
23,644 22,131 25,879 30,355 31,336 28,260 29,576 29,228 33,348 34,410 32,945 31,670
31,398 30,151 34,861
Total
42,550
35,231
46,904
48,318
55,978
62,948
48,430 49,277 50,398 52,469 52,599 53,458 55,299 52,380 54,375 55,978
56,588 55,608 60,718 61,719 65,737 60,088 59,582 61,294 66,139 64,288 63,710 62,948
61,073 58,169 61,689
Hong Kong Monthly Digest of Statistics April 1987
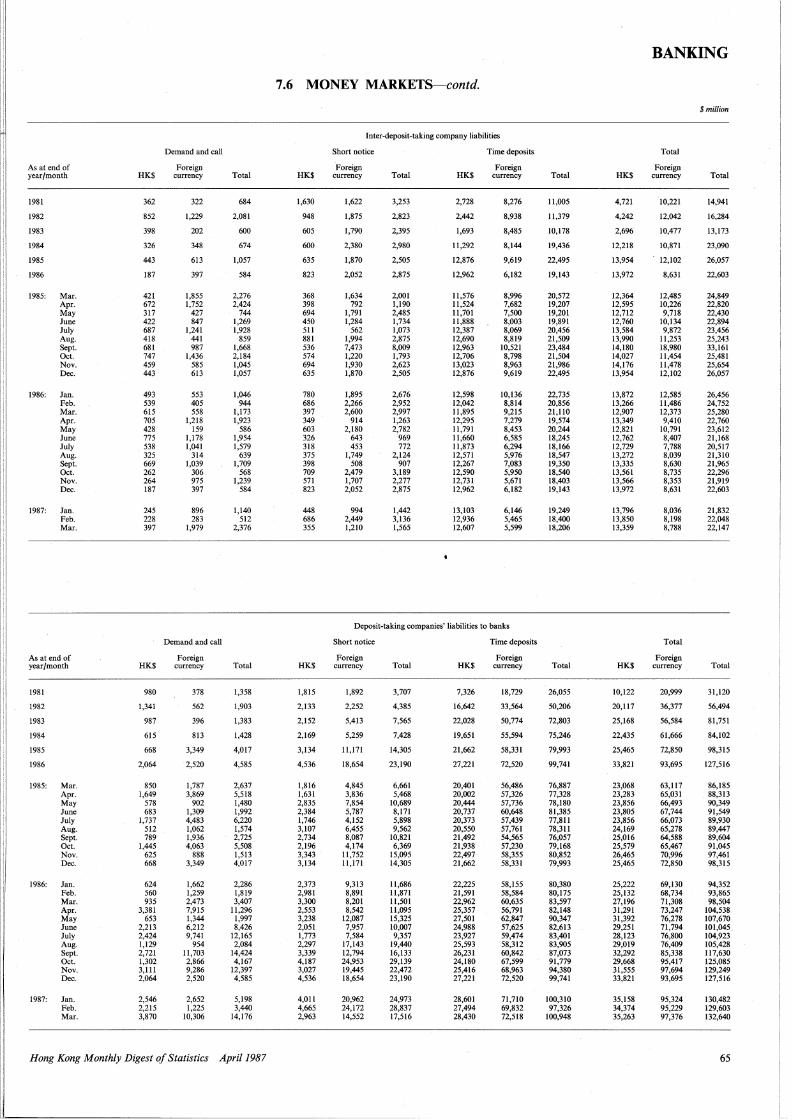
As at end of year/month
1981
1982
1983
1984
1985
1986
1985: Mar. Apr. May June July Aug. Sept. Oct. Nov. Dec.
1986: Jan. Feb. Mar. Apr. May June July Aug. Sept. Oct. Nov. Dec.
1987: Jan. Feb. Mar.
As at end of year/month
1981
1982
1983
1984
1985
1986
1985: Mar. Apr. May June July Aug. Sept. Oct. Nov. Dec.
1986: Jan. Feb. Mar. Apr. May June July Aug. Sept. Oct. Nov. Dec.
1987: Jan. Feb. Mar.
HK$
362
852
398
326
443
187
421 672 317 422 687 418 681 747 459 443
493 539 615 705 428 775 538 325 669 262 264 187
245 228 397
HK$
980
1,341
987
615
668
2,064
850 1,649
578 683
1,737 512 789
1,445 625 668
624 560 935
3,381 653
2,213 2,424 1,129 2,721 1,302 3,11! 2,064
2,546 2,215 3,870
Demand and call
Foreign currency
322
1,229
202
348
613
397
1,855 1,752
427 847
1,241 441 987
1,436 585 613
553 405 558
1,218 159
1,178 1,041
314 1,039
306 975 397
896 283
1,979
Demand and call
Foreign currency
378
562
396
813
3,349
2,520
1,787 3,869
902 1,309 4,483 1,062 1,936 4,063
888 3,349
1,662 1,259 2,473 7,915 1,344 6,212 9,741
954 ll,703 2,866 9,286 2,520
2,652 1,225
10,306
Total
684
2,081
600
674
1,057
584
2,276 2,424
744 1,269 1,928
859 1,668 2,184 l,o45 1,057
1,046 944
1,173 1,923
586 1,954 1,579
639 1,709
568 1,239
584
1,140 512
2,376
Total
1,358
1,903
1,383
1,428
4,017
4,585
2,637 5,518 1,480 1,992 6,220 1,574 2,725 5,508 1,513 4,017
2,286 1,819 3,407
ll,296 1,997 8,426
12,165 2,084
14,424 4,167
12,397 4,585
5,198 3,440
14,176
Hong Kong Monthly Digest of Statistics April 1987
7.6 MONEY MARKETS-contd.
HK$
1,630
948
605
600
635
823
368 398 694 450 51! 881 536 574 694 635
780 686 397 349 603 326 318 375 398 709 571 823
448 686 355
HK$
1,815
2,133
2,152
2,169
3,134
4,536
1,816 1,631 2,835 2,384 1,746 3,107 2,734 2,196 3,343 3,134
2,373 2,981 3,300 2,553 3,238 2,051 1,773 2,297 3,339 4,187 3,027 4,536
4,0ll 4,665 2,963
Inter-deposit-taking company liabilities
Short notice
Foreign currency
1,622
1,875
1,790
2,380
1,870
2,052
1,634 792
1,791 1,284
562 1,994 7,473 1,220 1,930 1,870
1,895 2,266 2,600
914 2,180
643 453
1,749 508
2,479 1,707 2,052
994 2,449 l,210
Total
3,253
2,823
2,395
2,980
2,505
2,875
2,001 1,190 2,485 1,734 1,073 2,875 8,009 1,793 2,623 2,505
2,676 2,952 2,997 1,263 2,782
969 772
2,124 907
3,189 2,277 2,875
1,442 3,136 1,565
HK$
2,728
2,442
1,693
ll,292
12,876
12,962
ll,576 ll,524 ll,701 ll,888 12,387 12,690 12,963 12,706 13,023 12,876
12,598 12,042 ll,895 12,295 ll,791 ll,660 ll,873 12,571 12,267 12,590 12,731 12,962
13,103 12,936 12,607
Time deposits
Foreign currency
8,276
8,938
8,485
8,144
9,619
6,182
8,996 7,682 7,500 8,003 8,069 8,819
10,521 8,798 8,963 9,619
10,136 8,814 9,215 7,279 8,453 6,585 6,294 5,976 7,083 5,950 5,671 6,182
6,146 5,465 5,599
Deposit-taking companies' liabilities to banks
Short notice
Foreign currency
l,892
2,252
5,413
5,259
ll,171
18,654
4,845 3,836 7,854 5,787 4,152 6,455 8,087 4,174
ll,752 ll,171
9,313 8,891 8,201 8,542
12,087 7,957 7,584
17,143 12,794 24,953 19,445 18,654
20,962 24,172 14,552
Total
3,707
4,385
7,565
7,428
14,305
23,190
6,661 5,468
10,689 8,171 5,898 9,562
10,821 6,369
15,095 14,305
ll,686 ll,871 ll,501 ll,095 15,325 10,007 9,357
19,440 16,133 29,139 22,472 23,190
24,973 28,837 17,516
HK$
7,326
16,642
22,028
19,651
21,662
27,221
20,401 20,002 20,444 20,737 20,373 20,550 21,492 21,938 22,497 21,662
22,225 21,591 22,962 25,357 27,501 24,988 23,927 25,593 26,231 24,180 25,416 27,221
28,601 27,494 28,430
Time deposits
Foreign currency
18,729
33,564
50,774
55,594
58,331
72,520
56,486 57,326 57,736 60,648 57,439 57,761 54,565 57,230 58,355 58,331
58,155 58,584 60,635 56,791 62,847 57,625 59,474 58,312 60,842 67,599 68,963 72,520
71,710 69,832 72,518
Total
ll,005
ll,379
10,178
19,436
22,495
19,143
20,572 19,207 19,201 19,891 20,456 21,509 23,484 21,504 21,986 22,495
22,735 20,856 21,l!O 19,574 20,244 18,245 18,166 18,547 19,350 18,540 18,403 19,143
19,249 18,400 18,206
Total
26,055
50,206
72,803
75,246
79,993
99,741
76,887 77,328 78,180 81,385 77,81! 78,31! 76,057 79,168 80,852 79,993
80,380 80,175 83,597 82,148 90,347 82,613 83,401 83,905 87,073 91,779 94,380 99,741
100,310 97,326
100,948
HK$
4,721
4,242
2,696
12,218
13,954
13,972
12,364 12,595 12,712 12,760 13,584 13,990 14,180 14,027 14,176 13,954
13,872 13,266 12,907 13,349 12,821 12,762 12,729 13,272 13,335 13,561 13,566 13,972
13,796 13,850 13,359
HK$
10,122
20,ll7
25,168
22,435
25,465
33,821
23,068 23,283 23,856 23,805 23,856 24,169 25,016 25,579 26,465 25,465
25,222 25,132 27,196 31,291 31,392 29,251 28,123 29,019 32,292 29,668 31,555 33,821
35,158 34,374 35,263
BANKING
Total
Foreign currency
10,221
12,042
10,477
10,871
12,102
8,631
12,485 10,226 9,718
10,134 9,872
ll,253 18,980 ll,454 ll,478 12,102
12,585 ll,486 12,373 9,410
10,791 8,407 7,788 8,039 8,630 8,735 8,353 8,631
8,036 8,198 8,788
Total
Foreign currency
20,999
36,377
56,584
61,666
72,850
93,695
63,ll7 65,031 66,493 67,744 66,073 65,278 64,588 65,467 70,996 72,850
69,130 68,734 71,308 73,247 76,278 71,794 76,800 76,409 85,338 95,417 97,694 93,695
95,324 95,229 97,376
$million
Total
14,941
16,284
13,173
23,090
26,057
22,603
24,849 22,820 22,430 22,894 23,456 25,243 33,161 25,481 25,654 26,057
26,456 24,752 25,280 22,760 23,612 21,168 20,517 21,310 21,965 22,296 21,919 22,603
21,832 22,048 22,147
Total
31,120
56,494
81,751
84,102
98,315
127,516
86,185 88,313 90,349 91,549 89,930 89,447 89,604 91,045 97,461 98,315
94,352 93,865 98,504
104,538 107,670 101,045 104,923 105,428 ll7,630 125,085 129,249 127,516
130,482 129,603 132,640
65

BANKING
7.7 ANALYSIS OF LOANS AND ADVANCES FOR USE IN HONG KONG
As at last day of quarter ended
1. Manufacturing
(a) Textiles
(i) cotton
(ii) other
(iii) sub-total
(b) Footwear and wearing apparel
(c) Metal products and engineering
(d) Rubber, plastics and chemicals
( e) Shipbuilding and repair
([) Electrical and electronic
(g) Food
(h) Beverages and tobacco
(i) Printing and publishing
(j) Miscellaneous
(k) Total
2. Agriculture and fisheries
(a) Fisheries
( b) Livestock and livestock products
( c) Vegetables and horticultures
(d) Total
3. Transport and transport equipment
4. Electricity, gas and telephone
5. Building, construction and property development
6. Wholesale and retail trade
7. Mining and quarrying
8. Miscellaneous
(a) Hotels, boarding houses and catering
(b) Financial concerns (other than banks and deposit-taking. companies)
(c) Stockbrokers
(d) Professional and private individuals
(i) to purchase flats in the Home Ownership Scheme and Private Sector Participation Scheme
(ii) to purchase other residential property
(iii) for credit card advances
(iv) for other business purposes
(v) for other private purposes
(vi) sub-total
(e) All others
([) Total
9. Loans and advances for use in Hong Kong
tLess than HK$0.5 million.
66
Mar. 1986
1,859
1,610
3,469
2,240
2,110
1,264
1,116
3,814
927
777
691
3,081
19,488
75
66
21
162
14,665
4,507
33,106
30,950
141
3,170
15,874
2,022
3,497
20,256
700
7,094
12,040
43,587
31,003
95,656
Banks
June Sept. 1986 1986
1,747
2,141
3,888
1,979
2,227
1,346
1,401
4,056
916
526
740
3,738
20,816
73
80
28
181
14,426
4,311 •
32,089
30,098
198
3,236
17,815
2,033
3,572
22,658
837
7,575
12,363
47,004
33,499
103,587
1,772
2,304
4,076
1,981
2,383
1,449
847
4,605
1,049
538
714
4,431
22,073
74
72
30
176
14,260
4,748
33,621
33,460
153
3,210
18,571
1,916
3,780
26,094
955
8,081
13,375
52,284
35,619
111,600
Dec. 1986
1,771
2,280
4,051
2,162
2,271
1,580
646
5,151
1,354
615
667
4,982
23,479
69
68
26
163
12,483
4,304
31,265
32,601
141
3,684
19,302
2,354
3,782
28,553
1,045
9,372
14,696
57,449
40,977
123,766
Mar. 1987
2,094
2,441
4,536
2,215
2,447
1,816
562
5,313
995
663
707
5,305
24,558
66
78
23
166
12,977
4,975
33,739
32,582
191
3,834
19,708
3,804
3,863
31,928
1,127
10,493
18,062
65,473
45,800
138,618
198,675 205,705 220,091 228,202 247,806
Mar. 1986
43
147
191
114
190
69
270
157
50
20
201
441
1,703
t
t t
5,774
507
4,838
1,509
31
348
3,745
307
2,462
12,619
4
2,394
1,140
18,619
4,600
27,618
Deposit-taking companies
June Sept. Dec. 1986 1986 1986
41
125
166
121
189
72
149
76
49
11
211
434
1,479
t
t 5,563
576
4,377
1,479
30
306
3,299
510
2,458
13,041
4
2,419
l,~92
19,215
4,499
27,829
36 44
132 150
168 194
112 117
212 194
79 133
296 146
77 83
41 52
5 23
243 235
467 486
1,700 1,661
12 18
t . 13 18
5,169 5,578
549 431
4,014 3,337
1,249 1,049
35 19
332 316
3,853 3,762
696 920
2,530
13,741
8
2,454
1,322
20,054
4,304
29,239
2,478
14,349
11
2,539
1,747
21,124
4,312
30,434
$million
Mar. 1987
56
165
221
137
236
161
108
168
39
7
304
290
1,669
22
t 23
5,606
504
3,080
1,105
19
307
4,267
1,498
2,572
14,920
11
2,970
2,128
22,601
4,665
33,338
41,980 41,332 41,967 42,527 45,345
Hong Kong Monthly Digest of Statistics April 1987
---··--------------

BANKING
7.8 LOANS AND ADVANCES ANALYSED BY TYPE-BANKS
$million
To finance imports to and exports and re-exports from Hong Kong
To finance merchandising trade not touching Hong Kong
Other loans for use in Hong Kong
As at end of Foreign Foreign Foreign year/month HK$ currency Total HK$ currency Total HK$ currency Total
1981 16,202 3,516 19,718 147 1,170 1,317 90,962 12,413 103,375
1982 17,332 6,293 23,624 195 1,316 1,510 119,700 17,419 137,118
1983 19,200 7,880 27,080 193 1,911 2,104 133,851 28,022 161,873
1984 19,983 10,073 30,056 206 3,459 3,665 142,631 33,600 176,231
(985 18,588 9,766 28,354 221 2,951 3,172 159,096 32,913 192,009
1986 20,041 13,071 33,112 375 3,779 4,154 183,904 44,298 228,202
1985: Mar. 20,228 9,392 29,620 275 3,144 3,420 146,548 33,423 179,971 Apr. 21,057 9,771 30,828 210 3,237 3,447 148,467 33,427 181,894 May 20,539 9,686 30,226 244 3,422 3,666 151,261 31,947 183,208 June 20,277 9,320 29,598 247 3,916 4,163 152,929 32,743 185,671 July 20,028 8,969 28,997 229 4,013 4,242 153,250 33,581 186,832 Aug. 19,762 9,059 28,821 224 3,486 3,710 154,532 33,296 187,827 Sept. 19,557 8,665 28,222 216 4,118 4,334 156,148 33,991 190,139 Oct. 18,842 9,060 27,902 484 3,650 4,135 154,903 34,533 189,436 Nov. 18,714 9,191 27,905 279 2,966 3,245 158,231 36,084 194,315 Dec. 18,588 9,766 28,354 221 2,951 3,172 159,096 32,913 192,009
1986: Jan. 19,003 9,439 28,442 230 3,382 3,612 160,227 34,075 194,302 Feb. 19,319 9,397 28,716 261 3,784 4,046 161,418 36,747 198,164 Mar. 19,166 10,303 29,468 296 4,581 4,878 163,069 35,607 198,675 Apr. 20,762 10,392 31,154 348 3,761 4,109 195,738 36,672 232,410 May 20,502 10,124 30,626 336 3,689 4,025 164,985 36,913 201,898 June 20,880 10,462 31,342 359 3,769 4,128 167,629 38,076 205,705 July 20,489 11,631 32,120 386 3,305 3,691 169,201 41,259 210,459 Aug. 20,299 11,219 31,518 379 3,480 3,859 171,543 42,046 213,589 Sept. 20,023 12,013 32,036 476 5,835 6,3ll 173,375 46,716 220,091 Oct. 20,602 12,332 32,933 437 3,799 4,235 177,261 44,231 221,493 Nov. 20,630 ll,919 32,549 401 3,108 3,509 179,852 44,402 224,254 Dec. 20,041 13,071 33,ll2 375 3,779 4,154 183,904 44,298 228,202
1987: Jan. 20,483 13,753 34,236 391 3,576 3,966 188,789 46,329 235,118 Feb. 20,265 13,501 33,766 384 3,750 4,134 194,321 46,334 240,655 Mar. 21,305 15,427 36,732 451 3,715 4,166 198,448 49,359 247,806
Other loans for use outside Hong Kong Other loans where the place of use is not known Total loans and advances
As at end of Foreign Foreign Foreign year/month HK$ currency Total HK$ currency Total HK$ currency Total
1981 1,338 32,072 33,410 627 3,352 3,979 109,276 52,523 161,799
1982 1,195 38,859 40,053 928 5,467 6,395 139,348 69,353 208,702
1983 1,713 53,454 55,167 1,376 7,566 8,942 156,332 98,833 255,165
1984 2,391 62,982 65,373 1,609 9,344 10,952 166,820 ll9,457 286,277
1985 4,165 71,122 75,287 2,066 12,056 14,121 184,135 128,808 312,942
1986 5,940 97,567 103,507 2,138 19,635 21,773 212,398 178,349 390,747
1985: Mar. 2,808 66,017 68,825 1,734 9,869 ll,603 171,593 121,846 293,439 Apr. 2,882 66,744 69,626 1,700 9,729 ll,429 174,316 122,908 297,224 May 2,941 69,679 72,621 1,646 9,569 11,215 176,632 124,303 300,935 June 3,037 70,204 73,242 1,730 9,801 11,531 178,220 125,984 304,204 July 3,142 69,880 73,022 1,972 8,978 10,949 178,621 125,420 304,042 Aug. 3,226 70,664 73,890 1,888 9,013 10,901 179,631 125,517 305,149 Sept. 3,292 70,133 73,425 1,944 9,112 ll,056 181,157 126,019 307,176 Oct. 3,579 72,172 75,750 1,823 10,074 ll,897 179,631 129,489 309,120 Nov. 4,037 72,525 76,562 1,944 12,568 14,512 183,205 133,333 316,538 Dec. 4,165 71,122 75,287 2,066 12,056 14,121 184,135 128,808 312,942
1986: Jan. 4,618 74,164 78,782 2,208 11,255 13,463 186,285 132,315 318,600 Feb. 4,828 76,425 81,254 2,108 ll,552 13,660 187,934 137,905 325,839 Mar. 5,106 78,826 83,932 1,934 13,072 15,006 189,571 142,388 331,959 Apr. 5,963 83,307 89,270 2,271 11,698 13,970 225,082 145,830 370,912 May 5,483 86,074 91,556 2,144 12,952 15,096 193,450 149,752 343,202 June 5,728 87,200 92,928 2,250 14,156 16,406 196,846 153,662 350,508 July 5,873 90,649 96,522 2,408 16,514 18,922 198,355 163,357 361,713 Aug. 5,969 89,974 95,943 2,540 16,755 19,295 200,729 163,474 364,203 Sept. 5,803 93,281 99,085 2,422 18,332 20,754 202,099 176,177 378,276 Oct. 5,575 92,299 97,874 2,744 19,357 22,101 206,619 172,017 378,636 Nov. 6,023 93,345 99,368 2,043 18,735 20,777 208,948 171,509 380,457 Dec. 5,940 97,567 103,507 2,138 19,635 21,773 212,398 178,349 390,747
1987: Jan. 6,379 101,143 107,522 2,446 20,991 23,437 218,488 185,792 404,280 Feb. 5,854 101,210 107,064 2,503 21,380 23,883 223,326 186,175 409,501 Mar. 5,842 106,128 111,970 2,263 26,300 28,563 228,308 200,928 429,237
Hong Kong Monthly Digest of Statistics April 1987 67

BANKING
7.9 LOANS AND ADVANCES ANALYSED BY TYPE-DEPOSIT-TAKING COMPANIES
$million
To finance imports to and exports To finance merchandising trade not Other loans for use in Hong Kong and re-exports from Hong Kong touching Hong Kong
As at end of Foreign Foreign Foreign year/month HK$ currency Total HK$ currency Total HK$ currency Total
1981 1,380 788 2,167 150 741 891 32,360 7,673 40,034
1982 1,682 1,032 2,714 113 668 782 38,496 11,707 50,203
1983 1,245 1,157 2,402 103 680 783 37,972 9,087 47,058
1984 1,214 1,197 2,4ll 95 688 783 36,716 7,959 44,675
1985 1,154 1,347 2,501 48 518 566 34,834 8,101 42,934
1986 1,131 1,259 2,390 18 423 441 35,040 7,488 42,527
1985: Mar. 1,204 U84 2,388 67 680 746 36,514 7,600 44,ll3 Apr. 1,152 1,218 2,370 66 666 732 36,277 7,988 44,265 May 1,151 1,148 2,299 68 658 725 36,937 7,522 44,458 June 1,124 1,128 2,252 78 710 788 36,544 7,362 43,906 July 1,107 1,182 2,289 35 639 673 36,458 7,833 44,291 Aug. 1,034 1,225 2,258 42 600 643 35,902 7,604 43,506 Sept. 1,047 1,190 2,237 39 544 583 35,972 7,771 43,743 Oct. 1,067 1,258 2,325 37 557 594 35,901 7,787 43,689 Nov. 1,043 l,3ll 2,354 44 570 614 35,606 8,638 44,244 Dec. 1,154 1,347 2,501 48 518 566 34,834 8,101 42,934
1986: Jan. 1,087 1,215 2,302 52 583 635 34,586 8,340 42,926 Feb. 1,084 1,330 2,414 50 636 686 34,232 8,345 42,576 Mar. 1,125 1,292 2,417 49 730 779 33,910 8,070 41,980 Apr. 1,159 1,352 2,511 50 706 756 38,509 8,083 46,592 May 1,147 1,334 2,481 51 766 817 34,096 8,027 42,123 June 1,164 1,376 2,540 55 778 833 33,772 7,560 41,332 July 1,527 1,367 2,894 64 737 801 33,058 7,792 40,850 Aug. 1,025 1,328 2,353 45 634 679 33,858 7,945 41,802 Sept. 1,0ll 1,354 2,364 20 525 546 34,055 7,912 41,967 Oct. 1,007 1,210 2,218 16 357 373 34,778 7,875 42,652 Nov. 1,143 1,173 2,316 15 454 469 34,437 7,203 41,640 Dec. 1,131 1,259 2,390 18 423 441 35,040 7,488 42,527
1987: Jan. 1,153 1,328 2,481 14 427 441 35,891 7,332 43,223 Feb. 1,126 1,337 2,462 17 407 424 36,627 7,827 44,455 Mar. 1,141 1,488 2,629 20 297 316 37,320 8,025 45,345
Other loans for use outside Hong Kong Other loans where the place of use is not known Total loans and advances
As at end of Foreign Foreign Foreign year/month HK$ currency Total HK$ currency Total HK$ currency Total
1981 781 44,444 45,225 1,633 5,792 7,425 36,305 59,438 95,742
1982 914 59,984 60,898 1,540 6,394 7,935 42,746 79,785 122,532
1983 811 75,519 76,330 713 8,901 9,614 40,843 95,344 136,187
1984 1,098 76,319 77,417 988 8,499 9,487 40,110 94,663 134,772
1985 1,358 69,675 71,033 1,401 8,587 9,988 38,794 88,228 127,022
1986 820 56,368 57,187 819 6,485 7,304 37,827 72,022 109,849
1985: Mar. 1,182 75,719 76,902 1,222 8,125 9,348 40,189 93,308 133,497 Apr. 1,199 74,396 75,595 1,203 7,522 8,726 39,898 91,790 131,688 May 1,213 74,207 75,420 1,306 7,420 8,726 40,674 90,955 131,629 June 1,217 73,235 74,452 1,264 7,342 8,606 40,227 89,776 130,003 July 1,071 72,780 73,851 1,239 7,521 8,760 39,909 89,955 129,864 Aug. 1,101 73,079 74,179 1,217 7,272 8,489 39,296 89,780 129,075 Sept. 1,270 71,875 73,145 1,207 7,212 8,419 39,534 88,592 128,127 Oct. 1,213 72,483 73,696 1,241 7,544 8,784 39,459 89,628 129,087 Nov. 1,219 72,422 73,641 1,252 7,521 8,773 39,164 90,463 129,627 Dec. 1,358 69,675 71,033 1,401 8,587 9,988 38,794 88,228 127,022
1986: Jan. 1,336 70,359 71,694 1,151 8,167 9,318 38,211 88,665 126,876 Feb. 1,090 69,852 70,942 1,322 8,637 9,959 37,778 88,800 126,578 Mar. 1,179 70,261 71,440 1,421 9,246 10,666 37,683 89,599 127,282 Apr. 1,121 69,685 70,806 1,492 8,866 10,358 42,331 88,691 131,022 May 1,020 66,366 67,386 1,290 8,663 9,953 37,604 85,156 122,760 June 871 65,386 66,257 1,268 7,794 9,061 37,129 82,894 120,023 July 914 65,425 66,339 982 7,831 8,813 36,544 83,153 119,697 Aug. 871 64,510 65,381 1,230 7,999 9,229 37,028 82,416 119,444 Sept. 879 63,645 64,524 1,102 7,336 8,438 37,066 80,772 117,839 Oct. 891 60,662 61,553 1,197 7,318 8,515 37,889 77,422 115,3l! Nov. 915 59,802 60,717 1,347 7,541 8,887 37,857 76,171 114,029 Dec. 820 56,368 57,187 819 6,485 7,304 37,827 72,022 109,849
1987: Jan. 883 57,105 57,988 1,283 7,492 8,775 39,224 73,684 112,908 Feb. 916 57,617 58,533 1,647 6,720 8,367 40,333 73,908 114,241 Mar. 883 59,546 60,430 1,058 6,287 7,344 40,420 75,643 116,064
68 Hong Kong Monthly Digest of Statistics April 1987
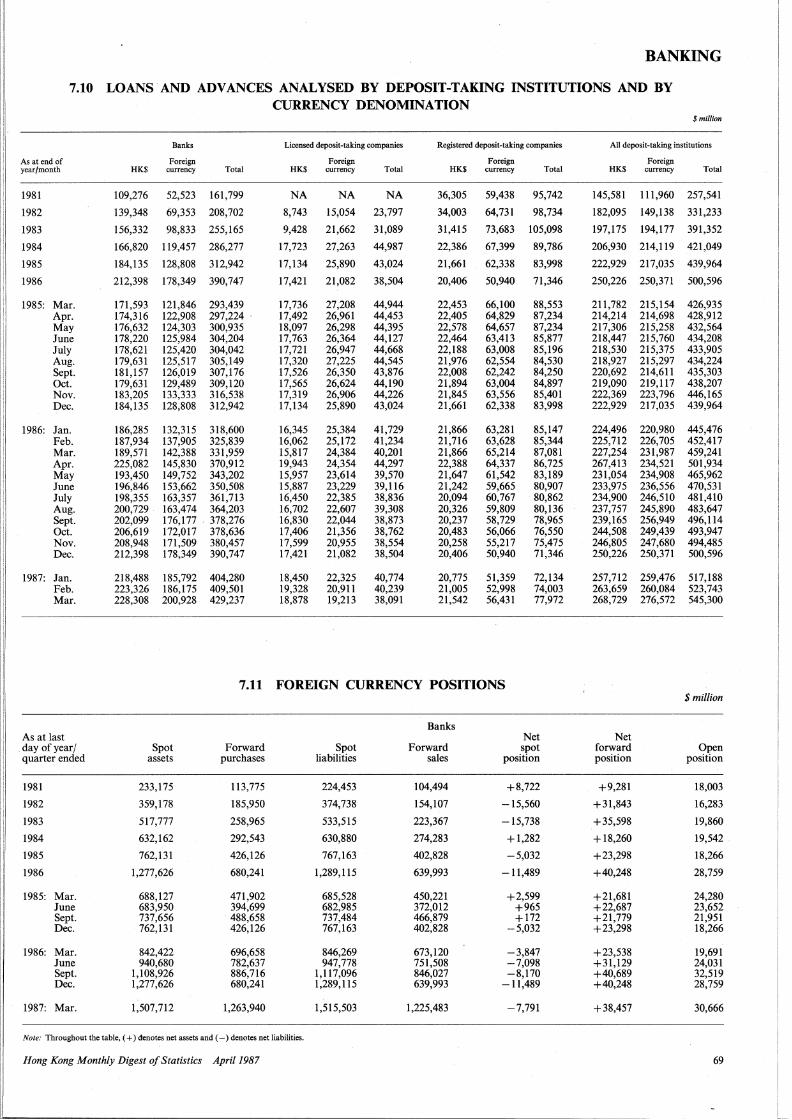
BANKING
7.10 LOANS. AND ADVANCES ANALYSED BY DEPOSIT-TAKING INSTITUTIONS AND BY CURRENCY DENOMINATION
$million
Banks Licensed deposit-taking companies Registered deposit-taking companies All deposit-taking institutions
As at end of Foreign Foreign Foreign Foreign yearfmonth HKS currency Total HK$ currency Total HK$ currency Total HK$ currency Total
1981 109,276 52,523 161,799 NA NA NA 36,305 59,438 95,742 145,581 111,960 257,541
1982 139,348 69,353 208,702 8,743 15,054 23,797 34,003 64,731 98,734 182,095 149,138 331,233
1983 156,332 98,833 255,165 9,428 21,662 31,089 31,415 73,683 105,098 197,175 194,177 391,352
1984 166,820 119,457 286,277 17,723 27,263 44,987 22,386 67,399 89,786 206,930 214,119 421,049
1985 184,135 128,808 312,942 17,134 25,890 43,024 21,661 62,338 83,998 222,929 217,035 439,964
1986 212,398 178,349 390,747 17,421 21,082 38,504 20,406 50,940 71,346 250,226 250,371 500,596
1985: Mar. 171,593 121,846 293,439 17,736 27,208 44,944 22,453 66,100 88,553 211,782 215,154 426,935 Apr. 174,316 122,908 297,224 , 17,492 26,961 44,453 22,405 64,829 87,234 214,214 214,698 428,912 May 176,632 124,303 300,935 18,097 26,298 44,395 22,578 64,657 87,234 217,306 215,258 432,564 June 178,220 125,984 304,204 17,763 26,364 44,127 22,464 63,413 85,877 218,447 215,760 434,208 July 178,621 125,420 304,042 17,721 26,947 44,668 22,188 63,008 85,196 218,530 215,375 433,905 Aug. 179,631 125,517 305,149 17,320 27,225 44,545 21,976 62,554 84,530 218,927 215,297 434,224 Sept. 181,157 126,019 307,176 17,526 26,350 43,876 22,008 62,242 84,250 220,692 214,611 435,303 Oct. 179,631 129,489 309,120 17,565 26,624 44,190 21,894 63,004 84,897 219,090 219,117 438,207 Nov. 183,205 133,333 316,538 17,319 26,906 44,226 21,845 63,556 85,401 222,369 223,796 446,165 Dec. 184,135 128,808 312,942 17,134 25,890 43,024 21,661 62,338 83,998 222,929 217,035 439,964
1986: Jan. 186,285 132,315 318,600 16,345 25,384 41,729 21,866 63,281 85,147 224,496 220,980 445,476 Feb. 187,934 137,905 325,839 16,062 25,172 41,234 21,716 63,628 85,344 225,712 226,705 452,417 Mar. 189,571 142,388 331,959 15,817 24,384 40,201 21,866 65,214 87,081 227,254 231,987 459,241 Apr. 225,082 145,830 370,912 19,943 24,354 44,297 22,388 64,337 86,725 267,413 234,521 501,934 May 193,450 149,752 343,202 15,957 23,614 39,570 21,647 61,542 83,189 231,054 234,908 465,962 June 196,846 153,662 350,508 15,887 23,229 39,116 21,242 59,665 80,907 233,975 236,556 470,531 July 198,355 163,357 361,713 16,450 22,385 38,836 20,094 60,767 80,862 234,900 246,510 481,410 Aug. 200,729 163,474 364,203 16,702 22,607 39,308 20,326 59,809 80,136 237,757 245,890 483,647 Sept. 202,099 176,177 . 378,276 16,830 22,044 38,873 20,237 58,729 78,965 239,165 256,949 496,114 Oct. 206,619 172,017 378,636 17,406 21,356 38,762 20,483 56,066 76,550 244,508 249,439 493,947 Nov. 208,948 171,509 380,457 17,599 20,955 38,554 20,258 55,217 75,475 246,805 247,680 494,485 Dec. 212,398 178,349 390,747 17,421 21,082 38,504 20,406 50,940 71,346 250,226 250,371 500,596
1987: Jan. 218,488 185,792 404,280 18,450 22,325 40,774 20,775 51,359 72,134 257,712 259,476 517,188 Feb. 223,326 186,175 409,501 19,328 20,911 40,239 21,005 52,998 74,003 263,659 260,084 523,743 Mar. 228,308 200,928 429,237 18,878 19,213 38,091 21,542 56,431 77,972 268,729 276,572 545,300
7.11 FOREIGN CURRENCY POSITIONS $million
Banks As at last Net Net day of year/ Spot Forward Spot Forward spot forward Open quarter ended assets purchases liabilities sales position position position
1981 233,175 113,775 224,453 104,494 +8,722 +9,281 18,003
1982 359,178 185,950 374,738 154,107 -15,560 +31,843 16,283
1983 517,777 258,965 533,515 223,367 -15,738 +35,598 19,860
1984 632,162 292,543 630,880 274,283 +1,282 +18,260 19,542
1985 762,131 426,126 767,163 402,828 -5,032 +23,298 18,266
1986 1,277,626 680,241 1,289,115 639,993 -11,489 +40,248 28,759
1985: Mar. 688,127 471,902 685,528 450,221 +2,599 +21,681 24,280 June 683,950 394,699 682,985 372,012 +965 +22,687 23,652 Sept. 737,656 488,658 737,484 466,879 +172 +21,779 21,951 Dec. 762,131 426,126 767,163 402,828 -5,032 +23,298 18,266
1986: Mar. 842,422 696,658 846,269 673,120 -3,847 +23,538 19,691 June 940,680 782,637 947,778 751,508 -7,098 +31,129 24,031 Sept. 1,108,926 886,716 1,117,096 846,027 -8,170 +40,689 32,519 Dec. 1,277,626 680,241 1,289,115 639,993 -11,489 +40,248 28,759
1987: Mar. 1,507,712 1,263,940 1,515,503 1,225,483 -7,791 +38,457 30,666
Note: Throughout the table, (+)denotes net assets and ( - ) denotes net liabilities.
Hong Kong Monthly Digest of Statistics April 1987 69

BANKING
7.11 FOREIGN CURRENCY POSITIONS~contd.
$million
Deposit-taking companies As at last day Net Net of year/ Spot Forward Spot Forward spot forward Open quarter ended assets purchases liabilities sales position position position
1981 126,054 46,267 128,973 41,747 -2,919 +4,520 1,601
1982 191,655 55,651 195,592 49,902 -3,937 +5,749 1,812
1983 250,779 50,758 252,033 44,597 -1,254 +6,161 4,907
1984 280,895 57,929 278,873 55,673 +2,022 +2,256 4,278
1985 361,697 105,228 359,065 103,748 +2,632 + 1,480 4,112
1986 355,597 138,804 353,734 136,779 + 1,863 +2,025 3,888
1985: Mar. 301,825 91,437 299,601 90,106 +2,224 + 1,331 3,555 June 310,397 75,455 308,423 74,003 +1,974 + 1,452 3,426 Sept. 333,456 103,150 331,395 101,382 +2,061 + 1,768 3,829 Dec. 361,697 105,228 359,065 103,748 +2,632 + 1,480 4,112
1986: Mar. 366,169 131,151 363,486 129,630 +2,683 + 1,521 4,204 June 364,007 130,355 361,725 128,319 +2,282 +2,036 4,318 Sept. 370,583 156,166 367,364 154,764 +3,219 + 1,402 4,621 Dec. 355,597 138,804 353,734 136,779 + 1,863 +2,025 3,888
1987: Mar. 377,347 201,663 375,966 199,214 + 1,381 +2,449 3,830
All deposit-taking institutions As at last day Net Net of year/ Spot Forward Spot Forward spot forward Open quarter ended assets purchases liabilities sales position position position
1981 359,229 160,042 353,426 146,241 +5,803 + 13,801 19,604
1982 550,833 241,601 570,330 204,009 -19,497 +37,592 18,095
1983 768,556 309,723 785,548 267,964 -16,992 +41,759 24,767
1984 913,057 350,472 909,753 329,956 +3,304 +20,516 23,820
1985 1,123,828 531,354 1,126,228 506,576 -2,400 +24,778 22,378
1986 1,633,223 819,045 1,642,849 776,772 -9,626 +42,273 32,647
1985: Mar. 989,952 563,339 985,129 540,327 +4,823 +23,012 27,835 June 994,347 470,154 991,408 446,015 +2,939 +24,139 27,078 Sept. 1,071,112 591,808 1,068,879 568,261 +2,233 +23,547 25,780 Dec. 1,123,828 531,354 1,126,228 506,576 -2,400 +24,778 22,378
1986: Mar. 1,208,591 827,809 1,209,755 802,750 -1,164 +25,059 23,895 June 1,304,687 912,992 1,309,503 879,827 -4,816 +33,165 28,349 Sept. 1,479,509 1,042,882 1,484,460 1,000,791 -4,951 +42,091 37,140 Dec. 1,633,223 819,045 1,642,849 776,772 -9,626 +42,273 32,647
1987: Mar. 1,885,059 1,465,603 1,891,469 1,424,697 -6,410 +40,906 34,496
Note: Throughout the table, (+)denotes net assets and ( - ) denotes net liabilities.
70 Hong Kong Monthly Digest of Statistics April 1987

Effective from
31 May l9S2 26 July l9S2 23 Aug. 1982 31 Aug. l9S2 29 Nov. 19S2 30 Dec. l9S2 20 Apr. 19S3 24May 19S3 6July 19S3 2S July 1983 9 Sept. l9S3 27 Sept. l9S3 27 Oct. l9S3 2 Nov. l9S3 23 Jan. l9S4 30 Jan. l9S4 lS Feb. 19S4 12 Mar. l9S4 26 Mar. 1984 9 Apr. l9S4 10 May l9S4 28 May l9S4 27 June l9S4 7 July l9S4 3 Aug. l9S4 23 Aug. 1984 l Oct. l9S4 29 Oct. l9S4 26 Nov. l9S4 24Dec. 19S4 14 Jan. 19SS 2S Jan. l9SS I Apr. 19SS 22 Apr. l9SS 20 May l9SS 24 June l9SS lS July l9SS 19 July l9SS 2 Sept. 19SS I Apr. 19S6 12 May l9S6 16 Aug. 1986 lSJan.1987 2 Mar. 1987 7 Apr. l9S7
7.12 INTEREST RATES PAID AND CHARGED BY PRINCIPAL BANKS
7 days' call
Time deposits fates paid
lmonth
lOt 9 8t ;t s
10 9 s 9t
llt 1gt s 7 St 4t St 6t 7t s 9
12 10 9 s 7t 7
~t St s 4t 4 3t 3 2t 3 3t 3t 2t
1i 2t
3 months
gt ~t s 7t St
10! 9t St
10 12 10 9 s 7 St 4+ St 6t s St 9t
l2l 10! 9t
~t 7t 7 6t St s 4t 4 3t 3t 2t 3! 4t 4 3t 2t 3 3t
6 months
llt ll gt s 7i St
lO;i 9t St
10-!-13-l-9! St 7t 7 St 4t St 6t s St 9!
121 lOt 9t St s 7t 7 6! St s 4± 4 3t 3! 2t 3t
f4 3! 2t 3 3!
12 months
Savings deposits
rate paid
6t 6 s 4t St 7t 6t St 7
10 9 s 7 6 4t 3t 4± St 6t 7 s
11 9 8 7 6! 6 St s 4t 4 3! 3! 2t 2t lt 2! 3 2t 2 I! lf 2
BANKING
%perannum
The HSBC's quoted best lending rate
IS 14 l2t 12 ll
m Bt 12t llt 13 16 lS Bt l2t llt 10 St
10 ll 12 12f 13:! 17 lS 14 13 12 lit ll IOt 10 9t 9 St s 7 6 7 s 7t 6t s 6 6t
7.13 HONG KONG DOLLAR INTER-BANK OFFER RATES AND BANK CHEQUES CLEARED
Year/month
!9Sl
l9S2
l9S3
l9S4
l98S
19S6
l98S: Mar.
Apr.
May
June
July
Aug.
Sept.
Oct.
Nov. Dec.
19S6: Jan.
Feb.
Mar. Apr.
May
June July
Aug.
Sept.
Oct.
Nov. Dec.
l9S7: Jan.
Feb.
Mar.
Overnight
St-23 3-16
1-32
!-4S t-12
0.25-lS.00
t-9 3-!--9t
1-12
2-7t 2-7! 2.\-{i
lt-7 1-7
2-7 3-7!
4.5-7.S
6.S7-7.2S
4.S-7.S
1.5-lS.O
1-ll 6.25-8.2S
3.00-S.SO
l.00-8.SO
4.25-6.SO
2.00-S.2S
3.7S-6.00
0.2S-l2.00
l.00-7.00
l.00-4.SO
l.00-S.SO
High/low during the period
One week
N.A. St-lSf
4!-30 1-39
Zt-9 2.00-12.00
5-8-l-6-8-!-
3t-7:l 4t-St 3t-6t 3t-6
2.\-{it
3t-6 4t-6:l St-6t
S.S-7.2S
6.75-7.2S
S.5-7.2S
6.37-12.0
4-8.7S 6.S-7.S
4.25-7.62
2.S0-7.00
4.62-S.7S
2..SO-S.2S
3.SO-S.12 2..00-S.00
l.75-6.00
l.62-4.62
4.00-S.2S
One month
11?6 19 7t-1Si 6t-26
3t-28
4-8t 3.37-9.00
7-St 6t-8
St-7i
6t-St 4t-6i 4-Si
4!-7t
4sf! 4t-6t St-6i
&-7.06
6.68-7.00
6.0-7.5
7.12-9.0
5.5-7.37
6.62-7.12
5.62-6.93
3.75-6.62
4.87-S.43
3.87-S.00
4.00-4.43 3.37-5.2S
3.00-S.87
2.62-4.62
4.62-S.06
Three months
l3t-1St
St-I St
7-h;-20 St-2S
S-9
4.l2-7.7S
7!-9 6tt-8
6if7i 6it-S s~
S--6! sf6-7ft; st-61,; 1f6i 5tPt
6.lS-7.06
6.6µj.93
6.43-7.S
6.7S-7.7S
&-7.12
6.5-7
6.00-6.87
4.Sl-6.43
4.S7-S.43
4.5&-S.IS
4.43-4.7S
4.l2-4.6S
3.62-S.2S
3.S6-4.62
4.75-S.2S
Hong Kong Monthly Digest of Statistics April 1987
Hong Kong Dollar Inter-bank Offer Rate(% per annum)
Rates at end of period
Six months
l3t-1Si
9t-1St
7[~ 19 7-21
sij-9i 4.S0-7.7S
St-9t
7t-8t 7-h--81\;
7t-8 6t-7ft; 6i-7ft, 6i-7i 6t-6i sij-6t 6-k-6i
6.S-7.06
6.6µj.87
6.62-7.S
6.75-7.7S
6.S-7
6.6µj.93
6.25-6.87
S.31-6.43
S.12-S.62
S.00-S.43
4.62-4.93
4.S0-4.68
3.S7-S.OO
3.93-4.S7 4.S7-S.37
Overnight
3
l3t 7
12.00
St s
6
2t 4
7
6t
6:! 7
7.2S
6.S7
7.0
ll.O
S.2S
8.SO
s.so 6.SO
4.7S
S.2S
12.00
l.00
4.SO
4.7S
One One week month
N.A. Tf,
lS
8! 6j!
8.00
7.2S
6.7S
7.2S
8.2S
6.7S
7.5
7.62
S.7S
S.2S
4.SO
S.00
8.00
l.75
4.62
4.87
Bt 8H l4t St
6* S.2S
6.S7
6.7S
7.5
7.2S
6.62
7.12
6.S7
S.2S
S.31
4.00
4.43 S.2S
3.00
4.62
5,06
Three months
13! 9t lS
St
6i 4.6S
6.Sl
6.Sl
7.S 7.0
6.5
6.93
6.S6
5.25
S.31
4.56
4.62
4.68
3.6S
4.62
S.2S
Six months
6.81
6.87
7.S 7.0
6.68
6.93
6.S6
5.43
5.50
4.93
4.68
4.68
3.93
4.S7
S.37
Bank cheques cleared
(thousand items)
73 S37 74 S33
77 252
82 347
86 654
94127
66SO
6990 7 608
6 607
7 S76
7010
6 713
7 957
7 482
7 461
8 383
6 262
6724
8 025
8 174
7 235
8096
7 374
8092
8 763
8091
8 907
9 672
7 381
8 888
Value of bank cheques cleared
($million)
4,807,863
5,792,607
6,040,2SS
7,099,064
7,334,287
9,691,488
625,967 565,797
6S3,S98
S4S,l62
610,161
639,784
616,48S
680,632
628,705
609,69S
726,330
565,698
667,723
898,403
852,551
652,l9S
838,395
862,119
829,625 995,611
892,521 910,316
1,101,621
1,044,672
1,086,347
71

BANKING
7.14 BANKS: EXTERNAL LIABILITIES AND CLAIMS AT 31 DECEMBER 1986
$million
Liabilities to banks Claims on banks Claims on non-bank outside Hong Kong outside Hong Kong customers outside Hong Kong
Denominated Denominated Denominated in foreign in foreign in foreign currencies currencies currencies
Denominated (HK dollar Denominated (HK dollar Denominated (HK dollar in HK dollars equivalent) in HK dollars equivalent) in HK dollars equivalent)
A. International organizations 95
B. Analysis by country
Asia and Pacific 12,988 455,677 24,592 561,499 3,724 65,762
Australia 128 3,051 169 7,156 284 5,093 Bangladesh 64 140 99 Brunei 3 2 88 China§ 7,913 18,728 19,451 10,543 1,119 9,189
Taiwan 82 2,475 128 13,706 3 1,417 Fiji 300 3 255 199 7 French Polynesia 5 23 ll India 56 68 65 364 48 2,758 Indonesia 153 3,158 3 161 456 7,995 Japan 102 237,204 913 346,945 205 12,269 Macao 1,383 2,588 816 4,560 374 287 Malaysia 160 888 2 957 599 3,479 Nepal 4 1 21 New Zealand 13 1,642 55 442 11 2,954 Democratic People's
Republic of Korea 3 3 212 Pakistan 32 2 13 392 Papua New Guinea 3 64 42 416 Philippines 30 2,811 20 10,669 51 3,984 Singapore 2,908 152,933 2,906 122,679 166 1,163 Solomon Islands 156 2,077 644 Republic of Korea 6 1,929 10 25,852 13 7,131 Sri Lanka 3 78 6 356 865 Thailand 32 1,333 5 1,920 152 5,031 Vanuatu 10,693 21 397 463 Vietnam 11 4 123 2 Others 1 15,470 10 11,903 39 6
Africa 8 154 8 711 366 9,594 Algeria 36 Angola 5 Cameroon 17 Djibouti 32 Equatorial Guinea 94 Ivory Coast 3 16 Liberia 82 11 364 9,484 Mauritius 4 19 Nigeria 381 21 Rwanda 7 South Africa 7 2 81 34 Tanzania 39 Togo 15 Zambia 61 Others 2 15 2
North America 501 63,339 355 40,133 575 2,170 Canada 38 4,105 180 3,891 482 231 United States 463 59,234 175 36,242 93 1,939
Latin America 39 1 158 1 607 Argentina 14 177 Brazil 61 376
Chile 39 3
Mexico 39 35 48
Others 9 3
§Excluding figures for Taiwan.
72 Hong Kong Monthly Digest of Statistics April 1987

BANKING
7.14 BANKS: EXTERNAL LIABILITIES AND CLAIMS AT 31 DECEMBER 1986-contd.
$million
Liabilities to banks Claims on banks Claims on non-bank outside Hong Kong outside Hong Kong customers outside Hong Kong
Denominated Denominated Denominated in foreign in foreign in foreign currencies currencies currencies
Denominated (HK dollar Denominated (HK dollar Denominated (HK dollar in HK dollars equivalent) in HK dollars equivalent) in HK dollars equivalent)
Caribbean 274 35,653 2 66,300 125 14,782 Bahamas 186 9,983 54,260 38 306 Bermuda 7 452 19 24 !,OOO Cayman Islands 80 24,392 11,623 2 634 Cuba 26 Netherlands Antilles 424 110 301 Panama 350 236 61 12,541 Others 52 26
Middle East 31 25,683 196 6,598 6 522 Bahrain 15 12,894 190 4,963 24 Egypt 146 6 2 Iran 10 13 Israel 248 4 40 Jordan 117 1 2 Kuwait 4 461 1,138 Lebanon 7 3 Libya 4 45 Oman 148 Qatar 1,680 Saudi Arabia 4,993 46 303 United Arab Emirates 2 4,893 383 148 People's Democratic
Republic of the Yemen 72 Others 27
Western Europe 4,200 227,963 3,743 144,339 753 4,952 Andorra 8 1 Austria 25 4,702 8 2,579 8 3 Belgium/Luxembourg 182 14,316 164 16,405 5 107 Cyprus 31 5 73 Denmark 27 524 28 764 87 Finland 8 598 7 467 43 France 267 12,083 325 16,042 18 332 Greece 391 212 2 98 Italy 15 7,089 21 . 6,446 11 731 Liechtenstein 1 162 Netherlands 118 5,576 35 4,271 64 152 Norway 6 117 10 179 10 224 Portugal 4 31 3 3 2 Republic of Ireland I 39 I 50 2 16 Spain 1,695 530 1 39 Sweden 19 239 27 365 15 Switzerland 276 16,880 115 5,163 8 82 Turkey 52 117 24 United Kingdom 2,962 145,702 2,877 87,503 614 1,117 Federal Republic
of Germany 287 17,571 117 2,854 8 1,805 Others 2 157 5 383 4
Eastern Europe 496 8 Czechoslovakia 142 German Democratic
Republic 86 Hungary 97 Poland 17 8 Romania 34 USSR 120 Others
Unallocated 26 227 2 72 c. Summary
International organizations 95 Countries 18,002 808,508 28,897 820,234 5,550 98,397 Unallocated 1 I 26 227 2 72
Total 18,003 808,509 28,923 820,461 5,552 98,564
Hong Kong Monthly Digest of Statistics April 1987 73 .

BANKING
7.15 DEPOSIT-TAKING COMPANIES: EXTERNAL LIABILITIES AND CLAIMS AT 31 DECEMBER 1986
A. ' International organizations
B. Analysis by country
Asia and Pacific Australia Bangladesh Brunei China§
Taiwan Fiji India Indonesia Japan Macao Malaysia New Zealand Democratic People's
Republic of Korea Pakistan Papua New Guinea Philippines Singapore Solomon Islands Republic of Korea Sri Lanka Thailand Vanuatu Vietnam Others
Africa Algeria Congo Djibouti Ivory Coast Liberia Morocco Nigeria South Africa Sudan Tunisia Zambia Others
North America Canada United States
Latin America Argentina Brazil Chile Colombia Costa Rica Ecuador Mexico Peru Uruguay Venezuela Others
§Excluding figures for Taiwan.
74
Liabilities to banks outside Hong Kong
Denominated in foreign currencies
Denominated (HK dollar in HK dollars equivalent)
498
46 6
8
144 1 2
103 43
43 99
15
15
64,781 947
233 452 109 215
7 1,549
20,751 172 497
35
2
1,201 33,595
11 1,752
31 266 226
30 2,700
191 39
16
120
16
8,415 1
8,414 97
97
Claims on banks outside Hong Kong
Denominated in foreign currencies
Denominated (HK dollar in HK dollars equivalent)
303 23
52
3 5 8
76
19
3
114
11 4 7
46,240 1,154
6
556 222 20
287 490
7,413 176 252 175
111 326
7 3,433
14,926
15,383 2
154 228 191 728
726 181
1
103
5 356 32 16 23
9
27,609 2,854
24,7S5 2,397
945 545 163
70 58
467
6 138
5
$million
Claims on non-bank customers outside Hong Kong
Denominated in foreign currencies
Denominated (HK dollar in HK dollars equivalent)
431 43
47
80 10 47 30 3
21 10
31
27
82
56
56
955
38,741 3,175
2 1,166 1,491
56 1,518 5,057 1,763
125 2,572 1,692
153 688
2,990 593
8 10,905
451 3,577
1
758 3,390
113 15
32 2,469
43 185 514
14
5
2,931 1,471 1,460 4,618 1,008
929 80
125 2
51 1,600
21 39
758 5
Hong Kong Monthly Digest of Statistics April 1987

BANKING
7.15 DEPOSIT-TAKING COMPANIES: EXTERNAL LIABILITIES AND CLAIMS AT 31 DECEMBER 1986-contd.
$million
Liabilities to banks Claims on banks Claims on non-bank outside Hong Kong outside Hong Kong customers outside Hong Kong
Denominated Denominated Denominated in foreign in foreign in foreign currencies currencies currencies
Denominated (HK dollar Denominated (HK dollar Denominated (HK dollar in HK dollars equivalent) in HK dollars equivalent) in HK dollars equivalent)
Caribbean 598 18,460 68 7,576 46 7,749 Bahamas 86 13,744 57 416 7 Bermuda 11 81 30 420 Cayman Islands 512 4,466 6,729 14 617 Cuba 5 Jamaica 1 27 Netherlands Antilles 250 143 2 104 Panama 201 6,559 Trinidad and Tobago 15 Others
Middle East 20 1,338 114 1,099 364 Bahrain 168 111 336 4 Egypt 439 268 11 Iraq 155 23 Israel 59 103 32 Jordan 23 1 7 Kuwait 178 48 199 Libya 78 Oman 39 Saudi Arabia 47 10 Syria 47 6 United Arab Emirates 20 392 3 69 33 Yemen 22 Others 3
Western Europe 506 59,866 620 96,206 188 12,492 Austria 3 951 879 897 Belgium/Luxembourg 22 4,835 28 3,290 985 Cyprus 28 Denmark 18 309 448 826 Finland 1 16 763 527 France 1 1,768 5,143 174 Greece 8 622 94 Iceland 7 Italy 70 1,498 559 Netherlands 118 749 1,229 39 485 Norway 95 364 419 2 841 Portugal 105 343 Republic of Ireland 152 83 707 Spain 15 1,210 199 Sweden 14 241 2 176 54 681 Switzerland 29 115 19 272 914 Turkey 16 27 68 United Kingdom 205 47,225 567 65,342 91 1,773 Federal Republic
of Germany 3,032 4 14,034 2 2,325 Yugoslavia 638 10 Others 21 56
Eastern Europe 2,466 16 Czechoslovakia 225 German Democratic
Republic 175 Hungary 1,191 Poland 416 16 Romania 11 USSR 240 Others 208
Unallocated 68 152 C. Summary
International organizations 955 Countries 1,637 153,148 1,116 .184,319 721 70,301 Unallocated 68 152
Total 1,637 153,148 1,116 184,387 721 71,408
Hong Kong Monthly Digest of Statistics April 1987 75

FINANCE
7.16 EXCHANGE RATES AND THE EFFECTIVE EXCHANGE RATE INDEXES (Average figures)
Year/month U.S.
dollar Sterling Deutsche
mark Japanese Canadian Australian Singapore
yen dollar dollar dollar Dutch New Taiwan
guilder dollar Swiss franc
Chinese renm.inbi
Belgian Republic of franc Korea won
(Hong Kong dollars to one unit of foreign currency)
1981
1982
1983
1984
1985
1986
1985: Mar. Apr. May June July Aug. Sept. Oct. Nov. Dec.
1986: Jan. Feb. Mar. Apr. May June July Aug. Sept. Oct. Nov. Dec.
1987: Jan. Feb. Mar.
Year/month
1981
1982
1983
1984
1985
1986
1985! Mar. Apr. May June July Aug. Sept. Oct. Nov. Dec.
1986: Jan. Feb. Mar. Apr. May June July Aug. Sept. Oct. Nov. Dec.
1987: Jan. Feb. Mar.
5.593
6.072
7.273
7.818
7.791
7.803
7.801 7.789 7.775 7.768 7.754 7.790 7.807 7.789 7.803 7.8o6
7.808 7.804 7.811 7.796 7.808 7.810 7.812 7.799 7.802 7.800 7.797 7.793
7.771 7.794 \ 7.801·
French franc
1.04
0.93
0.96
0.9"0
0.88
1.13
0.78 0.84 0.82 0.84 0.88 0.92 0.90 0.97 0.99 1.02
1.05 1.10 1.13 1.09 I.I I 1.10 1.13 1.17 1.17 1.19 1.18 1.19
1.25 1.28 1.28
11.31
10.64
11.06
10.47
10.15
11.48
8.79 9.73 9.72
10.00 10.69 10.83 10.66 II.JO 11.27 11.33
11.16 11.19 11.49 11.71 11.89 11.79 11.82 11.62 11.51 11.17 11.13 11.22
11.69 11.91 12.44
Italian lira
0.0050
0.0045
0.0048
0.0045
0.0041
0.0053
0.0038 0.0040 0.0040 0.0040 0.0041 0.0042 0.0041 0.0044 0.0045 0.0046
0.0047 0.0050 0.0051 0.0051 0.0052 0.0051 0.0053 0.0055 0.0056 0.0057 0.0056 0.0057
0.0059 0.0061 0.0060
2.48
2.50
2.84
2.75
2.67
3.62
2.36 2.53 2.50 2.54 2.66 2.79 2.74 2.95 3.01 3.11
3.20 3.35 3.46 3.43 3.54 3.49 3.63 3.78 3.82 3.90 3.85 3.92
4.16 4.27 4.26
Thai baht
0.0254
0.0245
0.0307
0.0330
0.0330
0.0467
0.0303 0.0311 0.0309 0.0313 0.0322 0.0329 0.0330 0.0363 0.0383 0.0385.
0.0390 0.0424 0.0438 0.0447 0.0468 0.0466 0.0493 0.0507 0.0505 0.0500 0:0479 0.0481
0.0502 0.0508 0.0515
4.67
4.93
5.92
6.05
5.72
5.63
5.65 5.72 5.66 5.69 5.74 5.75 5.71 5.71 5.68 5.60
5.56 5.56 5.58 5.63 5.68 5.63 5.67 5.63 5.64 5.63 5.63 5.66
5.71 5.85 5.92
Indonesian rupiah
6.43
6.18
6.58
6.89
5.48
5.24
5.46 5.15 5.28 5.18 5.42 5.53 5.39 5.48 5.30 5.33
5.46 5.48 5.53 5.64 5.69 5.39"' 4.94 4.79 4.86 4.99 5.04 5.15
5.14 5.20 5.35
Philippine peso
(Hong Kong dollars to one unit of foreign currency)
0.262
0.270
0.321
0.335
0.291
0.301
0.281 0.288 0.286 0.287 0.291 0.295 0.292 0.298 0.301 0.297
0.297 0.299 0.299 0.299 0.301 0.300 0.302 0.303 0.303 0.303 0.302 0.302
0.304 0.305 0.305
0.0085
0.0088
0.0078
0.0075
0.0070
0.0062
0.0072 0.0072 0.0072 0.0070 0.0069 0.0068 0.0068 0.0069 0.0070 0.0070
0.0068 0.0066 0.0066 0.0067 0.0067 0.0067 0.0067 0.0068 0.0060 0.0052 0.0050 0.0050
0.0047 0.0047 0.0047
0.718
0.748
0.689
0.494
0.431
0.385
0.449 0.445 0.445 0.442 0.419 0.420 0.422 0.419 0.419 Q.415
0.412 0.369 0.380 0.382 0.384 0.383 0.384 0.384 0.382 0.384 0.384 0.382
0.378 0.373 0.369
2.65
2.85
3.45
3.67
3.55
3.59
3.46 3.53 3.51 3.50 3.51 3.53 3.51 3.65 3.71 3.69
3.68 3.66 3.62 3.57 3.53 3.53 3.58 3.62 3.61 3.59 3.57 3.57
3.62 3.65 3.65
Malaysian dollar
2.43
2.61
3.15
3.35
3.15
3.03
3.04 3.14 3.15 3.16 3.14 3.17 3.15 3.18 3.21 3.22
3.20 3.17 3.10 3.02 3.01 2.9"9 2.97 2.99 2.99 2.98 2.99 3.01
3.03 3.08 3.10
Note: Figures are average exchange rau,s for the respective periods d.erived from closin.g middl<>-market T/T rates . ..
76
2.25
2.28
2.55
2.44
2.37
3.20
\ 2.09 2.24 2.21 2.25 2.36 2.48 2.44 2.61 2.67 2.76
2.83 2.96 3.06 3.05 3.11 3.10 3.22 3.35 3.39 3.45 3.41 3.46
3.69 3.78 3.77
SDR
6.58867
6.70148
7.77462
8.01665
7.91967
9.16159
7.51811 7.71434 7.69416 7.74540 7.90869 8.05084 8.02948 8.29709 8.42791 8.50688
8.57175 8.81232 8.96957 8.96715 9.129"98 9.09610 9.29164 9.42518 9.44505 9.45181 9.34073 9.40970
9.72352 9.83772 9.90267
0.141,
0.146
0.174
0.185
0.188
0.203.
0.186 0.188 0.187 0.187 0.187 0.189 0.193 0.191 0.189 0.189
0.191 0.194 0.195 0.194 0.1% 0.205 0.204 0.212 0.213 0.212 0.209 0.212
0.214 0.218 0.221
2.87
3.00
3.47
3.34
3.21
4.37
2.78 3.02 2.97 3.02 3.21 3.40 3.34 . 3.59 3.67 3.71
3.78 4.00 4.11 4.11 4.21 4.24 4.47 4.69 4.72 4.76 4.63 4.68
4.96 5.05 5.08
3.2918
3.2129
3.6785
3.3984
2.6653
2.2707
2.7335 2.7473 2.7393 2.7239 2.7176 2.6926 2.6417 2.5536 2.4516 2.4516
2.4516 2.4337 2.4266 2.4271 2.4403 2.4403 2.1579 2.1089 2.1089 2.0997 2.0974 2.0974
2.0903 2.0838 2.0940
0.152
0.137
0.146
0.139
0.136
0.179
0.121 0.129 0.128 0.129 0.136 0.141 0.139 0.150 0.154 0.157
0.161 0.168 0.173 0.173 0.175 0.174 0.179 0.185 0.188 0.191 0.189 0.192
0.203 0.210 0.209
0.0082
0.0083
0.0093
0.0097
0.0090
0.0089
0.0092 0.0091 0.0089 0.0089 0.0089 0.0089 0.0088 0.0087 0.0088 0.0088
0.0088 0.0088 0.0088 0.0088 0.0088 0.0088 0.0088 0.0088 0.0089 0.0089 0.0090 0.0090
0.0090 0.0091 0:0092
Effective exchange rate indexes for the Hong Kong dollar (18.12.71=100)
calculated with trade weights 1981
Trade (import and export)-weighted
86.3
85.5
72.6
71.1
75.0
66.3
78.1 76.5 76.8 76.5 75.3 74.3 74.7 72.2 71.4 71.0
70.5 68.5 67.6 67.3 66.1 66.1 65.5 64.5 64.5 64.7 65.8 65.4
63.8 63.1 62.6
Importweighted
83.4
83.5
70.5
69.I
73.3
63.3
76.5 74.9 75.3 75.0 73.8 72.8 73.1 70.2 69.2 68.8
68.3 65.9 64.9 64.5 63.1 63.0 62.2 61.2 61.2 61.5 62.8 62.5
60.8 60.2 59.6
Exportweighted
W.5
88.3
75.7
74.0
77.4
70.7
80.2 78.7 79.0 78.7 77.5 76.5 76.9 75.1 74.6 74.1
73.7 72.3 71.5 71.5 70.6 70.7 70.4 69.6 69.5 69.4 70.1 69.7
68.2 67.5 67.1
Hong Kong Monthly Digest of Statistics April 1987

FINANCE
7.17 EXCHANGE RATES AND THE EFFECTIVE EXCHANGE RATE INDEXES (End of period figures)
As at end of year/month
U.S. dollar Sterling
Deutsche mark
Japanese yen
Canadian Australian Singapore dollar dollar dollar
Dutch New Taiwan guilder dollar
(Hong Kong dollars to one unit of foreign currency)
1981
1982
1983
1984
1985
1986
1985: Mar. Apr. May June July Aug. Sept. Oct. Nov. Dec.
1986: Jan. Feb. Mar. Apr. May June July Aug. Sept. Oct. Nov. Dec.
1987: Jan. Feb. Mar.
As at end of year/month
5.675
6.495
7.780
7.823
7.811
7.795
7.798 7.780 7.771 7.761 7.750 7.805 7.750 7.801 7.800 7.811
7.805 7.802 7.814 7.795 7.810 7.810 7.807 7.803 7.802 7.797 7.784 7.795
7.771 7.795 7.799
French franc
10.88
10.58
ll.32
9.11
ll.27
ll.48
9.76 9.77 9.95
10.18 II.I I 10.87 10.85* 11.26 ll.62 ll.27
11.09 11.46 ll.56 12.06 ll.52 12.01 11.68 11.67 11.29 10.99 11.20 11.48
11.99 12.09 12.56
Italian lira
2.52
2.73
2.86
2.49
3.18
4.01
2.55 2.53 2.52 2.56 2.77 2.77 2.89 2.97 3.10 3.18
3.29 3.51 3.36 3.58 3.36 3.56 3.72 3.85 3.85 3.80 3.95 4.01
4.35 4.27 4.34
Thai bah!
0.0260
0.0278
0.0337
0.0312
0.0390
0.0488
0.0312 0.0310 0.0309 0.0313 0.0329 0.0327 0.0358 0.0369 0.0385 0.0390
0.0407 0.0434 0.0435 0.0465 0.0448 0.0477 0.0507 0.0508 0.0508 0.0484 0.0481 0.0488
0.0516 0.0509 0.0537
4.80
5.29
6.26
5.94
5.60
5.67
5.73 5.71 5.65 5.72 5.74 5.73 5.67 5.71 5.64 5.60
5.49 5.50 5.58 5.67 5.65 5.63 5.66 5.64 5.64 5.63 5.64 5.67
5.82 5.86 5.96
Indonesian rupiah
6.44
6.38
7.02
6.49
5.34
5.19
5.49 5.11 5.15 5.21 5.67 5.50 5.52 5.47 5.36 5.34
5.59 5.46 5.57 5.76 5.60 5.30 4.65 4.77 4.91 5.02 5.08 5.19
5.14 5.28 5.52
Philippine peso
(Hong Kong dollars to one unit of foreign currency)
1981
1982
1983
1984
1985
1986
1985: Mar. Apr. May June July Aug. Sept. Oct. Nov. Dec.
1986: Jan. Feb. Mar. Apr. May June July Aug. Sept. Oct. Nov. Dec.
1987: Jan. Feb. Mar.
l.00
0.97
0.94
0.82
l.04
l.21
0.84 0.84 0.83 0.85 0.91 0.91 0.95 0.98 l.02 l.04
l.08 l.15 l.10 l.13 l.06 1.12 l.16 l.17 l.18 l.17 l.21 l.21
l.30 l.28 l.30
0.0048
0.0048
0.0047
0.0041
0.0047
0.0058
0.0040 0.0040 0.0040 0.0040 0.0042 0.0042 0.0044 0.0044 0.0046 0.0047
0.0049 0.0052 0.0050 0.0053 0.0050 0.0052 0.0055 0.0055 0.0056 0.0056 0.0057 0.0058
0.0061 0.0061 0.0061
Note: Figures are based on closing middle market T /T rates.
0.254
0.287
0.344
0.294
0.297
0.302
0.280 0.286 0.287 0.287 0.293 0.295 0.298 0.298 0.303 0.297
0.298 0.299 0.299 0.300 0.300 0.300 0.302 0.303 0.303 0.302 0.302 0.302
0.305 0.305 0.305
0.0083
0.0089
0.0077
0.0072
0.0070
0.0048
0.0072 0.0072 0.0070 0.0070 0.0068 0.0068 0.0068 0.0070 0.0070 0.0070
0.0066 0.0066 0.0067 0.0067 0.0067 0.0067 0.0067 0.0069 0.0052 0.0052 0.0050 0.0048
0.0047 0.0047 0.0047
tFigures refer to the last trading day of the month/year. Trading days do not include Saturdays.
Hong Kong Monthly Digest of Statistics April 1987
0.723
0.745
0.575
0.400
0.413
0.382
0.445 0.445 0.445 0.440 0.417 0.422 0.420 0.418 0.418 0.413
0.405 0.351 0.382 0.383 0.384 0.382 0.385 0.383 0.384 0.384 0.384 0.382
0.365 0.375 0.367
2.79
3.10
3.68
3.60
3.72
3.60
3.55 3.52 3.50 3.51 3.56 3.47 3.63 3.66 3.74 3.72
3.67 3.64 3.61 3.56 3.50 3.58 3.60 3.64 3.61 3.57 3.56 3.60
3.66 3.67 3.66
Malaysian dollar
2.55
2.82
3.35
3.24
3.24
3.01
3.11 3.16 3.15 3.14 3.16 3.17 3.18 3.20 3.23 3.24
3.17 3.15 3.05 3.04 2.97 2.99 2.99 3.01 2.99 2.98 3.01 3.01
3.08 3.12 3 12
2.31
2.47
2.55
2.21
2.82
3.55
2.27 2.24 2.23 2.27 2.47 2.47 2.55 2.63 2.76 2.82
2.90 3.10 2.98 3.17 2.99 3.17 3.30 3.41 3.41 3.36 3.50 3.55
3.86 3.78 3.85
. 0.143
0.155
0.184
0.184
0.189
0.213
0.187 0.187 0.187 0.187 0.187 0.192 0.193 0.190 0.189 0.189
0.195 0.195 0.198 0.195 0.204 0.204 0.204 0.213 0.213 0.208 0.211 0.213
0.215 0.219 0.227
SDRt
6.60547
7.16470
8.14527
7.66814
8.57976
9.53415
7.72995 7.71132 7.71621 7.74766 8.03962 8.08098 8.20392 8.35994 8.52688 8.57976
8.67253 9.01729 8.91692 9.16661 8.92564 9.19682 9.39736 9.41736 9.46710 9.25200 9.42340 9.53415
9.95028 9.84298
10.02663
Swiss franc
3.17
3.25
3.57
3.02
3.77
4.79
3.03 3.01 2.98 3.06 3.39 3.37 3.52 H2 3.75 3.77
3.87 4.15 4.01 4.28 4.04 4.35 4.64 4.77 4.75 4.58 4.75 4.79
5.18 5.08 5.20
Chinese renminbi
3.2468
3.3557
3.9526
2.8178
2.4516
2.0974
2.7473 2.7473 2.7495 2.7197 2.6926 2.6926 2.6330 2.4516 2.4516 2.4516
2.4516 2.4266 2.4266 2.4403 2.4403 2.4403 2.1089 2.1089 2.1089 2.0974 2.0974 2.0974
2.0838 2.0838 2.0965
Belgian Republic of franc Korea won
0.153
0.143
0.142
0.127
0.161
0.196
0.131 0.128 0.128 0.131 0.145 0.141 0.148 0.152 0.158 0.161
0.156 0.176 0.168 0.180 0.168 0.177 0.182 0.186 0.190 0.187 0.194 0.196
0.212 0.210 0.213
0.0081
0.0086
0.0098
0.0095
0.0088
0.0091
0.0092 0.0090 0.0089 0.0089 0.0088 0.0088 0.0087 0.0087 0.0088 0.0088
0.0088 0.0088 0.0088 0.0088 0.0088 0.0088 0.0088 0.0089 0.0089 0.0089 0.0090 0.0091
0.0091 0.0091 0.0092
Effective exchange rate indexes for the Hong Kong dollar (18.12.71~100)
calculated with trade weights 1981
Trade (import and export)-weighted
85.2
79.5
68.3
75.9
70.6
64.8
76.2 76.6 76.7 76.4 74.4 74.5 72.6 72.2 70.9 70.6
69.5 67.7 68.0 66.0 67.4 65.4 64.9 64.3 64.4 65.8 65.4 64.8
62.7 62.9 61.4
Importweighted
82.3
77.3
66.0
74.3
68.4
61.9
74.7 75.I 75.2 74.9 72.8 73.0 70.5 70.2 68.7 68.4
67.l 65.0 65.2 63.l 64.4 62.2 61.5 61.0 61.0 62.7 62.5 61.9
59.7 60.0 58.2
Exportweighted
89.4
82.7
71.6
78.I
73.7
69.1
78.4 78.8 78.9 . 78.5 76.5 76.6 75.5 75.1 74.0 73.7
73.0 71.5 72.0 70.4 71.8 70.I 70.0 69.3 69.4 70.3 69.6 69.1
67.l 67.3 66.2
77

FINANCE
7.18 EXCHANGE RATES AND THE EFFECTIVE EXCHANGE RATE INDEXES IN MARCH 1987
As at end U.S. Deutsche Japanese Canadian Australian Singapore Dutch New Taiwan Swiss Chinese Belgian Republic of of day dollar Sterling mark yen dollar dollar dollar guilder dollar franc renminbi franc Korea won
March (Hong Kong dollars to one unit of foreign currency)
2 7.800 12.13 4.27 0.0509 5.86 5.30 3.66 3.78 0.219 5.08 2.0838 0.210 0.0091 3 7.800 12.27 4.25 0.0508 5.86 5.26 3.66 3.76 0.219 5.05 2.0838 0.209 0.0091 4 7.799 12.22 4.27 0.0509 5.86 5.30 3.66 3.78 0.219 5.07 2.0838 0.210 0.0091 5 7.800 12.25 4.24 0.0508 5.86 5.30 3.67 3.75 0.219 5.04 2.0838 0.206 0.0091 6 7.802 12.34 4.26 0.0508 5.86 5.29 3.66 3.77 0.219 5.06 2.0838 0.209 0.0091 7 7.801 12.39 4.23 0.0508 5.86 5.29 3.65 3.75 0.219 5.02 2.0965 0.208 0.0091
9 7.802 12.37 4.23 0.0508 5.85 5.30 3.65 3.74 0.219 5.01 2.0965 0.208 0.0091 10 7.804 12.38 4.20 0.0508 5.85 5.34 3.64 3.72 0.219 4.98 2.0965 0.207 0.0091 11 7.803 12.41 4.21 0.0509 5.86 5.34 3.65 3.72 0.219 5.00 2.0965 0.206 0.0091 12 7.804 12.46 4.19 0.0508 5.93 5.37 3.64 3.70 0.219 4.99 2.0965 0.205 0.0091 13 7.804 12.39 4.21 0.0509 5.93 5.31 3.64 3.73 0.219 5.02 2.0965 0.206 0.0091 14 7.802 12.34 4.22 0.0512 5.91 5.28 3.65 3.74 0.219 5.03 2.0965 0.207 0.0091
16 7.801 12.33 4.24 0.0512 5.93 5.31 3.65 3.75 0.221 5.06 2.0965 0.208 0.0091 17 7.804 12.46 4.26 0.0516 5.95 5.36 3.66 3.77 0.221 5.09 2.0965 0.209 0.0092 18 7.803 12.56 4.25 0.0514 5.96 5.36 3.65 3.76 0.221 5.08 2.0965 0.209 0.0092 19 7.799 12.54 4.25 0.0514 5.94 5.33 3.65 3.76 0.221 5.08 2.0965 0.209 0.0092 20 7.802 12.49 4.27 0.0515 5.95 5.37 3.65 3.78 0.221 5.09 2.0965 0.209 0.0092 21 7.803 12.55 4.27 0.0516 5.97 5.36 3.65 3.78 0.221 5.10 2.0965 0.210 0.0092
23 7.803 12.57 4.29 0.0518 5.98 5.36 3.66 3.80 0.221 5.12 2.0965 0.210 0.0092 24 7.799 12.67 4.31 0.0525 5.99 5.41 3.67 3.82 0.221 5.16 2.0965 0.211 0.0092 25 7.799 12.59 4.27 0.0522 5.98 5.42 3.66 3.78 0.223 5.11 2.0965 0.210 0.0092 26 7.802 12.53 4.26 0.0523 5.96 5.40 3.66 3.77 0.223 5.11 2.0965 0.209 0.0092 27 7.800 12.54 4.28 0.0524 5.98 5.44 3.65 3.79 0.223 5.12 2.0965 0.210 0.0092 28 7.800 12.58 4.30 0.0531 5.99 5.45 3.66 3.80 0.225 5.16 2.0965 0.211 0.0092
30 7.799 12.61 4.33 0.0534 6.00 5.49 3.67 3.83 0.227 5.19 2.0965 0.213 0.0092 31 7.799 12.56 4.34 0.0537 5.96 5.52 3.66 3.85 0.227 5.20 2.0965 0.213 0.0092
,,, Effective exchange_ rate indexes for the Hong Kong dollar (18.12.71=100)
calculated with trade weights 1981
As at end French Italian Thai Indonesian Philippine Malaysian Trade (import and Import· Export· of day franc lira baht rupiah peso dollar SDR export)-weighted weighted weighted
March (Hong Kong dollars to one unit of foreign currency)
2 1.28 0.0061 0.305 0.0047 0.375 3.11 9.86840 62.9 60.0 67.3 3 1.28 . 0.0060 0.305 0.0047 0.375 3.11 9.85475 63.0 60.1 67.4 4 1.28 0.0061 0.305 0.0047 0.370 3.11 9.86308 62.9 60.0 67.3 5 1.28 0.0060 0.305 0.0047 0.370 3.10 9.84446 63.0 60.1 67.4 6 1.28 0.0060 0.305 0.0047 0.370 3.10 9.87218 63.0 60.1 67.3 7 1.27 0.0060 0.305 0.0047 0.370 3.10 63.0 60.1 67.4
9 1.27 0.0060 0.305 0.0047 0.370 3.10 9.84238 63.0 60.1 67.4 10 1.26 0.0060 0.305 0.0047 0.370 3.10 9.82922 63.1 60.2 67.5 11 1.27 0.0060 0.305 0.0047 0.370 3.09 9.83638 63.0 60.1 67.4 12 1.26 0.0060 0.305 0.0047 0.370 3.09 9.83476 63.1 60.1 67.5 13 1.27 0.0060 0.305 0.0047 0.370 3.09 9.83351 63.0 60.1 67.4 14 1.27 0.0060 0.305 0.0047 0.370 3.10 62.9 59.9 67.3
16 1.27 0.0060 0.305 0.0047 0.370 3.10 9.87068 62.8 59.8 67.2 17 1.28 0.0060 0.305 0.0047 0.367 3.11 9.91061 62.6 59.6 67.0 18 1.28 0.0060 0.305 0.0047 0.367 3.10 9.90146 62.6 59.6 67.0 19 1.28 0.0060 0.305 0.0047 0.367 3.11 9.90426 62.6 59.6 67.1 20 1.28 0.0060 0.305 0.0047 0.367 3.11 9.91197 62.6 59.6 67.0 21 1.28 0.0061 0.305 0.0047 0.367 3.10 62.5 59.5 67.0
23 1.29 0.0061 0.305 0.0047 0.367 3.11 9.95702 62.4 59.4 66.8 24 1.30 0.0061 0.305 0.0047 0.367 3.12 9.99325 62.0 59.0 66.6 25 1.29 0.0060 0.305 0.0047 0.367 3.11 9.96268 62.2 59.1 66.8 26 1.28 0.0060 0.305 0.0047 0.370 3.11 9.94232 62.2 59.1 66.8 27 1.29 0.0061 0.305 0.0047 0.370 3.10 9.97066 62.1 59.1 66.8 28 1.29 0.0061 0.305 0.0047 0.370 3.11 61.8 58.6 66.5
30 1.30 0.0061 0.305 0.0047 0.370 3.12 10.02686 61.5 58.4 66.3 31 1.30 0.0061 0.305 0.0047 0.367 3.12 10.02663 61.4 58.2 66.2
Note: Figures are based on closing middle market T/T rates.
78 Hong Kong Monthly Digest of Statistics April 1987

FINANCE
7.19 INDEX OF SHARE PRICES AND VALUE OF STOCK EXCHANGE TURNOVER
Hang Seng Index and Sub-indices (31.7.64= 100) Hong Kong Index Total turnovert (2.4.86 = 1 OOO) ($million)
Sectoral Sub-indices Hang Seng Commerce
Year/month Index Finance Utilities Properties and industry
1981 1 506.84 105,986.85
1982 1 105.79 46,229.87
1983 933.03 37,164.68
1984 1 008.54 991.86 1 128.80 1 063.54 910.54 48,786.98
1985 1 567.56 1 290.40 1 902.98 1 952.31 1 376.60 75,808.05
1986 1 960.06 1 379.74 2 659.87 2 435.92 1 759.33 1 293.76t 123,128.01
1985: Mar. 1 382.04 1 254.82 1 638.99 1 608.58 1 199.61 5,346.28 Apr. 1 520.56 1 306.48 1 740.48 1 895.51 1 350.81 6,572.48 May 1 613.87 1 404.89 1 942.58 1 976.05 1 378.75 7,846.84 June 1 570.61 1 301.15 1 954.00 1 940.44 1 351.65 6,093.16 July 1 680.62 1 335.09 2 090.42 2 130.10 1 466.11 6,622.44 Aug. 1 656.10 1 300.54 1 977.50 2 129.89 1 491.15 5,507.75 Sept. 1 511.80 1 144.71 1 866.67 1 993.07 1 332.21 3,856.04 Oct. 1 665.39 1 254.85 2 046.28 2 217.65 1 466.12 5,353.24 Nov. 1 716.95 1 314.68 2 168.81 2 192.75 1511.77 7,093.43 Dec. 1 752.45 1 310.49 2 223.05 2 244.54 1 561.54 4,147.31
1986: Jan. 1 695.78 1 308.79 2 277.77 2 056.42 1 465.59 5,459.47 Feb. 1 695.30 1 302.93 2 268.42 2 025.95 I 493.51 3,495.04 Mar. 1625.94 1 259.47 2 186.42 I 929.70 I 424.53 5,164.09 Apr. I 836;99 1 411.15 2 434.93 2 131.38 1 668.81 I 141.63 9,350.33 May I 787.96 1 313.96 2 452.38 2 097.74 I 613.03 I 111.53 8,033.33 June I 739.11 I 271.23 2 380.47 2 036.12 I 578.33 I 086.02 4,978.36 July I 855.46 I 277.18 2 579.22 2 214.20 I 700.59 I 158.35 8,486.57 Aug. I 913.00 I 294.94 2 601.60 2 354.61 I 762.68 I 199.84 9,836.58 Sept. 2 068.44 I 383.29 2 820.74 2 668.25 I 855.27 1 303.21 11,433.09 Oct. 2 315.63 I 476.77 3 244.04 3 021.07 2 072.73 I 465.95 23,125.18 Nov. 2 418.75 1 550.05 3 262.74 3 262.08 2 172.54 I 538.81 14,577.09 Dec. 2 568.30 1 707.11 3 409.75 3 433.48 2 304.32 I 638.52 19,188.88
1987: Jan. 2 553.25 1 784.32 3 214.05 3 484.86 2 283.92 1 637.62 21,691.02 Feb. 2 877.87 1 947.84 3 650.58 4 011.18 2 568.96 I 841.20 28,260.26 Mar. 2 713.81 1 842.62 3 301.43 3 820.91 2 468.73 I 748.83 23,772.52
Note: Monthly indexes refer to the positions as at end of month and annual indexes are monthly averages. t As from April 1986 onwards, figures refer to the tradings of The Stock Exchange of Hong Kong Ltd. which, being an amalgamation of the four former stock exchange companies, i.e. Hong Kong Stock
Exchange Ltd., Far East Exchange Ltd., Kam Ngan Stock Exchange Ltd. and Kowloon Stock Exchange Ltd., has started business since 2 April 1986. Figures prior to April 1986 were total tradings of the four stock exchange companies before the amalgamation.
tFigures for April to December.
7.20 INDEX OF SHARE PRICES AND VALUE OF STOCK EXCHANGE TURNOVER IN MARCH 1987
Hang Seng Index and Sub-indices (31.7.64= 100) Hong Kong Index Total turnover (2.4.86 =I OOO) ($million)
Sectoral Sub-indices As at Hang Seng Commerce end of day Index Finance Utilities Properties and industry
March 2 2 894.26 I 955.58 3 675.40 4 032.10 2 584.85 I 850.95 1,061.47 3 2 939.05 I 984.05 3 748.04 4 022.67 2 649.95 I 880.09 1,055.37 4 2 890.93 1 954.79 3 624.00 3 973.98 2 626.30 I 849.68 1,857.40 5 2 798.44 I 893.58 3 489.70 3 854.36 2 546.71 I 791.70 1,327.97 6 2 798.64 I 906.34 3 470.47 3 854.91 2 547.20 1 792.71 1,702.02
9 2 820.38 1 939.49 3 500.39 3 891.52 2 550.05 I 805.94 1,113.84 10 2 731.05 1 882.07 3 393.51 3 755.68 2 470.09 I 750.29 1,045.54 11 2 760.90 1 828.16 3 416.53 3 867.73 2 524.25 I 766.89 1,634.53 12 2 750.14 I 842.06 3 407.44 3 853.50 2497.54 I 762.53 952.33 13 2 721.17 1 837.53 3 368.45 3 798.78 2 468.57 I 744.75 700.26
16 2 669.57 1 808.37 3 290.19 3 698.50 2 436.73 I 708 .. 31 802.27 17 2 629.28 I 790.36 3 239.37 3 648.73 2 391.20 I 685.31 740.93 18 2 724.01 I 841.68 3 345.37 3 806.91 2 480.20 I 746.22 913.37 19 2 721.28 I 850.04 3 334.03 3 798.63 2 476.11 1 745.60 860.61 20 2 780.55 I 901.25 3 386.75 3 906.47 2 520.72 1 784.17 958.16
23 2 813.40 I 932.62 3 392.77 3 941.65 2 564.73 I 806.07 1,169.12 24 2 828.07 I 936.39 3 440.52 3 966.66 2 566.67 I 818.24 938.69 25 2 831.50 I 940.64 3 433.39 3 995.67 2 563.27 I 822.99 1,183.22 26 2 783.12 I 886.02 3 387.32 3 930.21 2 527.67 1 792.28 759.80 27 2 798.74 I 927.30 3 403.75 3 906.91 2 540.76 I 802.27 1,010.74
30 2 774.88 I 898.13 3 366.27 3 904.29 2 519.32 I 789.44 999.30 31 2 713.81 1 842.62 3 301.43 3 820.91 2 468.73 I 748.83 985.59
Hong Kong Monthly Digest of Statistics April 1987 79
L_

FINANCE
7.21 CLOSING PRICES OF FUTURES EXCHANGE AND TURNOVER IN MARCH 1987
As at end of day
March
2
4
10
11
12
13
16
17
lS
19
20
23
24
25
26
27
30
31
As at end of day
March
4
10
11
12
13
16
17
lS
19
20
23
24
25
26
27
30
31
Turnover Lots Value
(H.K. (H.K. $50 x HSI) $'000)
10 775
9 S24
1409S
1,603,435
l,464,91S
2,103,554
19 219 2,S02,543
23 469 3,329,333
17 144
14 5S2
20 555
12 247
s S80
12002
14 973
15 S61
14 768
15 210
15 309
12 971
11 517
14 765
13 276
2,47S,202
2,070,6S4
2,S72,320
1,718,784
1,235,774
1,643,873
2,017,581
2,152,058
2,029,399
2,122,S54
2,178,309
l,S51,S33
1,657,208
2,092,617
1,S73,669
15 176 2,135,0SS
16 760 2,319,511
Turnover Lots Value
(30 OOO (H.K. kg. each) $'000)
655 34,26S
1 319 69,651
739 3S,701
l 221 65,250
2 277 124,472
707 38,250
2 5SO l3S,306
S15 43,832
l 1S4 64,371
2 397 12S,3S5
3432
948
S70
699
S21
190,727
52,499
4S,066
39,020
45,6SS
612 34,059
440 24,417
1 197 66,883
1 3S3 75,016
964 52,449
633 35,263
439 24,454
S7 Mar.
103.00
104.00
103.20
104.00
105.00
106.40
107.00
lOS.20
106.20
104.SO
Hang Seng Index Futures
S7 Mar.
2 967
3 002
2 943
2 SlS
2S44
2 S74
2 799
2 797
2 7S2
2 759
2 6S7
2 640
2 724
2 724
2 7S7
2 S36
2 S36
2 S43
2 790
2 799
2 774
Soybeans
Delivery months
S7 S7 Apr. May
3 004
3 043
2987
2SS4
2 S95
291S
2 S42
2 S35
2 Sl3
2 7S2
2 722
2 675
2 753
2 760
2 S21
2 S72
2 S6S
2 S74
2 S20
2 S20
2 SOS
2 732
3 040
3 076
3 025
2 924
2 940
2 962
2 SS6
2 S67
2 S45
2 Sl2
2 750
2 715
2 7S5
2 793
2 S54
2 910
2 904
2 904
2 S54
2 S4S
2 S36
2 759
Closing prices§ (H.K. dollars/60 kg.) Delivery months
S7 S7 S7 S7 87 Apr. May June July Aug.
l05c00
107.60
107.SO
109.40
110.40
110.20
108.00
lOS.00
109.00
110.40
111.40
112.00
112.SO
112.20
112.SO
112.20
111.80
112.20
106.40
109.20
109.SO
110.00
106.40
107.60
107.60
107.60
107.SO
107.80
107.60
107.20
lOS.20
109.20
110.60
112.20
111.40
111.40
112.00
112.00
112.00
112.00
112.40
Ill.SO
112.60
112.00
105.00
106.00
106.00
106.20
106.SO
106.40
107.00
107.00
109.00
109.00
110.60
111.00
110.60
110.60
Ill.SO
111.40
110.60
110.60
110.60
110.SO
112.20
Ill.SO
106.40
106.SO
105.20
105.60
107.00
106.SO
107.60
107.20
108.80
lOS.SO
109.20
109.40
110.00
110.00
110.40
106.20
106.40
105.40
105.60
106.SO
107.20
107.60
107.80
108.40
lOS.00
109.40
lOS.60
109.00
109.SO
110.00
110.20 110.00
109.SOb 109.SO
110.40
110.60
111.00
111.60
111.60
110.00
110.60
111.00
111.20
111.20
S7 June
2 7S5
Turnover Lots
(l 12 OOO lb. each)
3 350
3 776
1666
995
SS5
1609
l 69S
l 560
935
953
919
3 175
l 29S
1906
741
l 023
619
4276
1 955
7S6
3 576
1149
Turnover Lots Value
Value (U.S.
$'000)
32,26S
37,434
l6,0S5
9,633
S,537
15,S16
16,198
15,123
8,S43
9,095
8,743
2S,705
ll,Sl6
17,331
6,S5S
9,515
5,641
36,593
16,936
6,90S
29,37S
9,782
S7 May
S.40
S.55
S.40
S.30
8.29
S.51
S.25
S.2S
S.14
S.16
S.20b
7.91
7.71
7.69
7.S4
7.SO
7.7S
7.50
7.28
7.29
6.S3
6.91
Sugar
Closing prices§ (U.S. cents/lb.) Delivery months
S7 S7 S7 July Sept. Oct.
S.35
8.65
8.36
S.55
S.40
S.49
8.21
8.3S
S.21
S.23
S.23
7.81
7.9S
7.S5
7.99
7.92
7.92
7.43
7.41
7.43
6.90
7.15
Gold
S.43
8.64
S.46
8.59
8.46
S.51
S.25
S.39
S.20
8.30
S.22
7.S9
7.9S
7.87
S.07
S.03
7.9S
7.53
7.50
7.59
7.11
7.14
S.46
S.67
S.53
S.59
S.43
S.50
S.30
S.43
S.30
S.40
S.36
7.S6
S.01
7.99
S.11
S.10
S.02
7.50
7.65
7.74
7.35
7.42
Closing prices§ (U.S. dollars/troy oz.) Delivery months
S7 (100 troy (U.S. S7 Mar.
S7 S7 S7 S7 S7 Sept. oz. each) $'000) Apr. May June Aug. Oct.
110.20
lOS.80
109.20
109.60
110.00
111.60
110.60
110.60
111.40
111.60
Ill.SO
111.40
24
26
28
24
26
2S
24
26
28
24
26
2S
24
26
2S
24
26
28
24
26
2S
28
992 406.00 408.00
l,OSl 406.50 40S.OO
l,174 40S.50 410.50
l,020 412.50 414.50
1,075 409.50 411.00
409.50
40S.50
410.00
409.00 411.00 416.00
409.50 412.00 . 416.00
411.50 413.50 418.00
415.50 41S.OO 421.50
412.50 415.50 419.00
410.50
409.50
411.50
l,lSl
1,023
1,072
1,182
1,006
407.50
406.50
408.50
410.00
410.50
412.00 . 413.00
412.00 413.50
413.00
412.00
414.50
415.50
416.00
411.50
413.00
413.00
411.50
412.00
412.50
416.50
418.50
417.00
420.50
416.50
416.00
41S.OO
419.00
420.00
416.00
416.50
417.00
416.00
415.50
416.50
421.00
422.00
421.00
425.00
1,090
1,1S7
999
1,090
l,1S5
406.50
407.50
407.50
406.50
406.50
408.50
409.50
409.00
40S.50
408.50
409.50
410.50
410.50
409.50
409.50
998 407 .00 40S.50 410.00
l,103 411.50 413.50 414.50
1,203 413.00
1,009 411.50
1,111 415.50
1,235 423.50
1,196 421.00
415.00
413.00
417.50
425.50
421.00
416.00
414.50
418.50
426.50
422.00
429.00
424.00
432.50
429.00
421.50
422.50
424.50
42S.50
425.00
423.00
421.50
424.00
426.00
426.50
422.00
423.00
423.50
422.00
422.00
423.00
427.00
428.50
427.50
431.00
439.00
434.50
SS Jan.
S.6S
S.79
S.62
8.65
S.67
S.65
S.46
S.56
8.28
8.36
S.34
7.S8
7.93
8.05
S.25
S.13
s.os 7.SO
7.96
7.83
7.48
7.65
S7 Dec.
425.00
425.50
427.50
431.50
428.50
427.00
425.50
427.50
429.00
429.50
426.00
426.50
426.50
426.00
425.50
SS Mar.
S.95
9.16
9.00
S.S6
8.96
S.S7
S.73
S.75
S.65
S.76
S.75
8.34
S.43
S.30
S.49
S.44
S.40
7.72
7.99
S.04
7.60
7.80
SS Feb.
429.50
430.00
432.00
436.00
433.00
431.50
431.00
432.50
434.00
434.50
430.50
432.00
431.50
430.50
431.00
426.00 431.00
431.00 435.50
432.00
430.50
435.00
442.50
438.00
437.50
435.50
439.50
448.00
443.00
§Official prices compiled by the Clearing House for settlement purposes, and based on the last bid and asked prices at the end of each day's trading. •a' denotes asked price and 'b' denotes bid price. tExpired.
80 Hong Kong Monthly Digest of Statistics April 1987

FINANCE
7.22 GOLD AND SILVER EXCHANGE TRADING PRICES
Gold ($/tael) Silver ($/ 10 oz.)
Year/month Opening Closing High Low Opening Closing High Low
1981 3,611.00 2,714.00 3,663.00 2,651.00 780.00 465.00 835.00 450.00
1982 2,702.00 3,492.00 3,655.00 2,105.00 470.00 710.00 725.00 295.00
1983 3,500.00 3,569.00 4,750.00 3,030.00 710.00 695.00 1,110.00 660.00 1984 3,565.00 2,891.00 3,767.00 2,810.00 695.00 500.00 780.00 495.00 1985 2,869.00 3,040.50 3,236.00 2,649.00 500.00 455.00 520.00 430.00
1986 3,055.00 3,629.00 4,095.00 3,030.50 455.00 411.00 490.00 380.00
1985: Mar. 2,679.00 3,070.00 3,236.00 2,669.00 440.00 520.00 520.00. 430.00 Apr. 3,081.00 3,013.00 3,104.00 2,907.00 520.00 500.00 520.00 480.00 May ' 2,938.00 2,904.00 3,011.00 2,877.00 480.00 475.00 505.00 470.00 June 2,930.00 2,929.00 3,023.00 2,901.00 475.00 475.00 500.00 470.00 July 2,930.00 3,019.00 3,026.00 2,873.00 475.00 490.00 490.00 460.00 Aug. 3,011.00 3,110.00 3,176.00 2,967.00 490.00 485.00 500.00 480.00 Sept. 3,113.00 3,037.00 3,128.00 2,933.00 485.00 470.00 485.00 460.00 Oct. 2,995.00 3,032.00 3,074.00 2,995.00 470.00 480.00 495.00 470.00 Nov. 3,011.00 3,016.50 3,091.00 3,001.00 475.00 475.00 490.00 470.00 Dec. 3,014.00 3,040.50 3,046.50 2,945.00 475.00 455.00 475.00 450.00
1986: Jan. 3,055.00 3,274.00 3,364.00 3,030.50 455.00 475.00 490.00 450.00 Feb. 3,235.00 3,134.00 3,264.00 3,083.00 470.00 440.00 475.00 440.00 Mar. 3,144.00 3,207.00 3,307.00 3,130.00 440.00 440.00 455.00 435.00 Apr. 3,110.00 3,189.50 3,214.00 3,092.00 400.00 395.00 430.00 390.00 May 3,199.00 3,183.00 3,202.50 3,153.00 400.00 410.00 410.00 380.00 June 3,181.00 3,208.00 3,244.00 3,140.00 410.00 390.00 420.00 390.00 July 3,205.00 3,276.00 3,301.50 3,186.00 400.00 391.00 400.00 390.00 Aug. 3,342.00 3,575.00 3,629.00 3,301.00 398.00 401.00 433.00 398.00 Sept. 3,582.00 3,906.00 4,085.00 3,574.00 401.00 429.00 467.00 401.00 Oct. 3,930.00 3,759.00 4,095.00 3,724.00 435.00 444.00 452.00 432.00 Nov. 3,738.00 3,627.00 3,824.00 3,511.00 441.00 420.00 454.00 406.00 Dec. 3,640.00 3,629.00 3,670.00 3,561.00 420.00 411.00 427.00 411.00
1987: Jan. 3,738.00 3,757.00 3,907.00 3,711.00 420.00 430.00 440.00 418.00 Feb. 3,738.00 3,765.00 3,778.00 3,644.00 426.00 422.00 433.00 420.00 Mar. 3,759.00 3,894.00 3,968.00 3,749.00 422.00 490.00 490.00 422.00
7.23 GOLD AND SILVER EXCHANGE TRADING PRICES IN MARCH 1987
Gold ($/tael) Silver($/ 10 oz.)
Date Opening Closing High Low
March
2 3,759.00 3,766.00 3,766.00 3,756.00 422.00 3 3,752.00 3,757.00 3,757.00 3,749.00 425.00 4 3,776.00 3,778.00 3,782.00 3,773.00 426.00 5 3,800.00 3,810.00 3,810.00 3,800.00 427.00 6 3,792.00 3,792.00 3,793.00 3,788.00 433.00 7 3,777.00 3,778.00 3,778.00 3,774.00 434.00
9 3,776.00 3,775.00 3,778.00 3,773.00 434.00 10 3,768.00 3,768.00 3,768.00 3,763.00 434.00 11 3,779.00 3,785.00 3,787.00 3,778.00 433.00 12 3,783.00 3,799.00 3,800.00 3,783.00 433.00 13 3,803.00 3,807.00 3,810.00 3,802.00 440.00 14 3,761.00 3,767.00 3,767.00 3,761.00 436.00
16 3,765.00 3,768.00 3,771.00 3,765.00 436.00 17 3,772.00 3,779.00 3,784.00 3,772.00 434.00 18 3,777.00 3,783.00 3,784.00 3,777.00 433.00 19 3,773.00 3,767.00 3,774.00 3,766.00 435.00 20 3,773.00 3,773.00 3,774.00 3,772.00 434.00 21 3,774.00 3,775.00 3,776.00 3,774.00 432.00
23 3,778.00 3,783.00 3,784.00 3,777.00 432.00 24 3,814.00 3,812.00 3,822.00 3,812.00 447.00 25 3,834.00 3,831.00 3,836.00 3,828.00 458.00 26 3,833.00 3,818.00 3,833.00 3,818.00 459.00 27 3,824.00 3,853.00 3,855.00 3,824.00 462.00 28 3,912.00 3,911.00 3,916.00 3,903.00 483.00
30 3,947.00 3,936.00 3,968.00 3,936.00 483.00 31 3,916.00 3,894.00 3,916.00 3,886.00 490.00
Hong Kong Monthly Digest of Statistics April 1987 81

SECTION 8 PRICES AND RETAILING
8.1 AVERAGE RETAIL PRICES OF SELECTED FOODSTUFFS
$per kilogram, except where otherwise stated
Rice Meat and poultry Marine fish, fresh Top Middle and Pork, Pork Beef, best Beef, belly Chicken, Duck, Golden Mac-
Year/month grade low grade best cut chop quality flesh top grade top grade thread kerel Garoupa
1981 4.04 3.79 17.20 22.75 25.13 13.40 20.04 14.24 15.50 19.62 37.43 1982 4.20 3.95 19.94 26.06 27.23 14.10 22.43 14.19 16.74 21.34 40.67 1983 4.42 4.09 22.12 28.51 28.03 14.45 22.84 15.99 18.71 25.41 43.46 1984 4.70 4.36 23.52 30.14 30.92 16.22 26.36 16.85 17.36 24.39 45.48 1985 4.65 4.31 21.75 27.99 30.34 15.84 23.41 15.21 17.70 24.52 46.63 1986 4.65 4.26 20.84 26.74 30.50 15.83 22.96 14.33 19.11 28.38 50.24
1985: Mar. 4.66 4.33 21.88 28.27 30.34 16.09 26.34 16.49 17.23 23.74 47.19 Apr. 4.65 4.32 21.68 28.04 30.37 16.06 23.50 15.03 17.11 23.30 41.83 May 4.65 4.30 21.45 27.93 30.21 15.86 22.09 13.86 17.15 23.20 38.63 June 4.65 4.30 21.73 27.94 30.23 15.67 24.50 14.42 19.56 26.14 44.41 July 4.65 4.30 22.04 28.13 30.26 15.64 23.38 16.30 18.54 28.54 46.69 Aug. 4.63 4.28 21.96 28.11 30.37 15.56 22.16 17.53 18.12 24.34 45.97 Sept. 4.63 4.30 21.89 27.88 30.37 15.53 23.64 18.54 19.41 26.79 59.43 Oct. 4.63 4.30 21.71 27.89 30.39 15.72 22.34 15.23 18.54 26.06 55.31 Nov. 4.61 4.28 21.21 27.56 30.36 15.84 20.78 13.28 16.65 23.91 47.45 Dec. 4.63 4.28 21.00 27.41 30.32 15.89 21.35 13.87 17.51 24.49 45.92
1986: Jan. 4.65 4.30 21.02 27.28 30.39 15.96 21.89 13.71 17.26 24.44 46.73 Feb. 4.65 4.32 21.63 27.50 30.37 15.87 25.79 13.62 18.22 28.72 51.72 Mar. 4.65 4.32 20.93 26.90 30.46 15.86 21.74 12.02 17.87 27.71 47.26 Apr. 4.65 4.32 20.65 26.64 30.39 15.81 21.25 13.10 17.66 25.84 44.54 May 4.65 4.32 20.82 26.54 30.52 15.69 22.49 15.23 19.69 27.71 42.96 June 4.65 4.32 21.20 26.89 30.49 15.64 25.05 14.55 19.97 28.89 47.87 July 4.65 4.32 21.26 27.08 30.54 15.66 23.68 14.24 19.79 31.25 51.01 Aug. 4.65 4.32 21.26 27.18 30.54 15.63 22.09 15.58 19.73 31.80 54.28 Sept. 4.66§ 4.17§ 20.34§ 26.24§ 30.61§ 15.71§ 23.38 16.24 19.35 31.15 54.66 Oct. 4.66 4.18 20.24 26.19 30.56 15.92 22.09§ 15.74§ 21.16§ 28.14§ 56.37§ Nov. 4.65 4.13 20.32 26.21 30.56 16.09 22.62 14.14 19.35 27.51 54.68 Dec. 4.65 4.13 20.40 26.22 30.54 16.09 23.48 13.79 19.28 27.36 50.76
1987: Jan. 4.65 4.12 20.75 26.34 30.56 16.29 29.43 15.23 19.33 27.78 46.88 Feb. 4.65 4.13 20,75 26.34 30.59 16.06 29.08 14.88 19.33 26.41 49.82 Mar. 4.65 4.10 20.64 26.29 30.70 16.01 23.66 13.36 19.21 26.94 43.85
Fresh-water Fresh vegetables Fresh fruits Fresh Fresh Flour, fish, fresh milk hen eggs wheat Sugar
(per bottle) (per piece) Grass Big White Flowering Apples Oranges Bananas
Year/month carp head cabbage cabbage Tomato (per piece) (per piece)
1981 25.55 19.82 5.81 7.93 6.89 1.47 1.17 5.32 1.74 0.47 2.68 6.76 1982 26.80 21.41 6.40 8.75 6.48 1.78 1.67 5.24 1.96 0.50 2.87 5.79 1983 25.80 21.05 7.68 10.53 8.58 1.97 1.72 5.62 2.15 0.52 3.17 5.67 1984 26.45 21.71 6.19 8.52 7.38 2.18 1.97 6.09 2.40 0.59 3.63 5.79 1985 23.39 19.17 6.55 8.86 7.50 2.21 2.03 5.67 2.41 0.56 3.79 5.30 1986 22.50 18.57 5.98 7.82 7.76 2.43 2.01 5.25 2.43 0.54 3.95 5.27
1985:Mar. 23.17 19.10 6.98 9.16 5.95 2.18 2.02 8.16 2.42 0.57 3.89 5.46 Apr. 23.43 19.40 6.88 9.74 6.91 2.18 2.04 6.17 2.41 0.57 3.82 5.37 May 23.68 19.48 4.58 6.45 6.71 2.17 2.03 2.41 0.57 3.77 5.38 June 24.55 20.06 7.21 8.56 7.32 2.17 2.05 4.41 2.41 0.56 3.77 5.31 July 23.46 19.11 6.63 8.56 9.64 2.19 2.02 6.50 2.41 0.56 3.77 5.28 Aug. 23.33 19.11 7.14 9.47 8.73 2.26 2.01 2.41 0.56 3.77 5.26 Sept. 23.68 19.28 11.94 14.96 10.14 2.22 2.03 4.50 2.41 0.56 3.77 5.25 Oct. 23.15 18.95 5.21 7.89 9.44 2.25 2.05 4.25 2.41 0.56 3.72 5.19 Nov. 22.19 18.34 5.24 7.94 8.17 2.25 2.04 2.41 0.56 3.77 5.15 Dec. 23.03 18.95 5.04 7.52 6.48 2.21 2.04 2.41 0.56 3.77 5.13
1986: Jan. 22.69 18.80 4.17 5.82 4.99 2.23 2.07 2.41 0.56 3.79 5.10 Feb. 24.34 19.91 5.29 8.07 5.49 2.27 2.06 2.41 0.55 3.84 5.15 Mar. 22.37 18.77 6.07 8.50 5.44 2.25 2.02 5.34 2.41 0.55 3.84 5.16 Apr. 22.11 18.50 6.71 8.28 6.45 2.26 2.05 5.49 2.41 0.55 3.80 5.21 May 22.92 18.85 5.18 6.58 6.23 2.23 2.04 5.40 2.41 0.55 3.80 5.30 June 22.75 18.67 7.28 8.76 7.82 2.24 2.07 5.25 2.41 0.55 3.85 5.32 July 22.62 18.42 9.09 10.63 9.66 2.47 2.03 5.29 2.41 0.55 3.85 5.36 Aug. 22.72 18.55 6.45 8.52 8.95 2.99 2.04 5.34 2.41 0.54 3.85 5.35 Sept. 22.37 18.34 6.88 8.58 10.81 3.09§ 1.95§ 4.98§ 2.39§ 0.50§ 3.85 5.32 Oct. 22.01§ 18.32§ 5.29§ 6.89§ 11.08§ 2.61 1.93 5.49 2.39 0.51 3.85 5.33 Nov. 21.64 17.99 4.91 7.16 9.13 2.39 1.96 4.94 2.47 0.51 4.53§ 5.32§ Dec. 21.50 17.76 4.48 6.02 7.09 2.17 1.90 4.98 2.60 0.51 4.53 5.32
1987: Jan. 22.09 18.20 4.66 7.36 5.87 2.30 1.98 4.98 2.60 0.52 4.53 5.32 Feb. 22.37 18.32 4.78 6.10 5.34 2.46 2.08 5.42 2.60 0.51 4.53 5.34 Mar. 21.61 17.79 6.47 8.76 5.74 2.31 2.01 5.34 2.60 0.50 4.60 5.41
§Data from this month onwards are based on a revised price survey.
82 Hong Kong Monthly Digest of Statistics April 1987

PRICES
8.2 AVERAGE WHOLESALE PRICES OF SELECTED FOODSTUFFS
$per kilogram, except where otherwise stated
Rice (per tonne) Live pigs Live cattle Marine fish, fresh Fresh vegetables, (per tonne) (per tonne) locally produoed
Chinese Australian Thai See Long 100% Golden Flowering White
Year/month Mew Grain whole thread Mackerel Garoupa cabbage cabbage Tomato
1981 3,191 3,828 3,337 7,050 10,100 8.02 9.82 20.31 3.54 2.36 2.21
1982 3,028 3,606 3,149 7,910 10,840 8.02 9.27 22.98 4.05 2.53 1.71
1983 3,152 4,264 3,195 8,860 11,220 8.55 10.90 25.68 5.27 3.34 4.30
1984 3,088 4,605 3,139 9,410 12,580 7.84 10.38 23.46 4.07 2.39 3.69
1985 2,839 4,471 3,002 8,650 12,400 7.04 10.25 24.51 4.43 2.62 3.43
1986 2,910 4,710 3,024 8,160 12,970 6.98 12.09 25.34 3.55 2.16 3.79
1985: Mar. 2,924 4,519 3,052 8,950 11,900 6.12 10.54 23.51 4.35 2.78 2.68 Apr. 2,890 4,655 2,985 8,980 11,900 6.28 10.00 22.88 5.10 2.40 3.36 May 2,894 4,666 2,990 8,900 12,030 6.77 9.47 21.86 2.37 1.33 2.74 June 2,844 4,666 2,958 8,550 12,700 6.92 11.34 27.19 3.86 2.84 3.74 July 2,779 4,460 2,981 8,510 12,700 7.91 13.66 26.52 4.20 2.84 4.59 Aug. 2,781 4,497 2,967 8,520 12,790 8.19 12.07 24.63 5.47 3.51 3.75 Sept. 2,685 4,523 2,976 8,510 12,700 7.64 12.67 31.19 9.50 6.88 5.02 Oct. 2,635 4,396 2,981 8,470 12,610 6.72 9.15 27.32 3.44 1.65 4.08 Nov. 2,868 4,316 2,964 8,210 12,720 7.70 9.55 25.00 3.57 1.54 4.47 Dec. 2,875 4,316 3,042 8,250 12,900 8.38 10.69 26.22 3.62 1.41 2.61
1986: Jan. 2,904 4,690 3,146 8,250 13,160 8.64 13.40 26.00 2.27 0.92 2.24 Feb. 3,036 4,653 3,138 8,269 13,200 7.59 15.40 27.72 3.59 1.52 2.45 Mar. 2,858 4,667 3,141 8,241 13,200 7.19 13.86 24.65 3.95 2.08 2.55 Apr. 2,880 4,733 3,089 7,890 12,860 7.14 11.36 22.71 3.63 2.67 3.22 May 2,890 4,703 2,959 7,880 12,400 7.34 12.51 22.60 2.22 1.24 2.84 June 2,791 4,687 2,938 7,850 13,180 7.17 13.40 24.15 4.22 2.93 4.22 July 2,887 4,723 2,944 7,840 13,130 7.00 15.48 26.87 6.69 5.37 5.09 Aug. 2,906 4,694 2,947 8,010 13,140 6.77 13.55 27.12 3.89 2.80 4.64 Sept. 2,855 4,777 2,983 8,039 12,880 6.14 11.30 26.25 3.97 3.07 5.96 Oct. 2,902 4,792 2,990 8,520 12,600 6.17 9.42 26.50 2.75 1.22 6.17 Nov. 3,053 4,693 3,004 8,530 12,600 6.25 10.25 27.95 3.09 1.18 3.58 Dec. 2,959 4,701 3,008 8,560 13,250 6.39 10.41 25.05 2.38 0.93 2.46
1987: Jan. 2,920 4,794 2,958 8,430 13,080 6.79 11.41 23.86 3.41 1.05 2.16 Feb. 2,863 4,553 2,944 8,230 12,270 6.48 10.47 24.41 2.11 0.99 1.84 Mar. 2,859 4,714 2,955 8,230 12,770 6.09 11.14 23.14 4.80 2.02 2.26
8.3 NEW CONSUMER PRICE INDEX (A)
(October 84-September 85 = 100)
Alcoholic drinks and
tobacco Clothing Misoel- Transport Food- Fuel and (for home and Durable laneous and
Year/month All items stuffs Housing light consumption) footwear goods goods vehicles Services
Weights attached 100.00 45.48 15.31 3.41 2.57 5.24 5.72 5.84 6.79 9.64
1985 (Oct.-Dec.) 101.4 99.5 102.6 99.9 105.2 104.0 JOO.I 100.8 103.1 106.1
1986 103.7 101.4 105.0 92.5 108.5 106.9 105.3 104.9 106.1 109.8
1985: Nov. 101.2 99.1 102.6 99.9 105.1 104.6 100.0 100.9 103.2 106.0 Dec. 101.3 99.1 102.7 99.8 105.1 104.5 101.1 100.8 103.2 106.3
1986: Jan. 101.3 99.0 103.0 100.4 105.4 102.3 100.9 101.1 103.6 106.4 Feb. 102.6 101.3 103.2 99.6 105.3 101.1 101.2 101.9 103.9 109.1 Mar. 102.4 100.6 103.4 99.0 105.6 102.8 102.5 102.7 104.3 108.2 Apr. 103.0 100.7 104.2 95.3 105.9 107.6 105.1 102.7 106.0 108.4 May 102.9 100.3 104.3 92.8 108.4 108.5 105.5 103.2 106.1 108.6 June 103.8 102.1 104.6 89.4 110.3 108.3 105.7. 103.5 106.7 108.7 July 104.4 103.3 104.7 89.3 110.4 107.8 105.7 103.7 106.8 108.7 Aug. 103.9 102.3 104.8 88.9 110.2 106.1 105.9 104.5 106.8 109.5 Sept. 104.6 102.6 106.5 88.5 110.1 107.1 106.5 106.1 107.3 109.9 Oct. 104.8 101.7 106.6 89.2 110.0 109.5 107.6 107.1 107.2 113.4 Nov. 105.0 101.3 106.8 89.2 110.4 110.3 108.2 111.5 107.2 113.5 Dec. 105.1 101.1 108.2 88.4 110.4 111.5 108.2 110.8 107.2 113.7
1987: Jan. 105.8 102.5 108.4 89.7 110.3 108.6 108.3 111.3 107.4 114.6 Feb. 106.6 103.3 108.6 91.1 111.1 107.6 108.5 111.9 112.4 114.4 Mar. 106.9 103.4 108.6 91.8 116.0 107.7 108.9 112.5 113.2 114.5
Hong Kong Monthly Digest of Statistics April 1987 83

PRICES
Year/month
Weights attached
1985 (Oct.-Dec.) 1986
1985: Nov. Dec.
1986: Jan. Feb. Mar. Apr. May June July Aug. Sept. Oct. Nov. Dec.
1987: Jan. Feb. Mar.
Year/month
Weights attached
1985 (Oct.-Dec.) 1986
1985: Nov. Dec.
1986: Jan. Feb. Mar. Apr. May June July Aug. Sept. Oct. Nov. Dec.
1987: Jan. Feb. Mar.
Year/month
1985: Nov. Dec.
1986: Jan. Feb. Mar. Apr. May June July Aug. Sept. Oct. Nov. Dec.
1987: Jan. Feb. Mar.
8.6
All items
100.00
101.6 104.0
101.5 101.6
101.6 102.7 102.7 103.4 103.4 104.1 104.5 104.2 104.9 105.2 105.5 105.6
106.2 106.7 107.0
All items
100.00
102.3 105.7
102.3 102.6
102.5 103.7 103.8 104.4 104.9 105.9 106.1 106.0 106.9 107.5 108.4 108.2
108.4 108.9 109.8
Food-stuffs
38.92
99.8 101.7
99.4 99.5
99.6 101.6 100.9 101.0 100.7 102.3 103.3 102.5 102.9 102.2 101.9 101.7
103.2 104.0 104.0
8.5
Food-stuffs
29.98
100.1 102.4
99.7 100.1
100.2 101.7 101.l 101.1 101.0 102.6 104.0 103.4 103.8 103.2 103.3 103.4
104.5 105.5 105.4
8.4 NEW CONSUMER PRICE INDEX (B) (October 84-September 85 = 100)
Alcoholic drinks and
tobacco Clothing Fuel and (for home and Durable
Housing light consumption) footwear goods
20.16 2.76 1.67 6.98 5.60
101.9 100.0 105.0 104.4 100.0 104.3 93.0 108.4 107.7 104.6
101.9 100.0 104.9 105.2 100.0 102.0 99.9 104.9 104.8 100.9
102.3 100.6 105.3 102.2 100.7 102.8 99.6 105.2 100.6 100.8 103.0 99.2 105.5 103.1 102.1 103.6 95.7 105.8 108.7 104.5 103.8 93.3 108.2 109.5 104.7 104.l 89.8 110.0 109.3 105.0 104.2 89.9 110.1 108.8 105.0 104.4 89.6 110.0 107.1 105.0 105.4 89.1 109.8 108.2 105.8 105.5 89.9 109.8 110.7 106.8 105.7 89.9 110.2 111.6 107.4 106.3 88.9 110.3 113.0 107.4
106.4 90.5 110.2 109.6 107.5 106.6 91.6 111.0 108.0 107.6 106.6 92.4 115.9 108.2 108.2
NEW HANG SENG CONSUMER PRICE INDEX (October 84-September 85=100)
Alcoholic drinks and
tobacco Clothing Fuel and (for home and Durable
Housing light consumption) footwear goods
25.77 2.35 1.20 7.93 5.82
102.5 100.1 104.5 107.9 100.4 109.1 93.4 107.6 107.5 104.8
102.4 100.1 104.3 109.9 100.3 103.2 100.0 104.5 107.2 101.2
104.5 101.1 104.9 100.7 100.7 105.9 99.7 104.8 101.1 100.7 106.5 99.5 105.2 103.2 102.1 106.8 96.1 105.5 106.6 104.6 107.7 93.7 107.3 110.2 104.9 109.2 90.0 108.8 111.7 104.7 110.1 90.4 108.9 105.7 104.6 110.4 90.4 109.0 103.7 104.9 111.0 89.6 108.8 108.1 106.3 111.7 90.6 109.0 110.9 107.2 112.6 90.5 109.7 116.6 108.3 112.7 89.7 109.8 111.9 108.1
113.3 92.0 109.8 105.3 108.1 114.0 92.5 110.6 104.4 108.3 114.7 93.6 115.3 108.9 109.2
Miscel- Transport laneous and
goods vehicles
6.06 6.83
101.2 102.9 105.3 105.5
101.3 103.0 101.3 103.0
101.6 103.4 102.3 103.7 103.3 104.0 103.4 105.1 103.9 105.3 104.2 105.9 104.5 106.0 105.I 106.0 106.7 106.6 107.6 106.6 111.1 106.6 110.4 106.6
110.7 106.7 111.4 110.8 112.1 111.8
Miscel- Transport laneous and
goods vehicles
5.89 7.10
101.4 102.6 105.4 104.2
101.6 102.6 101.6 102.7
101.7 102.9 102.5 103.2 103.4 103.3 103.5 103.7 104.0 103.7 104.4 104.3 104.6 104.3 105.3 104.5 106.9 104.8 107.9 105.0 110.4 105.0 109.9 105.1
110.1 105.3 110.7 107.4 111.8 108.6
MONTH-TO-MONTH PERCENTAGE CHANGES IN THE SEASONALLY ADJUSTED NEW CONSUMER PRICE INDEXES
(October 84-September 85 = 100)
Services
11.02
105.4 109.3
105.2 105.8
105.9 108.9 107.8 108.0 108.2 108.3 108.3 109.0 109.4 112.4 112.6 112.8
113.8 113.5 113.7
Services
13.96
104.9 108.7
104.6 105.6
105.7 107.7 106.9 107.5 107.8 108.0 108.2 108.6 109.1 111.2 111.2 111.9
113.l 112.5 112.7
New Consumer Price Index (A) New Consumer Price Index (B) New Hang Seng Consumer Price Index All items All items All items
of the of the of the All latest three Food- All latest three Food- All latest three Food-
items monthsf stuffs items monthst stuffs items monthsf stuffs
0.2 0.3 0.2 0.3 0.5 0.4 0.4 0.2 0.6 0.4 0.2 0.5 0.5 0.3 0.9
-0.1 0.2 -0.1 O.Ot 0.2 o.oi -0.1 0.4 -0.1 0.3 0.1 0.1 0.4 0.2 0.1 0.8 0.3 0.2 0.1 0.3 -0.3 0.2 0.4 -0.2 0.3 0.5 -0.4 0.5 0.3 0.1 0.5 0.4 0.1 0.4 0.4 0.2 0.4 0.4 0.7 0.4 0.4 0.7 0.6 0.6 0.4 0.4 0.5 0.6 0.4 0.4 0.6 0.9 0.6 0.9 0.7 0.3 1.3 0.5 0.3 1.0 0.3 0.4 1.4
-0.3 0.2 -0.9 -0.1 0.2 -0.7 0.1 0.3 -0.4 0.1 0.1 -0.6 o.f 0.2 -0.5 0.4 0.4 -0.6 0.6 0.4 0.1 0.6 0.4 0.1 0.8 0.7 0.2 0.6 0.5 0.6 0.5 0.5 0.6 1.0 0.6 1.1 0.4 0.6 0.3 0.3 0.5 0.3 -0.1 0.4 0.3
0.7 0.3 1.4 0.6 0.3 1.4 0.3 0.1 1.1 -0.2 0.3 -1.3 -0.2 0.3 -1.1 0.2 0.4 -0.4
0.6 0.6 0.5 0.5 0.8 0.3
tAverage monthly percentage change is based on the seasonally adjusted movement in a period of three months, e.g. the figure for January 1986 is the average of the 'all-items' estimates for the months of December 1985, January and February 1986.
tLess than 0.05%.
84 Hong Kong Monthly Digest of Statistics April 1987

PRICES
8.7 CONSUMER PRICE INDEX (A)
(October 79-September 80= 100)
Alcoholic drinks and
tobacco Clothing Miscel- Transport Food- Fuel and (for home and Durable laneous and
Year/month All items stuffs Housing light consumption) footwear goods goods vehicles Services
Weights attached 100.00 46.39 15.05 3.63 2.67 5.02 6.71 5.68 5.27 9.58
1981 117.9 119.9 114.0 134.0 112.9 114.7 107.l 110.4 127.3 118.l
1982 130.3 134.1 125.2 136.2 124.4 129.7 108.2 122.5 140.l 134.3
1983 143.2 145.6 136.4 145.9 182.2 140.3 113.8 134.0 153.7 152.2
1984 154.9 155.4 145.7 148.4 208.2 155.9 124.8 149.7 169.7 170.2
1985 159.8 156.0 155.2 146.l 229.3 169.0 123.5 151.2 181.4 184.6
1986 164.3 157.7 160.1 131.6 241.6 178.8 129.9 157.3 189.8 199.8
1985: Mar. 159.3 156.8 153.4 146.8 231.0 164.9 123.9 150.3 181.1 180.0 Apr. 159.9 157.0 154.4 146.8 231.6 169.4 123.9 151.6 181.6 180.8 May 159.0 154.5 154.8 146.8 233.5 170.4 123.5 151.6 181.8 181.6 June 159.8 156.2 155.1 145.8 233.7 170.3 123.2 151.3 182.4 182.2 July 159.6 155.6 155.4 145.6 233.8 169.2 122.8 150.9 182.5 183.0 Aug. 159.9 156.4 155.6 145.6 233.9 167.2 122.4 151.2 182.6 183.9 Sept. 162.8 161.5 156.7 145.6 234.1 170.0 122.5 152.1 183.8 184.6 Oct. 161.1 156.0 156.9 145.6 234.3 171.7 122.7 151.8 184.0 192.4 Nov. 160.7 154.5 156.9 145.5 234.2 174.7 124.0 151.9 184.6 192.l Dec. 160.8 154.6 157.1 145.4 234.2 173.8 125.6 151.8 184.5 192.8
1986: Jan. 160.7 154.3 157.5 145.5 234.4 •170.6 125.2 152.1 185.7 193.6 Feb. 162.9 157.6 157.8 145.2 234.5 168.9 125.3 153.l 186.5 198.5 Mar. 162.6 156.6 158.1 144.0 234.9 171.7 127.l 154.1 187.1 196.8 Apr. 163.3 156.8 159.l 136.4 235.3 179.9 129.4 154.2 190.0 196.9 May 163.1 156.0 159.4 131.9 241.3 181.1 130.0 154.7 190.0 197.0 June 164.3 158.7 159.8 126.7 245.3 180.6 129.9 154.9 190.4 197.2 July 165.l 160.5 159.9 125.5 245.4 179.4 130.0 155.2 190.6 197.2 Aug. 164.5 159.0 160.2 124.0 245.4 176.9 130.3 156.1 190.6 198.5 Sept. 165.3 159.4 161.6 124.1 245.3 179.3 131.1 157.5 192.0 198.8 Oct. 165.8 158.1 161.8 125.l 245.4 183.2 132.7 158.l 191.8 207.3 Nov. 166.5 157.6 162.0 125.6 245.7 185.2 133.7 169.2 191.6 207.6 Dec. 166.9 157.3 164.5 125.l 245.8 188.4 133.6 168.5 191.7 208.0
1987: Jan. 167.9 159.7 164.8 124.9 245.8 183.6 132.9 168.8 192.0 209.7 Feb. 169.1 160.8 165.l 128.9 247.1 181.1 133.5 170.0 201.9 209.3 Mar. 169.8 161.1 165.1 129.7 258.6 181.8 134.4 170.6 202.9 209.8
8.8 CONSUMER PRICE INDEX (B) (October 79-September 80= 100)
Alcoholic drinks and
tobacco Clothing Miscel- Transport Food- Fuel and (for home and Durable laneous and
Year/month All items stuffs Housing light consumption) footwear goods goods vehicles Services
Weights attached 100.00 38.59 17.77 2.71 l.90 7.03 7.53 6.07 6.09 12.31
1981 117.3 120.0 114.2 134.8 112.5 114.6 107.6 110.1 125.l 117.7
1982 129.8 134.4 125.l 136.6 123.3 130.0 110.2 119.8 139.4 133.7
1983 142.6 145.9 136.l 146.4 176.0 141.2 116.7 132.9 156.1 150.3
1984 154.7 155.8 146.l 148.2 200.7 156.9 128.6 146.6 172.0 167.8
1985 160.l 156.9 154.5 146.2 220.l 171.0 128.4 148.2 182.3 180.l
1986 165.6 159.0 159.3 134.2 231.7 183.2 135.1 155.7 191.0 193.4
1985: Mar. 159.1 ~
157.6 152.9 146.7 221.4 166.2 128.5 146.2 181.9 176.l Apr. 160.0 157.7 153.7 146.7 222.1 171.9 128.7 148.6 182.3 176.8 May 159.4 155.6 154.2 146.7 223.9 172.4 128.2 148.6 182.4 177.4 June 160.1 157.l 154.5 145.9 224.0 172.0 128.l 148.4 182.9 178.l July 159.9 156.5 154.7 145.7 224.2 170.9 127.7 147.8 183.0 178.9 Aug. 160.l 157.2 154.9 145.9 224.3 168.4 127.4 148.2 183.1 179.6 Sept. 162.4 161.6 155.5 145.9 224.6 172.3 127.6 149.7 184.l 180.3 Oct. 161.7 156.9 156.0 145.8 224.8 174.6 127.9 149.4 184.4 186.5 Nov. 161.5 155.7 156.l 145.7 224.7 178.0 129.1 149.7 185.3 186.1 Dec. 161.7 155.9 156.l 145.7 224.8 176.5 130.3 149.7 185.2 187.0
1986: Jan. 161.8 155.8 156.6 145.9 225.l 173.0 130.l 150.1 187.0 188.0 Feb. 163.7 158.9 157.5 145.5 225.l 171.0 130.l 151.3 187.6 192.6 Mar. 163.7 157.9 157.8 144.5 225.6 175.4 131.7 152.6 188.5 190.8 Apr. 164.8 158.2 158.6 138.2 226.2 185.0 134.6 152.7 190.3 190.9 May 164.7 157.4 158.8 134.4 231.4 186.3 135.2 153.3 190.6 190.8 June 165.7 159.9 159.3 130.0 235.0 185.3 135.4 153.7 190.9 191.1 July 166.2 161.4 159.4 129.2 235.0 183.9 135.4 154.0 191.5 191.0 Aug. 165.7 160.1 159.6 128.2 235.0 180.4 135.7 155.0 191.5 192.0 Sept. 166.6 160.6 160.4 128.l 235.0 183.8 136.5 157.2 193.5 192.3 Oct. 167.7 159.6 160.6 128.8 235.2 188.6 138.l 158.4 193.4 200.0 Nov. 168.4 159.2 160.9 129.1 235.6 191.1 138.9 165.7 193.4 200.3 Dec. 168.7 159.0 162.0 128.2 235.8 194.l 138.9 164.9 193.5 200.8
1987: Jan. 169.5 161.4 162.3 128.3 235.7 188.4 138.5 165.l 193.7 202.5 Feb. 170.4 162.5 162.6 131.4 237.0 185.8 139.2 166.2 201.1 202.l Mar. 171.1 162.7 162.7 132.1 247.7 186.5 140.2 167.4 202.7 202.6
Hong Kong Monthly Digest of Statistics April 1987 85
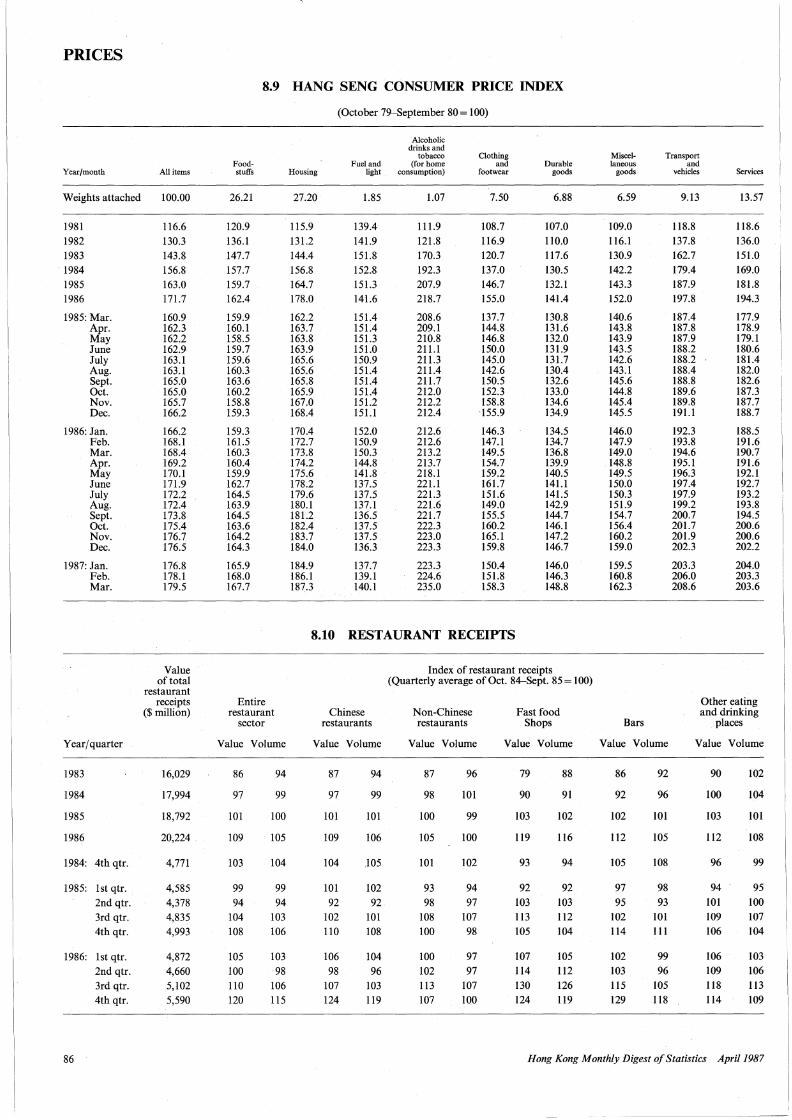
PRICES
Year/month
Weights attached
1981
1982
1983 1984 1985 1986
1985: Mar. Apr. May June July Aug. Sept. Oct. Nov. Dec.
1986: Jan. Feb. Mar. Apr. May June July Aug. Sept. Oct. Nov. Dec.
1987: Jan. Feb. Mar.
Year/ quarter
1983
1984
1985
1986
1984: 4th qtr.
1985: lst qtr.
2nd qtr. 3rd qtr. 4th qtr.
1986: lst qtr. 2nd qtr. 3rd qtr.
4th qtr.
86
All items
100.00
116.6
130.3 143.8 156.8 163.0 171.7
160.9 162.3 162.2 162.9 163.1 163.1 165.0 165.0 165.7 166.2
166.2 168.1 168.4 169.2 170.1 171.9 172.2 172.4 173.8 175.4 176.7 176.5
176.8 178-1 179.5
Value of total
restaurant receipts
($million)
16,029
17,994
18,792
20,224
4,771
4,585
4,378 4,835 4,993
4,872 4,660
5,I02 5,590
8.9 HANG SENG CONSUMER PRICE INDEX
Foodstuffs
26.21
120.9 136.1
147.7 157.7 159.7 162.4
159.9 160.l 158.5 159.7 159.6 160.3 163.6 160.2 158.8 159.3
159.3 161.5 160.3 160.4 159.9 162.7 164.5 163.9 164.5 163.6 164.2 164.3
165.9 168.0 167.7
Entire restaurant
sector
Value Volume
86
97
IOI
109
103
99
94 104
I08
I05 100
110 120
94
99
IOO
I05
104
99 94
103 106
I03 98
106
115
(October 79-September 80= 100)
Housing
27.20
115.9 131.2
144.4 156.8 164.7 178.0
162.2 163.7 163.8 163.9 165.6 165.6 165.8 165.9 167.0 168.4
170.4 172.7 173.8 174.2 175.6 178.2 179.6 180.1 181.2 182.4 183.7 184.0
184.9 186.1 187.3
Fuel and light
1.85
139.4 141.9 151.8
152.8 151.3 141.6
151.4 151.4 151.3 151.0 150.9 151.4 151.4 151.4 151.2 151.1
152.0 150.9 150.3 144.8 141.8 137.5 137.5 137.1 136.5 137.5 137.5 136.3
137.7 139.1 140.1
Alcoholic drinks and
tobacco (for home
consumption)
1.07
111.9
121.8 170.3
192.3 207.9 218.7
208.6 209.1 2I0.8 211.1 211.3 211.4 211.7 212.0 212.2 212.4
212.6 212.6 213.2 213.7 218.1 221.1 221.3 221.6 221.7 222.3 223.0 223.3
223.3 224.6 235.0
Clothing and
footwear
7.50
I08.7
116.9 120.7
137.0 146.7 155.0
137.7 144.8 146.8 150.0 145.0 142.6 150.5 152.3 158.8 155.9
146.3 147.1 149.5 154.7 159.2 161.7 151.6 149.0 155.5 160.2 165.1 159.8
150.4 151.8 158.3
Durable goods
6.88
I07.0
l I0.0 117.6 130.5 132.1 141.4
130.8 131.6 132.0 131.9 131.7 130.4 132.6 133.0 134.6 134.9
134.5 134.7 136.8 139.9 140.5 141.1 141.5 142.9 144.7 146.l 147.2 146.7
146.0 146.3 148.8
8.10 RESTAURANT RECEIPTS
Chinese restaurants
Value Volume
87
97
IOI
I09
104
IOI 92
I02 110
106
98 107
124
94
99
101
I06
105
I02
92 IOI 108
104 96
103
119
Index of restaurant receipts (Quarterly average of Oct. 84-Sept. 85= 100)
Non-Chinese restaurants
Value Volume
87
98
IOO
105
IOI
93 98
108 100
100
102 113
107
96
101
99
100
102
94
97 107
98
97
97 107
IOO
Fast food Shops
Value Volume
79
90
I03
119
93
92 103
113 105
I07 114 130
124
88
91
102
116
94
92
103 112 I04
I05 112
126 119
Miscellaneous
goods
6.59
I09.0
116.1 130.9 142.2 143.3 152.0
140.6 143.8 143.9 143.5 142.6 143.l 145.6 144.8 145.4 145.5
146.0 147.9 149.0 148.8 149.5 150.0 150.3 151.9 154.7 156.4 160.2 159.0
159.5 160.8 162.3
Bars
Transport and
vehicles
9.13
118.8
137.8 162.7 179.4 187.9 197.8
187.4 187.8 187.9 188.2 188.2 188.4 188.8 189.6 189.8 191.1
192.3 193.8 194.6 195.1 196.3 197.4 197.9 199.2 200.7 201.7 201.9 202.3
203.3 206.0 208.6
Services
13.57
118.6
136.0 151.0 169.0 181.8 194.3
177.9 178.9 179.l 180.6 181.4 182.0 182.6 187.3 187.7 188.7
188.5 191.6 190.7 191.6 192.I 192.7 193.2 193.8 194.5 200.6 200.6 202.2
204.0 203.3 203.6
Other eating and drinking
places
Value Volume Value Volume
86
92
102
112
105
97
95 I02 114
102 I03 115
129
92
96
IOI
I05
108
98 93
IOI 111
99 96
105
118
90
100
I03
112
96
94
101
I09 106
I06 I09 118
114
102
104
101
108
99
95
100 I07
I04
I03
106 113
109
Hong Kong Monthly Digest of Statistics April 1987

RETAILING
8.11 RETAIL SALES
Value of total Index of retail sales retail sales ($million)
(Monthly average of Oct. 84--Sept. 85 = IOO)
All retail Foodstuffs, Fuels Clothing, Consumer trades alcoholic footwear durables
drinks and and allied tobacco products
Year/month Value Volume Value Volume Value Volume Value Volume Value Volume
1981 48,960 73 95 68 90 69 89 62 88 81 IOI
1982 51,471 77 92 74 88 80 97 66 84 77 91
1983 57,377 85 93 86 93 94 98 75 89 81 91
1984 66,I08 98 99 98 98 99 99 93 99 98 99
1985 61,901 IOI IOI 101 IOI IOI 100 104 102 IOI 101
1986 71,996 I07 103 106 I05 89 100 119 111 Ill I03
1985: Feb. 5,839 104 105 110 llO 89 89 119 124 96 96 Mar. 5,543 99 99 102 IOI I03 102 94 96 97 97 Apr. 5,393 96 95 IOI 100 102 101 97 96 95 95 May 5,577 100 99 99 100 105 I04 99 97 109 109 June 5,186 93 92 99 98 101 IOI 83 81 97 97 July 5,452 97 97 102 102 102 102 88 87 102 102 Aug. 5,413 97 97 IOO 99 IOO 100 87 87 103 104 Sept. 5,571 99 98 I07 I03 IOO IOO 93 90 102 I02 Oct. 5,707 I02 IOI 95 95 I02 102 111 I07 IOI I02 Nov. 5,857 I05 103 94 95 99 99 117 110 103 102 Dec. 6,473 116 114 IOI 103 102 102 142 134 105 103
1986: Jan. 6,147 110 109 104 106 101 101 130 128 112 109 Feb. 5,539 99 97 105 104 90 90 115 114 93 90 Mar. 5,706 102 IOO 104 104 99 I02 106 103 99 95 Apr. 5,578 IOO 97 I04 105 92 100 Ill 103 101 94 May 5,736 102 99 104 105 89 IOI 115 105 108 100 June 5,427 97 93 103 101 87 102 103 94 I08 100 July 5,851 I04 100 106 103 88 104 107 IOO 115 I06 Aug. 6,030 I08 104 106 104 84 IOI 108 I02 120 110 Sept. 6,077 I08 I03 I07 105 83 IOO Ill I03 117 106 Oct. 6,301 113 106 !05 104 85 101 127 115 118 107 Nov. 6,436 ll5 108 102 102 84 99 149 132 118 I06 Dec. 7,166 128 120 115 114 87 I02 152 135 122 110
1987: Jan. 7,274 130 122 131 128 86 101 158 147 126 112 Feb.t 5,832 104 98 105 102 82 92 95 89 103 92
Index of retail sales (Monthly average of Oct. 84--Sept. 85 = IOO)
Other consumer Supermarkets Motor vehicles Consumer Department goods and parts durables, stores
other than motor vehicles
and parts
Year/month Value Volume Value Volume Value Volume Value Volume Value Volume
1981 75 96 45 64 126 192 67 80 66 84
1982 80 95 56 71 89 119 73 85 72 85
1983 89 95 74 84 64 73 86 95 80 86
1984 IOO IOO 95 96 79 82 103 I03 96 96
1985 IOI IOO 103 103 102 101 IOI IOI I02 IOI
1986 I06 IOO 115 112 125 106 107 102 I06 IOO
1985: Feb. 104 104 114 116 97 98 95 95 112 113 Mar. 99 100 95 95 94 94 98 98 92 93 Apr. 93 92 94 93 102 IOI 94 93 81 80 May 95 94 I07 I06 115 115 I07 I07 87 86 June 88 87 110 109 96 95 98 98 85 85 July 94 94 110 109 102 I02 IOI I02 89 89 Aug. 94 93 I04 I03 I08 I07 I02 I03 I08 107 Sept. 95 94 I06 I05 I09 108 IOO 100 86 85 Oct. I04 I02 99 98 99 97 102 103 I06 102 Nov. 110 I07 98 97 99 94 I04 104 113 I07 Dec. 125 122 114 112 98 93 I07 I06 147 140
1986: Jan. I08 107 108 107 127 116 I08 107 126 124 Feb. 96 94 122 120 104 94 89 88 94 93 Mar. I02 98 109 107 98 87 99 97 92 89 Apr. 95 91 IOI 99 112 98 97 93 87 82 May 98 93 I06 I03 121 I04 104 99 88 81 June 88 84 112 I09 123 I05 I03 98 89 82 July 100 95 117 114 128 I08 Ill I06 93 87 Aug. I06 101 122 118 134 Ill . 116 llO 118 112 Sept. I09 101 127 123 135 llO 111 I05 93 86 Oct. 115 105 116 113 135 110 113 I06 112 102 Nov. 117 107 I09 I05 131 106 114 I06 126 112 Dec. 139 127 128 123 147 119 115 107 159 143
1987: Jan. 131 121 160 154 158 128 116 I08 152 142 Feb.t 110 101 115 110 121 97 97 90 97 91
tProvisional figures.
Hong Kong Monthly Digest of Statistics Ap~i/1987 87

Year/quarter
1981 1982
New series 1982 1983 1984 1985 1986
1985: lst qtr. 2nd qtr. 3rd qtr. 4thqtr.
1986: lst qtr. 2nd qtr. 3rd qtr. 4th qtr.
1987: lst qtr.
Year/quarter
1981 1982
New series 1982 1983 1984 1985 1986
1985: lst qtr. 2nd qtr. 3rd qtr. 4th qtr.
1986: lst qtr. 2nd qtr. 3rd qtr. 4th qtr.
1987: lst qtr.
Year /quarter
1981 1982
New series 1982 1983 1984 1985 1986
1985: lst qtr. 2nd qtr. 3rd qtr. 4th qtr.
1986: lst qtr. 2ndqtr. 3rd qtr. 4th qtr.
1987: lst qtr.
88
SECTION 9
Against public order
Cases reported
I 693 l 988
l 492 l 730 l 595 I 734 1692
364 406 479 502 418 487 415 412 442
Cases reported
103 79
79 78 87 80 72
14 21 21 27 12 27 24 16 12
Rape
Persons prosecuted
2 650 3473
3473 3 264 3 262 3 480 3 392
746 853
I 042 993 823 960 885 796 919
Persons prosecuted
57 38
38 33 45 51 50
2 12 ll 18 9
14 15 8 3
Murder and manslaughter
Cases reported
105 93
93 84 84 89 67
18 31 20 20 15 21 17 14 21
Persons prosecuted
82 93
93 76 83 83 79
12 21 15 16 9
15 13 9
12
SOCIAL STATISTICS
9.1 CRIME
Against lawful authority
Unlawful society Other offences
Cases reported
919 940
940 695
I 058 I 392 l 055
268 367 374 345 220 321 255 263 212
Persons prosecuted
441 447
447 307 489 682 371
166 153 192 170 108 129 87 76 97
Cases reported
823 l 007
I 007 l 193
910 580 550
141 153 138 145 140 166 145 103 129
Persons prosecuted
487 620
620 748 614 457 438
113 Ill 100 128 108 121 llO 89
103
Against public morality
Indecent assault on female
Cases reported
Persons prosecuted
720 784
784 778 768 801 808
156 231 215 200 162 243 231 176 189
365 388
388 399 368 430 419
77 108 123 ll7 90
ll4 126 92 75
Other offences
Cases reported
529 511
5ll 577 563 877 901
185 231 248 236 168 214 253 266 244
Persons prosecuted
270 277
277 l 019
703 l 106 l 146
197 328 311 290 270 289 247 339 278
Against the person
Attempted murder
Cases reported
12 4 ll 4
2 2 3 4
Persons prosecuted
4
l
4
2
4
2 1 l
Serious assaults
Cases reported
6231 7 265
7 265 7 610 7 874 7 589 7 804
1606 1864 2 033 2057 l 8ll 1997 2039 1963 1 963
Persons prosecuted
4200 4 529
4 529 4 713 5 030 4 848 5 321
951 l 029 1298 1214 1141 l 265 l 288 l 359 l 317
Cases reported
3 435 3 935
3 439 3 618 3 563 3 706 3 297
773 926 991 992 778 974 815 778 783
Cases reported
l 352 l 374
l 374 l 433 l 418 l 758 l 781
355 483 484 463 342 484 508 458 445
Cases reported
lO
2 2 4 3 2 3 1
Total
Total
Persons prosecuted
3 578 4 540
4 540 4 319 4 365 4619 4201
I 025 l ll7 l 334 l 291 I 039 l 210 l 082
961 l ll9
Persons prosecuted
692 703
703 l 451 1 ll6 1 587 l 615
276 448 445 425 369 417 388 439 356
Abortion
Persons prosecuted
2
14 9
5 2 2 3 3 4 2
Hong Kong Monthly Digest of Statistics April 1987

Year/quarter
1981 1982
New series 1982 1983 1984 1985 1986 1985: lst qtr.
2nd qtr. 3rd qtr. 4th qtr.
1986: lst qtr. 2ndqtr. 3rd qtr. 4th qtr.
1987: lst qtr.
Year/quarter
1981 1982
New series 1982 1983 1984 1985 1986 1985: lst qtr.
2nd qtr. 3rd qtr. 4thqtr.
1986: lst qtr. 2ndqtr. 3rd qtr. 4th qtr.
1987: lst qtr.
Year/quarter
1981 1982
New 8eries 1982 1983 1984 1985 1986 1985: Jst qtr.
2nd qtr. 3rd qtr. 4th qtr.
1986: lst qtr. 2nd qtr. 3rd qtr. 4thqtr.
1987: lst qtr.
Kidnapping
Cases reported
4
4
Persons prosecuted
37
19 3
4 6
Other robberies
Cases reported
8 233 8 527
8 527 8 278 7 222 6 728 5 354 l 748 1 684 1 633 l 587 1431 1506 1226 1182 1462
Persons prosecuted
l 795 l 634
1634 1567 1491 l 564 1248
351 278 328 325 245 282 251 295 319
Theft from vehicle
Cases reported
4802 6 426
6426 6 339 5 048 4988'
5 028 l 058 1246 l 355 I 256 1204 1249 l 278 l 287 l 333
Persons prosecuted
624 766
766 909 748 625 647 127 158 148 183 150 134 182 159 135
Hong Kong Monthly Digest of Statistics April 1987
SOCIAL STATISTICS
9.1 CRIME-contd.
Against the person-continued
Other offences Total
Cases reported
652 696
696 653 765 795 636 185 204 222 202 153 188 149 163 150
Persons prosecuted
397 411
411 466 593 568 489 140 137 154 146 115 104 135 158 118
Cases reported
7 008 8 062
8062 8 372 8 734 8496 8 520 1814 2 103 2 283 2 286 1983 2212 2208 2142 2139
Persons prosecuted
4 723 5 043
5043 5 281 5 715 5 530 5908 l 114 1191 1472 1383 1272 l 396 1439 l 527 1447
Against property-continued
All burglaries
Cases reported
10 583 11 526
11 526 11 308 12 663 13 922 11·942
3 218 3 546 3 543 3 454 3 112 3 008 2 821 2 956 2 782
Persons prosecuted
1306 I 123
l 123 1223 I 253 1254 l 024
284 243 212 295 228 246 231 180 207
Theft from persons (snatching)
Cases reported
2024 2 177
2 177 2844 2447 2 357 1843
418 632 755 536 351 514 605 376 388
Persons prosecuted
201 225
225 284 216 245 178 42 69 72 62 34 42 50 48 49
Against property-continued
Theft of vehicle/taking conveyance without
authority
Cases reported
2973 6013
6 013 5 542 4121 3 149 2 967
836 751 804 750 737 741 742 757 839
Persons prosecuted
382 485
485 379 360 260 279
55 71 64 42 50 74 79 64 83
Theft associated with blackmail
Cases reported
519 519
Persons prosecuted
Against property
Robbery with firearms
Cases reported
30 21
21 30 23 17 18 7 4 3 3 6 4 4 4
Persons prosecuted
20 26
26 31 20 14 12
4 l 3
Theft from persons (pickpocketing)
Cases reported
2251 2 692
2 692 2 902 2 880 3 036 3 073
735· 737 699 822 770 695 738 861
l 215
Persons prosecuted
789 873
873 749 618 680 711 186 143 150 195 211 165 156 181 173
Other thefts
Cases reported
20 984 19 342
19 342 19 321 18 877 21480 20 370 4941 5052 5 535 5 822 5 249 5 307 5084 4800 4985
Persons prosecuted
6878 6 520
6 520 7 413 7 882 9 118 8431 2 098 2210 2 368 2617 2 269 2172 2 136 2018 l 965
89

SOCIAL STATISTICS
9.1 CRIME-contd.
Year/quarter
1981
1982
New series
1982
1983
1984
1985
1986
1985: lst qtr. 2nd qlr. 3rd qtr. 4thqtr.
1986 lst qtr. 2nd qlr. 3rd qtr. 4th qtr.
1987: lst qtr.
Year/quarter
1981
1982
New series
1982
1983
1984
1985
1986
1985: lst qtr. 2nd qtr. 3rd qtr. 4th qtr.
1986: lst qtr, 2nd qtr. 3rd qtr. 4thqtr.
1987: lst qtr.
Year/quarter
1981
1982
New series
1982
1983
1984
1985
1986
1985: lst qtr. 2nd qtr. 3rd qtr. 4thqtr.
1986: lst qtr. 2nd qtr. 3rd qtr. 4th qtr.
1987: lst qtr.
Blackmail
Cases reported
1145
I 067
652
794
921
789
687
161 210 213 209
l7l 175 178 171
141
Persons prosecuted
637
703
703
777
864
850
706
153 221 211 201
176 181 161 162
138
Against property-continued
Cases reported
63 812
68 984
66 552
68 099
65 606
66 875
60 791
15 749 16 565 17 261 16 994
15 298 15 669 15 186 14809
15 644
Total
Persons prosecuted
16 942
16 796
16 796
18 472 19435
19 914
17998
4 6ll 4 784 4 896 5 157
4430 4 483 4 573 4320
4221
Possession of arms and ammunition
Cases reported
142
135
73
71
99
48
41
17 15 14 6
lO 8
12 13
9
Persons prosecuted
124
131
l3l
70
109 49
42
17 17 16 7
8 7
lO 19
§Including the serious gambling offences which were classified as crime from 1.1.1985.
90
Against property---continued
All frauds
Cases reported
2408
2089
2089
2 114
2041
l 748
1508
469 542 513 427
393 388 431 380
339
Persons prosecuted
568
505
505
619
711 800
648
124 254 180 158
152 141 179 116
123
Forgery and coinage
Cases reported
l 486
1827
l 827
454
538
379
291
61 71
114 84
58 60 78 62
53
Persons prosecuted
576
961
961
226
230
188
180
26 25 48 45
35 27 44 41
34
Criminal damage to property
Cases reported
Persons prosecuted
3 042
3 483
3483
3 997
4538
4 750
4548
1 096 1168 l 242 l 246
l 089 1190 l 148 1140
l 240
Other crimes
870
924
924
981
l 096
l 133
l 180
258 280 309 319
258 270 325 330
285
Other offences
Cases reported
4 818
5 102
3 604
4 630
4 825
3 911
3 453
l 062 993 966 882
785 892 931 895
915
Persons prosecuted
2 872
3 012
3 012
3 540
4176
3 371
2934
932 854 851 760
654 776 819 766
741
Bribery and corruption
Police cases
Cases reported
31
27
27
l7
21
15
25
3 3 2 8
5 5 3
13
Persons prosecuted
23
14
14
15
13
17
3 3 1 7
2 3 2
ll
ICACcases
Cases reported
1 052
l 053
l 053
1 083
I 105 l 086
l 216
278 228 297 283
308 350 360 198
259
Persons prosecuted
478
379
379
449
392
289
251
84 72 54 79
36 47
IOI 67
134
Other crimes-continued
Cases reported
514
645
645
I 146
l 022
2 118
2 547
476 486 458 695
567 595 660 736
653
Others§
Persons prosecuted
677
722
722
1146
l 120
2 278
2 606
531 529 494 750
606 608 614 755 685
Total (Excluding ICAC cases)
Cases reported
2 173
2 634
2 572 1 688
l 680
2 560
2904
557 575 588 793
640 668 753 824
723
Persons prosecuted
l 400
1828
l 828
1449
l 474
2 528
2 845
577 574 559 809
651 645 670 826
731
Hong Kong Monthly Digest of Statistics April 1987

SOCIAL STATISTICS
9.1 CRIME-contd.
Serious narcotic Grand total offencest
Manufacturing Trafficking Police casest ICACcases
Cases Persons Cases Persons Cases Persons Cases PersOns Year/quarter reported prosecuted reported prosecuted reported prosecuted reported prosecuted
1981 4 11 2039 2 552 79 823 29 898 1052 478
1982 14 29 2 563 3 376 87 566 32 315 1053 379
New series
1982 14 29 2 563 3 376 84 576 32 315 I 053 379
1983 14 19 3 036 4006 86260 34997 I 083 449
1984 II 13 2 802 3 645 83 814 35 763 1105 392
1985 3 902 4 859 87 303 39 045 I 086 289
1986 10 16 4 598 5729 81901 38 312 1216 251
1985: lst qtr. 2 860 1109 20 111 8 714 278 84 2nd qtr. 924 1135 21 576 9249 228 72 3rd qtr. I 2 I 041 1243 22649 9 951 297 54 4th qtr. 2 4 I 115 1414 22645 10483 283 79
1986: lst qtr. 998 1233 20042 8 999 308 36 2nd qtr. 1112 1395 21124 9 554 350 47 3rd qtr. 1210 I 547 20680 9699 360 IOI 4th qtr. 2 1262 I 534 20274 9609 198 67
1987: lst qtr. 2 2 1139 1404 20 875 9280 259 134
Note: A new counting method of crime (except ICAC cases) has been adopted with effect from I January 1983. Figures in the new series which are compiled under the new counting method are not comparable with those of the previous years: The annual figures have been revised and do not equal the sum of the corresponding quarterly figures.
tincluding cases handled by the Police and Customs & Excise Department. tincluding cases of serious narcotic offences handled by Customs & Excise Department.
9.2 IN-PATIENT AND OUT-PATIENT STATISTICS IN GOVERNMENT AND
GOVERNMENT-ASSISTED INSTITUTIONS§
In-patient service
Beds available In-patients (as at end
Year/quarter treated ('OOO) of period)
1980 534 17 725
1981 568 18 492
1982 665 . 19 385
1983 661 19 647
1984 641 20446
1985 656 21 184
1984: 4th qtr. 162 20446
1985: lst qtr. 151 20 753 2ndqtr. 165 20944 3rd qtr. 171 21 155 4th qtr. 169 21 184
1986: lst qtr. 158 21 215 2ndqtr. 164 21267 3rd qtr. 171 21269 4th qtr. 169 21 273
Note: Quarterly figures for the current year are provisional figures. §Excluding correctional institutions.
Bed occupancy(%)
86.6
86.2
86.5
86.8
86.l
84.3
84.5
82.2 85.5 85.6 83.8
82.l 84.5 84.9 85.0
tExcluding physiotherapy and occupational therapy treatments rendered to in-patients.
Hong Kong Monthly Digest of Statistics April 1987
Out-patient attendances ('OOO)
General Specialistt clinics clinics Casualty
4766 7 832 l 013
4 941 7974 l 063
5 330 8 483 1121
5 653 8 606 l 169
5 879 9 749 l 212
5 995 10049 l 291
l 510 2 535 299
l 438 2342 281 l 521 2422 352 l 481 2 555 338 l 555 2 730 320
1429 2484 295 l 574 2680 338 1 550 2 740 333 l 555 2 742 304
Total
13 611
13 978
14934
15 428
16 840
17 335
4 344
4 061 4295 4 374 4605
4208 4592 4623 4 601
91

SOCIAL STATISTICS
9.3 NOTIFIED INFECTIOUS DISEASES
Amoebiasis Bacillary Cerebrospinal Chickenpox Diphtheria dysentery meningitis
Year/ quarter Cases Deaths Cases Deaths Cases Deaths Cases Deaths Cases Deaths
1981 48 563 3 18 l 140 1982 37 2 550 l 16 l 621 3 1983 37 2 479 l 13 1228 l 1984 29 l 396 8 2433 3 1985 16 2 519 12 l 194 1986 13 344 6 l 635
1985: lst qtr. 4 150 7 498 2nd qtr. 7 77 2 406 3rd qtr. 4 173 2 129 4th qtr. l 122 l 161
1986: lst qtr. 8 77 4 594 2nd qtr. 1 105 505 3rd qtr. 2 92 290 4th qtr. 2 70 2 246
1987: lst qtr. 2 105 876
Enteric fever Leprosy Mitlaria Measles Ophthalmia neonatorum
Year/ quarter Cases Deaths Cases Deaths Cases Deaths Cases Deaths Cases Deaths
1981 500 4 55 2 62 249 5 1982 392 57 80 1 863 5 4 1983 369 3 38 125 888 2 1 1984 331 25 113 678 2 6 1985 287 32 168 280 5 1986 198 29 143 215 5 1985: lst qtr. 65 9 32 41 2
2ndqtr. 83 11 50 80 3rd qtr. 73 10 63 57 1 4th qtr. '66 2 23 102 2
1986: lst qtr. 53 6 15 56 2nd qtr. 45 11 50 106 1 3rd qtr. 68 7 60 44 1 4th qtr. 32 5 18 9 3
1987: lst qtr. 73 9 8 57 3
Scarlet fever Tuberculosis Whooping Food Viral cough poisoning hepatitis
Out- Persons Year/ quarter Cases Deaths Cases Deaths Cases Deaths breaks affected Deaths Cases Deaths
1981 3 7 731 489 2 175 666 1 738 26 1982 4 7 527 454 l 215 . 870 1 814 42 1983 3 7 301 446 169 642 1 783 28 1984 5 7 843 420 18 233 1 340 1 780 12 1985 1 7 545 409 21 278 958 1 601 13 1986 9 7 432 407 l 223 1 076 1424 18
1985: lst qtr. 1 632 109 5 30 64 280 3 2nd qtr. 1 772 94 10 61 229 684 3 3rd qtr. 2069 101 6 111 301 357 4 4th qtr. 2072 105 76 364 280 3
1986: lst qtr. 3 1 680 99 34 123 430 2 2ndqtr. 6 1 884 109 64 480 519 6 3rd qtr. 2070 95 79 287 240 5 4th qtr. 1798 104 46 186 235 5
1987: lst qtr. 1 545 103 34 121 424 10
Note: Figures include Vietnamese refugee cases. Annual figures have been adjusted and may not equal to the sums of quarterly figures.
92 Hong Kong Monthly Digest of Statistics April 1987

SOCIAL STATISTICS
9.4 PUBLIC ASSISTANCE SCHEMES
Number of cases (as at end of period)
Old age Permanent disabilities Temporary Year (ending Physically Mentally disabilities/ 31 March)/month Blind Deaf disabled ill Ill health
1982 31 154 792 95 1101 965 6088
1983 33 910 768 124 1120 I 166 6962
1984 35 894 784 123 1 250 1442 7 731
1985 37 644 891 190 I 383 I 794 8 346
1986 40 214 806 139 1403 2051 8 878
1987 40 825 768 145 1260 2 348 8 215
1985: Mar. 37 644 891 190 1 383 1 794 8 346 Apr. 37 980 841 158 1 389 1 935 8 451 May 38 360 864 142 1405 l 885 8 553 June 38 314 861 146 1406 l 887 8 542 July 38 526 865 142 1414 1841 8 601 Aug. 38 788 858 135 1 383 I 868 8 592 Sept. 39 108 875 131 I 389 I 887 8 694 Oct. 39 262 858 133 1 391 1899 8 846 Nov. 39 543 834 136 1397 1 950 8 839 Dec. 39 682 835 135 1 391 1 959 8 855
1986: Jan. 40 072 824 135 1407 1 987 8 923 Feb. 39 996 828 137 1 393 2037 8 907 Mar. 40 214 806 139 1403 2051 8 878 Apr. 39 230 788 145 1 343 2 073 8 513 May 38 646 784 140 1 334 1998 8 080 June 39 150 771 137 1 301 2027 8 104 July 39 393 763 137 1293 2031 8 136 Aug. 39 693 757 133 1 267 2080 8 159 Sept. 39 832 765 134 I 255 2 094 8 276 Oct. 40 055 763 138 1284 2 160 8 313 Nov. 40452 773 136 1279 2 224 8 340 Dec. 40 654 759 141 1 268 2231 8 233
1987: Jan. 40 575 759 145 1 261 2 273 8 299 Feb. 40 585 772 145 1257 2 317 8 273 Mar. 40 825 768 145 1260 2 348 8 215
Number of cases (as at end of period) Amount of No. of new payment applications
Single parent ($'000) familyt /widow
Year (ending with dependent Low 31 March)/month childrent earning Unemployed Others Total
1982 2 206 1 377 521 I 453 45 752 291,288 14 328
1983 2 287 1 655 985 2290 51267 407,808 20084
1984 2 561 1916 1 574 2 815 56 090 486,568 22 353
1985 2 541 2080 1 744 3 287 59 900 583,369 21 161
1986 3 635 1 799 2 225 2 563 63 713 625,502 22 687
1987 3 806 1 515 2143 2 263 63 288 678 362 21 548
1985: Mar. 2 541 2 080 I 744 3 287 59 900 50,647 1 883 Apr. 2 788 2 085 1 795 2 739 60 161 57,346 1 827 May 3 165 1990 1 788 2293 60445 53,811 2 082 June 3 287 1 975 1 794 2232 60444 48,636 1620 July 3 390 1 903 I 852 2 328 60 862 50,522 2 017 Aug. 3 333 1914 1 927 2 505 61 303 49,745 2 019 Sept. 3 352 1904 1 988 2 597 61925 49,309 2043 Oct. 3 389 1 882 2028 2 571 62259 54,401 1 959 Nov. 3 497 I 847 2084 2 520 62 647 53,152 2043 Dec. 3 478 1 815 2083 2 625 62 858 52,537 1 756
1986: Jan. 3 577 1 818 2161 2 562 63 466 53,411 2 132 Feb. 3 622 1 818 2147 2 564 63 449 51,198 1 358 Mar. 3 635 1 799 2 225 2 563 63 713 51,434 1 831 Apr. 3 571 1 716 2190 2 471 62 040 63,850 2109 May 3 568 1614 2 145 2 348 60 657 57,174 1 817 June 3 617 1 548 2174 2 327 61 156 53,303 1 958 July 3 658 1 579 2 255 2 286 61 531 54,359 1964 Aug. 3 667 1 545 2 276 2 407 61984 53,440 1 875 Sept. 3 693 I 553 2 239 2 331 62 172 55,016 1 815 Oct. 3 684 1 564 2251 2 337 62 549 56,858 1 807 Nov. 3 616 I 546 2 211 2268 62 845 56,499 1 712 Dec. 3 705 1 505 2 233 2262 62 991 57,775 1 367
1987: Jan. 3 698 1497 2 215 2 262 62 984 56,487 1 669 Feb. 3 791 1 512 2 191 2 231 63 074 54,735 1 511 Mar. 3 806 1 515 2143 2263 63 288 58,867 1944
tFigures prior to April 1985 refer to widow with dependent children cases. As from April 1985, they refer to single parent family cases and include cases of deserted/separated/divorced spouse with dependent children, which were previously grouped under 'Others'. The data before and after April 1985 are therefore not strictly comparable.
Hong Kong Monthly Digest of Statistics April 1987 93

SOCIAL STATISTICS
9.5 SPECIAL NEEDS ALLOWANCE SCHEMES
Number of cases (as at end of period) Amount of Number of new payment ($'000) applications
Year (ending Disability Old age 31 March)/month allowance allowance Total
1982 31 614 171 903 203 517 436,729 34 680
1983 35 824 186 129 221 953 622,887 35 384
1984 40 138 200 173 240 311 709,178 35 435
1985 44 896 215 199 260 095 832,296 35 700
1986 48 336 230 434 278 770 909,564 38 158
1987 52 704 241 787 294 491 965,077 41 472
1985: Mar. 44 896 215 199 260 095 72,783 3 458 Apr. 45 224 216 067 261 291 74,232 3 077 May 45 594 216 984 262 578 74,623 3 086 June 46 105 218 021 264 126 74,458 2 769 July 46 171 219 428 265 599 74,612 3 122 Aug. 46 436 220 611 267 047 75,181 3 099 Sept. 46 578 222 218 268 796 75,499 3 190 Oct. 46 731 223 691 270 422 75,956 3 461 Nov. 47 016 225 579 272 595 76,429 3 798 Dec. 47 249 226 931 274 180 77,050 3 151
1986: Jan. 47 620 228 695 276 315 77,161 3 663 Feb. 47 917 229 472 277 389 77,191 2 546 Mar. 48 336 230 434 278 770 77,173 3 196 Apr. 48 470 230 729 279 199 78,438 3 308 May 48 431 230 089 278 520 78,145 3 020
June 48 981 231 017 279 998 78,599 3 253 July 49 436 232 618 282 054 78,737 3 247 Aug. 49 940 233 816 283 756 79,563 3 188 Sept. 50 360 235 328 285 688 80,114 3 923
Oct. 50 911 237 058 287 969 80,422 4206
Nov. 51 305 238 553 289 858 81,084 3 698 Dec. 51 499 240 068 291 567 81,964 3. 557
1987: Jan. 51 814 240482 292 296 82,493 3 489 Feb. 52 294 241 205 293 499 82,733 3 184 Mar. 52 704 241 787 294 491 82,786 3 399
94 Hong Kong Monthly Digest of Statistics April 1987

SECTION 10 ENERGY
10.1 ELECTRICITY CONSUMPTION
Terajoule
Street Export Year/month Domestic Commercial Industrial lighting to China Total
1981 8 733.10 17 339.54 15 405.95 140.95 851.14 42 470.69 1982 9 227.42 19 952.86 15 435.68 152.97 978.75 45 747.68 1983 10 685.11 22 849.49 16 820.00 171.03 1 323.25 51 848.88 1984 10 816.89 24 609.49 18 543.34 195.95 2 662.90 56 828.57 1985 11519.16 26 793.44 18 819.49 207.71 3 780.30 61 120.10 1986 12 807.92 29 179.50 21 391.42 213.16 4 349.75 67 941.76
1985: Mar. 765.88 1 727.64 1 137.87 19.64 283.44 3 934.47 Apr. 770.00 1 900.01 1 412.91 18.57 266.66 4368.15 May 876.83 2 363.55 1 674.53 17.50 245.33 5 177.73 June 1 096.48 2 403.40 1 680.53 16.33 266.53 5 463.26 July 1 215.15 2 607.27 1 785.90 15.26 291.30 5 914.87 Aug. 1411.11 2 809.83 1 900.10 15.98 388.77 6 525.79 Sept. 1 206.65 2 534.51 1 696.96. 16.61 304.64 5 759.38 Oct. 1 021.85 2 635.85 1 789.32 16.49 341.44 5 804.94 Nov. 867.24 2 364.25 1 709.87 17.o3 346.81 5 305.19 Dec. 742.86 2 007.30 1 520.26 17.69 437.83 4 725.95
1986: Jan. 844.45 2 054.26 1 534.19 17.26 484.89 4 935.05 Feb. 803.14 1 745.47 1 080.86 17.69 329.75 3 976.91 Mar. 768.82 1 744.47 1 284.48 17.54 355.84 4 171.16 Apr. 860.80 2 321.15 1 761.67 17.72 403.55 5 364.89 May 901.11 2 557.88 1 860;63 17.63 298.27 5 635.52 June 1 213.04 2 742.65 1 949.18 17.76 258.00 6 180.63 July 1 519.79 2 960.79 2 093.92 18.03 43.09 6 635.62 Aug. 1 536.85 2 913.91 2 107.75 17.76 329.27 6 905.54 Sept. 1 615.58 2 945.41 2 084.90 17.85 459.79 7 123.53 Oct. 1 121.45 2 699.06 2 023.39 17.96 456.20 6 318.07 Nov. 857.67 2 338.85 1 826.81 17.99 415.37 5 456.68 Dec. 765.21 2 155,60 1 783.65 17.97 515.74 5 238.17
1987: Jan. 842.49 2 074.44 1 629.11 18.15 522.05 5 086.23 Feb. 839.90 2 151.41 1 392.69 18.29 504.27 4 906.56 Mar. 802.83 2 280.37 1 784.57 18.12 588.51 5 474.40
10.2 GAS CONSUMPTION
Terajoule
Year/month Domestic Commercial Industrial Total
1981 2 024.19 1 783.99 225.27 4 033.45 1982 2 499.75 2 138.15 219.90 4 857.80 1983 3 020.82 2 670.26 233.14 5 924.23 1984 3 475.56 3 174.05 257.33 6 906.94 1985 4 036.22 3 669.05 273.45 7 978.72 1986 4 593.27 4 122.74 327.05 9 043.06
1985: Mar. 388.95 308.05 20.06 717.05 Apr. 392.61 318.05 24.14 734.80 May 342.16 302.80 25.19 670.15 June 307.12 293.14 22.84 623.09 July 272.78 290.38 22.41 585.58 Aug. 263.15 294.79 23.16 581.11 Sept. 263.88 294.90 22.28 581.07 Oct. 304.07 305.97 21.67 631.72 Nov. 329.56 310.62 23.52 663.70 Dec. 379.29 320.90 23.62 723.80
1986: Jan. 449.78 337.68 23.49 810.95 Feb. 482.23 341.06 19.60 842.89 Mar. 406.14 327.03 20.91 754.08 Apr. 378.35 341.30 24.79 744.44 May 399.03 337.39 25.68 762.10 June 382.14 335.46 29.16 746.76 July 331.85 327.07 29.28 688.20 Aug. 295.65 341.56 31.00 668.21 Sept. 306.94 340.79 29.18 676.90 Oct. 323.12 344.77 30.08 697.97 Nov. 382.82 370.07 32.30 785.19 Dec. 455.23 378.55 31.56 865.35
1987: Jan. 518.56 402.23 33.07 953.86 Feb. 510.10 388.78 25.50 924.37 Mar. 414.30 398.87 32.50 845.67
Hong Kong Monthly Digest of Statistics April 1987 95
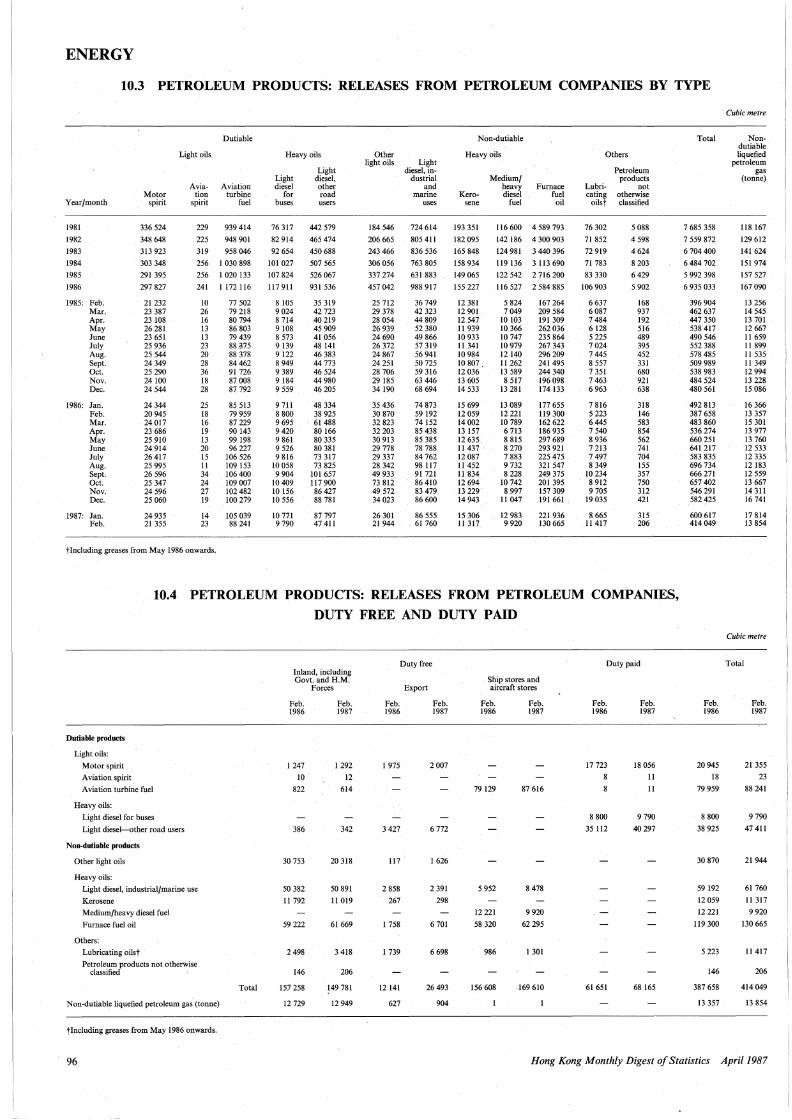
ENERGY
10.3 PETROLEUM PRODUCTS: RELEASES FROM PETROLEUM COMPANIES BY TYPE
Year/month
1981
1982
1983
1984
1985
1986
1985: Feb. Mar. Apr. May June July Aug. Sept. Oct. Nov. Dec.
1986: Jan. Feb. Mar. Apr. May June July Aug. Sept. Oct. Nov. Dec.
1987: Jan. Feb.
Dutiable
Light oils
Avia- Aviation Motor tion turbine
spirit spirit fuel
336 524
348 648
313 923
303 348
291 395
297 827
21232 23 387 23 108 26 281 23 651 25 936 25 544 24349 25 290 24100 24 544
24 344 20 945 24017 23 686 25 910 24914 26 417 25 995 26 596 25 347 24 596 25 060
24 935 21 355
229 939 414
225 948 901
319 958 046
256 I 030 898
256 I 020 133
241 I 172 ll6
10 26 16 13 13 23 20 28 36 18 28
25 18 16 19 13 20 15 II 34 24 27 19
14 23
77 502 79 218 80 794 86 803 79 439 88 .375 88 378 84462 91 726 87 008 87 792
85 513 79 959 87 229 90 143 99 198 96 227
106 526 109 153 106 400 109 007 102 482 100 279
105 039 88 241
tincluding greases from May 1986 onwards.
Heavy oils
Light Light diesel, diesel other
for road buses users
76 317
82 914
92 654
101 027
107 824
117911
8 105 9 024 8 714 9 108 8 573 9 139 9122 8 949 9 389 9184 9 559
9 711 8 800 9 695 9420 9 861 9 526 9 816
10 058 9 904
10409 10 156 10 556
10 771 9 790
442 579
465 474
450 688
507 565
526 067
931 536
35 319 42 723 40 219 45 909 41 056 48 141 46 383 44 773 46 524 44980 46 205
48 334 38 925 61 488 80 166 80 335 80 381 73 317 73 825
101 657 117 900 86 427 88 781
87 797 47 411
Other light oils Light
184 546
206 665
243 466
306 056
337 274
457 042
25 712 29 378 28 054 26 939 24 690 26 372 24 867 24251 28 706 29 185 34190
35 436 30 870 32 823 32 203 30913 29 778 29 337 28 342 49 933 73 812 49 572 34 023
26 301 21 944
diesel, industrial
and marine
uses
724 614
805 411
836 536
763 805
631 883
988 917
36 749 42 323 44 809 52 380 49 866 57 319 56941 50 725 59 316 63 446 68 694
74 873 59192 74 152 85 438 85 385 78 788 84 762 98 117 91 721 86410 83 479 86 600
86 555 61 760
Non-dutiable
Heavy oils
Medium/ heavy
Kero- diesel Furnace
fuel oil sene fuel
193 351
182 095
165 848
158 934
149 065
155 227
12 381 12 901 12 547 II 939 10 933 II 341 10984 10 807. 12036 13 605 14 533
15 699 12059 14002 13 157 12 635 11437 12087 11452 II 834 12 694 13 229 14943
15 306 II 317
116 600 4 589 793
142 186 4 300 903
124 981 3 440 396
119 136 3 113 690
122 542 2 716 200
116 527 2 584 885
5 824 7049
10 103 10 366 10 747 10 979 12140 II 262 13 589 8 517
13 281
13 089 12 221 10 789 6 713 8 815 8 270 7 883 9 732 8 228
10 742 8 997
II 047
12 983 9920
167 264 209 584 191 309 262 036 235 864 267 343 296 209 241 495 244 340 196 098 174 133
177 655 119 300 162 622 186 935 297 689 293 921 225 475 321 547 249 375 201 395 157 309 191 661
221 936 130 665
Others
Petroleum products
Lubri- not eating otherwise
oilst classified
76 302
71 852
72 919
71 783
83 330
106 903
6 637 6087 7 484 6128 5 225 7 024 7 445 8 557 7 351 7 463 6 963
7 816 5 223 6445 7 540 8 936 7 213 7 497 8 349
10 234 8 912 9 705
19 035
8 665 11417
5 088
4598
4624
8 203
6 429
5 902
168 937 192 516 489 395 452 331 680 921 638
318 146 583 854 562 741 704 155 357 750 312 421
315 206
10.4 PETROLEUM PRODUCTS: RELEASES FROM PETROLEUM COMPANIES,
DUTY FREE AND DUTY PAID
Dutiable products
Light oils:
Motor spirit
Aviation spirit
Aviation turbine fuel
Heavy oils:
Light diesel for buses
Light diesel-other road users
Non-dutiable products
Other light oils
Heavy oils:
Light diesel, industrial/marine use
Kerosene
Medium/heavy diesel fuel
Furnace fuel oil
Others:
Lubricating oilst
Petroleum products not otherwise classified
Non-dutiable liquefied petroleum gas (tonne)
tincluding greases from May 1986 onwards.
Total
Inland, including Govt. and H.M.
Feb. 1986
1247
10
822
386
30 753
50 382
11 792
59 222
2498
146
157 258
12 729
Forces
Feb. 1987
1292
12
614
342
20 318
50 891
II 019
61669
3 418
206
149 781
12 949
Duty free
Feb. 1986
1975
3 427
117
2 858
267
I 758
I 739
12 141
627
Export
Feb. 1987
2007
6 772
1626
2 391
298
6 701
6698
26 493
904
Ship stores and aircraft stores
Feb. 1986
79129
5 952
12221
58 320
986
156 608
Feb. 1987
87 616
8 478
9 920
62 295
1301
169 610
Duty paid
Feb. 1986
17 723
8 800
35 112
61651
Feb. 1987
18 056
II
II
9 790
40297
68 165
Total
7 685 358
7 559 872
6 704 400
6 484 702
5 992 398
6 935 033
396 904 462 637 447 350 538 417 490 546 552 388 578 485 509 989 538 983 484 524 480 561
492 813 387 658 483 860 536 274 660 251 641217 583 835 696 734 666 271 657 402 546 291 582 425
600 617 414049
Feb. 1986
20945
18
79 959
8 800
38 925
30 870
59 192
12059
12 221
119 300
5 223
146
387 658
13 357
Cubic metre
Nondutiable liquefied
petroleum gas
(tonne)
118 167
129 612
141624
151974
157 527
167 090
13 256 14 545 13 701 12 667 II 659 11 899 11 535 II 349 12 994 13 228 15 086
16 366 13 357 15 301 13 977 13 760 12 533 12 335 12 183 12 559 13 667 14 311 16 741
17 814 13 854
Cubic metre
Total
Feb. 1987
21 355
23
88 241
9 790
47411
21944
61 760
11 317
9 920
130 665
11 417
206
414 049
13 854
96 Hong Kong Monthly Digest of Statistics April 1987

Year§/ quarter
1980--1981
1981-1982
1982-1983
1983-1984
1984-1985
1985-1986
1984: Oct.-Dec.
1985: Jan.-Mar. Apr.-June July-Sept. Oct.-Dec.
1986: Jan.-Mar. Apr.-June July-Sept. Oct.-Dec.
SECTION 11 MISCELLANEOUS
11.1 RF:VENUE AND EXPENDITURE OF THE HONG KONG GOVERNMENT UNDER THE GENERAL REVENUE ACCOUNT
Direct taxes
8,216
10,882
12,162
11,739
13,816
16,993
4,247
7,927 1,713
461 5,252
9,567 2,346
500 5,966
Revenue
Indirect Other taxes revenue
5,708
6,156
5,481
7,701
8,443
ll,107
2,388
2,665 2,557 2,242 3,126
3,182 2,583 2,655 3,767
16,366
17,275
13,455
10,960
14,084
13,141
2,600
3,589 5,141 2,447 2,724
2,829 3,071 2,789 2,538
Total revenue
30,290
34,313
31,098
30,400
36,343
41,241
9,235
14,181 9,411 5,150
11,102
15,578 8,000 5,944
12,271
Actual expenditure during the period
17,706
24,830
21,844
24,213
27,396
30,745
6,991
7,195 7,120 7,467 7,863
8,295 8,110 8,242 8,565
Expenditure
Transfers to Capital Works Reserve Fundt
10,800
7,700
7,758
5,800
1,500
3,553 1,350 1,350 1,350
1,750 720
1,080
Transfers to other Fundst
5,887
2,948
1,954
l,480
1,748
3,253
300
878 300 300
l,800
853 291 291 291
§Fiscal year from l April to 31 March.
$million
Total expenditure on General
Revenue Account
23,593
27,778
34,598
33,393
36,902
39,798
8,791
11,626 8,770 9,117
11,013
10,898 9,121 8,533 9,936
tThe Capital Works Reserve Fund was established on 20 January 1982 by Resolution of the Legislative Council for the purpose offinancing the Public Works Programme and acquisitions of land. tThese include transfers to Development Loan Fund, Home Ownership Fund, Mass Transit Fund and Student Loan Fund.
11.2 LOCAL AND OVERSEA COMPANIES REGISTERED AND DISSOLVED
Local companies
Amount of authorized share capital
Year/month
1981
1982
1983
1984
1985
1986
1985: Mar. Apr. May June July Aug. Sept. Oct. Nov. Dec.
1986: Jan. Feb. Mar. Apr. May June July Aug. Sept. Oct. Nov. Dec.
1987: Jan. Feb. Mar.
Under $10,000
3 275
2 355
l 566
1498
l 795
l 389
103 165 213 102 145 174 255 138 132 122
121 82 94
109 132 72
133 81
123 168 163 Ill
127 148 179
$10,000 $50,000 $100,000 and and and
under under under $50,000 $100,000 $500,000
7 355
6070
6280
7 797
12 342
11 432
l 074 l 007 1089
956 l 098 l 351 1628
887 l 083
733
798 678 705 905 967 635
l 078 1184 l 119 l 185 l 060 l 118
1246 l 342 l 508
235
232
226
229
173
182
20 12 19 10 15 13 17 17 15 16
12 28 7 9
24 17 12 8
16 24 16 9
16 15 18
2 373
2167
1891
2100
2 121
1 875
175 159 170 128 218 146 234 174 214 195
174 137 121 165 216 120 171 176 163 167 138 127
116 143 145
§Including l company restored to the Register. tincluding 7 companies restored to the Register. pncluding 2 companies restored to the Register.
$500,000 and
under $1,000,000
980
849
646
733
749
670
65 62 58 46 60 61 80 62 70 82
63 36 55 87 65 46 63 52 53 55 46 49
52 41 62
Hong Kong Monthly Digest of Statistics April 1987
u__ ___________________ _
$1,000,000 and
under $5,000,000
1201
909
659
750
865
780
76 67 70 50 91 54 84 69 84 73
73 69 44 63 86 45 67 74 75 71 61 52
45 56 55
$5,000,000 and
under $10,000,000
113
67
49
49
59
61
4 6 5 2 7 4 5 4 4 8
4 l 6 8 9
4 3 6 9 8 3
2 4 l
$10,000,000 and above
79
63
35
34
45
36
7 4 2 2 4 4 7 4 3 2
4 2 4 5 3 2 5 4 2
2 l 6
Guarantee
Total
No. of com
panies registered
Amount of
authorized
share capital
$million
Total dis
solved during period
Total existing at
end of period
266 15 877 4,749.56 829 96 261 t
271 12 983 3,939.85 943 108 302§
206 11 558 3,469.46 l 181 118 680
244 13 434 3,277.92 l 394 130 722t
316 18 465 3,664.43 l 551 147 636
318 16 743 3,356.66 2 393 161 986
23 7
20 23 23 19 31 42 57 26
24 24 26 28 30 22 30 21 24 34 31 24
5 12 24
l 547 1489 1646 l 319 1661 l 826 2 341 l 397 1662 1257
1273 l 057 l 062 l 379 l 532
959 l 563 1603 l 581 l 713 1523 1498
1611 l 762 1998
577.38 429.92 259.69 157.32 295.97 217.56 449.41 229.54 292.49 265.31
373.66 174.92 219.56 501.57 402.39 147.61 329.38 317.62 233.61 213.98 216.86 225.49
160.29 181.13 293.67
103 134 318 142 135 665 115 137 196 57 138 458
139 139 980 199 141 607 142 143 806 153 145050 190 146 522 143 147 636
131 148 778 210 149 625 136 150 551 179 151 751 119 153 164 150 153973 109 155 427 282 156 748 311 158 018 297 159 434 273 160 684 196 161 986
205 163 392 191 164 963 154 166 807
Oversea companies
Total registered
during period
207
213
257
215
231
288
16 18 24 17 32 20 21 24 22 15
23 11 30 27 44 18 13 29 17 30 25 21
13 22 20
Total ceased
business
during period
Total existing at
end of period
58 l 547
61 1699
84 l 872
82 2 005
144 2 092
142 2 238
11 20 13 3
18 8
20 14 6
16
8 11 15 13 12 11 7
13 13 20 11 8
13 13 11
2017 2015 2026 2040 2054 2066 2067 2077 2093 2092
2107 2107 2122 2 136 2168 2 175 2 181 2197 2 201 2 211 2 225 2 238
2238 2 247 2 256
97

FIRE SERVICES
Year /quarter
1981
1982
1983
1984
1985
1986
1985: lst qtr.
2ndqtr.
3rd qtr.
4th qtr.
1986: lst qtr.
2nd qtr.
3rd qtr.
4th qtr.
1987: lst qtr.
Year/quarter
1981
1982
1983
1984
1985
1986
1985: lst qtr.
2nd qtr.
3rd qtr.
4th qtr.
1986: lst qtr.
2nd qtr.
3rd qtr.
4th qtr.
1987: lst qtr.
Hong Kong Island
5 401
5 329
6 058
5 556
6 138
6895
I 196
1 613
1680
I 649
1 671
1 700
I 915
1609
I 846
Com. plaints
197 645
96 710
126 426
161 756
103 984
33 648
25 256
29 255
24791
24 682
9172
9 342
7 033
8101
8 720
Kowloon
9 479
9 345
10 358
10 224
9 999
II 749
2 337
2 354
2 433
2 875
3 035
2 735
3 106
2 873
3 305
Dangerous goods, timber yards
Factories
and storage
7 790
7 559
7 223
7 605
8 764
II 469
2161
2 214
2 269
2120
2161
2 985
3 250
3 073
3 312
21 843
8 436
984
509
145
90
65
53
10
17
57
15
New Territories
6 785
6 594
7 515
7 917
8 179
11 059
I 824
1695
I 762
2 898
3 163
2471
2604
2 821
3 292
Fire instal
lations, neon
signs, etc.
6 312
6907
6 644
7056
7 837
13 428
1 833
2092
2080
1 832
2 690
3 905
3 479
3 354
3 268
11.3 FIRE SERVICES
(A) FIRE, SPECIAL SERVICE, AMBULANCE CALLS AND FATALITIES
Fire and special service calls
Total calls
21665
21268
23 931
23 697
24 316
29 703
5 357
5 662
5 875
7 422
7 869
6 906
7 625
7 303
8 443
Fire calls Ind us- Non-
trial industrial
526
408
479
545
538
648
114
109
131
184
168
122
175
183
149
9 004
7 905
8 875
9 985
9 307
10 567
2 307
I 920
1 774
3 306
3 673
1 989
2 128
2 777
3 266
False alarms
6 290
6 782
7 764
6 949
7 660
9 862
1481
I 895
2084
2 200
2 356
1942
2 993
2 571
3 115
Special service
calls
5 845
6173
6 813
6218
6 811
8 626
I 455
I 738
1 886
I 732
1672
2 853
2 329
I 772
1 913
(B) FIRE PREVENTION STATISTICSt
Fire inspections
Places of
public enter
tainment
3 505
2 397
2 306
2 705
2 836
3 190
544
688
722
882
739
746
931
774
I 071
Restaurants
and night clubs
5 872
5 873
8 076
12 966
18 214
13 089
5 066
3 801
4810
4 537
3413
3 333
3 346
2 997
2920
Schools Ventilation
systems
1284
982
810
I 024
1 110
1 835
315
264
282
249
312
357
404
762
561
8 560
8 086
8005
7 829
8 435
1 343
2 119
2 013
2 240
2063
312
346
364
321
311
Miscellaneous
Total
14 863 267 674
3 929 140 879
4 278 164 752
4 823 206 273
4 696 156 021
5 41'8
1187
I 066
I 094
1349
I 181
1288
1142
I 807
1433
83 510
38 546
41446
38 298
37 731
19989
22 311
20006
21204
21 597
Ambulance calls Fatalities
Emergency Removal Fire Ind us- Non-
Special services
189 179
203 634
220 242
220 768
235 200
250 323
56250
59 594
59 791
59 565
60 310
62404
64 836
62 773
63 342
63 788
72 591
83 281
92 444
106 766
115 251
24421
26 116
27 250
28 979
27 347
29 178
29 468
29 258
29 138
trial industrial
19
14
13
25
40
40
52
28
31
10
15
367
330
375
340
322
408
76
63
89
94
92
113
117
86
81
Fire prevention
Full Building/
Area Surveys
5 231
1261
1 352
1309
1309
I 382
Plans Licences finalised issued/
New Ventila-projects ting
11664
8 272
6 809
7 346
7 347
8 555
I 772
I 733
I 883
1959
I 897
2 103
2227
2 328
2109
systems
1966
511
457
449
549
587
renewed
3 580
3 979
4490
4 545
4 871
4984
1222
I 159
1234
1 256
1152
I 180
"1311
I 341
1192
Fire hazard abate
ment notices issued
10 833
3 669
4 714
5 312
5 727
6120
1 987
1435
1271
I 034
1173
I 363
I 764
1820
1305
Prosecutions undertaken
Fines Cases imposed
3 907 l,774,922
2 028 1,042,555
2 889 1,475,395
2 815 1,262,111
4 677 1,680,940
1 500 1,153,385
917 473,920
I 328 444,420
1 556 503,255
876 259,345
557 218,425
327 276,335
261 319,375
355 339,250
263 361,200
tMethods of classification and counting for the statistics on fire inspection and fire prevention have been revised since I January 1986. Figures as from lst quarter 1986 onwards are new series which-are not strictly comparable with the previous series.
98 Hong Kong Monthly Digest of Statistics April 1987

Year/month
1981
1982
1983
1984
1985
1986
1985: Mar. Apr. May June July Aug. Sept. Oct. Nov. Dec.
1986: Jan. Feb. Mar. Apr. May June July Aug. Sept. Oct. Nov. Dec.
1987: Jan. Feb. Mar. Apr.
Note: Water restrictions were in force: (a) from 8.10.81to25.10.81, on a 16-hour supply daily basis; (b) from 26.10.81to4.5.82, on a 10-hour supply daily basis; (c) from 5.5.82 to 28.5.82, on a 16-hour supply daily basis.
11.5
WATER SUPPLIES AND CLIMATE
11.4 WATER SUPPLIES
Mill ion cubic metres
Storage at Consumption beginning of Import
period Total Daily mean from China
308.064 507.412 l.390 210.912
260.341 519.461 l.423 239.352
434.020 592.030 1.622 250.748
528.664 627.109 1.713 285.472
427.579 636.977 1.745 319.378
396.225 703.015 1.926 360.191
398.373 49.662 l.602 348.591 48.934 l.631 335.597 55.602 l.794 33.329 322.401 52.154 l.738 32.249 348.650 56.630 l.827 33.323 352.541 57.516 l.855 33.194 420.828 54.961 l.832 32.388 467.667 57.549 l.856 33.337 447.514 55.399 l.847 31.332 422.319 55.ll9 l.778 35.373
396.225 55.024 l.775 32.390 368.561 44.858 l.602 28.118 349.963 54.940 l.772 293.147 55.492 1.850 244.672 60.983 1.967 37.312 270.054 60.133 2.004 35.655 311.222 63.246 2.040 36.895 370.092 63.977 2.064 36.938 409.189 62.124 2.071 35.749 408.945 62.880 2.028 36.995 385.336 59.068 1.969 35.852 367.161 60.290 1.945 44.287
351.562 57.575 l.857 46.621 336.936 49.906 l.782 47.037 330.069 60.222 1.943 l.216 291.467
METEOROLOGICAL OBSERVATIONS
Royal Observatory King's Park Waglan Island
Mean Air temperature Mean Mean Mean Total Total Prevailing Mean pressure Mean Mean dew relative amount Total bright evapora- wind wind
Year/month at M.S.L. maximum Mean minimum point humidity of cloud rainfall sunshine tion direction speed
hectopascals oc oc oc oc % % mm hours mm degrees km/h
1981 1 013.l 25.5 23.l 21.2 18.7 77 68 1 659.5 1 802.9 1 383.4 080 23.7
1982 1 013.0 25.2 22.9 21.0 18.7 78 68 3 247.5 1 785.0 1429.1 080 22.8
1983 l 013.7 25.4 23.0 21.1 18.7 78 69 2 893.8 1 859.4 1 365.3 070 25.0
1984 1 012.5 24.9 22.5 20.7 18.l 77 72 2017.0 l 701.9 1276.6 080 23.7
1985 1 012.3 25.0 22.6 20.8 18.8 80 71 2191.4 l 711.2 1199.0 080 22.6
1986 1 013.l 25.3 22.8 20.8 18.4 78 63 2 338.3 2014.0 1 315.2 080 24.8
1985: Mar. l 018.2 19.0 16.7 15.0 13.6 82 88 64.2 51.7 63.4 030 22.4 Apr. 1 011.9 23.1 20.5 18.9 17.2 82 80 271.3 82.0 87.9 070 18.9 May 1 009.l 29.7 26.8 25.0 23.6 83 63 103.3 206.2 130.5 090 15.7 June 1 002.2 29.4 27.2 25.5 24.2 84- 82 378.4 94.5 94.4 090 29.4 July 1 006.9 31.2 28.4 26.4 24.4 80 61 189.8 226.7 146.2 230 16.7 Aug. 1 002.9 30.6 28.0 26.l 25.l 85 70 501.4 188.4 125.6 100 17.4 Sept. l 009.6 29.0 26.8 25.l 23.6 83 77 335.5 142.4 106.4 080 27.8 Oct. 1 014.1 28.0 25.8 24.0 20.9 76 54 56.l 218.2 134.2 080 25.9 Nov. 1 017.4 24.6 22.4 20.6 17.6 74 58 45.9 184.0 106.0 080 27.2 Dec. 1 020.2 19.7 17.2 14.9 10.6 67 50 12.9 182.3 99.6 360 27.4
1986: Jan. 1 021.2 18.8 15.9 13.6 9.0 65 32 t 230.2 94.3 070 27.2 Feb. 1 019.4 16.9 14.7 13.0 10.3 76 78 68.8 94.1 62.3 070 30.2 Mar. l 015.6 20.1 17.6 15.6 13.7 80 76 51.8 94.3 58.9 020 24.5 Apr. 1 013.8 25.2 22.6 20.8 19.7 84 78 ll5.7 104.9 89.1 080 20.2 May 1 007.5 28.4 25.9 24.2 23.0 84 76 378.7 147.8 116.4 090 22.6 June 1 005.0 30.3 28.0 26.2 24.8 83 75 415.9 174.0 136.0 230 22.0 July 1 006.0 31.2 28.5 26.4 25.l 82 62 547.3 222.1 150.4 120 20.8 Aug. 1 004.1 31.6 29.0 26.9 24.9 79 58 274.9 199.6 144.0 090 19.5 Sept. 1 009.9 30.4 27.8 25.8 22.3 74 54 264.7 217.5 158.5 100 22.2 Oct. 1 015.6 27.3 25.0 23.2 19.7 73 58 61.3 190.3 134.5 080 32.6 Nov. 1 017.9 22.8 20.5 18.5 15.6 75 60 112.6 161.1 93.5 360 29.7 Dec. 1 021.5 20.0 17.7 15.8 12.9 75 50 46.6 178.l 77.3 080 26.4
1987: Jan. 1 022.1 19.7 17.3 15.4 11.7 71 50 12.5 183.3 93.3 070 27.1 Feb. l 020.6 20.7 18.3 16.6 14.1 78 57 ll.2 147.5 75.0 080 24.0 Mar. l 014.9 23.5 21.3 19.7 18.8 86 84 234.0 62.8 57.3 080 24.3
NORMALS FOR MARCH
1 016.2 21.3 18.5 16.3 15.0 82 76 54.8 101.4 97.3 070 21.4
tTrace.
Hong Kong Monthly Digest of Statistics April 1987 99

SUMMARY STATISTICS FROM THE 1985 SURVEY OF BUILDING, CONSTRUCTION AND REAL ESTATE SECTORS
16.1 PRINCIPAL STATISTICS FOR ALL BUILDING AND CIVIL ENGINEERING CONTRACTORS IN THE 1985 SURVEY OF BUILDING, CONSTRUCTION AND REAL ESTATE SECTORS,
ANALYSED BY TRADE GROUP
Trade group
New construction works-pre-erection works at building and construction sites
New construction works-architectural and civil engineering works at building and construction sites
New construction works-demolition and minor new construction works
Renovation and maintenance at erected buildings and structures
Special trades-erection and general finishing
Special trades-electrical, mechanical, gas, water and other fittings
Special trades-not elsewhere classified
Total
Number of establishments
190
653
244
2 815
1 313
1940
165
7 321
Number of persons directly
engaged
4 927
37 315
2 569
15 881
9 320
25 553
I 583
97 148
Compensa- Consumption tion of of materials
employees and supplies; and payments fuel, electricity
to labour- and water; and only sub- maintenance
contractors services
425
5,294
176
890
738
2,506
92
10,120
505
5,935
143
890
705
3,602
94
11,875
Value of subcontract work
rendered by fee sub
contractors
409
ll,051
ll6
1,330
173
714
27
13,821
Misc~llaneous
operating expenses
158
1,294
28
207
147
444
14
2,292
Gross value of construc
tion work performed
1,490
23,977
486
3,510
1,898
7,731
241
39,333
$million unless otherwise specified
Business receipts apart
from construction
35
445
18
28
ll9
I
649
National accounts
value added
464
6,136
205
!,Ill
908
3,122
107
12,053
Gross additions to fixed assets
78
201
6
36
49
35
5
409
16.2 PRINCIPAL STATISTICS FOR ALL BUILDING AND CIVIL ENGINEERING CONTRACTORS IN THE 1985 SURVEY OF BUILDING, CONSTRUCTION AND REAL ESTATE SECTORS,
ANALYSED BY GROSS VALUE OF CONSTRUCTION WORK PERFORMED
Gross value of construction work performed ($'000)
Under 500
500-1,999
2,000-4,999
5,000-9,999
10,000-19,999
20,000-49,999
50,000-99,999
100,000 and over
Total
Number of establishments
3 770
1942
739
349
228
164
63
65
7 321
Number of persons directly
engaged
10 944
14043
II 859
7 842
8 200
10 107
8 363
25 790
97 148
Compensa- Consumption tion of of materials
employees and supplies; and payments fuel, electricity
to labour- and water; and only sub- maintenance
contractors services
245
716
818
822
930
1,369
1,165
4,055
10,120
258
635
735
824
1,013
1,662
1,423
5,324
ll,875
Value of subcontract work
rendered by fee sub
contractors
53
349
597
631
918
1,589
1,404
8,280
13,821
Miscellaneous
operating expenses
91
167
179
153
223
335
245
899
2,292
Gross value of construc
tion work performed
668
1,965
2,396
2,529
3,193
5,047
4,308
19,226
39,333
$ million unless otherwise specified
Business receipts apart
from construction
31
25
34
31
51
ll5
73
290
649
National accounts
value added
301
854
930
956
1,102
1,594
1,322
4,994
12,053
Gross additions to fixed assets
42
59
60
18
49
93
-3 91
409
16.3 PRINCIPAL STATISTICS FOR ALL ARCHITECTURAL, SURVEYING AND PROJECT ENGINEERING ESTABLISHMENTS IN THE 1985 SURVEY OF BUILDING,
CONSTRUCTION AND REAL ESTATE SECTORS, ANALYSED BY TRADE
Trade
Architectural design
Real estate surveying, valuation and consultancy
Structural engineering
Building services engineering
Civil and geotechnical engineering
Architectural design and structural engineering
Combination of preceding services
Total
tDenotes less than $0.5 million in magnitude.
100
Number of establishments
219
146
47
27
38
49
48
575
Number of persons directly Compensation
engaged of employees
I 743
2 551
203
703
962
I 029
2078
9270
156
256
17
65
132
93
269
988
Consumption of sundry
supplies; fuel, electricity and
water; and maintenance
services
II
22
4
15
66
Payments for
commission work
84
33
14
II
33 53
233
Miscellaneous
operating expenses
61
ll7
7
20
33
29
76
344
Service income
351
585
38
107
189
194
533
1,998
$ million unless otherwise specified
Other business receipts
19
37
t
23
19
110
National accounts
value added
206
450
26
72
161
132
405
l,452
Gross additions to fixed assets
9
12
32
Hong Kong Monthly Digest of Statistics April 1987

1985 SURVEY OF BUILDING, CONSTRUCTION AND REAL ESTATE SECTORS
16.4 PRINCIPAL STATISTICS FOR ALL REAL ESTATE DEVELOPMENT, LEASING, BROKERAGE AND MAINTENANCE MANAGEMENT ESTABLISHMENTS IN THE 1985 SURVEY OF BUILDING,
CONSTRUCTION AND REAL ESTATE SECTORS, ANALYSED BY TRADE
$ million unless otherwise specified
Trade
Real estate development and/or leasing
Real estate maintenance management
Real estate brokerage and agency
Total
Number of establishments
2483
248
922
3 652
Number of persons directly Compensation
engaged of employees
12 320 712
12 801 414
3 792 171
28913 1,298
Consumption of sundry
supplies; fuel, electricity and
water; and Miscellaneous maintenance operating
services expenses
599
560
21
1,180
3,531
338
362
4,230
Gross margin of real estate
development projects
6,217
6,217
Service and rental income
8,186
1,383
580
10,149
National Other accounts
business value receipts added
1,748 13,189
56 526
237 372
2,040 14,087
16.5 CONSTRUCTION SITE STATISTICS OF BUILDING AND CIVIL ENGINEERING CONTRACTORS IN THE 1985 SURVEY OF BUILDING, CONSTRUCTION AND
REAL ESTATE SECTORS, ANALYSED BY PUBLIC/PRIVATE SECTOR
Gross additions to fixed assets
-841
26
-808
$ million unless otherwise specified
Public/private sector
Public sectort
Private sector
Total
· Number of sites
645
1148
l 793
Total
6,346
11,013
17,359
Major project expenses
Materials and supplies as input Wages to Sub-contract
for construction work operatives work
1,704 428 4,214
2,869 566 7,579
4,572 993 11,793
Note: tPublic sector includes Hong Kong Government, Mass Transit Railway Corporation and Kowloon-Canton Railway Corporation.
16.6 CONSTRUCTION SITE STATISTICS OF BUILDING AND CIVIL ENGINEERING CONTRACTORS IN THE 1985 SURVEY OF BUILDING, CONSTRUCTION AND
REAL ESTATE SECTORS, ANALYSED BY NATURE OF CONSTRUCTION ACTIVITY
Gross value of construction
work performed
7,163
12,490
19,652
$ million unless otherwise specified
Nature of construction activity
Site formation and clearance
Piling and related foundation work
Erection of architectural superstructure
Civil engineering construction
Total
Number of sites
50
429
925
389
I 793
Hong Kong Monthly Digest of Statistics April 1987
Total
364
1,235
12,284
3,476
17,359
Major project expenses
Materials and supplies as input
for construction work
84
562
3,174
753
4,572
Wages to operatives
22
96
578
297
993
Gross value of Sub-contract construction
work work performed
258 430
577 1,445
8,532 13,677
2,426 4,100
ll,793 19,652
101

1985 SURVEY OF BUILDING, CONSTRUCTION AND REAL ESTATE SECTORS
16.7 CONSTRUCTION SITE STATISTICS OF BUILDING AND CIVIL ENGINEERING CONTRACTORS IN THE 1985 SURVEY OF BUILDING, CONSTRUCTION AND
REAL ESTATE SECTORS, ANALYSED BY END USE OF BUILDING OR STRUCTURE
End use
Buildings
Residential, including combined resident.ial and non-residential buildings
Commercial buildings
Industrial and storage buildings
Service buildings
Structures and facilities
Transport
Other utilities and plant
Environment
Sports and recreation
Total
Number of sites
738
121
172
313
192
119
83
55
I 793
16.8 PROJECT STATISTICS
Total
7,683
2,698
1,354
1,578
2,240
1,111
575
119
17,359
Major project expenses
Materials and supplies as input
for construction work
2,405
247
566
393
556
223
161
22
4,572
Wages to operatives
425
74
53
85
221
85
41
993
$million unless otherwise specified
Sub-contract work
4,853
2,377
736
1,100
1,464
802
372
89
11,793
Gross value of construction
work performed
8,633
3,025
1,515
1,732
2,667
1,292
655
134
19,652
OF REAL ESTATE DEVELOPERS IN THE 1985 SURVEY OF BUILDING, CONSTRUCTION AND REAL ESTATE SECTORS,
ANALYSED BY END USE OF BUILDING
$ million unless otherwise specified
Project expenses incurred during reporting period Gross floor
Building Architectural Value accrued area of materials design and to project Land buildings
Payments and technical Other during area of when Number of to fittings consultancy Interest project reporting projects completed
End use of building projects Total contractors supplied fees payments expenses period ('000m2 ) ('000m2)
Private residential, including combined residential and non-residential buildings 468 7,047 5,471 14 395 946 222 10,436 4028 10 538
Government Home Ownership Schemes (Private Sector Participation Sc,-::hemes) 702 584 14 98 1,118 218 1174
Office buildings 56 245 143 22 73 304 24 303
Hotels and boarding houses 325 280 10 31 4 530 13 150
Multi-purpOse commercial premises 28 1,366 1,012 27 67 248 13 1,614 95 1157
Flatted factory blocks 86 1,446 1,103 41 271 23 1,673 417 2 778
Warehouses 14 213 167 II 31 4 188 76 453
Total 669 11,344 8,761 49 559 1,697 277 15,864 4 872 16 553
102 Hong Kong Monthly Digest of Statistics April 1987

EXPLANATORY NOTES
PART I REGULAR TABLES
Section I POPULATION AND VITAL STATISTICS
The mid-year and end-year population figures are estimated by adjusting Population Census/ByCensus results for total births, deaths and balance of migration whether legal or illegal, over a period.
These estimates include local residents, permanent and temporary foreign residents, military personnel, visitors from foreign countries and Vietnamese refugees in Hong Kong at a point oftime, i.e. 30 June or 31 December each year.
While the birth rate, death rate and rate of natural increase are calculated by relating the known births, the known deaths and their difference in a year to their corresponding mid-year population, the infant mortality rate is obtained by relating the known infant deaths in a year to the known births in the same year. Births and deaths of Vietnamese refugees are excluded. All rates refer to a calendar year except the population growth rate which refers to a period from 1 July of a year to 30 June of the following year.
Statistics relating to births, deaths and marriages refer to such events as were registered with the Director of Immigration during the period covered, and do not necessarily equate exactly to the number of events which occurred during that period. The marriage figures include marriages performed at the official registries and at licensed places of-public worship; they include also marriages other than first marriages.
Section 2 LABOUR
Labour force statistics refer to the land civilian non-institutional population aged 15 and above. The 1980 annual figures are averages of the March and September Labour Force Surveys while figures for 1981 are averages of the 1981 Population Census and the August to October 1981 General Household Survey. Annu'al figures for 1982 onwards are averages of the quarterly General Household Surveys. For the quarterly estimates, figures for any two consecutive moving quarters do not reflect the quarterly movements as two months are overlapping in the quarters. To measure quarter-to-quarter changes, comparison should be made of the reference quarter and the quarter three months ago. As the proportion of first-time job-seekers (e.g. people who have just left school) varies from month to month, unemployment rates which have been seasonally adjusted for the variation in first-time job-seekers are given for making comparisons over time. Underemployed is the number of employed persons who work short hours and are seeking more work. Underemployment rate refers to the proportion of labour force who are underemployed.
Prior to April 1980, statistics of employment and vacancies were compiled quarterly from separate employment surveys in various sf:ctors.
Starting from April 1980, statistics of employment, vacancies and payroll were collected quarterly by an integrated survey of employment, vacancies and payroll. In terms of the United Nations International Standard Industrial Classification (1968), the survey covers the following economic sector:
I.S.l.C. Major Division
2 3 4 6 7 8 9
Mining and Quarrying Manufacturing Electricity, Gas and Steam
Economic Sector
Wholesale, Retail and Import/Export Trades, Restaurants and Hotels Transport, Storage and Communication Financing, Insurance, Real Estate and Business Services Community, Social and Personal Services
For Major Divisions 7 and 9, the coverage is incomplete. Major expansions of industry coverage in these two major divisions took place in 1970, 1976 and 1977. As for Major Division 8, there was also a major expansion of industry coverage in 1973. Complete coverage of industry was attained in 1975. Economic activities not yet covered by the survey are;
I.S.I.C. Major Division
Economic Activities Not Covered
Agriculture, hunting, forestry and fishing (whole division) Hawkers; street vendors; retail pitches (other than market stalls) Taxis, public light buses, marine cargo handling services and tow boats Veterinary services, religious organizations, authors and other independent artists, domestic servants, and miscellaneous recreational and personal services
For the construction block, employment statistics are collected for manual site workers only at building and construction sites which include:
(a) sites in the private sector: all construction sites registered with the Buildings Ordinance Office of the Buildings and Lands Department, including those super-structures on sites above the Mass Transit Railway Stations or the Kowloon-Canton Railway Stations which were registered with the Buildings Ordinance Office, e.g. those real-estate development projects developed jointly with private developers.
(b) sites in the public sector-: all sites under the charge of the Architectural Services Department, Civil Engineering Services Department, Highways Department, Territory Development Department, Water Supplies Department or Housing Department; including KowloonCanton Railway Corporation sites not registered with the B-Uildings Ordinance Office, for which construction work was committed, contracted or started before 1.2.1983.
(c) railway and tunnel construction sites: construction sites contracted out by the Mass Transit Railway Corporation and Kowloon-Canton Railway Corporation that are not registered with Buildings Ordinance Office. In the case of Kowloon-Canton Railway Corporation sites, only those contracted out after 1.2.1983 are included. Those Contracted out before 1.2.1983 are included under (b). Employment in construction sites of Eastern Harbour Crossing is also included under this category.
Construction sites for village-type houses registered with the New Territories Administration are excluded. Statistics exclude minor alterations and additions, repairs, maintenance, partitioning and interior decoration work on existing buildings.
Following the re-organization of the Public Works Department into several Departments in April 1982, the description of the statistical series on persons engaged at sites contracted by 'Public Works Departmerit' given in Table 2.3 is revised to read as sites contracted by 'other government departments'.
As from the second quarter of 1985, employment figures in the public sector are compiled from the returns submitted by individual Government departments to the Civil Service Branch. Persons engaged include all direct employees paid under the personal emolument vote on the reference date which, since this quarter, falls on the first of January, April, July, October of each year. This change in definition and reference date has negligible effect on the continuity of the employment series in the public sector. Classification of Government departments and sections by purpose is based on the System of National Accounts Classification for Government expenditure with some modifications. The formerly Kowloon-Canton Railway Department has been separated from the Government with effect from l.2.1983 and accordingly its employment is excluded from Government employment.
An 'establishment' is defined as an economic unit which engages, under a single ownership or control, in one (or predominantly one) kind of economic activity at a single physical location.
'Persons engaged' refer to working proprietors, active business partners, unpaid family workers and all employees of the establishment who are either at work for pay or profit, or are temporarily absent from work, i.e. on short-term leave such as sick leave, casual leave or paid vacation. Excluded are outworkers, and persons on indefinite leave and on pension. Part-time and casual employees and unpaid family workers who worked for less than 3 hours of the normal working time on the reference date are also not included.
'Reported Vacancies' refer to those unfilled, immediately available job openings for which the establishment is actively trying to recruit personnel.
Hong Kong Monthly Digest of Statistics April 1987
'Payroll' refers to wages and salaries, bonuses .. and gratuities, commissions and allowances and cash payment in other forms paid directly to all employees. Profits earned by proprietors and business partners, pensions, and payment to outworkers are however excluded.
The 'nominal index of payroll per person engaged' is derived from the employment and total payroll figures. The ·•real index of payroll per person engaged' is obtained by dividing the nominal index by the Consumer Price Index (A) to adjust for changes in purchasing power.
'Payroll per person engaged' should not be interpreted as average income of employees. Firstly, the time period covered by employment figures is not the same as that covered by monthly payroll figures. Employment figures refer to a reference date, while monthly payroll is obtained by aggregating cash payments made over the whole month. Secondly, •payroll' refers to payments to employees, whereas 'persons engaged' includes more than just employees. It also includes working proprietors, business partners and unpaid family members who normally are not on the payroll. Finally, as far as income is concerned, employees' income usually is not just limited to cash payments for work as reflected in payroll figures. Furthermore, because of the fact that "persons engaged' includes some who are not on the payroll and the magnitude of such persons varies between sectors, comparison of absolute values of payroll per person engaged between sectors is not meaningful. However, movements in the nominal and real indexes of payroll per person engaged can be used as indicators of changes in average earnings of employees provided that the employment structure remains stable over time.
As from June 1980, establishments manufacturing knitwear from yarn were grouped under textiles. Before June 1980, they were grouped under wearing apparel. In the tables, figures before June 1980 have been-adjusted to conform to the new classification scheme so that a continuous series can be obtained. ·
In 1978, an economic census was conducted for Major Division 6 for the year 1977. Upon analysis of returns, it was found that a number of establishments had changed their activities and/or commodity groups. As the changes were quite extensive and had accumulated over some time, activities of the affected establishments were reclassified with effect from June 1979. Similar reclassification was also made for Major Division 3 by utilizing the product information obtained in the 1978 Survey of Industrial Production.
Concurrent with the September 1982 round of the Survey of Employment, Vacancies and Payroll, an industry updating survey was undertaken to collect up-to-date information on business activities of each and every establishment in the industrial block (i.e. I.S.I.C. Major Divisions 2, 3 & 4). Results of this survey have been used to compile statistics as from the third quarter of 1983. Statistics since this quarter analysed by industry are, therefore, not strictly comparable with those in previous quarters. To enable users to analyse the effect of this survey on the statistical series, statistics for the third quarter of 1983, both before and after incorporating the results of this survey, were given in the December 1983 issue of the Report of Employment, Vacancies and Payroll Statistics. On the other hand, the indexes of payroll per person engaged (nominal and real) have been spliced as from the fourth quarter of 1983 in such a way that comparison can be directly made. A summary of the results of this survey was given in the Special Review Article contained in the May 1984 issue of the Hong Kong Monthly Digest of Statistics.
Concurrent with the June 1983 round of the survey, a similar survey was undertaken for the distributive trades block (i.e. I.S.I.C. Major Division 6). Results of this survey have been used to compile statistics as from the second quarter of 1984. To enable users to analyse the effect of this survey on the statistical series, statistics for the second quarter of 1984, both before and after incorporating the results of this survey are given in the September 1984 issue of the Quarterly Report of Employment, Vacancies and Payroll Statistics. The indexes of payroll per person engaged (nominal and real) have been spliced as from the third quarter of 1984 in such a way that comparison can be directly made. A summary result of this survey was published in the Special Review Article contained in the July 1985 issue of the Hong Kong Monthly Digest of Statistics.
Concurrent with the March 1984 round of the survey, a similar survey was conducted for the services block (i.e. I.S.I.C. Major Divisions 7, 8 & 9). Results of this survey have been used to compile statistics in the March 1985 issue of the Report of Employment, Vacancies and Payroll Statistics. Based on the results of this survey, some establishments previously classified into this block, notably those in l.S.l.C. 9512 and 9519, were re-classified into appropriate industry sectors belonging to other l.S.I.C. major divisions in March 1985. In conjunction with this industry updating survey, some welfare organizations which used to provide a consolidated return covering the whole organization were asked to furnish detailed information in respect of individual branches operating at different locations. Appropriate industry codes were assigned to these branches and have been used to compile statistics as from March 1985. As a result, the figures since this quarter for some industry groups, notably l.S.l.C. 934 and 939, are not strictly comparable with those in previous quarters. To enable users to analyse the effect of this survey on the statistical series, statistics for the first quarter of 1985, both before and after incorporating the results of.this survey are given in the June 1985 issue of the Report of Employment, Vacancies and Payroll Statistics. An article entitled .. Shift in the Industrial Activities of Establishments in the Transport, Storage and Communication Sector, the Financing, Insurance, Real Estate and Busin.ess Services Sector; and the Community, Social and Personal Services Sector" was published in the January 1986 issue of the Hong Kong Monthly Digest of Statistics.
The second round of the industry updating survey for the industrial block was conducted concurrently with the September 1984 round of the survey. Based on the results, some establishments previously classified into this block were re-classified to other I.S.I.C. major divisions in September 1985. As a result, the figure& since this quarter for some industry groups, notably I.S.l.C. 833, are not strictly comparable with those in previous quarters. Statistics for the third quarter of 1985 both before and after incorporating the results of this survey are given in the December 1985 issue of the Report of Employment, Vacancies and Payroll Statistics. The indexes for the industrial block have been spliced as from the fourth quarter of 1985 so that comparison of changes over time can be directly made.
The second round of the industry updating survey for the distributive block (i.e. l.S.I.C. Major Division 6) was conducted concurrently with the June 1985 round of the survey. Results of this survey have been used to compile statistics as from the second quarter of 1986. To enable users to analyse the effect of this survey on the statistical series, statistics for the second quarter of 1986, both before and after incorporating the results of this survey, are given in the September 1986 issue of the Quarterly Report of Employment, Vacancies and Payroll Statistics: On the other hand, the indexes published in this report have been spliced as from the third quarter 1986 in such a way that comparison of change over time can directly be made.
Figures of establishments, employment and vacancies refer to March, June, September and December of the year. But prior to the second quarter of 1980, figures for Major Divisions 7 and 8 referred to February, May, August and November of each year; and those for Government service referred to January, April, July and October of each year as from the second quarter 1985.
The Census and Statistics Department had, since 1964, compiled and published wage indexes to measure the cha:nges in wage rates, both including and excluding fringe benefits, of manual workers in selected industries mainly in the manufacturing sector, based on the findings of a half-yearly Wage Survey.
In March 1982, a new quarterly Survey of Wages, Salaries and Employee Benefits was introduced to replace the half-yearly Wage Survey. A number of improvements were made, including the collection of statistics on wage rates at more frequent intervals, the use of a larger sample (about 2 OOO establishments) to achieve a highet degree of precision in the estimates for each industry covered, and an extension· in coverage to include the non-manufacturing sectors and non-manual workers so as to make the statistics more representative (employees at the administrative and professional levels are, however, still excluded). The details of the differences between the old and the new survey are given in the "Quarterly Report of Wages, Salaries and Employees Benefits Statistics for March, June and September 1982, Volume I".
Based on the findings of the new survey, a Nominal Wage Index and a Real Wage Index are compiled. These wage indexes measure the "pure" changes in wage rates by holding the structural pattern of the labour fofce with respect to industry, occupation, sex and mode of payment the same as that of March 1982, which is the based period of the Wage Indexes. While the Nominal Wage Index measures the changes in wage rates in money terms, the Real Wage Index, which is obtained by deflating the Nominal Wage Index by the Consumer Price Index (A), measures the changes in the purchasing power of the amount of money earned. Apart from basic wages and salaries, wage rate is defined to include also cost-of-living allowance, meal benefits, commission and tips, good attendance bonus, night shift allowance, year-end bonus and other guaranteed and regular bonuses and allowances. There is no distinction made between wage rates with and without fringe benefits ill compiling the New Wage Indexes. Since all the wage elements mentioned above are included in

compiling the New Wage Indexes, they are roughly equal to the definition of the wage rate including fringe benefits in the old survey.
In reading the wage statistics, users are reminded to note that the change in the wage index for a particular industry between any two months may.be different from the change derived by comparing the published wage rate figures for that industry of the corresponding months. As the wage index is designed to measure the "pure" change in wage rates by holding constant the structure of the labour force with respect to industry, occupation, sex and mode of payment, the movement as indicated by the wage indexes should always be used to measure changes in wage rates.
There are differences in the interpretation of wage and payroll indexes. Essentially, the wage indexes, which measure the changes in the price of labour, are concerned with the movements of wage rates which indicate the amount of remuneration for normal time of work. On the other hand, per-capita payroll indexes reflect the changes in the amount of cash earnings workers receive during a particular period. The movements of the per-capita payroll indexes are affected by changes in wage rates, as well as changes in such other factors as the amount of time actually worked, the composition of the labour force and the incidence of the payment of bonuses and back-pay. As a result, the movements of the wage indexes do not necessarily agree with those for per-capita payroll.
The average daily wages statistics in Table 2.10 are compiled based on the statistical returns obtained from contractors engaged in Government building and construction projects. The wage rate is defined to include basic wage, meal allowance, transportation allowance, 10-days statutory holidays and 7-days public holidays for daily-rated workers whilst sick leave and year-end bonuses are also included for monthly-rated workers.
Statistics on reported occupational accidents, industrial accidents and industrial work stoppages are supplied by the Labour Department.
Statistics on industrial work stoppages refer to number of work stoppages and the corresponding number of working days (or man-days) classified by International Standard Industrial Classification major divisions. These figures cover stoppages of work arising from disputes connected with terms and conditions of employment. Stoppages involving fewer than ten workers or lasting less than one day are excluded, unless the aggregate of working days lost exceeds 100. The number of workers involved is the number who actually cease work at the establishments where the disputes occur.
Reported occupational accidents refer to all accidents reported to the Labour Department which have resulted in the death of an employee or the total or partial incapacity of an employee for more than three days. ·
Industrial accidents refer to accidents occurred in industrial undertakings and arising out of industrial activities.
Section 3 EXTERNAL TRADE
External trade statistics comprise movements of cargo between Hong Kong and other trading partners, by land, air and water and to a limited extent by post, with the exception of the following classes of goods: I. Transhipment cargo under through bill of lading or through air waybill; 2. Transit cargo; 3. Articles imported or exported by the armed forces of the Crown; 4. Ships' stores, including bunker fuel; aircraft stores, including aviation fuel; 5. Personal baggage and possessions of travellers, not including motor vehicles; 6. Advertising materials supplied free of charge and samples of no commercial value or valued at
less than one thousand dollars; 7. Marine fish arriving direct from fishing grounds on fishing craft registered or licensed in Hong
Kong; 8. Gifts of a personal nature where no payment has been made by the receiver; 9. Articles temporarily imported and exported solely for exhibition and subsequent return; 10. Articles imported or exported under and in accordance with an A.T.A. carnet for the
temporary admission of goods; 11. Circulatory used freight containers and the like; 12. Banknotes after issue into circulation, being legal tender in any country.
The trade accounts relate to movements of merchandise only, and do not include those of bullion and specie.
Imports are c.i.f. values, exports and re-exports are f.o.b. values.
Due to the adoption of Standard International Trade Classification (Revision 2) as from January 1978, figures for earlier years are not strictly comparable with those for 1978 onwards.
The monthly figures are subject to adjustment of errors which may arise from various sources, such as mis-classification of commodity or country of consignment, wrong reporting of values or quantities, and lodgement of more than one declaration for the same consignment. As from 1978, adjustments to these errors for consignments relating to earlier months are made to the cumulative totals only. It follows that the sums of the monthly figures may differ from the cumulative totals.
The trade index numbers are compiled from value and quantity data as published in the Hong Kong Trade Statistics. The unit values for domestic exports and re-exports are on an f.o.b. (free-on-board) basis while those for imports are on a c.i.f. (cost, insurance and freight) basis.
The unit value for each commodity classification item is the quotient of the value over its corresponding quantity. As such, the unit value series (as opposed to market prices) are not free of the effect of change, especially improvements, in quality or of change in product mix and markets or sources included within a commodity classification.
Quantum index numbers are derived by dividing the value index numbers by corresponding unit value index numbers; and as a result are derived as a residual and subject to the limitations mentioned above. The unit value index numbers are base-weighted while the quantum index numbers are current-weighted. The monthly value and quantum indexes are derived by comparing trade figures in the current month with the average monthly data of the base year 1981.
As from March 1983, prices of selected imports (c.i.f.) and exports (f.o.b.) were collected and used to compile price indexes. These price indexes which are based on product specifications, are intended to substitute the u~it value indexes where problems exist of changes in quality, product mix, markets and sources, etc.
The terms of trade index, which was up to December 1982 the ratio of the unit value index for domestic exports to that for imports, has been re-defined as the ratio of the unit value index for total exports (i.e. domestic exports and re-exports) to that for imports.
For inclusion in the compilation of the trade index numbers, 737 items out of a total of 1 874 items for domestic exports, I 518 out of 3 162 for imports and 1 039 out of 2 638 for re-exports are selected. In terms of value, the selected items accounted for 69 per cent, 71 per cent and 71 per cent for domestic exports, imports and re-exports respectively in the base year 1981.
Section 4 PRODUCTION
The indexes of industrial production, which relate to net output at constant prices, are based On results of the Quarterly Survey of Industrial Production, conducted by the Census and Statistics Department, covering all manufacturing establishments engaging 500 or more persons and a sample of the smaller establishments. The production index for an industry is obtained by aggregating the production quantity relatives or deflated value indexes of the primary products or industrial services of the industry, using sales or work done values as weights. Deflated value indexes are adopted for those heterogeneous products that are not suitable for quantity measurement. Value added is used as weights in aggregating the production indexes of different industries. The weights are derived from the 1981 Survey of Industrial Production.
The indexes of industrial production in Table 4.1 cover the whole manufacturing sector, including the spinning and weaving industries. Statistics for the latter industries are also shown separately in greater detail in the ongoing series of Index of Textile Production and Textile Production Statistics in Tables 4.2 and 4.3.
Items 4 to 6 in Table 4.3 exclude the contribution from establishments engaged principally in providing supporting services to spinning and weaving, but these establishments are also classified as spinning and weaving establishments and their details included in items 1 to 3. Examples of such supporting services are: yarn doubling, yarn winding, texturizing, fabric mercerizing, fabric shrinking and webbing. Commodity items with a quantity of less than I 00 OOO units are not
II
individually listed. They include materials such as man-made (staple) fibre yarn, woollen yarn, metallic yarn, elastic thread and glass fibre yarn; products such as silk/man-made fibre piecegoods, elastic bands and laces.
Statistics of cement production are supplied by the cement manufacturing companies and those of quarry production by the Geotechnical Control Office of the Civil Engineering Services Department.
Section 5 LAND, HOUSING, BUILDING AND CONSTRUCTION.
Permanent living quarters statistics are compiled by the Census and Statistics Department. Before 1985 these statistics were compiled from a manual register of quarters. Since 1985 they are obtained from the computerized frame of quarters. A permanent living quarter is an enclosed space in a building built of permanent materials. And for such a space to be counted as a living quarter it must (i) be internally connected so that the occupants can move between rooms/cubicles or from one corner to another without going outside onto a public corridor, a landing or staircase; (ii) have direct access to a street, a corridor or landing without going through someone else' unit; and (iii) be built or used for the purpose of living.
Public housing comprises Housing Authority estate blocks and Housing Society buildings. Home Ownership Scheme also includes living quarters built under the Private Sector Participation Scheme and Middle Income Housing. Statistics on Housing Authority blocks and Home Ownership buildings are supplied by the Housing Department; statistics on Housing Society buildings are obtained from the Hong Kong Housing Society and details contained in the monthly returns of the Buildings Ordinance Office of the Buildings and Lands Department. This department also supplies data for the small village-type houses. With regard to all other private building projects as well as Private Sector Participation Scheme and Middle Income Housing, data are compiled from the above mentioned monthly returns.
A building is said to be 'completed' upon the issuance of an Occupation Permit by the Buildings Ordinance Office of the Buildings and Lands Department in the case of a Housing Society building or a private building (except small village-type houses); and in the case of a small village-type house, a compliance certificate issued by that department; a Housing Authority block is 'completed' when it has been certified as substantially completed by the Chief Architects of the Housing Department.
'Consents' to commence work are issued by the Buildings Ordinance Office of the Buildings and Lands Department for Housing Society buildings and private buildings except small village-type houses where 'consents' are not necessary. In the case of Housing Authority blocks, 'consents' are not required and the date of award of contracts by the Housing Authority is taken as the consent date.
The 'usable floor area' of a flat is defined as the total floor area within the flat excluding any staircases, lavatories, water closets, kitchens and otper common areas of the building.
The 'lettable floor area' and 'saleable floor area' ofa flat refer to the total floor area inside the flat measured to the outside of the external walls and to the centre lines of the party walls, including the balcony, kitchen and water closet inside the fiat. All common areas of the building are excluded.
The 'gross floor area' of a building is defined as 'the aggregate of the areas of the fioor(s) in a building'.
Building statistics in Tables 5. 7 and 5.8 include only building activities in the private sector and those for Private Sector Participation Scheme and Middle Income Housing but exclude small village-type houses.
Statistics on price and rental indexes in Tables 5.9 and 5.10 are supplied by the Rating and Valuation Department.
Shops comprise only those premises designed for retail trade with a frontage to a public throughfare.
Offices cover only those in the districts of Sheung Wan, Central, Wanchai/Causeway Bay, Tsim Sha Tsui, Yau Ma Tei/Mongkok. Grade A refers to the well constructed, designed and managed, centrally air-conditioned premises in suitable locations within the district. Grade B refers to the less superior buildings in good locations or high quality buildings in secondary locations wit4in the district. Grade C refers to the poorer quality buildings on less attractive sites within the district.
Flatted factories refer to the upper floor premises for general manufacturing processes.
Information on instruments registered is supplied by the Registrar General and covers only Hong Kong, Kowloon and New Kowloon. The terms used in Table 5.11 are explained as follows:
'Assignment': a deed transferring property from one part to another.
'Lot': a piece of Government land originally granted by the Government by auction, tender or private treaty grant.
'Share of lot': a lot can be shared jointly by two or more persons, the entitlement of each is called a share of lot. Unlike a 'section', a share is just a percentage value with no explicit boundary defined as in a 'section'. Assignments of discrete flats are included here if the relevant building is located in an undivided lot.
'Section': a lot can be carved into a number of smaller parts called sections.The sections may be of varying size and the area of each is clearly defined and labelled accordingly.
'Share of section': same meaning as 'share of lot' except that the land is a section instead of a lot. Assignments of discrete flats are included here if the relevant building is located in a particular section of a lot.
'Building mortgages/building legal charges' (previously known as Building mortgages): mortgages secured for the purpose of financing building construction.
'Mortgages/legal charges other than building mortgages/building legal charges· (previously known as Mortgages other than building mortgages): highly varied and the mortgagee is not obliged to state the purpose of the mortgage. Many of these relate to mortgage arrangements for the purchase of residential fiats and other building premises.
'Reassignments/receipts/discharges/releases and certificates of satisfaction' (previously known as Reassignments and certificates of satisfaction): when a loan is fully repaid and the mortgage redeemed, a •reassignment/receipt/discharge/release' or ·certificate of satisfaction' will be prepared and registered at the Land Office.
•Agreements for sale and purchase': an agreement for future sale or purchase of property. The property may be a building under construction or a completed building.
'Tenancy agreements': agreement between a lessor and lessee concerning property letting.
·Exclusion orders issued under the Landlord and Tenant Ordinance': landlords of pre-war buildings who wanted to re-develop the property have to apply for an Exclusion Order with respect to Part One of the Landlord and Tenant Ordinance which mainly protects the interests of the existing tenants.
'Miscellaneous': all other types of transaction.
Statistics on the gross value of construction work performed are obtained from the Quarterly Survey of Construction Output conducted by the Census and Statistics Department since 1983 for the purpose of providing a prompt indicator of current developments and output trends in the construction industry. All main contractors of building and construction sites, irrespective of their employment sizes, and other construction establishments engaging 100 persons or more are fully enumerated in the Survey. As regards the other establishments in the frame, a random sample stratified by trade and employment size is enumerated. New construction work and renovation and maintenance includes the erection of new buildings and structures and installation of service facilities such as utility fittings and ventilation systems, major alteration and conversion works on existing structures, demolition, site formation, piling and other sub-structure work preceding the actual erection of structures, and the restoration of existing buildings and structures to normal condition. Special trades refer to those contractors that specialize in delineated job areas such as steel bending, scaffolding, masonry, carpentry and painting. A main contractor is one who enters into a contract directly with a real estate developer or client of the project, as distinct from a sub-contractor who obtains the job from another contractor. Because of the sub-contracting system
Hong Kong Monthly Digest of Statistics April 1987

in the construction sector, there is some element of double-counting in the total gross value of construction work performed by all contractors. To serve certain data uses, separate statistics covering activities of main contractors only are shown.
Statistics on disposals of Government land are supplied by the Buildings and Lands Department.
Letter 'A' and 'B' tender system in the New Territories: and when it is necessary for Government to acquire land for public purposes the Government exercises its power under the Crown Lands Resumption Ordinance. Where land is required within an area embraced by an approved layout plan, the policy is to give the lessee of private land the opportunity of surrendering his land voluntarily in exchange for the right to be granted Government land at some future date. This right is contained in a Letter called Letter 'A' or Letter 'B'.
The realised premium of land acquired by a land exchange entitlement is calculated by deducting the Government's value of the resumed land from the value of the land to be granted prevailing at the time when the exchange entitlement letter was issued. The realised premium of land acquired through auction or public tender is the auctioned/tendered price of the land.
Land for special low cost housing projects, Home Ownership Schemes, for public utilities, schools, churches, temples, clinics welfare and certain charitable purposes is usually granted by private treaty, and in such cases, the premium charged varies from nothing for non-profit-making purposes up to the full market value for public utilities.
Section 6 TRANSPORT, COMMUNICATIONS AND TOURISM
Statistics on aircraft movements are taken from the reports of the Civil Aviation Department.
Statistics on vessels and containers are supplied by the Marine Department. Ocean-going vessels are classified according to nationality. 'Vessels entered' refers to vessels arriving at Hong Kong whereas 'vessels cleared' refers to vessels leaving Hong Kong.
Statistics on airborne cargoes are supplied by the Civil Aviation Department, on seaborne cargoes by the Marine Department, on cargoes carried by railway by the Kowloon-Canton Railway Corporation and on cargoes transported by road by the Customs and Excise Department. Starting with the February 1986 issue, statistics on international movements of commercial cargo by railway in Table 6.4 refer to the actual tonnage of cargo conveyed whereas those published in previous issues represent the loading capacity of wagons used for conveyance.
Statistics of passenger journeys on public transport, of motor vehicles registered and of vehicular traffic through toll-charged tunnels and vehicular ferry services are compiled by the Transport Department. The passenger journey figures exclude those of taxis and Kowloon-Canto_n Railway platform ticket holders, but include passengers carried by Ocean Park cable cars which started operation on 15 January 1977; they also include estimated passengers in vehicles carried by the Hong Kong & Yaumati Ferry Co.'s vehicular ferry services. A minor ferry service is any ferry service (other than Hongkong & Yaumati Ferry and Star Ferry) operated under a licence granted under the Ferries Ordinance, Cap. 104. Statistics on passenger journeys by 'Cross Harbour Tunnel' include passengers carried by Mass Transit Railway and Harbour tunnel buses.
Statistics on motor vehicles licensed shown in Table 6.8 do not include the 162 tram cars of the Hongkong Tramways Ltd. and the 3 tramcars of the Peak Tram Co. Ltd.
Statistics on traffic accidents and casualties are supplied by the Royal Hong Kong Police Force. The traffic accident figures exclude accidents involving damages only.
Statistics on telephone services are supplied by the Hong Kong Telephone Company Ltd. and those on telecommunication and postal services by the Post Office.
Statistics on passenger arrivals and departures as well as Hong Kong resident departures are supplied by the Immigration Department. They refer exclusively to international movements of passengers or Hong Kong residents. Particulars on incoming visitors and hotels are supplied by the Hong Kong Tourist Association. From January 1986 onwards figures in Table 6.16 on visitor arrivals by country of residence differ from the 'Visitor Arrival Statistics' published by the Hong Kong Tourist Association since the former include visitors from the People's Republic of China but the latter do not.
Statistics of hotels and number of rooms are obtained from surveys conducted in June and December each year among Hong Kong Tourist Assocation members. These statistics are revised from time to time as information on current situation of hotel industry becomes available. Room occupancy rate is based on surveys conducted monthly among HKTA members.
Section 7 MONEY, BANKING AND FINANCE
Statistics on the money supply and on banks and deposit-taking companies, in Tables 7.1 to 7.10, are supplied by the Secretary for Monetary Affairs, with the exception of the figures for branches of banks and deposit-taking companies in Tables 7.3 and 7.4, which are supplied by the Commissioner of Banking/Commissioner of Deposit-taking Companies. The Commissioner also supplies the data in Tables 7.11, 7.14 and 7.15. Data supplied by the Secretary for Monetary Affairs are not available before December 1980 except those on loans and advances for use in Hong Kong in Table 7.7, which are not available before December 1981.
The definitions of money supply (Table 7.l) are:
Money supply definition 1 (Total): Notes and coins with the public, plus customers' demand deposits with licensed banks.
Money supply definition 2 (Total): Ml plus customers' savings and time deposits with licensed banks, plus negotiable certificates of deposit issued by licensed banks and held outside the monetary sector.
Money supply definition 3 (Total): M2 plus customers' deposits with licensed and registered deposit-taking companies plus negotiable certificates of deposit issued by deposit-taking companies held outside the monetary sector.
HK$Ml, HK$M2 and HK$M3 are the Hong Kong dollar components of these definitions.
All deposit-taking institutions are defined here to include licensed banks, licensed deposit-taking companies and registered deposit-taking companies.
The banking statistics (Table 7.3) exclude certificates of indebtedness issued by the Exchange Fund, and the equivalent note issue.
Bank's quoted best lending rate, which refers to the Hongkong & Shanghai Banking Corporation and Standard, Chartered Bank's quoted best lending rate for general guidance of other banks, as well as interest rates paid to depositors are supplied by the Secretary for Monetary Affairs. Interest rates for deposits over 12 months are determined by agreement between individual depositors and the banks.
The closing Hong Kong Dollar Inter-bank Offer Rates (HIBOR) on or before December l 985 in Table 7.13 are quoted from the Hongkong and Shanghai Banking Corporation and those from January 1986 onwards are quoted from the Standard Chartered Bank. Figures of bank cheques cleared are supplied by the Clearing House of The Hong Kong Association of Banks.
Liabilities to and claims on banks outside Hong Kong are analysed by the country of the branch making or accepting the deposit, and not by the country of that branch's head office- e.g. a claim on the London branch of a US bank is shown against the United Kingdom, and not against the United States.
Claims on non-bank customers incorporated outside Hong Kong are analysed by the country of incorporation, while claims on unincorporated customers are analysed by their recorded address. Columns 1to4 of Table 7.14 include liabilities to and claims on the head office (if any) overseas, and on any other branches overseas of the reporting bank in Hong Kong.
Hong Kong Monthly Digest of Statistics April 1987
The figures for liabilities to banks outside Hong Kong, for claims on banks outside Hong Kong, and for claims on non-bank customers outside Hong Kong in Tables 7.14 and 7.15 do not excactly correspond with the appropriate items in Tables 7.3 (Banks) and 7.4 (Deposit-taking Companies) respectively. This results from differences in classification of some accounts.
Statistics of exchange rates between the Hong Kong dollar and currencies of selected countries are compiled by the Census and Statistics Department from quotations supplied mainly by the Hang Seng Bank Limited. Figures in Tables 7.16, 7.17 and 7.18 refer to average closing middlemarket telegraphic transfer rates. The currencies are selected for those countries which are major trading partners of Hong Kong. The exchange rates of the SDR are derived by multiplying the U.S. dollar value of the SDR as published by the IMF by the appropriate exchange rates of Hong Kong dollar against U.S. dollar as published in the tables. The effective exchange rate indexes measure movements in the weighted average of nominal exchange rates of Hong Kong dollar against the currencies of 15 principal trading partners. The principal trading partners are selected on the basis of their merchandise trade with Hong Kong and their relative importance in world trade. The weighting system derived from the trade pattern in 1981 has been adopted since 3 January 1983. The base date is 18 December 1971 when the Smithsonian Agreement was reached. For more details on the trade-weighted effective exchange rate index, see the Special Review in ·Hong Kong Monthly Digest of Statistics' January 1983.
The following table shows the weights attached to each of the three indexes:
Selected trading
,partners
Australia Belgium Canada China France Germany, F.R. Italy Japan Netherlands Singapore South Korea Switzerland Taiwan U.K. U.S.A.
Currrencies
Dollar Franc Dollar Renminbi Franc Deutsche Mark Lira Yen Guilder Dollar Won Franc Dollar Sterling Dollar
Weights attached(%)
Trade (import and
export)weighted
index
2.74 l.23 l.65
17.99 l.69 5.19 l.34
16.81 l.21 7.26 3.58 2.21 6.83 7.15
23.14
Importweighted
index
2.02 l.50 0.70
22.43 l.45 2.70 l.38
24.76 0.62 8.60 4.94 2.40 8.82 5.36
12.34
Exportweighted
index
3.69 0.87 2.91
12.13 2.02 8.47 l.29 6.31 l.98 5.50 l.78 l.96 4.20 9.51
37.39
The Hong Kong Index on share prices and value of stock exchange turnover are supplied by The Stock Exchange of Hong Kong Ltd. The Hang Seng Index and Sectoral Sub-indices are compiled by the Hang Seng Bank Ltd. Sectoral sub-indices of the Hang Seng Index have been introduced since 13 January 1984, and closing share prices on that day are used as the basis for calculation. The base value of the sub-indices is 975.47 i.e. the closing Hang Seng Index for that day.
Statistics on futures trading and gold and silver exchange trading are supplied by the Hong Kong Futures Exchange Ltd. and the Chinese Gold and Silver Exchange Society respectively.
Section 8 PRICES AND RETAILING
The average retail prices of the principal foodstuffs are obtained by price investigators from market stalls and shops throughout Hong Kong during the periods specified.
The average wholesale prices of rice are supplied by the Trade Department, while those of live pigs, live cattle, fresh marine fish and fresh vegetables are supplied by the Agriculture and Fisheries Department.
The three New Consumer Price Index series shown in Tables 8.3-8.6 and the three index series shown in Tables 8.7--1!.9 were derived from the Household Expenditure Survey conducted in l 984--1!5 and 1979-80 respectively. They are defined in terms of the percentage distribution of households by expenditure as follows:
Index
CPI(A) CPl(B) Hang Seng CPI
Approximate percent of households covered
50 30 10
Monthly expenditure range in
l 979 /80 1984/85
$1,000-$ 3,499 $3,500-$ 6,499 $6,500-$19,999
$ 2,000--$ 6,499 $ 6,500--$ 9,999 $10,000--$24,999
The remaining 10 percent of households - at top and bottom of the household expenditure scale -are excluded.
Readers interested in information on household expenditure may refer to the Report of the Household Expenditure Survey 1979-80 and the New Consumer Price Index, or to the Report on the Household Expenditure Survey, 1984--1!5.
A special review article introducing the seasonally 3.djuSted consumer price index~s was published in the May 1983 issue of this Digest. Information on the objectives, method and interpretation of the figures can be found in the article.
Statistics on retail sales are compiled by-the Census and Statistics Department based on data collected from a monthly survey of retail sales. The survey covers some l 200 establishments ,drawn from all the retail establishments registered with the Business Registration Office (BRO) of the Inland Revenue Department (IRD), and market stalls registered with the Urban Services Department (USD) and the Housing Department (HD). Excluded from the survey are hawkers, street vendors and retail pitches.
Statistics on restaurant receipts are compiled by the Census and Statistics Department based on data collected from a quarterly survey of restaurant receipts and purchases. The survey covers some 750 establishments drawn from all the catering establishments registered with the BRO 'of the !RD, the USD and the HD. Excluded from the survey are cooked food stalls operated outside the main structure of buildings, canteens attached to organizations open to members only, and catering outlets operated by and situated within hotels.
The value indexes measure the changes in value terms, while the volume indexes obtained by deflating the value indexes by specially constructed price indexes measure the changes in real terms.
Section 9 SOCIAL STATISTICS
Statistics of reported crime are supplied by the Royal Hong Kong Police Force and the Independent Commission Against Corruption. If a person is prosecuted on two or more occasions he is recorded once on each occasion; and when a person is prosecuted on the same occasion for two or more offences, one offence is selected for tabulation.
Statistics on notified infectious diseases and the number of in-patients treated and out-patient attendances ~n government and government-assisted institutions are supplied by the Medical and Health Department.
Statistics on public assistance schemes and special needs allowance schemes are supplied by the Social Welfare Department.
III
"-----------------------------------

Section 10 ENERGY
Statistics on electricity and gas are supplied by the public utilities companies and those on petrpleum products are obtained from the monthly returns submitted by the leading petroleum companies.
Section 11 MISCELLANEOUS
Government revenue and expenditure statistics are supplied by the Treasury. The analysis of revenue and expenditure by the broad groups as given in Table I I.I is made by the Census and Statistics Department. 'Direct taxes' include earnings and profit tax and estate duty; 'Indirect taxes' include duties, general iates, motor vehicle taxes, taxi concessions, royalties and concessions, taxes on bets and sweeps, entertainment and hotel accommodation, stamp duties and airport departure tax (introduced in 1983/84 only). •Transfers to other funds' include transfers to Development 1:-oan Fund, Home Ownership Fund, Mass Transit Fund and Student Loan Fund; •Actual expenditure during the period' refers to expenditure other than transfers to funds.
Information on companies registered and dissolved is supplied by the Registrar General.
The fire services statistics are supplied by the Fire Services Department and refer to operational and preventive work.
Statistics on water supplies are supplied by the Water Supplies Department and refer to fresh water supply only (while salt water for flushing purposes is excluded). The maximum capacity of the existing 18 storage reservoirs is 577.896 million cubic metres; before storage at the High Island Reservoir (since August 1977) began the maximum capacity was 305.396 million cubic metres. Figures for water imported from China are slightly different from those published in Hong Kong Trade Statistics. They refer to the quantity of water received from 09:00 hours on the first day of the month up to 09:00 hours on the first day of the following month whereas those published in the Hong Kong Trade Statistics represent the quantity of water paid for from the morning on the last day of the previous month to the morning on the last day of the month.
Statistics of meteorological observations are taken from the records of the Royal Observatory, King's Park and Waglan Island stations. The monthly normals for the various meteorological elements (except for the total evaporation, prevailing wind direction and mean wind speed) refer to the 30-year period 1951-1980. Due tp the lack of data within the same period, normals for ~he prevailing wind direction and mean wind speed are the averages durmg the 30-year penod 1953-1982. The normal for the total evaporation is obtained from the average for the period 1958-1984 and will be updated every year because the covering period is less than 30 years.
PART II PERIODIC TABLES
Section 12 POPULATION AND MORTALITY STATISTICS
See explanatory notes in Section l for mid-year population estimates in Table 12.1.
Statistics of deaths by cause are supplied by the Medical and Health Department whereas those of life expectancy are compiled by the Census and Statistics Department.
Section 13 EDUCATION
Statistics of schools and enrolment are supplied by the Education Department except those for the Universities and Polytechnics, and Technical Institutes which are supplied by the University and Polytechnic Grants Committee and Vocational Training Council respectively. The figures for institutes and enrolment by type of education refer to both day and evening classes. Enrolment for the Universities include undergraduates and postgraduates but exclude participants of extra-mural courses.
Section 14 WAGES AND EMPLOYEE BENEFITS
A new annual Survey of Salaries and Employee Benefits (Managerial & Professional EmployeesExcluding Top Management) was conducted for the first time in September 1984. It collects information on salaries and fringe benefits of managerial and professional staff who are not covered by the Quarterly Survey of Wages, Salaries and Employee Benefits. The survey covers about 200 large and medium-sized companies in five economic sectors, namely the manufacturing/electrlcit)'.; gas and steam sector; the building and construction and related tra~es ~ector; the wholesale/ ret~d and import/export trades sector; the transport, storage and commumcat10n sector; and the financial institutions and insurance sector. Details of the survey methodology are given in "Report of Salary and Employee Benefits (Managerial and Professional Employees-Excluding Top Management)" published by the Census and Statistics Department.
Based on the findings of the new survey, a Nominal Salary Index (A) and Nominal Salar~ Index (B) are compiled. These salary indexes are designed to measure changes in salary rates usmg the occupational and industrial structures of June 1983, which is also taken as the base period of the indexes. Apart from basic salaries, the salary rate is defined to include also cost-of-living allowance, guaranteed year-end bonus, commission and tips and other guaranteed and regular bonuses and allowances. Other items which tnay contribute significantly to the total pay package of employees at this level such as profit-sharing bonus and housing allowance are not included in the definition of salary rate. However, statistics on these fringe benefits items are separately compiled and are expressed in terms of percentages of employees included in the survey entitled to such benefits in Table 14.2.
The Salary Index (A) is compiled by comparing the a~erage of the salary levels. of managerial a.nd professional empfoyees in June of the reference year with that m June 1983. It is a compr~hensiv~ measure of change in salary levels and it takes into account changes in salary level resultmg from movements across companies and in and out of occupations as well as changes in salaries for those who remain in the same occupation and the same company in both y~ars. While the Nominal Salary Index (A) measures the changes in salary rates in money terms, the Real Salary Index (A), which is obtained. by deflating the Nominal Salary Index (A) by the Hang Seng Consumer Pnce Index, measures the changes in salary rates in real terms.
On the other hand, the Salary Index (BJ measures the changes in salary levels only for those who remain in the same occupation and in the same company in two consecutive years. It therefore accounts only for changes due to a general increment, meritorious increases and gains in seniority, and should be useful to personnel managers in making salary adjustments. A Real Salary Index (B) is also compiled using the method adopted in deriving the Real Salary Index (A).
Large and medium-sized companies are defined as below:
Selected major economic sectors
Manufacturing/electricity, gas & steam Building & construction and related trades Wholesale/retail and import/export trades Transport, storage and communication Financial institutions and insurance (excluding holding
and investment companies) Holding and investment companies
Section 15 NATIONAL ACCOUNTS
No. of persons engaged Large Medium-sized
companies companies
~ 2000 200-1 999
~ 500 50- 499
~ 500 100- 499
~ 500 JOO- 499
~ I OOO 100- 999
~ 500 20- 499
Gross domestic product is an aggregate measu,re of the valu~ of goods and ~e~vices produced by residents within the domestic boundary ofa country or a territory, net of their imported contents,
IV
before provision for depreciation (or capital consumption). Gross domestic product at current market prices is valued at current period transaction prices, inclusive of indirect taxes l~ss government subsidies. The constant price estimates are obtained by deflating the current pnce estimates of different categories of goods and services by the appropriate price indexes or by revaluing current period quantities at base year prices.
Estimates of gross domestic product are compiled by the Census and Statistics Department using both the expenditure approach and the production approach.
I. Expenditure estimates
The expenditure estimates measure the total value of goods and services produced for final use, net of their imported contents, and comprise the following major components:
( J) Private consumption expenditure:
This covers all expenditure by the household sector, including private non-profit-making.bodies, on goods and services for current use. It is the sum of the estimates of consumption expenditure on goods and services in the domestic market and the expenditure of Hong Kong residents abroad less the expenditure of non-residents in the domestic market.
Data sources for compiling the estimates include trade statistics, administrative statistics from government departments and various organizations, data collected from economic censuses/ surveys, household surveys and other expenditure surveys conducted by the Census and Statistics Department.
(2) Government consumption expenditure:
Government consumption expenditure refers to the current expenditure on goods and services by non-trading government departments and quasi-government non-profit bodies. Trading departments are distinguished from non-trading departments in that the former are engaged mainly in the production of goods and services for sale to the public. .
Current expenditure on goods and services by non4rading departments and quasi-government bodies is the sum of compensation of employees and purchases of goods and services less receipts from sales of goods and services. The estimates in respect of non-trading d~partme~ts are co~piled based on an analysis of government accounts and other supplementary mformatlon supplied by government departments. Those for the quasi-government bodies are obtained from special enquiries on the income and expenditure of these bodies. Disbursements which are transfer payments are not included.
( 3) Gross domestic fixed capita/formation:
This represents the gross value (i.e. no allowance being made for capital consumption) of investment expenditure in land, building and construction, real estate developers' margin, plant, machinery and equipment by the public and private sectors.
Transfer cost of land and buildings are the expenditure incurred in connection with transfer of ownership ofland and buildings. Building and construction estimates for the private sector for years from 1979 onwards were based on the results of the Survey of Building, Construction and Real Estate Sectors. For the earlier years, private sector building and construction estimates are based on statistical information from the Buildings Ordinance Office. Estimates for the public sector are derived from data obtained from the government accounts, the Mass Transit Railway Corporation and the Kowloon-Canton Railway Corporation. Real estate developers' margin is the difference between the selling price of the newly developed property and its land and construction cost which is taken as the measure of the economic activities of the real estate developers. Data are collected from the Survey of Building, Construction and Real Estate Sectors.
Investment in plant and machinery is compiled from trade statistics, data from the government accounts and statistics on local production.
( 4) Increase in stocks:
The estimates refer to the change in the value of work-in-progress and stocks of goods held by manufacturers and distributorS. The information is based on the opening and closing book values of stocks reported by the establishments in censuses/surveys. Increase in stocks reflect~ c~ange~ in the physical quantities of stocks. Adjustments have been made for stock appreciat10n (1.e. the increase/decrease in value of stocks attributed to price changes) by revaluing the openmg and closing stocks at the average current prices of the period.
( 5) Exports of goods less imports of goods:
Exports of goods include domestic exports and re-exports of merc~andise r~orded on an f.o:h. basis, exclusive of monetary gold. Imports of goods are valued at c.1.f., covermg all merchandise imports and a proportion of retained imports of gold which is considered as non-monetary.
(6) Exports of services less imports of services:
These comprise transactions in services between Hong Kong residents and the rest of the world. Data for compiling various items of imports and exports of services originate from the Hong Kong Tourist Association, various sources of administrative statistics, and the Survey of Imports and Exports of Services.
II. Production estimates
The production estimates measure the sum of •value-added' or 'net output' of all productive units in the economy, for example factories, shops, service organizations. The value-added of a productive unit is equal to the value of total production by the unit (gross output) less the value of materials and services consumed in the process of production (intermediate input). Value-added can be equated with the sum of 'compensation of employees' and 'operating surplus'; the former-includes wages and salaries, payments in kind and employer's expenditure on social security and the latter refers basically to profits of the productive units subject to detailed definitional adjustments. Data sources for compiling the estimates are based on economic censuses and surveys conducted by the Census & Statistics Department, government accounts and other administrative records. A full set of production estimates for all economic sectors is available from the reference year 1980 onwards while for the earlier years, the estimates are available for selected sectors only.
Economic sectors covered by the production estimates are classified broadly into the following: agriculture and fishing; mining and quarrying; manufacturing; electricity, gas and water; construction· wholesale and retail, import/export trades, restaurants and hotels; transport, storage and co~unication; financing, insurance, real estate and business services; community, social and personal services; ownership of premises and the nominal sector. Ownership of premises is treated as an economic activity in the national accounts. This sector covers rental services which owners of premises like households, government and private non-profit. org~nizat~o~s P!~vide to thei:riselves and rental services provided to tenants by owners of premises m thetr md1v1dual capacity. An imputed estimate of rent is introduced into the na~ional incom~ calculations to reflect ~he value of services rendered by the former kind of properties. The nommal sector may be descnbed as a provision for the adjustment for financial services. An imputed service charge, equal to net interest receipts (interest received minus interest paid) is included in valuing the output of the banking sector. It is necessary to charge other economic sectors for the use of this imputed service. However, there is virtually no basis to enable this aUocation to be made, and the internationally acoepted practice is to create a dummy or nominal accoui;it to w~ich is d~bited the total impu~ed banking charge. The value-added of the nominal sector is negative and 1s of the same magmtude as the imputed banking charge.
Further details on the methods and data sources for compiling the estimates of gross domestic product are contained in the publication 'Estimates of Gross Domestic Product, 1966 to 1986'.
Hong Kong Monthly Digest of Statistics April 1987

Hong Kong Review of Overseas Trade • in 1986 A Concise Annual Review on Hong Kong's External Trade Performance
This publication contains the latest annual figures on:
• Value, unit value and quantum indexes of dt>mestic exports, re-exports and imports
• Terms of trade indexes
• Domestic exports by principal commodity, major.market and industrial origin (with highlights for cotton textiles, clothing and man-made fibre products)
• Imports by end-use and retained imports of significant industrial items
• Re-exports by country of origin, destination and principal commodity
• Airborne and seaborne trade by commodity and country
• Comparative international statistics
• Tonnage of commercial cargo by mode of transport
• Exchange rates and their indexes
The Hong Kong Review of Overseas Trade,
Now available at HK$20.00 only
published annually by the Census & Statistics Department, contains a brief text, 18 graphs and 39 statistical tables giving a concise review on Hong Kong's external trade performance in the latest year compared with earlier years. It brings together in one volume the latest annual statistics on the value, price and volume movements of Hong Kong's external trade and exchange rates. It is a useful reference for businessmen, economists, researchers and any parties interested in analysing Hong Kong's external trade performance on an annual basis.
Copies can be obtained from the Government Publications Centre, General Post Office Building, Connaught Place, and from the Publications Sales Counter of Census & Statistics Department at 19/F, Wanchai Tower I, 12 Harbour Road, Wan Chai, Hong Kong.

PUBLICATIONS Produced by Census and Statistics Department
Title of Publication
Price in HK$ (excluding
postage)
Regular: Hong Kong Economic Trends (monthly) Hong Kong Monthly Digest of Statistics (month ly) Hong Kong Trade Statistics Summary (monthly) .... Hong Kong External Trade (monthly) Hong Kong Trade Index Numbers (monthly) Hong Kong Trade Statistics 1986:
Imports (monthly) .. ... .... . Exports & Re-exports (monthly) Annual Supplement
Imports ................ . ... ... .... .. .... . . Exports & Re-exports ... .. .... .... .. ... ....................... ...... ...... .
Consumer Price Index Report (monthly) ................. ...... .... . Month ly Survey of Employment, Payroll and Orders-on-
Hand (monthly) ........... . ................................ . Report on Monthly Survey of Retai l Sales (monthly) .. Report on Quarterly Survey of Restaurant Receipts and
Purchases (quarter ly) ... ... ... ... ... ... ... . . Quarterly Business Survey Report (quarterly) ..................... . Report on the Quarterly Index of Industrial Production
(quarterly) .......... . ...... ........................... .. .... .. ... . . Textile Production Statist ics (quarterly) .. . Report on the Quarterly Survey of Construction Output
(quarterly) ... ... ... .... .. . .............................. .. ....... .................... . Employment. Wages and Material Prices in the Construction
Industry (quarter ly) ....................... .... ..... ... ........................ . . Report of Employment, Vacancies and Payroll Statistics
(quarterly) ............... . .... .. .. .... ... .. ... ... . General Household Survey Labour Force Characteristics
(quarterly) .............................. . ... .... ... .... . . Quarterly Report of Wages, Salaries and Employee Benefits
Statistics (quarterly) : Volume I . ...... ... ... ... ... ....... . ..................... .... . . (Deta iled Tables) Volume II .. .. .... .. ................................ . .
Hong Kong Energy Statist ics (Quarterly Supplement) ....... . Hong Kong Sh ipping Statist ics (quarterly) .......... .. .. .... .. . Hong Kong Shipping Statistics (yearly) Employment & Vacancies Statistics (Detailed Tables) in
Manufacturing, Mining & Quarrying, Electricity & Gas 1986 (yearly) .. .. .... . ........... ... ... .
Employment & Vacanc ies Statistics (Detailed Tables) in Transport, Storage & Communication, Financing, Insurance, Real Estate & Business Services, Community, Social & Personal Services 1986 (yearly) ........... ... ... .. ..... .
Employment & Vacancies Statistics (Detai led Tables) in Wholesale, Reta il, Import & Export Trades, Restaurants & Hotels 1986 (yearly) ..... .............................. ..... .. .... .. ... .
Hong Kong Annual Digest of Stat istics 1986 Edition (yearly) .. ........................ . ............... .
Report of Salaries and Employee Benefits StatisticsManageria l and Professional Employees (Excluding Top Management ) 1986 (yearly) .............. . . ... ... .......... .
Annual Report on the Consumer Price Index 1986 (yearly) Import/Export Price Indexes 1983 (yearly) .. ....................... . Hong Kong Review of Overseas Trade in 1986 (yearly) .... . Hong Kong Energy Stat ist ics 1976-1986 (yearly) 1984 Survey of Industria l Production (yearly) .. ... ... ... ... .. .... . 1984 Survey of Wholesale, Retail and Import/Export Trades,
Restaurants and Hotels (year ly) ...................... ... ... ... ... ..... . 1984 Survey of Storage, Communications, Financing, In-
surance and Business Services (yearly) ....... .... .. . 1984 Survey of Transport and Related Services (yearly) .. .. 1984 Survey of Bu ilding, Construction and Real Estate
Sectors (yearly)
1.00 28.00
5.50 15.00
2.50
70.00 70.00
70.00 70.00
3.50
1.50 1.00
1.00 3.50
3.00 1.50
2.00
3.00
11.00
9.50
8.00 8.00 4.00
19.50 19.00
52.00
35.00
48.00
95.00
15.00 12.00
3.00 20.00
9.50 12.50
7.50
8.50 7.50
9.00
Title of Publication
Price in HK$ (excluding
postage)
An Outline of Statistical Development 1987 (yearly) Estimates of Gross Domestic Product 1966 to 1986 (yearly) Hong Kong Social and Economic Trends 1974-1984
(triennial) .................... ............ ...... ...... ... ... ........................... .
Irregular: Hong Kong 1981 Census:
Tertiary Planning Unit Population by Age .... .. .. ... ..... . Living Quarters, Households and Population by Type of
Living Quarter and Tertiary Planning Unit .. ..... .. .... .. ..... . Basic Tables ................................................................ ... .. .... . District Board Tabulations ... .. ... ...... ... ... ... ..... .... .. .... ... .. ... ... . . District Board Constituency Area Population by Age .... . . Tertiary Planning Unit Tabulations:
Hong Kong Island ...................................... .................... . Kowloon and New Kowloon .... ... ... ... ... ... ... .... .... ... ..... ... . . New Territories .. .. .. ..... ....... ..... .. .... ... ... ...... .... ... ...... ...... .... .
Street Block/Village Cluster Tabulations: Hong Kong Island East ..... ... ... .. .... .. .... .. .... ... ...... ... ......... . . Hong Kong Island West .................................... .............. . Kowloon.. .. .. ... ........ .. . . ........... ..................... ..... ......... . New Kowloon ... ............................................... .......... ..... . Tai Po and Fanling ................................. ... .... ...... ...... ..... . Tsuen Wan, Yuen Long and Tuen Mun ....... .... .. ... ... ... .. . Sha Tin, Sai Kung and Islands ................ .... .. ... ...... ... ... .. .
Graphic Guide (- ji,;\.- !if:'@'n!lf' i::Jt.ifttitt.iftiftll\.ij~~) Main Report:
Volume 1: Analysis .......................... ............ ... ... ..... . Volume 2: Tables ......................................... ...... ... ... ... ... . .
Educational Attainment, Median Household Income, Occupation & Labour Force .. .. .... ... ..... ..... ... .. ..... ...... ...... .
Hong Kong 1986 By-Census: Summary Results .. .. ... ... ... .. ........ .. .... ....... ..... .. ...................... . Tertiary Planning Unit: Population by Age ...... ................. . Tertiary Planning Unit: Living Quarters, Households
and Population by Type of Living Quarters .. ........ ... ... .. . District Board Constituency Area : Population by ~e ....................... ......... ...... ...... ... .. ..... .... .... ...... .. ....... ... . .
District Board Constituency Area: Living Quarters, Households and Population by Type of Living Quarters ....................................................... ... .. .... .... .. .. .... .
District Board: District Summary Tables ... ................... ..... . District Board: Constituency Area Summary Tables .. ... .. .
Tertiary Planning Unit Summary Tables: Hong Kong Island ............................. ..... ..... ... .... .. ... .... ...... .. . Kowloon and New Kowloon ..... .......... ..... ... .... ...... .... .. .... .. . New Territories ...... ..... ..... ...... .. .... .. .... .. ..... ........................... .
Hong Kong Population A 20-Year Projection ... ..... ... .. ... ... .. . Hong Kong Population A 20-Year Projection (Revised
Edition) ............ ......... ............................................................ . Hong Kong Life Tables ................................................... ... ..... . Demographic Trends in Hong Kong 1971-82 ..... ........ ........ . Hong Kong Imports & Exports Classification List 1986 Issue Report on The Household Expend iture Survey, 1984-85 ... Special Topics Report Ill-Social Data Collected by the
General Household Survey .. .. .... ....... ..... .. ... .... ... ... ... ... ... ... . . Crime And Its Victims in Hong Kong 1981
English Version ................... ................ ......... ..... .. .... .. ..... .... .. . Chinese Version (- ji,;\.-!if:Wnll~':l:.1¥1$~.&jt:~~
fi) .............................................................. ...... ....... .... .. .... .
Free: Average Dai ly Wages of Workers Engaged in Government
Building and Construction Projects (monthly) Hong Kong in Figures, 1987 Edition
10.00 20.00
30.00
6.00
8.00 6.00 9.00 5.00
42.00 48.00 77.00
60.00 66.00 63.00 71 .00 65.00 85.00 56 .00
6.50
101 .00 106.00
2.00
6.00 10.00
10.00
12.00
10.00 37.00
144.00
90.00 95.00
150.00 24.00
4.00 16.00 26.00 45.00 25.00
12.00
16.00
16.00
Enquiries concerning the above publications or their back issues should be addressed to the Publications Officer, Census and Statistics Department, Wancha i Tower I, 12 Harbour Road, Wan Chai, Hong Kong. Telephone No. 5-8235073.
Saleable copies are purchasable from the Government Publications Centre, General Post Office Building, Ground Floor, Connaught Place, Hong Kong and from the Publ ications Sa les Counter of Census and Statistics Department at 19/F, Wanchai Tower I, 12 Harbour Road, Wan Cha i, Hong Kong.
Order for loca l and overseas mai lings please contact the Director of Information Services, Information Services Department, Baskerville House, Duddel l Street, Hong Kong.
150419-36L-6/87 $28-J470487
Top Related
Copyright © 2022 FDOKUMEN

