


Bahasa
Halaman
Hukum

ERIK JORGE SILVA FERREIRA
Licenciado em Engenharia Geológica
Hole Cleaning Performance Monitoring During The
Drilling Of Directional Wells
Dissertação para obtenção do Grau de Mestre em Engenharia Geológica (Georrecursos)
Orientador: Doutor José António de Almeida
Prof. Associado, Faculdade de Ciências e Tecnologia da UNL
Co-orientador: Engenheiro Mário José Manuel
Drilling Engineer, Empresa Total E&P Angola
Júri:
Presidente: Prof. Doutora Ana Paula Fernandes da Silva
Arguente(s): Prof. Doutor Paulo do Carmo Sá Caetano
Vogal(ais): Prof. Doutor José António de Almeida
Setembro 2012

Erik Jorge Silva Ferreira
Licenciado em Engenharia Geológica
Hole Cleaning Performance Monitoring During The Drilling
Of Directional Wells
Dissertação para obtenção do Grau de Mestre em Engenharia Geológica (Georrecursos)
Orientador: Doutor José António de Almeida
Prof. Associado, Faculdade de Ciências e Tecnologia da UNL
Co-orientador: Engenheiro Mário José Manuel
Drilling Engineer, Empresa Total EP Angola
Setembro 2012


I
HOLE CLEANING PERFORMANCE MONITORING DURING THE DRILLING OF DIRECTIONAL WELLS
Copyright em nome de Erik Jorge Silva Ferreira, da FCT/UNL e da UNL
A Faculdade de Ciências e Tecnologia e a Universidade Nova de Lisboa tem o direito, perpétuo e sem
limites geográficos, de arquivar e publicar esta dissertação através de exemplares impressos
reproduzidos em papel ou de forma digital, ou por qualquer outro meio conhecido ou que venha a ser
inventado, e de a divulgar através de repositórios científicos e de admitir a sua cópia e distribuição
com objetivos educacionais ou de investigação, não comerciais, desde que seja dado crédito ao autor e
editor.


III
ACKNOWLEDGEMENTS
Although a dissertation is, by its academic purpose, individual work, there are contributions of various
kinds which cannot and should be highlighted. For this reason, I express my sincere thanks:
To Drilling wells Tutor, Jacques Dumont and Drilling Engineer, Mário José Manuel, who supervised
this work by helping in a constructive manner for the availability revealed during these six months,
and their criticisms and suggestions made during the relevant guidance.
To TOTAL, for operational support and providing field data, which were fundamental to this work.
To Luis Benchimol, Jerome Profinet, Eugenio António, Sambo Pedro, José Cardoso, Ben Silva,
Mpanda Dompetelo, Dixander Alárcon, Pedro António, Hildebrando Pedro, José Podia, Bruno
Assunção, José Lundungo, Vera Moreno, Abdenego Campos, active members of the company Total
E&P, who helped me gain knowledge and providing material to do this work.
To Colleagues from Total E&P for its warmth and tireless moral support during my internship and the
wonderful and rewarding moments we spent together.
To my Teachers of the Earth Sciences Department, of Faculdade de Ciências e Tecnologia, who taught
me the basics of my field of study, especially professors, Paulo de Sá Caetano, José Carlos Kullberg,
Maria da Graça Azevedo de Brito, Joaquim Simão, Zenaide da Silva, Ana Paula Fernandes da Silva
and José Antonio de Almeida , who also provide valuable guidance of my work.
To my friends at the Faculdade de Ciências e Tecnologia, who provided a valuable exchange of
materials to me and also friendship and fun and great times we had.
To all my non academic friends who contributed with their friendship and support for this work. I
express my deep gratitude.
Finally (the last are always the first), my family, especially my father Vasco Alves Ferreira Junior, my
mother Maria Eugénia Silva, for the unconditional support and encouragement from the outset, and for
their patience, friendship and wisdom. To my brother Yuri Ferreira, my sister Yoshida Ferreira Lopes
and my brother-in-law Hugo Lopes for the support and complicity.
And finally to my companion Petra Cruz, thank you for the huge load you carried as you motivated me
and your caring and support during my academic life.


V
RESUMO Durante a perfuração de um poço, são produzidos detritos que devem ser removidos do fundo do poço
para evitar constrangimentos que podem dar origem a tempo não produtivo. A maioria dos eventos
relacionados com o entrave da coluna de perfuração, levando em certos casos a perda de coluna de
perfuração estão relacionados com a inapropriada limpeza do poço. Existem parametros que ajudam a
aumentar a eficiência da limpeza do poço e outros que ajudam a determinar as condições de limpeza
do poço. A seleção apropriada dos parâmetros chaves, facilita a monitorização da evolução da limpeza
do poço assim como as possíveis intervenções em caso de haver constrangimentos durante a
perfuração.
O objectivo da monitorização do desempenho da limpeza do poço em tempo real e de acompanhar a
eficiência da limpeza do poço e as condições de estabilidade do poço durante a perfuração. A
adequada limpeza do poço, e uma das maiores preocupações durante a perfuração de um poço,
principalmente em poços direcionados e horizontais.
Este trabalho tem como objetivo endereçar alguns fundamentos teóricos e práticos sobre a limpeza de
poço que irão servir de princípios básicos a serem aplicados durante a perfuração de um poço.
Entender de que modo os parâmetros Flowrate, Rotacoes Por Minuto (RPM), Rate Of Penetration
(ROP) and Mud Weigth aumentam o desempenho da remoção dos detritos do fundo do poço e como
os parâmetros do Equivalent Circulate Density (ECD), Torque & Drag (T&D) e Volume de Detritos
vindos do fundo do poço indicam o estado de limpeza e estabilidade do poço.
Para o caso de estudo, a monitorização do desempenho da limpeza do poco, será baseada na medição
em tempo real do volume de detritos removidos do fundo do poço a um determinado tempo, tendo em
conta o Flowrate, RPM e Mud Wigth, projetando graficamente numa folha Excel os valores obtidos de
modo a comparar com os valores esperados durante a perfuração. A monitorização dos parâmetros
Equivalent Circulate Density (ECD) servirá de auxílio para determinar as condicoes de estabilidade do
poco e o modelo Torque & Drag (T&D) Data, servirá de auxílio para determinar em que condições de
limpeza se encontra o poço. O T&D Model Software providencia valores teóricos para o Torque and
Drag. Este modelo usa as medições do Hookload para calcular os factores de fricção em torno do
poço.
Palavras-chave: Limpeza de Poço; Tempo Não Produtivo; Volume de Detritos; Flowrate, Rotações
Por Minuto (RPM), Rate Of Penetration (ROP); Equivalent Circulate Density (ECD); Torque and
Drag (T&D)

VII
ABSTRACT
During drilling operation, cuttings are produced downhole and must be removed to avoid issues which
can lead to Non Productive Time (NPT). Most of stuck pipe and then Bottom-Hole Assembly (BHA)
lost events are hole cleaned related. There are many parameters which help determine hole cleaning
conditions, but a proper selection of the key parameters will facilitate monitoring hole cleaning
conditions and interventions.
The aim of Hole Cleaning Monitoring is to keep track of borehole conditions including hole cleaning
efficiency and wellbore stability issues during drilling operations. Adequate hole cleaning is the one of
the main concerns in the underbalanced drilling operations especially for directional and horizontal
wells.
This dissertation addresses some hole cleaning fundamentals which will act as the basis for
recommendation practice during drilling operations. Understand how parameters such as Flowrate,
Rotation per Minute (RPM), Rate of Penetration (ROP) and Mud Weight are useful to improve the
hole cleaning performance and how Equivalent Circulate Density (ECD), Torque & Drag (T&D) and
Cuttings Volumes coming from downhole help to indicate how clean and stable the well is.
For case study, hole cleaning performance or cuttings volume removal monitoring, will be based on
real-time measurements of the cuttings volume removal from downhole at certain time, taking into
account Flowrate, RPM, ROP and Drilling fluid or Mud properties, and then will be plotted and
compared to the volume being drilled expected. ECD monitoring will dictate hole stability conditions
and T&D and Cuttings Volume coming from downhole monitoring will dictate how clean the well is.
T&D Modeling Software provide theoretical calculated T&D trends which will be plotted and
compared to the real-time measurements. It will use the measured hookloads to perform a back-
calculation of friction factors along the wellbore.
Keywords: Hole Cleaning; Non Productive Time (NPT); Cuttings; Flowrate, Rotation Per Minute
(RPM), Rate Of Penetration (ROP); Torque and Drag (T&D); Equivalent Circulate Density (ECD)


IX
INDEX
1. Introduction .................................................................................................. 1
1.1 OBJECTIVES AND FRAMEWORK ................................................................................. 1
1.2 ORGANIZATION ................................................................................................................. 1
2. D RILLING OPERATION OVERVIEW .................................................. 3
2.1 DRILLSTRING DESIGN ..................................................................................................... 4
2.2 WELL DESIGN ..................................................................................................................... 7
2.2.1 Well Architecture ............................................................................................................ 7
2.2.2 Casing .............................................................................................................................. 7
2.2.3 Cement............................................................................................................................. 9
2.2.4 Well Profile ..................................................................................................................... 9
2.3 DRILLING FLUIDS (DF) SELECTION .......................................................................... 12
2.4 WELLBORE STABILITY ISSUE .................................................................................... 16
3. FUNDAMENTALS OF HOLE CLEANING .......................................... 37
3.1 CUTTINGS BEHAVIOR IN DOWNHOLE ..................................................................... 37
3.2 CUTTINGS TRANSPORTATION ................................................................................... 38
3.3 PARAMETERS THAT EFFECT HOLE CLEANING ................................................... 39
3.3.1 Drillpipe Rotation .......................................................................................................... 40
3.3.2 Flow rate ........................................................................................................................ 40
3.3.3 Drilling Fluid Properties ................................................................................................ 41
3.4 GUIDELINES FOR HOLE CLEANING ......................................................................... 42
3.4.1 Guidelines For Hole Cleaning While Drilling ............................................................... 42
3.4.2 Guidelines for cleanup prior tripping out of hole .......................................................... 45
3.4.3 Guidelines for backreaming through a tight spot .......................................................... 46
3.4.4 Guidelines for remedial hole cleaning ........................................................................... 46
4. GENERAL RIG SITE PARAMETERS MONITORING ...................... 49

X
4.1 TORQUE & DRAG (T&D) MONITORING .................................................................... 49
4.2 HOLE CLEANING RATE MONITORING .................................................................... 51
4.3 EQUIVALENT CIRCULATING DENSITY (ECD) MONITORING ........................... 51
5. ENVIORONMENT ISSUES DURING DRILLING OPERATIONS ... 55
5.1 ENVIRONMENT PROBLEMS ......................................................................................... 55
5.2 MITIGATION MEASURES .............................................................................................. 55
5.3 WASTE MANAGEMENT ................................................................................................. 56
6. CASE STUDY – WELL NAME: “MUCUA 10 (m-10)” ........................ 59
6.1 OBJECTIVE ........................................................................................................................ 59
6.2 GEOGRAPHICAL AND GEOLOGICAL GENERAL DATA ...................................... 59
6.3 WELL PLAN AND WELL ARCHITECTURE ............................................................... 62
6.4 THE SPECIFIC CASE FOR 9 ½” SECTION .................................................................. 62
6.4.1 Drilling Procedures ........................................................................................................ 62
6.4.2 Hole Cleaning While Drilling at section TD ................................................................. 63
6.4.3 Hole Cleaning performance Monitoring ....................................................................... 64
7. FINAL REMARKS .................................................................................... 71
8. REFERENCES ........................................................................................... 73
XI
Index of figures
Figure 2.2: Schematic drawing of an oil well being drilled .................. Error! Bookmark not defined.
Figure 2.3: Drillstring .............................................................................................................................. 4
Figure 2.4: Drill collar ............................................................................................................................. 5
Figure 2.5: Stabilizer ............................................................................................................................... 6
Figure 2.6: Hydraulic Jar ......................................................................................................................... 6
Figure 2.7: Cross-over ............................................................................................................................. 6
Figure 2.8: Drilling Bit. A) Tooth bit for soft formation. B) PDC Bit for hard formation ...................... 7
Figure 2.9: Casing. A) Conductor Pipe. B) 14" Casing........................................................................... 8
Figure 2.10: Casings used to drill a well ................................................................................................. 9
Figure 2.11: Vertical well ...................................................................................................................... 10
Figure 2.12: J-Type well ....................................................................................................................... 10
Figure 2.13: S-Type well ....................................................................................................................... 10
Figure 2.14: Horizontal well ................................................................................................................. 11
Figure 2.15: Deviated well applications ................................................................................................ 12
Figure 2.16: Drilling Fluid Density window and formation pressure. .................................................. 13
Figure 2.17: Mud filtrate ....................................................................................................................... 15
Figure 2.18: Undergauge hole. .............................................................................................................. 18
Figure 2.19: Mobile formation .............................................................................................................. 19
Figure 2.20: Dogleg ............................................................................................................................... 20
Figure 2.21: Key seat............................................................................................................................. 21
Figure 2.22: Hole Cleaning Induced Packoff ........................................................................................ 23
Figure 2.23: Unconsolidated formation ................................................................................................. 24
Figure 2.24: Reactive Formations ......................................................................................................... 25
Figure 2.25: Fractured formation .......................................................................................................... 26
Figure 2.26: Cement blocks ................................................................................................................... 27
Figure 2.27: Natural over-pressure. ....................................................................................................... 28

XII
Figure 2.28: Induced over-pressure ....................................................................................................... 30
Figure 2.29: Tectonically stressed formations ....................................................................................... 31
Figure 2.30: Overburden stress ............................................................................................................. 32
Figure 2.31: Junk in hole ....................................................................................................................... 33
Figure 2.32: Green cement .................................................................................................................... 34
Figure 2.33 - Differential sticking ......................................................................................................... 35
Figure 3.1: Fluid Movement in the Annulus ......................................................................................... 37
Figure 3.2: Formation of Cuttings Dunes when Sliding ........................................................................ 38
Figure 3.3: Cuttings behaviour at different ranges of inclination .......................................................... 39
Figure 3.4:Impact of Rotation on Cuttings Beds ................................................................................... 40
Figure 3.5: Change in Flow Area with Viscosity. ................................................................................. 42
Figure 3.6: Acceptable Cutting Bed and Backreaming ......................................................................... 48
Figure 4.1: T&D Monitoring chart ........................................................................................................ 49
Figure 4.2: Ploughing of the Tool joint in the cutting Bed.................................................................... 51
Figure 4.3: ECD Increase due to Pipe Rotation. ................................................................................... 52
Figure 6.1: Block 17 Location.. ............................................................................................................. 59
Figure 6.2: Location of Mucua field ..................................................................................................... 60
Figure 6.3: Lithostratigraphic column of the Lower Congo Basin ........................................................ 61
Figure 6.4: Light Architecture. .............................................................................................................. 62
Figure 6.5: Monitoring PUW. Expected vs Actual. .............................................................................. 65
Figure 6.6: Monitoring SOW Expected vs Actual. ............................................................................... 65
Figure 6.7: Monitoring Torque Expected vs Actual. ............................................................................. 66
Figure 6.8: Monitoring ECD. Expected (at 1600m MDBML) vs Actual. ............................................. 67
Figure 6.9: Monitoring hole cleaning performance. .............................................................................. 68

XIII
Index of tables
Table 2-1: Function and Physical Properties of Drilling Fluid ............................................................. 15
Table 3-1: Rotary speed rules ................................................................................................................ 43
Table 3-2: Flow rate recommendation .................................................................................................. 43
Table 6-1: Hole Cleaning Rate Results ................................................................................................. 69

XV
ABBREVIATIONS
AV: Annulus velocity
BHA: Bottom-Hole Assembly
BU: Bottoms up
CP: Conductor Pipe
DF: Drilling Fluid
DP: Drill Pipe or Drillpipe
ECD: Equivalent Circulate Density
ERD: Extended Reach Drilling
FD: Fluid Density
FRT: Free Rotate Torque
FV: Fluid Viscosity
h = Bed height
HWDC: Heavy Weight Drill Collar
LWD: Logging While Drilling
MD: Measure Depth
MWD: Measure While Drilling
NABM: Non Aquose Base Mud
NMDC: Non Magnetic Drill Collar
NPT: Non Productive Time
OBM: Oil Base Mud
OD: Outer diameter
OD: Outer Diameter
Cd: Cuttings drilled
SbA: Surface bit Area
ROP: Rate of Penetration
POOH: Pull Out of Hole
PUW: Pick Up Weight
PV: Plastic Viscosity
PWD: Pressure While Drilling
RIH: Run In Hole
ROP: Rate of Penetration
RPM: Rotation per Minute
SBM: Synthetic Based Mud
SG: Specific Gravity
SOW: Slack Off Weight
Stand: Group of at least three drill pipes or
casing units approximately 10 meters long and
connected to each other.
T&D: Torque and Drag.
TD: Total Depth.
TOC: Top of Cement.
TVD: True Vertical Depth.
WBM: Water Base Mud
YP: Yield Point
α = Residual bed height
β = Initial bed height
γ = Reciprocal time constant


1
1. INTRODUCTION
1.1 OBJECTIVES AND FRAMEWORK
The purpose of this dissertation is to fulfil the internship requirement for a Master’s Decree of
Geological Engineering. The internship began on March, 19th 2012 ended on September, 7
th of 2012 at
Total E&P in Angola. Focused on drilling techniques, in particular on good Hole Cleaning techniques
and procedures when drilling, tripping and running the casing in directional drilled wells.
The dissertation also dmostrate the benefits provided by monitoring hole cleaning parameters and how
hole cleaning efficient parameters improve cuttings removal and discuss what could happen in
downhole and the best actions or procedures to take in case of hole cleaning issues.
1.2 ORGANIZATION
This dissertation is organized into eigth chapters:
Chapter 1 presents a brief review of the general objectives of the dissertation.
Chapter 2 outline basic concepts about drilling operations and describes general drilling operations
overview.
Chapter 3 chapter describes the theoretical background for hole cleaning as well as the main
parameters and their interaction and standard procedures for hole cleaning when drilling, tripping, etc.
Chapter 4 explains what parameters must be used to get a good motorization for hole cleaning.
Chapter 5 discusses the environmental issue, how drilling waste affects the environment and
mitigation measures.
Chapter 6 presents the dissertation’s case study including a discussion of the basic practices used on
the M-10 well drilled in the case study.
Chapter 7 discuss final remarks.
Chapter 8 lists dissertation’s references.

3
2. D RILLING OPERATION OVERVIEW
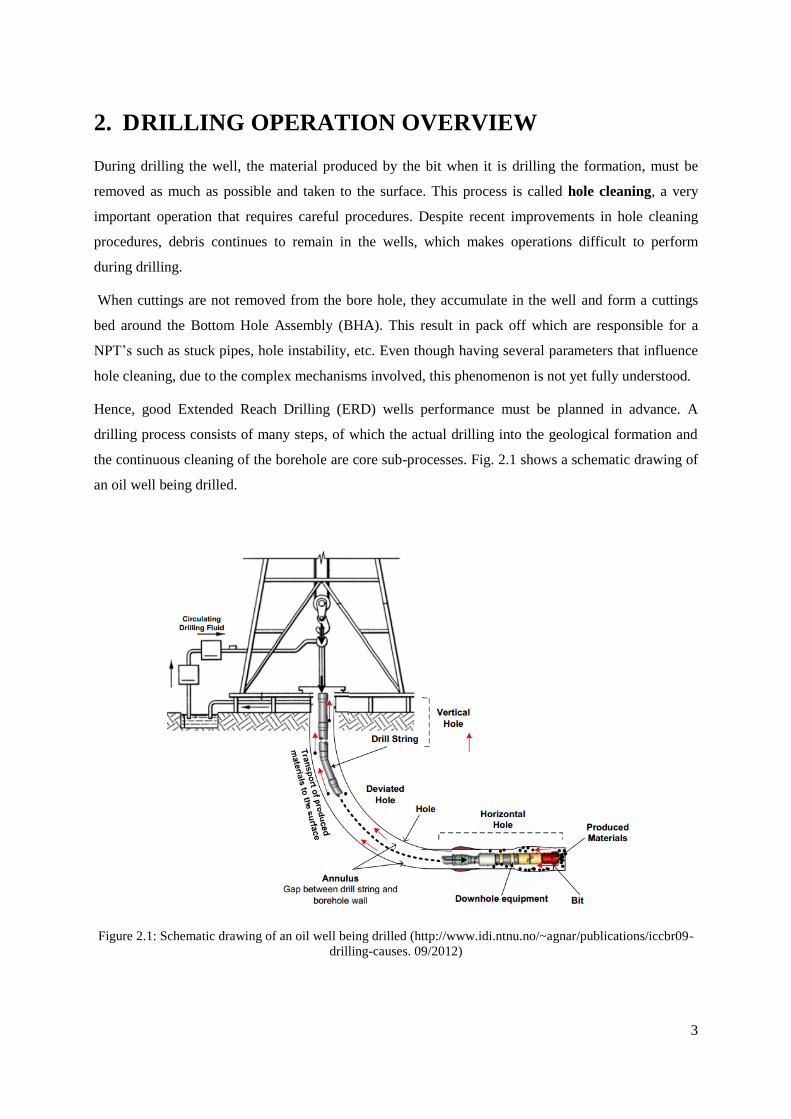
During drilling the well, the material produced by the bit when it is drilling the formation, must be
removed as much as possible and taken to the surface. This process is called hole cleaning, a very
important operation that requires careful procedures. Despite recent improvements in hole cleaning
procedures, debris continues to remain in the wells, which makes operations difficult to perform
during drilling.
When cuttings are not removed from the bore hole, they accumulate in the well and form a cuttings
bed around the Bottom Hole Assembly (BHA). This result in pack off which are responsible for a
NPT’s such as stuck pipes, hole instability, etc. Even though having several parameters that influence
hole cleaning, due to the complex mechanisms involved, this phenomenon is not yet fully understood.
Hence, good Extended Reach Drilling (ERD) wells performance must be planned in advance. A
drilling process consists of many steps, of which the actual drilling into the geological formation and
the continuous cleaning of the borehole are core sub-processes. Fig. 2.1 shows a schematic drawing of
an oil well being drilled.
Figure 2.1: Schematic drawing of an oil well being drilled (http://www.idi.ntnu.no/~agnar/publications/iccbr09-
drilling-causes. 09/2012)
4
2.1 DRILLSTRING DESIGN
Bit and BHA design are two of the main ERD performance factors. Drillings parameters such as angle,
rotary speed limitations, flow rate limitations, directional performance, bit utility and overall hole
cleaning efficiency must all be considered in the design and must be planned in advance. The
following is a description of drillstring and some of its components.
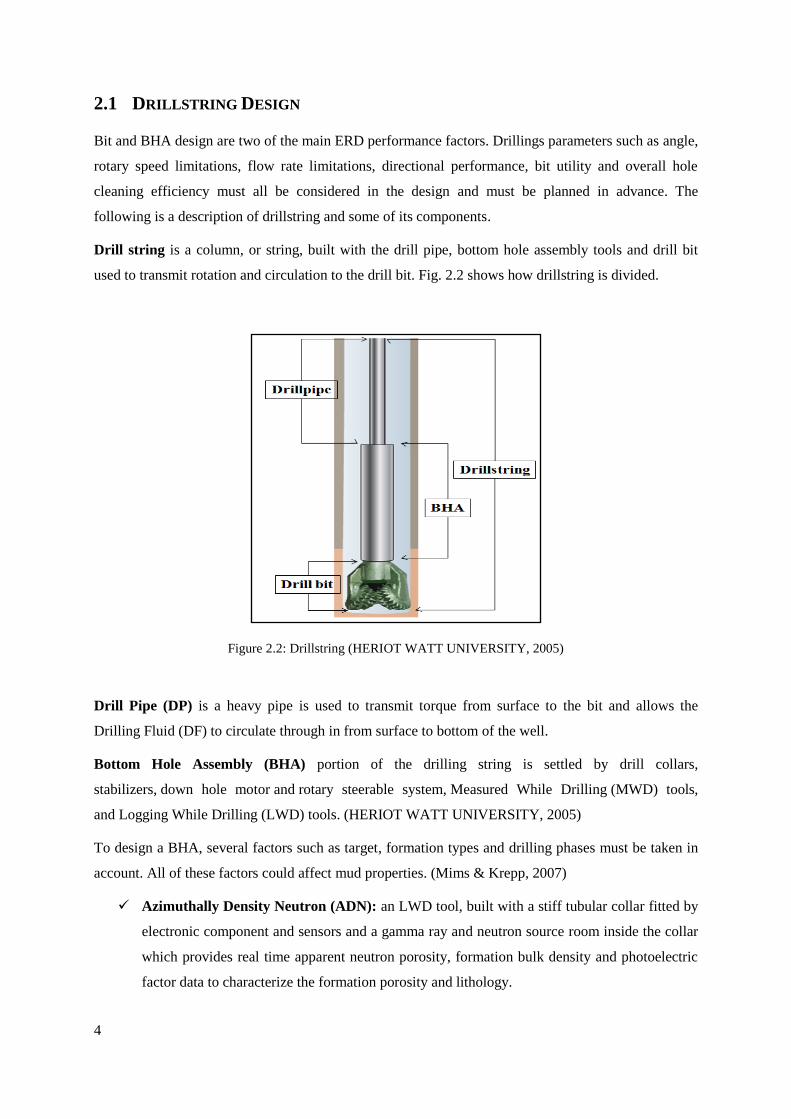
Drill string is a column, or string, built with the drill pipe, bottom hole assembly tools and drill bit
used to transmit rotation and circulation to the drill bit. Fig. 2.2 shows how drillstring is divided.
Figure 2.2: Drillstring (HERIOT WATT UNIVERSITY, 2005)
Drill Pipe (DP) is a heavy pipe is used to transmit torque from surface to the bit and allows the
Drilling Fluid (DF) to circulate through in from surface to bottom of the well.
Bottom Hole Assembly (BHA) portion of the drilling string is settled by drill collars,
stabilizers, down hole motor and rotary steerable system, Measured While Drilling (MWD) tools,
and Logging While Drilling (LWD) tools. (HERIOT WATT UNIVERSITY, 2005)
To design a BHA, several factors such as target, formation types and drilling phases must be taken in
account. All of these factors could affect mud properties. (Mims & Krepp, 2007)
Azimuthally Density Neutron (ADN): an LWD tool, built with a stiff tubular collar fitted by
electronic component and sensors and a gamma ray and neutron source room inside the collar
which provides real time apparent neutron porosity, formation bulk density and photoelectric
factor data to characterize the formation porosity and lithology.

5
Array Resistivity Compensated (ARC): a LWD tool, built with a stiff tubular collar fitted by
electronic component and sensors, which provide real time resistivity, and gamma ray and
annular pressure while drilling measurements.
Telescope: a MWD tool, built with a stiff tubular collar fitted by electronic component and
sensors, which provides continues direction and inclination to guide geosteering while drilling.
Non Magnetic Drill Collar (NMDC): a heavy stiff tubular pipe, usually located on the
bottom part of the BHA which is used to provide weight and rigidity to the bit and also used to
avoid and isolate magnetic interference coming from BHA steel components when survey is
taken by a MWD tool.
Drill Collar (DC): a heavy stiff tubular pipe, used at the bottom of BHA to provide weight
and rigidity for the bit.
Figure 2.3: Drill collar
Heavy Weight Drill Pipe (HWDP): works as a DC with different weight and is commonly
used to reinforce drill string resistance against compressive strength.
Stabiliser: used to control the deviation of the wellbore, so as to avoid the risk of unexpected
deviation one or more stabilisers may be used to keep the desired trajectory.

6
Figure 2.4: Stabilizer
Hydraulic Jar: designed to deliver impact either upward or downward in case of a stuck pipe.
Figure 2.5: Hydraulic Jar
Cross-over (XO): a joint, normally used to connect two pipes of different sizes.
Figure 2.6: Cross-over
Bit the cutting element at the bottom of drillstring, which is used to bore the formation.
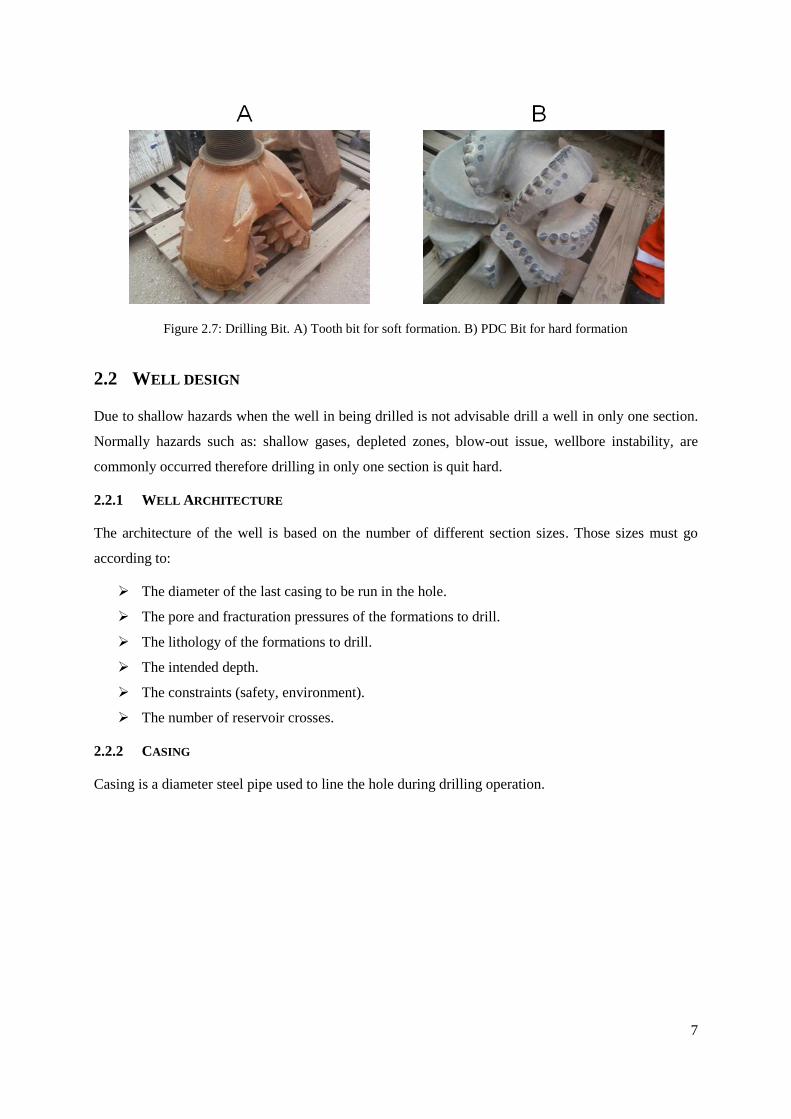
7
Figure 2.7: Drilling Bit. A) Tooth bit for soft formation. B) PDC Bit for hard formation
2.2 WELL DESIGN
Due to shallow hazards when the well in being drilled is not advisable drill a well in only one section.
Normally hazards such as: shallow gases, depleted zones, blow-out issue, wellbore instability, are
commonly occurred therefore drilling in only one section is quit hard.
2.2.1 WELL ARCHITECTURE
The architecture of the well is based on the number of different section sizes. Those sizes must go
according to:
The diameter of the last casing to be run in the hole.
The pore and fracturation pressures of the formations to drill.
The lithology of the formations to drill.
The intended depth.
The constraints (safety, environment).
The number of reservoir crosses.
2.2.2 CASING
Casing is a diameter steel pipe used to line the hole during drilling operation.

8
Figure 2.8: Casing. A) Conductor Pipe. B) 14" Casing
Purpose of casings:
To maintain the fluids inside the well.
To maintain the formations already drilled.
To allow drilling safely (casings should allow to circulate a kick without risks of fracturation
in the open hole).
To re-establish and maintain the seal between layers.
Casings used on drilling operations:
Conductor pipe (CP)
To constitute a foundation for the well and maintain the soil.
Length: from few meters to few tenths of meters (≈65m).
Surface casing
To support others casings and well head.
To protect potable water reservoir.
Is cemented from bottom to surface.
Length: a few hundred meters.
Intermediate or technical casing
To solve pressure, lithology, depth problem.
Is always cemented at the shoe
Length: few thousand meters.
Production casing
To protect pay zone.
To allow completion equipment to be put in place.

9
Figure 2.9: Casings used to drill a well. (From: IFP Training 2010)
2.2.3 CEMENT
The bit size is bigger than the casing size and the empty spaces must be avoided during perforation,
because gas leaks may occur. Cement is used to seal these gaps. When the cement job is properly
done, further drilling and production operations can be made without problems. (HERIOT WATT
UNIVERSITY, 2005)
Main functions of cement
Zonal isolation to avoid fluid emigration either from one formation to another or from
formation to the surface through annulus between casing and formation.
To support the casing string.
To protect the casing from the corrosive fluids in the formations.
2.2.4 WELL PROFILE
The most usual types of well profile are: Vertical well, J-type well, S-type well and Horizontal well.
The well profile is established before drilling, but due to some constrains or issues changes in the well
profile may be required.
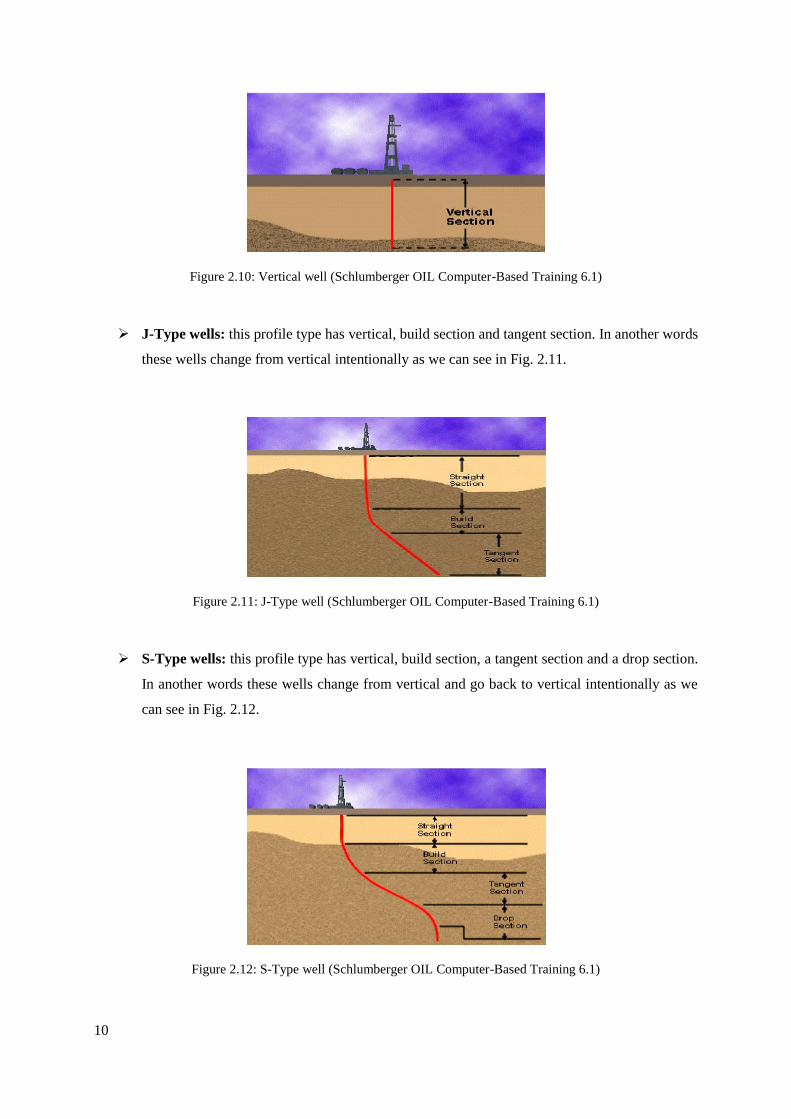
Vertical wells are wells with a minimum deviation from the vertical. Fig. 2.10 shows an
example of a vertical well.
10
Figure 2.10: Vertical well (Schlumberger OIL Computer-Based Training 6.1)
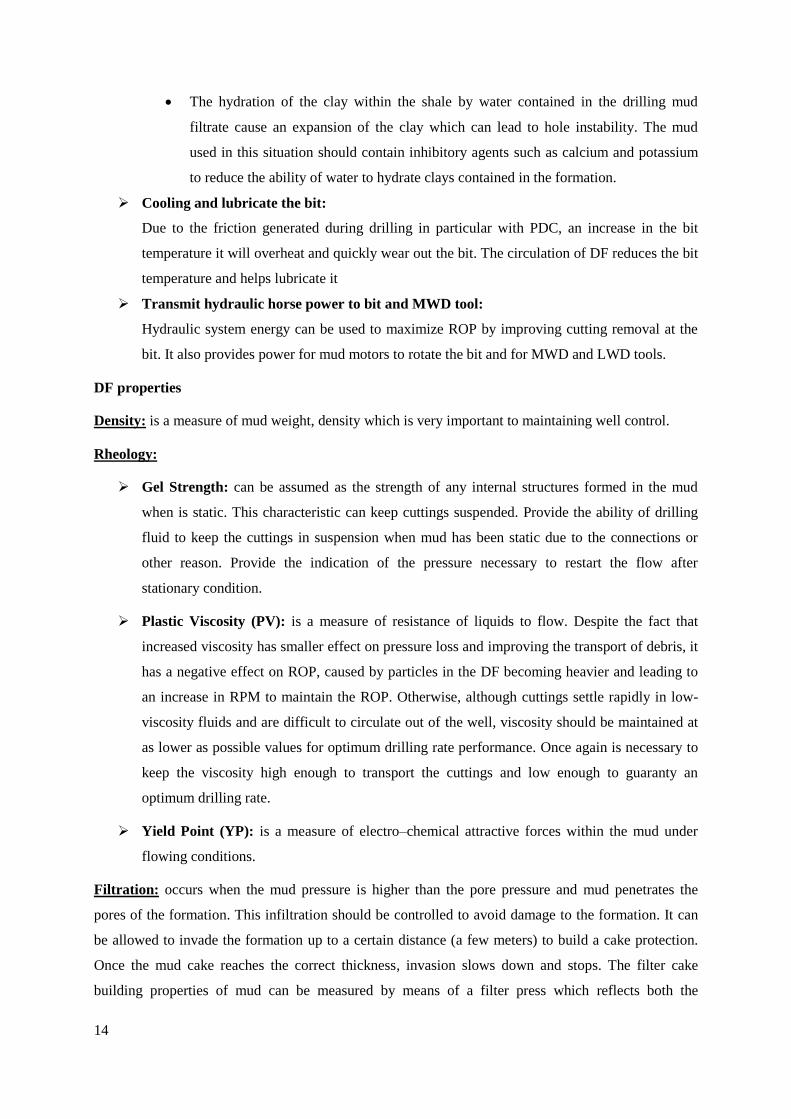
J-Type wells: this profile type has vertical, build section and tangent section. In another words
these wells change from vertical intentionally as we can see in Fig. 2.11.
Figure 2.11: J-Type well (Schlumberger OIL Computer-Based Training 6.1)
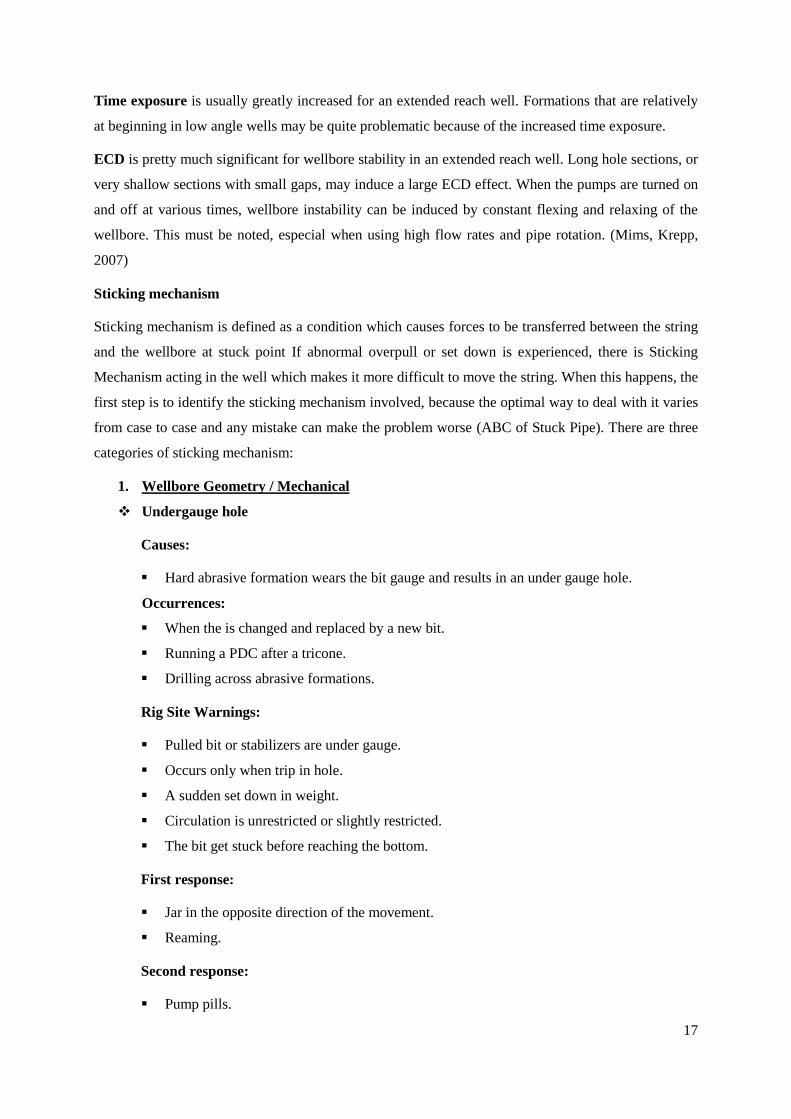
S-Type wells: this profile type has vertical, build section, a tangent section and a drop section.
In another words these wells change from vertical and go back to vertical intentionally as we
can see in Fig. 2.12.
Figure 2.12: S-Type well (Schlumberger OIL Computer-Based Training 6.1)

11
Horizontal wells: this profile type has vertical, build section, a tangent section, a second build
section and a horizontal section. In another words these wells change from vertical to
approximately to horizontal intentionally, as we can see in Fig. 2.13. Horizontal wells are
likely used in development wells
Figure 2.13: Horizontal well (Schlumberger OIL Computer-Based Training 6.1)
The following constraints can lead to changes in the well profile.
Fault, formation dip: due to geological properties and cross faults could represent challenges.
Sudden changes in formation properties, for instance in the presence of a normal fault where
the formation can change from shale to sand or vice versa, leads to changes in the drilling fluid
(DF) properties to guarantee a good wellbore stability, avoid swelling and formation invasion,
etc. A S-Type well profile is likely used to cross faults.
Horizontal wells and multi-drains for recovery: may call for drilling multiple entry points
to cut through a reservoir at a better angle and increase the drainage area. The Horizontal well
profile provides a better recovery mainly in thickness reservoirs.
Inaccessible locations: do not allow to rigging up on an interest area, so the rig should be far
away from the target. In this case, a deviated or directional well is needed. Any type of well
profile could perform this job, depending upon the well requirements.
Multiple target: may require steering the well path to include more than one target reservoir,
S-Type well profile is one of profile used to perform this task.
Relief well: may be applicable due to pressure downhole in order to avoid blowout. J-Type or
S-type well are usually used to perform this job.
Salt domes: due to slat properties (plastic and chemistry properties) is better avoid drilling
through salt domes. Differential tensions may lead to a stuck BHA. Any well profile could
perform this job.

12
Side track: in case of stuck BHA where is not possible fish the tools from downhole, or when
the formation behave (due to its properties) does not allow to drilling ahead. It basically
consists of changing the path and drilling in another direction using the same top hole. An S-
Type well profile is most appropriate in this situation.
Fig. 2.14 illustrates some of the applications of wells profiles .
Figure 2.14: Deviated well applications. (From: IFP Training 2010)
2.3 DRILLING FLUIDS (DF) SELECTION
Drilling fluid or drilling mud is one of the most important elements of drilling. The DF helps us avoid
many hazards associated with drilling. Therefore, the properties of the DF must be analyzed very
carefully to fulfil all the necessary requirements to have a good drilling performance. (HERIOT
WATT UNIVERSITY, 2005). Follow are described the mains purpose of drilling fluid.
Purposes of DF
To remove and suspend cuttings:
It is the primary function of DF to ensure drilling efficiency. As we know rock cuttings
generated by the drill bit must be removed from the wellbore as much as possible. If these
cuttings are removed properly the drillstring will become stuck in the wellbore, leading to
NPT. Rheological properties have a significant effect on hole cleaning.
To prevent formation fluids flowing into the wellbore:
When drilling a new formation, the first barrier for the protection of the influx is the mud. The
hydrostatic pressure exerted by a DF column should be controlled so that it does not not
exceed formation fracture pressure while at the same time being high enough to prevent the

13
influx coming from the formation. In many cases increase DF weight along with some
additives (such as barite) due to the lost weight while mud passes through the shakers (lost
solids in shakers because of mesh size and friction during transportation) and to overbalance
the formation pressure.
Equation 2.1: Hydrostatic pressure. (From: Heriot-Watt University 2005)
Maintain wellbore stability:
Shale instability is one of the most common problems in drillings operations. Maintain
wellbore stability requires a balance between mechanical and chemical factors. These two
factors should combine to provide a stable wellbore until running casing and finish cement
job. Shale instability may be caused by:
Differential Pressure between the bottom hole pressure in the borehole and pore
pressure in the shales. Figure 2.15 shows the drilling fluid density window
(mechanical factor).
Figure 2.15: Drilling Fluid Density window and formation pressure.
14
The hydration of the clay within the shale by water contained in the drilling mud
filtrate cause an expansion of the clay which can lead to hole instability. The mud
used in this situation should contain inhibitory agents such as calcium and potassium
to reduce the ability of water to hydrate clays contained in the formation.
Cooling and lubricate the bit:
Due to the friction generated during drilling in particular with PDC, an increase in the bit
temperature it will overheat and quickly wear out the bit. The circulation of DF reduces the bit
temperature and helps lubricate it
Transmit hydraulic horse power to bit and MWD tool:
Hydraulic system energy can be used to maximize ROP by improving cutting removal at the
bit. It also provides power for mud motors to rotate the bit and for MWD and LWD tools.
DF properties
Density: is a measure of mud weight, density which is very important to maintaining well control.
Rheology:
Gel Strength: can be assumed as the strength of any internal structures formed in the mud
when is static. This characteristic can keep cuttings suspended. Provide the ability of drilling
fluid to keep the cuttings in suspension when mud has been static due to the connections or
other reason. Provide the indication of the pressure necessary to restart the flow after
stationary condition.
Plastic Viscosity (PV): is a measure of resistance of liquids to flow. Despite the fact that
increased viscosity has smaller effect on pressure loss and improving the transport of debris, it
has a negative effect on ROP, caused by particles in the DF becoming heavier and leading to
an increase in RPM to maintain the ROP. Otherwise, although cuttings settle rapidly in low-
viscosity fluids and are difficult to circulate out of the well, viscosity should be maintained at
as lower as possible values for optimum drilling rate performance. Once again is necessary to
keep the viscosity high enough to transport the cuttings and low enough to guaranty an
optimum drilling rate.
Yield Point (YP): is a measure of electro–chemical attractive forces within the mud under
flowing conditions.
Filtration: occurs when the mud pressure is higher than the pore pressure and mud penetrates the
pores of the formation. This infiltration should be controlled to avoid damage to the formation. It can
be allowed to invade the formation up to a certain distance (a few meters) to build a cake protection.
Once the mud cake reaches the correct thickness, invasion slows down and stops. The filter cake
building properties of mud can be measured by means of a filter press which reflects both the

15
efficiency with which the solids in the mud are creating an impermeable filter cake and the efficiency
thickness of the filter cake that will be created in the wellbore. In Fig. 2.16 we can see how mud cake
is built.
Figure 2.16: Mud filtrate. (IFP training 2010)
Sand Content: is the proportion of sand in the mud. This proportion should not be high in order to
avoid mud pump damage, increase ECD and change mud density while drilling. Table 2.1 describes
resumed the mud function and physical nda chemical properties.
Table 2.1: Function and Physical Properties of Drilling Fluid (HERIOT WATT UNIVERSITY, 2005)
Function Physical/Chemical property
Transport cuttings from wellbore YP, apparent viscosity, velocity, gel strength
Prevent formation fluid flowing into the
wellbore
Density
Maintain wellbore stability Density, reactive with clay
Cool and lubricate the bit Density, velocity
Transmit hydraulic horsepower to bit Velocity, density and viscosity
Main types of DF
Water Based Mud (WBM): is a type of drilling fluid used when the continuous phase of the system
is water (salt water or fresh). It consists of a mixture of solids, liquids and chemicals. Some solids

16
(clays), known as active solids react with the water and the chemicals in the mud. Those which do not
react within the mud are called inactive or inert solids (barite). The system can be based on sea water.
Advantages
• In offshore applications, there is an abundance of seawater supply.
• It is economical and environment friendly.
Disadvantage
• The water in this mud can create instability (caused largely by the hydration of clay mud
containing water).
Oil Base Mud (OBM): consists of a composite of WBM, but the continuous phase is oil instead of
water. In an invert oil emulsion (a mix of water with the oil in the continuous phase), mud water may
increase to a large percentage of the volume, but oil is still in continuous phase. OBM does not contain
free water which can react with clays in shale.
Advantages
• Provides excellent wellbore stability.
• Less formation risk damage than WBM.
Disadvantages
• More expensive and require more careful handling than WBM.
• Drilled cuttings contaminated by OBM can have lasting environment impact.
2.4 WELLBORE STABILITY ISSUE
Wellbore stability is critical when drilling the horizontal phase, and is critical to all assumptions of
feasibility and performance on an extended reach well. Hole cleaning is significantly affected by
intervals of hole enlargement or swelling.
Hole angle is one of the main reasons for wellbore stability. Generally, as the inclination increases,
drilling fluid weight does not need to vary greatly because in many cases we are crossing the same
formation. Otherwise, high angles result in longer intervals of troublesome formations being open,
which can lead to an increase of problems related to hole stability.
Tectonic stress must be understood and managed appropriately. For a deviated well, when horizontal
stresses exceed vertical stresses, it is actually safer to drill in high inclination than on the vertical.
Therefore, a minimum drilling fluid weight for stability is required when drilling, relative to the
horizontal stress orientation.
17
Time exposure is usually greatly increased for an extended reach well. Formations that are relatively
at beginning in low angle wells may be quite problematic because of the increased time exposure.
ECD is pretty much significant for wellbore stability in an extended reach well. Long hole sections, or
very shallow sections with small gaps, may induce a large ECD effect. When the pumps are turned on
and off at various times, wellbore instability can be induced by constant flexing and relaxing of the
wellbore. This must be noted, especial when using high flow rates and pipe rotation. (Mims, Krepp,
2007)
Sticking mechanism
Sticking mechanism is defined as a condition which causes forces to be transferred between the string
and the wellbore at stuck point If abnormal overpull or set down is experienced, there is Sticking
Mechanism acting in the well which makes it more difficult to move the string. When this happens, the
first step is to identify the sticking mechanism involved, because the optimal way to deal with it varies
from case to case and any mistake can make the problem worse (ABC of Stuck Pipe). There are three
categories of sticking mechanism:
1. Wellbore Geometry / Mechanical
Undergauge hole
Causes:
Hard abrasive formation wears the bit gauge and results in an under gauge hole.
Occurrences:
When the is changed and replaced by a new bit.
Running a PDC after a tricone.
Drilling across abrasive formations.
Rig Site Warnings:
Pulled bit or stabilizers are under gauge.
Occurs only when trip in hole.
A sudden set down in weight.
Circulation is unrestricted or slightly restricted.
The bit get stuck before reaching the bottom.
First response:
Jar in the opposite direction of the movement.
Reaming.
Second response:
Pump pills.
18
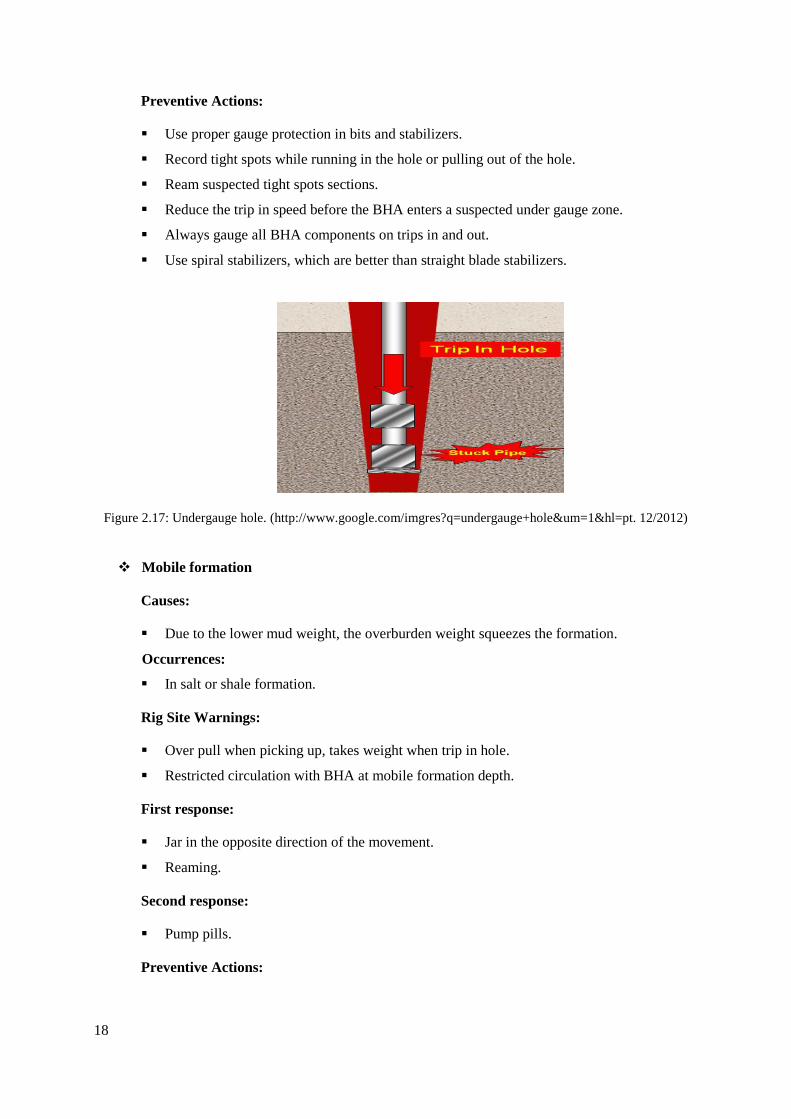
Preventive Actions:
Use proper gauge protection in bits and stabilizers.
Record tight spots while running in the hole or pulling out of the hole.
Ream suspected tight spots sections.
Reduce the trip in speed before the BHA enters a suspected under gauge zone.
Always gauge all BHA components on trips in and out.
Use spiral stabilizers, which are better than straight blade stabilizers.
Figure 2.17: Undergauge hole. (http://www.google.com/imgres?q=undergauge+hole&um=1&hl=pt. 12/2012)
Mobile formation
Causes:
Due to the lower mud weight, the overburden weight squeezes the formation.
Occurrences:
In salt or shale formation.
Rig Site Warnings:
Over pull when picking up, takes weight when trip in hole.
Restricted circulation with BHA at mobile formation depth.
First response:
Jar in the opposite direction of the movement.
Reaming.
Second response:
Pump pills.
Preventive Actions:

19
Maintain sufficient mud weight. Select carefully a mud system that will not aggravate the
mobile formation.
In order to prevent mobile salt formation washout, consider using a slightly under-
saturated mud system.
Plan regular reaming/wiper trips particularly for this section of the hole.
Minimize as much as possible the open hole exposure time of these formations.
Reduce trip speed before BHA enters the suspected area.
Figure 2.18: Mobile formation. (http://www.drillingformulas.com/mobile-formation-causes-stuck-pipe 09/2012)
Ledges and doglegs
Causes:
Ledges at interface of hard/soft formations.
Occurrences:
Hard/soft interbedded layers.
Faulted/fractured formations.
Frequent angle/direction changes.
Rig Site Warnings:
Sudden erratic over pull or set down.
Issues are at recurring fixed depths.
Issue does not disappear with circulation below the problem area.
Full circulation is possible.
First response:
Jar in the opposite direction of the movement.
Reaming.
20
Second response:
Pump pills.
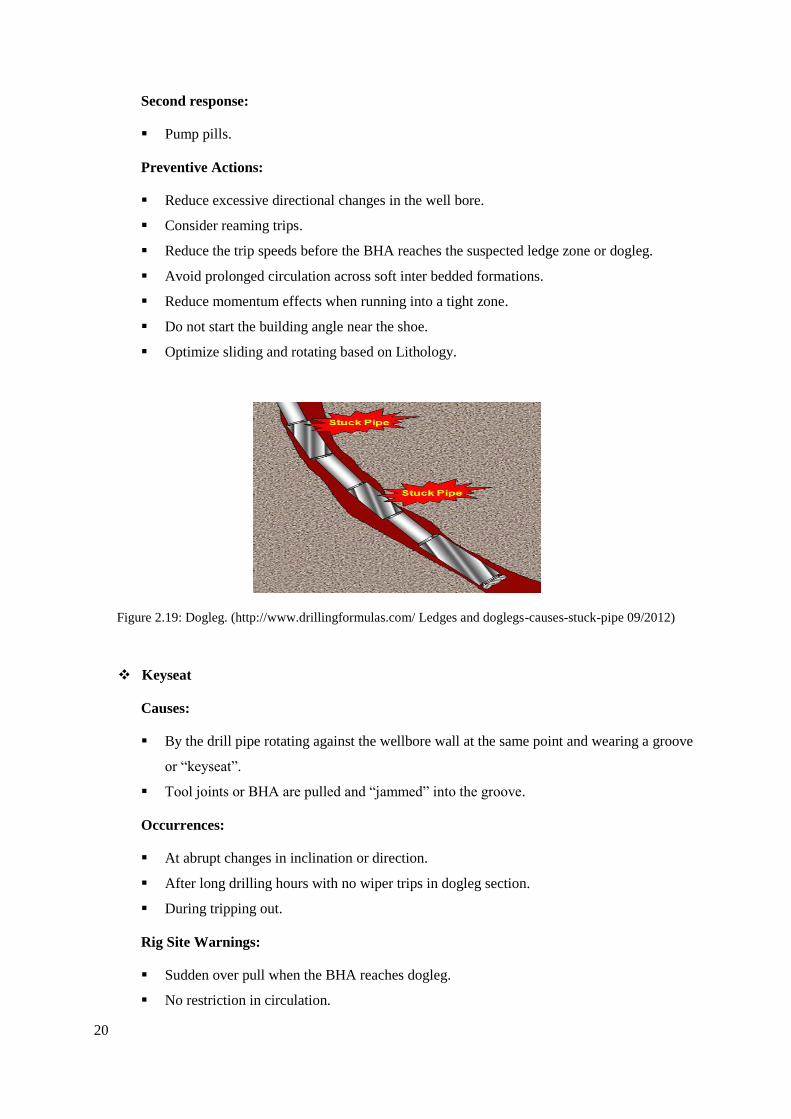
Preventive Actions:
Reduce excessive directional changes in the well bore.
Consider reaming trips.
Reduce the trip speeds before the BHA reaches the suspected ledge zone or dogleg.
Avoid prolonged circulation across soft inter bedded formations.
Reduce momentum effects when running into a tight zone.
Do not start the building angle near the shoe.
Optimize sliding and rotating based on Lithology.
Figure 2.19: Dogleg. (http://www.drillingformulas.com/ Ledges and doglegs-causes-stuck-pipe 09/2012)
Keyseat
Causes:
By the drill pipe rotating against the wellbore wall at the same point and wearing a groove
or “keyseat”.
Tool joints or BHA are pulled and “jammed” into the groove.
Occurrences:
At abrupt changes in inclination or direction.
After long drilling hours with no wiper trips in dogleg section.
During tripping out.
Rig Site Warnings:
Sudden over pull when the BHA reaches dogleg.
No restriction in circulation.
21
Free string movement below key seat depth possible if not, already stuck in key seat.
Cyclic over pull at tool joints when trip in or out.
First response:
Jar in the opposite direction of the movement.
Reaming.
Second response:
Pump pills.
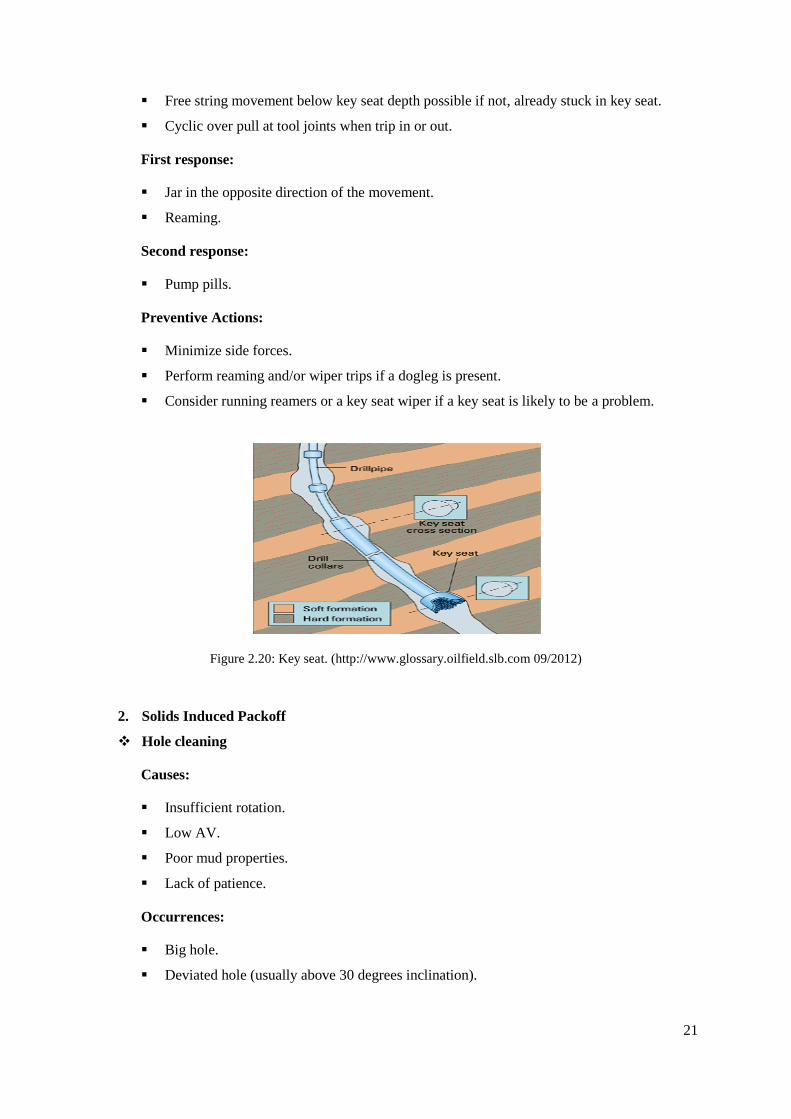
Preventive Actions:
Minimize side forces.
Perform reaming and/or wiper trips if a dogleg is present.
Consider running reamers or a key seat wiper if a key seat is likely to be a problem.
Figure 2.20: Key seat. (http://www.glossary.oilfield.slb.com 09/2012)
2. Solids Induced Packoff
Hole cleaning
Causes:
Insufficient rotation.
Low AV.
Poor mud properties.
Lack of patience.
Occurrences:
Big hole.
Deviated hole (usually above 30 degrees inclination).
22
Rig Site warnings:
Low Angle Hole
Overpull after connections.
Increased Stand Pipe Pressure (SPP) / ECD.
High Angle Hole
Sudden increase in drag (high PUW readings)
Tight hole on trips (if tight spot moves up after circulation).
First response:
Circulation
Second response:
Jar in opposite direction of the movement.
Preventive action:
Low Angle Hole
Maximize Annular Velocity (AV)
Increase low-end rheology
Pump Sweep.
Match ROP to hole cleaning rate
High Angle Hole
Maximize RPM
Circulate a long time prior to tripping
Match ROP to hole cleaning rate
Maximize AV
Optimize low-end mud rheology

23
Figure 2.21: Hole Cleaning Induced Packoff (K&M Technology Group-2010)
Unconsolidated formation
Causes:
No bonding between particles.
Little or no filter cake.
Not enough hydrostatic pressure to support the formation.
Sand/Gravel falls into the hole.
Occurrences:
While drilling top hole sections.
While drilling shallow formations (sands).
Rig Site Warnings:
Increasing pump pressure.
Increasing Torque and Drag.
Overpull on connections.
Fill on bottom.
Shakers blinding.
First response:
Jar in the opposite direction of the movement.
Reaming.
Second response:
Pump pills.
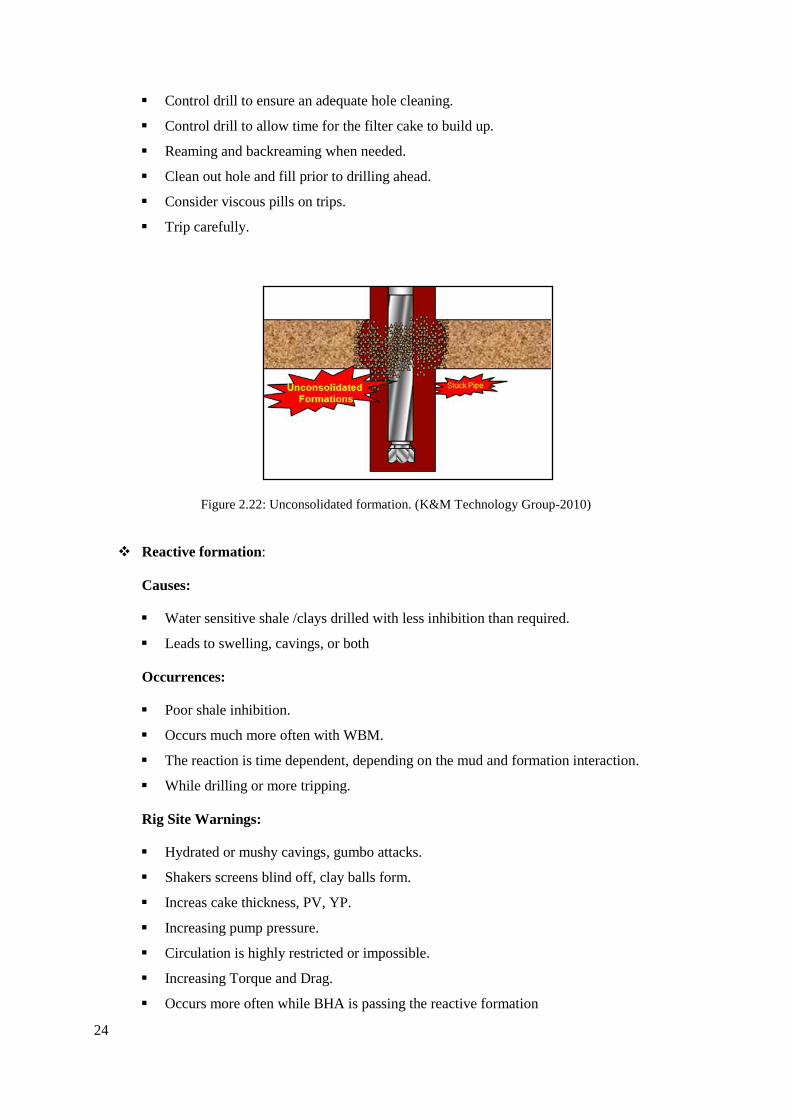
Preventive Actions:
Design the mud to build a low permeable cake.
Keep adequate hole cleaning (flowrate and viscosity).
24
Control drill to ensure an adequate hole cleaning.
Control drill to allow time for the filter cake to build up.
Reaming and backreaming when needed.
Clean out hole and fill prior to drilling ahead.
Consider viscous pills on trips.
Trip carefully.
Figure 2.22: Unconsolidated formation. (K&M Technology Group-2010)
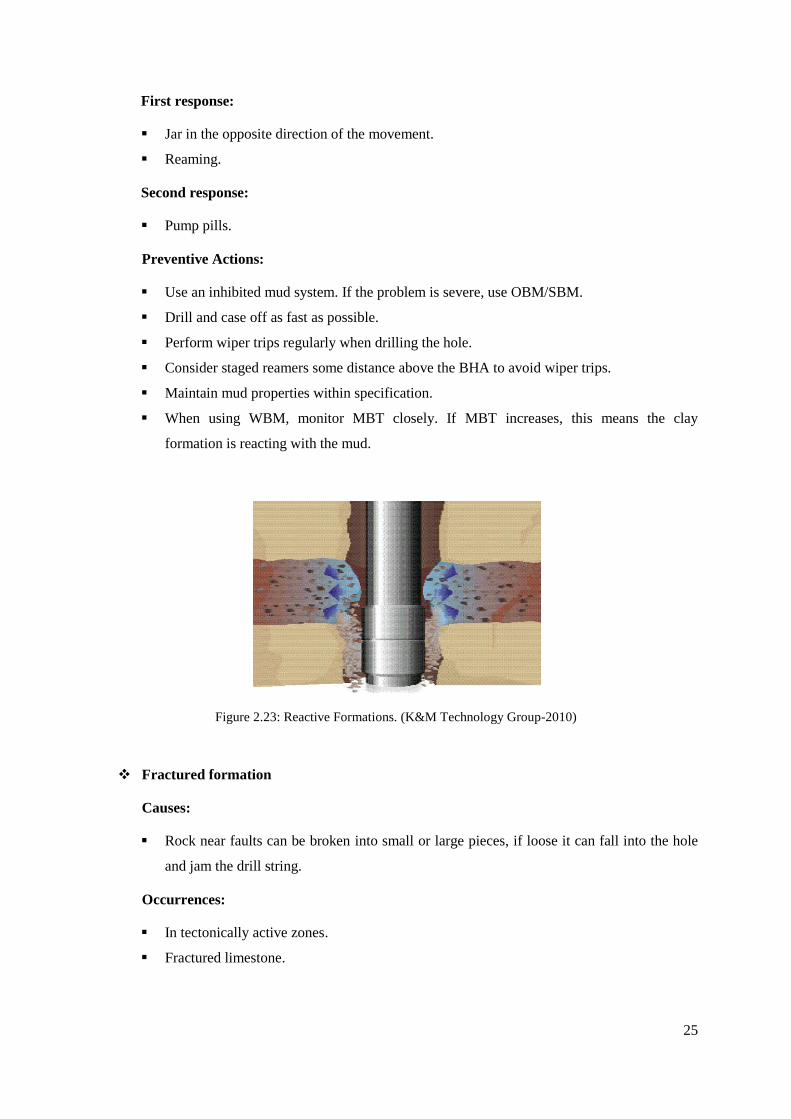
Reactive formation:
Causes:
Water sensitive shale /clays drilled with less inhibition than required.
Leads to swelling, cavings, or both
Occurrences:
Poor shale inhibition.
Occurs much more often with WBM.
The reaction is time dependent, depending on the mud and formation interaction.
While drilling or more tripping.
Rig Site Warnings:
Hydrated or mushy cavings, gumbo attacks.
Shakers screens blind off, clay balls form.
Increas cake thickness, PV, YP.
Increasing pump pressure.
Circulation is highly restricted or impossible.
Increasing Torque and Drag.
Occurs more often while BHA is passing the reactive formation
25
First response:
Jar in the opposite direction of the movement.
Reaming.
Second response:
Pump pills.
Preventive Actions:
Use an inhibited mud system. If the problem is severe, use OBM/SBM.
Drill and case off as fast as possible.
Perform wiper trips regularly when drilling the hole.
Consider staged reamers some distance above the BHA to avoid wiper trips.
Maintain mud properties within specification.
When using WBM, monitor MBT closely. If MBT increases, this means the clay
formation is reacting with the mud.
Figure 2.23: Reactive Formations. (K&M Technology Group-2010)
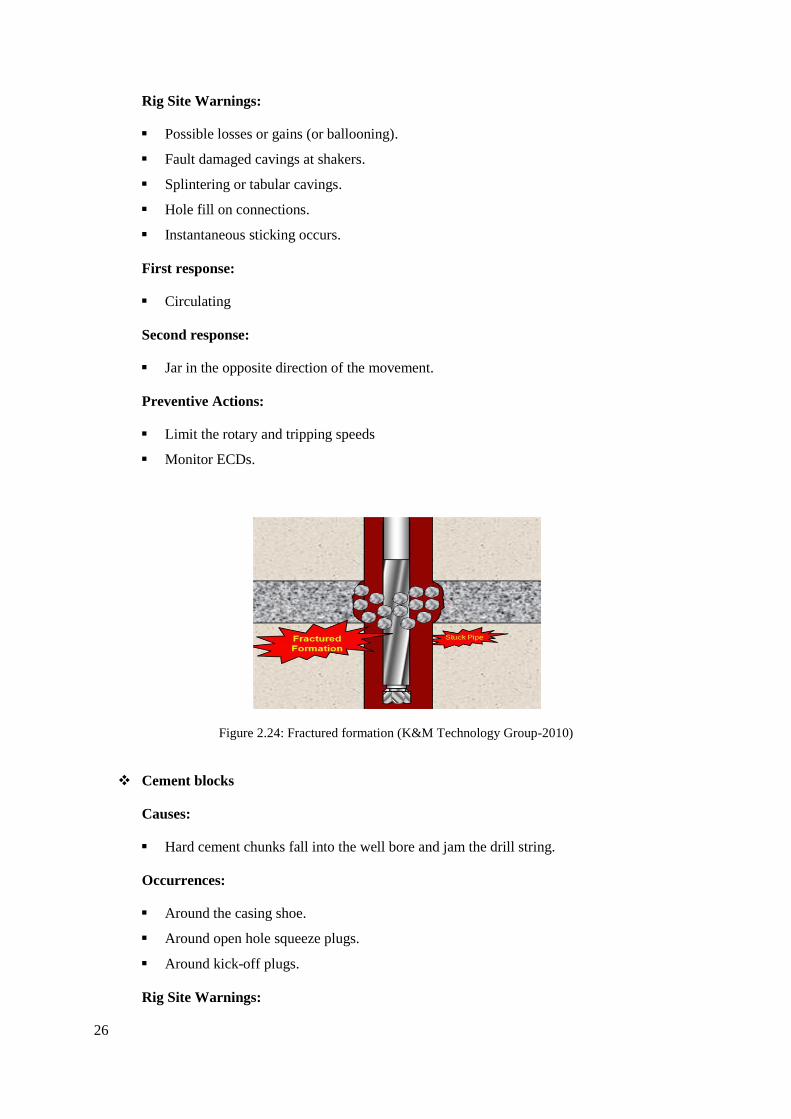
Fractured formation
Causes:
Rock near faults can be broken into small or large pieces, if loose it can fall into the hole
and jam the drill string.
Occurrences:
In tectonically active zones.
Fractured limestone.
26
Rig Site Warnings:
Possible losses or gains (or ballooning).
Fault damaged cavings at shakers.
Splintering or tabular cavings.
Hole fill on connections.
Instantaneous sticking occurs.
First response:
Circulating
Second response:
Jar in the opposite direction of the movement.
Preventive Actions:
Limit the rotary and tripping speeds
Monitor ECDs.
Figure 2.24: Fractured formation (K&M Technology Group-2010)
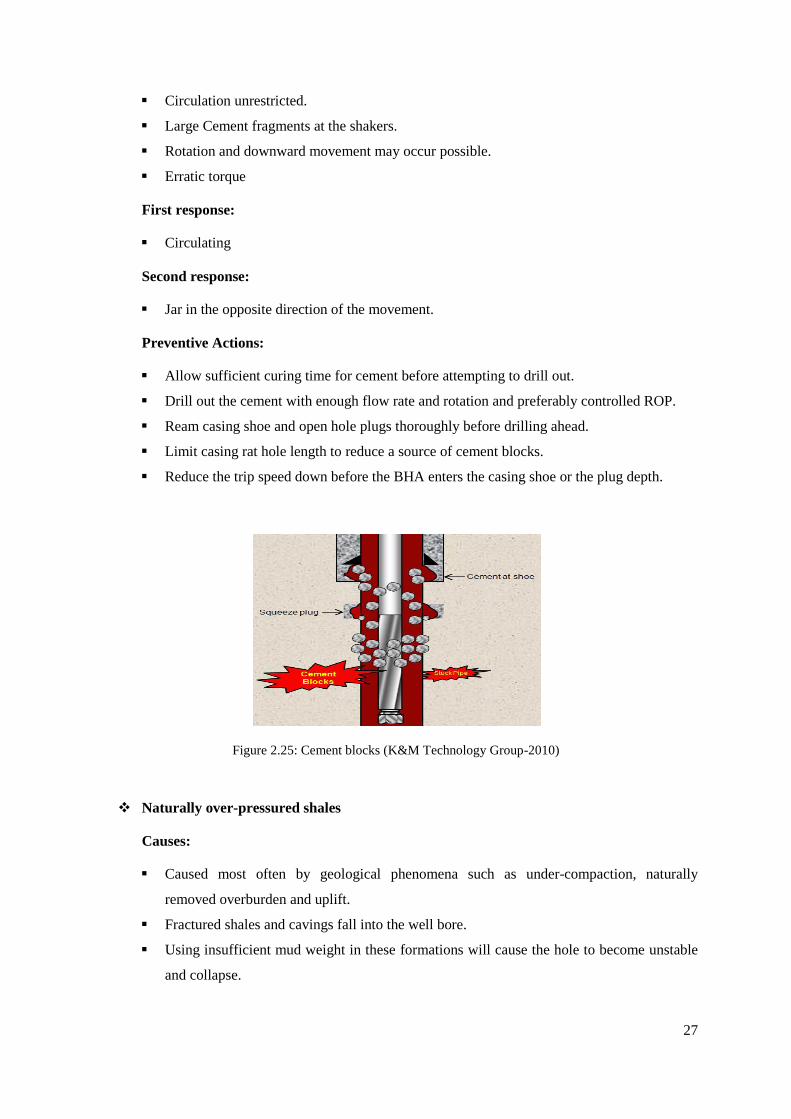
Cement blocks
Causes:
Hard cement chunks fall into the well bore and jam the drill string.
Occurrences:
Around the casing shoe.
Around open hole squeeze plugs.
Around kick-off plugs.
Rig Site Warnings:
27
Circulation unrestricted.
Large Cement fragments at the shakers.
Rotation and downward movement may occur possible.
Erratic torque
First response:
Circulating
Second response:
Jar in the opposite direction of the movement.
Preventive Actions:
Allow sufficient curing time for cement before attempting to drill out.
Drill out the cement with enough flow rate and rotation and preferably controlled ROP.
Ream casing shoe and open hole plugs thoroughly before drilling ahead.
Limit casing rat hole length to reduce a source of cement blocks.
Reduce the trip speed down before the BHA enters the casing shoe or the plug depth.
Figure 2.25: Cement blocks (K&M Technology Group-2010)
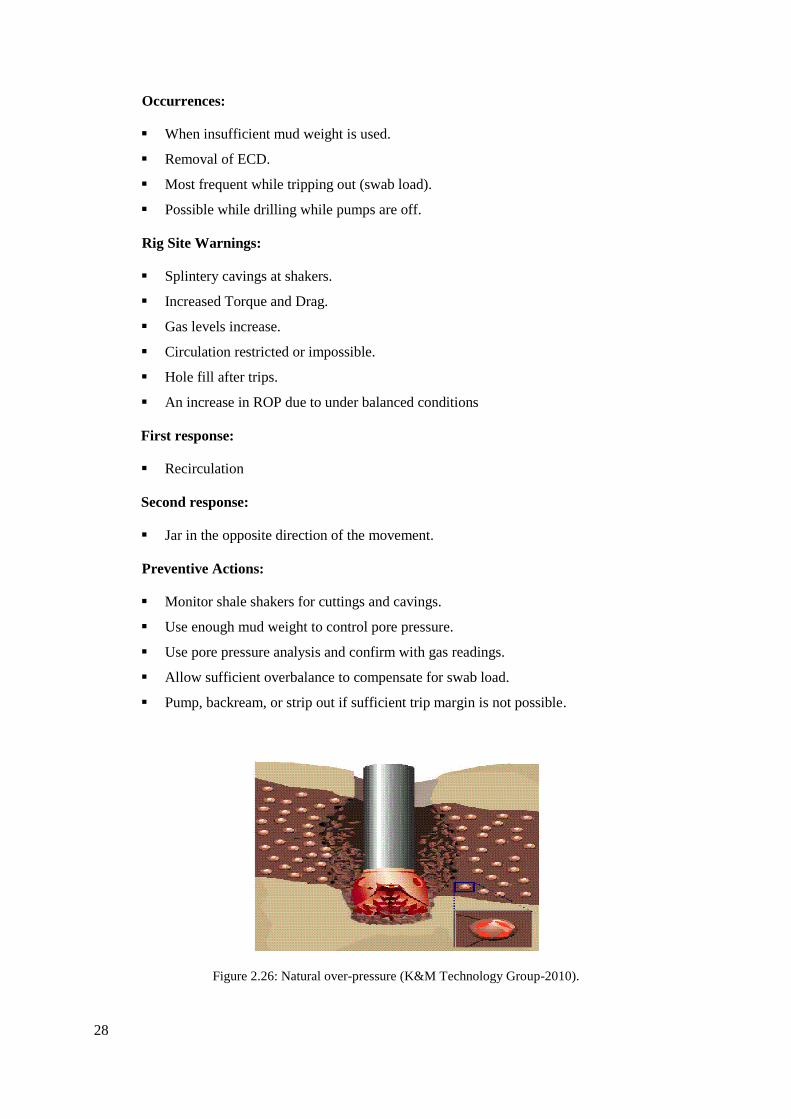
Naturally over-pressured shales
Causes:
Caused most often by geological phenomena such as under-compaction, naturally
removed overburden and uplift.
Fractured shales and cavings fall into the well bore.
Using insufficient mud weight in these formations will cause the hole to become unstable
and collapse.
28
Occurrences:
When insufficient mud weight is used.
Removal of ECD.
Most frequent while tripping out (swab load).
Possible while drilling while pumps are off.
Rig Site Warnings:
Splintery cavings at shakers.
Increased Torque and Drag.
Gas levels increase.
Circulation restricted or impossible.
Hole fill after trips.
An increase in ROP due to under balanced conditions
First response:
Recirculation
Second response:
Jar in the opposite direction of the movement.
Preventive Actions:
Monitor shale shakers for cuttings and cavings.
Use enough mud weight to control pore pressure.
Use pore pressure analysis and confirm with gas readings.
Allow sufficient overbalance to compensate for swab load.
Pump, backream, or strip out if sufficient trip margin is not possible.
Figure 2.26: Natural over-pressure (K&M Technology Group-2010).

29
Induced over-pressured
Causes:
Shale pore pressure becomes “super charged”by hydrostatic or ECD overbalance.
Shale cracks and falls into the wellbore.
Occurrences:
After a decreasing in MW or a long exposure time with constant MW.
In high ECD environments.
It is likely to occur in any type of mud.
While drilling or tripping (surge).
Rig Site Warnings:
Cavings (splintery) at shakers.
Cuttings / cavings show no sign of hydration.
Ballooning effect.
Increasing Torque and Drag.
Circulating restricted or impossible.
Hole fill.
Tight hole in casing rat hole.
First response:
Recirculation.
Second response:
Jar in the opposite direction of the movement.
Preventive Actions:
Control ECD properly to minimize ballooning and inducing over pressure to sensitive
formations.
Good hole cleaning practices are required if cavings occur.

30
Figure 2.27: Induced over-pressure (K&M Technology Group-2010)
Tectonically stressed formations
Causes:
Natural lateral stresses are present due to the movement of the earth’s crust.
Shale fractures and falls into the wellbore.
Occurrences:
In reverse or strike-slip stressed locations.
In mountainous locations.
During drilling or tripping (due to swab load).
Rig Site Warnings:
Increase in Torque and Drag.
Increase in Pump Pressure / ECD.
Fill on bottom.
Cavings at shakers.
LWD indicators.
First response:
Recirculation
Second response:
Jar in the opposite direction of the movement.
Preventive Actions:
Use geomechanical analysis and/or offset data to establish optimum inclination and
azimuth.

31
Well design is required to accommodate the correct mud weight (wellpath, casing points,
ECD management).
Keep mud weight and ECD (including swab load) within correct mud weight window.
Keep the hole clean and be prepared for increased amount of cuttings and cavings.
Figure 2.28: Tectonically stressed formations (K&M Technology Group-2010)
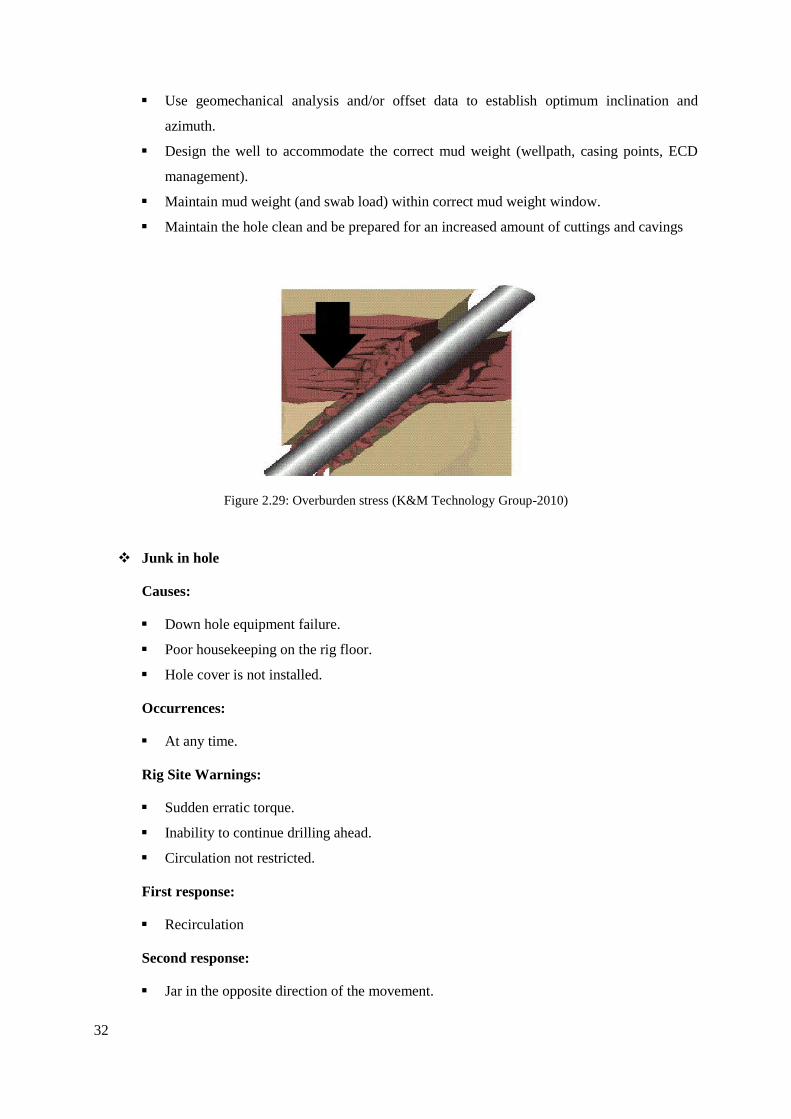
Overburden stress
Causes:
The overburden or vertical stress, σV, is usually a principal stress. MW is not enough to
support the overburden and is not adjusted as the hole angle increases.
Occurrences:
Mainly in deviated wells.
Rig Site Warnings:
Angular cavings at the shakers.
Increase in Torque and Drag.
Increase in Pump Pressure / ECD.
Fill on bottom.
LWD indicators.
First response:
Recirculation
Second response:
Jar in the opposite direction of the movement.
Preventive Actions:
32
Use geomechanical analysis and/or offset data to establish optimum inclination and
azimuth.
Design the well to accommodate the correct mud weight (wellpath, casing points, ECD
management).
Maintain mud weight (and swab load) within correct mud weight window.
Maintain the hole clean and be prepared for an increased amount of cuttings and cavings
Figure 2.29: Overburden stress (K&M Technology Group-2010)
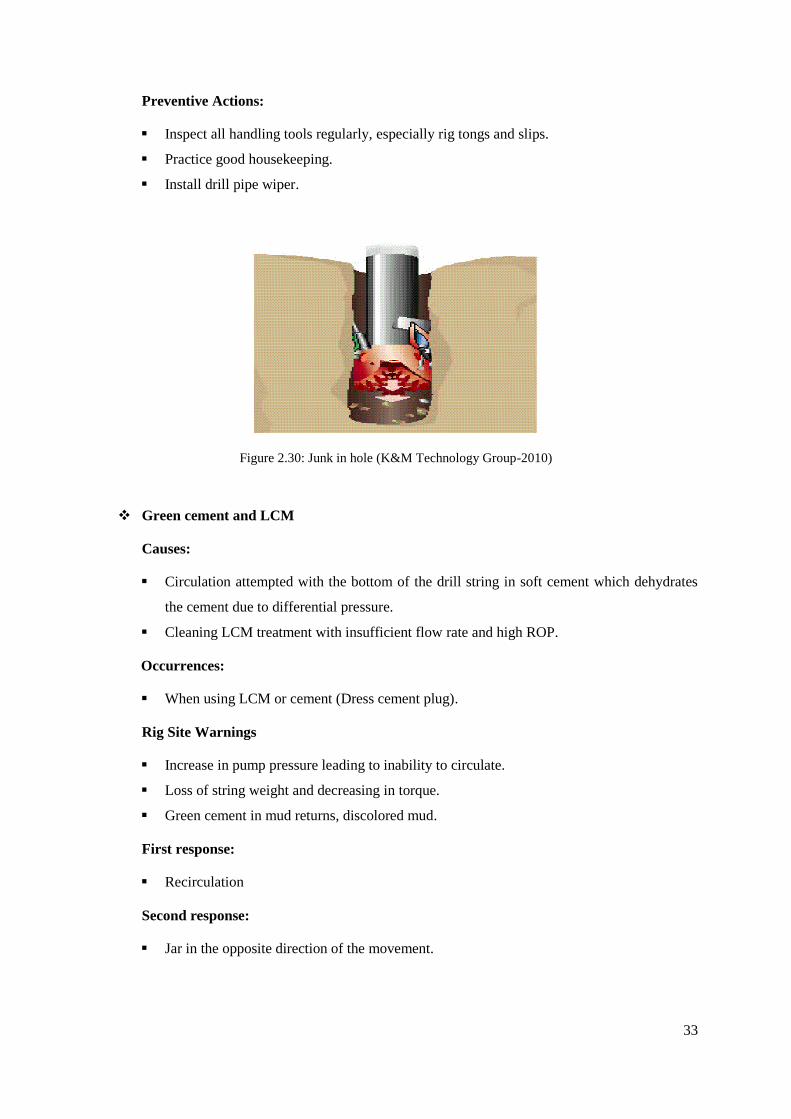
Junk in hole
Causes:
Down hole equipment failure.
Poor housekeeping on the rig floor.
Hole cover is not installed.
Occurrences:
At any time.
Rig Site Warnings:
Sudden erratic torque.
Inability to continue drilling ahead.
Circulation not restricted.
First response:
Recirculation
Second response:
Jar in the opposite direction of the movement.
33
Preventive Actions:
Inspect all handling tools regularly, especially rig tongs and slips.
Practice good housekeeping.
Install drill pipe wiper.
Figure 2.30: Junk in hole (K&M Technology Group-2010)
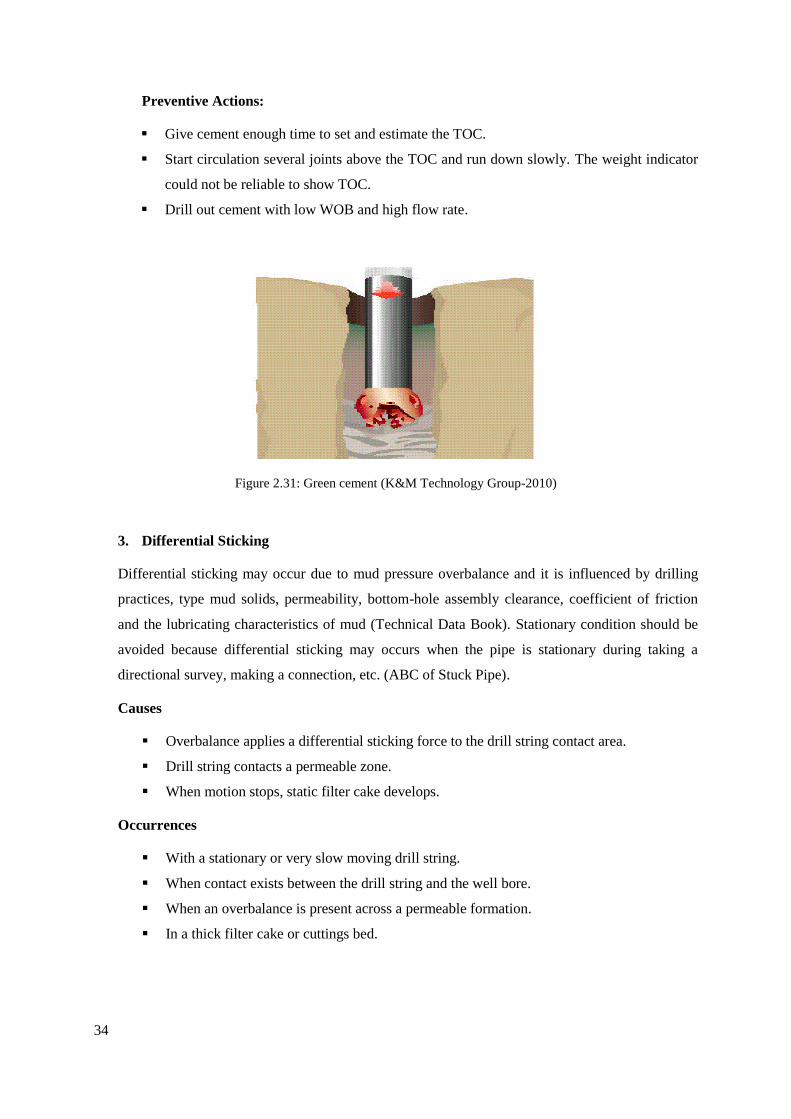
Green cement and LCM
Causes:
Circulation attempted with the bottom of the drill string in soft cement which dehydrates
the cement due to differential pressure.
Cleaning LCM treatment with insufficient flow rate and high ROP.
Occurrences:
When using LCM or cement (Dress cement plug).
Rig Site Warnings
Increase in pump pressure leading to inability to circulate.
Loss of string weight and decreasing in torque.
Green cement in mud returns, discolored mud.
First response:
Recirculation
Second response:
Jar in the opposite direction of the movement.
34
Preventive Actions:
Give cement enough time to set and estimate the TOC.
Start circulation several joints above the TOC and run down slowly. The weight indicator
could not be reliable to show TOC.
Drill out cement with low WOB and high flow rate.
Figure 2.31: Green cement (K&M Technology Group-2010)
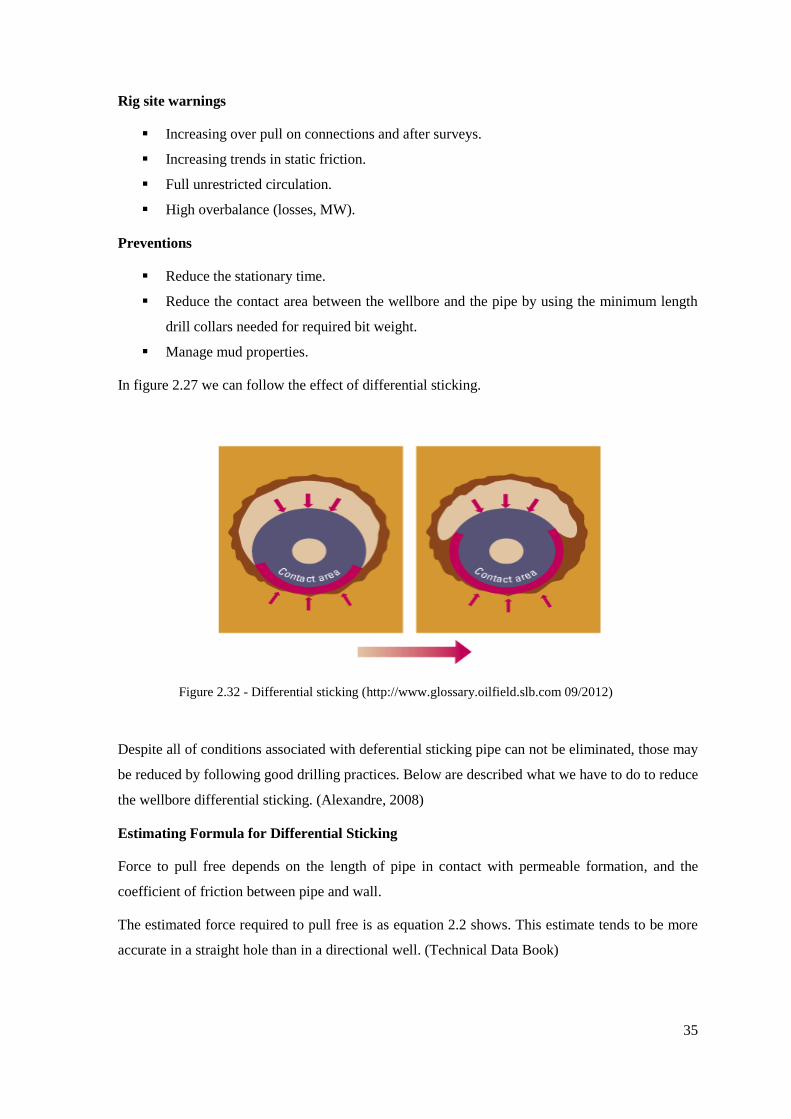
3. Differential Sticking
Differential sticking may occur due to mud pressure overbalance and it is influenced by drilling
practices, type mud solids, permeability, bottom-hole assembly clearance, coefficient of friction
and the lubricating characteristics of mud (Technical Data Book). Stationary condition should be
avoided because differential sticking may occurs when the pipe is stationary during taking a
directional survey, making a connection, etc. (ABC of Stuck Pipe).
Causes
Overbalance applies a differential sticking force to the drill string contact area.
Drill string contacts a permeable zone.
When motion stops, static filter cake develops.
Occurrences
With a stationary or very slow moving drill string.
When contact exists between the drill string and the well bore.
When an overbalance is present across a permeable formation.
In a thick filter cake or cuttings bed.
35
Rig site warnings
Increasing over pull on connections and after surveys.
Increasing trends in static friction.
Full unrestricted circulation.
High overbalance (losses, MW).
Preventions
Reduce the stationary time.
Reduce the contact area between the wellbore and the pipe by using the minimum length
drill collars needed for required bit weight.
Manage mud properties.
In figure 2.27 we can follow the effect of differential sticking.
Figure 2.32 - Differential sticking (http://www.glossary.oilfield.slb.com 09/2012)
Despite all of conditions associated with deferential sticking pipe can not be eliminated, those may
be reduced by following good drilling practices. Below are described what we have to do to reduce
the wellbore differential sticking. (Alexandre, 2008)
Estimating Formula for Differential Sticking
Force to pull free depends on the length of pipe in contact with permeable formation, and the
coefficient of friction between pipe and wall.
The estimated force required to pull free is as equation 2.2 shows. This estimate tends to be more
accurate in a straight hole than in a directional well. (Technical Data Book)

36
K = Sticking coefficient (0.2 water base mud)
(ΔP) = Differential pressure
Area = Contact area
Area = L (12in/ft) (πd/3)
(assume ⅓ of the drill collar circumference is buried)
Circumference = π x Diameter
Equation 2.2 - Formula for F differential Sticking. (From: Technical Data Book)
37
3. FUNDAMENTALS OF HOLE CLEANING
Hole cleaning is one of the biggest challenges in high deviated drilling wells. Despite all recent
improvements in technologies and procedure we cannot know what is really happening in the
downhole yet, even though efforts have been made to understand what is happening relative to cuttings
and borehole condition when drilling, tripping and running the casing.
3.1 CUTTINGS BEHAVIOR IN DOWNHOLE
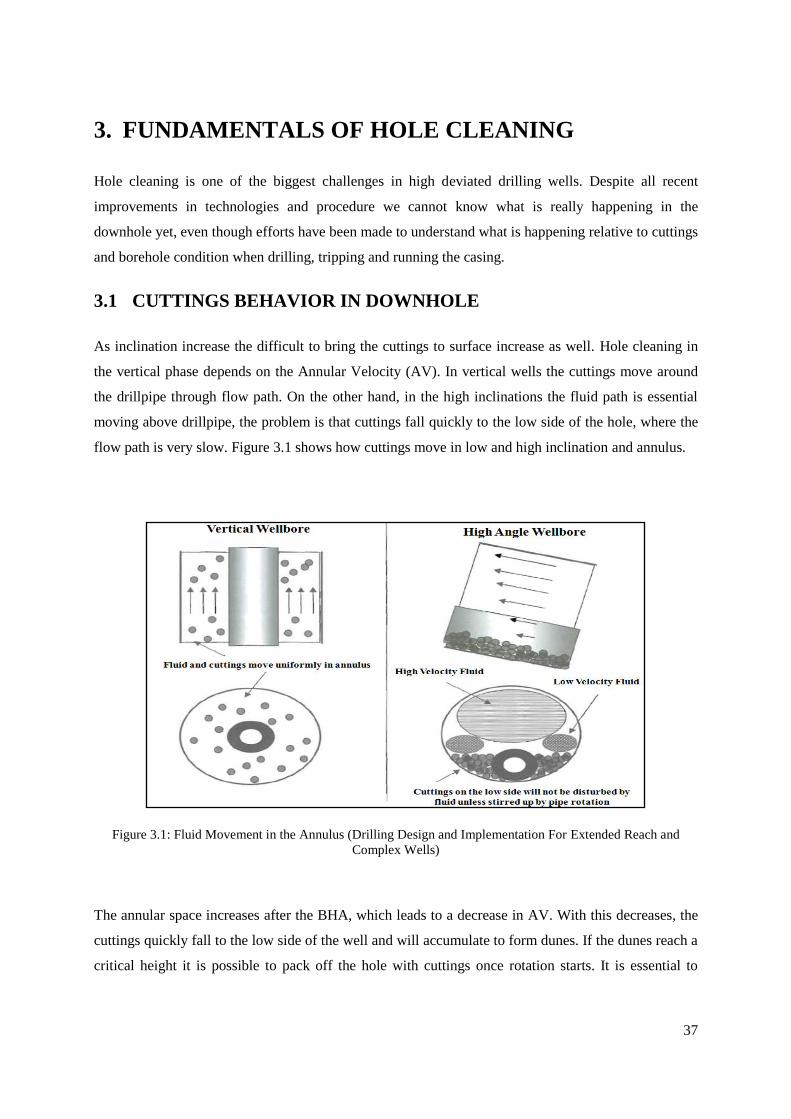
As inclination increase the difficult to bring the cuttings to surface increase as well. Hole cleaning in
the vertical phase depends on the Annular Velocity (AV). In vertical wells the cuttings move around
the drillpipe through flow path. On the other hand, in the high inclinations the fluid path is essential
moving above drillpipe, the problem is that cuttings fall quickly to the low side of the hole, where the
flow path is very slow. Figure 3.1 shows how cuttings move in low and high inclination and annulus.
Figure 3.1: Fluid Movement in the Annulus (Drilling Design and Implementation For Extended Reach and
Complex Wells)
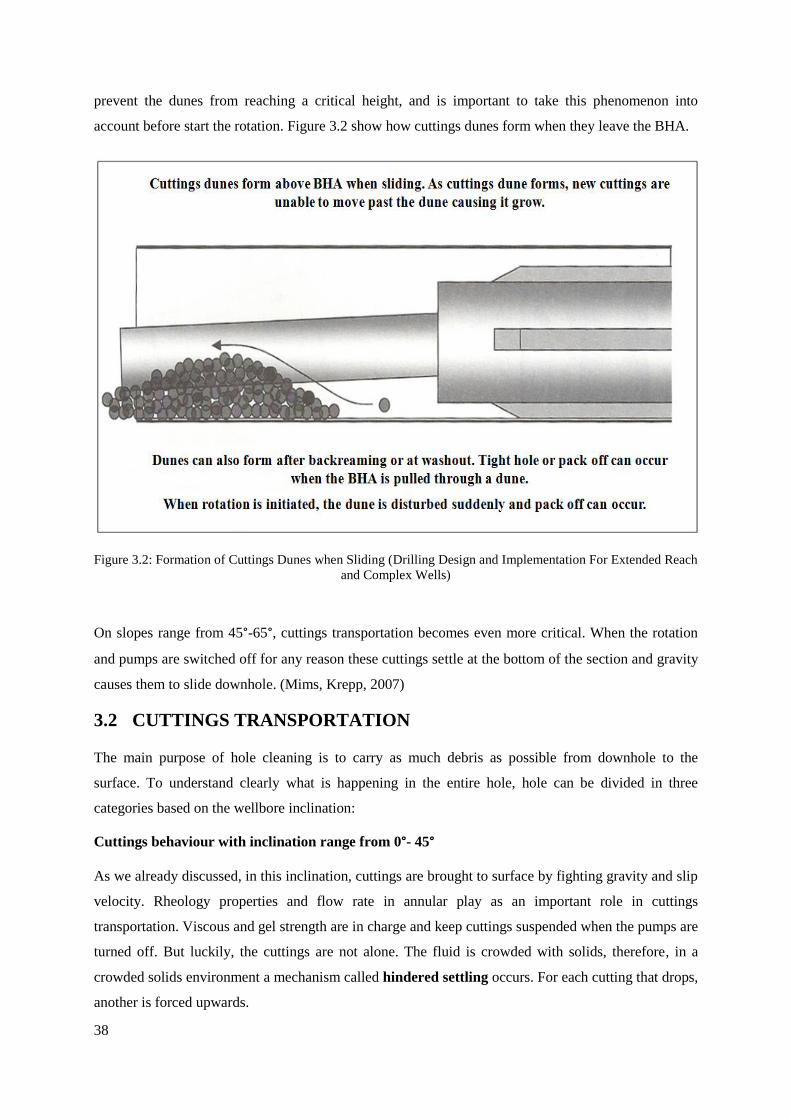
The annular space increases after the BHA, which leads to a decrease in AV. With this decreases, the
cuttings quickly fall to the low side of the well and will accumulate to form dunes. If the dunes reach a
critical height it is possible to pack off the hole with cuttings once rotation starts. It is essential to
38
prevent the dunes from reaching a critical height, and is important to take this phenomenon into
account before start the rotation. Figure 3.2 show how cuttings dunes form when they leave the BHA.
Figure 3.2: Formation of Cuttings Dunes when Sliding (Drilling Design and Implementation For Extended Reach
and Complex Wells)
On slopes range from 45°-65°, cuttings transportation becomes even more critical. When the rotation
and pumps are switched off for any reason these cuttings settle at the bottom of the section and gravity
causes them to slide downhole. (Mims, Krepp, 2007)
3.2 CUTTINGS TRANSPORTATION
The main purpose of hole cleaning is to carry as much debris as possible from downhole to the
surface. To understand clearly what is happening in the entire hole, hole can be divided in three
categories based on the wellbore inclination:
Cuttings behaviour with inclination range from 0°- 45°
As we already discussed, in this inclination, cuttings are brought to surface by fighting gravity and slip
velocity. Rheology properties and flow rate in annular play as an important role in cuttings
transportation. Viscous and gel strength are in charge and keep cuttings suspended when the pumps are
turned off. But luckily, the cuttings are not alone. The fluid is crowded with solids, therefore, in a
crowded solids environment a mechanism called hindered settling occurs. For each cutting that drops,
another is forced upwards.
39
Cuttings behaviour with inclination range from 45° - 65°
Here the cuttings move up the hole mostly on low side and begin to form dunes, with rotation is easily
to stirred up the cuttings into the effective flow regime. The main issue in this range is that when
pumps are stopped, the cuttings will fall in low side and begin to slide as an avalanche to downhole.
Alteration in hole cleaning strategy must be done with respect to the vertical well section.
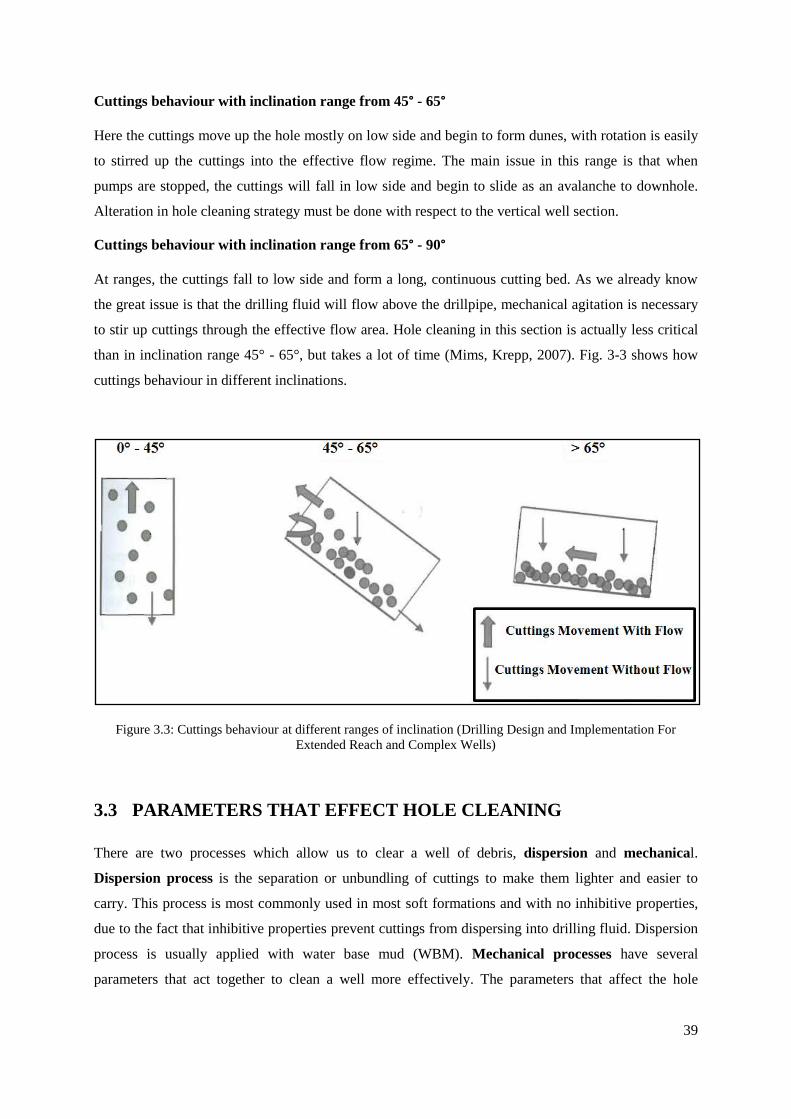
Cuttings behaviour with inclination range from 65° - 90°
At ranges, the cuttings fall to low side and form a long, continuous cutting bed. As we already know
the great issue is that the drilling fluid will flow above the drillpipe, mechanical agitation is necessary
to stir up cuttings through the effective flow area. Hole cleaning in this section is actually less critical
than in inclination range 45° - 65°, but takes a lot of time (Mims, Krepp, 2007). Fig. 3-3 shows how
cuttings behaviour in different inclinations.
Figure 3.3: Cuttings behaviour at different ranges of inclination (Drilling Design and Implementation For
Extended Reach and Complex Wells)
3.3 PARAMETERS THAT EFFECT HOLE CLEANING
There are two processes which allow us to clear a well of debris, dispersion and mechanical.
Dispersion process is the separation or unbundling of cuttings to make them lighter and easier to
carry. This process is most commonly used in most soft formations and with no inhibitive properties,
due to the fact that inhibitive properties prevent cuttings from dispersing into drilling fluid. Dispersion
process is usually applied with water base mud (WBM). Mechanical processes have several
parameters that act together to clean a well more effectively. The parameters that affect the hole
40
cleaning performance are: drillpipe rotation, flow rate and drilling fluid rheology. (Mims, Krepp,
2007)
3.3.1 DRILLPIPE ROTATION
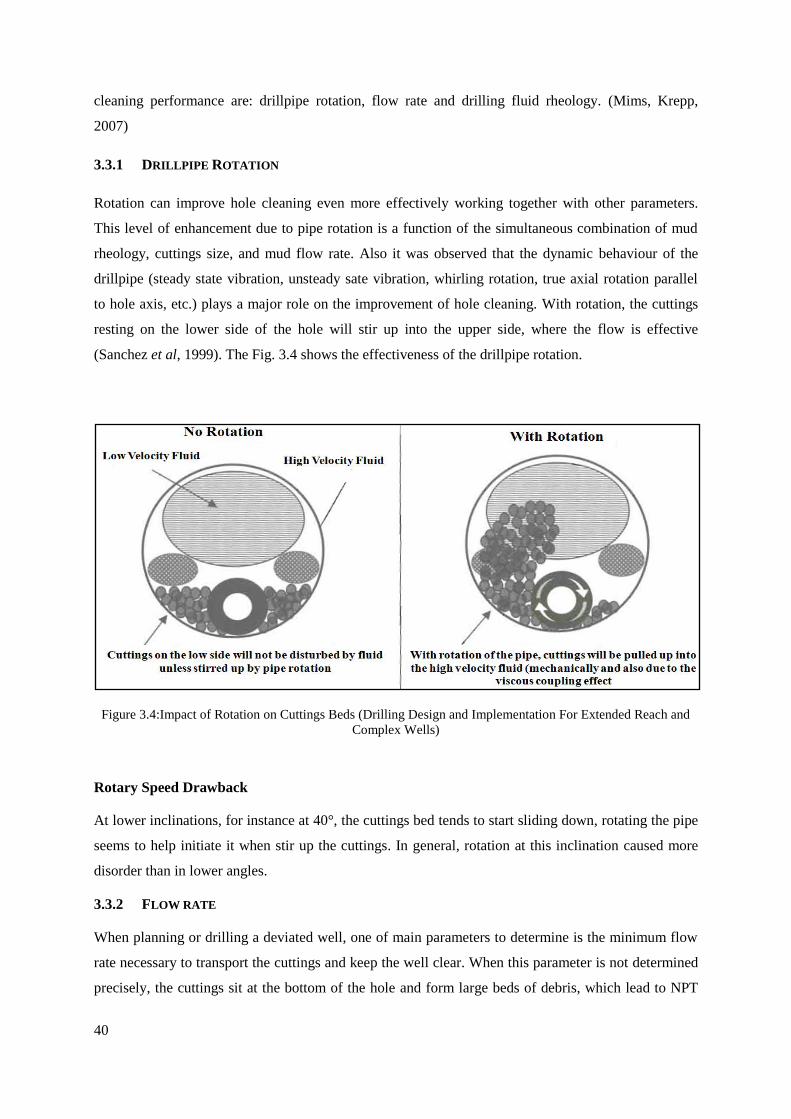
Rotation can improve hole cleaning even more effectively working together with other parameters.
This level of enhancement due to pipe rotation is a function of the simultaneous combination of mud
rheology, cuttings size, and mud flow rate. Also it was observed that the dynamic behaviour of the
drillpipe (steady state vibration, unsteady sate vibration, whirling rotation, true axial rotation parallel
to hole axis, etc.) plays a major role on the improvement of hole cleaning. With rotation, the cuttings
resting on the lower side of the hole will stir up into the upper side, where the flow is effective
(Sanchez et al, 1999). The Fig. 3.4 shows the effectiveness of the drillpipe rotation.
Figure 3.4:Impact of Rotation on Cuttings Beds (Drilling Design and Implementation For Extended Reach and
Complex Wells)
Rotary Speed Drawback
At lower inclinations, for instance at 40°, the cuttings bed tends to start sliding down, rotating the pipe
seems to help initiate it when stir up the cuttings. In general, rotation at this inclination caused more
disorder than in lower angles.
3.3.2 FLOW RATE
When planning or drilling a deviated well, one of main parameters to determine is the minimum flow
rate necessary to transport the cuttings and keep the well clear. When this parameter is not determined
precisely, the cuttings sit at the bottom of the hole and form large beds of debris, which lead to NPT

41
caused by such problems as high torque and drag, hole packing-off and stuck pipe. All these problems
may subsequently require expensive remedial operations and thus incur substantial increases in drilling
cost (Luo et al, 1994). Hence, if drilling mud is pumped at a high flowrate, it is more difficult for the
cuttings bed to build up is easier to remove (Adari et al, 2000). The rate of cuttings bed erosion in the
annulus with time can be given by the following non-linear exponential formula:
h = Bed height
α = Residual bed height
β = Initial bed height
γ = Reciprocal time constant
Equation 3.1: Bed height
Flow rate Regime
Cuttings removal in deviated wells occurs by a combination of two mechanisms, saltation and bed
sliding. These mechanisms result from two forces that act on fluids such as lift and the drag forces that
act on the cuttings bed. In laminar flow, the drag force dominates, while in turbulent flow the lift force
dominates. Results show that turbulent flow is more efficient in removing the cuttings than laminar
flow, because turbulent flow lifts the cuttings into the effective flow path. (Luo et al, 1994)
Flow rate and Mud Rheology
In turbulent flow, a lower YP causes a higher turbulent intensity and thus results in a higher lift force
for transporting cuttings by saltation. In laminar flow, a higher YP corresponds to a higher fluid drag
force which removes cuttings as sliding bed. So high YP muds are preferred in laminar flow for hole
cleaning.
3.3.3 DRILLING FLUID PROPERTIES
Drilling Fluid Weight
DF weight influences hole cleaning through the buoyancy of drilled cuttings, as mud weight increases
the cuttings weight becomes soft then drilling fluid weight and tend to float out of well making hole
cleaning easier. (Tomas, 2011)
Drilling Fluid Rheology
As we already know, the mud rheology is an important factor and the most challenging is to optimize,
because the viscosity must be high enough to keep the cuttings suspended and low enough to carry
42
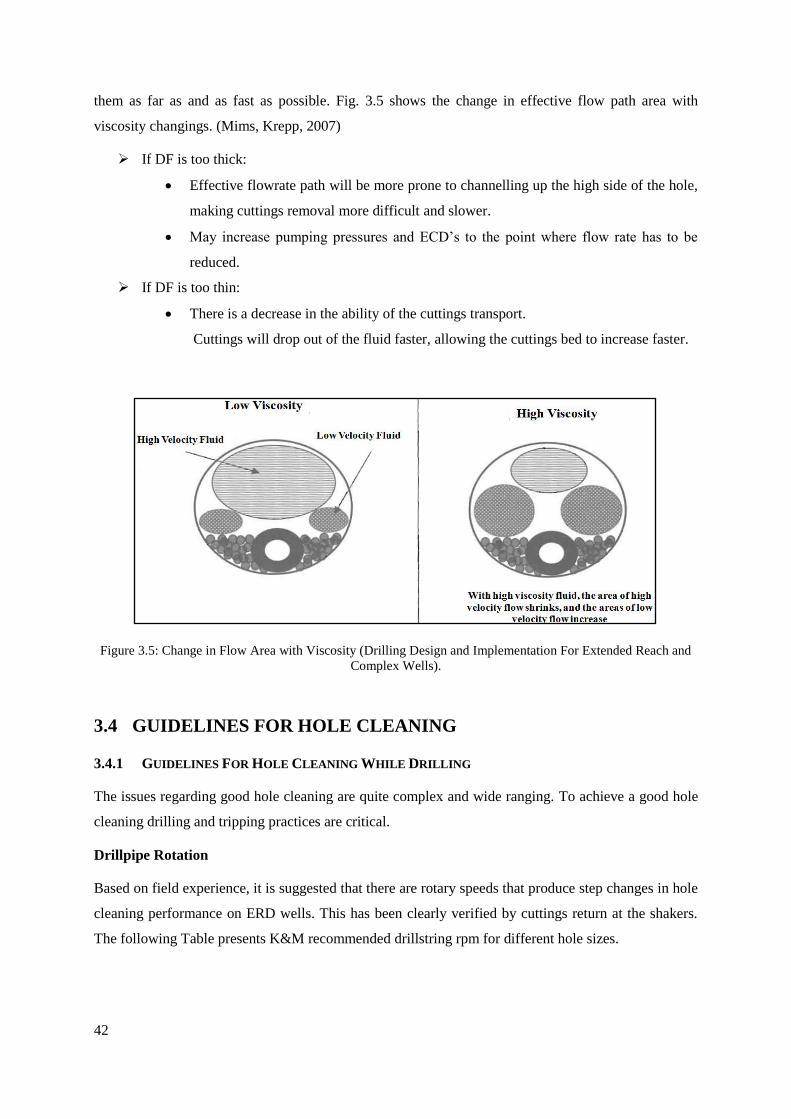
them as far as and as fast as possible. Fig. 3.5 shows the change in effective flow path area with
viscosity changings. (Mims, Krepp, 2007)
If DF is too thick:
Effective flowrate path will be more prone to channelling up the high side of the hole,
making cuttings removal more difficult and slower.
May increase pumping pressures and ECD’s to the point where flow rate has to be
reduced.
If DF is too thin:
There is a decrease in the ability of the cuttings transport.
Cuttings will drop out of the fluid faster, allowing the cuttings bed to increase faster.
Figure 3.5: Change in Flow Area with Viscosity (Drilling Design and Implementation For Extended Reach and
Complex Wells).
3.4 GUIDELINES FOR HOLE CLEANING
3.4.1 GUIDELINES FOR HOLE CLEANING WHILE DRILLING
The issues regarding good hole cleaning are quite complex and wide ranging. To achieve a good hole
cleaning drilling and tripping practices are critical.
Drillpipe Rotation
Based on field experience, it is suggested that there are rotary speeds that produce step changes in hole
cleaning performance on ERD wells. This has been clearly verified by cuttings return at the shakers.
The following Table presents K&M recommended drillstring rpm for different hole sizes.

43
Table 3.1: Rotary speed rules (Drilling Design and Implementation For Extended Reach and Complex Wells)
Hole
Size (in)
Desirable
RPM
Minimum Effective For
Hole Cleaning (rpm)
17 ½” 120 - 180 120
12 ¼” 150 -180 120
9 7/8” 120 - 150 100
8 ½” 70 - 100 60
The following factors must be taken into account when choosing the pipe rpm:
The need for high rpm should be balanced with ECD and others effects, especially when
dealing with small diameters (<8 ½”).
Care must be exercised when rotating over 130 rpm in 17 ½” or larger hole sizes. Large
annular clearance can lead to increased vibration and potential failures in the BHA and
drillstring.
If cuttings are still coming over the shakers, this means the hole is not properly cleaned.
Flow rate
Using the maximum flowrate for every section is recomended, but this is conditioned by ECD.
Consideration may lead to reduction of the flow rate. Table 3.2 below presents K&M recommended
minimum and maximum realistic flow rates for different hole sizes.
Table 3.2: Flow rate recommendation (Drilling Design and Implementation For Extended Reach and Complex
Wells)
Hole Size
(in)
Desirable Flow rate
(lpm)
Minimum Workable Flow rate
17 ½” 3406 – 4542.50 3406 lpm, with ROP at 20 m/h
12 ¼” 3028.33 – 4163.95 2460.52 – 2649.79 lpm, with ROP at 10 – 15 m/h
3028 lpm, with ROP at 20 30 m/h
9 7/8” 2649.79 – 3406.87 1892.70 lpm, with ROP at 10 – 20 m/h
8 ½” 1514.16 – 2271.25 1324.89 – 1514.16 lpm, with ROP at 10 – 20 m/h
44
Other factors to take into account to choose the pipe rpm and for hole cleaning are:
Off-bottom surface pressure is usually less than during on-bottom drilling, hence, higher flow
rates may be used when off-bottom circulating during hole cleaning.
The bit and BHA selection has a large effect on achievable flow rates in a pressure limited
environment.
Flow rate and rheology should be dimensioned in order to avoid washing out the wall of the
hole. Many people are concerned during such procedures that turbulent flow will result in
erosion of the wellbore, regardless of theoretical AV the actual velocity immediately next to
the wellbore is essentially zero, due to that the fluid is viscous, and is moving slower near
wellbore.
Rheology Guidelines
Viscosity should be low for pump ability. For WBM systems, maintaining a 6 rpm reading between 1
and 1.2 inches times the hole size has proven very effective in high angle applications. For OBM
systems, temperature and pressure should be observed and taken into account. (Mims, Krepp, 2007)
Connection practices
The recommended baseline connection procedure is as follows:
Drill down the stand with the current rpm and flow rate.
Pick up off-bottom and increase flow rate and rpm to their maximum.
Ream one stand out and back in (repeat if hole is tight).
Determine off-bottom torque and string weight.
Shut down the rotary.
Reciprocate the pipe and take the Pick-up and Slack-off weights values.
Shut down the pumps and make a connection.
The objectives of these connection practices are to:
Move cuttings away from the BHA to ensure trouble free connection
Condition the new section of that hole has been drilled
Collect Torque and Drag data in a consistent manner
Hole Cleaning Pills
Proper use of mud pills improve hole cleaning in a high angle inclination well. When using a low
viscosity pill, it is important to maintain the normal high flow rate and minimize non-circulate time to
avoid cuttings set on the lower side of the hole. It is often necessary for lower viscosity pill to be
followed by high viscosity pill in order to ensure adequate hole cleaning in the larger diameter vertical
section. The specific pill volumes should be determined based on the hole size and the calculated
45
effect on hydrostatic head. The use of low viscosity, turbulent flow pills is not recommended in a
weakly consolidated formation because washout or hole collapse may occur. (Tomás, D., 2011)
3.4.2 GUIDELINES FOR CLEANUP PRIOR TRIPPING OUT OF HOLE
If the hole is cleaned adequately prior to Pull Out of Hole (POOH), this practice is imperative in order
to avoid several problems such as pipe stuck. Circulation at maximum flow rate and rpm allowed
while working the last stand on bottom. Circulation should not stop until the shakers clean up from
cuttings even if 3-4 bottoms up have already circulated. At least two bottoms up should be required.
Depending on the drilling mode, cuttings flow over the shakers may also vary considerably with time.
When the motor assembly is in the hole and periods of slide drilling have occurred, various dunes may
still exist in the well, as the dunes are removed from the hole, it may give the appearance that the hole
is free from cuttings. Patience is required to avoid problems such as stuck pipe.
Guidelines for standard tripping procedure
As a general rule, this procedure should be used for all trips in high angle wells.
Clean up the hole by circulation rotating for a minimum 1.5 BU until the shakers are clean.
Keep rpm and flow as high as possible.
Rack back a stand every 30 minutes if necessary (if washout or undercutting are seen in
the formation).
Expect at least 3-4 bottoms up to cleanup high angle 12 ¼” hole.
When the shakers are clean, pull 3-5 stands wet to check hole condition (without rotation or
circulation).
Pump a slug and POOH on elevators.
Record PUW while tripping out and compare real-time to theoretical trends.
If tight spots are encountered (20-40 lbs overpull), or drag is increased over the theoretical,
always assume that the problem is cuttings.
Run in Hole (RIH) until BHA is clear of the obstruction (3-5 stands).
Circulate and rotate at maximum rate for 30 minutes.
The goal here is simply to confirm if it is a cutting dune, so as not to waste time, if
otherwise.
Pull up wet through the tight spot without rotation or circulation. If the tight spot has
disappeared, then the problem could be caused by a cuttings pile which has now been moved
up the hole. Go back to step one and circulate the cuttings out of the hole before repeating the
tripping procedure.
If a tight spot remains in the same place, then another mechanical problem has occurred,
such as key seating or swelling formation. In this case, reaming through the section is
46
required to try to eliminate the tight spot. Pull out through the tight spot again without
rotation to see if everything is ok after reaming. If the obstruction has been removed,
pump a slug and continue tripping out of the hole.
It is important to record, the primary rules for tripping in high angle well are:
Always assume that any tight hole or over-pull is due to cuttings.
Do not assume that a cased hole is a safe haven for tight hole avoidance. It is not unheard of
for stuck pipe to occur inside the casing, either just inside the shoe or many thousands of feet
inside the casing.
Backreaming should be used if deemed necessary when a cuttings bed cannot be circulated
out. When backreaming is started, it should be done until at least 30 degrees inclination before
circulate the hole clean and POOH.
3.4.3 GUIDELINES FOR BACKREAMING THROUGH A TIGHT SPOT
When a tight spot is encountered, the pipe should be run back into the hole to ensure that the BHA is
far from the cuttings bed. This may require 3-5 stands to get the bottom hole. It is imperative to never
start pumping or rotating while the BHA lies within or near the obstruction because BHA can be
embebbed in a cuttings dune. Start rotation and then pump slowly and gradually. At this point,
circulate and rotate at the maximum rates for 30 minutes. Turn the rotary and pumps off and pull out
carefully.
If the tight spot has gone, then the obstruction was cutting related. The BHA should then be run back
into the hole, far from the tight spot, and the hole cleaned up with high flow rate and rotary speed. If
the tight spot has not disappeared from the hole, then the obstruction may be related to something
other than cuttings, and normal practices may not be enough to solve the problem. At this point,
careful backreaming may be required until is past the obstruction. Never forget that a potentially
dangerous cuttings dune exists above the BHA.
3.4.4 GUIDELINES FOR REMEDIAL HOLE CLEANING
When practices and parameters are combined, they allow drilling for very long intervals without any
remedial measures. So is better to stay on the bottom at an optimized ROP than it is to drill in short
bursts and then use the remedial operations to clean the hole. In many cases remedial actions are
required due to changing conditions, such as deteriorating wellbore condition, low mud properties.
Stop and circulate
Once changes in the drilling parameters and ROP controls have proven ineffective, coming off bottom
and circulating should be used as the first remedial hole cleaning option. Is important take into account
that achievable off bottom flow rates and pipe rpm may be higher than those used for drilling. If T&D

47
returns to clean hole values following these procedures, then drilling may be resumed otherwise, a
wiper trip may be required. (Mims, Krepp, 2007)
Wiper trips
In this process, the bit is pulled inside the previous casing shoe and then run back to the bottom. This
may be necessary to improve wellbore conditions such as irregularities. Field experiences tell us that a
high angle hole section can be drilled without wiper tripping, because wiper trip should be used as
standard remedial option if deemed necessary, since good practices and strategies should be used at all
times. (HERIOT WATT UNIVERSITY, 2005)
Backreaming
Although backreaming may be a good practice for vertical or near vertical wells, it does not have the
same effect for high angle wells in the case of tight spots or as a primary hole cleaning tool, because it
is very inefficient and can also be very risky. The cuttings bed response to backreaming and pumping
out can be quite detrimental as packoff, stuck pipe and irreparable wellbore damage may occur (Mims,
Krepp, 2007). The following are problems associated with backreaming in high angle wells:
Back reaming cleans the wellbore completely below the BHA, leaving a small cuttings bed
that the bit and BHA can safely trip through. The drawback is that a dangerous cuttings dune
that builds up above the BHA, is likely to be higher and thicker than a cuttings bed left from
hole cleaning and can increase the risk of packing off and stuck pipe. If pack off does occur,
an instantaneous increase on surge effect is verify.
Backreaming can be detrimental for casing wear if high tension forces in the drillstring are
observed in the build section.
Backreaming may also have a significant impact on the fatigue life of the drilling string.
High vibration and shocks are often seen on the MWD when backreaming.
It is a time consuming operation.
The following are recommended procedures if backreaming is deemed necessary:
Backreaming should always be performed at the maximum allowable flow rate and pipe rpm.
The pulling speed for some operators is a critical parameter, it may be as slow as 10-15
min/stand in 12 ¼” hole.
Clean the hole up prior to starting backreaming minimum 1.5 x bottoms up then until the
shakers are clean. This will reduce the risk of stuck pipe and packoff.
After finishing backreaming should clean the hole never just POOH.
Be careful when backreaming into a casing shoe as the larger diameter rathole below shoe may
be an area where cuttings might accumulate. Consider extra circulation with rotation before
backreaming into shoe.

48
The following procedures are recommended for backreaming through tight spot:
Is best to consider that any tight spot during trip in is a cuttings related problem. If a tight spot
is encountered, the pipe should be tripped back into the hole far enough to ensure that the
BHA is away from the cuttings bed (this requires at least 3-5 stands are tripped back into
hole).
Avoid start pumping or rotating while the BHA lies within or near the obstruction, this can be
risky for BHA.
If the tight spot has moved up the hole, then the obstruction is cuttings related, and the BHA
should then tripped back into the hole.
Fig. 3.19 shows how a cutting dune could be built when backreaming in a high deviated well.
Figure 3.6: Acceptable Cutting Bed and Backreaming (Drilling Design and Implementation For Extended Reach
and Complex Wells)
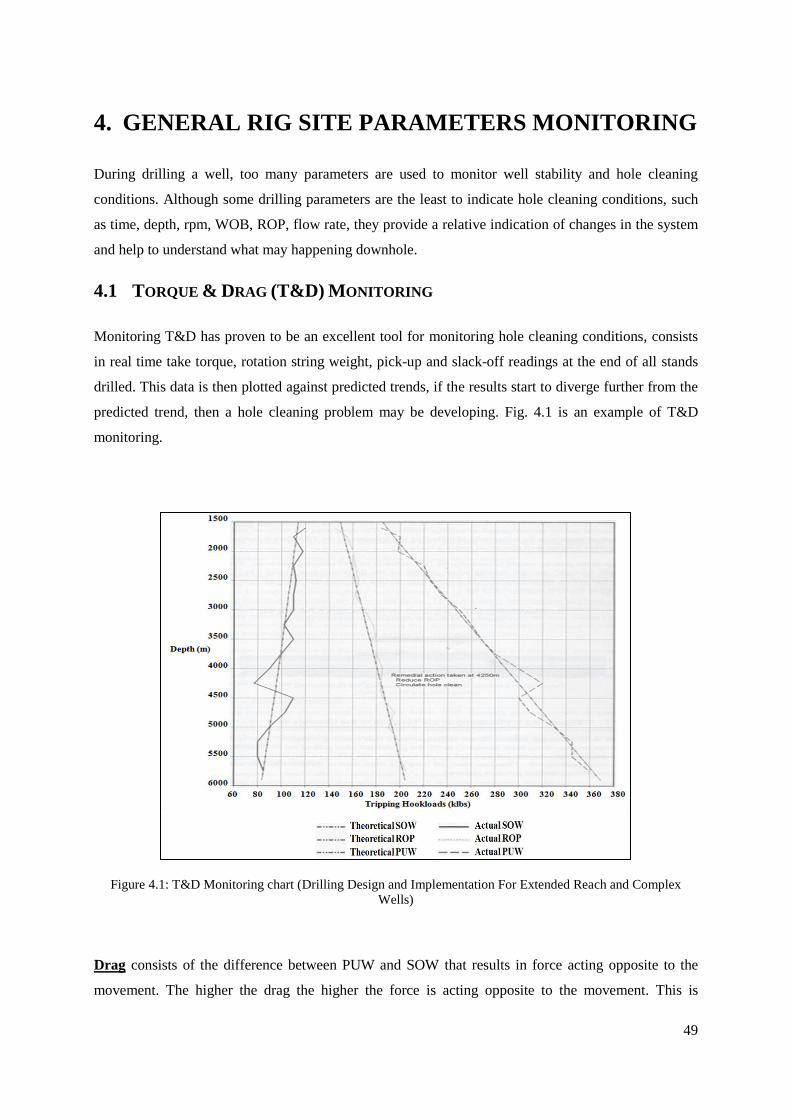
49
4. GENERAL RIG SITE PARAMETERS MONITORING
During drilling a well, too many parameters are used to monitor well stability and hole cleaning
conditions. Although some drilling parameters are the least to indicate hole cleaning conditions, such
as time, depth, rpm, WOB, ROP, flow rate, they provide a relative indication of changes in the system
and help to understand what may happening downhole.
4.1 TORQUE & DRAG (T&D) MONITORING
Monitoring T&D has proven to be an excellent tool for monitoring hole cleaning conditions, consists
in real time take torque, rotation string weight, pick-up and slack-off readings at the end of all stands
drilled. This data is then plotted against predicted trends, if the results start to diverge further from the
predicted trend, then a hole cleaning problem may be developing. Fig. 4.1 is an example of T&D
monitoring.
Figure 4.1: T&D Monitoring chart (Drilling Design and Implementation For Extended Reach and Complex
Wells)
Drag consists of the difference between PUW and SOW that results in force acting opposite to the
movement. The higher the drag the higher the force is acting opposite to the movement. This is
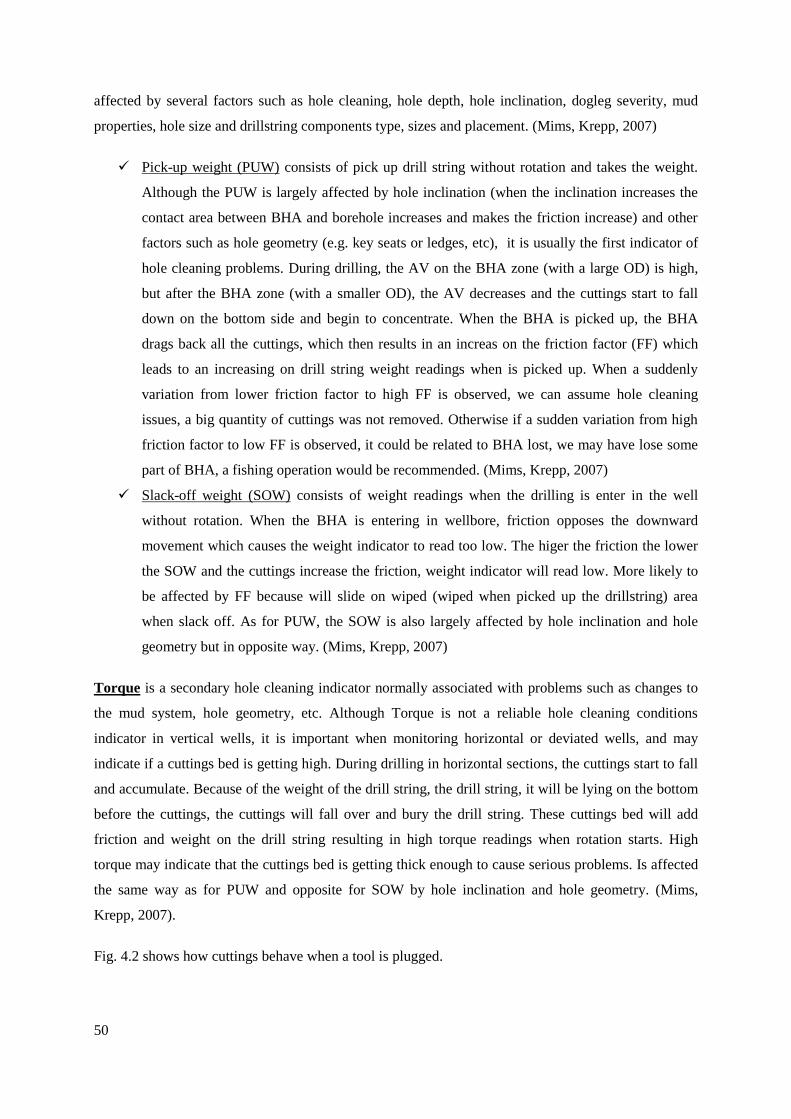
50
affected by several factors such as hole cleaning, hole depth, hole inclination, dogleg severity, mud
properties, hole size and drillstring components type, sizes and placement. (Mims, Krepp, 2007)
Pick-up weight (PUW) consists of pick up drill string without rotation and takes the weight.
Although the PUW is largely affected by hole inclination (when the inclination increases the
contact area between BHA and borehole increases and makes the friction increase) and other
factors such as hole geometry (e.g. key seats or ledges, etc), it is usually the first indicator of
hole cleaning problems. During drilling, the AV on the BHA zone (with a large OD) is high,
but after the BHA zone (with a smaller OD), the AV decreases and the cuttings start to fall
down on the bottom side and begin to concentrate. When the BHA is picked up, the BHA
drags back all the cuttings, which then results in an increas on the friction factor (FF) which
leads to an increasing on drill string weight readings when is picked up. When a suddenly
variation from lower friction factor to high FF is observed, we can assume hole cleaning
issues, a big quantity of cuttings was not removed. Otherwise if a sudden variation from high
friction factor to low FF is observed, it could be related to BHA lost, we may have lose some
part of BHA, a fishing operation would be recommended. (Mims, Krepp, 2007)
Slack-off weight (SOW) consists of weight readings when the drilling is enter in the well
without rotation. When the BHA is entering in wellbore, friction opposes the downward
movement which causes the weight indicator to read too low. The higer the friction the lower
the SOW and the cuttings increase the friction, weight indicator will read low. More likely to
be affected by FF because will slide on wiped (wiped when picked up the drillstring) area
when slack off. As for PUW, the SOW is also largely affected by hole inclination and hole
geometry but in opposite way. (Mims, Krepp, 2007)
Torque is a secondary hole cleaning indicator normally associated with problems such as changes to
the mud system, hole geometry, etc. Although Torque is not a reliable hole cleaning conditions
indicator in vertical wells, it is important when monitoring horizontal or deviated wells, and may
indicate if a cuttings bed is getting high. During drilling in horizontal sections, the cuttings start to fall
and accumulate. Because of the weight of the drill string, the drill string, it will be lying on the bottom
before the cuttings, the cuttings will fall over and bury the drill string. These cuttings bed will add
friction and weight on the drill string resulting in high torque readings when rotation starts. High
torque may indicate that the cuttings bed is getting thick enough to cause serious problems. Is affected
the same way as for PUW and opposite for SOW by hole inclination and hole geometry. (Mims,
Krepp, 2007).
Fig. 4.2 shows how cuttings behave when a tool is plugged.

51
Figure 4.2: Ploughing of the Tool joint in the cutting Bed (Drilling Design and Implementation For Extended
Reach and Complex Wells).
4.2 HOLE CLEANING RATE MONITORING
Cuttings returns check cuttings returns at regular intervals while drilling is a very important issue.
Monitoring the volume and type of cuttings coming from downhole will help to understand how clean
the hole is.
Cuttings volume returns consist of determining the weight (or volume) of the rock coming out
from downhole, compared to the expected weight being drilled. A big difference between the
expected quantity and real quantity coming out from downhole indicates poor hole cleaning
(expected higher than real value) or formation washout (expected lower than real value).
Cuttings type and shape are an important evaluation because it could be used to determine how
well the hole has being cleaned, if wellbore stability is affected and if the mud is doing its job.
A change in the type and shape of the cuttings will indicate a change downhole. For example
an unexpected dogleg leads to get out of trajectory defined and new formation started being
drilled resulting in a unexpected cuttings type on shakers. (Mims, Krepp, 2007)
4.3 EQUIVALENT CIRCULATING DENSITY (ECD) MONITORING
The ECD can be defined as the additional mud weight seen by the hole, due to the circulating pressure
losses of the fluid in the annulus. When the drilling fluid is circulating through the drillstring, the
borehole pressure at the bottom of the annulus will be greater than the hydrostatic pressure of the mud,
this extra pressure is due to the frictional pressure required to pump the fluid up the annulus. This
frictional pressure must be added to hydrostatic pressure to get a true value of the pressure acting
against the formation at the bottom of well. The ECD is affected directly by annular pressure loss
which is affected by Flowrate, Mud Rheology, RPM, Surge & Swab pressure. (HERIOT WATT
UNIVERSITY, 2005)
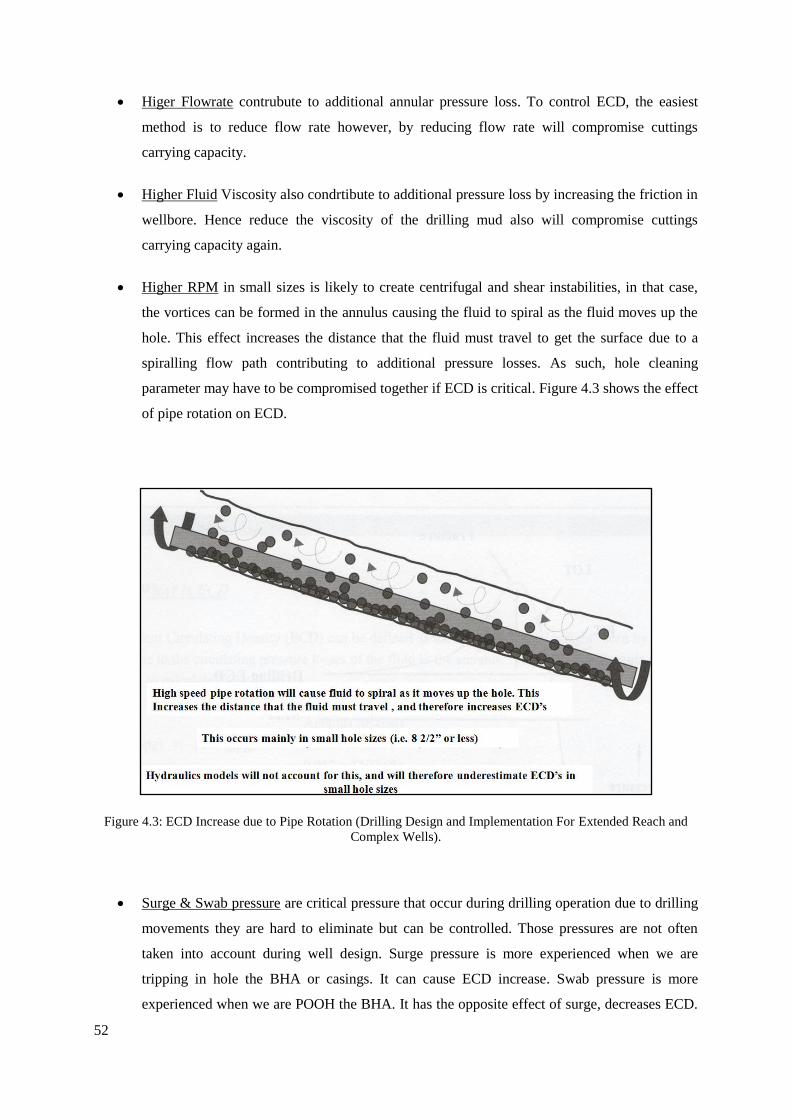
52
Higer Flowrate contrubute to additional annular pressure loss. To control ECD, the easiest
method is to reduce flow rate however, by reducing flow rate will compromise cuttings
carrying capacity.
Higher Fluid Viscosity also condrtibute to additional pressure loss by increasing the friction in
wellbore. Hence reduce the viscosity of the drilling mud also will compromise cuttings
carrying capacity again.
Higher RPM in small sizes is likely to create centrifugal and shear instabilities, in that case,
the vortices can be formed in the annulus causing the fluid to spiral as the fluid moves up the
hole. This effect increases the distance that the fluid must travel to get the surface due to a
spiralling flow path contributing to additional pressure losses. As such, hole cleaning
parameter may have to be compromised together if ECD is critical. Figure 4.3 shows the effect
of pipe rotation on ECD.
Figure 4.3: ECD Increase due to Pipe Rotation (Drilling Design and Implementation For Extended Reach and
Complex Wells).
Surge & Swab pressure are critical pressure that occur during drilling operation due to drilling
movements they are hard to eliminate but can be controlled. Those pressures are not often
taken into account during well design. Surge pressure is more experienced when we are
tripping in hole the BHA or casings. It can cause ECD increase. Swab pressure is more
experienced when we are POOH the BHA. It has the opposite effect of surge, decreases ECD.
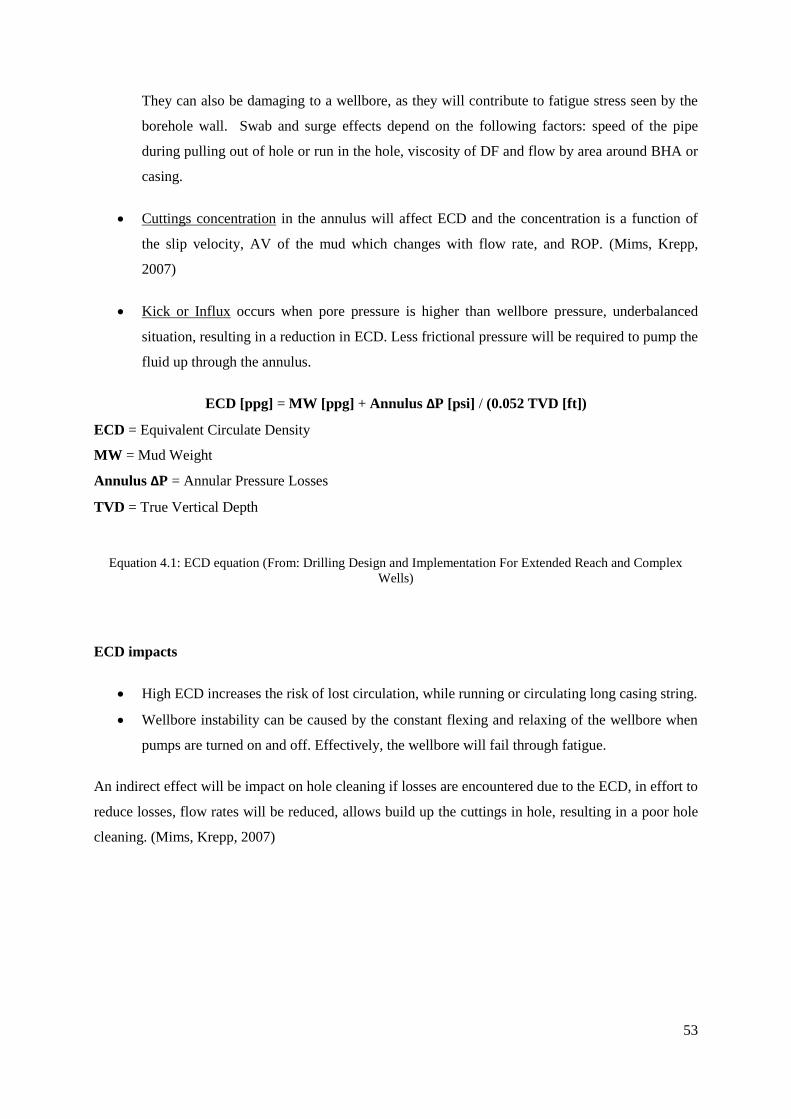
53
They can also be damaging to a wellbore, as they will contribute to fatigue stress seen by the
borehole wall. Swab and surge effects depend on the following factors: speed of the pipe
during pulling out of hole or run in the hole, viscosity of DF and flow by area around BHA or
casing.
Cuttings concentration in the annulus will affect ECD and the concentration is a function of
the slip velocity, AV of the mud which changes with flow rate, and ROP. (Mims, Krepp,
2007)
Kick or Influx occurs when pore pressure is higher than wellbore pressure, underbalanced
situation, resulting in a reduction in ECD. Less frictional pressure will be required to pump the
fluid up through the annulus.
ECD [ppg] = MW [ppg] + Annulus ∆P [psi] / (0.052 TVD [ft])
ECD = Equivalent Circulate Density
MW = Mud Weight
Annulus ∆P = Annular Pressure Losses
TVD = True Vertical Depth
Equation 4.1: ECD equation (From: Drilling Design and Implementation For Extended Reach and Complex
Wells)
ECD impacts
High ECD increases the risk of lost circulation, while running or circulating long casing string.
Wellbore instability can be caused by the constant flexing and relaxing of the wellbore when
pumps are turned on and off. Effectively, the wellbore will fail through fatigue.
An indirect effect will be impact on hole cleaning if losses are encountered due to the ECD, in effort to
reduce losses, flow rates will be reduced, allows build up the cuttings in hole, resulting in a poor hole
cleaning. (Mims, Krepp, 2007)


55
5. ENVIORONMENT ISSUES DURING DRILLING
OPERATIONS
5.1 ENVIRONMENT PROBLEMS
Drilling and seismic operations represent a huge source of noise underwater. As we know, sound
through water carries four times faster than through air. Thus, noise could disturb the natural habitants
by interfering their eco-communication, which might lead to migration of these habitants to others
areas.
During drilling operations cuttings come from wellbore with Non Aquose Base Mud (NABM) which
represents a big problem if it is dropped directly onto the sea bed. These cuttings are common in oil
and could provide significant hydrocarbons and chemical quantities discharged into the sea, which
would destroy indigenous fauna. These cuttings must be separated from oil before dropped in order to
avoid several environment accidents.
The cuttings discharged into the sea drop on the sea bed and accumulate at different levels. This
accumulation depends on local environment conditions such as flows, heaves, etc. But after
discharges, the NABM concentration in sediments is high and benthic community may be affected.
The impacts of NABM on the water column is considered low, because they set fast on sea bed,
therefore for benthic organism the initial environment impact is physic burial. Due to NABM
biodegradation risk such as chemistry toxicity, decreased oxygen. (BANCO MUNDIAL, AFNOR,
2007).
5.2 MITIGATION MEASURES
Use water base mud as much as possible during drilling.
When NABM is used, ensure that lower toxicity.
Check if an oil static pellicle forms during discharges.
Fit rigs with equipment that separates the oil from the cuttings at a rate of at least 95%
(through centrifuge).
It is important to anticipate th that cuttings be treated on shore if the desired performance
cannot be achieved off shore.
Cuttings treatments performance monitoring.
56
5.3 WASTE MANAGEMENT
The principles of waste management include the incorporation of a hierarchy of practices into
development waste management plans. All waste management effort relate to prevention of pollution.
If elimination of a waste is not possible, then minimizing the amount of waste generated should be
investigated.
The first step in managing drillings wastes is to separates the solid cuttings from the drilling fluid.
Once solid and liquid fluid wastes have been separated, many technologies and practices may be used
to manage the wastes. These management technologies and practices can be grouped into three main
categories: waste minimization, recycle/reuse and disposal (Owens et al, 1993).
Waste minimization
Use drilling practices that minimize the generation of drilling wastes:
Perform directional drilling
Drill smaller diameter holes
Use drilling techniques that use less drilling fluid
Use muds and additives with lower environment impacts
Synthetic-based muds
New drilling fluid systems
Alternate weighting agents
Recycle/Reuse
Beneficial reuse of drilling wastes
Recycling of mud
Road spreading
Reuse of cuttings for construction purposes
Restoration of wetland using cuttings
Use of oily cuttings as fuel
Disposal
Onsite burial
Land application
Land farming
Land spreading
Bioremediation
Composting
Bioreactors
Vermiculture

57
Discharge to ocean
Offsite disposal to commercial facilities
Slurry injection
Thermal treatments
Incineration
Thermal desorption

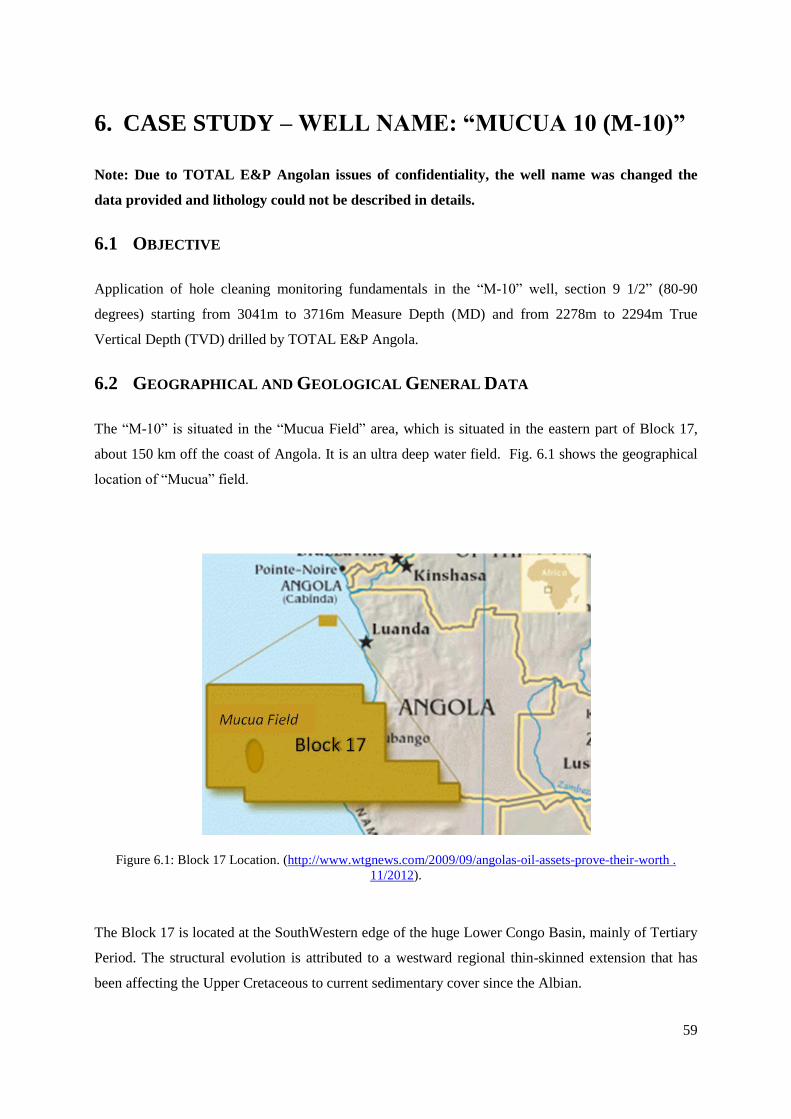
59
6. CASE STUDY – WELL NAME: “MUCUA 10 (M-10)”
Note: Due to TOTAL E&P Angolan issues of confidentiality, the well name was changed the
data provided and lithology could not be described in details.
6.1 OBJECTIVE
Application of hole cleaning monitoring fundamentals in the “M-10” well, section 9 1/2” (80-90
degrees) starting from 3041m to 3716m Measure Depth (MD) and from 2278m to 2294m True
Vertical Depth (TVD) drilled by TOTAL E&P Angola.
6.2 GEOGRAPHICAL AND GEOLOGICAL GENERAL DATA
The “M-10” is situated in the “Mucua Field” area, which is situated in the eastern part of Block 17,
about 150 km off the coast of Angola. It is an ultra deep water field. Fig. 6.1 shows the geographical
location of “Mucua” field.
Figure 6.1: Block 17 Location. (http://www.wtgnews.com/2009/09/angolas-oil-assets-prove-their-worth .
11/2012).
The Block 17 is located at the SouthWestern edge of the huge Lower Congo Basin, mainly of Tertiary
Period. The structural evolution is attributed to a westward regional thin-skinned extension that has
been affecting the Upper Cretaceous to current sedimentary cover since the Albian.
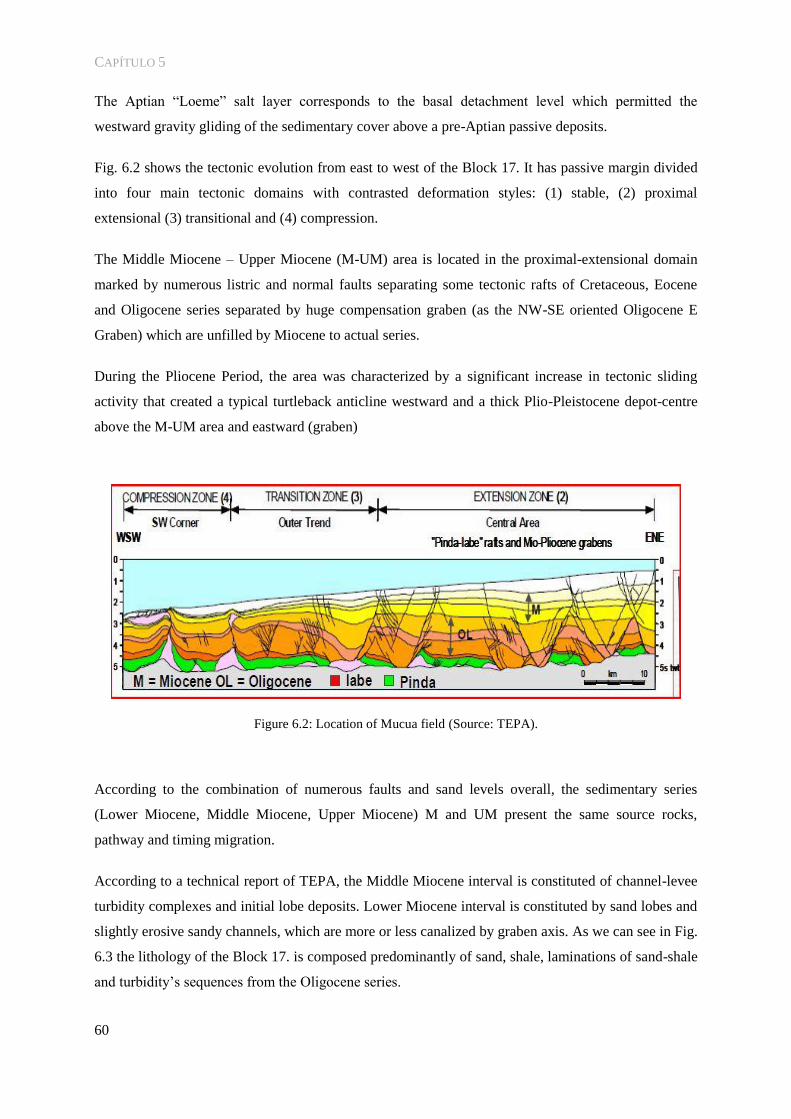
CAPÍTULO 5
60
The Aptian “Loeme” salt layer corresponds to the basal detachment level which permitted the
westward gravity gliding of the sedimentary cover above a pre-Aptian passive deposits.
Fig. 6.2 shows the tectonic evolution from east to west of the Block 17. It has passive margin divided
into four main tectonic domains with contrasted deformation styles: (1) stable, (2) proximal
extensional (3) transitional and (4) compression.
The Middle Miocene – Upper Miocene (M-UM) area is located in the proximal-extensional domain
marked by numerous listric and normal faults separating some tectonic rafts of Cretaceous, Eocene
and Oligocene series separated by huge compensation graben (as the NW-SE oriented Oligocene E
Graben) which are unfilled by Miocene to actual series.
During the Pliocene Period, the area was characterized by a significant increase in tectonic sliding
activity that created a typical turtleback anticline westward and a thick Plio-Pleistocene depot-centre
above the M-UM area and eastward (graben)
Figure 6.2: Location of Mucua field (Source: TEPA).
According to the combination of numerous faults and sand levels overall, the sedimentary series
(Lower Miocene, Middle Miocene, Upper Miocene) M and UM present the same source rocks,
pathway and timing migration.
According to a technical report of TEPA, the Middle Miocene interval is constituted of channel-levee
turbidity complexes and initial lobe deposits. Lower Miocene interval is constituted by sand lobes and
slightly erosive sandy channels, which are more or less canalized by graben axis. As we can see in Fig.
6.3 the lithology of the Block 17. is composed predominantly of sand, shale, laminations of sand-shale
and turbidity’s sequences from the Oligocene series.
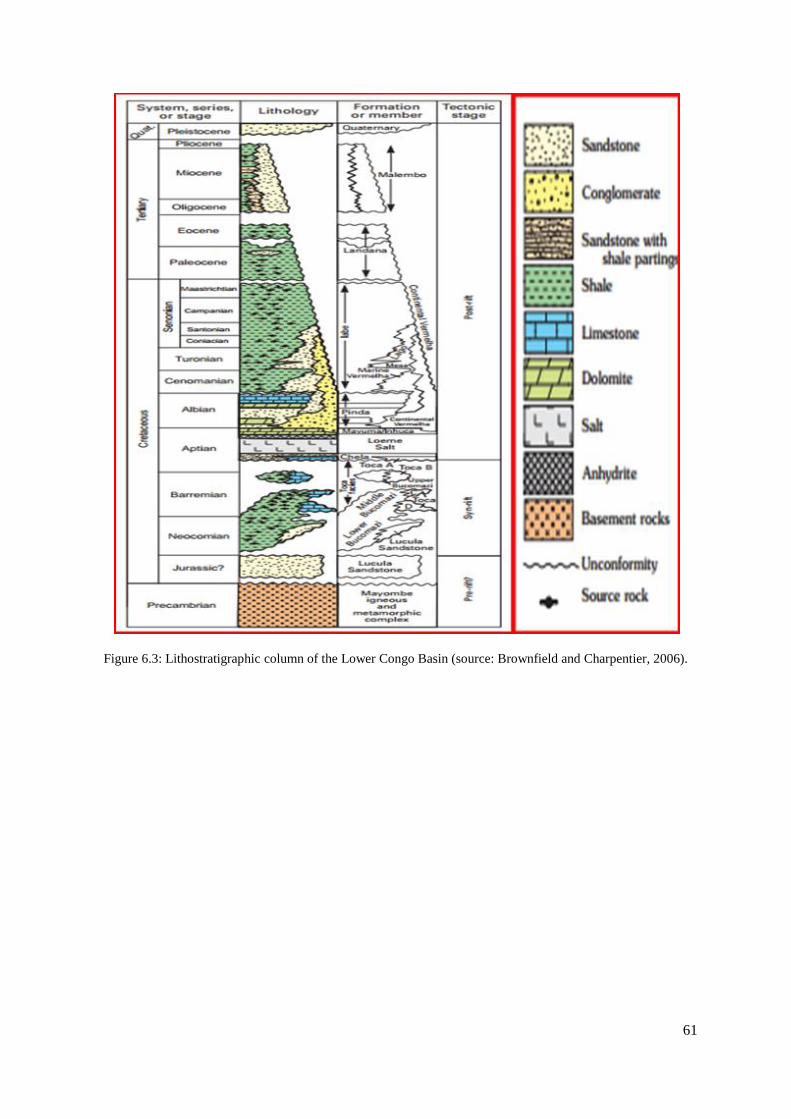
61
Figure 6.3: Lithostratigraphic column of the Lower Congo Basin (source: Brownfield and Charpentier, 2006).
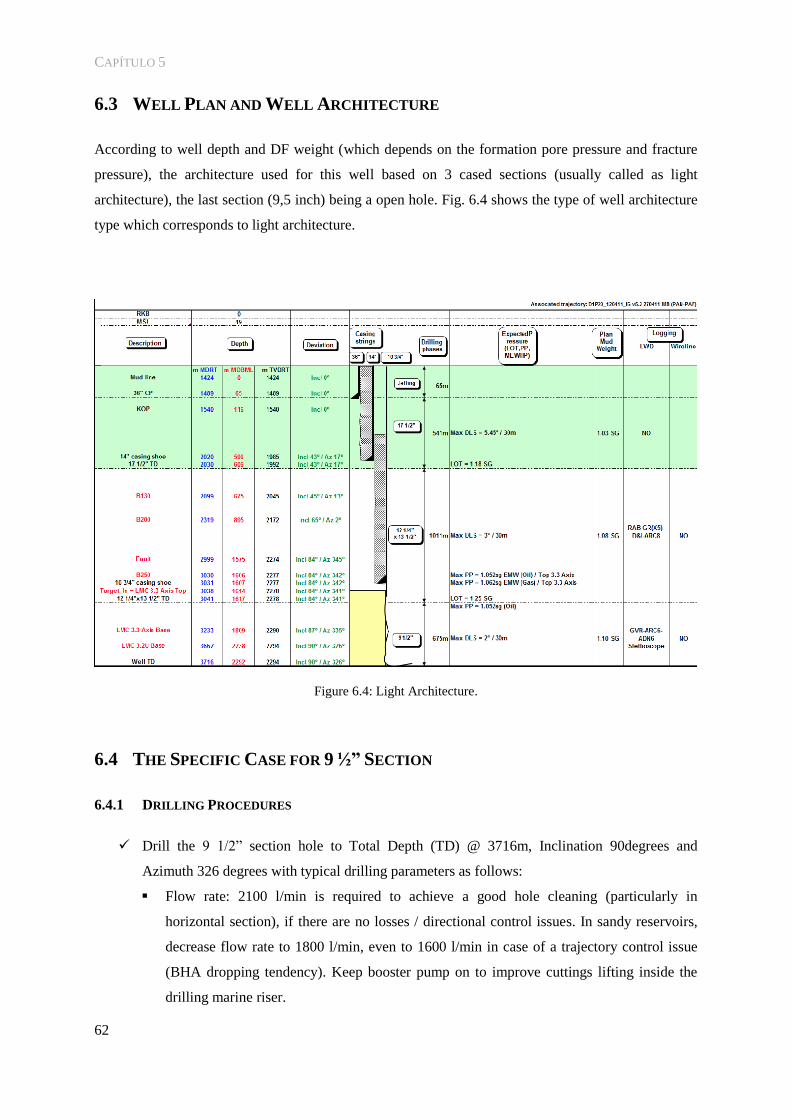
CAPÍTULO 5
62
6.3 WELL PLAN AND WELL ARCHITECTURE
According to well depth and DF weight (which depends on the formation pore pressure and fracture
pressure), the architecture used for this well based on 3 cased sections (usually called as light
architecture), the last section (9,5 inch) being a open hole. Fig. 6.4 shows the type of well architecture
type which corresponds to light architecture.
Figure 6.4: Light Architecture.
6.4 THE SPECIFIC CASE FOR 9 ½” SECTION
6.4.1 DRILLING PROCEDURES
Drill the 9 1/2” section hole to Total Depth (TD) @ 3716m, Inclination 90degrees and
Azimuth 326 degrees with typical drilling parameters as follows:
Flow rate: 2100 l/min is required to achieve a good hole cleaning (particularly in
horizontal section), if there are no losses / directional control issues. In sandy reservoirs,
decrease flow rate to 1800 l/min, even to 1600 l/min in case of a trajectory control issue
(BHA dropping tendency). Keep booster pump on to improve cuttings lifting inside the
drilling marine riser.
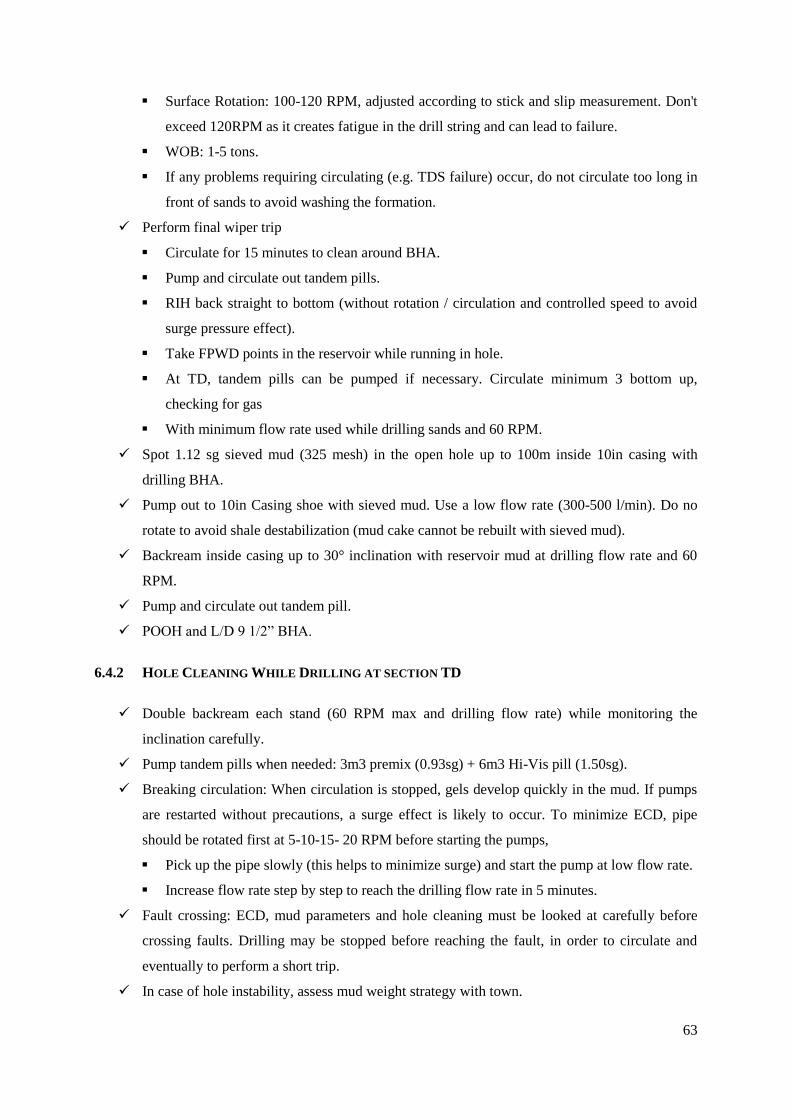
63
Surface Rotation: 100-120 RPM, adjusted according to stick and slip measurement. Don't
exceed 120RPM as it creates fatigue in the drill string and can lead to failure.
WOB: 1-5 tons.
If any problems requiring circulating (e.g. TDS failure) occur, do not circulate too long in
front of sands to avoid washing the formation.
Perform final wiper trip
Circulate for 15 minutes to clean around BHA.
Pump and circulate out tandem pills.
RIH back straight to bottom (without rotation / circulation and controlled speed to avoid
surge pressure effect).
Take FPWD points in the reservoir while running in hole.
At TD, tandem pills can be pumped if necessary. Circulate minimum 3 bottom up,
checking for gas
With minimum flow rate used while drilling sands and 60 RPM.
Spot 1.12 sg sieved mud (325 mesh) in the open hole up to 100m inside 10in casing with
drilling BHA.
Pump out to 10in Casing shoe with sieved mud. Use a low flow rate (300-500 l/min). Do no
rotate to avoid shale destabilization (mud cake cannot be rebuilt with sieved mud).
Backream inside casing up to 30° inclination with reservoir mud at drilling flow rate and 60
RPM.
Pump and circulate out tandem pill.
POOH and L/D 9 1/2” BHA.
6.4.2 HOLE CLEANING WHILE DRILLING AT SECTION TD
Double backream each stand (60 RPM max and drilling flow rate) while monitoring the
inclination carefully.
Pump tandem pills when needed: 3m3 premix (0.93sg) + 6m3 Hi-Vis pill (1.50sg).
Breaking circulation: When circulation is stopped, gels develop quickly in the mud. If pumps
are restarted without precautions, a surge effect is likely to occur. To minimize ECD, pipe
should be rotated first at 5-10-15- 20 RPM before starting the pumps,
Pick up the pipe slowly (this helps to minimize surge) and start the pump at low flow rate.
Increase flow rate step by step to reach the drilling flow rate in 5 minutes.
Fault crossing: ECD, mud parameters and hole cleaning must be looked at carefully before
crossing faults. Drilling may be stopped before reaching the fault, in order to circulate and
eventually to perform a short trip.
In case of hole instability, assess mud weight strategy with town.

CAPÍTULO 5
64
It is imperative to conduct the hole clean at the end of the drilling phase, so wiper trips (if they
are deemed necessary) are not skipped.
6.4.3 HOLE CLEANING PERFORMANCE MONITORING
Main indicators to be monitored during drilling
Measurement of PUW, SOW and FRT in every stand.
ECD at bit: this information, provided by the Pressure While Drilling tool (PWD) is useful,
because it is directly linked to wellbore stability.
Surface pressure. Monitoring stand pipe pressure.
Cuttings: every 1 hour, report quantity, to be checked by mud loggers. (General Drilling and
Completion Program).
To have a good and clear picture of what is really happening downhole, multiple friction factor lines
are necessary. T&D Modeling Software provides theoretically calculated T&D trends, which will be
plotted and compared to the real-time measurements. It will use the measured hookloads to perform a
back-calculation of friction factors along the wellbore.
Pick Up Weight (PUW) Monitoring
In Fig. 6.5 we can observe a notable and suddenly diverging trend from low FF to high FF (from
3080m to 3164m MD). As mentioned before, when this happens, assume that a build up of cuttings is
occurring when pick up the BHA. The cuttings are not being removed properly resulting in a big
cuttings concentration downhole, which gives additional weight in drill string when is picked up. From
3179m to 3654m MD the trend is quit constant increasing as expected and, no diverging trend from
low FF to high FF is observed. Good hole cleaning has been performed.

65
Figure 6.5: Monitoring PUW. Expected vs Actual.
Slack Off Weigh (SOW) Monitoring
Fig. 6.6 shows a pretty constant trend thatis decreasing as expected, no considerable diverging trend
from high FF to low FF is observed. This means that no build up of cuttings is occurring when trip in
the BHA.
Figure 6.6: Monitoring SOW Expected vs Actual.
3010
3110
3210
3310
3410
3510
3610
3710
125 130 135 140 145 150 155 160 165 170 175 180 185 190 195 200 (m
eter
s)
(tons) PUW evolution
PUW FF= 0,15/0,2
PUW FF= 0,15/0,25
PUW FF= 0,2/0,3
PUW FF= 0,25/0,35
PUW FF= 0,3/0,4
Measured PUW while
drilling
3010
3110
3210
3310
3410
3510
3610
3710
100 105 110 115 120 125 130 135 140 145 (m
eter
s)
(tons) SOW evolution
SOW FF= 0,15/0,2
SOW FF= 0,15/0,25
SOW FF= 0,2/0,3
SOW FF= 0,25/0,35
SOW FF= 0,3/0,4
Measured SOW while drilling

CAPÍTULO 5
66
Free Rotate Torque Monitoring
Fig. 6.7 shows a notable and sudden variation in FF, a notable increase (from 3080m to 3164m MD).
As we already know this is related to the cuttings concentration height. In this case the cuttings
concentration was reaching a critical height. From 3179m to 3654m MD the trend is quite constant it
is increasing as expected and no diverging trend from low FF to high FF is observed. This means the
cuttings concentration was washed out.
Figure 6.7: Monitoring Torque Expected vs Actual.
ECD Monitoring
In Fig. 6.8 we can observe that as the depth and RPM increase. The ECD increases (from 3179m to
3470m MD). However the level of increase is attenuated when flow rate and RPM decrease (from
3503m to 3654m MD). At high 2000 l/min and 115 rpm the level of increase is more evident and
dangerous than at the lower flowrate (1600 l/min) and medium RPM (100 rpm). This happens
because high flow rate will affect more annular pressure loss increases than low flow rate. In small
sizes, high RPM will cause fluid to spiral as it moves up to surface, which increases the distance that
fluid must travel, thus increase the ECD values, all of which could affect the well stability. The ECD
should be as maximum as possible to the advise model to avoid well stability problems.
3010
3110
3210
3310
3410
3510
3610
3710
800 900 1000 1100 1200 1300 1400 1500 1600 1700 1800 1900 2000 2100 2200 2300 2400 2500
(met
ers)
(kgf.m) FRT evolution
FRT FF= 0,15/0,2 FRT FF= 0,15/0,25 FRT FF= 0,2/0,3
FRT FF= 0,25/0,35 FRT FF= 0,3/0,4 Measured FRT
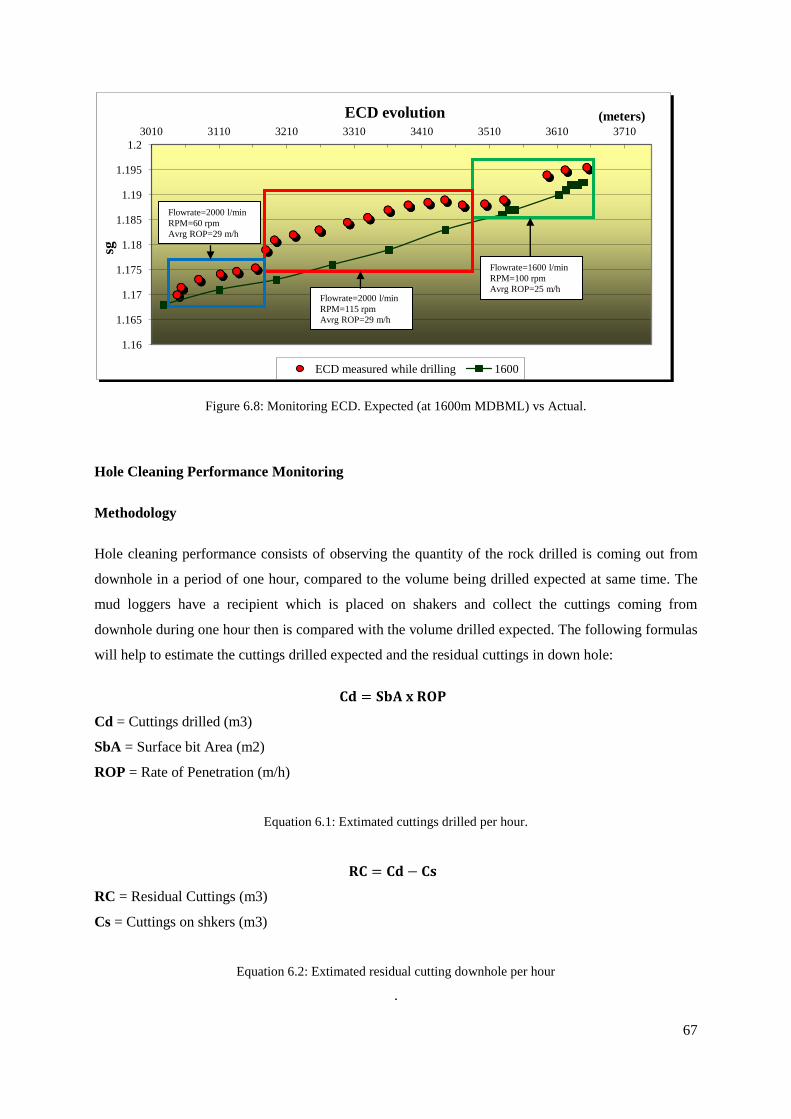
67
Figure 6.8: Monitoring ECD. Expected (at 1600m MDBML) vs Actual.
Hole Cleaning Performance Monitoring
Methodology
Hole cleaning performance consists of observing the quantity of the rock drilled is coming out from
downhole in a period of one hour, compared to the volume being drilled expected at same time. The
mud loggers have a recipient which is placed on shakers and collect the cuttings coming from
downhole during one hour then is compared with the volume drilled expected. The following formulas
will help to estimate the cuttings drilled expected and the residual cuttings in down hole:
Cd = Cuttings drilled (m3)
SbA = Surface bit Area (m2)
ROP = Rate of Penetration (m/h)
Equation 6.1: Extimated cuttings drilled per hour.
RC = Residual Cuttings (m3)
Cs = Cuttings on shkers (m3)
Equation 6.2: Extimated residual cutting downhole per hour
.
1.16
1.165
1.17
1.175
1.18
1.185
1.19
1.195
1.2
3010 3110 3210 3310 3410 3510 3610 3710
sg
(meters) ECD evolution
ECD measured while drilling 1600
Flowrate=2000 l/min
RPM=60 rpm
Avrg ROP=29 m/h
Flowrate=2000 l/min
RPM=115 rpm
Avrg ROP=29 m/h
Flowrate=1600 l/min
RPM=100 rpm
Avrg ROP=25 m/h
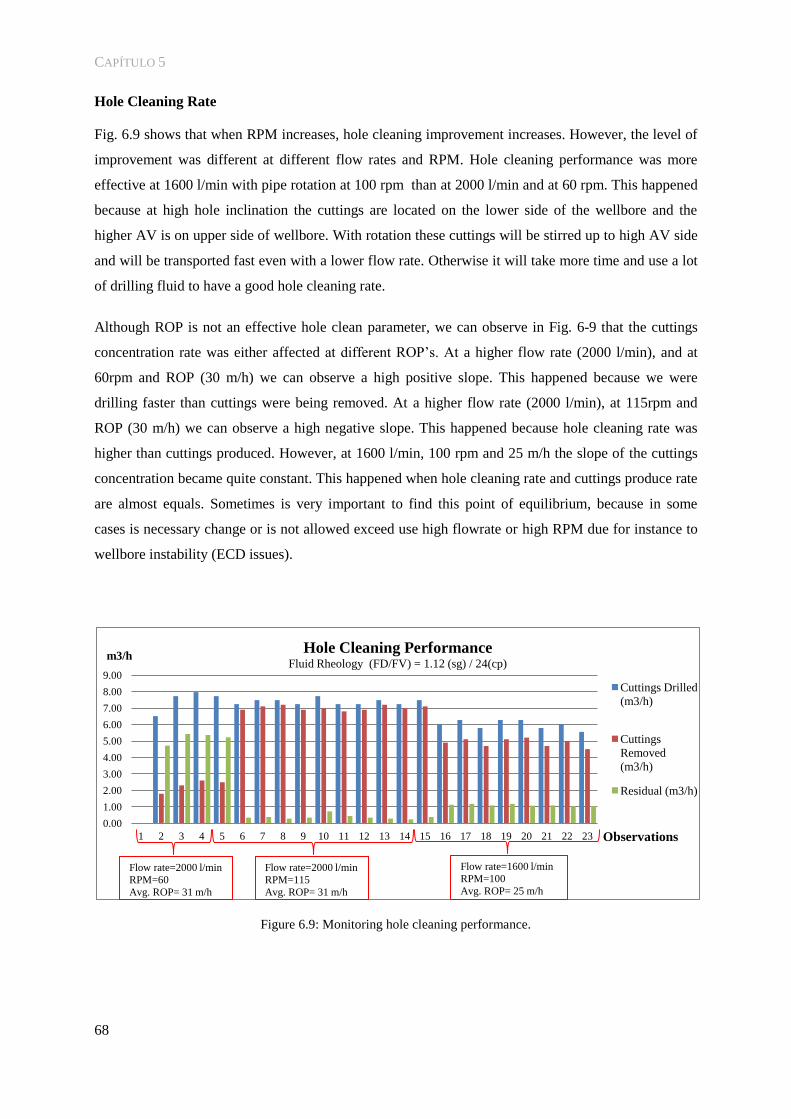
CAPÍTULO 5
68
Hole Cleaning Rate
Fig. 6.9 shows that when RPM increases, hole cleaning improvement increases. However, the level of
improvement was different at different flow rates and RPM. Hole cleaning performance was more
effective at 1600 l/min with pipe rotation at 100 rpm than at 2000 l/min and at 60 rpm. This happened
because at high hole inclination the cuttings are located on the lower side of the wellbore and the
higher AV is on upper side of wellbore. With rotation these cuttings will be stirred up to high AV side
and will be transported fast even with a lower flow rate. Otherwise it will take more time and use a lot
of drilling fluid to have a good hole cleaning rate.
Although ROP is not an effective hole clean parameter, we can observe in Fig. 6-9 that the cuttings
concentration rate was either affected at different ROP’s. At a higher flow rate (2000 l/min), and at
60rpm and ROP (30 m/h) we can observe a high positive slope. This happened because we were
drilling faster than cuttings were being removed. At a higher flow rate (2000 l/min), at 115rpm and
ROP (30 m/h) we can observe a high negative slope. This happened because hole cleaning rate was
higher than cuttings produced. However, at 1600 l/min, 100 rpm and 25 m/h the slope of the cuttings
concentration became quite constant. This happened when hole cleaning rate and cuttings produce rate
are almost equals. Sometimes is very important to find this point of equilibrium, because in some
cases is necessary change or is not allowed exceed use high flowrate or high RPM due for instance to
wellbore instability (ECD issues).
Figure 6.9: Monitoring hole cleaning performance.
0.00
1.00
2.00
3.00
4.00
5.00
6.00
7.00
8.00
9.00
1 2 3 4 5 6 7 8 9 10 11 12 13 14 15 16 17 18 19 20 21 22 23
m3/h
Observations
Hole Cleaning Performance Fluid Rheology (FD/FV) = 1.12 (sg) / 24(cp)
Cuttings Drilled
(m3/h)
Cuttings
Removed
(m3/h)
Residual (m3/h)
Flow rate=2000 l/min
RPM=60
Avg. ROP= 31 m/h
Flow rate=2000 l/min
RPM=115
Avg. ROP= 31 m/h
Flow rate=1600 l/min
RPM=100
Avg. ROP= 25 m/h
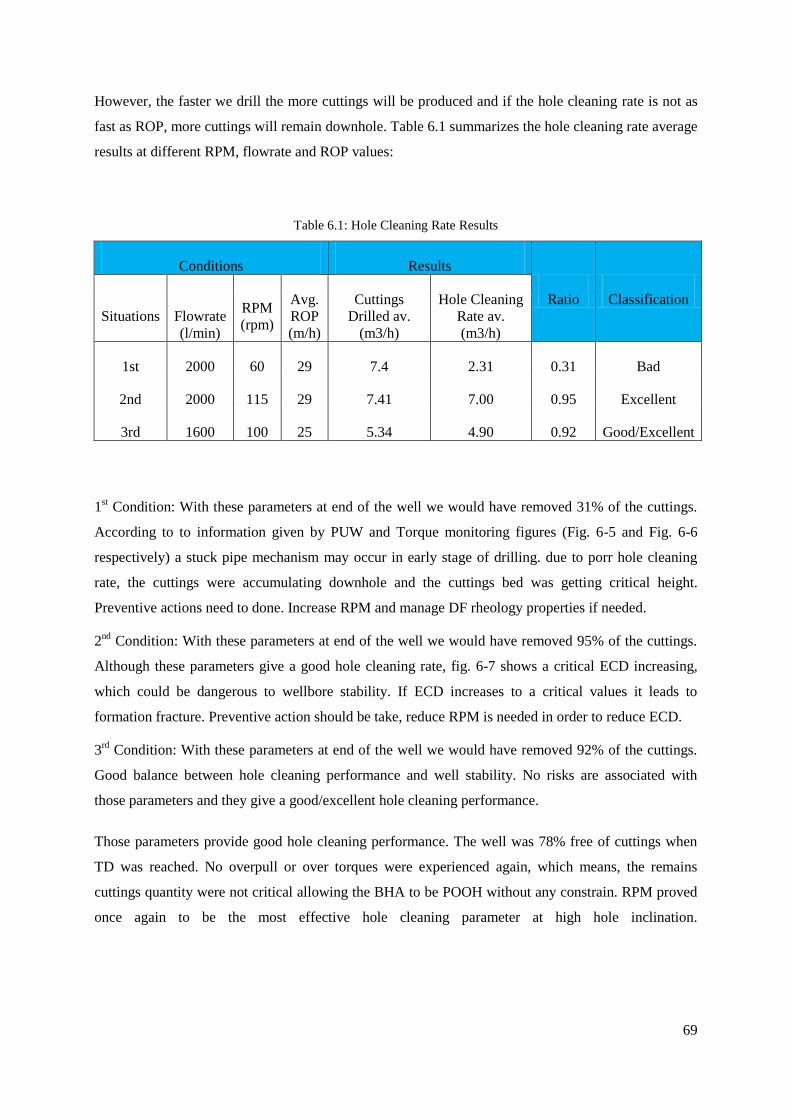
69
However, the faster we drill the more cuttings will be produced and if the hole cleaning rate is not as
fast as ROP, more cuttings will remain downhole. Table 6.1 summarizes the hole cleaning rate average
results at different RPM, flowrate and ROP values:
Table 6.1: Hole Cleaning Rate Results
Conditions Results
Ratio Classification
Situations Flowrate
(l/min)
RPM
(rpm)
Avg.
ROP
(m/h)
Cuttings
Drilled av.
(m3/h)
Hole Cleaning
Rate av.
(m3/h)
1st 2000 60 29 7.4 2.31 0.31 Bad
2nd 2000 115 29 7.41 7.00 0.95 Excellent
3rd 1600 100 25 5.34 4.90 0.92 Good/Excellent
1st Condition: With these parameters at end of the well we would have removed 31% of the cuttings.
According to to information given by PUW and Torque monitoring figures (Fig. 6-5 and Fig. 6-6
respectively) a stuck pipe mechanism may occur in early stage of drilling. due to porr hole cleaning
rate, the cuttings were accumulating downhole and the cuttings bed was getting critical height.
Preventive actions need to done. Increase RPM and manage DF rheology properties if needed.
2nd
Condition: With these parameters at end of the well we would have removed 95% of the cuttings.
Although these parameters give a good hole cleaning rate, fig. 6-7 shows a critical ECD increasing,
which could be dangerous to wellbore stability. If ECD increases to a critical values it leads to
formation fracture. Preventive action should be take, reduce RPM is needed in order to reduce ECD.
3rd
Condition: With these parameters at end of the well we would have removed 92% of the cuttings.
Good balance between hole cleaning performance and well stability. No risks are associated with
those parameters and they give a good/excellent hole cleaning performance.
Those parameters provide good hole cleaning performance. The well was 78% free of cuttings when
TD was reached. No overpull or over torques were experienced again, which means, the remains
cuttings quantity were not critical allowing the BHA to be POOH without any constrain. RPM proved
once again to be the most effective hole cleaning parameter at high hole inclination.

71
7. FINAL REMARKS
This work was intended to provide a better understanding of hole cleaning issues and how we can
manage them. Removal of cuttings from the wellbore is an essential part of the drilling operation.
Understanding hole cleaning is the key to avoid stuck pipe related NPT and red money.
Flow rate itself could be enough to clean a hole, but it will take time and will need more mud, which
makes the operation more expensive. Drillpipe rotation and mud rheology are effective hole cleaning
parameters that help to remove the cuttings faster and more cheaply.
Hole cleaning monitoring is an important practice to use to control hole cleaning performance. The
ECD, T&D are the most important parameters for monitoring during drilling wells. This data should
be collected in same manner for each data point to ensure consistency and reliable output, driller
sensibility must take this into account when data are being analyzed. The trend of each one of those
parameters must be followed and compared to the expected trend. If any significant deviation from the
expected trend is observed, it must be analysed. If a hole cleaning problem is suspected, the well must
be properly cleaned until the recovery before resuming drilling.
Despite recent improvements in drillings practices and technologies, hole cleaning still a great
challenge, because we not know what exactly is happening in down hole we still working in the dark.
The following are addressed recommendations for improved hole cleaning process in the future:
Monitoring and reporting the cuttings quantity at the surface in short intervals (every 30 or 15
minutes) will provide valuable information about the clean condition of the well and the
possibility of taking preventive actions earlier.
Training is also very important. Training gives people the knowledge to recognize the signals
at the surface and choose the best action to take in case of hole cleaning issues.
Increasing the drill pipe OD helps avoid the abrupt reduction in AV when the flow gets into
low OD (when lives the BHA area and start flow in drill pipes area).
Environmental issues must be taken into account when planning a well. Effective and responsible
waste handling and disposal are key elements in an organisation’s environmental management system.
Finally, my internship in the Total E&P Angola Company was critical to developing the dissertation.
It also served as a source of knowledge and familiarity with the world of oil which have positive
impact on the work I do in this profession in the future.

73
8. REFERENCES
Adari, R., Miska, S., Kuru, E., Bern, P., Saasen, A. 2000. Selecting Drilling Fluid Properties and
Flow rates For Effective Hole Cleaningin High Angle and Horizontal Wells - Society of Petroleum
Engineers Inc.
Alexandre, P. 2008. Hole Cleaning - Petroleum Specialization Program. TOTAL E&P Angola.
Luanda.
BANCO MUNDIAL and AFNOR (Association Française de Normalisation), 2007. Environmental,
Health and Safety Guidelines.
HERIOT WATT UNIVERSITY, 2005. Drilling Engineering, 2005 - Heriot Watt University.
Luo, Yuejin, Bern, P.A., Chambers, B.D.. 1994. Simple Charts To Determine Hole Cleaning
Requirements in Deviated Wells – IADC/SPE.
Mims M & Krepp T. 2007. Drilling Design and Implementation For Extended Reach and Complex
Wells – Third Edition, K&M Technologies Group, LLC.USA.
Owens, C.K., Rycroft, D.R., Stephenson, M.T., Norris, G., Johnson, J.A., Crame, L.W., Inglesfield,
C., Gireg, A. 1993. Exploration and Production (E&P) Waste Management Guidelines, Report nº
2.58/196.
Alfredo Sanchez, R., Azar, J.J., Bassal, A.A., Martins, A.L. 1999. Effect of Drillpipe Rotation on Hole
Cleaning During Direction-Well Drilling - Society of Petroleum Engineers.
Technical Reference Document. ABC of Stuck Pipe.
Tomás, D., 2011. Drilling Pazflor Oligocene Wells - Petroleum Specialization Program. TOTAL E&P
Angola. Luanda.
Wild Well Control. Technical Data Book.

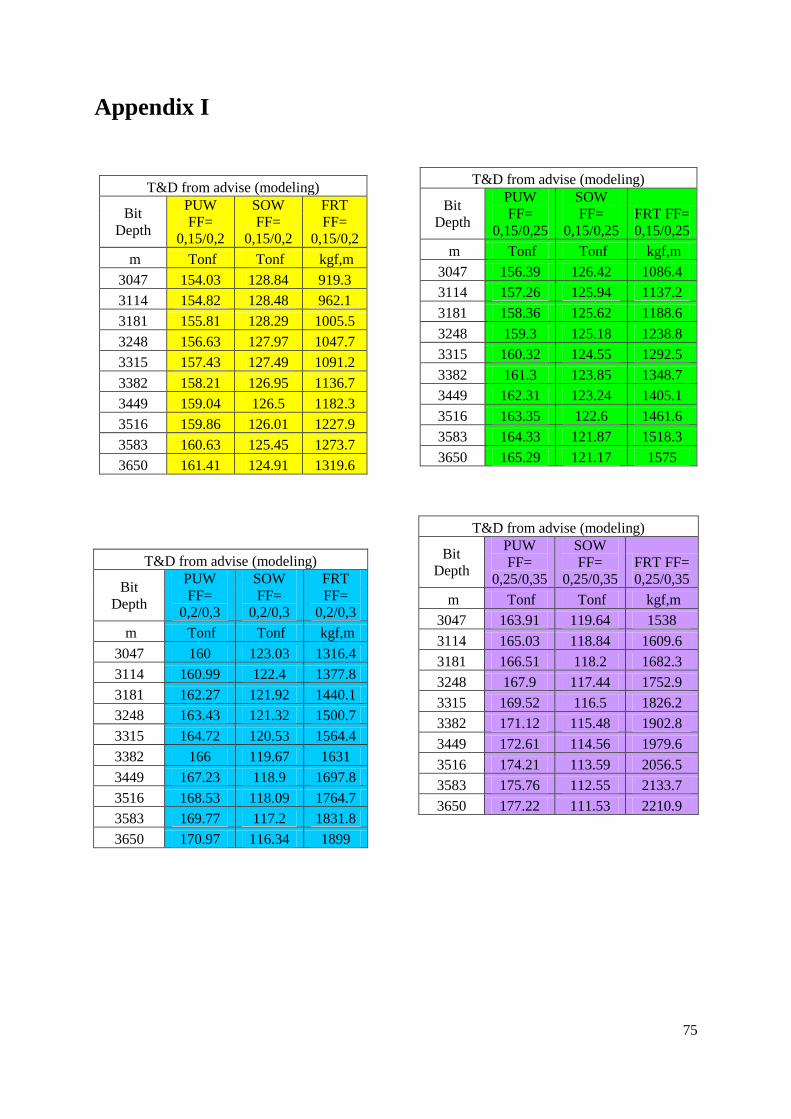
75
Appendix I
T&D from advise (modeling)
Bit
Depth
PUW
FF=
0,15/0,2
SOW
FF=
0,15/0,2
FRT
FF=
0,15/0,2
m Tonf Tonf kgf,m
3047 154.03 128.84 919.3
3114 154.82 128.48 962.1
3181 155.81 128.29 1005.5
3248 156.63 127.97 1047.7
3315 157.43 127.49 1091.2
3382 158.21 126.95 1136.7
3449 159.04 126.5 1182.3
3516 159.86 126.01 1227.9
3583 160.63 125.45 1273.7
3650 161.41 124.91 1319.6
T&D from advise (modeling)
Bit
Depth
PUW
FF=
0,15/0,25
SOW
FF=
0,15/0,25
FRT FF=
0,15/0,25
m Tonf Tonf kgf,m
3047 156.39 126.42 1086.4
3114 157.26 125.94 1137.2
3181 158.36 125.62 1188.6
3248 159.3 125.18 1238.8
3315 160.32 124.55 1292.5
3382 161.3 123.85 1348.7
3449 162.31 123.24 1405.1
3516 163.35 122.6 1461.6
3583 164.33 121.87 1518.3
3650 165.29 121.17 1575
T&D from advise (modeling)
Bit
Depth
PUW
FF=
0,2/0,3
SOW
FF=
0,2/0,3
FRT
FF=
0,2/0,3
m Tonf Tonf kgf,m
3047 160 123.03 1316.4
3114 160.99 122.4 1377.8
3181 162.27 121.92 1440.1
3248 163.43 121.32 1500.7
3315 164.72 120.53 1564.4
3382 166 119.67 1631
3449 167.23 118.9 1697.8
3516 168.53 118.09 1764.7
3583 169.77 117.2 1831.8
3650 170.97 116.34 1899
T&D from advise (modeling)
Bit
Depth
PUW
FF=
0,25/0,35
SOW
FF=
0,25/0,35
FRT FF=
0,25/0,35
m Tonf Tonf kgf,m
3047 163.91 119.64 1538
3114 165.03 118.84 1609.6
3181 166.51 118.2 1682.3
3248 167.9 117.44 1752.9
3315 169.52 116.5 1826.2
3382 171.12 115.48 1902.8
3449 172.61 114.56 1979.6
3516 174.21 113.59 2056.5
3583 175.76 112.55 2133.7
3650 177.22 111.53 2210.9
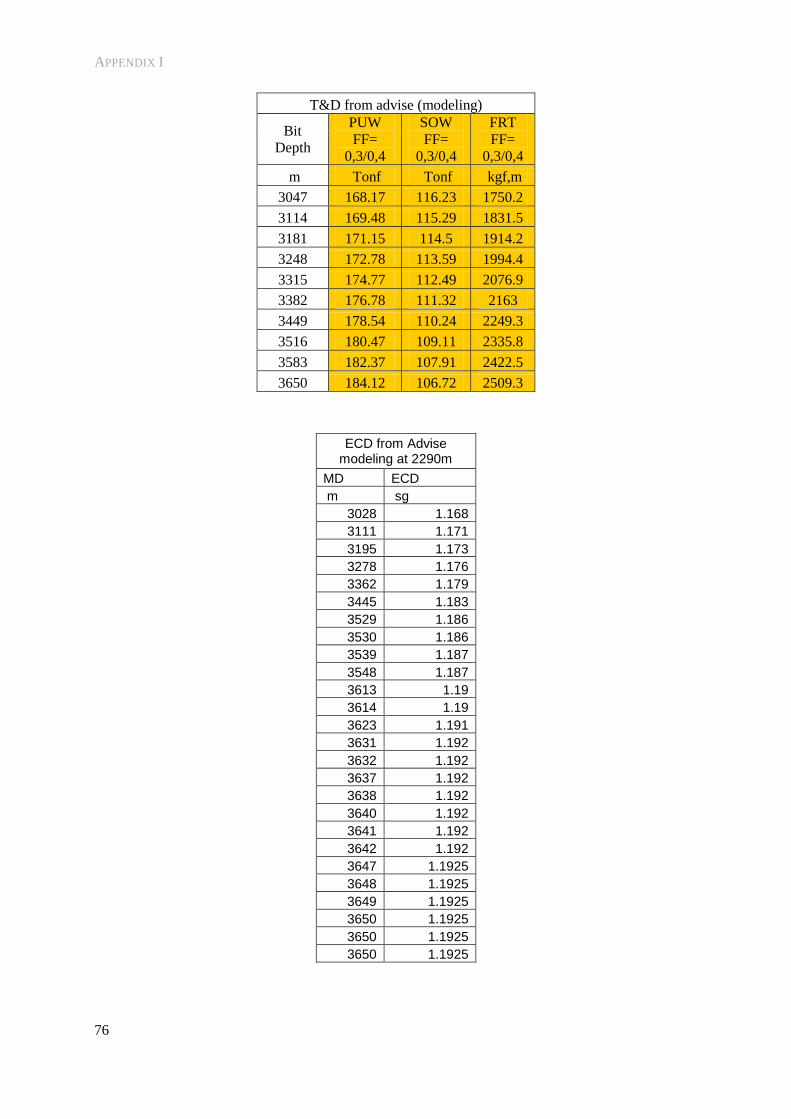
APPENDIX I
76
T&D from advise (modeling)
Bit
Depth
PUW
FF=
0,3/0,4
SOW
FF=
0,3/0,4
FRT
FF=
0,3/0,4
m Tonf Tonf kgf,m
3047 168.17 116.23 1750.2
3114 169.48 115.29 1831.5
3181 171.15 114.5 1914.2
3248 172.78 113.59 1994.4
3315 174.77 112.49 2076.9
3382 176.78 111.32 2163
3449 178.54 110.24 2249.3
3516 180.47 109.11 2335.8
3583 182.37 107.91 2422.5
3650 184.12 106.72 2509.3
ECD from Advise modeling at 2290m
MD ECD
m sg
3028 1.168
3111 1.171
3195 1.173
3278 1.176
3362 1.179
3445 1.183
3529 1.186
3530 1.186
3539 1.187
3548 1.187
3613 1.19
3614 1.19
3623 1.191
3631 1.192
3632 1.192
3637 1.192
3638 1.192
3640 1.192
3641 1.192
3642 1.192
3647 1.1925
3648 1.1925
3649 1.1925
3650 1.1925
3650 1.1925
3650 1.1925

APPENDIX I
77
While Drilling
Bit
Depth Measured PUW Measured SOW Measured FRW Measured FRT Calculated drags ECD measured
while drilling while drilling while drilling while drilling while drilling while drilling
m tons tons tons klbs.ft tons emw
3048 1.17
3054 156 123 143 1100 33 1.1715
3080 165 123 143 1225 42 1.1731
3112 166 122.5 142 1235 43.5 1.1742
3136 167 122 137 1252 45 1.1747
3164 166 121.5 139 1246 44.5 1.1754
3179 159 121.5 139 1200 37.5 1.179
3192 159 121.5 140 1200 37.5 1.181
3220 159.5 121.5 140 1220 38 1.182
3258 160 120.5 141 1280 39.5 1.183
3300 161 120 142 1300 41 1.1845
3330 161.5 120 141 1330 41.5 1.1855
3360 162 119.5 141 1335 42.5 1.187
3390 162 119 141 1400 43 1.188
3419 163 119 141 1400 44 1.1885
3444 163.5 119 141 1410 44.5 1.189
3470 163.6 119 141 1450 44.6 1.188
3503 164 118 141 1485 46 1.1882
3531 165 118 141 1480 47 1.189
3562 165.5 117 141 1510 48.5 1.895
3595 166 117 142 1550 49 1.194
3622 165.8 117 140 1560 48.8 1.195
3654 166.5 116.5 141 1585 50 1.1955
Drilling Parameters

APPENDIX I
78
Observation
Flow
av.(*100
l/min)
RPM av.
(*10 rpm)
SPP av.
(*10 bar)
ROP av.
(m/h)
Depth
(km)
Cuttings
Drilled
(m3/h)
Cuttings
Removed
(m3/h)
Residual
(m3/h)
0 0 0 13 0 3.04 0.00 0.00 0.00
1 20 6 17.8 27 3.07 6.52 1.80 4.72
2 20 6 17.6 32 3.10 7.72 2.30 5.42
3 20 6 17.7 33 3.13 7.96 2.60 5.36
4 20 6 17.5 32 3.17 7.72 2.50 5.22
5 20 11.5 17.8 30 3.20 7.24 6.90 0.34
6 20 11.5 17.7 31 3.23 7.48 7.10 0.38
7 20 11.5 17.5 31 3.26 7.48 7.20 0.28
8 20 11.5 17.6 30 3.29 7.24 6.90 0.34
9 20 11.5 17.4 32 3.32 7.72 7.00 0.72
10 20 11.5 17.4 30 3.35 7.24 6.80 0.44
11 20 11.5 17.5 30 3.38 7.24 6.90 0.34
12 20 11.5 17.5 31 3.41 7.48 7.20 0.28
13 20 11.5 17.6 30 3.44 7.24 7.00 0.24
14 20 11.5 17.4 31 3.47 7.48 7.10 0.38
15 16 10 17.4 25 3.50 6.03 4.90 1.13
16 16 10 17.6 26 3.52 6.27 5.10 1.17
17 16 10 17.5 24 3.55 5.79 4.70 1.09
18 16 10 17.5 26 3.57 6.27 5.10 1.17
19 16 10 17.5 26 3.60 6.27 5.20 1.07
20 16 10 17.6 24 3.62 5.79 4.70 1.09
21 16 10 17.6 25 3.65 6.03 5.00 1.03
22 16 10 17.4 23 3.67 5.55 4.50 1.05
Total 0 0 13 0 151.78 118.50 33.28

APPENDIX I
79
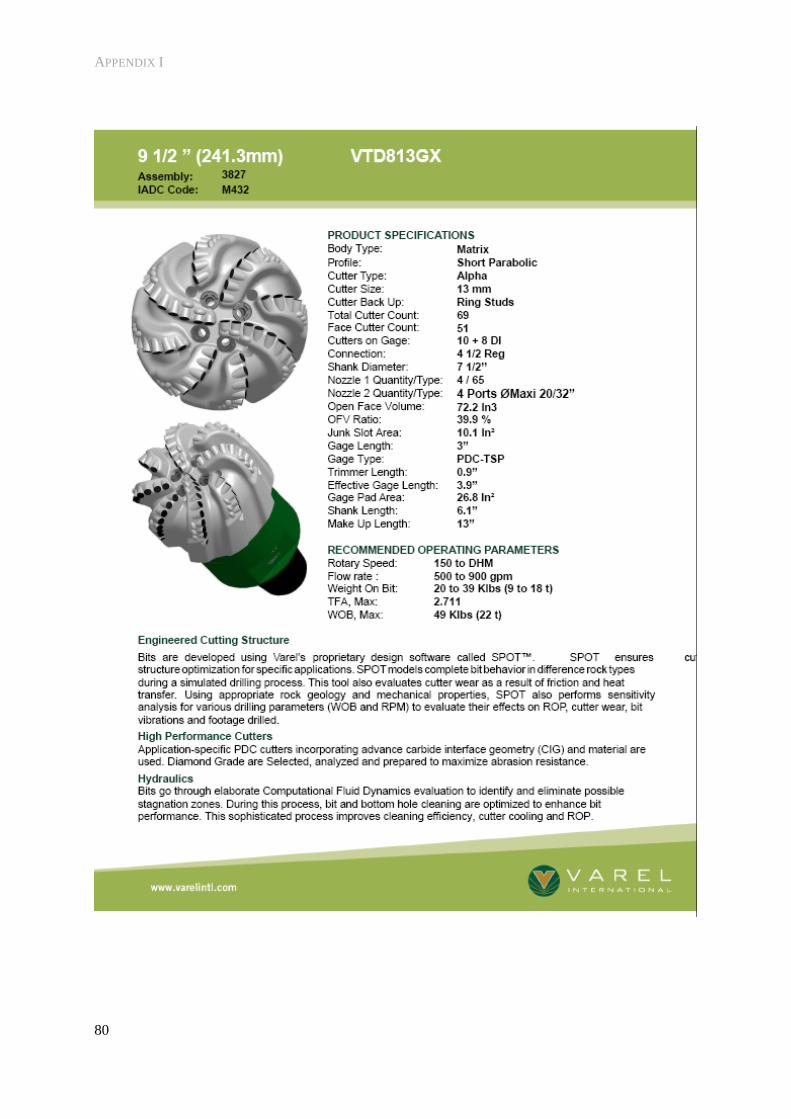
APPENDIX I
80
Copyright © 2022 FDOKUMEN

