


Bahasa
Halaman
Hukum

Hawassa University
College of Business and Economics
School of Management and Accounting
Influence of service quality on customers’ satisfaction and loyalty:
The case of Commercial Bank of Ethiopia, Shashemene District
By:
Melaku Yilma (PGMKW/016/04)
A Research Project
Submitted in Partial Fulfillment of the Requirements for the Master of Business Administration in
Marketing Management
Advisor: Dr. Aravind Soudikar
Co-Advisor: Mr. Mesay Sata
June, 2013
2
Approval sheet
Hawassa University School of Graduate Studies
Project Title: Influence of quality service on customers satisfaction and loyalty:
The case of Commercial Bank of Ethiopia, Shashemene District
By:
Melaku Yilma
College of Business and Economics
School of Management and Accounting
Postgraduate Program
Approved by:
Dr. Aravind Soudikar Advisor ________________________ Signature
Mr. Mesay Sata Co-advisor ________________________
Signature
Examiner ________________________
Signature
3
Declaration I, the undersigned, declare that this research paper is my original work and that all sources of the
materials in the research paper have been duly acknowledged. The matter embodied in this
project work has not been submitted earlier for award of any degree or diploma to the best of my
knowledge and belief.
Name: Melaku Yilma
Signature
Date: June13, 2013
This research has been submitted for examination with my approval as a university advisor.
Name of Advisor: Dr. Aravind Soudikar
Signature: _____________________________________
Date: _________________________________________
Name of Co-advisor: Mr. Mesay Sata
Signature: _____________________________________
Date: _____________________________________
Melaku Yilma
4
Hawassa University
College of Business and Economics
School of Management and Accounting
CERTIFICATE
We, hereby certify that Mr. Melaku Yilma, student of Masters of Business Administration at
Hawassa University, College of Business and Economics, School of Management and
Accounting, Hawassa has completed his research project on “Influence of quality service on
customers satisfaction and loyalty: The case of Commercial Bank of Ethiopia, Shashemene
district ”, under our advice, guidance and supervision.
Signature: Signature:
Name of Advisor: Dr. Aravind Soudikar Name of Co-Advisor: Mr. Mesay Sata
Place: Hawassa
Date:
5
Biographical Sketch
The author was born on November 29, 1974 G/C in Endeto kebel, Arssi robie woreda, Arssi. He
started his education at Endeto elementary school and learned until 4th grade and went to
Shashemene Catholic elementary school completed his elementary education in 1983. He learned
Junior and high school education at Abiot Chora junior school and Shashemene comprehensive
high school respectively from 1984 to 1986 and 1987 to 1990. Regarding his higher education he
joined Hawassa college of Agriculture from 1993 to 1994 E/C and undergraduated in Diploma in
Agricultural Engineering and Technology then he joined Ethiopia Adventist College from 2003
to 2006 and graduated in B.A in Business Administration majoring Management. He joined for
the second time Ethiopia Adventist College from 2007to 2008 and graduated in B.A in Business
Administration majoring Accounting. After graduation he was employed at Harar Brewery Share
Company as Sales Branch Head Accountant at Shashemene sales branch and worked from
January 25, 2001 until January16, 2004E.C. His interest was pushing education further and he
joined Hawassa University post graduate school to specialize in MBA in Marketing
management since 2004 E/C.
6
Acknowledgements
This Project wouldn’t have been completed without the help of Almighty God. First and for
most, my heartily thanks go to Almighty Father, God for his graciously provision of knowledge,
wisdom, inspiration and diligence required for the successful completion of this paper and for
bringing my dreams into reality.
I like to express my heart-felt thanks and sincere appreciation to my Senior Advisor Dr. Aravind
Soudikar for this all-round help, guidance, valuable comments and encouragement which
enabled me to complete the research work and project write up. I am also deeply indebted to
Mr. Measay Sata, my Co-advisor, for his useful and valuable comments and kind treatment
starting from the early design of the Project to the final write up of it.
My especially thanks goes to Dr. Mekonin Kurabachew, for his generous support and follow up
and valuable advise until the completion of the research.
A great thank and special gratitude is addressed to CBE, Shashemene District manager, Branch
managers of Shashemene, Harufa, Arsinegelle, Adjie and Kofelle, staffs and bank customers
because they gave me a great opportunity and cooperation to conduct my research.
Finally, I would like to extend my love and respect to my Grand mother, W/o Abaynesh Lema,
and my friend, Ato Belete Aseffa, Yesuf Ali and Ato Birhanu Shano; who are role models to my
life and who showed me love.
7
Table of Contents Title Page No. Approval sheet --------------------------------------------------------------------------------------------- II
Declaration ------------------------------------------------------------------------------------------------ iii
Certification ----------------------------------------------------------------------------------------------- iv
Biographical sketch --------------------------------------------------------------------------------------- v
Acknowledgements--------------------------------------------------------------------------------------- vi
Table of contents ----------------------------------------------------------------------------------------- vii
List of tables ---------------------------------------------------------------------------------------------- xi
List of figures --------------------------------------------------------------------------------------------- xii
Acronym and abbreviation --------------------------------------------------------------------------- xiii
Abstract --------------------------------------------------------------------------------------------------- xiv
CHAPTER ONE: INTRODUCTION
1.1. Back ground of the study ----------------------------------------------------------------------------- 1
1.2. Statement of the problem-- --------------------------------------------------------------------------- 3
1.3. Objectives of the study area----------------------------------------------------------------------------4
1.3.1 General objective --------------------------------------------------------------------4
1.3.2. Specific objectives-------------------------------------------------------------------5
1.4. Research questions ------------------------------------------------------------------------------------ 5
1.5. Research hypothesis ----------------------------------------------------------------------------------- 5
1.6. Significance of the study ----------------------------------------------------------------------------- 6
1.7. Scope of the study ------------------------------------------------------------------------------------- 7
1.8. Limitation of the study -------------------------------------------------------------------------------- 7
1.9. Organization of the project --------------------------------------------------------------------------- 7
CHAPTER TWO: LITERATURE REVIEW
2.1. Introduction ------------------------------------------------------------------------------------------- 8
2.2. Commercial bank -------------------------------------------------------------------------------------- 8
2.3. Commercial bank in ethiopia------------------------------------------------------------------------- 8
2.4. Services rendered by commercial bank of Ethiopia --------------------------------------------- 9
8
2.5. Definition of customer services --------------------------------------------------------------------- 9
2.5.1. Characteristics of services --------------------------------------------------------------- 10
2.6. Services quality --------------------------------------------------------------------------------------- 12
2.7. Services quality dimensions ------------------------------------------------------------------------- 15
2.8. Customer satisfaction -------------------------------------------------------------------------------- 17
2.8.1. Customer satisfaction measures --------------------------------------------------------- 19
2.9. Customer loyalty ------------------------------------------------------------------------------------- 19
2.10. Relationship between services quality and customer satisfaction ----------------------------- 20
2.11. Relationship between customer satisfaction and customer loyalty ---------------------------- 21
2.12. Service quality model ------------------------------------------------------------------------------ 23
2.13. Servqual ---------------------------------------------------------------------------------------------- 25
2.14. Serperf ------------------------------------------------------------------------------------------------ 26
2.15. Bankserv --------------------------------------------------------------------------------------------- 27
2.16. Review of some previous studies ----------------------------------------------------------------- 29
2.17. Conceptual gaps in literature ---------------------------------------------------------------------- 31
2.18. Conceptual framework ----------------------------------------------------------------------------- 31
CHAPTER THREE: RESEARCH DESIGN AND METHODOLOGY
3.1. Introduction ------------------------------------------------------------------------------------------ 33
3.1.1. Description of study area----------------------------------------------------------33
3.1. 2. Research design--------------------------------------------------------------------35
3.1.3. Sample size and sampling technique ------------------------------------------- 35
3.2. Method of data collection, sources and research instruments ----------------------------------- 37
3.2.1. Method and tools of data collection -------------------------------------------- 37
3.2.2. Sources of data and type --------------------------------------------------------- 38
3.2.3. Description of variable ------------------------------------------------------------39
3.2.3. Questionnaire --------------------------------------------------------------------- 39
3.3. Reliability and validity analysis of bankserv dimensions ---------------------------------------- 40
3.4. Testing of the questionnaire ------------------------------------------------------------------------ 41
3.5. Method of data analysis ------------------------------------------------------------------------------ 42
9
3.6. Ethical considerations -------------------------------------------------------------------------------- 43
CHAPTER FOUR: DATA ANALYSIS AND INTERPRETATION
4.1. Introduction ------------------------------------------------------------------------------------------ 45
4.2. Data analysis ----------------------------------------------------------------------------------------- 45
4.2.1. Background information of respondents ----------------------------------------------- 45
4.2.2. Demographic characteristics of the respondents -------------------------------------- 46
4.2.3. Descriptive statistics analysis ------------------------------------------------------------ 49
4.2.3.1. Analysis of quality dimension items ----------------------------------------- 49
4.2.3.2. Summary of service quality dimension items ------------------------------- 58
4.2.3.3. Analysis of customer satisfaction items ------------------------------------- 59
4.2.3.4. Summary of customer satisfaction items ------------------------------------ 61
4.2.3.5. Analysis of customer loyalty items ------------------------------------------- 62
4.2.3.6. Summary of customer loyalty items------------------------------------------ 64
4.2.4. Pearson correlation analysis ------------------------------------------------------------- 65
4.2.5. Multiple regression analysis ------------------------------------------------------------- 66
4.2.6. Discussion of interpretations ----------------------------------------------------------- 70
4.2.6.1. Descriptive statistics and correlation analysis ----------------------------- 70
4.2.6.2. Regressing customer satisfaction ------------------------------------------- 72
4.2.6.3. Regressing customer loyalty ------------------------------------------------- 73
CHAPTER FIVE: SUMMARY,CONCLUSIONS AND RECOMMENDATIONS
5.1. Introduction ------------------------------------------------------------------------------------------ 74
5.2. Summary of the findings ---------------------------------------------------------------------------- 74
5.3. Conclusions ------------------------------------------------------------------------------------------- 75
5.4. Recommendations/suggestions --------------------------------------------------------------------- 77
5.5. Implication for future research ---------------------------------------------------------------------- 79
REFERENCES ---------------------------------------------------------------------------------------------81
APPENDIXES: Appendix A: Data analysis out put---------------------------------------------------------------91
Appendix B: Survey questionnaires------------------------------------------------------------100
10
List of Tables Title Page No.
Table 3.1: List of Banks under CBE, Shashemene district--------------------------------------------34
Table 3.2: Lists of sample Banks selected by Lottery method----------------------------------------35
Table 3.3: Lists of selected Banks and sample appropriation-----------------------------------------37
Table 3.4: Result of reliability analysis for the questionnaire-----------------------------------------41
Table 4.1: Characteristics of the respondents -----------------------------------------------------------46
Table 4.2: Frequency, percent, mean and standard deviation score for Staff conduct item-------49
Table 4.3: Frequency, percent, mean and standard deviation score for Staff conduct item-------49
Table 4.4: Frequency, percent, mean and standard deviation score for Staff conduct item-------50
Table 4.5: Frequency, percent, mean and standard deviation score for Staff conduct item-------50
Table 4.6: Frequency, percent, mean and standard deviation score for Staff conduct item-------51
Table 4.7: Frequency, percent, mean and standard deviation score for Staff conduct item-------51
Table 4.8: Frequency, percent, mean and standard deviation score for Staff conduct item-------52
Table 4.9: Frequency, percent, mean and standard deviation score for Credibility item----------52
Table 4.10: Frequency, percent, mean and standard deviation score for Credibility item --------53
Table 4.11: Frequency, percent, mean and standard deviation score for Credibility item---------53
Table 4.12: Frequency, percent, mean and standard deviation score for Communication item---54
Table 4.13: Frequency, percent, mean and standard deviation score for Communication item---54
Table 4.14: Frequency, percent, mean and standard deviation score for Communication item---55
Table 4.15: Frequency, percent, mean and standard deviation score for Communication item---55
Table 4.16: Frequency, percent, mean and standard deviation score for Communication item---56
Table 4.17: Frequency, percent, mean and standard deviation score for ATS item ----------------56
Table 4.18: Frequency, percent, mean and standard deviation score for ATS item ----------------57
Table 4.19: Summary of Service Quality dimensions --------------------------------------------------58
11
Table 4.20: Frequency, percent, mean and standard deviation score for Satisfaction item--------59
Table 4.21: Frequency, percent, mean and standard deviation score for Satisfaction item--------59
Table 4.22: Frequency, percent, mean and standard deviation score for Satisfaction item--------60
Table 4.23: Frequency, percent, mean and standard deviation score for Satisfaction item--------60
Table 4.24: Frequency, percent, mean and standard deviation score for Satisfaction item--------61
Table 4.25: Summary of mean and standard deviation score customer satisfaction items---------61
Table 4.26: Frequency, percent, mean and standard deviation score for loyalty item--------------62
Table 4.27: Frequency, percent, mean and standard deviation score for loyalty item--------------62
Table 4.28: Frequency, percent, mean and standard deviation score for loyalty item--------------63
Table 4.29: Frequency, percent, mean and standard deviation score for loyalty item--------------63
Table 4.30: Summary of mean and standard deviation score customer loyalty items--------------64
Table 4.31: Correlations results of service quality dimensions and customer satisfaction --------65
Table 4.32: Regression results of each service quality dimensions and customer satisfaction----67
Table 4.33: Regression results of customer satisfaction and loyalty----------------------------------69
12
List of Figures
Title Page No.
Figure 2.1: A conceptual model of service quality------------------------------------------------------24
Figure 2.2: Service quality, customer satisfaction, and loyalty model -------------------------------32
13
Abbreviation and Acronym
ATS: Access to tellers services
BANKSERV: Bank Service
CBE: Commercial Bank of Ethiopia
CLQ: Customer Loyalty Questionnaire
CSQ: Customer Satisfaction Questionnaire
SERVPERF: Service Performance
SERVQUAL: Service Quality
SPSS: Statistical Package for Social Sciences
SQQ: Service Quality Questionnaire
14
Abstract
The main objective of the study was to investigate the influence of quality service on customers’
satisfaction and loyalty in five selected branch banks found under CBE, Shashemene district.
Since, BANKSERV model was especially developed to examine the services quality of banking
sector; researchers selected this model to extensively test retail banking industry. The current
study measured customer services quality and its relation with customer satisfaction and loyalty
in the selected branch banks. Survey method used as the research method of the study. The
sample consists of 398 respondents selected based on convenience sampling procedure. The
dimensions of the study were staff conduct, credibility, communication and access to teller
services. Study data were collected using self administered questionnaire and the questionnaire
consisted of 17 items categorized under four dimensions of the BANKSERV model. Correlation
and multiple regressions were used to investigate the relationship between dependent and
independent variables. The correlation results indicate that there is a positive correlation
between the dimensions of service quality and customer satisfaction. The results of the
regression test showed that offering quality service have positive impact on overall customer
satisfaction. The research proves that staffs conduct and communication plays the most
important role in customer satisfaction level followed by access to teller service and finally the
bank credibility. The research findings also indicate offering high quality service increase
customer satisfaction, which in turn leads to high level of customer commitment and loyalty.
Key words: Staff conduct, credibility, communication, access to tellers services, customer
satisfaction, loyalty, BANKSERV model.
15
CHAPTER ONE
INTRODUCTION
This chapter consists of background of the study, statement of the problem, research hypotheses,
general and specifics objective of the study, significance of the study, scope of the study,
limitation of the study and organization of the paper.
1.1. Background of the study
The government of Ethiopia has launched economic reforms, financial liberalization measures
and restructuring of financial institutions with the aim of promoting a competitive environment
and efficient banking services to the public. The financial sector, with implementation of flexible
interest and exchange rates that are market-lead, shows sign of improvement. In addition, the
coming in to effect of the Licensing and Supervising Banking and Business Proclamation No.
84/1994 propels the mergence of many private banks in the market since 1994 (Kiyota et.al,
2007). This joined by rapid technological advancement and improved communication systems,
has contributed to the increasing integration and resemblance amongst banks in the financial
sector. As a result, banks are now faced with very high and intense competition amongst them
(Harvey, 2010).
Hence, in order to win this intense competition and maintain their market share of the bank
industry; they must give attention to the existing and potential customers need, want and
preferences to maximize their satisfaction and loyalty plus to that they must make continues
customer service quality improvement program. Since the importance of making continuous
customer service quality improvement program is to make profit, build good images, lead the
market, and retain customers which lead customer loyalty.
16
In this context, the subject of service quality in relation to customer satisfaction and loyalty
needs a fresh understanding in the current business scenario. Service quality is particularly
essential in the banking services context because it provides high level of customer
satisfaction and wins customer loyalty, for this reason it becomes a key to competitive
advantage (Ahmossawi, 2001).
Customer satisfaction is also crucial in the banking sector because of the special nature of
the service which is characterized by intensive contact with customers who have different
needs and require customized solutions and it is known to be one of the most important
and serious issues towards success in today’s competitive business environment, as it
affects company market shares and customer loyalty (Clemes, 2008).
Similarly, service loyalty is one of the most important structures in service marketing, due to its
final effect on customers’ repeated purchases, and in fact, those loyal customers who purchase
repeatedly are considered as the base of any business (Mohsan, 2011). Although these concepts
have been used so many times in the marketing literature, but the relations between these three
concepts still remain ambiguous and this calls for investigation to find the relation of these three
concepts.
Avkiran (1994) developed a utilitarian multi-dimensional model BANKSERV to measure
Australian retail banking customers’ service quality perceptions. It is a model, designed to allow
customers to reflect on their expectations and perceptions in single statements. This avoids the
potential psychometric problems related with SERVQUAL and the negatively worded
questionnaire items found in the model (Avkiran, 1999). In order to customize the instrument for
banking, He used Parasuraman et al. (1988) SERVQUAL scale as the starting point, and then
17
refine the measurement by adding items extracted from a separately conducted qualitative study
about bank service quality.
This study, therefore, investigated the effect of customer service quality on customer
satisfaction and loyalty using BANKSERV model in selected banks of CBE, Shashemene
district.
1.2. Statement of the Problem
Banks operating in Ethiopia are facing lots of challenges due to increase in competition amongst
them. As a result various strategies are formulated to retain the customer and increasing the
service quality level has been considered key success factor. Service quality is particularly
essential in the banking services context because it provides high level of customer
satisfaction, and hence it becomes a key to competitive advantage (Ahmossawi,2001).
At the present time, service quality has received much attention because of its obvious
relationship with costs, financial performance, customer satisfaction, and customer loyalty.
Since customer satisfaction is also based upon the level of service quality provided by the
service provider and service quality acts as a determinant of customer satisfaction (Wilson
et al., 2008).
On the relationship between customer satisfaction, service quality and service loyalty in Tehran
banks conducted by Mosahab et.al. (2010) concluded that nearly 43 percent of customer’s
satisfaction change is explained by service quality. On the other hand, service quality has a direct
relation with loyalty, and nearly 45 percent of loyalty changes can be explained by service
quality changes. Another point is that if the satisfaction variable enters the model, the resulted
determination index will be higher in figure than other cases (0.803). This figure means that
18
nearly 80 percent of loyalty changes can be explained by satisfaction and service quality,
although satisfaction plays a more important role in this relation.
This study focuses merely on service quality with out considering above mentioned factors like
cost, financial performance and others. Because service quality has been proven to be the best
determinant of customer satisfaction and indirectly customer loyalty when it comes to
service sectors Daniel et al (2012). Unsatisfactory service leads to a drop in customer
satisfaction, loyalty and willingness to recommend the service to a friend. This would in turn
lead to an increase the number of customers shifts to competitors.
1.3. Objectives of the study area
1.3.1. General Objective
The general objective of the study is to assess the influence of quality service on
customer satisfaction and loyalty of commercial bank of Ethiopia (CBE), Shashemene
district.
1.3.2. Specific Objectives
This study, specifically will seeks to achieve the following objectives:-
1. To identify the factors that affect the client satisfaction;
2. To discover the relationship between quality services and customer satisfaction
of CBE, Shashemene District;
3. To spot the relationship between customer satisfaction and customer loyalty of
CBE, Shashemene District;
4. To offer some suggestions for the improvement of services of CBE Shashemene
district;
19
1.4. Research Questions
The study will attempt to answer the following basic questions:
1. What are the factors that affect customer satisfaction?
2. Is there a relationship between customer satisfaction and the service quality?
3. Is there a relationship between customer loyalty and the customer satisfaction?
4. What are the service quality dimensions that are needed to be improved?
1.5. Research Hypothesis
In light of the objectives expressed above, the following hypotheses were investigated:
Hypothesis 1
Ho1:There is a relationship between service quality dimensions and customer
satisfaction in banking services.
Hypothesis 2
Ho2: There is a relationship between overall service quality and customer satisfaction in
banking services.
Hypothesis 3
Ho3: There is a relationship between customer satisfactions and loyalty in banking
services.
1.6. Significance of the study
The ultimate success or failure of a company depends on its ability to make profitable
sell, what it produces and continuously offering quality services relatively for a longer period.
This study is therefore intended to help the company management to direct their attention
to this highly essential function of business.
20
The finding of this study has also the following importance:-
It will help banks to understand the role of good customer service on customer
satisfaction.
It provides literature for the bank industry under customer service quality.
It helps to other researchers who want to conduct further study on the subject in the
future.
It provides solution for bank industry service quality problems and it may give
them an idea of where they are presently in terms of their service quality and what they
should do in the future.
1.7. Scope of the Study
The study was limited to topic of the Influence of service quality on customers satisfaction
and loyalty was conducted in five branch banks of CBE, Shashemene District, and was only
focus on sampled branch banks found in Oromia region. In addition, this study did not include
non sampled branches of CBE, Shashemene district and other private banks and the time before
and after study schedule was not included in the area of study.
1.8. Limitations of the study
The main limitations of this study are constraints of resources, access to relevant data, and time.
The financial and material resources needed for a larger sample size for the study was not
available. Language is another limitation to data collection as it is difficult translating some
questions and statements into the local language perfectly. This study is also constrained by time.
It is conducted within very limited academic time frame. BANKSERV model which did not
include empathy as service quality dimension can be seen as a limitation.
21
1.9. Organization of the Chapter
The study was organized into five chapters: Chapter one presents introduction, Chapter two
discusses literature review related to the research. This is followed by the discussion of the
research methodology that was used in the proposal in chapter three. Chapters four consisted of
analysis and interpretations and chapter five comprised of conclusions and recommendation.
22
CHAPTER TWO
LITERATURE REVIEW
2.1. Introduction
This chapter gives an overview of literature that is related to the research problem
presented in the previous chapter. The concept of commercial bank, service characteristics,
service quality, customer satisfaction, customer loyalty, relation between customer
satisfaction and service quality, and service quality model will be introduced in order to give a
clear idea about the research area.
2.2. Commercial Bank
Commercial bank is an institution which accepts, deposits money, makes business loans, and
offers related services. It also allow for a variety of deposit accounts, such as checking, saving,
and time deposit. This institution is run to make a profit and owned by a group of individuals, yet
some may be members of the Federal Reserve System. While Commercial banks offer service to
individuals, they are primarily concerned with receiving deposits (www.investopedia.com).
2.3. Commercial Bank of Ethiopia
Commercial Bank of Ethiopia was incorporated as a share company on December 16, 1963 per
proclamation number 207-1955 to take over the commercial banking activities of the former
state Bank of Ethiopia. Under this name, it began operation on January 1, 1964, with a capital of
Ethiopian Birr 20,000,000 and served for about 16 years. The bank was wholly owned by the
state and operated as an autonomous institution under the commercial code of Ethiopia under the
socialist regime in Ethiopia (1974-1991).
23
The Commercial Bank of Ethiopia Share Company and Addis Bank had identical objectives
power and duties. Hence, the socialist regime saw it necessary to merge them in order to
eliminate the duplication of efforts and bring them under a centralized banking structure;
consequently, the present day commercial Bank of Ethiopia was established under proclamation
No.184 of Augest2,1980 (Belay, 1987).
2.4. Services rendered by Commercial Bank of Ethiopia
Commercial Bank of Ethiopia provides three major services which comprises of Domestic
banking service, International banking service and recently E-payment services. Domestic
banking services consist of Deposit, Credit and Local transfer service, International banking
services consists of Trade service, Forex service and International money transfer using different
money transfer agencies and E-payment service also includes Internet Banking Service, ATM,
POS, Card Banking and Mobile Banking Service (www.cbe.com).
2.5. Definition of Customer Service
In recent years, more and more organizations focus their attention on retaining existing
customers rather than attracting new ones since losing a customer means losing more than a
single sale. It means losing the entire stream of purchases that the customer would make over a
life time of patronage. In addition, the cost of attracting a new customer is five times greater than
the cost of keeping a current customer happy Kotler (2010).
Many writers define ‘customer service’ in different ways: for instance, Catherine McGuinn
(2009) defined customer service as a philosophy that directs all practices of an organization to
serve the needs of customers in a manner that is mutually beneficial to all stakeholders and
involves the facilitation of customer satisfaction, loyalty and goodwill.
24
Kottler (2010) defined service as any activity or benefit that one party can offer to another that is
essentially intangible and does not result in the ownership of anything and its production may or
may not be tied to a physical product.
Any intangible actions that are performed by person or machines or both to create good
perception within users are called service. Although services are performed by service providers
and consumers together, its quality results in perception and value assessment by the customer
(Rao et. al., 2007).
2.5.1. Characteristics of Services
According to Bitner et al. (1993) service has four characteristics: intangibility, inseparability,
heterogeneity and perishability.
Intangibility of Services
Regan (1963) introduced the idea of services being activities, benefits or satisfactions which are
offered for sale or provided in connection with the sale of goods. The degree of
intangibility has been suggested as a means of differentiating tangible products with services.
Most of the time, services are explained as being intangible since their outcome is considered to
be an action rather than a physical product highlight the fact that the degree of tangibility has
implications for the ease with which consumers can evaluate services and products(Zeithmal
et al. 1985).
25
Inseparability of Services
Inseparability is taken to show the simultaneous delivery and consumption of services and it is
believed to enable consumers to affect or shape the performance and quality of the service
(Zeithmal et al. 1985).
Heterogeneity of Services
Heterogeneity reveals the degree of high variability in service delivery. This is a particular
problem for services with high labor involvement, as the service performance is delivered by
different people and the performance of people can vary from day to day and also from
person to person. Besides, it offers the opportunity to provide high degree of flexibility and
customization of the service and this can be used as a benefit and point of differentiation
(Wolak et al., 1998).
Perishability of Services
The notion of perishability reflects services cannot be stored and carried forward to a future
time period and suggest that services are time dependent and time important which make them
very perishable. The issue of perish ability is primarily the concern of the service producer and
that the consumer only becomes aware of the issue when there is insufficient supply and
they have to wait for the service Bitner et al. (1993).
2.6. Service Quality
In today’s increasingly competitive business environment, service quality is essential for the
success of any organization. Service quality is important aspect that affects the competitiveness
of business. Banks should always increase the quality of service continuously since there is no
26
assurance that the current outstanding service will be suitable for future. Thus, banks
should develop new strategy to satisfy their customer and should provide quality service to gain
competitive advantage over competitors (Siddiqi, 2011).
Service quality is considered an important tool for a firm’s struggle to differentiate itself from its
competitors (Ladhari, 2009). The relevance of service quality to companies is emphasized
especially the fact that it offers a competitive advantage to companies that strive to improve it
and hence bring customer satisfaction.
The challenge in defining service quality is that it is a subjective concept, like beauty. Everyone
has a different definition based on their personal experiences. It has also received a great deal of
attention from academicians, practitioners and services marketing literature, service quality is
defined as the overall assessment of a service by the customer. Researcher points out that, by
defining service quality, companies will be able to deliver services with higher quality level
presumably resulting in increased customer satisfaction. Understanding service quality must
involve acknowledging the characteristics of service which are intangibility, heterogeneity and
inseparability. In that way, service quality would be easily measured (Negi et al., 2009).
Crosby (1984) defined quality as conformance to requirements. This definition implies that
organizations must establish requirements and specifications. Once these requirements and
specifications are established, the quality goal of the various functions of an organization
is to comply strictly with them. Quality also defined from different point of views, from
customer point of view quality means fitness for use and meeting customer satisfaction and from
process point of view it means conformance with the process design, standards and
specifications. Quality may also be defined as the degree of excellence at an acceptable price
27
from product point of view and from the cost point of view it means best combination between
costs and features.
A solid foundation in defining and measuring service quality was emanated in the mid
eighties by Gronroos (1984) and Parasuraman et al. (1985). They were amongst the
earliest scholars laid down the foundation for the definitions as well as development of
service quality. Service quality defined as the degree and direction of discrepancy between
consumer’s perceptions and expectations in terms of different but relatively important
dimensions of the service quality, which can affect their future purchasing behavior. This
definition clearly shows that service quality is what customers’ assess through their
expectations and perceptions of a service experience. Customers’ perceptions of service quality
result from a comparison of their before-service expectations with their actual service
experience. Service quality is based on a comparison between what the customer feels should be
offered and what is provided (Parasuraman et al. 1985).
If the customer’s expectations are meeting or exceeded, then the company is perceived to
be offering higher service quality. But if on the other hand, if the expectations of the customers
are not meet, the company is on its way not only to face displeased and hostile customers, which
in turn leads to defection to competitors. Customer’s expectation serves as a foundation for
evaluating service quality because, quality is high when performance exceeds expectation
and quality is low when performance does not meet their expectation. Expectation is
viewed in service quality literature as desires or wants of consumer that is , what they feel a
service provider should offer rather than would offer (Parasuraman et al., 1988).
28
Perceived service is the outcome of the consumer’s view of the service dimensions, which are
both technical and functional in nature (Gronroos, 1984). Parasuraman et al, (1988) define
perceived quality as a form of attitude, related but not equal to satisfaction, and results
from a consumption of expectations with perceptions of performance. Therefore, having a
better understanding of consumers attitudes will help to know how they perceive service quality
in banks and respond accordingly.
The service process as well as the service outcome will contribute quality evaluations. As stated
by (Gronroos, 1982) there are two types of service quality these are technical quality and
functional quality. Technical quality is what the customer is actually receiving from the service
(outcome) while functional quality is the manner in which the service is delivered (process).
It is likely to be much more effective to tell a service contact employee what specific attributes
service quality includes, such as responsiveness. Management can say, if we can improve our
responsiveness, quality will increase” (Asubonteng et al; 1996).
2.7. Service quality dimensions
Service’s exclusive characteristics of intangibility, heterogeneity, and inseparability lead them to
possess high levels of experience and credence properties, as a result, they became difficult to
evaluate as we did in tangible goods. Hence, recognition of the determinants of service quality is
necessary in order to specify, measure, control and improve customer perceived service
quality (Johnston,1995).
The BANKSERV instrument, developed by Avkiran (1994), was adapted from SERVQUAL to
specifically suit the Australian banking industry. It is an instrument, designed to allow customers
to reflect on their expectations and perceptions in single statements. It avoids the potential
29
psychometric problems associated with SERVQUAL and the negatively worded questionnaire
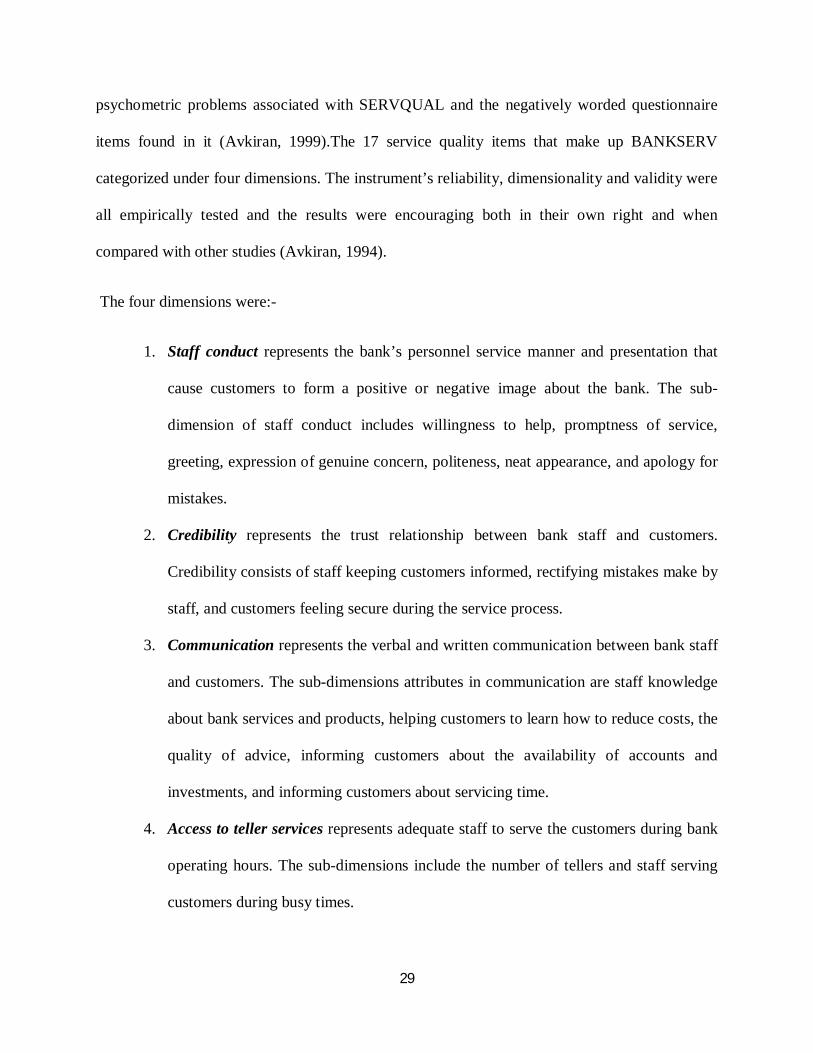
items found in it (Avkiran, 1999).The 17 service quality items that make up BANKSERV
categorized under four dimensions. The instrument’s reliability, dimensionality and validity were
all empirically tested and the results were encouraging both in their own right and when
compared with other studies (Avkiran, 1994).
The four dimensions were:-
1. Staff conduct represents the bank’s personnel service manner and presentation that
cause customers to form a positive or negative image about the bank. The sub-
dimension of staff conduct includes willingness to help, promptness of service,
greeting, expression of genuine concern, politeness, neat appearance, and apology for
mistakes.
2. Credibility represents the trust relationship between bank staff and customers.
Credibility consists of staff keeping customers informed, rectifying mistakes make by
staff, and customers feeling secure during the service process.
3. Communication represents the verbal and written communication between bank staff
and customers. The sub-dimensions attributes in communication are staff knowledge
about bank services and products, helping customers to learn how to reduce costs, the
quality of advice, informing customers about the availability of accounts and
investments, and informing customers about servicing time.
4. Access to teller services represents adequate staff to serve the customers during bank
operating hours. The sub-dimensions include the number of tellers and staff serving
customers during busy times.
30
2.8. Customer satisfaction
Customer satisfaction is a post-purchase evaluation of a service offering. A traditional definition
of customer satisfaction followed the disconfirmation paradigm of consumer
satisfaction/dissatisfaction (CS/D), suggesting that CS/D is the result of interaction between the
consumer’s pre-purchase expectations and post purchase evaluation.
According to Rigopoulou, et al. (2008) customer satisfaction is the state of mind that customers
have about a company when their expectations have been met or exceeded over the lifetime of
the product or service. Service companies have since recently focused on customers in
order to improve competitiveness. Customer satisfaction is one of the important outcomes of
marketing activity.
In the competitive banking industry, customer satisfaction is considered as the fundamental of
success. Satisfying customers is one of the main objectives of every business. Businesses
recognize that keeping current customers is more profitable than having to win new ones
to replace those lost since it cost the company a lot of money. Management and marketing
theorists emphasize the importance of customer satisfaction for a business’s success (Kennedy
and Schneider, 2000).
Good customer satisfaction has an effect on the profitability of nearly every business. For
example, when customers receive good service, each will typically tell nine to ten people.
However, customers who receive poor service will typically relate their dissatisfaction to
between fifteen and twenty others Naik et al. (2010). Therefore, customer satisfaction is an
asset that should be monitored and managed just like any physical asset.
31
The satisfaction judgment is related to all the experiences made with a certain business
concerning its given products, the sales process, and the after- sale service. Whether the
customer is satisfied after purchase also depends on the offer’s performance in relation to the
customer’s expectation. Customers form their expectation from past buying experience, friends’
and associates’ advice, and marketers’ and competitors’ information and promises (Kotler;
2010).
Higher customer satisfaction leads to greater customer loyalty which in turn leads to
higher future revenue. As a result, many market leaders are found to be highly superior-
customer-service orientated. They have been rewarded with high revenue and customer retention
as well. For that reason, organizations in the same market sector are forced to assess the quality
of the services that they provide in order to attract and retain their customers. Because
satisfied customers are a key to long-term business success (Zeithaml et al., 1996).
Customer satisfaction is consumer's fulfillment response. It is a judgment that a product or
service feature, or the product or service itself, provided (or is providing) a pleasurable level of
consumption-related fulfillment, including levels of under- or over fulfillment (Oliver, 1997)
2.8.1. Customer satisfaction measures
Customer satisfaction measurement involves the collection of data that provides
information about how satisfied or dissatisfied customers are with a service. This information
can be collected and analyzed in many different ways. Many organizations regularly check the
levels of customer satisfaction to monitor performance over time and measure the impact of
service improvement.
32
Henley center headlight vision (Anon., 2007) states the research carried out in the UK with
public sector organizations suggests that there are five themes that are likely to be
relevant to all organizations in measuring customer satisfaction.
Delivery of the service (how problems were handled, reliability, outcome.)
Timeliness (waiting times, number of times contacted)
Information (accuracy, enough information, kept informed)
Professionalism (competent staff, fair treatment)
Staff attitude (friendly, polite, sympathetic)
2.9. Customer loyalty
Customer loyalties is a deeply held commitment to rebuy or repatronize a preferred product or
service consistently in the future, thereby causing repetitive purchasing of the same brand,
despite situational influences and marketing efforts. It can also be defined as the degree to which
a customer exhibits repeat purchasing behavior from a service provider, possesses a positive
attitudinal disposition toward the provider, and considers using this provider when a need for
this service arises. Loyalty is therefore an attitude or behavior that customers explicitly repeat
or exhibit (Seyed, 2007).
Loyalty has both behavioral and attitudinal dimensions. The behavioral dimension consists of
repeated purchase of product while attitudinal loyalty refers to attitudinal commitment or
favorable attitude toward a product resulting in repeat purchasing behavior. It is an
influenced purchase response resulting from an evaluative attitude favoring the purchase.
Loyalty is thus, viewed as the customer’s demonstration of faithful obedience to an organization
despite the occasional error or indifferent services (Daniel, 2012).
33
In addition, Loyalty in service businesses refers to the customer’s commitment to do business
with a particular organization, purchasing their products repeatedly and recommending others to
the organization’s products. Christopher L. and, Jochen W. (2006) ascertain that customer
loyalty is actually the result of an organization creating a benefit for customer so that they will
maintain or increase their purchases from the organization. They indicate that true loyalty is
created when the customer becomes an advocate for the organization without incentives.
2.10. Relationship between Service Quality and Customer Satisfaction
Kotler and Armstrong (2012) preach that satisfaction is the pos-purchase evaluation of
products or services taking into consideration the expectations. Researchers are divided over
the antecedents of service quality and satisfaction. Whilst some believe service quality leads to
satisfaction, others think otherwise. The studies of many researchers suggest service quality leads
to customer satisfaction. To achieve a high level of customer satisfaction, they suggest that a
high level of service quality should be delivered by the service provider as service quality is
normally considered an antecedent of customer satisfaction (Mesay, 2012).
As service quality improves, the probability of customer satisfaction increases. Quality was only
one of many dimensions on which satisfaction was based; satisfaction was also one potential
influence on future quality perceptions (Clemes, 2008).
Parasuraman et al (1988) defined service quality and customer satisfaction as follows: Service
quality is a global judgment, or attitude, relating to the superiority of the service, whereas
satisfaction is related to a specific transaction. Satisfaction is a post consumption experience
which compares perceived quality with expected quality, whereas, service quality refers to
a global evaluation of a firm's service delivery system” (Parasuraman et al., 1985).
34
Siddiqi (2011) described that all the service quality attributes are positively related to
customer satisfaction and customer satisfaction is positively related to customer loyalty in
the retail banking settings. Furthermore, Daniel O. Auka (2012) also stated that high quality of
service will result in high customer satisfaction and increase loyalty.
2.11. Relationship between Customer Satisfaction and Loyalty
Both the service management and the marketing literatures suggest that there is a strong
theoretical foundation for an empirical exploration of the linkages between customer
satisfaction and customer loyalty. These literatures state that there is a strong and positive
relationship between customer satisfaction and loyalty. A satisfied customer is six times more
likely to repurchase a product and share his experience with five or six other people where as,
one unsatisfied customer can drive out more business from the organization than ten
highly satisfied customers do. With higher customer satisfaction the level of loyalty also
increases (Mohsan et.al. 2011).
Lin (2009) stated that customer satisfaction has measurable impact on customer loyalty in
that when satisfaction reaches a certain level; on the high side, loyalty increases considerably;
at the same time, when satisfaction falls to a certain point, loyalty reduces too. He
proposed that a link between satisfaction and loyalty can be classified into four different
groups:-
1. Loyalist/apostle (high satisfaction, high loyalty)
2. Defector/ terrorist (low satisfaction, low loyalty)
3. Mercenary (high satisfaction, low loyalty), and
4. Hostage (low satisfaction, high loyalty).
35
As Sudharshan (1995) indicated, there is a positive relationship between customer satisfaction
and customer loyalty but this connection is not always a linear relation. It depends on factors
such as market regulation, switching costs, and brand equity, existence of loyalty programs,
proprietary technology, and product differentiation at the industry level.
2.12. Service Quality Models
If we want to manage something, it should be measured first. Without measurement, managers
cannot be sure of whether service quality gaps exist or not and of course, measurement is needed
to determine whether goals for improvement are being met after changes have been implemented
(Christopher et al., 2006).
Measuring service quality has been one of the most persistent topics in management literature.
This is because the need to develop valid instruments for the systematic evaluation of firms’
performance from the customer point of view; and the association between perceived service
quality and other key organizational outcomes, which has led to the development of models for
measuring service quality Cronin et al., (2010).
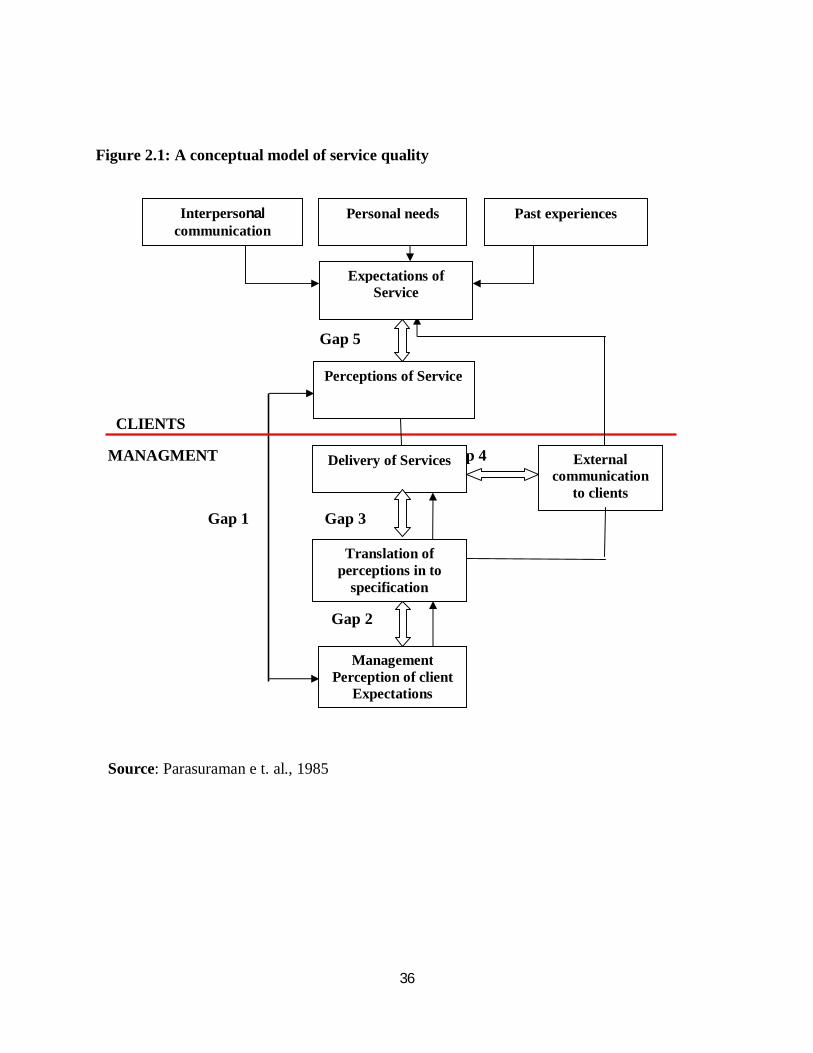
Parasuraman et al., 1985 developed a conceptual model of service quality where they identified
five gaps that could impact the consumer’s evaluation of service quality in four different
industries (retail banking, credit card, securities brokerage and product repair and maintenance).
These gaps were:-
1. Gap between Customer Expectation and Management Perception;
2. Gap between Management Perception and Service Quality Specification;
3. Gap between Service Quality Specification and Service Delivery;
4. Gap between Service Delivery and External Communication and
5. Gap between Perceived Service and Expected Service.
36
Figure 2.1: A conceptual model of service quality
Gap 5
CLIENTS
MANAGMENT Gap 4
Gap 1 Gap 3
Gap 2
Source: Parasuraman e t. al., 1985
Interpersonal communication
Expectations of Service
Perceptions of Service
Delivery of Services
Translation of perceptions in to
specification
Personal needs Past experiences
External communication
to clients
Management Perception of client
Expectations
37
2.13. SERVQUAL
For the purpose of measuring customer satisfaction with respect to different aspects of
service quality and to overcome problems which is created as a result of the gap between
management and customers, a survey instrument was developed by Parasuraman, Zeithmal
and Berry in 1988. The instrument is called SERVQUAL. The basic assumption of the
measurement was that customers can evaluate a firm’s service quality by comparing their
perception with their experience. It is designed to measure service quality as perceived by the
customer.
Based on the information from focus group interviews, Parasuraman et al. (1985)
identified basic dimensions that reflect service attributes used by consumers in evaluating the
quality of service provided by service businesses. Parasuraman et al., (1988) measured the
quality of services provided by retail banks, a long-distance telephone company, a
securities broker, an appliance repair and maintenance firm, and credit card companies. Based
on this study, ten key determinants of service quality identified.
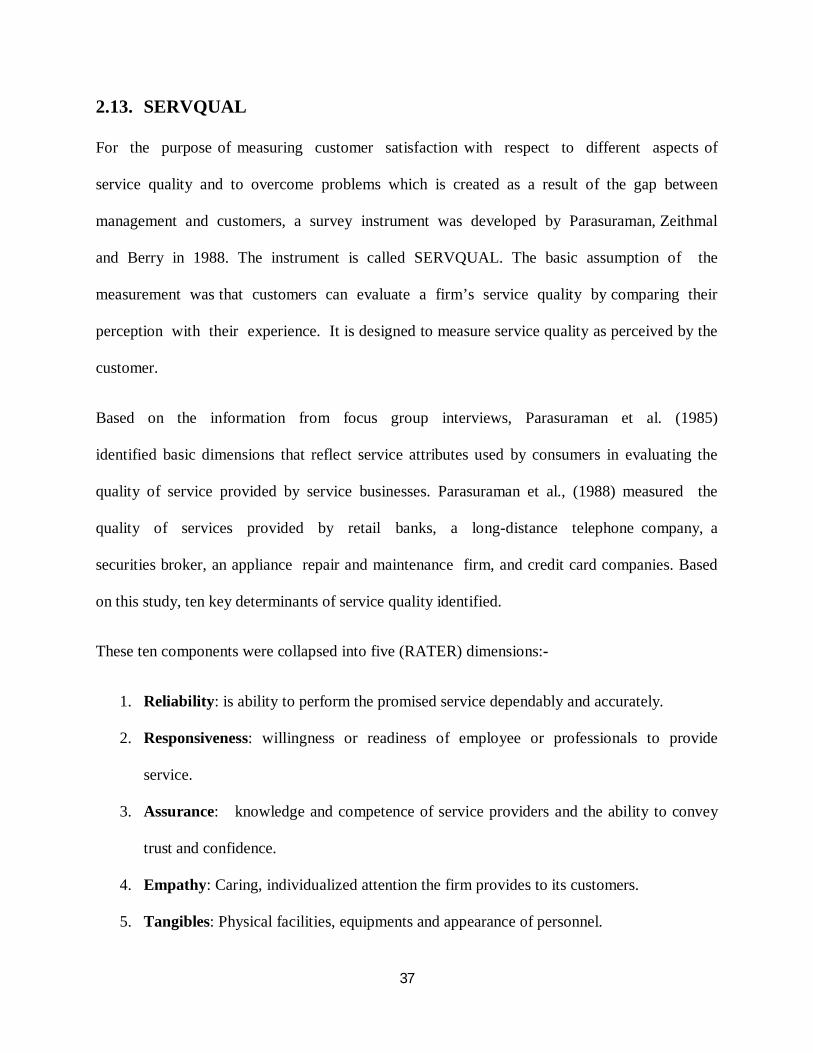
These ten components were collapsed into five (RATER) dimensions:-
1. Reliability: is ability to perform the promised service dependably and accurately.
2. Responsiveness: willingness or readiness of employee or professionals to provide
service.
3. Assurance: knowledge and competence of service providers and the ability to convey
trust and confidence.
4. Empathy: Caring, individualized attention the firm provides to its customers.
5. Tangibles: Physical facilities, equipments and appearance of personnel.
38
Though, the SERVQUAL model has been the major generic model used to measure and manage
service quality across different service settings and various cultural backgrounds, it has been
subjected to a number of theoretical and operational criticisms (Buttle, 1996).
2.14. SERVPERF
Cronin and Taylor (1992) were amongst the researchers who leveled maximum attack on the
SERVQUAL scale. They questioned the conceptual basis of the SERVQUAL scale and found it
confusing with service satisfaction. They, therefore, opined that expectation (E) component of
SERVQUAL be discarded and instead performance (P) component alone be used. They
proposed what is referred to as the ‘SERVPERF’ scale. Besides theoretical arguments, Cronin
and Taylor (1992) provided empirical evidence across four industries (namely banks, pest
control, dry cleaning, and fast food) to corroborate the superiority of their ‘performance-only’
instrument over disconfirmation-based SERVQUAL scale.
Being a variant of the SERVQUAL scale and containing perceived performance component
alone, ‘performance only’ scale is comprised of only 22 items. A higher perceived performance
implies higher service quality.
Methodologically, the SERVPERF scale represents marked improvement over the SERVQUAL
scale. Not only is the scale more efficient in reducing the number of items to be measured by 50
per cent, it has also been empirically found superior to the SERVQUAL scale for being able to
explain greater variance in the overall service quality measured through the use of single-item
scale (Sanjay and Garima,2004).
39
2.15. BANKSERV
The SERVQUAL model has come in for criticism from many authors, for example, Avkiran
(1999), criticizes the SERVQUAL as gigantic data user, cost and time inefficient, cause it
compare perceived performance with expectations in separate items (22-expectations items and
22-perceptions items) Whereas, the BANKSERV instrument captures the similar comparison of
perceived performance with expectations in a battery of single statements.
Asubonteng et al. (1996) did eighteen critical reviews on empirical studies of service quality and
conclude that SERVQUAL instrument is industry specific. When SERVQUAL applied for retail
banking, problems were identified with regard to its dimensionality and the value of expectation
scores.
In order to suit the Australian banking industry, The BANKSERV instrument, developed by
Avkiran (1994), was adapted from SERVQUAL to specifically suit the Australian banking
industry. It is an instrument, designed to allow customers to reflect on their expectations and
perceptions in single statements. It evaded the probable psychometric difficulties connected with
SERVQUAL and negatively worded questionnaire items of this instrument. The 17 service
quality items that make up BANKSERV categorized under four dimensions.
The four dimensions were:-
1. Staff conduct represents the bank’s personnel service manner and presentation that
cause customers to form a positive or negative image about the bank. The sub-
dimension of staff conduct includes willingness to help, promptness of service,
greeting, expression of genuine concern, politeness, neat appearance, and apology for
mistakes.
40
2. Credibility represents the trust relationship between bank staff and customers.
Credibility consists of staff keeping customers informed, rectifying mistakes made by
staff, and customers feeling secure during the service process.
3. Communication represents the verbal and written communication between bank staff
and customers. The sub-dimensions attributes in communication are staff knowledge
about bank services and products, helping customers to learn how to reduce costs, the
quality of advice, informing customers about the availability of accounts and
investments, and informing customers about servicing time.
4. Access to teller services represents adequate staff to serve the customers during bank
operating hours. The sub-dimensions include the number of tellers and staff serving
customers during busy times.
The instrument’s reliability, dimensionality and validity were all empirically tested and the
results were encouraging both in their own right and when compared with other studies
(Avkiran, 1994).
2.16. Review of some previous studies
Research on services quality has currently received special attention from marketing researcher.
Some research conducted on quality services and its effect on customer satisfaction and loyalty
and their results are summarized as follow:-
On the relationship between staff conduct, communication, access to service, and credibility
on satisfaction towards telecommunication services was conducted in Malaysia using
BANKSERV model, by Junaid Zafar, et.al (2012) revealed that the regression parameter
estimates show four significant relationships between: staff conduct and credibility (β=0.295,
41
P-value=0.003, C.R=2.93),communication and credibility (β=0.76,p<0.001, C.R= 8.996),
access and satisfaction (β=0.316, p<0.001, C.R= 3.673) and credibility and satisfaction
(β=0.945, p<0.05, C.R=2.05). Conversely, the relationship between access and satisfaction
(β=-0.051, P-value=-0.569 and C.R=-0.570), staff conduct and satisfaction and (β=0.065, P-
value=0.676 and C.R=0.156) and communication and satisfaction (β=-0.289, P-value=0.415
and C.R=-0.815) are found to be insignificant. Finally, credibility is found to have non-
mediating effects between exogenous and endogenous variables. In addition, the researchers
advice the staff should be flexible in its approach. A culture of smile and feedback should be
introduced so that every person has access to services.
A Conceptual Analysis on Service Quality Dimensions conducted on various literatures on
service, service quality and service dimensions based on UK and other developed countries
like the European Union countries by Mohammed Alamgir and Mohammad Shamsuddoha
(2010) showed that all of the specific elements of service quality of reliability,
responsiveness, assurance, empathy, and social responsibility dimensions are included in the
four dimensions of BANKSERV, an instrument that exclusively deals with the perceived
quality within the special context of banks, proposed by Avkiran (1999) except for the
specific elements of tangibles dimension. The author, therefore, proposes that the
BANKSERV instrument proposed by Avkiran (1999) should be modified by adding
tangibles dimension and this instrument will be an appropriate battery to measure the service
quality in the banking sector. In addition, the finding stresses that due to the main problem
with SERVQUAL, as it compare perceived performance with expectations in separate items
(22-expectations items and 22- perceptions items), whereas, the BANKSERV instrument
42
captures the similar comparison of perceived performance with expectations in a battery of
single statements (Avkiran, 1999).
On the relationship between customer satisfaction, service quality and service loyalty
research was conducted in a bank in Tehran, Iran by Osman Mahamad, et.al (2010) revealed
that service quality would be one of the determinants of satisfaction and loyalty. In fact,
nearly 43 percent of customer’s satisfaction change is explained by service quality. On the
other hand, service quality has a direct relation with loyalty, and nearly 45 percent of loyalty
changes can be explained by service quality changes.
On the relationship between Bank Service Quality, Customer Satisfaction and Loyalty in
Ethiopian Banking Sector, Messay (2012) concluded that all service quality dimensions are
positively correlated with customer satisfaction indicating 90.7% of the variance in customer
satisfaction can be predicted by the service quality offered by the private banks. In addition,
results of this research show that there is a positive significant relationship between customer
satisfaction and loyalty, and explain 62% of the variance.
On the relationship between Service quality, satisfaction, perceived value and loyalty among
customers in commercial banking in Nakuru Municipality, Kenya, Daniel O. Auka (2012)
concluded that service quality and customer loyalty were positively and significantly
associated indicating 19.8% of the variance in customer loyalty can be predicted by the
service quality offered by the commercial banks.
43
2.17. Conceptual Gaps in the Literature
A review of the literature on Ethiopian banking industry identified two conceptual research gaps:
The first gap identified in the literature relates to the lack of empirical research on the influence
of service quality on customer satisfaction and loyalty on branch banks found under CBE,
Shashemene District.
The second conceptual gap relates to a lack of empirical research on the banking sector using a
BANKSERV model as an instrument to measure the relationship among service quality,
customer satisfaction and loyalty in Ethiopian retail banking context.
2.18. Conceptual Framework
The conceptual framework indicates the crucial process, which is useful to show the
direction of the study. The study shows the relationship between the five service quality
dimensions (reliability, responsiveness, assurance, empathy and tangible) and customer
satisfaction. Also the study focuses on gap 5 which represents the difference between
customers’ expectation and perceptions which is referred to as the perceived service
quality.
44
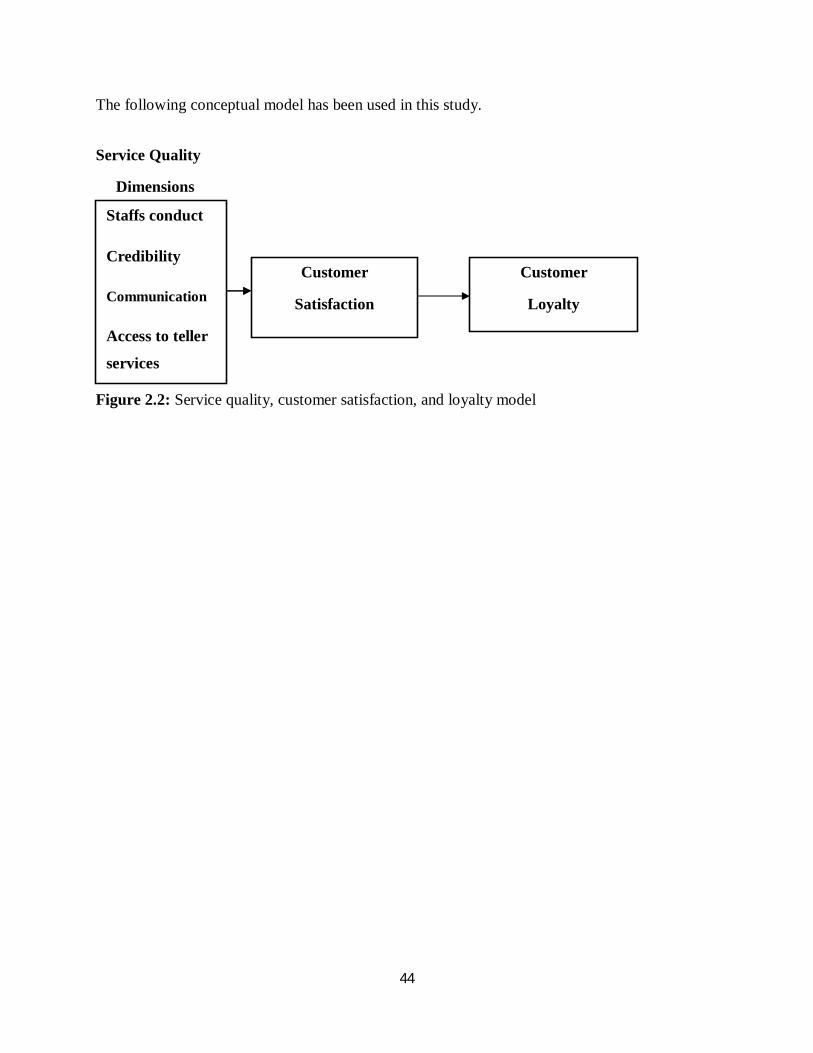
The following conceptual model has been used in this study.
Service Quality
Dimensions
Figure 2.2: Service quality, customer satisfaction, and loyalty model
Staffs conduct
Credibility
Communication
Access to teller
services
Customer
Satisfaction
Customer
Loyalty
Staffs conduct
Credibility
Communication
Access to teller
services
45
CHAPTER THREE
RESEARCH DESIGN AND METHODOLOGY
3.1. Introduction
This chapter presents details of the research design and methodology. It includes the description
of the study area, research design, sample size and sampling technique, data source and type,
methods and tools of data collection, description of variables and questionnaire. At the end of the
chapter method of data analysis is presented.
3.1.1. Description of the study area
Commercial bank of Ethiopia is the leading bank in Ethiopia established in 1942; pioneer to
introduce modern banking to the country. It has reliable and long-standing relationships with
many internationally acclaimed banks throughout the world. The bank has 547 branches
stretched across the length and breadth of the country. Among these 547 branches 33 of them
are under the Shashemene district. CBE is a leading African bank with assets of 114 billion (Jun
30, 2011) and the first bank to introduce ATM service for local users. The bank currently has
more than two million country wide account holders, combines a wide capita base with more
than 10,000 talented and committed employees. CBE, Shashemene district has about 250,425 of
clients’ as of February, 2013 (www.cbe.com).
46
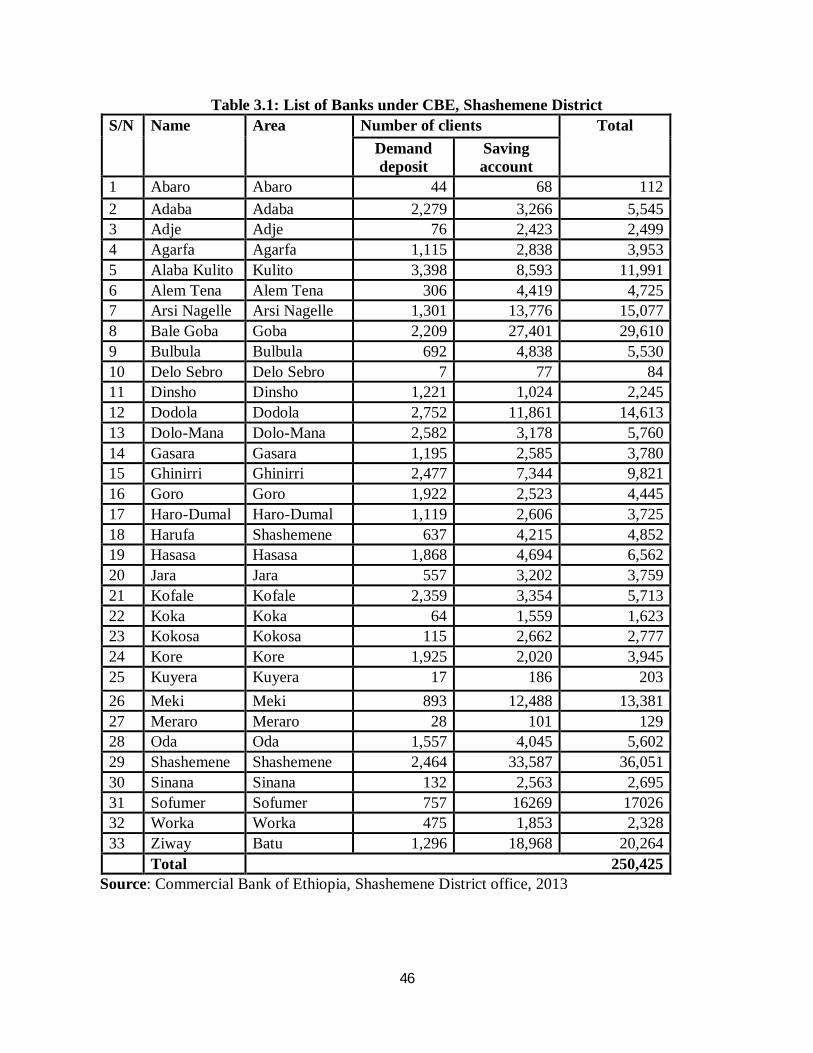
Table 3.1: List of Banks under CBE, Shashemene District S/N Name Area Number of clients Total
Demand deposit
Saving account
1 Abaro Abaro 44 68 112 2 Adaba Adaba 2,279 3,266 5,545 3 Adje Adje 76 2,423 2,499 4 Agarfa Agarfa 1,115 2,838 3,953 5 Alaba Kulito Kulito 3,398 8,593 11,991 6 Alem Tena Alem Tena 306 4,419 4,725 7 Arsi Nagelle Arsi Nagelle 1,301 13,776 15,077 8 Bale Goba Goba 2,209 27,401 29,610 9 Bulbula Bulbula 692 4,838 5,530 10 Delo Sebro Delo Sebro 7 77 84 11 Dinsho Dinsho 1,221 1,024 2,245 12 Dodola Dodola 2,752 11,861 14,613 13 Dolo-Mana Dolo-Mana 2,582 3,178 5,760 14 Gasara Gasara 1,195 2,585 3,780 15 Ghinirri Ghinirri 2,477 7,344 9,821 16 Goro Goro 1,922 2,523 4,445 17 Haro-Dumal Haro-Dumal 1,119 2,606 3,725 18 Harufa Shashemene 637 4,215 4,852 19 Hasasa Hasasa 1,868 4,694 6,562 20 Jara Jara 557 3,202 3,759 21 Kofale Kofale 2,359 3,354 5,713 22 Koka Koka 64 1,559 1,623 23 Kokosa Kokosa 115 2,662 2,777 24 Kore Kore 1,925 2,020 3,945 25 Kuyera Kuyera 17 186 203 26 Meki Meki 893 12,488 13,381 27 Meraro Meraro 28 101 129 28 Oda Oda 1,557 4,045 5,602 29 Shashemene Shashemene 2,464 33,587 36,051 30 Sinana Sinana 132 2,563 2,695 31 Sofumer Sofumer 757 16269 17026 32 Worka Worka 475 1,853 2,328 33 Ziway Batu 1,296 18,968 20,264 Total 250,425
Source: Commercial Bank of Ethiopia, Shashemene District office, 2013
47
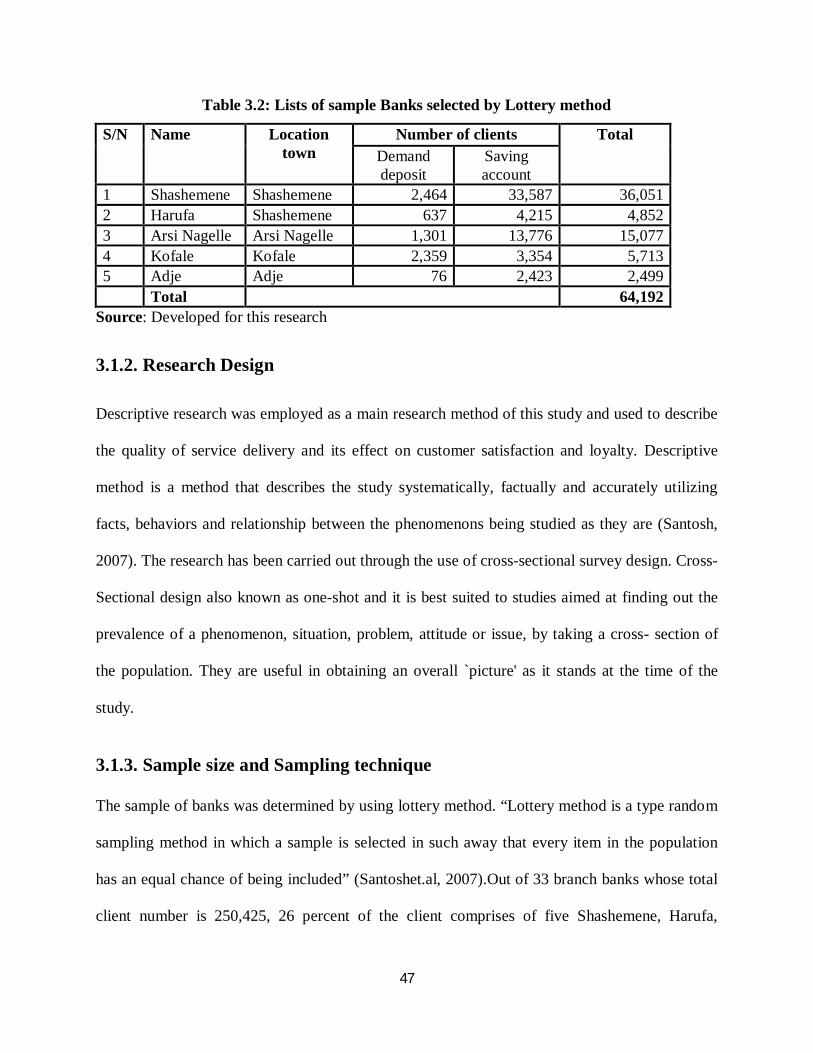
Table 3.2: Lists of sample Banks selected by Lottery method
S/N Name Location town
Number of clients Total Demand deposit
Saving account
1 Shashemene Shashemene 2,464 33,587 36,051 2 Harufa Shashemene 637 4,215 4,852 3 Arsi Nagelle Arsi Nagelle 1,301 13,776 15,077 4 Kofale Kofale 2,359 3,354 5,713 5 Adje Adje 76 2,423 2,499 Total 64,192
Source: Developed for this research
3.1.2. Research Design
Descriptive research was employed as a main research method of this study and used to describe
the quality of service delivery and its effect on customer satisfaction and loyalty. Descriptive
method is a method that describes the study systematically, factually and accurately utilizing
facts, behaviors and relationship between the phenomenons being studied as they are (Santosh,
2007). The research has been carried out through the use of cross-sectional survey design. Cross-
Sectional design also known as one-shot and it is best suited to studies aimed at finding out the
prevalence of a phenomenon, situation, problem, attitude or issue, by taking a cross- section of
the population. They are useful in obtaining an overall `picture' as it stands at the time of the
study.
3.1.3. Sample size and Sampling technique
The sample of banks was determined by using lottery method. “Lottery method is a type random
sampling method in which a sample is selected in such away that every item in the population
has an equal chance of being included” (Santoshet.al, 2007).Out of 33 branch banks whose total
client number is 250,425, 26 percent of the client comprises of five Shashemene, Harufa,
48
Arsinegelle, Kofale, and Adje branch banks whose total client number is 64,192, was selected as
a sample banks on the assumption that they could represent CBE, Shashemene district.
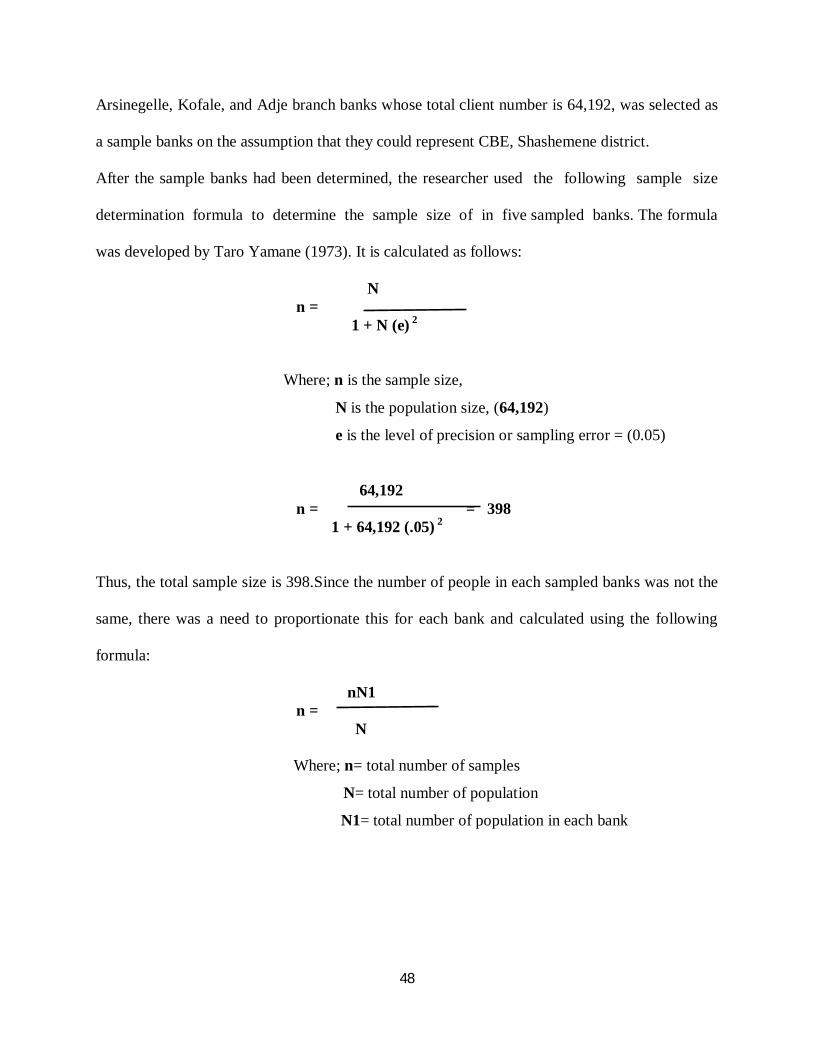
After the sample banks had been determined, the researcher used the following sample size
determination formula to determine the sample size of in five sampled banks. The formula
was developed by Taro Yamane (1973). It is calculated as follows:
N n = 1 + N (e) 2
Where; n is the sample size,
N is the population size, (64,192)
e is the level of precision or sampling error = (0.05)
64,192 n = = 398 1 + 64,192 (.05) 2
Thus, the total sample size is 398.Since the number of people in each sampled banks was not the
same, there was a need to proportionate this for each bank and calculated using the following
formula:
nN1 n = N
Where; n= total number of samples
N= total number of population
N1= total number of population in each bank
49
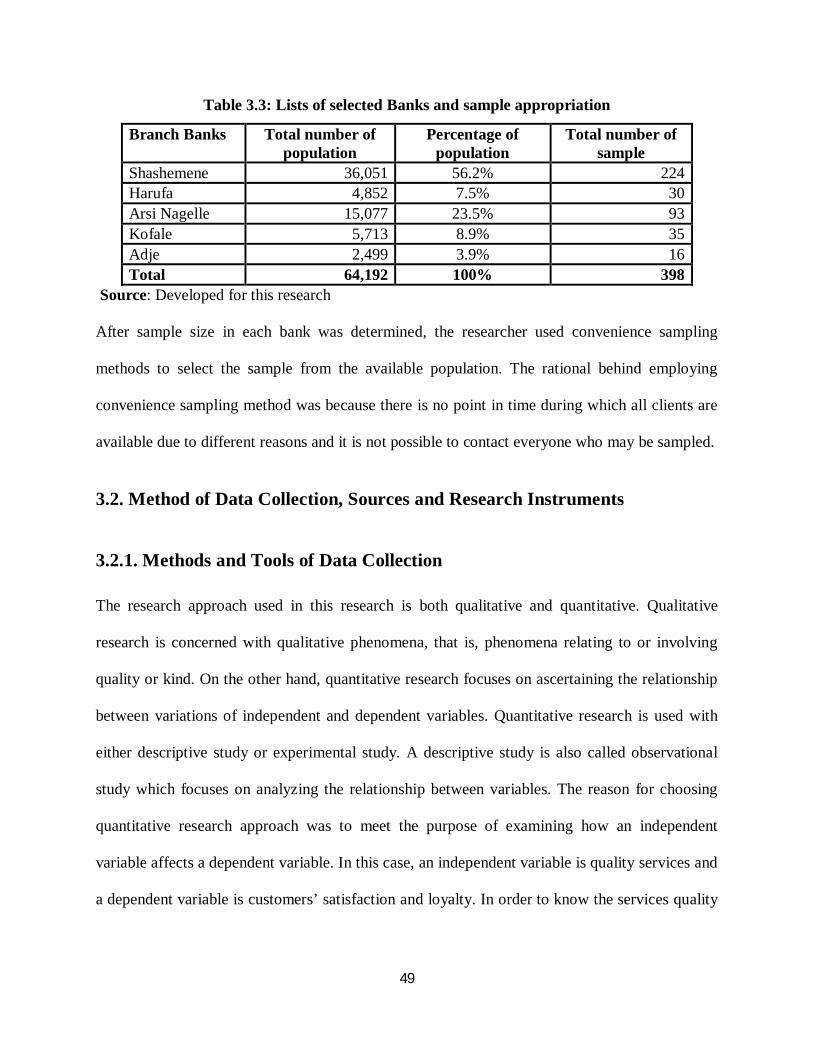
Table 3.3: Lists of selected Banks and sample appropriation
Branch Banks Total number of population
Percentage of population
Total number of sample
Shashemene 36,051 56.2% 224 Harufa 4,852 7.5% 30 Arsi Nagelle 15,077 23.5% 93 Kofale 5,713 8.9% 35 Adje 2,499 3.9% 16 Total 64,192 100% 398
Source: Developed for this research
After sample size in each bank was determined, the researcher used convenience sampling
methods to select the sample from the available population. The rational behind employing
convenience sampling method was because there is no point in time during which all clients are
available due to different reasons and it is not possible to contact everyone who may be sampled.
3.2. Method of Data Collection, Sources and Research Instruments
3.2.1. Methods and Tools of Data Collection
The research approach used in this research is both qualitative and quantitative. Qualitative
research is concerned with qualitative phenomena, that is, phenomena relating to or involving
quality or kind. On the other hand, quantitative research focuses on ascertaining the relationship
between variations of independent and dependent variables. Quantitative research is used with
either descriptive study or experimental study. A descriptive study is also called observational
study which focuses on analyzing the relationship between variables. The reason for choosing
quantitative research approach was to meet the purpose of examining how an independent
variable affects a dependent variable. In this case, an independent variable is quality services and
a dependent variable is customers’ satisfaction and loyalty. In order to know the services quality
50
affects customers’ satisfaction and indirectly loyalty, it will be necessary to utilize descriptive
study.
In this study, structured questionnaire have been used to collect data. Structured questionnaires
were developed containing closed end and can easily understood by respondents. The
questionnaires have four parts: The first part of the questionnaire was about the personal
information of respondents. The second section designed to measure the customers’ perception
about the bank service delivery system. The third part of the questioner was about customers’
satisfaction and the last part was about customers’ loyalty. In order to collect the data three
enumerators who are fluent speakers of local language and national language were recruited.
These enumerators were trained on how to handle respondents, data collection techniques and
how to manage questionnaires. The respondents who are the clients of the branch banks were ask
for cooperation and given the questionnaire when they were receiving the service of specific
branch and some questionnaire also distributed to respondents at their working places and
homes. The data collection process conducted from April 02 to April16, 2013.
3.2.2. Sources of Data and Type
In order to achieve the objective of the study, both primary and secondary data were collected.
The approach for primary data collection was survey research because this approach best suited
for gathering descriptive information about people’s knowledge, attitudes, preferences, or buying
behavior can often be found out by asking them directly. The source of secondary data was
existing research papers, annual report, journals and publication, books and websites.
51
3.2.3. Description of Variables
1. Independent Variables: Staff conduct, Credibility, Communications and Access to
tellers service-Services quality dimensions.
2. Mediating Variable: Customer Satisfaction.
3. Dependent Variable: Customer Loyalty.
3.2.4. Questionnaire
The questionnaire has four parts. These are: - Personal information, Service Quality
Questionnaire (SQQ), Customer Satisfaction Questionnaire (CSQ) and Customer Loyalty
Questionnaire (CLQ).
1. Personal Information Questionnaire
The first part of the questionnaire was about the demographic characteristics of
respondents and types of account which include sex, age, marital status, family size, and
educational level.
2. Service Quality Questionnaire (SQQ)
The second part of the questionnaire measures the banks service quality by using a five–
point Likert response scale which includes strongly disagree (1), disagree(2), neither
agree nor disagree (3), agree (4) and strongly agree (5). After a review of the literature
pertains to services quality model, BANKSERV instrument selected as a foundation of
questionnaire and 17 service quality attributes of these model were employed in the
questionnaire (Avkiran, 1994).
3. Customer Satisfaction Questionnaire (CSQ)
The third part of the questionnaire measures customer satisfaction level by using a five -
point Likert response scale which includes strongly disagree (1), disagree(2), neither
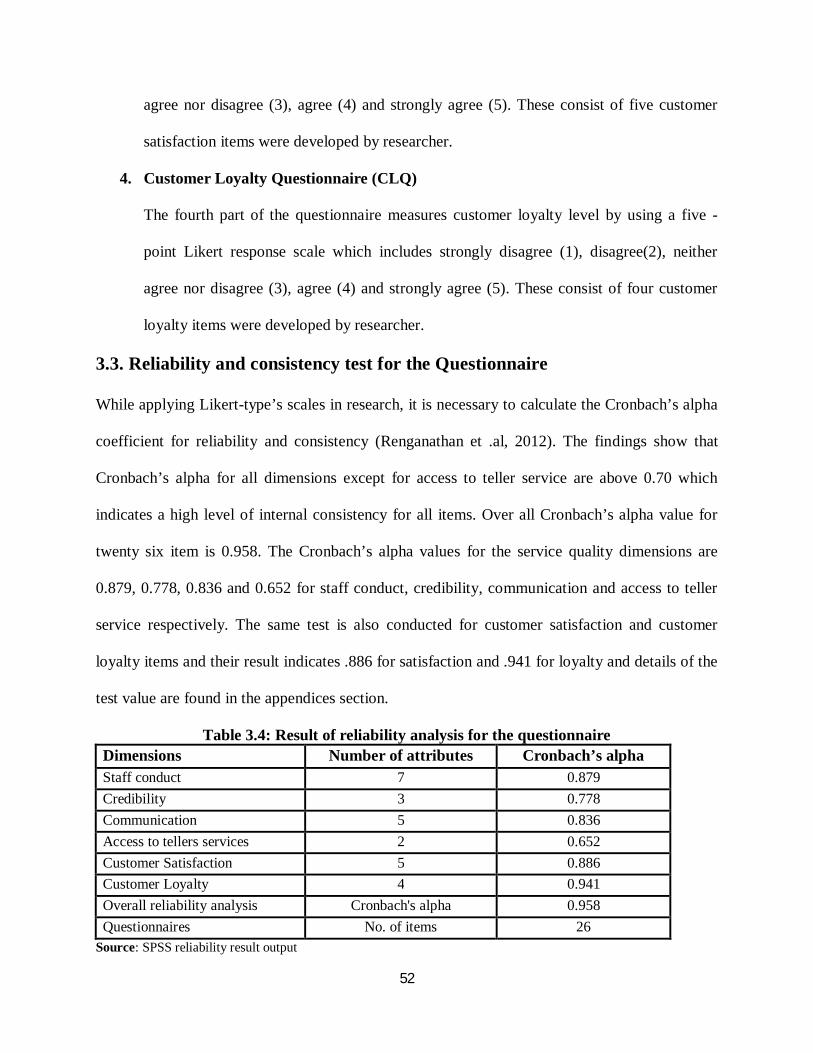
52
agree nor disagree (3), agree (4) and strongly agree (5). These consist of five customer
satisfaction items were developed by researcher.
4. Customer Loyalty Questionnaire (CLQ)
The fourth part of the questionnaire measures customer loyalty level by using a five -
point Likert response scale which includes strongly disagree (1), disagree(2), neither
agree nor disagree (3), agree (4) and strongly agree (5). These consist of four customer
loyalty items were developed by researcher.
3.3. Reliability and consistency test for the Questionnaire
While applying Likert-type’s scales in research, it is necessary to calculate the Cronbach’s alpha
coefficient for reliability and consistency (Renganathan et .al, 2012). The findings show that
Cronbach’s alpha for all dimensions except for access to teller service are above 0.70 which
indicates a high level of internal consistency for all items. Over all Cronbach’s alpha value for
twenty six item is 0.958. The Cronbach’s alpha values for the service quality dimensions are
0.879, 0.778, 0.836 and 0.652 for staff conduct, credibility, communication and access to teller
service respectively. The same test is also conducted for customer satisfaction and customer
loyalty items and their result indicates .886 for satisfaction and .941 for loyalty and details of the
test value are found in the appendices section.
Table 3.4: Result of reliability analysis for the questionnaire Dimensions Number of attributes Cronbach’s alpha Staff conduct 7 0.879 Credibility 3 0.778 Communication 5 0.836 Access to tellers services 2 0.652 Customer Satisfaction 5 0.886 Customer Loyalty 4 0.941 Overall reliability analysis Cronbach's alpha 0.958 Questionnaires No. of items 26
Source: SPSS reliability result output
53
3.4. Testing of the questionnaire
The questionnaire is tested to identify whether the questionnaire is able to capture the required
data as expected by the researchers. The test was conducted mainly to find out whether our
questionnaire was easily-understandable by respondents as well as whether there were any vague
and confusing questions in the questionnaire. Questionnaires were distributed to five respondents
who have the following profession: University Instructor (PhD in Molecular Biology), Amharic
Language teacher, Lawyer and Building Material store Owner. All the respondents reported that
they had no difficulty in answering the questions. However, they commented that some of the
questions have professional words; words that we do not use daily and some respondent may fail
to understand it and some words have negative connotation. Accordingly, the researcher made
necessary changes.
3.5. Method of Data Analysis
Statistical Package for Social Science (SPSS) software version 20.0 was employed to analyze
and present the data through the statistical tools used for this study, namely descriptive analysis,
correlation and multiple regression analysis.
1. Descriptive analysis
The descriptive statistical results were presented by tables, frequency distributions and
percentages to give a condensed picture of the data. This was achieved through summary of
statistics, which includes the means, mode and standard deviations values which are computed
for each variable in this study.
54
2. Pearson Correlation analysis
In this study Pearson’s correlation coefficient was used to determine the relationships between
service quality dimensions (Staff conduct, Credibility, Communication and Access to teller
services), customer satisfaction and customer loyalty.
3. Multiple Regression Analysis
Multiple regression analysis was used to investigate the effect of service quality dimensions
(Staff conduct, Credibility, Communication and Access to teller services) on customer
satisfaction and also customer satisfaction on customer loyalty.
Regression functions
The equation of multiple regressions on this study is generally built around three sets of variable,
namely dependent, mediating and independent variables. The basic objective of using regression
equation is to make the researcher more effective at describing, understanding, predicting, and
controlling the stated variables.
Regress customer satisfaction on the service quality dimensions
Yi = β1 + β2X2 + β3 X3 + β 4X4 + β 5X5
Where Y is the dependent variable- customer satisfaction
Staff conduct=X2, Credibility=X3, Communication=X4, and Access to tellers service=X5 are the
explanatory variables (or the regressors).
β1 is the intercept term- it gives the mean or average effect on Y of all the variables excluded
from the equation, although its mechanical interpretation is the average value of Y when the
stated independent variables are set equal to zero.
β2, β3, β4, and β5 refer to the coefficient of their respective independent variable which measures
the change in the mean value of Y, per unit change in their respective independent variables.
55
Regress customer loyalty on the customer satisfaction
Yi = β+ β1X1
Where Y is the dependent variable- customer loyalty
Customer satisfaction=X1 is the explanatory variables (or the regressors)
3.6. Ethical Considerations
The consideration of ethics in research and business is of growing importance. Therefore, it is
critical to understand the basics of ethical research. This is especially important if your research
involves interaction with businesses or members of the general community who serve as
participants (i.e., respondents) in your research. As a researcher, you will need to ensure that no
psychological, financial and social harm occurs to those who involved in the study.
For these reasons, Ethical aspects of this study have been effectively addressed by implementing
the following measure:
1. Respondents have participated in the survey voluntarily and have been fully informed
about the aims and objectives of the study.
2. Texts belonging to other authors that have been used in any part of this study have been
fully referenced with American Psychological Association (APA) Referencing System.
3. The questionnaires did not contain any degrading, discriminating or any other
unacceptable language that could be offensive to any members of the sample group.
4. The questionnaire has been designed to collect information directly related to the research
questions, and no private or personal questions were asked from respondents (Bryman, A,
Bell. E., 2007).
56
CHAPTER FOUR
DATA ANALYSIS AND INTERPRETATION
4.1. Introduction
This chapter will present a discussion of the final results and the processes through which the
results were obtained. In addition to this, background information of respondents will be
presented. Finally, the statistical methods of analysis were discussed, which included a
descriptive analysis, a correlation analysis, and a multiple regression analysis through SPSS
version 20.
4.2. Data Analysis
4.2.1. Background information of Respondents
Three hundred ninety eight questionnaires were distributed to the respondents and out of this 360
were collected with a response rate of 90%. However, only 344 responses were valid with
complete answers. The unresponded questionnaire profile consists of Shashemene branch, 17;
Harufa branch, 13; ArsiNegelle branch, 5; Adjie, 3 and Kofelle branch, 0. The demographic
characteristics of the respondents include the following: sex, age, marital status, level of
education, family size and account type. This aspect of the data analysis deals with the analysis
personal data on the respondents of the questionnaires. The table below shows the details of
characteristics of the respondents and their percentage.
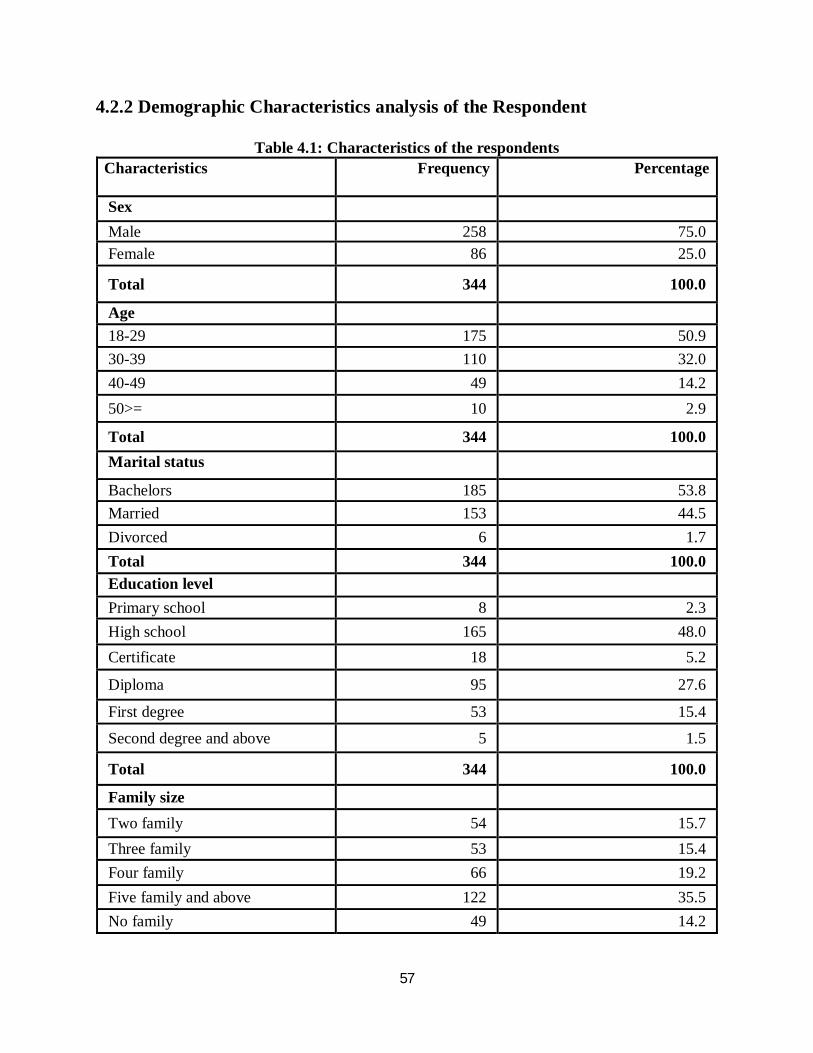
57
4.2.2 Demographic Characteristics analysis of the Respondent
Table 4.1: Characteristics of the respondents Characteristics
f Frequency Fr
Percentage
Sex Male 258 75.0 Female 86 25.0
Total 344 100.0
Age 18-29 175 50.9 30-39 110 32.0 40-49 49 14.2 50>= 10 2.9
Total 344 100.0 Marital status
Bachelors 185 53.8 Married 153 44.5 Divorced 6 1.7 Total 344 100.0 Education level Primary school 8 2.3 High school 165 48.0 Certificate 18 5.2
Diploma 95 27.6
First degree 53 15.4
Second degree and above 5 1.5
Total 344 100.0
Family size Two family 54 15.7 Three family 53 15.4 Four family 66 19.2 Five family and above 122 35.5 No family 49 14.2
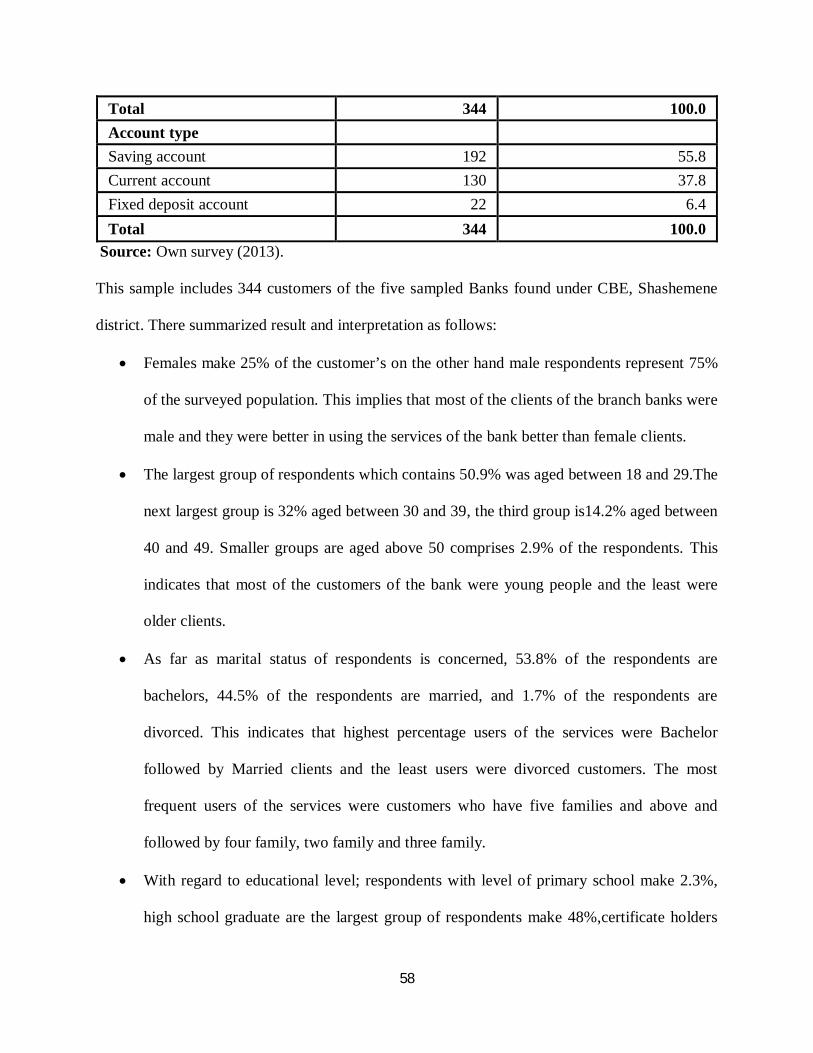
58
Total 344 100.0 Account type Saving account 192 55.8 Current account 130 37.8 Fixed deposit account 22 6.4 Total 344 100.0
Source: Own survey (2013).
This sample includes 344 customers of the five sampled Banks found under CBE, Shashemene
district. There summarized result and interpretation as follows:
Females make 25% of the customer’s on the other hand male respondents represent 75%
of the surveyed population. This implies that most of the clients of the branch banks were
male and they were better in using the services of the bank better than female clients.
The largest group of respondents which contains 50.9% was aged between 18 and 29.The
next largest group is 32% aged between 30 and 39, the third group is14.2% aged between
40 and 49. Smaller groups are aged above 50 comprises 2.9% of the respondents. This
indicates that most of the customers of the bank were young people and the least were
older clients.
As far as marital status of respondents is concerned, 53.8% of the respondents are
bachelors, 44.5% of the respondents are married, and 1.7% of the respondents are
divorced. This indicates that highest percentage users of the services were Bachelor
followed by Married clients and the least users were divorced customers. The most
frequent users of the services were customers who have five families and above and
followed by four family, two family and three family.
With regard to educational level; respondents with level of primary school make 2.3%,
high school graduate are the largest group of respondents make 48%,certificate holders
59
make 5.2% and diploma holders comprises 27.6% of the customers. While first degree
holders are 15.4% of the respondents. Finally, holders of second degree and above make
1.5% of the customers. This implies that most of the clients were high school graduates
where as, the least were second degree holders and above. The others positioned in
between the two clients.
As to the family size 15.7% of the respondents have two families, 15.4% of the
respondents have three families, 19.2% of the respondents have four families, 35.5% of
the respondents have five and above families which are the highest respondent and lastly
respondents who did not have family making of 14.2%.The most frequent users of the
services were clients who have five families and above followed by clients who have two
families and three families. The least frequent users were customers who have no family.
Regarding the type of account respondents use majority of the respondent are saving
account users represent 55.8% of the clients and the users of current and fixed deposit
account exhibit 37.8% and 6.4% respectively. This indicates most of customers are
interest earners and least number of customers were users of non-interest bearing saving
account. More than one third of the customers were current account users which let them
write a check to third party and draw a large amount of money at preferred time than
saving account holders.
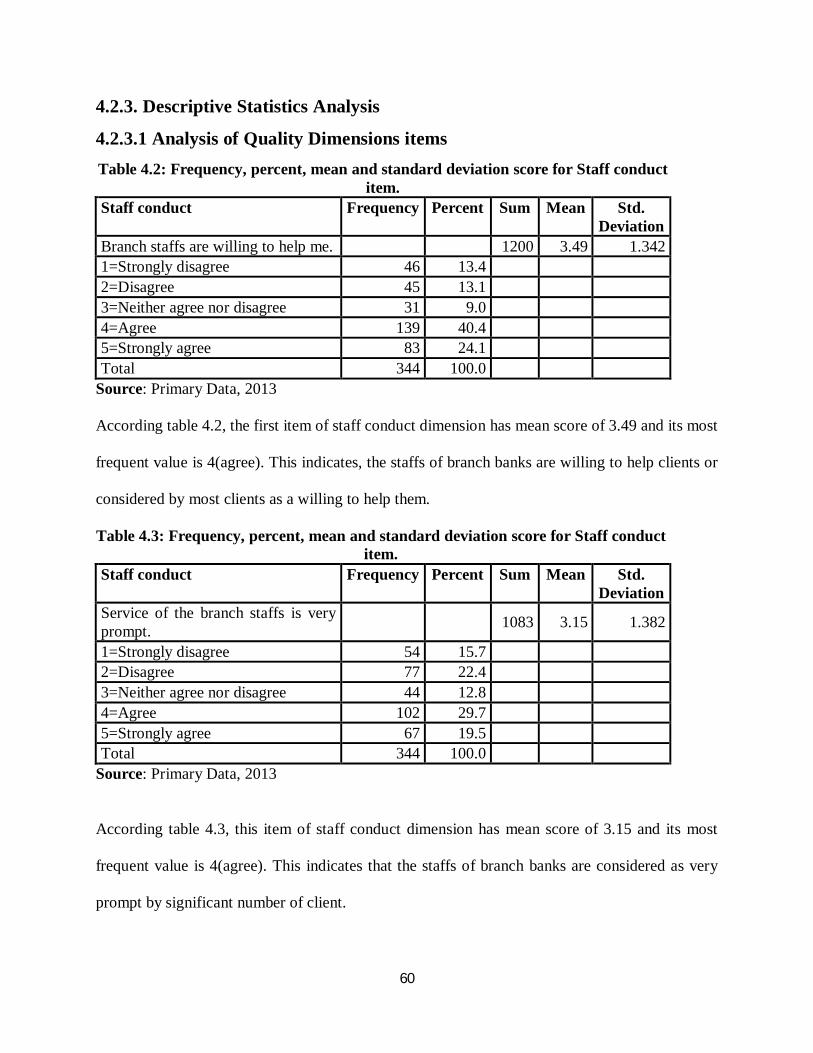
60
4.2.3. Descriptive Statistics Analysis
4.2.3.1 Analysis of Quality Dimensions items Table 4.2: Frequency, percent, mean and standard deviation score for Staff conduct
item. Staff conduct Frequency Percent Sum Mean Std.
Deviation Branch staffs are willing to help me. 1200 3.49 1.342 1=Strongly disagree 46 13.4 2=Disagree 45 13.1 3=Neither agree nor disagree 31 9.0 4=Agree 139 40.4 5=Strongly agree 83 24.1 Total 344 100.0
Source: Primary Data, 2013
According table 4.2, the first item of staff conduct dimension has mean score of 3.49 and its most
frequent value is 4(agree). This indicates, the staffs of branch banks are willing to help clients or
considered by most clients as a willing to help them.
Table 4.3: Frequency, percent, mean and standard deviation score for Staff conduct item.
Staff conduct Frequency Percent Sum Mean Std. Deviation
Service of the branch staffs is very prompt. 1083 3.15 1.382
1=Strongly disagree 54 15.7 2=Disagree 77 22.4 3=Neither agree nor disagree 44 12.8 4=Agree 102 29.7 5=Strongly agree 67 19.5 Total 344 100.0
Source: Primary Data, 2013
According table 4.3, this item of staff conduct dimension has mean score of 3.15 and its most
frequent value is 4(agree). This indicates that the staffs of branch banks are considered as very
prompt by significant number of client.
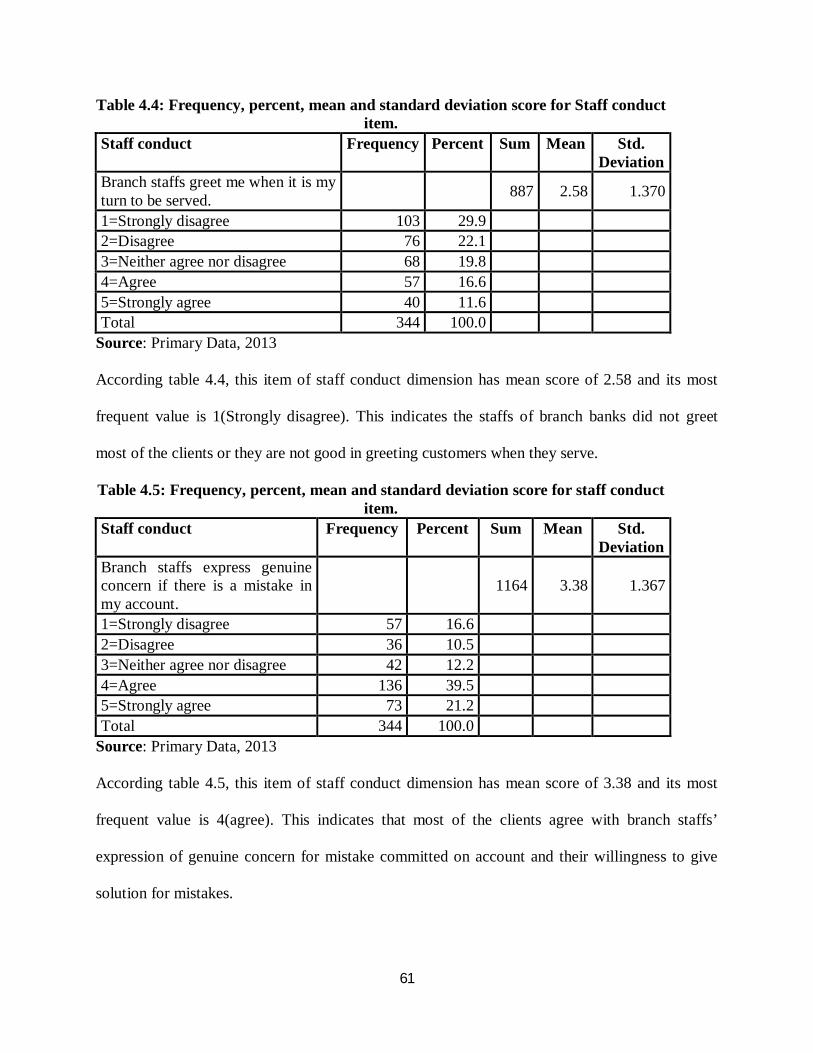
61
Table 4.4: Frequency, percent, mean and standard deviation score for Staff conduct item.
Staff conduct Frequency Percent Sum Mean Std. Deviation
Branch staffs greet me when it is my turn to be served. 887 2.58 1.370
1=Strongly disagree 103 29.9 2=Disagree 76 22.1 3=Neither agree nor disagree 68 19.8 4=Agree 57 16.6 5=Strongly agree 40 11.6 Total 344 100.0
Source: Primary Data, 2013
According table 4.4, this item of staff conduct dimension has mean score of 2.58 and its most
frequent value is 1(Strongly disagree). This indicates the staffs of branch banks did not greet
most of the clients or they are not good in greeting customers when they serve.
Table 4.5: Frequency, percent, mean and standard deviation score for staff conduct item.
Staff conduct Frequency Percent Sum Mean Std. Deviation
Branch staffs express genuine concern if there is a mistake in my account.
1164 3.38 1.367
1=Strongly disagree 57 16.6 2=Disagree 36 10.5 3=Neither agree nor disagree 42 12.2 4=Agree 136 39.5 5=Strongly agree 73 21.2 Total 344 100.0
Source: Primary Data, 2013
According table 4.5, this item of staff conduct dimension has mean score of 3.38 and its most
frequent value is 4(agree). This indicates that most of the clients agree with branch staffs’
expression of genuine concern for mistake committed on account and their willingness to give
solution for mistakes.
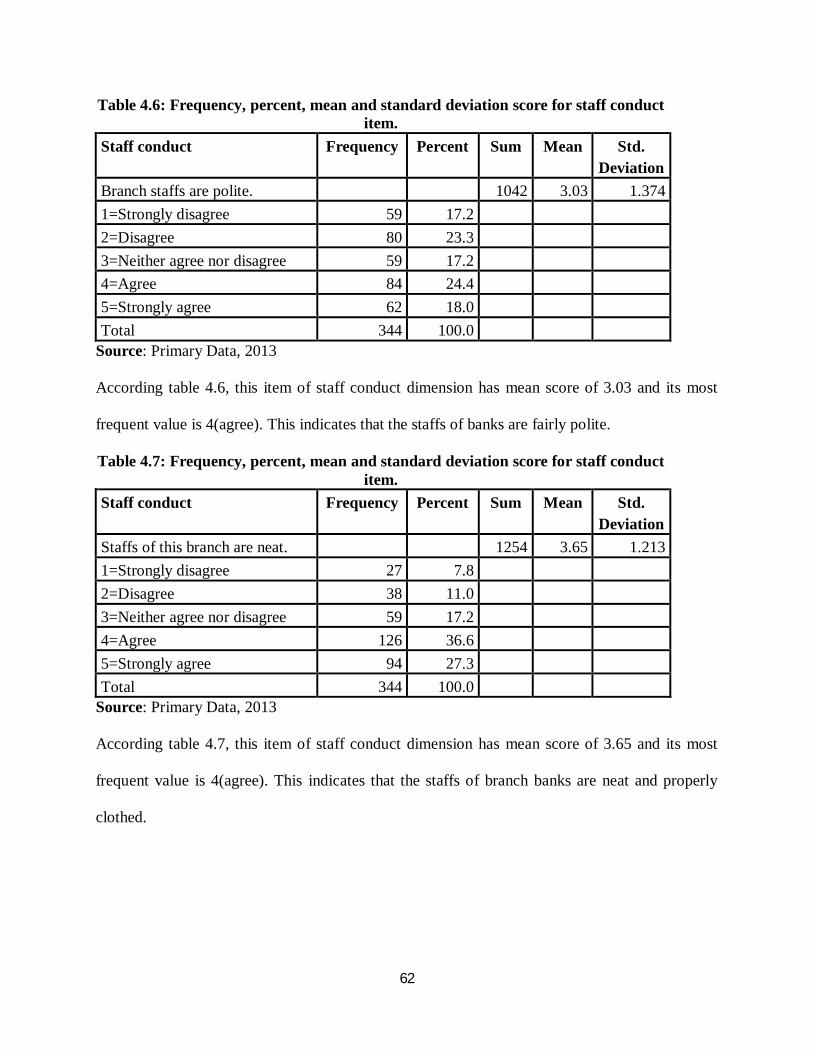
62
Table 4.6: Frequency, percent, mean and standard deviation score for staff conduct item.
Staff conduct Frequency Percent Sum Mean Std. Deviation
Branch staffs are polite. 1042 3.03 1.374 1=Strongly disagree 59 17.2 2=Disagree 80 23.3 3=Neither agree nor disagree 59 17.2 4=Agree 84 24.4 5=Strongly agree 62 18.0 Total 344 100.0
Source: Primary Data, 2013
According table 4.6, this item of staff conduct dimension has mean score of 3.03 and its most
frequent value is 4(agree). This indicates that the staffs of banks are fairly polite.
Table 4.7: Frequency, percent, mean and standard deviation score for staff conduct item.
Staff conduct Frequency Percent Sum Mean Std. Deviation
Staffs of this branch are neat. 1254 3.65 1.213 1=Strongly disagree 27 7.8 2=Disagree 38 11.0 3=Neither agree nor disagree 59 17.2 4=Agree 126 36.6 5=Strongly agree 94 27.3 Total 344 100.0
Source: Primary Data, 2013
According table 4.7, this item of staff conduct dimension has mean score of 3.65 and its most
frequent value is 4(agree). This indicates that the staffs of branch banks are neat and properly
clothed.
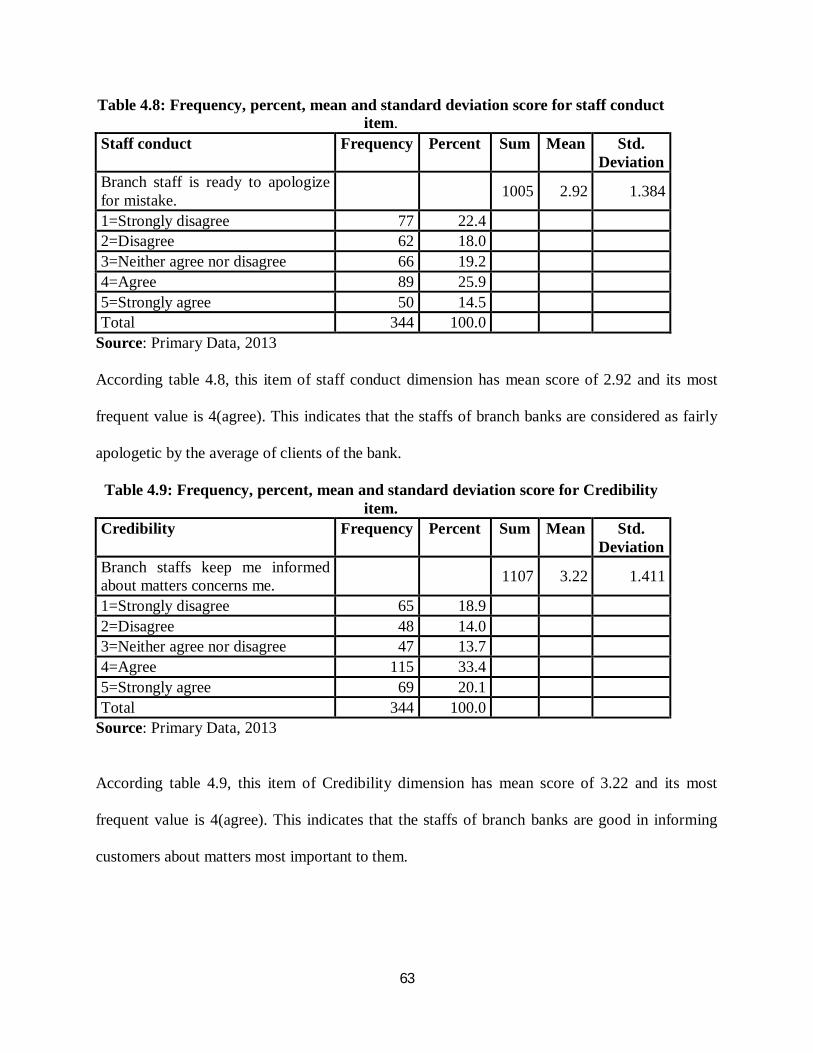
63
Table 4.8: Frequency, percent, mean and standard deviation score for staff conduct item.
Staff conduct Frequency Percent Sum Mean Std. Deviation
Branch staff is ready to apologize for mistake. 1005 2.92 1.384
1=Strongly disagree 77 22.4 2=Disagree 62 18.0 3=Neither agree nor disagree 66 19.2 4=Agree 89 25.9 5=Strongly agree 50 14.5 Total 344 100.0
Source: Primary Data, 2013
According table 4.8, this item of staff conduct dimension has mean score of 2.92 and its most
frequent value is 4(agree). This indicates that the staffs of branch banks are considered as fairly
apologetic by the average of clients of the bank.
Table 4.9: Frequency, percent, mean and standard deviation score for Credibility item.
Credibility Frequency Percent Sum Mean Std. Deviation
Branch staffs keep me informed about matters concerns me. 1107 3.22 1.411
1=Strongly disagree 65 18.9 2=Disagree 48 14.0 3=Neither agree nor disagree 47 13.7 4=Agree 115 33.4 5=Strongly agree 69 20.1 Total 344 100.0
Source: Primary Data, 2013
According table 4.9, this item of Credibility dimension has mean score of 3.22 and its most
frequent value is 4(agree). This indicates that the staffs of branch banks are good in informing
customers about matters most important to them.
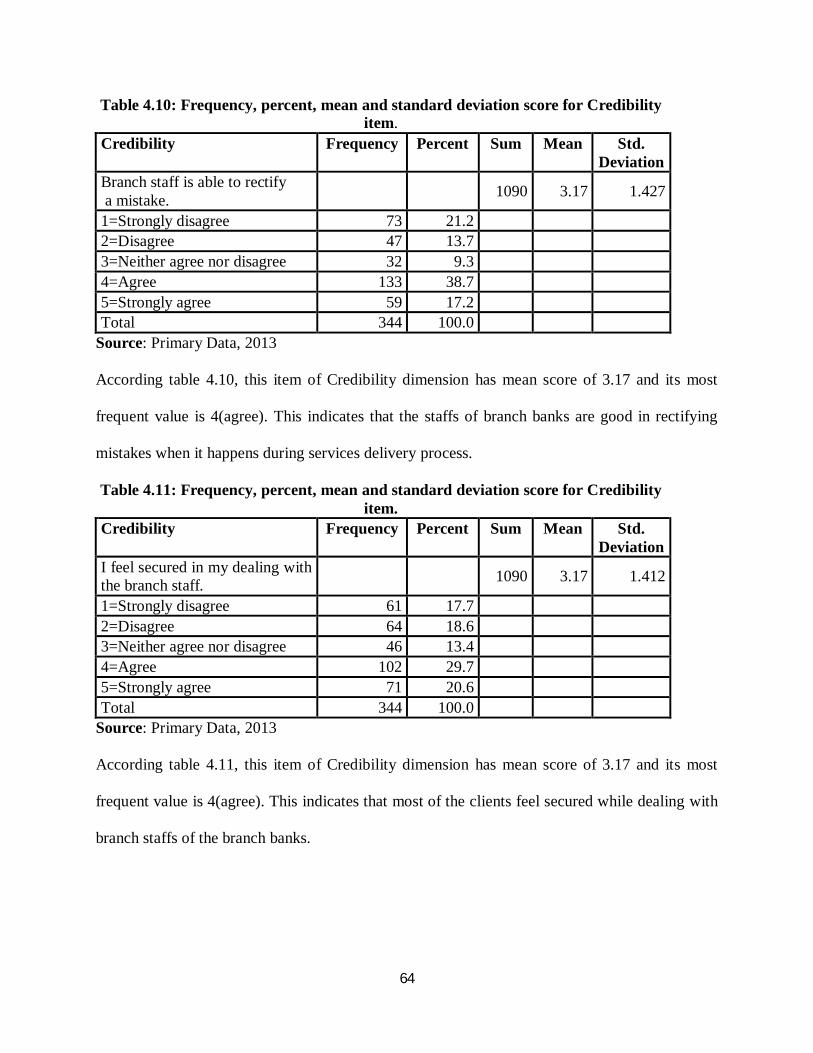
64
Table 4.10: Frequency, percent, mean and standard deviation score for Credibility item.
Credibility Frequency Percent Sum Mean Std. Deviation
Branch staff is able to rectify a mistake. 1090 3.17 1.427
1=Strongly disagree 73 21.2 2=Disagree 47 13.7 3=Neither agree nor disagree 32 9.3 4=Agree 133 38.7 5=Strongly agree 59 17.2 Total 344 100.0
Source: Primary Data, 2013
According table 4.10, this item of Credibility dimension has mean score of 3.17 and its most
frequent value is 4(agree). This indicates that the staffs of branch banks are good in rectifying
mistakes when it happens during services delivery process.
Table 4.11: Frequency, percent, mean and standard deviation score for Credibility item.
Credibility Frequency Percent Sum Mean Std. Deviation
I feel secured in my dealing with the branch staff. 1090 3.17 1.412
1=Strongly disagree 61 17.7 2=Disagree 64 18.6 3=Neither agree nor disagree 46 13.4 4=Agree 102 29.7 5=Strongly agree 71 20.6 Total 344 100.0
Source: Primary Data, 2013
According table 4.11, this item of Credibility dimension has mean score of 3.17 and its most
frequent value is 4(agree). This indicates that most of the clients feel secured while dealing with
branch staffs of the branch banks.
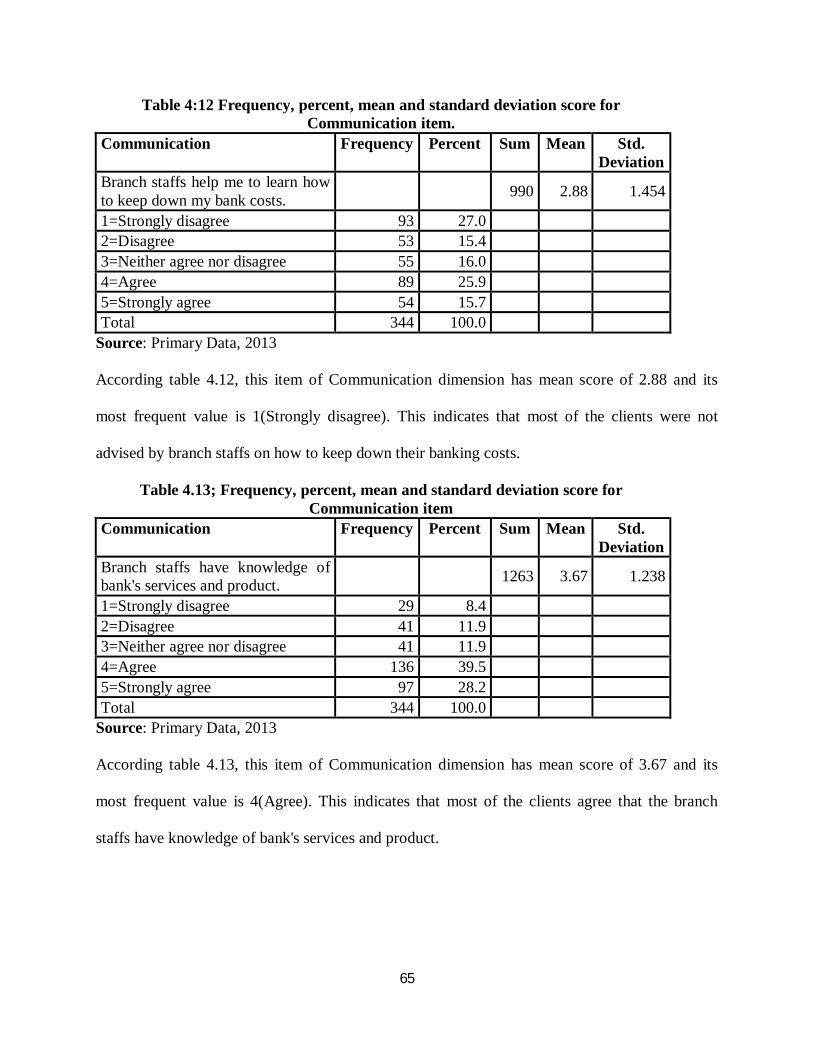
65
Table 4:12 Frequency, percent, mean and standard deviation score for Communication item.
Communication Frequency Percent Sum Mean Std. Deviation
Branch staffs help me to learn how to keep down my bank costs. 990 2.88 1.454
1=Strongly disagree 93 27.0 2=Disagree 53 15.4 3=Neither agree nor disagree 55 16.0 4=Agree 89 25.9 5=Strongly agree 54 15.7 Total 344 100.0
Source: Primary Data, 2013
According table 4.12, this item of Communication dimension has mean score of 2.88 and its
most frequent value is 1(Strongly disagree). This indicates that most of the clients were not
advised by branch staffs on how to keep down their banking costs.
Table 4.13; Frequency, percent, mean and standard deviation score for Communication item
Communication Frequency Percent Sum Mean Std. Deviation
Branch staffs have knowledge of bank's services and product. 1263 3.67 1.238
1=Strongly disagree 29 8.4 2=Disagree 41 11.9 3=Neither agree nor disagree 41 11.9 4=Agree 136 39.5 5=Strongly agree 97 28.2 Total 344 100.0
Source: Primary Data, 2013
According table 4.13, this item of Communication dimension has mean score of 3.67 and its
most frequent value is 4(Agree). This indicates that most of the clients agree that the branch
staffs have knowledge of bank's services and product.
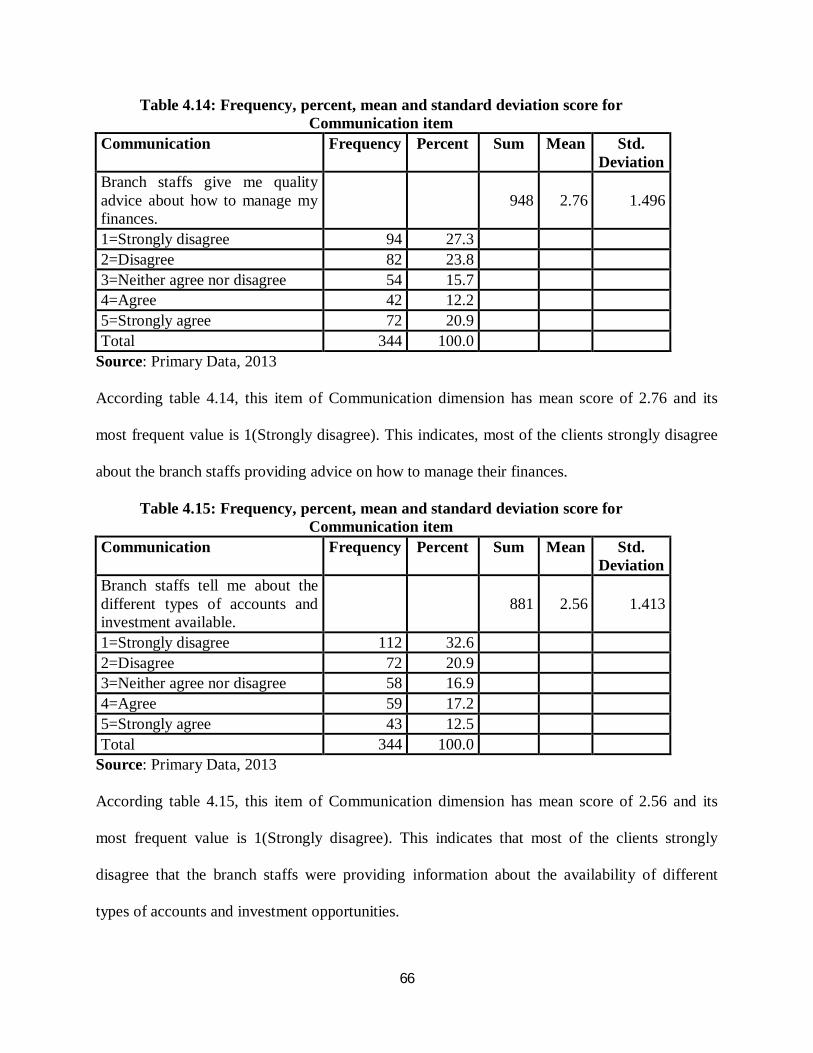
66
Table 4.14: Frequency, percent, mean and standard deviation score for Communication item
Communication Frequency Percent Sum Mean Std. Deviation
Branch staffs give me quality advice about how to manage my finances.
948 2.76 1.496
1=Strongly disagree 94 27.3 2=Disagree 82 23.8 3=Neither agree nor disagree 54 15.7 4=Agree 42 12.2 5=Strongly agree 72 20.9 Total 344 100.0
Source: Primary Data, 2013
According table 4.14, this item of Communication dimension has mean score of 2.76 and its
most frequent value is 1(Strongly disagree). This indicates, most of the clients strongly disagree
about the branch staffs providing advice on how to manage their finances.
Table 4.15: Frequency, percent, mean and standard deviation score for Communication item
Communication Frequency Percent Sum Mean Std. Deviation
Branch staffs tell me about the different types of accounts and investment available.
881 2.56 1.413
1=Strongly disagree 112 32.6 2=Disagree 72 20.9 3=Neither agree nor disagree 58 16.9 4=Agree 59 17.2 5=Strongly agree 43 12.5 Total 344 100.0
Source: Primary Data, 2013
According table 4.15, this item of Communication dimension has mean score of 2.56 and its
most frequent value is 1(Strongly disagree). This indicates that most of the clients strongly
disagree that the branch staffs were providing information about the availability of different
types of accounts and investment opportunities.
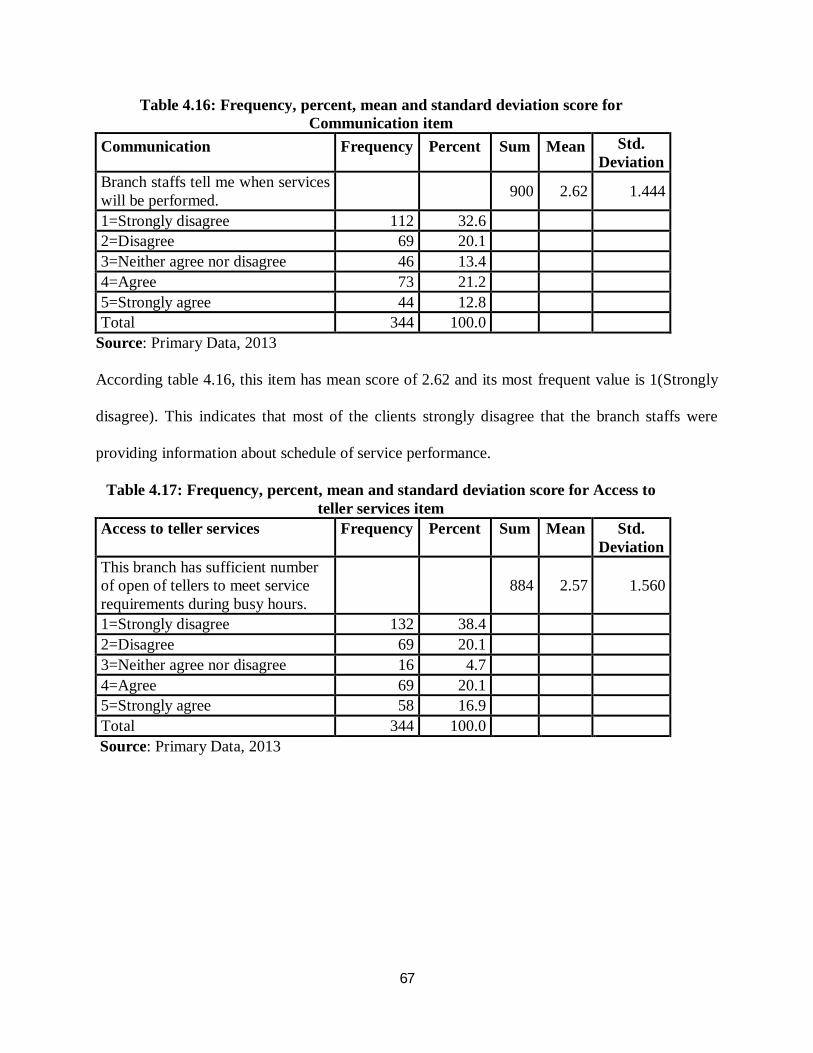
67
Table 4.16: Frequency, percent, mean and standard deviation score for Communication item
Communication Frequency Percent Sum Mean Std. Deviation
Branch staffs tell me when services will be performed. 900 2.62 1.444
1=Strongly disagree 112 32.6 2=Disagree 69 20.1 3=Neither agree nor disagree 46 13.4 4=Agree 73 21.2 5=Strongly agree 44 12.8 Total 344 100.0
Source: Primary Data, 2013
According table 4.16, this item has mean score of 2.62 and its most frequent value is 1(Strongly
disagree). This indicates that most of the clients strongly disagree that the branch staffs were
providing information about schedule of service performance.
Table 4.17: Frequency, percent, mean and standard deviation score for Access to teller services item
Access to teller services Frequency Percent Sum Mean Std. Deviation
This branch has sufficient number of open of tellers to meet service requirements during busy hours.
884 2.57 1.560
1=Strongly disagree 132 38.4 2=Disagree 69 20.1 3=Neither agree nor disagree 16 4.7 4=Agree 69 20.1 5=Strongly agree 58 16.9 Total 344 100.0 Source: Primary Data, 2013
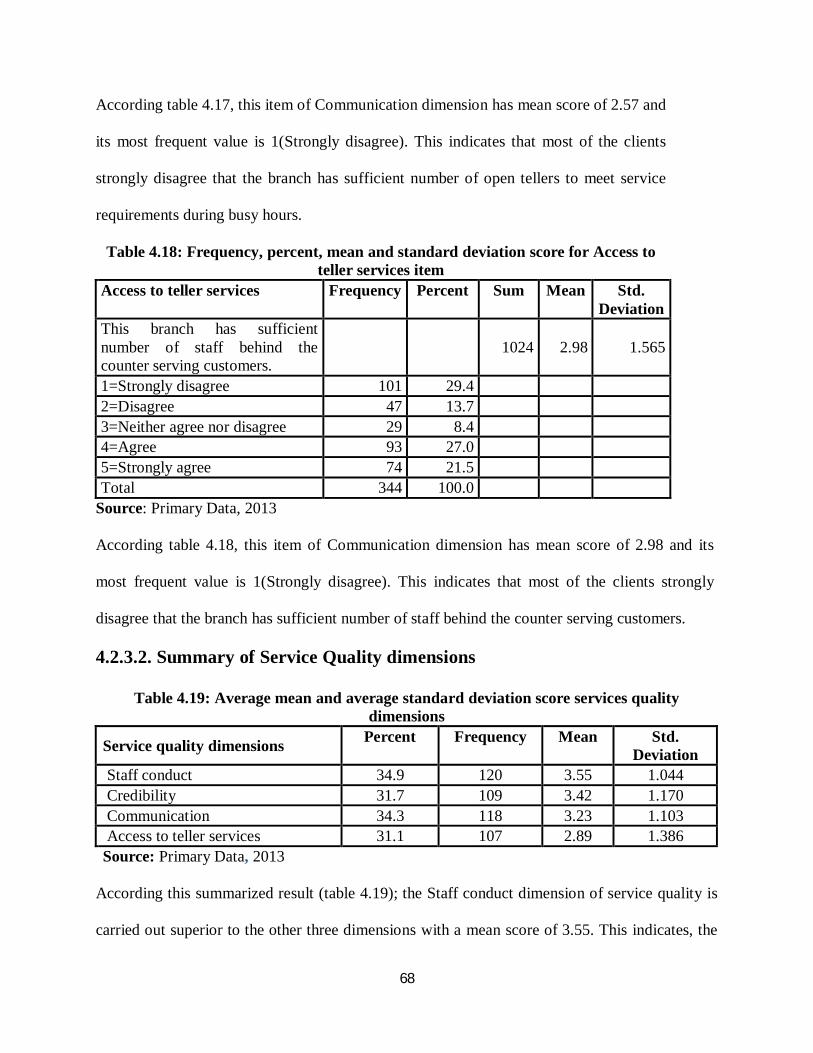
68
According table 4.17, this item of Communication dimension has mean score of 2.57 and
its most frequent value is 1(Strongly disagree). This indicates that most of the clients
strongly disagree that the branch has sufficient number of open tellers to meet service
requirements during busy hours.
Table 4.18: Frequency, percent, mean and standard deviation score for Access to teller services item
Access to teller services Frequency Percent Sum Mean Std. Deviation
This branch has sufficient number of staff behind the counter serving customers.
1024 2.98 1.565
1=Strongly disagree 101 29.4 2=Disagree 47 13.7 3=Neither agree nor disagree 29 8.4 4=Agree 93 27.0 5=Strongly agree 74 21.5 Total 344 100.0
Source: Primary Data, 2013
According table 4.18, this item of Communication dimension has mean score of 2.98 and its
most frequent value is 1(Strongly disagree). This indicates that most of the clients strongly
disagree that the branch has sufficient number of staff behind the counter serving customers.
4.2.3.2. Summary of Service Quality dimensions
Table 4.19: Average mean and average standard deviation score services quality dimensions
Service quality dimensions Percent Frequency Mean Std. Deviation
Staff conduct 34.9 120 3.55 1.044 Credibility 31.7 109 3.42 1.170 Communication 34.3 118 3.23 1.103 Access to teller services 31.1 107 2.89 1.386
Source: Primary Data, 2013
According this summarized result (table 4.19); the Staff conduct dimension of service quality is
carried out superior to the other three dimensions with a mean score of 3.55. This indicates, the
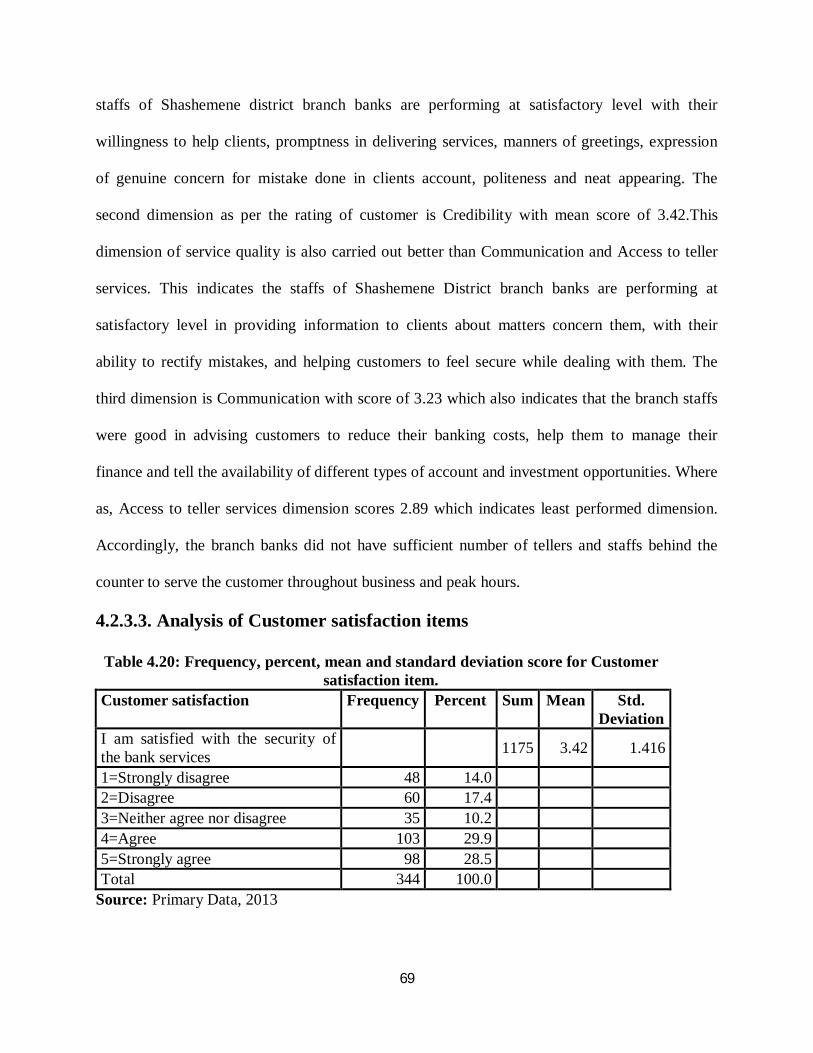
69
staffs of Shashemene district branch banks are performing at satisfactory level with their
willingness to help clients, promptness in delivering services, manners of greetings, expression
of genuine concern for mistake done in clients account, politeness and neat appearing. The
second dimension as per the rating of customer is Credibility with mean score of 3.42.This
dimension of service quality is also carried out better than Communication and Access to teller
services. This indicates the staffs of Shashemene District branch banks are performing at
satisfactory level in providing information to clients about matters concern them, with their
ability to rectify mistakes, and helping customers to feel secure while dealing with them. The
third dimension is Communication with score of 3.23 which also indicates that the branch staffs
were good in advising customers to reduce their banking costs, help them to manage their
finance and tell the availability of different types of account and investment opportunities. Where
as, Access to teller services dimension scores 2.89 which indicates least performed dimension.
Accordingly, the branch banks did not have sufficient number of tellers and staffs behind the
counter to serve the customer throughout business and peak hours.
4.2.3.3. Analysis of Customer satisfaction items
Table 4.20: Frequency, percent, mean and standard deviation score for Customer satisfaction item.
Customer satisfaction Frequency Percent Sum Mean Std. Deviation
I am satisfied with the security of the bank services 1175 3.42 1.416
1=Strongly disagree 48 14.0 2=Disagree 60 17.4 3=Neither agree nor disagree 35 10.2 4=Agree 103 29.9 5=Strongly agree 98 28.5 Total 344 100.0
Source: Primary Data, 2013
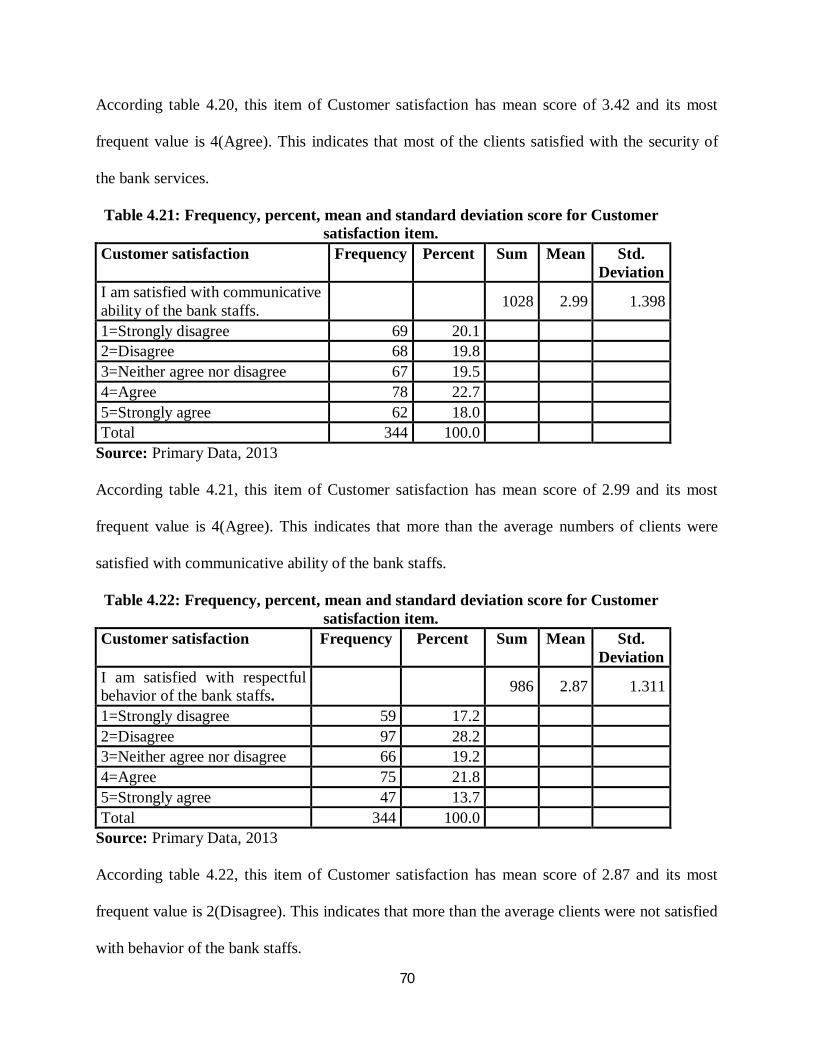
70
According table 4.20, this item of Customer satisfaction has mean score of 3.42 and its most
frequent value is 4(Agree). This indicates that most of the clients satisfied with the security of
the bank services.
Table 4.21: Frequency, percent, mean and standard deviation score for Customer satisfaction item.
Customer satisfaction Frequency Percent Sum Mean Std. Deviation
I am satisfied with communicative ability of the bank staffs. 1028 2.99 1.398
1=Strongly disagree 69 20.1 2=Disagree 68 19.8 3=Neither agree nor disagree 67 19.5 4=Agree 78 22.7 5=Strongly agree 62 18.0 Total 344 100.0
Source: Primary Data, 2013
According table 4.21, this item of Customer satisfaction has mean score of 2.99 and its most
frequent value is 4(Agree). This indicates that more than the average numbers of clients were
satisfied with communicative ability of the bank staffs.
Table 4.22: Frequency, percent, mean and standard deviation score for Customer satisfaction item.
Customer satisfaction Frequency Percent Sum Mean Std. Deviation
I am satisfied with respectful behavior of the bank staffs. 986 2.87 1.311
1=Strongly disagree 59 17.2 2=Disagree 97 28.2 3=Neither agree nor disagree 66 19.2 4=Agree 75 21.8 5=Strongly agree 47 13.7 Total 344 100.0
Source: Primary Data, 2013
According table 4.22, this item of Customer satisfaction has mean score of 2.87 and its most
frequent value is 2(Disagree). This indicates that more than the average clients were not satisfied
with behavior of the bank staffs.
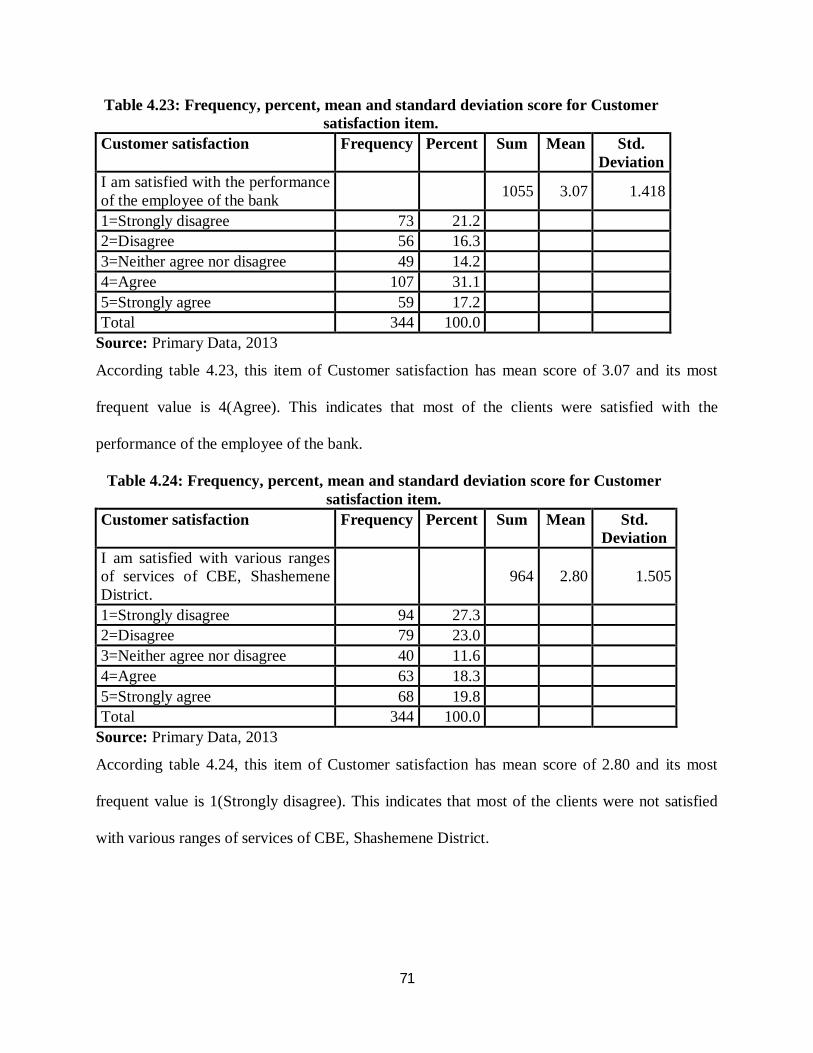
71
Table 4.23: Frequency, percent, mean and standard deviation score for Customer satisfaction item.
Customer satisfaction Frequency Percent Sum Mean Std. Deviation
I am satisfied with the performance of the employee of the bank 1055 3.07 1.418
1=Strongly disagree 73 21.2 2=Disagree 56 16.3 3=Neither agree nor disagree 49 14.2 4=Agree 107 31.1 5=Strongly agree 59 17.2 Total 344 100.0
Source: Primary Data, 2013
According table 4.23, this item of Customer satisfaction has mean score of 3.07 and its most
frequent value is 4(Agree). This indicates that most of the clients were satisfied with the
performance of the employee of the bank.
Table 4.24: Frequency, percent, mean and standard deviation score for Customer satisfaction item.
Customer satisfaction Frequency Percent Sum Mean Std. Deviation
I am satisfied with various ranges of services of CBE, Shashemene District.
964 2.80 1.505
1=Strongly disagree 94 27.3 2=Disagree 79 23.0 3=Neither agree nor disagree 40 11.6 4=Agree 63 18.3 5=Strongly agree 68 19.8 Total 344 100.0
Source: Primary Data, 2013
According table 4.24, this item of Customer satisfaction has mean score of 2.80 and its most
frequent value is 1(Strongly disagree). This indicates that most of the clients were not satisfied
with various ranges of services of CBE, Shashemene District.
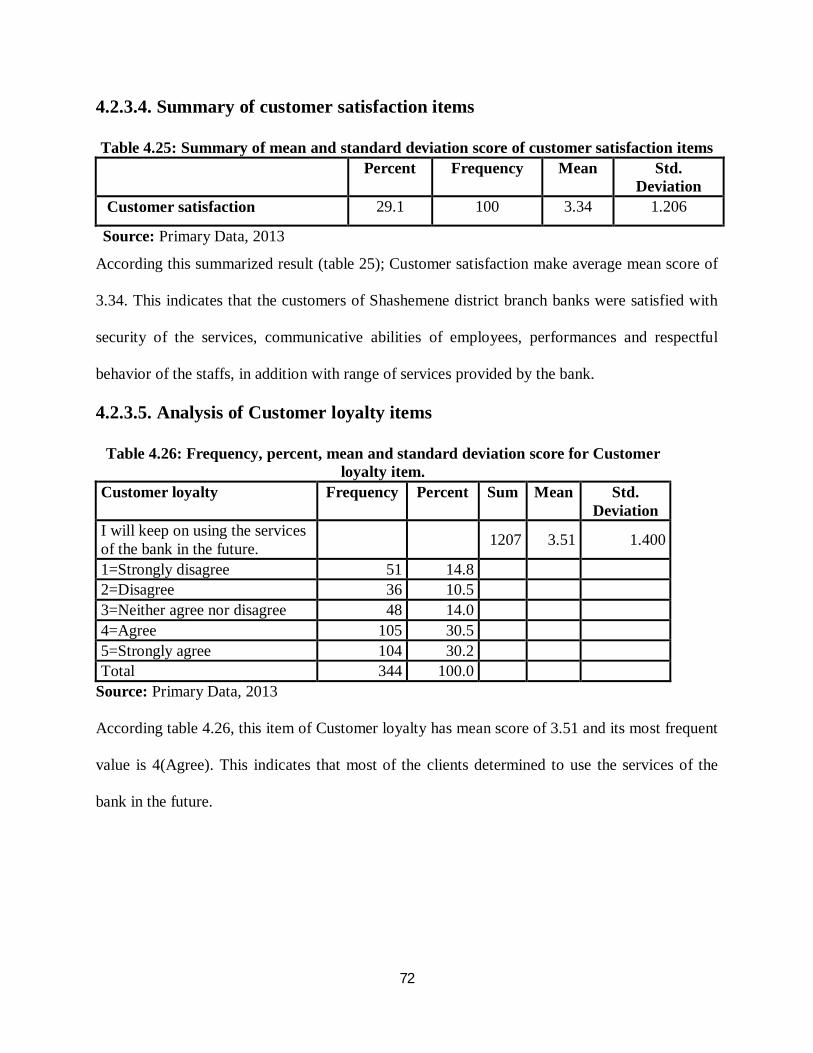
72
4.2.3.4. Summary of customer satisfaction items
Table 4.25: Summary of mean and standard deviation score of customer satisfaction items
Percent Frequency Mean Std. Deviation
Customer satisfaction 29.1 100 3.34 1.206
Source: Primary Data, 2013
According this summarized result (table 25); Customer satisfaction make average mean score of
3.34. This indicates that the customers of Shashemene district branch banks were satisfied with
security of the services, communicative abilities of employees, performances and respectful
behavior of the staffs, in addition with range of services provided by the bank.
4.2.3.5. Analysis of Customer loyalty items
Table 4.26: Frequency, percent, mean and standard deviation score for Customer loyalty item.
Customer loyalty Frequency Percent Sum Mean Std. Deviation
I will keep on using the services of the bank in the future. 1207 3.51 1.400
1=Strongly disagree 51 14.8 2=Disagree 36 10.5 3=Neither agree nor disagree 48 14.0 4=Agree 105 30.5 5=Strongly agree 104 30.2 Total 344 100.0
Source: Primary Data, 2013
According table 4.26, this item of Customer loyalty has mean score of 3.51 and its most frequent
value is 4(Agree). This indicates that most of the clients determined to use the services of the
bank in the future.
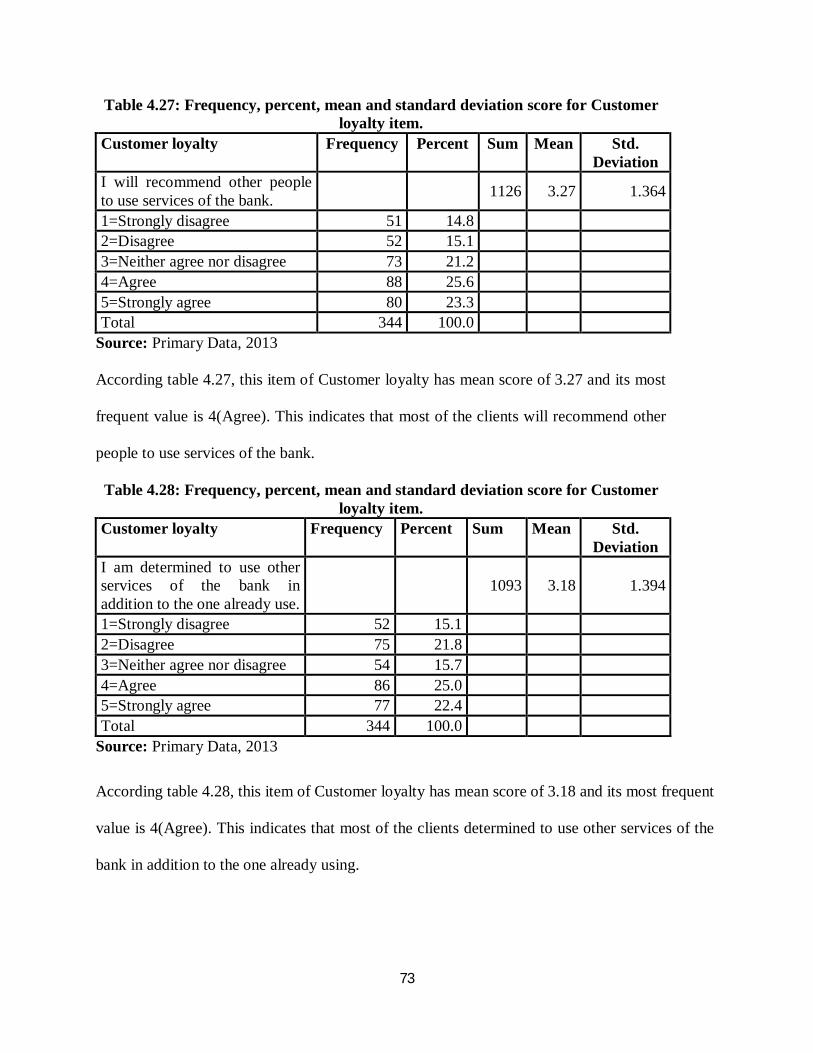
73
Table 4.27: Frequency, percent, mean and standard deviation score for Customer loyalty item.
Customer loyalty Frequency Percent Sum Mean Std. Deviation
I will recommend other people to use services of the bank. 1126 3.27 1.364
1=Strongly disagree 51 14.8 2=Disagree 52 15.1 3=Neither agree nor disagree 73 21.2 4=Agree 88 25.6 5=Strongly agree 80 23.3 Total 344 100.0
Source: Primary Data, 2013
According table 4.27, this item of Customer loyalty has mean score of 3.27 and its most
frequent value is 4(Agree). This indicates that most of the clients will recommend other
people to use services of the bank.
Table 4.28: Frequency, percent, mean and standard deviation score for Customer loyalty item.
Customer loyalty Frequency Percent Sum Mean Std. Deviation
I am determined to use other services of the bank in addition to the one already use.
1093 3.18 1.394
1=Strongly disagree 52 15.1 2=Disagree 75 21.8 3=Neither agree nor disagree 54 15.7 4=Agree 86 25.0 5=Strongly agree 77 22.4 Total 344 100.0
Source: Primary Data, 2013
According table 4.28, this item of Customer loyalty has mean score of 3.18 and its most frequent
value is 4(Agree). This indicates that most of the clients determined to use other services of the
bank in addition to the one already using.
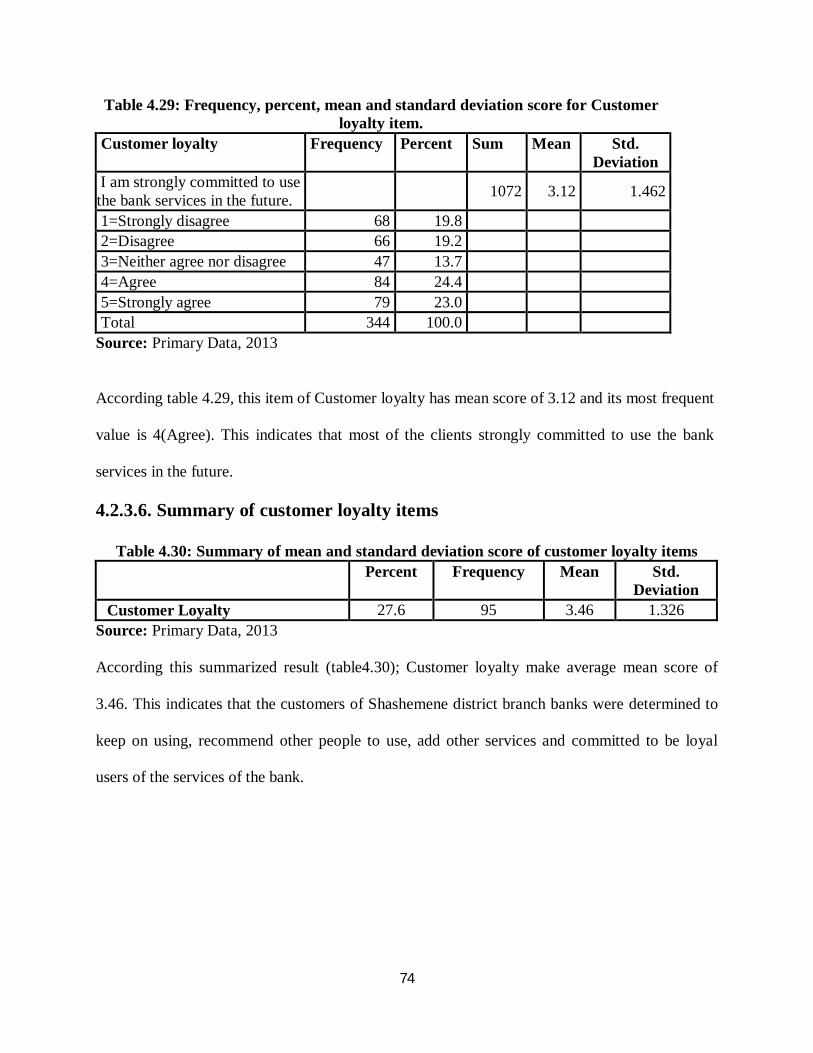
74
Table 4.29: Frequency, percent, mean and standard deviation score for Customer loyalty item.
Customer loyalty Frequency Percent Sum Mean Std. Deviation
I am strongly committed to use the bank services in the future. 1072 3.12 1.462
1=Strongly disagree 68 19.8 2=Disagree 66 19.2 3=Neither agree nor disagree 47 13.7 4=Agree 84 24.4 5=Strongly agree 79 23.0 Total 344 100.0
Source: Primary Data, 2013
According table 4.29, this item of Customer loyalty has mean score of 3.12 and its most frequent
value is 4(Agree). This indicates that most of the clients strongly committed to use the bank
services in the future.
4.2.3.6. Summary of customer loyalty items
Table 4.30: Summary of mean and standard deviation score of customer loyalty items
Percent Frequency Mean Std. Deviation
Customer Loyalty 27.6 95 3.46 1.326 Source: Primary Data, 2013 According this summarized result (table4.30); Customer loyalty make average mean score of
3.46. This indicates that the customers of Shashemene district branch banks were determined to
keep on using, recommend other people to use, add other services and committed to be loyal
users of the services of the bank.
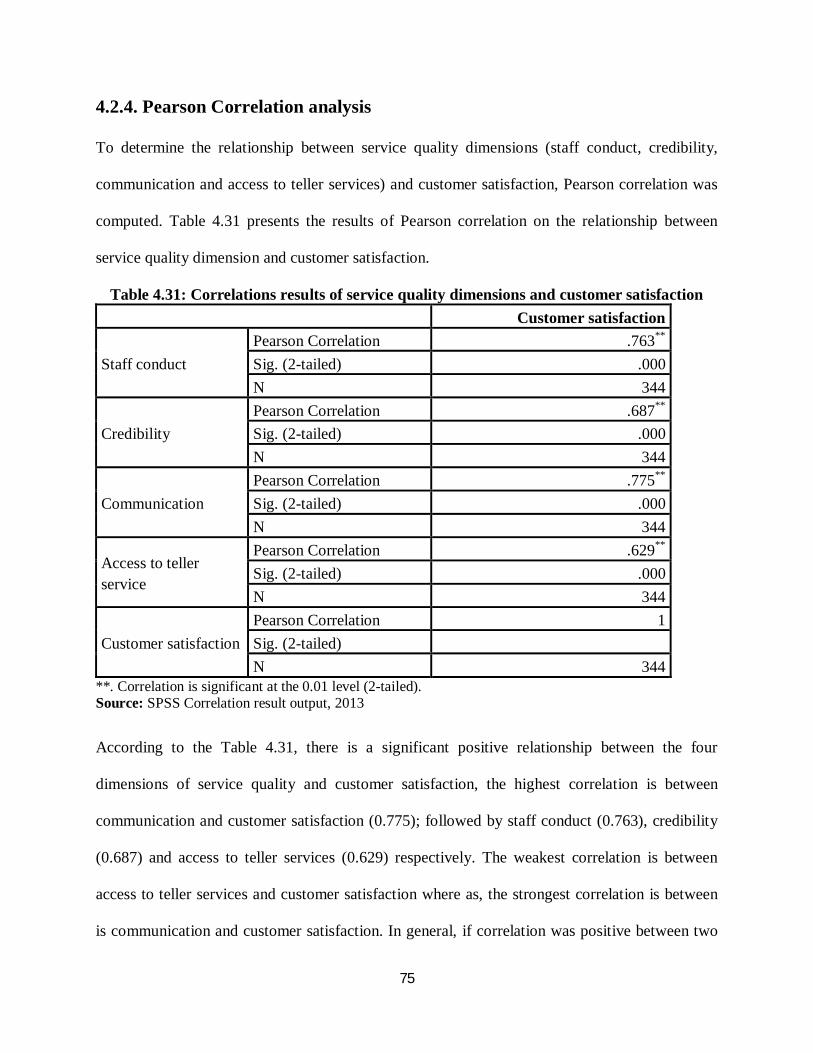
75
4.2.4. Pearson Correlation analysis
To determine the relationship between service quality dimensions (staff conduct, credibility,
communication and access to teller services) and customer satisfaction, Pearson correlation was
computed. Table 4.31 presents the results of Pearson correlation on the relationship between
service quality dimension and customer satisfaction.
Table 4.31: Correlations results of service quality dimensions and customer satisfaction Customer satisfaction
Staff conduct Pearson Correlation .763** Sig. (2-tailed) .000 N 344
Credibility Pearson Correlation .687** Sig. (2-tailed) .000 N 344
Communication Pearson Correlation .775** Sig. (2-tailed) .000 N 344
Access to teller service
Pearson Correlation .629** Sig. (2-tailed) .000 N 344
Customer satisfaction Pearson Correlation 1 Sig. (2-tailed) N 344
**. Correlation is significant at the 0.01 level (2-tailed). Source: SPSS Correlation result output, 2013
According to the Table 4.31, there is a significant positive relationship between the four
dimensions of service quality and customer satisfaction, the highest correlation is between
communication and customer satisfaction (0.775); followed by staff conduct (0.763), credibility
(0.687) and access to teller services (0.629) respectively. The weakest correlation is between
access to teller services and customer satisfaction where as, the strongest correlation is between
is communication and customer satisfaction. In general, if correlation was positive between two
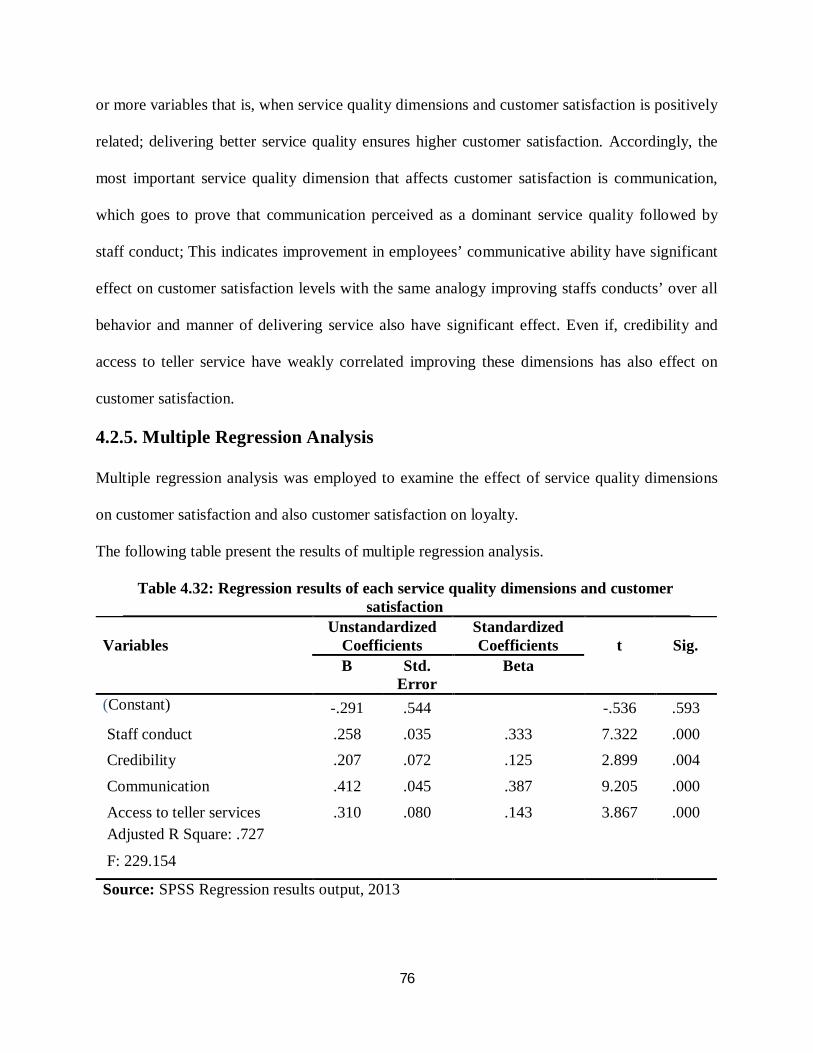
76
or more variables that is, when service quality dimensions and customer satisfaction is positively
related; delivering better service quality ensures higher customer satisfaction. Accordingly, the
most important service quality dimension that affects customer satisfaction is communication,
which goes to prove that communication perceived as a dominant service quality followed by
staff conduct; This indicates improvement in employees’ communicative ability have significant
effect on customer satisfaction levels with the same analogy improving staffs conducts’ over all
behavior and manner of delivering service also have significant effect. Even if, credibility and
access to teller service have weakly correlated improving these dimensions has also effect on
customer satisfaction.
4.2.5. Multiple Regression Analysis
Multiple regression analysis was employed to examine the effect of service quality dimensions
on customer satisfaction and also customer satisfaction on loyalty.
The following table present the results of multiple regression analysis.
Table 4.32: Regression results of each service quality dimensions and customer satisfaction
Variables
Unstandardized Coefficients
Standardized Coefficients
t
Sig.
B Std. Error
Beta
(Constant) -.291 .544 -.536 .593 Staff conduct .258 .035 .333 7.322 .000 Credibility .207 .072 .125 2.899 .004 Communication .412 .045 .387 9.205 .000 Access to teller services .310 .080 .143 3.867 .000 Adjusted R Square: .727 F: 229.154
Source: SPSS Regression results output, 2013
77
Table 4.32, indicates staff conduct, communication, access to teller service and credibility
dimension of service quality have a significant influence on customers’ satisfaction at 95%
confidence level. The significant service quality factors have been included for the establishment
of the function. The established regression function is:
Y = - 0.291 + 0.258X1 + 0.207X2 + 0.412X3 + 0.310X4
The regression results indicate all the service quality dimensions (staff conduct, communication,
access to teller service and credibility) combined significantly influence the satisfaction of
customers. The adjusted R2 of 0.727 indicates 72.7% of the variance in customer satisfaction can
be predicted by the service quality offered by the branch banks.
Hypothesis testing is based on standardized coefficients beta with 95% confidence level to test
whether the hypotheses are rejected or not.
Hypothesis 1
Ho1:There is a positive relationship between each service quality dimensions and customer
satisfaction in banking services.
Ha1: There is a positive relationship between each service quality dimensions and customer
satisfaction in banking services.
The results of multiple regressions, as presented in table 4.32 above, revealed that all service
quality dimensions have a positive and significant effect on customer satisfaction with a beta
value for staff conduct, 0.333, credibility, 0.125, communication, 0.387 and access to teller
service, 0.143 at 95% confidence level. Therefore, the researcher may accept the null hypothesis.
Since, all service quality dimensions have a positive and significant effect on customer
satisfaction.
78
Hypothesis 2
Ho2: There is a positive relationship between service quality and customer satisfaction in
banking services.
Ha2: There is a positive relationship between service quality and customer satisfaction in
banking services.
The results of multiple regressions, as presented in table 4.32 above, revealed that all the service
quality dimensions (staff conduct, communication, access to teller service and credibility)
combined significantly influence the satisfaction of customers. The adjusted R2 of 0.727
indicates 72.7% of the variance in customer satisfaction can be predicted by the service quality
offered by the branch banks. Therefore, the researcher may accept the null hypothesis. Since,
service quality has a positive and significant effect on customer satisfaction.
Table 4.33: Regression results of customer satisfaction and loyalty
Variables
Unstandardized Coefficients
Standardized Coefficient
t
Sig.
B Std. Error
Beta
(Constant) 3.237 .529 6.121 .000
Customer satisfaction .650 .033 .733 19.936 .000
Adjusted R Square: .536
F: 397.439
Source: SPSS Regression results output, 2013
According McIIroy and Barnett (2000) an important factor to be considered when developing a
customer loyalty is customer satisfaction. Satisfaction is a critical scale of how well customers’
needs and demands are met while customer loyalty is a measure of how likely a customer is to
repeat the purchases and engage in relationship activities. The above table displays the
79
relationship between customers satisfaction with their loyalty to the bank. In order to test the
relationship, linear regression is used. The established regression function is:
Y = 3.237 + 0.650X1
The regression result indicates customer satisfaction has significant and positive influence on
customers’ loyalty. The adjusted R2 of 0.536 indicates 53.6% of customer satisfaction is
associated with their loyalty. This indicates customer satisfaction plays an important role in
enhancing customer loyalty in branch banks found under Shashemene district.
Hypothesis 3
Ho2: There is a positive relationship between customer satisfactions and loyalty in banking
services.
Ha3: There is a positive relationship between customer satisfactions and loyalty in banking
services.
The results of multiple regressions, as presented in table 4.33 above, revealed that customer
satisfaction has a positive and significant effect on customer loyalty with a beta value (beta =
0.733), at 95% confidence level. Therefore, the researcher may accept the null hypothesis. Since,
customer satisfaction has a positive and significant effect on customer loyalty.
4.2.6. Discussion of interpretations
4.2.6.1. Descriptive statistics and correlation analysis for the service quality,
customer satisfaction and loyalty dimensions.
The finding of this study bear out the following:
Among the service quality dimensions the staff conduct items willingness, promptness,
expressions of genuine concern, politeness, and neatness attributes score high frequency
and mean value. This indicates that most customers of the banks were satisfied with
80
these attributes. In the contrary, with in this dimension customers were less satisfied with
greeting and apologetic manners of the branch staffs.
Communication’s dimension items branch staffs knowledge of the services leads the
other with highest frequency and means score followed by least scorers’ items like
informing about the means of reducing banking cost, advising how to manage finance,
telling about the time table of services performance and telling about different types of
accounts and investment availability. This indicates that customers were not satisfied
with most of the items under communication dimension.
All of the Credibility items score high mean and frequency value which reveals that most
customers are satisfied with the mistakes rectifying, informing and creating secure
environment ability of the staffs.
Regarding to Access to teller services items score least mean and frequency value which
indicates that most customers did not think, the bank has neither sufficient number of
teller nor sufficient number of staff behind the counter to provide services during peak
hours.
Among Customer satisfaction items security of the services and performances of the
employee got high percentage and mean value. On the other hand, communicative ability
of the staffs, behavior of the staffs and range of service available make less than average.
This specifies clients were less satisfied with these attribute and vice versa for high
scorer.
All of the customer loyalty items scored high percentage and mean value which
illustrates customers are willing to use in the future, recommend others people to use, add
other service of the bank and strongly committed to use the bank.
81
In general, customers were most satisfied with the staff conducts, credibility and communication
dimension of service quality. However, customers were less satisfied with access to teller
services. In addition, customers are determined to use the services of the bank in the future
recommend others to use and strongly committed to use the bank services.
The correlation result show that there is positive and significant relationship between
communication and customer satisfaction, staff conduct and customer satisfaction, credibility
and customer satisfaction, access to teller services and customer satisfaction. The finding further
indicates that the highest relationship is found between communication and customer satisfaction
followed by staff conduct dimension.
4.2.6.2. Regressing customer satisfaction on the service quality dimensions
The result of this study indicates that all service quality dimensions have a positive and
significant effect on customer satisfaction indicating quality banking service as a prerequisite for
establishing and having satisfied customers. According to the regression result, communication
and staff conduct are the dominant determinants of customer satisfaction followed by access to
tellers’ service and credibility dimensions. This indicates that banks’ staffs required improving
information providing ability, their knowledge of the services, advising how to manage finance
and telling types of account investment availability. Moreover, they also demanded to show
willingness, promptness, politeness and apologetic behavior to the customers.
Improvements done on access to tellers’ service and credibility items have also positive impact
on customer satisfaction. Overall, the results revealed that all independent variables accounted
for 72.7% of the variance in customer satisfaction (adjusted R2 = 0.727). Thus, 72.7% of the
variation in customer satisfaction can be explained by the four service quality dimensions and
82
other unexplored variables may explain the variation in customer satisfaction which accounts for
about 27.3%.
4.2.6.3. Regressing customer loyalty on the customer satisfaction
The positive and significant coefficient for customer satisfaction and loyalty relationship
suggests higher customer satisfaction on banking service and the higher the loyalty of customers
towards the banks. Thus, satisfied customer is important in developing a loyal customer.
Therefore, the bank should always strive to ensure that their customers are very satisfied with
security of its services, behavior of the staff, their communicative ability, their performance and
range service it is providing.
Customer loyalty and retention is potentially one of the most powerful weapons that financial
institutions can employ in their fight to gain a strategic advantage and survive in today’s ever-
increasing competitive environment. Moreover, banks need to develop strategies that enhance
loyalty of their customers. The adjusted R2 of 0.536indicates 53.6% of customer satisfaction is
associated with their loyalty. This indicates customer satisfaction plays an important role in
enhancing customer loyalty in Shashemene District banks.
83
CHAPTER FIVE
SUMMARY, CONCLUSIONS AND RECOMMENDATIONS
5.1. Introduction
This chapter deals with the summary of findings, conclusions drawn from the findings and the
recommendations forwarded for improvement in services delivery process of the branch banks.
The recommendations covers creating awareness of the importance improving on those
dimensions in which the banks got inferior score and also to keep working on the superior scored
dimensions. The chapter is presented under the headings: summary of findings, conclusions, and
recommendations.
5.2. Summary of Findings
The study was intended to investigate the influence of quality service on customers’ satisfaction
and loyalty in randomly selected five branch banks found under Commercial Bank of Ethiopia,
Shashemene District based on the questionnaire consisting of 344 conveniently selected
customers of these banks.
The results of background information of respondents indicated that majority of the total
respondents (75%) are male, (50.9%) aged in the range of 18-29 years, (48%) are high school
graduates, (53.8%) of the respondents are bachelor, (35.5%) have five and above family size, and
(55.8%) of the respondent are saving account users.
The results of the descriptive statistical analysis also indicated that, customers were most
satisfied with the staffs conduct and credibility dimensions of service quality followed by
communication. However, customers were less satisfied with access to teller service dimensions
of service quality.
84
The correlation result show that there is a positive and significant relationship between
communication and customer satisfaction, staff conduct and customer satisfaction, credibility
and customer satisfaction, access to tellers service and customer satisfaction. The finding also
indicates that the highest relationship was found between communication and customer
satisfaction, while the lowest relationship was found between access to teller services and
customer satisfaction.
The multiple regression results showed that all service quality dimensions (staff conduct,
communication, access to teller service and credibility) have positive and significant effect on
customer satisfaction. The R square value of 0.727, demonstrates that 72.7% of variation in
customer satisfaction can be accounted by the service quality dimensions. Furthermore, customer
satisfaction has positive and significant effect on and loyalty. The adjusted R2 of 0.536 indicates
53.6% of customer satisfaction is associated with their loyalty.
5.3. Conclusions
The main aim of the study was to assess the service quality of CBE, Shashemene District branch
banks and its impact on customer satisfaction and loyalty. The study tried to test the relationship
that exists between service quality dimensions and customer satisfaction; customer satisfaction
and loyalty. The mean score values for service quality dimensions was between 2.89 and 3.55.
The multiple regression results showed that all service quality dimensions have positive and
significant effect on customer satisfaction. The R square value of 0.727, demonstrates that 72.7%
of variation in customer satisfaction can be accounted by the service quality dimensions.
Besides, customer satisfaction has positive and significant effect on and loyalty. The adjusted R2
of 0.536 indicates 53.6% of customer satisfaction is associated with their loyalty.
Hence, the study comes up with the following conclusion:
85
The ability to deliver quality service has a positive effect on customer satisfaction.
Therefore, customers of Shashemene District banks wish to have quality services from
the banks. However, the banks are not providing quality service as desired; the banks
employees are not good in asking apology, greeting, politeness, promptness and
expressions of genuine concerns all of which are elements of quality services.
In general, credibility of the banks services were relatively good, the staffs were good in
providing information, rectifying mistakes and creating secure environment.
Knowledge and competence of service providers and the ability to help and advice
customers that benefit them has positive effect on customer satisfaction. But employees
in the banks have a problem in helping and advising customers on how to manage their
finance and reduce banking costs. In addition, the employees were not telling when
services performed and the availability different types of account and investment
opportunities.
The sufficiency of open tellers to meet services requirements during busy hours and the
number of sufficient number of staff behind the counter have positive effect on customer
satisfaction cause it help customer to avoid long ques. However, the district banks do not
have sufficient number of tellers and staffs behind the counter.
In general, the following specific empirical findings emerged from the investigation: The four
service quality dimensions including staff conduct, credibility, communication and access to
teller service have positive and significant effect on customer satisfaction. The findings of this
study also indicated that communication is the most important factor to have a positive and
significant effect on customer satisfaction. In addition to this, the four service quality dimensions
86
significantly explain the variations in customer satisfaction. Further more, customer satisfaction
also explain the variations in loyalty of the customers.
5.4. Recommendations/Suggestions
Based on the findings and conclusions of the study, the researcher forwards the following
recommendations to the management of the banks and the staffs.
Even if credibility scores high mean and frequency value but there are still customers
who were not persuaded by this dimension so that, the bank should up grade its
performance capabilities on providing information, in rectifying mistakes and in creating
secure environment.
Since, there were customers who were not satisfied by the Staff conduct dimension so
that the bank staffs should be trained and motivated by managers to be willing, prompt,
polite and neat also express genuine concern to customers when they serve customers.
The score of Communication dimension shows inferior mean and frequency value so
that, the bank managers should motivate and train the staff members to over come their
underperformances pertaining to advising customers about managing finance, helping
customers to keep down banking costs and telling customers the availability different
types of account and investment opportunities.
Access to teller service dimension was considered as one of the most important factors
influencing customer satisfaction. However, the customers of the branch banks were
found less satisfied in terms of this dimension. One way of addressing this could be
adding the number of tellers and staffs behind the counter serving customers so that, the
branches could avoid waiting time and long lines.
87
The finding of the study also indicates that customer’s of the branch banks were satisfied
with security of the services, communicative abilities of employees, performances and
respectful behavior of the staffs, in addition with range of services provided by the bank.
However, this should not mean it lasts for ever. So there is a need for management bodies
to evaluate their status constantly and work for continuous improvements.
Furthermore, customer loyalty scores high mean and frequency value but the managers
should not be over buoyant by these scores so that, they will work hard to achieve a level
of satisfaction that will make customers to use in the future, recommend other people to
use and add other services of the bank.
To sum up, keeping the customers satisfied contributes in attracting as well as in making
customers loyal to the organization, the employees of the banks and managers should exhibit
professional manners, earn credibility, enhance their communication ability and assign sufficient
number of tellers and staff members especially during peak hours. Moreover, to serve the
customers well, providing timely training and development for employees plays a great role.
Thus, the banks should give training to staff to enable them in serving the customers well and
provide them with relevant and timely information that enables the banks also to have proper
communication among staff members and ensuring error-free and delayed transaction.
In general, banks have to improve performance on all the dimensions of service quality in order
to increase customer satisfaction and bringing the customers to higher level of loyalty since
consumers expect more than what is been offered by other banks. This will enable them maintain
high level of competitiveness in retail banking industry.
88
5.5. Implications for Future Research
This study was conducted to examine the effect of customer service quality on customer
satisfaction and loyalty in selected branch banks of CBE, Shashemene District. The sample was
drawn from only five branch banks, thus this study may be limited in its generalizability of the
findings to others branch of the district and the private banks found. So, future research should
have to draw sample of respondents on more number of branch banks of the district and also
private banks for the sake generalizing the results of the study.
This study included only four factors, there could be some other relevant factors that may be
perceived as important by customers, but those were excluded from this study. Future researches,
therefore, may consider more factors, like corporate image, location, price, technology
employed, security issues and other variables which can influence customer satisfaction.
Additionally, it is also better if comparative study will be conducted between public and private
banks with similar issue at hand so as to find out other factors that can affect customer
satisfaction and if there is different factor that can affect customer satisfaction as a matter of
form of ownership.
Furthermore, conducting a replication study in other service industries is also needed; for
example in the hotel service, telecommunication service, post office service and so on.
89
REFERENCES
Text Books:-
Joseph F. Hair, Robert P. Bush & David J. Ortinau (2003). Marketing Research, 2nd Edition,
New Delhi, India. Tata Mc Graw-Hill Publishing Company.
Santosh Gupta (2007). Research Methodology and Statistical Techniques. Rajouri Garden, New
Delhi. Deep &Deep publication Pvt. Ltd Publications.
Electronic Books:-
Alan B. and Emma B. (2007). Business Research Methods, 2nd edition. Oxford University Press.
Available from www.gobookee.net/business-research-methods-bryman-bell/
American Psychological Association (2002). A P A style guide electronics referencing.
American Psychological Association, 750 First Street, NE, Washington, DC., Available
from http://www.apa.org/books/
C.R. Kothari (2004). Research Methodology: Method and Techniques. Available from
http://www.newagepublishers.com.
Christopher L. and, Jochen W. (2006). Services Marketing, people, technology, strategy, 7th
edition, pp.314-345. Available from http://www. aculty.mu.edu.sa/public.
Crosby Philip B. (1984). Quality without Tears: The Art of Hassle Free Management, New
York, McGraw-Hill. Available from http:// www.abebooks.co.uk.
Kotler P. and Armstrong G. (2012). Principles of Marketing. 14th Edition, NewJersy, USA.
Pearson Education Inc. Available from http://www. freepdfdb.com.
Nancy L. Leech, Karen C. Barrett and George A. Morgan (2005). SPSS for Intermediate
Statistics: Use and Interpretation 2nd Edition, 10 Industrial Avenue Mahwah, New Jersey,
90
USA. Lawrence Erlbaum Associates Inc. Publishers. Available from http://www.
reengineering.webs.com.
Taro Yamane (1973). Statistics, An Introductory Analysis, 3rd edition, New York: Harper and
Row. Available from www.worldcat.org/oclc/39121222/
Gazette:-
Negaret Gazetta (1994). Ethiopian Government, Licensing and Supervision of Banking Business
Proclamation No. 84/94.Available from http;//www.fsc.gov.et/resources/
Thesis:-
Tizazu K. (2012). The Effect of Customer Service Quality on Customer Satisfaction in Selected
Private Banks (Addis Ababa). MBA Thesis, Department of Business Administration.
Retrieved from http://www.etd.aau.edu.et/dspace/bitstream/ 123456789/4494/
Journals:-
Adam E. and Simon S. (2009). Understanding consumer preference in the flower industry.
Retrieved February 10, 2013from http://www.flowercouncil.org.
Ahmossawi M. (2001). Bank selection criteria employed by college students in Bahrain: an
empirical analysis. International Journal of Bank Marketing 19(3): 115-125. Retrieved
April 10, 2013, from http://www.bjournal.co.uk/BJASS.aspx.
Anderson, Eugene W. and Vikas M. (2000), “Strengthening the Satisfaction-Profit Chain,”
Journal of Service Research, 3 (2), 107-120. Retrieved April 1, 2013, from
http://www.academicjournals.org/AJBM
Asubonteng P, McCleary KJ, Swan JE (1996). SERVQUAL revisited: a critical review of
service quality. Journal of Service Marketing 6(6):62-81. Retrieved March10, 2013, from
http://www.bjournal.co.uk/BJASS.aspx
91
Avkiran NK (1994). Developing an Instrument to Measure Customer Service Quality in Branch
Banking. International Journal of Bank Marketing 12(6):10-18. Retrieved February28,
2013, from http://first.emeraldinsight.com/journal.htm?issn=0265-2323 and
volume=17&issue=2.
Avkiran NK (1999). Quality Customer Service Demands Human Contact. International Journal
of Bank Marketing 17(2):61-71. Retrieved April 02, 2013, February28, 2013, from
www.emeraldinsight.com/journals.htm?articleid=854985.
Babatunde A. and Olukemi L. (2012).Customers Satisfaction and its Implications for Bank
Performance in Nigeria Retrieved April 14, 2013, from
http://www.bjournal.co.uk/BJASS.aspx
Belay G. (1987). Currency and banking: Ethiopia. Retrieved from
http://www.ethiopianreview.com/archive/164095842808211102_ethiopia.html .
Belay K. (1998). Instability of Ethiopian‘s Export Earnings: The contribution of major
agricultural commodities. Ethiopian Journal of Agricultural Economics, Volume 2, No. 1.
Addis Ababa. pp. 1-10. Retrieved from http://www. archive.lib.msu.edu.
Bitner, M.J. (1990). Evaluating service encounters: the effect of physical surroundings and
employee responses. Journal of Marketing, 54, 69-82. Retrieved March 10, 2013,
http://www.emeraldinsight.com.
C.N. Krishna Naik, Swapna Bhargavi Gantasala and Gantasala V. Prabhakar (2010). Service
Quality (Servqual) and its Effect on Customer Satisfaction in Retailing, European Journal
of Social Sciences – Volume 16, Number 2. Retrieved March 02, 2013, fromhttp: //
www.ccsenet.org/ijbm.
92
Caruana A. (2002). Service loyalty: the effects of service quality and the mediating role of
customer satisfaction. European Journal of Marketing, Vol. 36 No. 7/8, pp. 811-28.
Retrieved from http://www.emeraldinsight.com/ journals.html.
Catherine Mc Guinn (2009). The future of customer service. Irish Marketing Review Volume
20, Number 1, Mercury Publications. Retrieved from http://
www.mii.ie/attachments/wysiwyg/6051/IMRVol20_McGuinn.pdf.
Charles H. (2010).Banking reform in Ethiopia. Retrieved April 2, 2013, from http://www.
edoc.bibliothek.unihalle.de/servlets//HALCoRe.../IDS_Wp37.pdf
Clemes MD (2008). An empirical analysis of customer satisfaction in international air travel,
Innovative Marketing, 4: 49-62. Retrieved March 24, 2013, from http://
www.ccsenet.org/ijbm.
Cronin J, Taylor A (1992). Measuring Service Quality: A Reexamination and Extension. Journal
of Marketing 6:55-68. Retrieved March 24, 2013, from http://
www.emeraldinsight.com/0265-666X.html.
Cronin JJ, Taylor SA (1994). SERVPERF versus SERVQUAL: Reconciling performance based
and perceptions-minus-expectations measurement of service quality. Journal of
Marketing 58(1):125-131. Retrieved March 24, from http://
www.emeraldinsight.com/0265-671X.html.
Daniel O. Auka (2012). Service quality, Satisfaction, Perceived value and Loyalty among
customers in Commercial Banking in Nakuru Municipality, Kenya. African Journal of
Marketing Management Vol. 4(5), pp.185-203, Retrieved April 04, 2013, from
http://www.academicjournals.org/AJMM.
93
Francis B. (1996). Relationship Marketing: Theory and Practice. Paul Chapman Publishing,
London pp.1–16.Retrived from http://www.dx.doi.org/ 10.1016/S0019-8501(00)00112-7.
Gronroos C. (1984). A service quality model and its market implications. European Journal of
Marketing 18(4): 36-44. Retrieved on March 10, 2012 from nccur.lib.nccu.edu.tw/bit
stream/140.119/35446/10.
Joan L.Giese (2012).Definition of consumer satisfaction. Academy of Marketing Science
Review, Volume 2000. Retrieved on June 01, 2012 from http://www.amsreview.org/
articles/giese01-2000.pdf.
Junaid Zafar, Nik Kamariah Nik Mat, Theeb M.A. AL Motairi, Meddour Houcine, Egab Al
Otaibi, Muhammad S. Al Alawni and Jamal M. Alekam (2012). Staff Conduct,
Communication, Access to Service and Customer Satisfaction: The Mediating Effect of
Credibility. American Journal of Economics June 2012, Special Issue: 37-40. Retrieved
on April 02, 2013, from http://www. Journal.sapub.org /economics.
Kambiz H. Hanzaee and Seyed A. Seyed S. (2011). A perceived service quality measurement
scale in Iran’s retail banking market. African Journal of Business Management Vol.5 (5),
pp. 1804-1810.Retrieved April 27, 2013, from http://www.academicjournals.org/AJBM.
Kazi O. Siddiqi (2011). Interrelations between Service Qualities Attributes, Customer
Satisfaction and Customer Loyalty in the Retail Banking Sector in Bangladesh.
International Journal of Business and Management Vol. 6, No. 3. Retrieved April 14,
2013, from http: //www.ccsenet.org/ijbm.
Kiyota, k. Barbara P. and Robert M Stern (2007). The Case of Financial Sector Liberalization in
Ethiopia. Gerald R. Ford School of Public Policy The University of Michigan Ann Arbor,
94
Michigan 48109-309, Discussion Paper No. 565. Retrieved April 02, 2013, from
http://www. Fordschool.umich.edu/rsie/working papers/wp.html.
Ladhari, R. (2009). A review of twenty years of SERVQUAL research, International Journal of
Quality and Service Sciences, Vol. 1, Number 2. P.172-198. Retrieved
fromhttps://www.eprints.mdx.ac.uk/6929/2/Boulter_-_QMODPAPER.pdf .
Lin, Chia Chi, (2009). A critical appraisal of customer satisfaction and ecommerce. Managerial
Auditing Journal, Vol. 18 No. 3, pp. 202-212.Retrieved from libra.msra.cn › Publications.
Maive S. (2003).Service Quality-Main Conceptualizations and Critique. Tartu University Press,
Order No.742. Retrieved April 25, 2013, from http://www.tyk.ut.ee.
McColl-Kennedy, J. and Schneider, U. (2000). Measuring customer satisfaction: why, what and
how. Total Quality Management, 11 (7), 1-14. Retrieved April 25, 2013, from
http://www.vps.ns.ac.rs/SB/2011/7.12.pdf
McIlroy A, Barnett S (2000). Building Customer Relationships: Do Discount Cards Work?
Managing Service Quality, 10(6), 347-355. Retrieved from http://
www.emeraldinsight.com/journals.htm?articleid=842707.
Mesay S. (2012). Bank Service Quality, Customer Satisfaction and Loyalty in Ethiopian
Banking Sector. Retrieved from http://www.apexjournal.org/JBAMSR.
Mohammed Al-Hawari, Nicole Hartley and Tony Ward (2005). Measuring Banks’ Automated
Service Quality: A Confirmatory Factor Analysis Approach. Marketing Bulletin, 2005,
16, Article 1, Retrieved February 12, 2013, from http://www. http://marketing-
bulletin.massey.ac.nz.
Mohsan F. (2011). Impact of Customer Satisfaction on Customer Loyalty and Intentions to
Switch: Evidence from Banking Sector of Pakistan, International Journal of Business
95
Social Science 2(16). Retrieved March 12, 2013, from
http://www.ijbssnet.com/journals/Vol_2_No_16.
Negi, R. (2009). Determining customer satisfaction through perceived service quality: A study
of Ethiopian mobile users, International Journal of Mobile Marketing; Vol.4, Number 1;
p.31-38.Retrieved from umu.diva-portal.org.
Oliver, R. L. (1993).Cognitive, Affective, and Attribute Bases of the Satisfaction Response.
Journal of Consumer Research, December 20, pp. 418-430.Retrieved from
http://www.marketingscales.com/sites//Marketing-Scales-Sample-review.
Oliver, R.L. (1997). Satisfaction: A behavioral perspective on the consumer. New York, NY:
Irwin McGraw-Hill. Retrieved from http:// www.121qa.com/docs/121QA
_White_Paper.pdf
Parasuraman A, Berry LL, Zeithaml VA (1985). “A conceptual model of service quality and its
implication for future research”, Journal of Marketing. 49(4): 41-50. Retrieved from
:http//www.academia.edu/
Parasuraman A, Zeithaml VA, Berry L (1988).”SERVQUAL: a multiple-item scale for
measuring customer perceptions of service quality”, Journal of Retailing.64: 12-40.
Retrieved from :http// www.academia.edu/
Parasuraman A, Zeithaml VA, Berry L (1988).The Service-Quality puzzle. Business Horizon.
Journal of Marketing Research. Retrieved from :http//
www.ijaser.com/articles/vol1issue42012/vol1issue4/JASER120065.pdf
Peter O. (2010). Mobile Banking in Africa: Taking the Bank to the People. Volume 1, Issue 8.
Retrieved from http://www.afdb.org.
96
R. Renganathan, S. Balachandran and K. Govindarajan (2012).Customer perception towards
banking sector: Structural equation modeling approach. African Journal of Business
Management Vol.6 (46), pp. 11426-11436.Retrieved April 02, 2013, from
http://www.academicjournals.org/AJBM.
Rahim Mosahab, Osman Mahamad, and T. Ramayah (2010). Service Quality, Customer
Satisfaction and Loyalty: A Test of Mediation. International Business Research, Vol.3,
No. 4. Retrieved May 14, 2013, from http: // www.ccsenet.org/ibr.
Rao, K. S. P. and Saravanan, R. (2007). Measurement of service quality from the customer’s
perspective – An empirical study, Total Quality Management, Vol.18. No. 4, p.435-449.
Retrieved from http://www.businessperspectives.org/
Ravichandran K. (2010). Influence of Service Quality on Customer Satisfaction, Application of
SERVQUAL Model, International Journal of Business Management 5: 117-124.Retrived
from http://www.nyit.edu/
Regan W.J. (1963). “The Service Revolution”, Journal of Marketing, 47, 57 – 62. Retrieved
from http://www.iu.diva-portal.org/smash/get/diva2:434592/
Rigopoulou, Irini D, Tsiotsou, Rodoula H, Kehagias, John D (2008).Shopping orientation-
defined segments based store-choice criteria and satisfaction: an empirical investigation.
Published in Journal of Marketing Management. Retrieved from http://
www.econbiz.de/.../
Russell Wolak, Stavros Kalafatis and Patricia Harris (1998). An Investigation into Four
Characteristics of Services. Kingston Business School, Kingston Hill, Kingston upon
Thames, Surrey KT2 7LB. Journal of Empirical Generalisations in Marketing Science,
97
Volume Three, Page, 26. Retrieved from http://
www.members.byronsharp.com/empgens/emp1.pdf.
Sanjay K Jain and Garima Gupta (2004) Measuring Service Quality: SERVQUAL vs.
SERVPERF Scales. VIKALPA, Volume 29, No. 2. Retrieved from
http://www.vikalpa.com/pdf/articles/2004/2004_apr_jun_25_37.pdf
Sio Hong Tih, Sean Ennis & June M. L. Poon. (2008). Attitude towards online retailing
services: Asian Academy of Management Journal, Vol. 13, No. 1, 113–126. Retrieved
from http://web.usm.my/aamj/13.1.2008/aamj%2013-1-6.pdf
Sudharshan, D. (1995), Marketing Strategy: Relationships, Offerings, Timing and Resource
Allocation, Prentice Hall, New Jersey. Retrieved from
http://www.aabri.com/manuscripts/09204.pdf
Tibebu D. (2006). National Bank of Ethiopia Issued Directive on Provisions of International
Remittance Service. Retrieved April 30, 2013, from http:www.primopdf.com.
Vijay M. Kumbhar (2011). Customers’ satisfaction in ATM service: An empirical evidence
from public and private sector banks in India. Management Research and Practice Vol. 3
Issue 2 (2011) pp: 24-35. Retrieved April 27, 2013, from http://www. mrp. ase.ro.
Zeithaml V.A., Parasuraman A. and Berry L.L. (1985). Problems and Strategies in Services
Marketing, Journal of Marketing, 49, 33–46. Retrieved from http://www. areas.kenan-
flagler.unc.edu/marketing/
Web site:-
Definition of Commercial Bank (n.d). Investopedia online dictionary. Retrieved April 01, 2013
from http://www Investopedia.com /terms/c/c/dictionary/
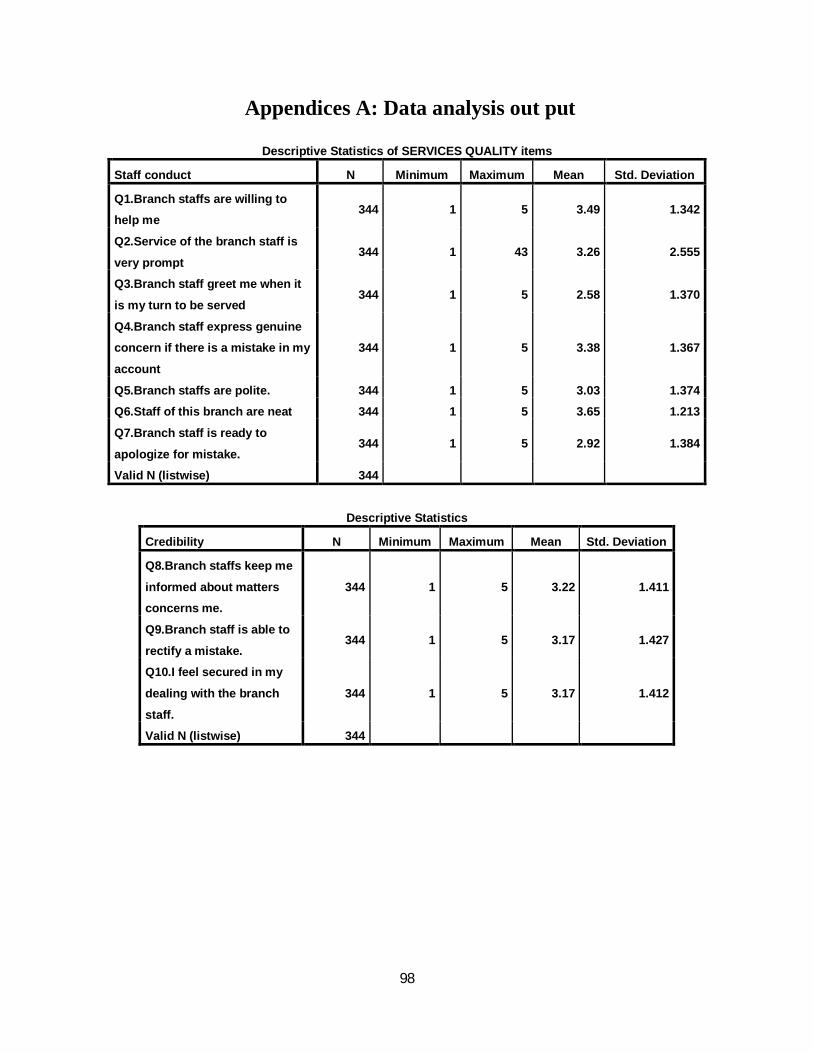
98
Appendices A: Data analysis out put
Descriptive Statistics of SERVICES QUALITY items
Staff conduct N Minimum Maximum Mean Std. Deviation
Q1.Branch staffs are willing to
help me 344 1 5 3.49 1.342
Q2.Service of the branch staff is
very prompt 344 1 43 3.26 2.555
Q3.Branch staff greet me when it
is my turn to be served 344 1 5 2.58 1.370
Q4.Branch staff express genuine
concern if there is a mistake in my
account
344 1 5 3.38 1.367
Q5.Branch staffs are polite. 344 1 5 3.03 1.374
Q6.Staff of this branch are neat 344 1 5 3.65 1.213
Q7.Branch staff is ready to
apologize for mistake. 344 1 5 2.92 1.384
Valid N (listwise) 344
Descriptive Statistics
Credibility N Minimum Maximum Mean Std. Deviation
Q8.Branch staffs keep me
informed about matters
concerns me.
344 1 5 3.22 1.411
Q9.Branch staff is able to
rectify a mistake. 344 1 5 3.17 1.427
Q10.I feel secured in my
dealing with the branch
staff.
344 1 5 3.17 1.412
Valid N (listwise) 344
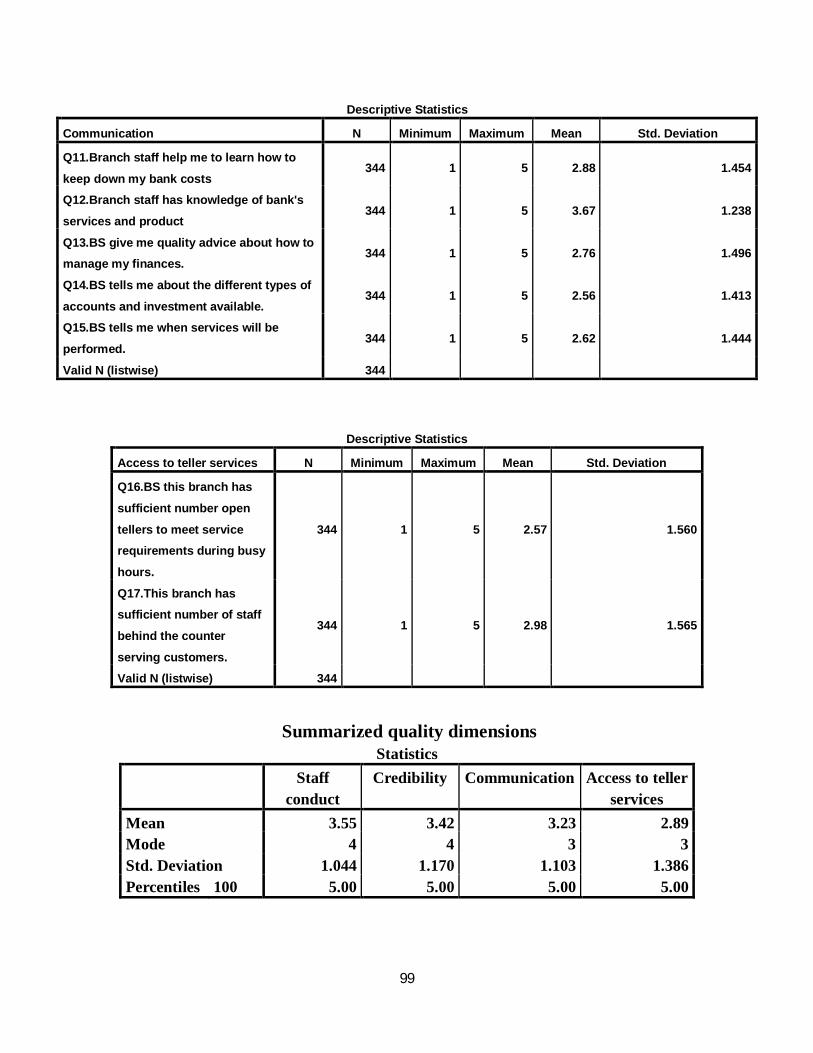
99
Descriptive Statistics
Communication N Minimum Maximum Mean Std. Deviation
Q11.Branch staff help me to learn how to
keep down my bank costs 344 1 5 2.88 1.454
Q12.Branch staff has knowledge of bank's
services and product 344 1 5 3.67 1.238
Q13.BS give me quality advice about how to
manage my finances. 344 1 5 2.76 1.496
Q14.BS tells me about the different types of
accounts and investment available. 344 1 5 2.56 1.413
Q15.BS tells me when services will be
performed. 344 1 5 2.62 1.444
Valid N (listwise) 344
Descriptive Statistics
Access to teller services N Minimum Maximum Mean Std. Deviation
Q16.BS this branch has
sufficient number open
tellers to meet service
requirements during busy
hours.
344 1 5 2.57 1.560
Q17.This branch has
sufficient number of staff
behind the counter
serving customers.
344 1 5 2.98 1.565
Valid N (listwise) 344
Summarized quality dimensions
Statistics Staff
conduct Credibility Communication Access to teller
services Mean 3.55 3.42 3.23 2.89 Mode 4 4 3 3 Std. Deviation 1.044 1.170 1.103 1.386 Percentiles 100 5.00 5.00 5.00 5.00
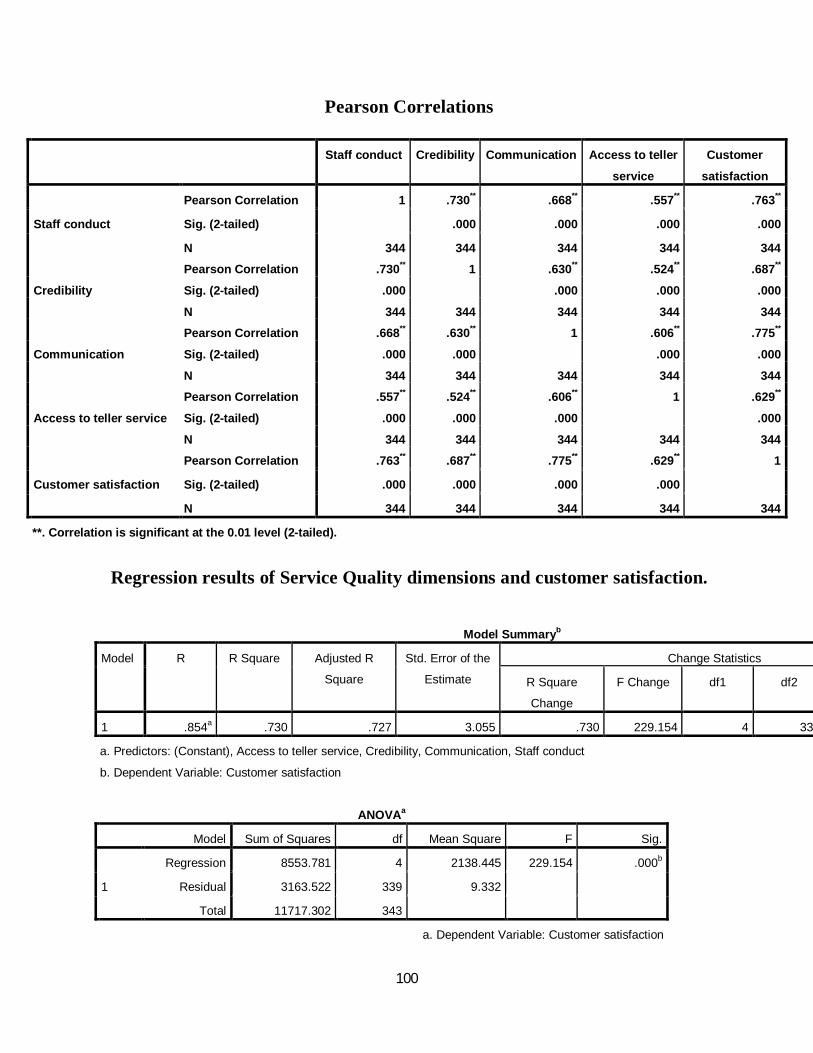
100
Pearson Correlations
Staff conduct Credibility Communication Access to teller
service
Customer
satisfaction
Staff conduct
Pearson Correlation 1 .730** .668** .557** .763**
Sig. (2-tailed) .000 .000 .000 .000
N 344 344 344 344 344
Credibility
Pearson Correlation .730** 1 .630** .524** .687**
Sig. (2-tailed) .000 .000 .000 .000
N 344 344 344 344 344
Communication
Pearson Correlation .668** .630** 1 .606** .775**
Sig. (2-tailed) .000 .000 .000 .000
N 344 344 344 344 344
Access to teller service
Pearson Correlation .557** .524** .606** 1 .629**
Sig. (2-tailed) .000 .000 .000 .000
N 344 344 344 344 344
Customer satisfaction
Pearson Correlation .763** .687** .775** .629** 1
Sig. (2-tailed) .000 .000 .000 .000
N 344 344 344 344 344
**. Correlation is significant at the 0.01 level (2-tailed).
Regression results of Service Quality dimensions and customer satisfaction.
Model Summaryb
Model R R Square Adjusted R
Square
Std. Error of the
Estimate
Change Statistics
R Square
Change
F Change df1 df2
1 .854a .730 .727 3.055 .730 229.154 4 339
a. Predictors: (Constant), Access to teller service, Credibility, Communication, Staff conduct
b. Dependent Variable: Customer satisfaction
ANOVAa
Model Sum of Squares df Mean Square F Sig.
1
Regression 8553.781 4 2138.445 229.154 .000b
Residual 3163.522 339 9.332
Total 11717.302 343
a. Dependent Variable: Customer satisfaction
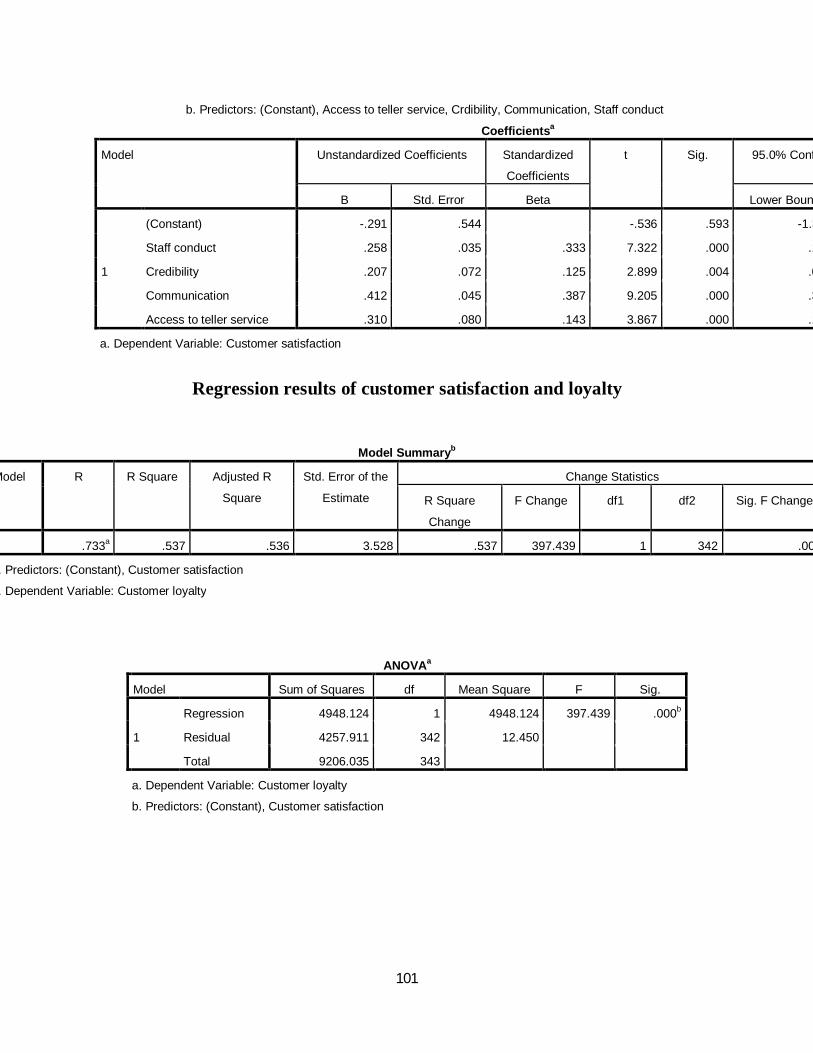
101
b. Predictors: (Constant), Access to teller service, Crdibility, Communication, Staff conduct
Coefficientsa
Model Unstandardized Coefficients Standardized
Coefficients
t Sig. 95.0% Confidence Interval for B
B Std. Error Beta Lower Bound
1
(Constant) -.291 .544 -.536 .593 -1.361
Staff conduct .258 .035 .333 7.322 .000 .189
Credibility .207 .072 .125 2.899 .004 .067
Communication .412 .045 .387 9.205 .000 .324
Access to teller service .310 .080 .143 3.867 .000 .153
a. Dependent Variable: Customer satisfaction
Regression results of customer satisfaction and loyalty
Model Summaryb
Model R R Square Adjusted R
Square
Std. Error of the
Estimate
Change Statistics
R Square
Change
F Change df1 df2 Sig. F Change
.733a .537 .536 3.528 .537 397.439 1 342 .000
a. Predictors: (Constant), Customer satisfaction
b. Dependent Variable: Customer loyalty
ANOVAa
Model Sum of Squares df Mean Square F Sig.
1
Regression 4948.124 1 4948.124 397.439 .000b
Residual 4257.911 342 12.450
Total 9206.035 343
a. Dependent Variable: Customer loyalty
b. Predictors: (Constant), Customer satisfaction
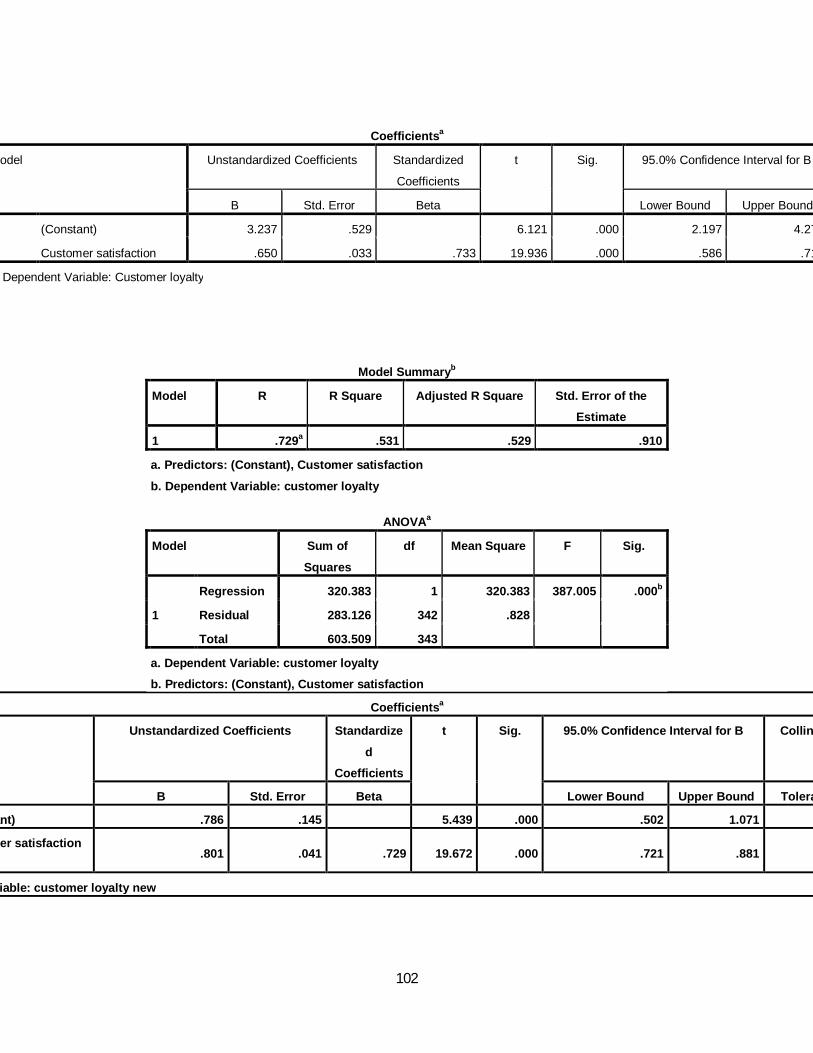
102
Coefficientsa
Model Unstandardized Coefficients Standardized
Coefficients
t Sig. 95.0% Confidence Interval for B
B Std. Error Beta Lower Bound Upper Bound
(Constant) 3.237 .529 6.121 .000 2.197 4.278
Customer satisfaction .650 .033 .733 19.936 .000 .586 .714
a. Dependent Variable: Customer loyalty
Model Summaryb
Model R R Square Adjusted R Square Std. Error of the
Estimate
1 .729a .531 .529 .910
a. Predictors: (Constant), Customer satisfaction
b. Dependent Variable: customer loyalty
Coefficientsa
Unstandardized Coefficients Standardize
d
Coefficients
t Sig. 95.0% Confidence Interval for B Collinearity Statistics
B Std. Error Beta Lower Bound Upper Bound Tolerance
(Constant) .786 .145 5.439 .000 .502 1.071
Customer satisfaction .801 .041 .729 19.672 .000 .721 .881
a. Dependent Variable: customer loyalty new
ANOVAa
Model Sum of
Squares
df Mean Square F Sig.
1
Regression 320.383 1 320.383 387.005 .000b
Residual 283.126 342 .828
Total 603.509 343
a. Dependent Variable: customer loyalty
b. Predictors: (Constant), Customer satisfaction
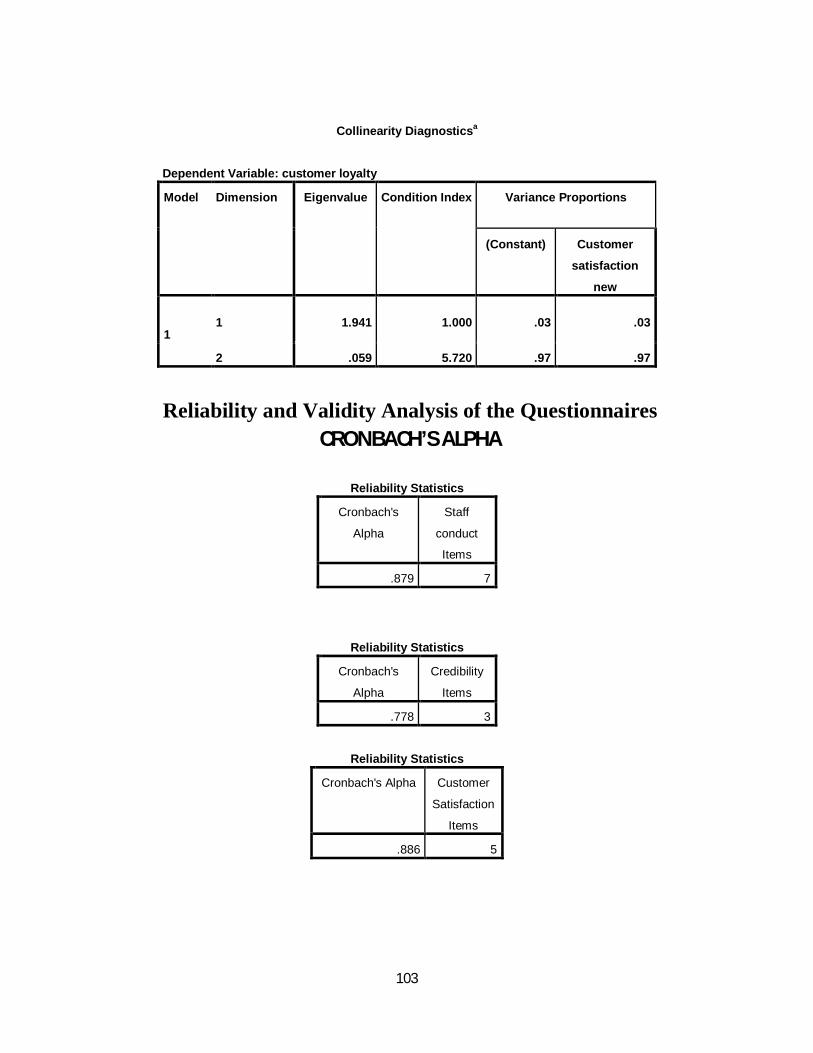
103
Collinearity Diagnosticsa
Dependent Variable: customer loyalty
Model Dimension Eigenvalue Condition Index Variance Proportions
(Constant) Customer
satisfaction
new
1 1 1.941 1.000 .03 .03
2 .059 5.720 .97 .97
Reliability and Validity Analysis of the Questionnaires
CRONBACH’S ALPHA
Reliability Statistics
Cronbach's
Alpha
Staff
conduct
Items
.879 7
Reliability Statistics
Cronbach's
Alpha
Credibility
Items
.778 3
Reliability Statistics
Cronbach's Alpha Customer
Satisfaction
Items
.886 5
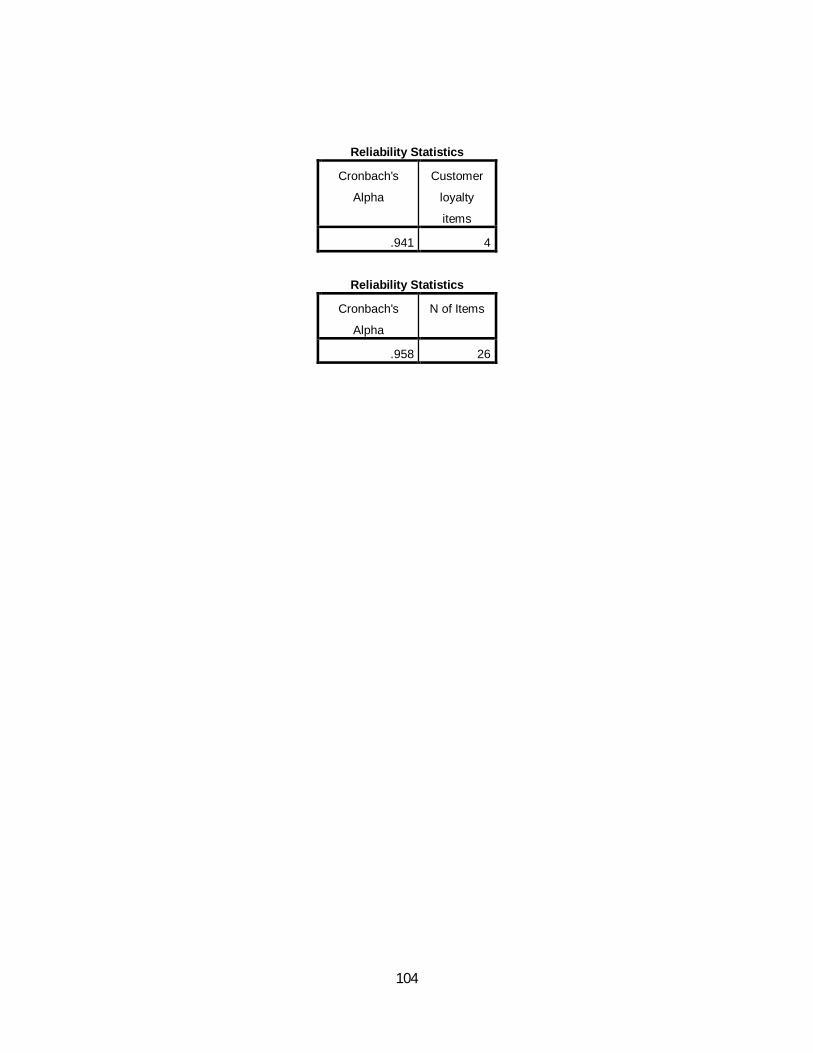
104
Reliability Statistics
Cronbach's
Alpha
Customer
loyalty
items
.941 4
Reliability Statistics
Cronbach's
Alpha
N of Items
.958 26
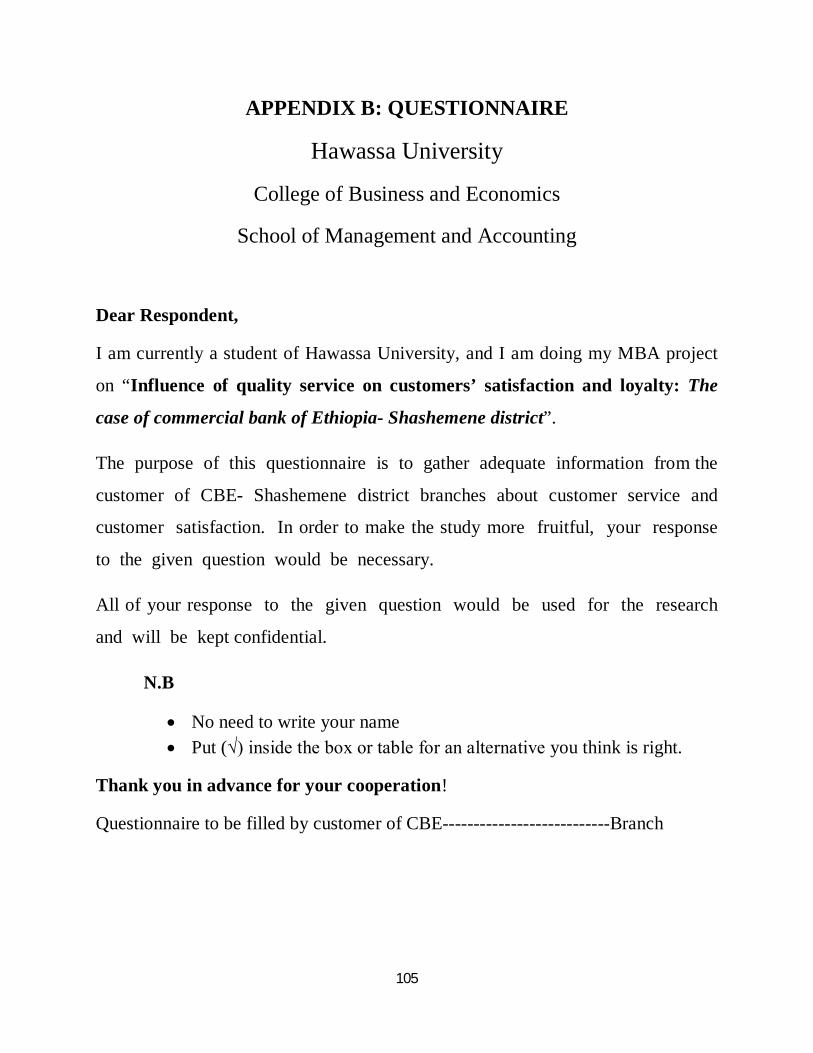
105
APPENDIX B: QUESTIONNAIRE
Hawassa University
College of Business and Economics
School of Management and Accounting
Dear Respondent,
I am currently a student of Hawassa University, and I am doing my MBA project
on “Influence of quality service on customers’ satisfaction and loyalty: The
case of commercial bank of Ethiopia- Shashemene district”.
The purpose of this questionnaire is to gather adequate information from the
customer of CBE- Shashemene district branches about customer service and
customer satisfaction. In order to make the study more fruitful, your response
to the given question would be necessary.
All of your response to the given question would be used for the research
and will be kept confidential.
N.B
No need to write your name Put (√) inside the box or table for an alternative you think is right.
Thank you in advance for your cooperation!
Questionnaire to be filled by customer of CBE---------------------------Branch
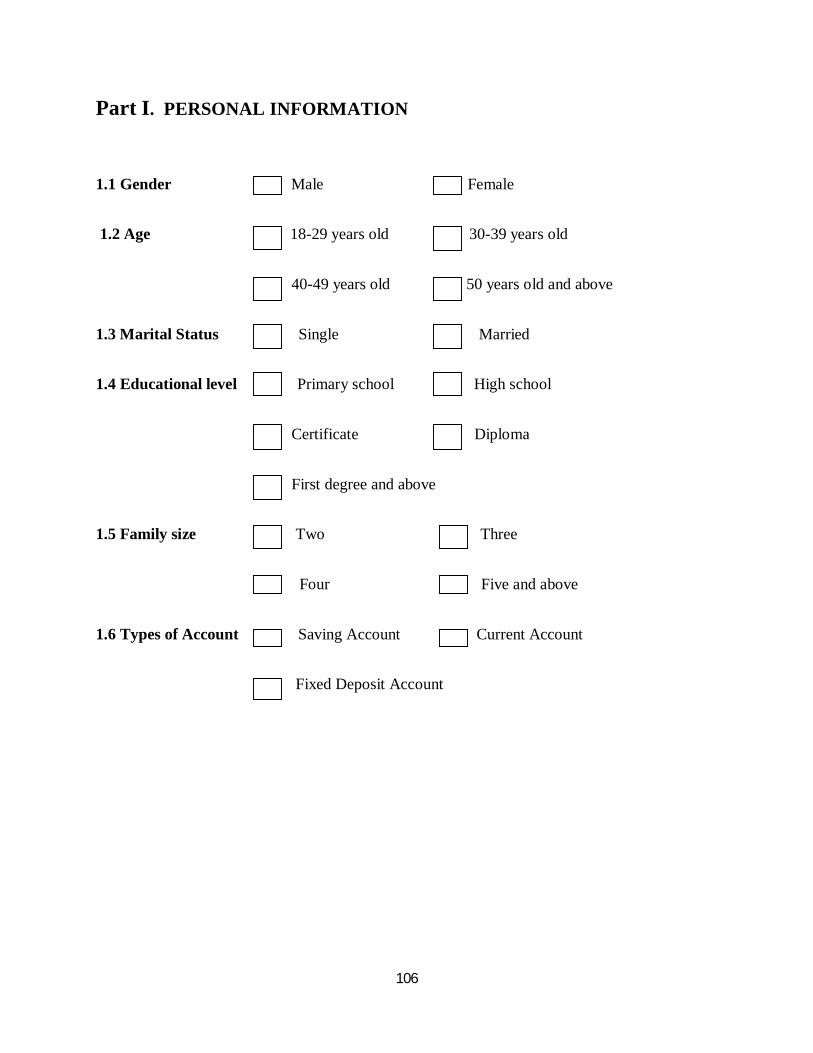
106
Part I. PERSONAL INFORMATION
1.1 Gender Male Female
1.2 Age 18-29 years old 30-39 years old
40-49 years old 50 years old and above
1.3 Marital Status Single Married
1.4 Educational level Primary school High school
Certificate Diploma
First degree and above
1.5 Family size Two Three
Four Five and above
1.6 Types of Account Saving Account Current Account
Fixed Deposit Account
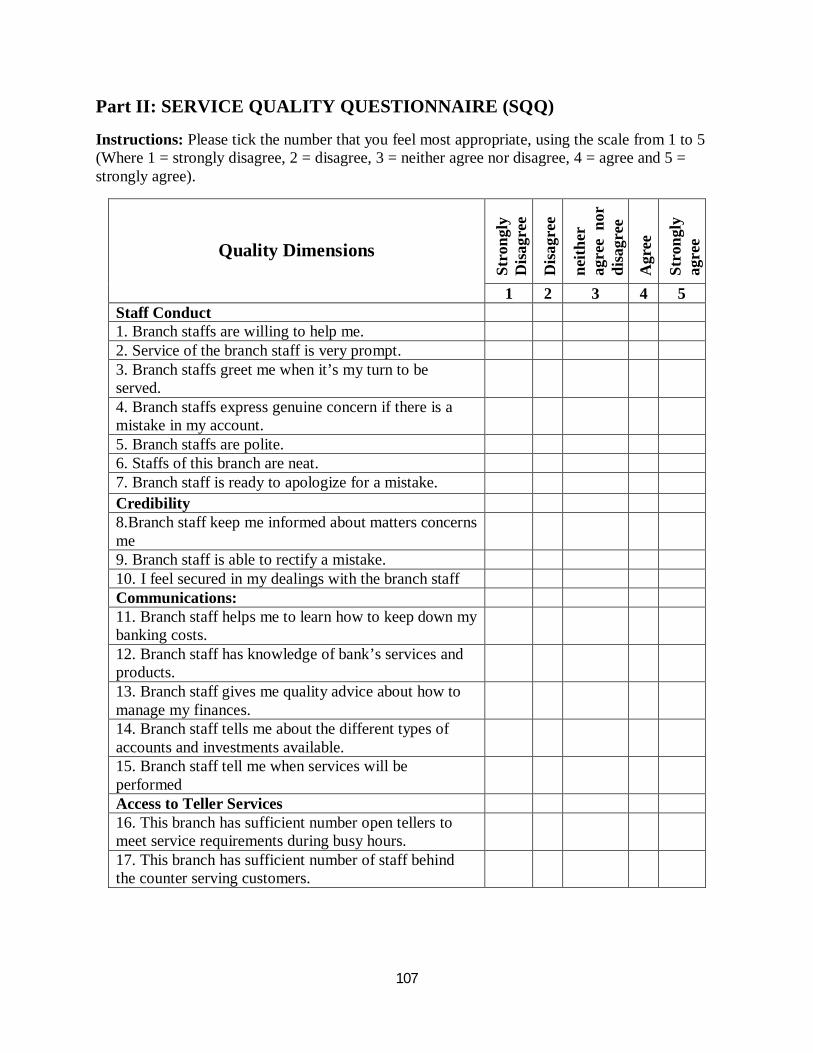
107
Part II: SERVICE QUALITY QUESTIONNAIRE (SQQ)
Instructions: Please tick the number that you feel most appropriate, using the scale from 1 to 5 (Where 1 = strongly disagree, 2 = disagree, 3 = neither agree nor disagree, 4 = agree and 5 = strongly agree).
Quality Dimensions
Stro
ngly
D
isagr
ee
Disa
gree
ne
ither
ag
ree
nor
di
sagr
ee
Agr
ee
Stro
ngly
ag
ree
1 2 3 4 5 Staff Conduct 1. Branch staffs are willing to help me. 2. Service of the branch staff is very prompt. 3. Branch staffs greet me when it’s my turn to be served.
4. Branch staffs express genuine concern if there is a mistake in my account.
5. Branch staffs are polite. 6. Staffs of this branch are neat. 7. Branch staff is ready to apologize for a mistake. Credibility 8.Branch staff keep me informed about matters concerns me
9. Branch staff is able to rectify a mistake. 10. I feel secured in my dealings with the branch staff Communications: 11. Branch staff helps me to learn how to keep down my banking costs.
12. Branch staff has knowledge of bank’s services and products.
13. Branch staff gives me quality advice about how to manage my finances.
14. Branch staff tells me about the different types of accounts and investments available.
15. Branch staff tell me when services will be performed
Access to Teller Services 16. This branch has sufficient number open tellers to meet service requirements during busy hours.
17. This branch has sufficient number of staff behind the counter serving customers.
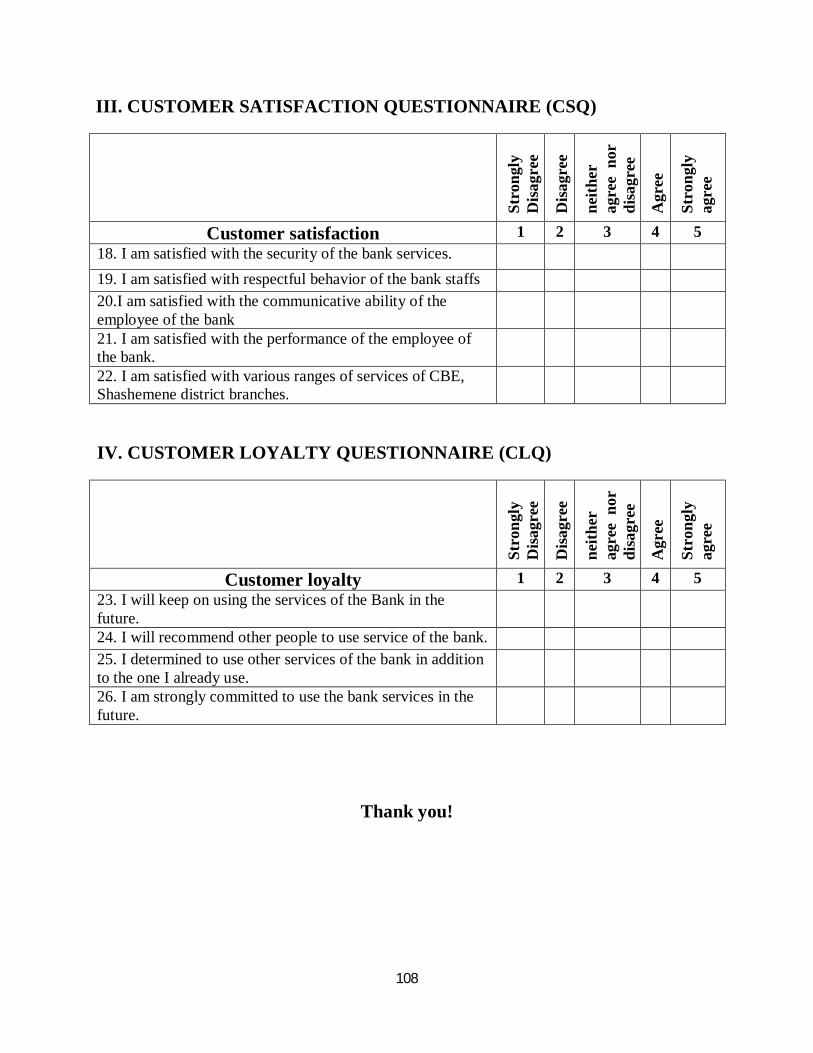
108
III. CUSTOMER SATISFACTION QUESTIONNAIRE (CSQ)
Stro
ngly
D
isagr
ee
Disa
gree
ne
ither
ag
ree
nor
di
sagr
ee
Agr
ee
Stro
ngly
ag
ree
Customer satisfaction 1 2 3 4 5 18. I am satisfied with the security of the bank services. 19. I am satisfied with respectful behavior of the bank staffs 20.I am satisfied with the communicative ability of the employee of the bank
21. I am satisfied with the performance of the employee of the bank.
22. I am satisfied with various ranges of services of CBE, Shashemene district branches.
IV. CUSTOMER LOYALTY QUESTIONNAIRE (CLQ)
St
rong
ly
Disa
gree
Disa
gree
ne
ither
ag
ree
nor
di
sagr
ee
Agr
ee
Stro
ngly
ag
ree
Customer loyalty 1 2 3 4 5 23. I will keep on using the services of the Bank in the future.
24. I will recommend other people to use service of the bank. 25. I determined to use other services of the bank in addition to the one I already use.
26. I am strongly committed to use the bank services in the future.
Thank you!

109
መጠይቅ
ሀዋሳ ዩኒቨርስቲ
ቢዝነስና ኢኮኖሚክስ ኮሌጅ
የማኔጅመንትና አካውንቲንግ ትምህርት ቤት
ውድ የባንኩ ደንበኛ፡-
እኔ በአሁኑ ሰዓት በሀዋሳ ዩኒቨርስቲ የንግድ ስራ አስተዳደር የድህረ ምረቃ (Master of Business
Administration-Marketing management) ተማሪ ስሆን የመመረቂያ ጥናቴንም በኢትዮጵያ ንግድ
ባንክ በሻሸመኔ ዲስትሪክት ስር ባሉ ቅርንጫፎች ላይ “ጥራት ያለው አገልግሎት በደንበኛ
እርካታና ታማኝነት ላይ ያለው ተፅዕኖ” በሚል ርዕስ ጥናቴን እየሰራሁ እገኛለሁ፡፡
የዚህ መጠይቅ ዓላማም ከባንኩ ደንበኞች ስለ ባንኩ አገልግሎትና የደንበኛ እርካታ በቂ መረጃ
በመሰብሰብ ጥናቱን ውጤታማና ተአማኒነት ያለው ማድረግ ነው፡፡ ይኸንንም አሳካ ዘንድ የእርሶዎ
ትብብር በጣም ያስፈልገኛል፡፡ ስለዚህ ለመጠይቁ መልስዎን ይሠጡኝ ዘንድ በአክብሮት
እጠይቃለሁ፡፡
ለመጠይቁ የሚሰጡት ምላሽ ለጥናቴ ብቻ የሚውል ሲሆን መልስዎትም በሚስጥር ይያዛል፡፡
ማሳሰቢያ፡-
- ስምዎትን መጥቀስ አያስፈልግም፣ - ትክክል አማራጭ ፊት ለፊት የራይት () ምልክት ያድርጉ፣
ለትብብርዎ በቅድሚያ በጣም አመሰግናለሁ!
በኢትዮጵያ ንግድ ባንክ የ------------------------- ቅርንጫፍ ደንበኛ የሚሞላ መጠይቅ፣

110
I. ክፍል አንድ፡ የግል ሁኔታ፣
1.1. ፆታ ወንድ ሴት
1.2. ዕድሜ 18-29 ዓመት 30-39 ዓመት
40-49 ዓመት 50 ዓመትና ከዚያ በላይ
1.3. የጋብቻ ሁኔታ ያላገባ ያገባ
ፈት
1.4. የትምህርት ደረጃ 1ኛ ደረጃ ሁለተኛ ደረጃ/ሀይስኩል/
ሰርተፍኬት ዲፕሎማ
የመጀመሪያ ድግሪ ሁለተኛ ድግሪና ከዚያ በላይ
1.5. የቤተሰብ ብዛት ሁለት ሶስት
አራት አምስት ቤተሰብና ከዚያ በላይ
1.6. የሒሳቡ ዓይነት የቁጠባ ሂሳብ
ተንቀሳቃሽ ሂሳብ
ወለድ አልባ ቁጠባ ሂሳብ
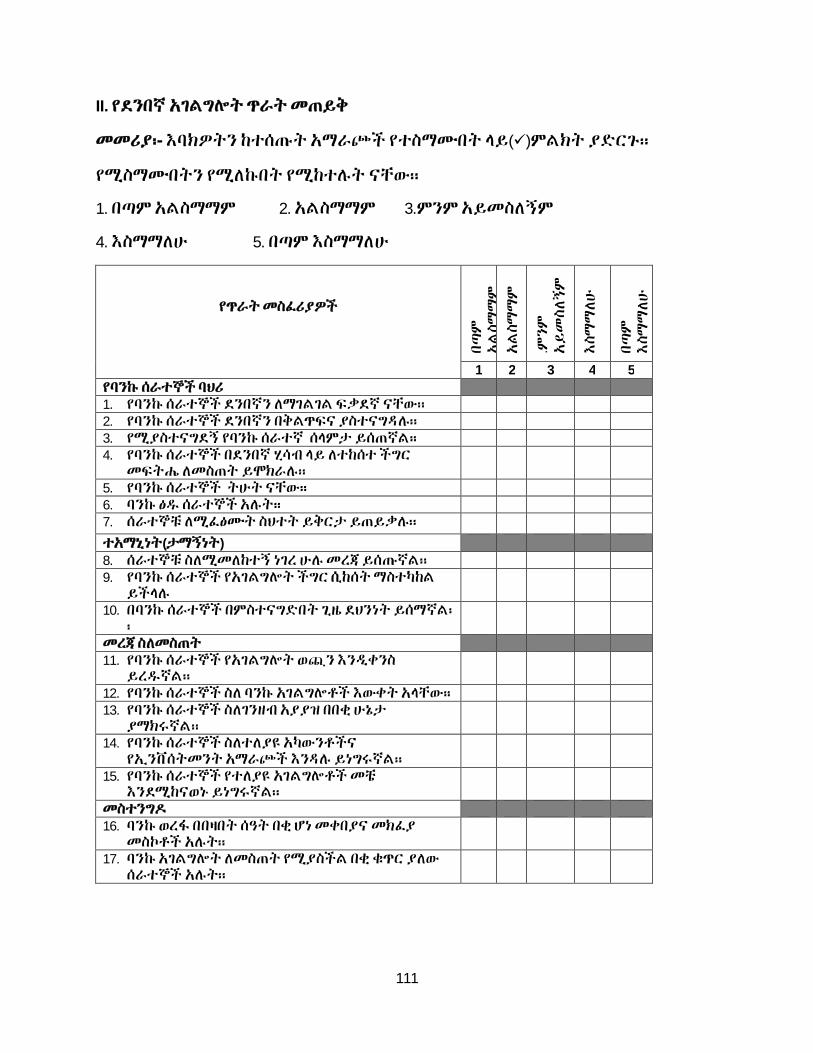
111
II. የደንበኛ አገልግሎት ጥራት መጠይቅ
መመሪያ፡- እባክዎትን ከተሰጡት አማራጮች የተስማሙበት ላይ()ምልክት ያድርጉ፡፡
የሚስማሙበትን የሚለኩበት የሚከተሉት ናቸው፡፡
1. በጣም አልስማማም 2. አልስማማም 3.ምንም አይመስለኝም
4. እስማማለሁ 5. በጣም እስማማለሁ
የጥራት መስፈሪያዎች
በጣም
አልስማማም
አልስማማም
.ምንም
አይመስለኝም
እስማማለሁ
በጣም
እስማማለሁ
1 2 3 4 5 የባንኩ ሰራተኞች ባህሪ 1. የባንኩ ሰራተኞች ደንበኛን ለማገልገል ፍቃደኛ ናቸው፡፡ 2. የባንኩ ሰራተኞች ደንበኛን በቅልጥፍና ያስተናግዳሉ፡፡ 3. የሚያስተናግደኝ የባንኩ ሰራተኛ ሰላምታ ይሰጠኛል፡፡ 4. የባንኩ ሰራተኞች በደንበኛ ሂሳብ ላይ ለተከሰተ ችግር
መፍትሔ ለመስጠት ይሞክራሉ፡፡
5. የባንኩ ሰራተኞች ትሁት ናቸው፡፡ 6. ባንኩ ፅዱ ሰራተኞች አሉት፡፡ 7. ሰራተኞቹ ለሚፈፅሙት ስህተት ይቅርታ ይጠይቃሉ፡፡
ተአማኒነት(ታማኝነት) 8. ሰራተኞቹ ስለሚመለከተኝ ነገረ ሁሉ መረጃ ይሰጡኛል፡፡ 9. የባንኩ ሰራተኞች የአገልግሎት ችግር ሲከሰት ማስተካከል
ይችላሉ
10. በባንኩ ሰራተኞች በምስተናግድበት ጊዜ ደህንነት ይሰማኛል፡፡
መረጃ ስለመስጠት 11. የባንኩ ሰራተኞች የአገልግሎት ወጪን እንዲቀንስ
ይረዱኛል፡፡
12. የባንኩ ሰራተኞች ስለ ባንኩ አገልግሎቶች እውቀት አላቸው፡፡ 13. የባንኩ ሰራተኞች ስለገንዘብ አያያዝ በበቂ ሁኔታ
ያማክሩኛል፡፡
14. የባንኩ ሰራተኞች ስለተለያዩ አካውንቶችና የኢንቨሰትመንት አማራጮች እንዳሉ ይነግሩኛል፡፡
15. የባንኩ ሰራተኞች የተለያዩ አገልግሎቶች መቼ እንደሚከናወኑ ይነግሩኛል፡፡
መስተንግዶ 16. ባንኩ ወረፋ በበዛበት ሰዓት በቂ ሆነ መቀበያና መክፈያ
መስኮቶች አሉት፡፡
17. ባንኩ አገልግሎት ለመስጠት የሚያስችል በቂ ቁጥር ያለው ሰራተኞች አሉት፡፡
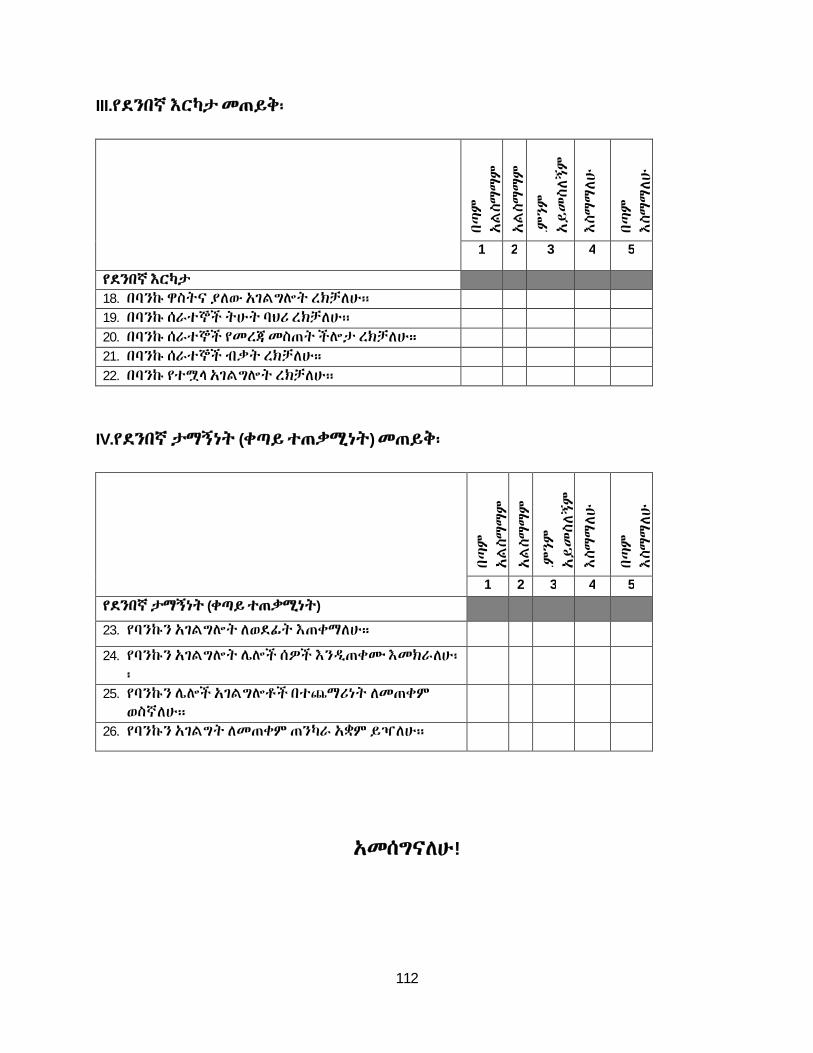
112
III.የደንበኛ እርካታ መጠይቅ፡
በጣም
አልስማማም
አልስማማም
.ምንም
አይመስለኝም
እስማማለሁ
በጣም
እስማማለሁ
1 2 3 4 5
የደንበኛ እርካታ
18. በባንኩ ዋስትና ያለው አገልግሎት ረክቻለሁ፡፡
19. በባንኩ ሰራተኞች ትሁት ባህሪ ረክቻለሁ፡፡
20. በባንኩ ሰራተኞች የመረጃ መስጠት ችሎታ ረክቻለሁ፡፡
21. በባንኩ ሰራተኞች ብቃት ረክቻለሁ፡፡
22. በባንኩ የተሟላ አገልግሎት ረክቻለሁ፡፡
IV.የደንበኛ ታማኝነት (ቀጣይ ተጠቃሚነት) መጠይቅ፡
በጣም
አልስማማም
አልስማማም
.ምንም
አይመስለኝም
እስማማለሁ
በጣም
እስማማለሁ
1 2 3 4 5
የደንበኛ ታማኝነት (ቀጣይ ተጠቃሚነት)
23. የባንኩን አገልግሎት ለወደፊት እጠቀማለሁ፡፡
24. የባንኩን አገልግሎት ሌሎች ሰዎች እንዲጠቀሙ እመክራለሁ፡፡
25. የባንኩን ሌሎች አገልግሎቶች በተጨማሪነት ለመጠቀም ወስኛለሁ፡፡
26. የባንኩን አገልግት ለመጠቀም ጠንካራ አቋም ይዣለሁ፡፡
አመሰግናለሁ!
Top Related
Copyright © 2022 FDOKUMEN

