


Bahasa
Halaman
Hukum

This article appeared in a journal published by Elsevier. The attachedcopy is furnished to the author for internal non-commercial researchand education use, including for instruction at the authors institution
and sharing with colleagues.
Other uses, including reproduction and distribution, or selling orlicensing copies, or posting to personal, institutional or third party
websites are prohibited.
In most cases authors are permitted to post their version of thearticle (e.g. in Word or Tex form) to their personal website orinstitutional repository. Authors requiring further information
regarding Elsevier’s archiving and manuscript policies areencouraged to visit:
http://www.elsevier.com/copyright
Author's personal copy
Gradients of abundance and biomass across reserveboundaries in six Mediterranean marine protected areas:Evidence of fish spillover?
Mireille Harmelin-Viviena,*, Laurence Le Direachb, Just Bayle-Semperec, Eric Charbonnelb,d,Jose Antonio Garcıa-Chartone, Denis Odyf, Angel Perez-Ruzafae, Olga Renonesg,Pablo Sanchez-Jerezc, Carlos Vallec
aCentre d’Oceanologie de Marseille, Universite de la Mediterranee, UMR CNRS 6540, 13007 Marseille, FrancebGIS Posidonie, Parc Scientifique et Technologique de Luminy, Case 901, 13288 Marseille Cedex 09, FrancecDepartamento de Ciencias del Mar y Biologıa Aplicada, Edificio Ciencias V., Universidad de Alicante, POB 99, 03080 Alicante, SpaindParc Marin de la Cote Bleue, Observatoire, BP 42, 13620 Carry-le-Rouet, FranceeDepartamento de Ecologıa e Hidrologıa, Universidad de Murcia, Campus de Espinardo, 30100 Murcia, SpainfWWF-France, 6 rue des Fabres, 13001 Marseille, FrancegInstituto Espanol de Oceanografıa, Centro Oceanografico de Baleares, Apdo. 291, 07080 Palma de Mallorca, Spain
A R T I C L E I N F O
Article history:
Received 22 September 2007
Received in revised form
9 April 2008
Accepted 24 April 2008
Available online 10 June 2008
Keywords:
Visual census
Fish spillover
Marine reserves
Fisheries
A B S T R A C T
Marine protected areas (MPAs) are considered as an effective tool in marine coastal man-
agement, and considered able to enhance local fisheries through adult fish spillover. Indi-
rect evidence of fish spillover could be obtained by horizontal gradients in fish abundance.
To address this question, the existence of gradients of fish abundance and biomass across
marine reserve boundaries was assessed in six Mediterranean MPAs using underwater
visual censuses performed at various distances from the core of the MPA, in integral
reserve (IR), to buffer zone (BZ) and fished areas. A reserve effect was evidenced with higher
values of fish species richness (·1.1), abundance (·1.3), and biomass (·4.7) recorded inside
MPAs compared to adjacent fished areas. Linear correlations revealed significant negative
gradients in mean fish biomass in all the reserves studied after the effect of habitat had
been removed, whereas negative gradients in abundance were less conspicuous. General-
ized additive models suggested two main patterns of biomass gradients, with a sharp
decrease at the IR–BZ boundary or at the BZ–fished area boundary. It was estimated that
fish spillover beneficial to local fisheries occurred mostly at a small spatial scale (100s of
metres). The existence of regular patterns of negative fish biomass gradients from within
MPAs to fished areas was consistent with the hypothesis of adult fish biomass spillover pro-
cesses from marine reserves and could be considered as a general pattern in this Mediter-
ranean region.
� 2008 Elsevier Ltd. All rights reserved.
0006-3207/$ - see front matter � 2008 Elsevier Ltd. All rights reserved.doi:10.1016/j.biocon.2008.04.029
* Corresponding author: Tel.: +33 491041628; fax: +33 491041635.E-mail addresses: [email protected] (M. Harmelin-Vivien), [email protected] (L. Le Direach), [email protected]
(J. Bayle-Sempere), [email protected] (E. Charbonnel), [email protected] (J.A. Garcıa-Charton), [email protected] (D. Ody),[email protected] (A. Perez-Ruzafa), [email protected] (O. Renones), [email protected] (P. Sanchez-Jerez), [email protected] (C. Valle).
B I O L O G I C A L C O N S E R V A T I O N 1 4 1 ( 2 0 0 8 ) 1 8 2 9 – 1 8 3 9
ava i lab le a t www.sc iencedi rec t . com
journal homepage: www.elsevier .com/ locate /b iocon
Author's personal copy
1. Introduction
Marine protected areas (MPAs) are widely promoted as a con-
servation tool for biodiversity and habitats and are used to
protect or restore fish species populations, but they are also
predicted to benefit adjacent fisheries through two main
mechanisms: net emigration of adult and juvenile fishes
(‘‘spillover effect’’, Rowley, 1994), and export of pelagic eggs
and larvae from restored spawning stocks inside the MPA
(Roberts and Polunin, 1991; Gell and Roberts, 2003; Alcala
et al., 2005). Previous studies have demonstrated a positive ef-
fect of MPAs on adjacent fisheries, mainly in coral reef areas,
by analysing long-term data (Russ and Alcala, 1996; Roberts
et al., 2001; Russ et al., 2004) or measuring gradients of bio-
mass through the marine reserve border (Rakitin and Kramer,
1996; Chapman and Kramer, 1999; Kaunda-Arara and Rose,
2004; Abesamis et al., 2006). If analysing the effect of fish spill-
over on a time scale gives the best evidence of fish spillover
(Russ et al., 2003; Abesamis and Russ, 2005), such studies need
longer-term efforts compared to studies performed at a hori-
zontal spatial scale (Halpern et al., 2004).
Gradients of fish abundance and biomass have been advo-
cated as a simple tool for evidencing fish spillover across re-
serve boundaries and assessing the distance of influence of
the reserve (Rakitin and Kramer, 1996; McClanahan and Man-
gi, 2000; Ashworth and Ormond, 2005; Abesamis et al., 2006).
A theoretical evaluation of the significance of gradients was
recently modelled by Kellner et al. (2007) who proposed that
emigration of fish from MPAs, as well as home range move-
ments and relocation of fish, can be expected to produce a
gradient of abundance across marine reserve boundaries.
Their model showed that considering the effect of harvesting
and the diffusion rate of species, the distribution of abun-
dance or biomass with increasing distance from an MPA
should produce a gradient in the form of a curve with a lower
negative slope as the diffusion process becomes more impor-
tant or as the fishing pressure increases. These negative gra-
dients of fish abundance or biomass through MPA boundaries
could be interpreted as evidence of spillover of adult fish ben-
eficial to fisheries.
Mediterranean MPAs have been established mainly to
meet conservation benefits in zones that already harbour
structurally complex habitats like islands and capes (Fran-
cour et al., 2001). Numerous studies conducted in Mediterra-
nean MPAs demonstrate an increase in the abundance,
biomass and size of fishes inside marine reserves (Bell,
1983; Garcıa-Rubies and Zabala, 1990; Harmelin et al., 1995;
Renones et al., 1997; Garcıa-Charton and Perez-Ruzafa, 1999;
Macpherson et al., 2002; Garcıa-Charton et al., 2004). Their
role in sustaining local fisheries in the Mediterranean has
been recently confirmed for the spiny lobster, Palinurus ele-
phas, from gradients of abundance in experimental and com-
mercial catches along with tagging experiments in the
Columbretes Islands (Goni et al., 2006). However, to date no
study has been carried out in the Mediterranean to look for
evidence of fish biomass gradients which are needed to test
the hypothesis of fish spillover through marine reserve
boundaries. Most studies on MPAs are performed on single re-
serves, making it difficult to assess general trends in fish dis-
tribution across MPA boundaries (Halpern and Warner, 2002;
Halpern, 2003). Evidence of fish spillover and estimation of
the spatial extent of fish export require sampling fish commu-
nities at many sites across a gradient of distances from the re-
serve border, both outside and within the reserve (Halpern
et al., 2004).
The objective of this study was therefore to provide evi-
dence of the export of adult fishes from six Mediterranean
marine reserves by directly assessing the existence of gradi-
ents of abundance and biomass across the MPA boundaries,
and estimate the distance at which fish spillover might occur.
The working hypothesis was that if fish export is taking place
between the MPAs and surrounding fished areas one can ex-
pect abundance and biomass of fishes to be higher inside
the MPAs, and negative gradients of these parameters to oc-
cur across the MPA boundaries, following Rakitin and Kramer
(1996) and Ashworth and Ormond (2005).
2. Materials and methods
2.1. Study sites
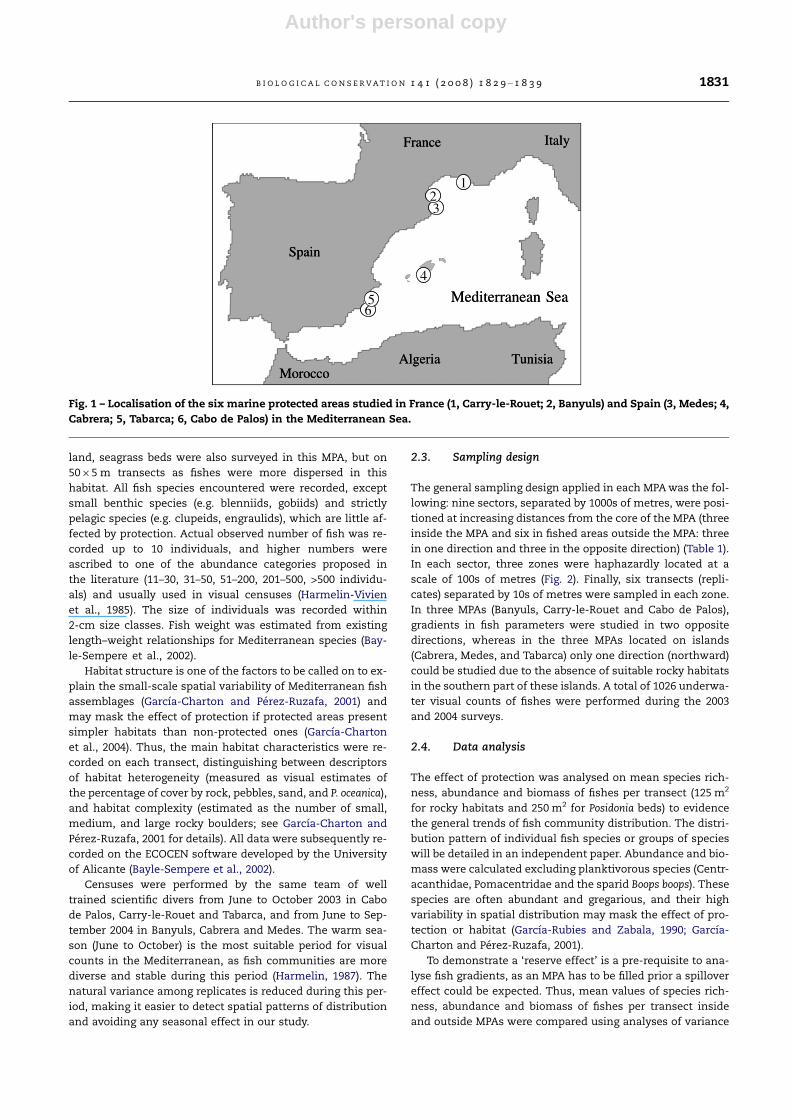
Six marine protected areas were studied in the Western Med-
iterranean, two located in France (Cerbere–Banyuls Marine
Natural Reserve and Carry-le-Rouet Natural Park, hereafter
referred as Banyuls and Carry-le-Rouet, respectively) and four
located in Spain (Cabo de Palos – Islas Hormigas Marine Re-
serve, Cabrera Archipelago National Park, Medes Islands Mar-
ine Reserve, and Tabarca Island Marine Reserve, referred from
now on as Cabo de Palos, Cabrera, Medes, and Tabarca)
(Fig. 1). Common criteria used to select these MPAs were year
of establishment (>10 years), high protection enforcement,
degree of isolation (on mainland or island), and size (small
and large; Table 1). Recent studies demonstrated that year
of establishment is more important than size in detecting
the effectiveness of MPAs (Dufour et al., 2007) along with a
high level of enforcement (Samoilys et al., 2007). The six MPAs
studied have been established for long enough and are well
enforced by local rangers, therefore providing a good repre-
sentation of reserve effects on fish communities in the Wes-
tern Mediterranean. We selected MPAs that were at least 10
years old, as some studies have shown that a steady state is
not reached before 6–10 years after their establishment (Russ
et al., 2005; Claudet et al., 2006). Three reserves were located
on mainland (Banyuls, Carry-le-Rouet and Cabo de Palos)
and three were on islands (Cabrera, Medes and Tabarca) in or-
der to look for patterns associated with reserve isolation
state. All MPAs had an integral reserve area (IR) where all fish-
ing activities (commercial and recreational) were forbidden,
and all of them, with the exception of Carry-le-Rouet, also
had a buffer zone (BZ) where only some controlled fishing
activities were allowed (Francour et al., 2001).
2.2. Visual censuses
Fish species and their abundance and size were recorded in
standardised sheets by underwater visual censuses using
SCUBA diving on rocky substrates between 6 and 12 m
depth using 25 · 5 m transects parallel to the coast. As Pos-
idonia oceanica beds covered large areas around Tabarca Is-
1830 B I O L O G I C A L C O N S E R V A T I O N 1 4 1 ( 2 0 0 8 ) 1 8 2 9 – 1 8 3 9
Author's personal copy
land, seagrass beds were also surveyed in this MPA, but on
50 · 5 m transects as fishes were more dispersed in this
habitat. All fish species encountered were recorded, except
small benthic species (e.g. blenniids, gobiids) and strictly
pelagic species (e.g. clupeids, engraulids), which are little af-
fected by protection. Actual observed number of fish was re-
corded up to 10 individuals, and higher numbers were
ascribed to one of the abundance categories proposed in
the literature (11–30, 31–50, 51–200, 201–500, >500 individu-
als) and usually used in visual censuses (Harmelin-Vivien
et al., 1985). The size of individuals was recorded within
2-cm size classes. Fish weight was estimated from existing
length–weight relationships for Mediterranean species (Bay-
le-Sempere et al., 2002).
Habitat structure is one of the factors to be called on to ex-
plain the small-scale spatial variability of Mediterranean fish
assemblages (Garcıa-Charton and Perez-Ruzafa, 2001) and
may mask the effect of protection if protected areas present
simpler habitats than non-protected ones (Garcıa-Charton
et al., 2004). Thus, the main habitat characteristics were re-
corded on each transect, distinguishing between descriptors
of habitat heterogeneity (measured as visual estimates of
the percentage of cover by rock, pebbles, sand, and P. oceanica),
and habitat complexity (estimated as the number of small,
medium, and large rocky boulders; see Garcıa-Charton and
Perez-Ruzafa, 2001 for details). All data were subsequently re-
corded on the ECOCEN software developed by the University
of Alicante (Bayle-Sempere et al., 2002).
Censuses were performed by the same team of well
trained scientific divers from June to October 2003 in Cabo
de Palos, Carry-le-Rouet and Tabarca, and from June to Sep-
tember 2004 in Banyuls, Cabrera and Medes. The warm sea-
son (June to October) is the most suitable period for visual
counts in the Mediterranean, as fish communities are more
diverse and stable during this period (Harmelin, 1987). The
natural variance among replicates is reduced during this per-
iod, making it easier to detect spatial patterns of distribution
and avoiding any seasonal effect in our study.
2.3. Sampling design
The general sampling design applied in each MPA was the fol-
lowing: nine sectors, separated by 1000s of metres, were posi-
tioned at increasing distances from the core of the MPA (three
inside the MPA and six in fished areas outside the MPA: three
in one direction and three in the opposite direction) (Table 1).
In each sector, three zones were haphazardly located at a
scale of 100s of metres (Fig. 2). Finally, six transects (repli-
cates) separated by 10s of metres were sampled in each zone.
In three MPAs (Banyuls, Carry-le-Rouet and Cabo de Palos),
gradients in fish parameters were studied in two opposite
directions, whereas in the three MPAs located on islands
(Cabrera, Medes, and Tabarca) only one direction (northward)
could be studied due to the absence of suitable rocky habitats
in the southern part of these islands. A total of 1026 underwa-
ter visual counts of fishes were performed during the 2003
and 2004 surveys.
2.4. Data analysis
The effect of protection was analysed on mean species rich-
ness, abundance and biomass of fishes per transect (125 m2
for rocky habitats and 250 m2 for Posidonia beds) to evidence
the general trends of fish community distribution. The distri-
bution pattern of individual fish species or groups of species
will be detailed in an independent paper. Abundance and bio-
mass were calculated excluding planktivorous species (Centr-
acanthidae, Pomacentridae and the sparid Boops boops). These
species are often abundant and gregarious, and their high
variability in spatial distribution may mask the effect of pro-
tection or habitat (Garcıa-Rubies and Zabala, 1990; Garcıa-
Charton and Perez-Ruzafa, 2001).
To demonstrate a ‘reserve effect’ is a pre-requisite to ana-
lyse fish gradients, as an MPA has to be filled prior a spillover
effect could be expected. Thus, mean values of species rich-
ness, abundance and biomass of fishes per transect inside
and outside MPAs were compared using analyses of variance
Spain
France Italy
MoroccoAlgeria Tunisia
1
32
4
65 Mediterranean Sea
Spain
France Italy
MoroccoAlgeria Tunisia
1
32
4
65 Mediterranean Sea
Fig. 1 – Localisation of the six marine protected areas studied in France (1, Carry-le-Rouet; 2, Banyuls) and Spain (3, Medes; 4,
Cabrera; 5, Tabarca; 6, Cabo de Palos) in the Mediterranean Sea.
B I O L O G I C A L C O N S E R V A T I O N 1 4 1 ( 2 0 0 8 ) 1 8 2 9 – 1 8 3 9 1831
Author's personal copy
(Underwood, 1997). The Cochran’s test was used to test the
homogeneity of variance for all variables (Cochran, 1951).
Where significant differences were found, the data were
transformed byp
(x) or ln(x + 1). When transformations did
not remove heterogeneity, analyses were performed on the
untransformed data since analysis of variance is quite robust
to departures from their assumptions, especially when the
design is balanced and contains a large number of samples
or treatments (Underwood, 1997).
As Mediterranean MPAs were often established in natu-
rally complex habitats that are more favourable to the devel-
opment of abundant and diversified fish assemblages, the
effect of habitat structure and protection could be con-
founded. It was thus important to discriminate between these
two factors. To explore the relationships between habitat
structure and fish community parameters, multiple regres-
sions were performed between all habitat characteristics re-
corded and fish species richness, abundance and biomass,
using generalized linear models (GLM; McCullagh and Nelder,
1989). Prior to regression analyses, the extreme and influen-
tial cases were detected and subsequently removed (McCul-
lagh and Nelder, 1989; Garcıa-Charton and Perez-Ruzafa,
2001). Because habitat characteristics may explain a large part
of the data variation, we extracted first the variability due to
the influence of habitat variables. Then, we used the residuals
of regression analyses as dependent variables in the analyses
of variance, linear regressions and GAMs with distance from
MPA limits, to ensure that gradients were related to protec-
tion level and not to difference in habitat characteristics
(Chapman and Kramer, 1999; Garcıa-Charton et al., 2004).
Trends and significance of gradients of fish abundance and
biomass across MPA boundaries were calculated by linear cor-
relations. Negative correlations would indicate that abun-
dance and biomass of fishes decreased from the core of the
MPA to distant fished areas. The border of the integral reserve
was defined as zero, so negative distances indicated zones lo-
cated inside the integral reserve (IR) and positive distances
zones located outside the IR. Gradients of fish abundance
and biomass were analysed by linear correlations on raw data
and on residuals of multiple regressions with habitat charac-
teristics to check how differences in these characteristics may
affect the gradients. We used GAMs to describe the shape of
the relationships of the residuals of biomass with distance
to the boundaries of the reserve, as biomass was the most
pertinent parameter in our study. Distance to the integral re-
serve boundary was introduced as a continuous smooth var-
iable modelled non-parametrically using a loess smoother
(lo(distance)). To model the relationship between dependent
variables and predictors, we used the Gaussian variance and
the identity link functions. F-tests were used to determine
whether the distance to the reserve explained a significant
portion of the model deviance. To fit the GAMs, we used the
routines contained in the S-Plus (MathSoft Inc.) programming
environment based on Hastie and Tibshirani (1990) and func-
tions developed by Venables and Ripley (2000).
To measure at which spatial scale fish spillover might oc-
cur, we calculated the minimum distance between the stud-
ied zones located on each side of the MPA border where a
sharp difference in mean fish abundance and biomass was
observed inside versus outside the reserve.
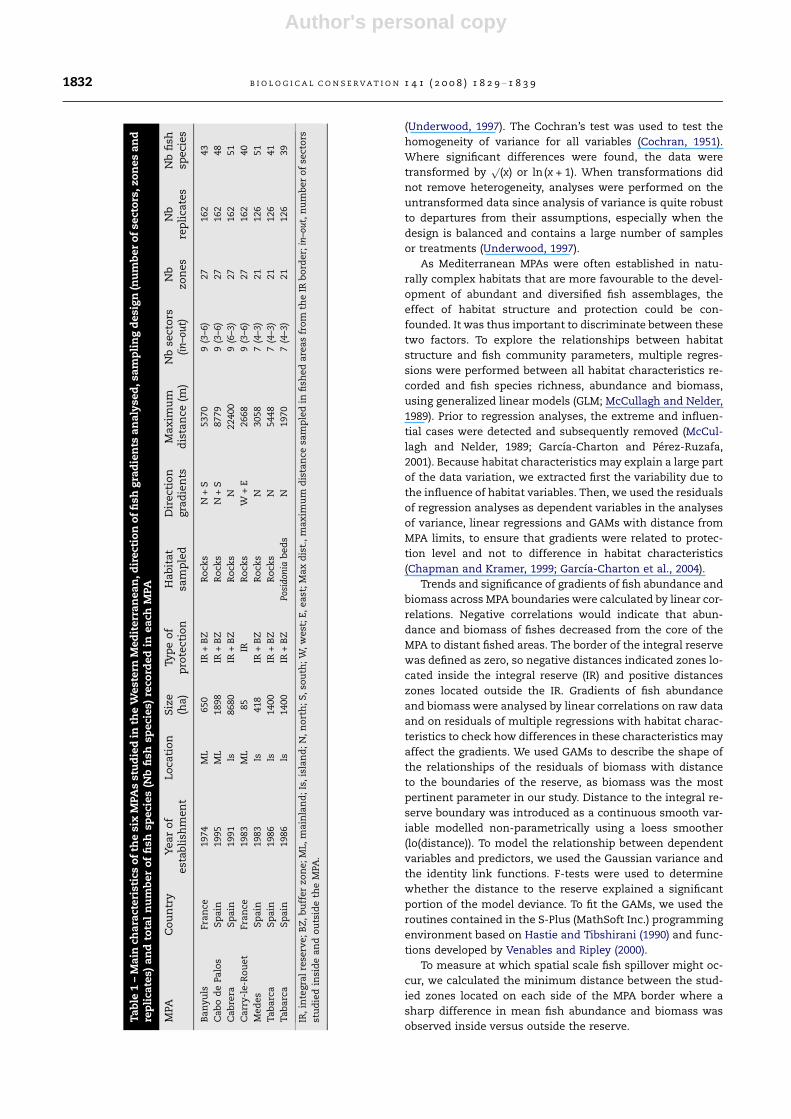
Ta
ble
1–
Ma
inch
ara
cteri
stic
so
fth
esi
xM
PAs
stu
die
din
the
West
ern
Med
iterr
an
ea
n,d
irect
ion
of
fish
gra
die
nts
an
aly
sed
,sa
mp
lin
gd
esi
gn
(nu
mb
er
of
sect
ors
,zo
nes
an
dre
pli
cate
s)a
nd
tota
ln
um
ber
of
fish
speci
es
(Nb
fish
speci
es)
reco
rded
inea
chM
PA
MPA
Co
un
try
Yea
ro
fest
ab
lish
men
tLo
cati
on
Siz
e(h
a)
Typ
eo
fp
rote
ctio
nH
ab
ita
tsa
mp
led
Dir
ect
ion
gra
die
nts
Ma
xim
um
dis
tan
ce(m
)N
bse
cto
rs(i
n–o
ut)
Nb
zon
es
Nb
rep
lica
tes
Nb
fish
speci
es
Ba
ny
uls
Fra
nce
1974
ML
650
IR+
BZ
Ro
cks
N+
S5370
9(3
–6)
27
162
43
Ca
bo
de
Pa
los
Sp
ain
1995
ML
1898
IR+
BZ
Ro
cks
N+
S8779
9(3
–6)
27
162
48
Ca
bre
raS
pa
in1991
Is8680
IR+
BZ
Ro
cks
N22400
9(6
–3)
27
162
51
Ca
rry
-le-R
ou
et
Fra
nce
1983
ML
85
IRR
ock
sW
+E
2668
9(3
–6)
27
162
40
Med
es
Sp
ain
1983
Is418
IR+
BZ
Ro
cks
N3058
7(4
–3)
21
126
51
Tab
arc
aS
pa
in1986
Is1400
IR+
BZ
Ro
cks
N5448
7(4
–3)
21
126
41
Tab
arc
aS
pa
in1986
Is1400
IR+
BZ
Posi
don
iab
ed
sN
1970
7(4
–3)
21
126
39
IR,
inte
gra
lre
serv
e;
BZ
,b
uff
er
zon
e;
ML,
ma
inla
nd
;Is
,is
lan
d;
N,
no
rth
;S
,so
uth
;W
,w
est
;E
,ea
st;
Ma
xd
ist.
,m
ax
imu
md
ista
nce
sam
ple
din
fish
ed
are
as
fro
mth
eIR
bo
rder;
in–o
ut,
nu
mb
er
of
sect
ors
stu
die
din
sid
ea
nd
ou
tsid
eth
eM
PA.
1832 B I O L O G I C A L C O N S E R V A T I O N 1 4 1 ( 2 0 0 8 ) 1 8 2 9 – 1 8 3 9
Author's personal copy
3. Results
3.1. Effect of protection
In Cabo de Palos, Medes and Tabarca-Posidonia, all fish com-
munity parameters (species richness, abundance, and bio-
mass) were significantly higher inside than outside the
MPAs, whereas no significant difference existed in Tabarca-
rocks (Table 2). The only non-significant parameters between
protected and unprotected areas were mean abundance in
Banyuls, and mean species and abundance in Cabrera and
Carry-le-Rouet. Thus, a ‘reserve effect’ was observed for fish
biomass in all MPAs, except in Tabarca-rocks, whereas the ef-
fect on fish abundance was less conspicuous.
3.2. Influence of habitat
Habitat structure showed a significant influence on all param-
eters in Banyuls, Cabo de Palos and Medes, whereas it was
less important in Cabrera where only fish abundance re-
sponded significantly (Table 3). In Carry-le-Rouet and Tabar-
ca-rocks fish biomass was not affected by habitat structure.
It was interesting to observe that in Tabarca-Posidonia beds
subtle differences in habitat structure in this apparently
Table 2 – Mean (SD) fish species richness (SP, number of species), abundance (AB, number of individuals) and biomass (BIO,fish biomass in kg) per transect of fish recorded inside and outside the six MPAs studied with results of ANOVAs
MPA Inside MPA Outside MPA F p
Banyuls SP 11.2 (3.2) 10.8 (2.5) 2.53 0.048 *
AB 79.2 (61.2) 70.5 (55.5) 1.40 0.263 ns
BIO 16.3 (30.3) 4.0 (19.3) 34.91 0.002 **
Cabo de Palos SP 12.9 (3.2) 9.8 (2.7) 3.69 0.010 *
AB 99.0 (66.0) 60.1 (50.2) 9.35 <0.001 ***
BIO 28.2 (28.3) 2.9 (5.8) 36.13 <0.001 ***
Cabrera SP 14.1 (2.5) 13.9 (2.7) 0.38 0.536 ns
AB 93.0 (77.2) 71.6 (29.6) 3.82 0.052 ns
BIO 13.6 (18.6) 2.7 (1.7) 18.46 <0.001 ***
Carry-le-Rouet SP 13.1 (3.0) 12.4 (2.8) 1.84 0.135 ns
AB 99.3 (80.1) 64.1 (41.7) 1.29 0.306 ns
BIO 16.3 (40.9) 2.4 (9.1) 4.12 0.006 **
Medes SP 13.8 (3.6) 10.2 (2.4) 3.24 0.033 *
AB 61.1 (34.2) 31.5 (23.0) 5.46 0.004 **
BIO 17.5 (14.9) 2.7 (4.3) 15.00 <0.001 ***
Tabarca-rocks SP 12.3 (2.7) 13.3 (1.9) 1.97 0.139 ns
AB 113.6 (69.7) 98.3 (52.0) 1.31 0.314 ns
BIO 9.4 (9.0) 5.3 (0.1) 1.37 0.291 ns
Tabarca-Posidonia SP 10.1 (2.8) 7.7 (2.4) 4.73 0.008 **
AB 89.3 (68.4) 49.0 (44.0) 8.80 <0.001 **
BIO 4.5 (11.2) 0.7 (0.8) 7.44 0.001 **
ns, not significant; *, significant at p < 0.05; **, significant at p < 0.01; ***, significant at p < 0.001.
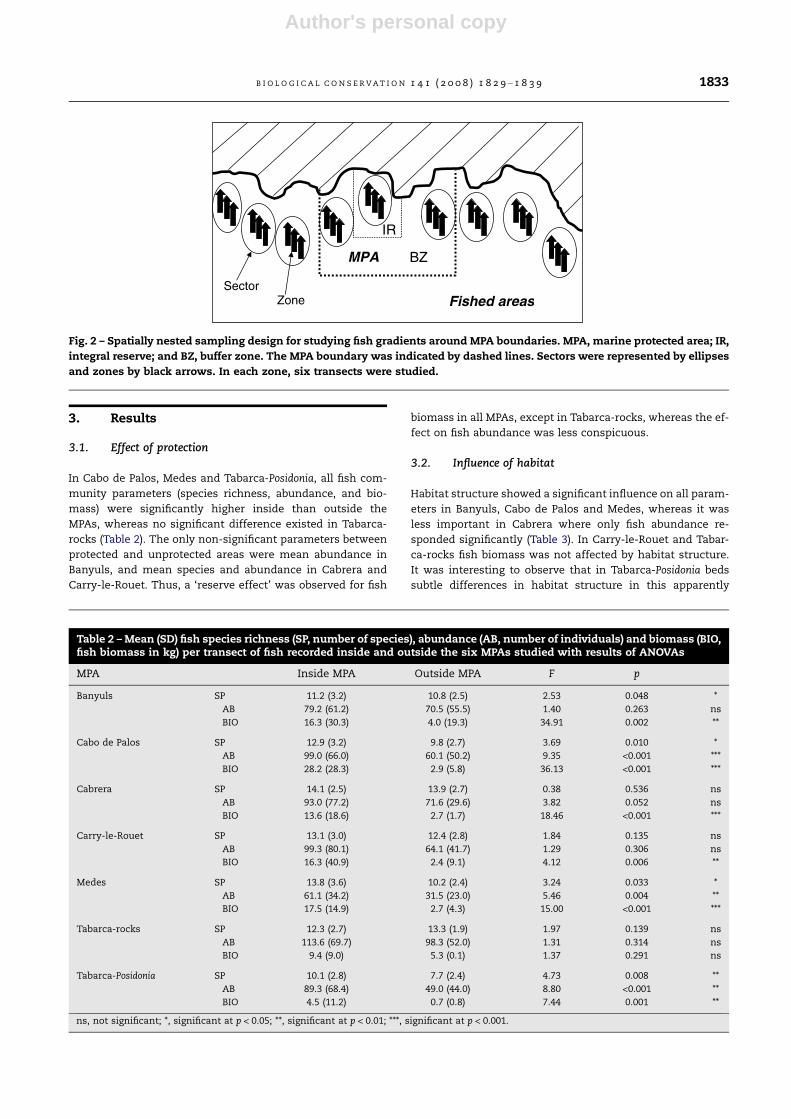
IR
BZ
Fished areas
MPA
SectorZone
Fig. 2 – Spatially nested sampling design for studying fish gradients around MPA boundaries. MPA, marine protected area; IR,
integral reserve; and BZ, buffer zone. The MPA boundary was indicated by dashed lines. Sectors were represented by ellipses
and zones by black arrows. In each zone, six transects were studied.
B I O L O G I C A L C O N S E R V A T I O N 1 4 1 ( 2 0 0 8 ) 1 8 2 9 – 1 8 3 9 1833

Author's personal copy
‘homogeneous’ seagrass environment influenced significantly
the species richness and biomass of fish. We removed then
the effects of habitat in all MPAs when analysing gradients
to be sure that the patterns observed were due to differences
in protection and not to differences in habitat structure.
3.3. Gradients of abundance and biomass
Correlation coefficients (r) and probability levels (p) of these
coefficients for abundance and biomass are presented in Ta-
ble 4. Most correlations (35/40) were negative, which implied
that fish abundance and biomass decreased from the core
of the MPA to fished areas, and 23 of these negative correla-
tions were statistically significant. Only five correlations were
positive (increasing abundance and biomass in fished areas),
but none of them were significant. The number of significant
negative correlations was higher with biomass than with
abundance, and higher when computed on raw data than
on residuals. These results suggested that protection has
greater influence on biomass than on abundance, and could
be confounded with the effect of habitat structure in some
cases.
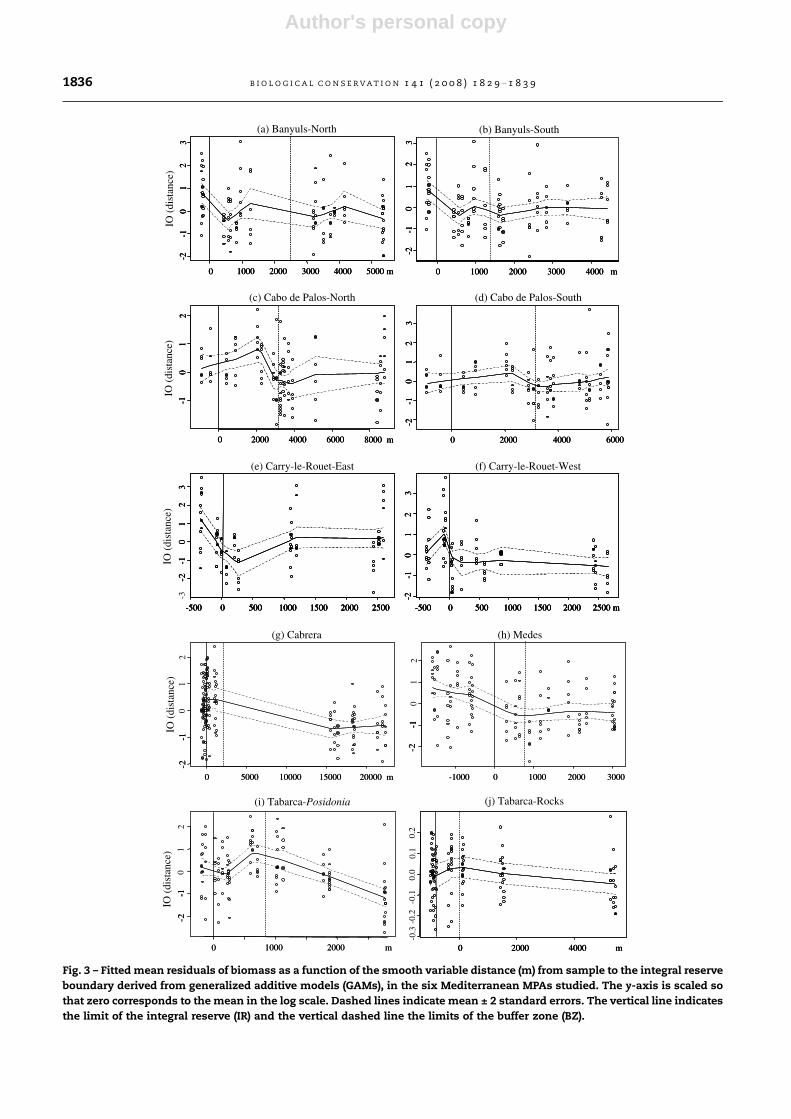
Results of GAMs of the residuals of fish biomass, as a func-
tion of distance to reserve boundaries yielded significant non-
linear relationships in 8 out of 10 cases studied (Table 5). The
deviation explained by the models was generally low with a
maximum of 31% in Tabarca-Posidonia. Representation of fit-
ted values for the GAMs showed two main patterns of bio-
mass gradients (Fig. 3): mean biomass declined abruptly
inside the MPA, at the IR–BZ boundary (Banyuls, Medes, and
Tabarca-Posidonia) or declined mainly outside the MPAs at
the BZ–fished area boundary (Cabo de Palos, Cabrera, and
Tabarca-rocks). In Carry-le-Rouet, biomass decreased
abruptly at the IR–fished area boundary, as no buffer zone
was established in this MPA.
3.4. Mean distance for spillover
The mean distance estimated for fish spillover was
510 ± 562 m (n = 10) from the six MPAs studied, ranging from
a minimum of 107 m at Carry-West to a maximum of
1959 m at Banyuls-North. Results of GAMs provided a visual
confirmation of these estimates with a depletion of biomass
close to the reserve boundaries (<1000 m), with the exception
of Cabo de Palos where the depletion was observed at a great-
er distance (3000 m) (Fig. 2). Therefore, the mean distance for
fish spillover estimated in this study probably occurred at a
scale of 100s of metres in five out of the six MPAs studied.
4. Discussion
4.1. Effects of protection
Our data indicated that significantly higher values in mean
species richness, abundance or biomass of fishes occurred in-
side the six marine protected areas studied. The non-signifi-
cant pattern observed for Tabarca-rocks originated probably
from a synergy between two local characteristics: rocky areas
were scarce and isolated among seagrass beds around Tabar-
ca Island, and the fishing pressure was centred on Posidonia
Table 3 – Summary of multiple linear regressions (GLMs) of mean species richness, abundance and biomass of fishesagainst linear, quadratic and cubic terms of all habitat characteristics together, as tested in the six MPAs
Banyuls Cabo de Palos Cabrera Carry-le-Rouet Medes Tabarca-rocks Tabarca-Posidonia
Species richness 0.256*** 0.347*** 0.198 ns 0.278** 0.330*** 0.262*** 0.203**
Abundance 0.124* 0.269*** 0.290** 0.233* 0.281*** 0.204** 0.025 ns
Biomass 0.211*** 0.605*** 0.209 ns 0.206 ns 0.191** 0.102 ns 0.286***
Values of adjusted R2 and the level of significance of each analysis were indicated; ns, not significant.
* Significant at p < 0.05.
** Significant at p < 0.01.
*** Significant at p < 0.001.
Table 4 – Results of linear correlations performed on raw data of abundance (AB raw data) and biomass (BIO raw data), andon residuals after extracting the effects of habitat (AB residuals and BIO residuals)
MPA AB raw data (r) AB residuals (r) BIO raw data (r) BIO residuals (r)
Banyuls-North �0.069 ns �0.104 ns �0.387 *** �0.200 *
Banyuls-South �0.040 ns �0.126 ns �0.203 * �0.141 *
Cabo de Palos-North �0.194 * +0.020 ns �0.492 *** �0.141 *
Cabo de Palos-South �0.353 *** +0.067 ns �0.624 *** �0.010 ns
Cabrera �0.056 ns �0.001 ns �0.157 * �0.459 ***
Carry-le-Rouet-East +0.037 ns +0.190 ns �0.021 ns +0.033 ns
Carry-le-Rouet-West �0.256 * �0.228 * �0.201 ns �0.319 **
Medes �0.575 *** �0.122 ns �0.664 *** �0.356 ***
Tabarca-rocks �0.236 ** �0.022 ns �0.242 ** �0.147 ns
Tabarca-Posidonia �0.509 *** �0.312 *** �0.604 *** �0.352 ***
The correlation coefficient (r) is given with its statistical significance; ns, not significant; *, significant at p < 0.05; **, significant at p < 0.01; ***,
significant at p < 0.001.
1834 B I O L O G I C A L C O N S E R V A T I O N 1 4 1 ( 2 0 0 8 ) 1 8 2 9 – 1 8 3 9

Author's personal copy
beds instead of on rocky areas (Sanchez-Jerez and Ramos-Es-
pla, 1996). Difference in fish community parameters between
inside and outside MPAs generally increased from species
richness to abundance, and then to biomass. Mean values
for the six MPAs were 1.1 times higher inside MPA than out-
side for species richness, 1.3 times higher for fish abundance
(planktivores excluded) and 4.7 times higher for biomass. This
implies higher fish weight in the MPAs than in fished areas.
Mean fish weight of fishes, all species included, was esti-
mated to be 3.4 times higher inside the MPAs than in fished
areas. However, analysis at a species level is necessary to fully
understand the differences in the patterns of the ‘reserve ef-
fect’ among fish communities. Higher abundance and bio-
mass of fish inside MPAs was reported previously in Carry
(Harmelin et al., 1995), Banyuls (Bell, 1983), Medes (Garcıa-Ru-
bies and Zabala, 1990), Cabrera (Renones et al., 1997), Tabarca
(Bayle-Sempere and Ramos-Espla, 1993), and Cabo de Palos
(Garcıa-Charton et al., 2004). Results from the present study
indicate the long-lasting effects of protection, and a further
evidence that protection promotes an increase in fish species
richness, abundance, and biomass in Mediterranean marine
reserves, as observed for most tropical and temperate MPAs
(see Halpern, 2003).
4.2. Evidence of gradients in fish abundance and biomass
Whereas visual counts were performed on rocky areas with
habitat structure as comparable as possible, multiple linear
regressions demonstrated that habitat characteristics at a fine
spatial scale significantly influenced the fish community
parameters (species richness, abundance, and biomass). The
decrease in the number of significant linear correlations
when calculated on residuals rather than on raw data was a
confirmation of the need to take habitat characteristics into
account to really analyse gradients related to protection, as
evidenced by Chapman and Kramer (1999) and Garcıa-Char-
ton et al. (2004).
More significant correlations were observed for fish bio-
mass than for abundance. Overall, 70% of the linear correla-
tions of fish biomass with distance were significantly
negative, which implied that in most cases fish biomass sig-
nificantly decreased from MPAs to fished areas. GAMs dem-
onstrated that gradients were not linear in most cases,
with sharp decrease in fish biomass near MPA boundaries.
Few studies throughout the world have quantified up to
now the actual shape of fish abundance or biomass gradients
across MPA boundaries (e.g. Chapman and Kramer, 1999;
Kaunda-Arara and Rose, 2004; Ashworth and Ormond, 2005;
Guidetti, 2007). The present study, by encompassing a broad
geographical extent, and including six MPAs with their own
particularities, constitutes the biggest effort to date to quan-
tify such gradients, and permits to generalize the results at
the regional scale. It also provided evidence that decreasing
gradients of abundance and biomass are not related to the
location (on mainland or island) or size (small or large) of
the MPAs.
Table 5 – Analysis of deviance for the generalized additive models (GAMs) fitted with the residuals of fish biomass
Term Res.dev Res.df df dev F p(F) R2
Banyuls-North Null 118.46 107
Lo(distance) 100.10 102 1 18.35 3.50 0.010** 0.16
Banyuls-South Null 123.85 107
Lo(distance) 104.57 103 1 19.28 5.56 0.001*** 0.16
Cabo de Palos-North Null 84.73 107
Lo(distance) 69.30 101 1 15.42 4.61 0.001*** 0.18
Cabo de Palos-South Null 97.18 107
Lo(distance) 89.50 102 1 7.68 2.78 0.040* 0.08
Cabrera Null 147.67 161
Lo(distance) 113.08 156 1 34.57 2.20 0.070 ns 0.23
Carry-le-Rouet-East Null 157.12 83
Lo(distance) 119.97 79 1 37.15 7.74 <0.001*** 0.24
Carry-le-Rouet-West Null 102.49 83
Lo(distance) 71.43 78 1 31.06 6.27 <0.001*** 0.30
Medes Null 171.46 124
Lo(distance) 137.69 120 1 33.77 3.73 0.015* 0.20
Tabarca-rocks Null 1.54 125
Lo(distance) 1.46 120 1 0.08 0.88 0.460 ns 0.05
Tabarca-Posidonia Null 148.77 125
Lo(distance) 102.50 120 1 46.27 9.05 <0.001*** 0.31
Res.dev. and Res.df are the deviance and degrees of freedom of the model, respectively. The probability column corresponds to the significance
of the deviance portion of the residuals of biomass explained by the predictor. Lo(distance), locally weighted regression smoother ‘loes’; ns, not
significant.
* Significant at p < 0.05.
** Significant at p < 0.01.
*** Significant at p < 0.001.
B I O L O G I C A L C O N S E R V A T I O N 1 4 1 ( 2 0 0 8 ) 1 8 2 9 – 1 8 3 9 1835
Author's personal copy
0 1000 2000 3000 4000 5000 m
-2-1
01
23
0 2000 4000 6000 8000 m
-10
12
-500 0 500 1000 1500 2000 2500
0 1000 2000 3000 4000 m
0 2000 4000 6000
-500 0 500 1000 1500 2000 2500 m
0 5000 10000 15000 20000 m
0 1000 2000 m
-1000 0 1000 2000 3000
0 2000 4000 m
-0.3
-0.2
-0.1
0.0
0.1
0.2
0 1000 2000 3000 4000 5000 m
-2-1
01
23
0 1000 2000 3000 4000 5000 m
-2-1
01
23
-2-1
01
23
-2-1
01
23
-2-1
01
23
-2-1
01
23
-2-1
01
23
-2-1
01
23
-2-1
01
23
-2-1
01
23
-2-1
01
23
-2-1
01
23
-2-1
01
23
-2-2-2
-1-1-1-1
00
11
22
-2-2-1-1-1
01
2
-2-2-1-1-1
01
23
-3
0 2000 4000 6000 8000 m
-10
12
0 2000 4000 6000 8000 m
-10
12
-500 0 500 1000 1500 2000 2500 -500 0 500 1000 1500 2000 2500 -500 0 500 1000 1500 2000 2500
0 1000 2000 3000 4000 m0 1000 2000 3000 4000 m
0 2000 4000 60000 2000 4000 6000
-500 0 500 1000 1500 2000 2500 m-500 0 500 1000 1500 2000 2500 m-500 0 500 1000 1500 2000 2500 m
0 5000 10000 15000 20000 m
0 1000 2000 m
-1000 0 1000 2000 3000
0 2000 4000 m0 2000 4000 m
IO (
dist
ance
)IO
(di
stan
ce)
IO (
dist
ance
)IO
(di
stan
ce)
IO (
dist
ance
)
(a) Banyuls-North
(c) Cabo de Palos-North (d) Cabo de Palos-South
(e) Carry-le-Rouet-East
(g) Cabrera
(i) Tabarca-Posidonia (j) Tabarca-Rocks
(h) Medes
(f) Carry-le-Rouet-West
(b) Banyuls-South
Fig. 3 – Fitted mean residuals of biomass as a function of the smooth variable distance (m) from sample to the integral reserve
boundary derived from generalized additive models (GAMs), in the six Mediterranean MPAs studied. The y-axis is scaled so
that zero corresponds to the mean in the log scale. Dashed lines indicate mean ± 2 standard errors. The vertical line indicates
the limit of the integral reserve (IR) and the vertical dashed line the limits of the buffer zone (BZ).
1836 B I O L O G I C A L C O N S E R V A T I O N 1 4 1 ( 2 0 0 8 ) 1 8 2 9 – 1 8 3 9
Author's personal copy
In our analysis, two main patterns in the change of bio-
mass with distance could be differentiated: one showed that
mean biomass declined inside the MPA at the integral re-
serve–buffer zone boundaries, while in others mean biomass
declined outside the MPA at the buffer–fished area bound-
aries. These two patterns may be related to spatial allocation
of fishing effort allowed and effectively exerted in both the
buffer zone and outside the different MPAs, diversity of gears
used, and mobility and catchability of the main species form-
ing the fish assemblage (Rakitin and Kramer, 1996; Kramer
and Chapman, 1999; Kellner et al., 2007).
Modelling studies have suggested that spillover from mar-
ine reserves is likely to be higher under condition of high fish-
ing pressure (Nowlis and Roberts, 1997). Abesamis et al. (2006)
observed that density and biomass decreased abruptly across
the reserve boundary in the Philippines and attributed this
pattern to high fishing level. Furthermore, the fishing-the-line
strategy, by being the more frequent spatial arrangement of
fishing effort around Mediterranean marine reserves (Goni
et al., 2006), is likely to generate abrupt changes in the border
limits (Kellner et al., 2007). Stelzenmuller et al. (2007) ob-
served high levels of fishing effort and catch per unit of area
(CPUA) by local artisanal fisheries near protection boundaries
around Medes Islands, as well as significant decreasing trends
with distance to those boundaries. As an example, in Cabo de
Palos the total fishing effort (expressed as total length of long-
lines or nets soak in one year, averaged for 2003–2005) for bot-
tom longline sharply decreased with distance to the no-use
area from 72,330 to 36,800 m y�1 in 1 nautical mile (nm) to
the north, and to 23,216 m y�1 in 2 nm to the south; in the
case of rockfish trammel-net this difference was
76,410 m y�1 against 29,710 m y�1 in 1 nm to the north, and
34,680 m y�1 in 2 nm to the south (S. Polti and O. Esparza,
Univ. de Murcia, Murcia, Spain, personal communication).
This concentration of fishing effort along MPA limits can be
used as evidence of spillover, provided that MPAs included
in the present study are older than 10 years, hence precluding
the confounding effect of redistribution of fishing effort after
reserve creation, as indicated by Halpern et al. (2004).
Fish mobility and catchability are likely to influence the
existence and shape of abundance and biomass gradients
across MPA boundaries (Kramer and Chapman, 1999; Kellner
et al., 2007). Thus, these gradients are expected to be sharper
for low-mobility species and for species presenting high
catchability. In some cases (Banyuls, Cabo de Palos-North,
Carry-East, and Medes), we observed a sharp depression of
the biomass of the observed fish assemblage. This could be
due to an accumulation of fishing effort near the reserve
boundary, in a multispecies fishery aiming to maximize CPUE
of more mobile species and catching less mobile species at
the same time (Kellner et al., 2007). Similarly, the depletion
in biomass of lobsters observed around Columbretes Islands
by Goni et al. (2006) would indicate that fishing effort was
higher near this MPA, as corroborated by their effort alloca-
tion data. On the other hand, fishing effort exerted in the
vicinity of Mediterranean MPAs throughout the year is target-
ing a large array of fish species very efficiently, the mobility of
these target species ranging from limited (e.g. Scorpaenidae)
to high (e.g. Carangidae). This is due to the fact that artisanal
fisheries within and around Mediterranean MPAs are usually
seasonally rotating, multi-gear and multi-specific in nature,
and they use a technology that has been evolving for centu-
ries until achieving very high efficiency to obtaining aggre-
gated catch of several, high-value species (Bas et al., 1985;
Stelzenmuller et al., 2007). Such decreasing gradients of fish
abundance and biomass across MPA boundaries were ob-
served in a number of studies in tropical and temperate re-
gions for fish and invertebrates targeted by local fisheries
(Chapman and Kramer, 1999; Ashworth and Ormond, 2005;
Goni et al., 2006; Guidetti, 2007). General trends emerging
from our results were in accordance with the initial hypothe-
sis proposed by Rakitin and Kramer (1996) and the existence
of such negative gradients seemed to be a good evidence of
fish spillover from the six Mediterranean MPAs studied.
4.3. Spatial scale of MPA effectiveness for local fisheries
Even if individual fish of some species were able to swim long
distances as shown by tagging experiments in this region
(Chauvet et al., 1992), the benefit of fish spillover to local fish-
eries is likely to occur at small spatial scales (100s of meters),
at least where the movement of sub-adults and adults by dif-
ferent mechanisms is concerned (home range relocation and/
or migration). The small-scale (500 m in average) on which
fish spillover from the six MPAs studied seemed mostly to oc-
cur was probably also related to the high fishing pressure
existing outside these MPAs. Similar results were obtained
for other marine reserves located in temperate (Guidetti,
2007) and tropical regions (Russ and Alcala, 1996; Roberts
et al., 2001; Russ et al., 2003; Abesamis et al., 2006), where fish
spillover from MPA was estimated to occur on the scale of a
few 100s of metres. The procedure used in the present study
was questionable as measuring spillover distance depended
on the sampling design in each MPA but was used here as
the best estimate available.
Tagging and telemetry studies recurrently revealed that
movement of fishes across MPA boundaries are rare, extend-
ing from a few 10s to 100s of meters away from the marine re-
serves for sparids (Egli and Babcock, 2004), labrids (Topping
et al., 2006), serranids (Lowe et al., 2003), mullids (Meyer
et al., 2000), lutjanids (Meyer et al., 2007), and young sharks
(Garla et al., 2006). Only for some carangids, the beneficial ef-
fect of MPAs beyond their boundaries can reach longer dis-
tances (e.g. James, 1980; but see Holland et al., 1996). In this
framework, the question of what is the optimal fraction of
coast to be protected, or other design aspects of MPAs in order
to prevent fish populations from fishing depletion, remains
open.
5. Conclusions
The existence of regular patterns in negative gradients of fish
abundance and biomass across MPA boundaries to fished
areas in the six MPAs studied was consistent with the initial
hypothesis of export of adult fishes from MPAs to adjacent
non-reserve sites, and could be considered to be a general
pattern in the Western Mediterranean. Spillover, however, is
probably reduced to a few 100s of metres around MPAs. Very
little information is available yet to characterize home range
B I O L O G I C A L C O N S E R V A T I O N 1 4 1 ( 2 0 0 8 ) 1 8 2 9 – 1 8 3 9 1837
Author's personal copy
and diel, seasonal and ontogenetic migrations of Mediterra-
nean coastal fish species, and hence this kind of information
is urgently needed to properly design MPAs to achieve their
management goals.
Acknowledgements
This work was developed in the framework of the EC Project
BIOMEX (QLRT-2001-0891), WP2. We thank the support of the
coordinator Serge Planes, the BIOMEX group and the staffs of
the six MPAs investigated. We are grateful to Aitor Forcada
and Mikel Zabala for assistance in fieldwork in Tabarca and
Medes, respectively. We are grateful to Ben Stobart for his useful
comments and the correction of English. Thanks are expressed
to three anonymous reviewers for their helpful criticisms.
R E F E R E N C E S
Abesamis, R.A., Russ, G.R., 2005. Density-dependent spilloverfrom a marine reserve: long-term evidence. EcologicalApplications 15, 1798–1812.
Abesamis, R.A., Russ, G.R., Alcala, A.C., 2006. Gradients ofabundance of fish across no-take marine reserve boundaries:evidence from Philippine coral reefs. Aquatic Conservation:Marine and Freshwater Ecosystems 16, 349–371.
Alcala, A.C., Russ, G.R., Maypa, A.P., Calumpong, H.P., 2005. Along-term, spatially replicated experimental test of the effectof marine reserves on local fish yields. Canadian Journal ofFisheries and Aquatic Sciences 62, 98–108.
Ashworth, J.S., Ormond, R.F.G., 2005. Effects of fishing pressureand trophic group on abundance and spillover acrossboundaries of a no-take zone. Biological Conservation 121,333–344.
Bas, C., Macpherson, E., Sarda, F., 1985. Fishes and fishermen: theexploitable trophic levels. In: Margalef, R. (Ed.), WesternMediterranean. Pergamon Press, Oxford, pp. 296–316.
Bayle-Sempere, J.T., Ramos-Espla, A.A., 1993. Some populationparameters as bioindicators to assess the ‘‘reserve effect’’ onthe fish assemblage. In: Boudouresque, C.M., Avon, M.,Pergent-Martini, C. (Eds.), Qualite du milieu marin: Indicateursbiologiques et physico-chimiques. GIS Posidonie Publishing,Marseille, pp. 189–214.
Bayle-Sempere, J.T., Valle, C., Verdu, A., 2002. ECOCEN v1.00.00.Application for managing fish visual counts. Universitatd’Alacant.
Bell, J.D., 1983. Effects of depth and marine reserve fishingrestrictions on the structure of a rocky reef fish assemblage inthe North-Western Mediterranean Sea. Journal of AppliedEcology 20, 357–369.
Chapman, M.R., Kramer, D.L., 1999. Gradients in coral reef fishdensity and size across the Barbados Marine Reserveboundary: effects of reserve protection and habitatcharacteristics. Marine Ecology Progress Series 181, 81–96.
Chauvet, C., Lasserre, G., Bach, P., Besseau, L., 1992. Resultatsd’une experience de marquage de trois especes de poissonscotiers du golfe du Lion: Dicentrarchus labrax, Sparus aurataet Liza aurata. Cybium 16, 3–11.
Claudet, J., Pelletier, D., Jouvenel, J.Y., Bachet, F., Galzin, R., 2006.Assessing the effects of marine protected area (MPA) on a reeffish assemblage in a northwestern Mediterranean marinereserve: identifying community-based indicators. BiologicalConservation 130, 349–369.
Cochran, W.G., 1951. Testing a linear relation among variances.Biometrics 7, 17–32.
Dufour, F., Guidetti, P., Francour, P., 2007. Comparaison desinventaires de poissons dans les aires marines protegees deMediterranee: influence de la surface et de l’anciennete.Cybium 31, 19–31.
Egli, D.P., Babcock, R.C., 2004. Ultrasonic tracking reveals multiplebehavioural modes of snapper (Pagrus auratus) in a temperateno-take marine reserve. ICES Journal of Marine Science 61,1137–1143.
Francour, P., Harmelin, J.G., Pollard, D., Sartoretto, S., 2001. Areview of marine protected areas in the northwesternMediterranean region: sitting, usage, zonation andmanagement. Aquatic Conservation: Marine and FreshwaterEcosystems 11, 155–188.
Garcıa-Charton, J.A., Perez-Ruzafa, A., 1999. Ecologicalheterogeneity and the evaluation of the effects of marinereserves. Fisheries Research 42, 1–20.
Garcıa-Charton, J.A., Perez-Ruzafa, A., 2001. Spatial pattern andthe habitat structure of a Mediterranean rocky reef fish localassemblage. Marine Biology 138, 917–934.
Garcıa-Charton, J.A., Perez-Ruzafa, A., Sanchez-Jerez, P., Bayle-Sempere, J.T., Renones, O., Moreno, D., 2004. Multi-scale spatialheterogeneity, habitat structure, and the effect of marinereserves on Western Mediterranean rocky reef fishassemblages. Marine Biology 144, 161–182.
Garcıa-Rubies, A., Zabala, M., 1990. Effect of total fishingprohibition on the rocky fish assemblages of Medes Islandsmarine reserve (N.W. Mediterranean). Scientia Marina 54, 317–328.
Garla, R.C., Chapman, D.D., Wetherbee, B.M., Shivji, M., 2006.Movement patterns of young Caribbean reef sharks,Carcharhinus perezi, at Fernando de Noronha Archipelago,Brazil: the potential of marine protected areas forconservation of a nursery ground. Marine Biology 149, 189–199.
Gell, F.R., Roberts, C.M., 2003. Benefits beyond boundaries: thefishery effects of marine reserves. Trends in Ecology andEvolution 18, 448–455.
Goni, R., Quetglas, A., Renones, O., 2006. Spillover of spiny lobstersPalinurus elephas from a marine reserve to an adjoining fishery.Marine Ecology Progress Series 308, 207–219.
Guidetti, P., 2007. Potential of marine reserves to causecommunity-wide changes beyond their boundaries.Conservation Biology 21, 540–545.
Halpern, B.S., 2003. The impact of marine reserves: do reserveswork and does reserve size matter? Ecological Applications 13(Suppl), S117–S137.
Halpern, B.S., Gaines, S.D., Warner, R.R., 2004. Confoundingeffects of the export of production and the displacement offishing effort from marine reserves. Ecological Applications 14,1248–1256.
Halpern, B.S., Warner, R.R., 2002. Marine reserves have rapid andlasting effects. Ecology Letters 5, 361–366.
Harmelin, J.G., 1987. Structure and variability of the ichthyofaunain a Mediterranean protected rocky area (National Park of Port-Cros, France). PSZNI: Marine Ecology 8, 263–284.
Harmelin, J.G., Bachet, F., Garcia, F., 1995. Mediterranean marinereserves: fish indices as tests of protection efficiency. PSZNI:Marine Ecology 16, 233–250.
Harmelin-Vivien, M.L., Harmelin, J.G., Chauvet, C., Duval, C.,Galzin, R., Lejeune, P., Barnabe, G., Blanc, F., Chevalier, R.,Duclerc, J., Lasserre, G., 1985. Evaluation visuelle despeuplements et populations de poissons: Methodes etproblemes. Revue d’Ecologie (Terre Vie) 40, 467–539.
Hastie, T., Tibshirani, R., 1990. Generalized Additive Models.Chapman & Hall, London.
Holland, K.N., Lowe, C.G., Wetherbee, B.M., 1996. Movements anddispersal patterns of Blue Trevally (Caranx melampygus) in afisheries conservation zone. Fisheries Research 25,279–292.
1838 B I O L O G I C A L C O N S E R V A T I O N 1 4 1 ( 2 0 0 8 ) 1 8 2 9 – 1 8 3 9
Author's personal copy
James, G.D., 1980. Tagging experiments on trawl-caught trevally,Caranx georgianus, off north-east New Zealand, 1973–1979.New Zealand Journal of Marine and Freshwater Research 14,249–254.
Kaunda-Arara, B., Rose, G.A., 2004. Effects of marine reef NationalParks on fishery CPUE in coastal Kenya. BiologicalConservation 118, 1–13.
Kellner, J.B., Tetreault, I., Gaines, S.D., Nisbet, R.M., 2007. Fishing-the-line near marine reserves in single and multi-speciesfisheries. Ecological Applications 17, 1039–1054.
Kramer, D.L., Chapman, M.R., 1999. Implications of fish homerange size and relocation for marine reserve function.Environmental Biology of Fishes 55, 65–79.
Lowe, C.G., Topping, D.T., Cartamil, D.P., Papastamatiou, Y.P., 2003.Movement patterns, home range, and habitat utilization ofadult kelp bass Paralabrax clathratus in a temperate no-takemarine reserve. Marine Ecology Progress Series 256, 205–216.
McClanahan, T.R., Mangi, S., 2000. Spillover of exploitable fishesfrom a marine park and its effect on the adjacent fishery.Ecological Applications 10, 1792–1805.
McCullagh, P., Nelder, J.A., 1989. Generalized Linear Models,second ed. Chapman and Hall, New York.
Macpherson, E., Gordoa, A., Garcıa-Rubies, A., 2002. Biomass sizespectra in littoral fishes in protected and unprotected areas inthe NW Mediterranean. Estuarine, Coastal and Shelf Science55, 777–788.
Meyer, C.G., Holland, K.N., Wetherbee, B.M., Lowe, C.G., 2000.Movement patterns, habitat utilization, home range size andsite fidelity of whitesaddle goatfish, Parupeneus porphyreus, in amarine reserve. Environmental Biology of Fishes 59, 235–242.
Meyer, C.G., Papastamatiou, Y.P., Holland, K.N., 2007. Seasonal,diel, and tidal movements of green jobfish (Aprion virescens,Lutjanidae) at remote Hawaiian atolls: implications for marineprotected area design. Marine Biology 151, 2133–2143.
Nowlis, J.S., Roberts, C.M., 1997. You can have your fish and eat it,too: Theoretical approaches to marine reserve design. In:Proceedings of the 8th International Coral Reef Symposium,vol. 2, pp. 1907–1910.
Rakitin, A., Kramer, D.L., 1996. Effect of a marine reserve on thedistribution of coral reef fishes in Barbados. Marine EcologyProgress Series 131, 97–113.
Renones, O., Moranta, J., Coll, J., Morales-Nin, B., 1997. Rockybottom fish communities of Cabrera Archipelago NationalPark (Mallorca, Western Mediterranean). Scientia Marina 61,495–506.
Roberts, C.M., Bohnsack, J.A., Gell, F., Hawkins, J.P., Goodridge, R.,2001. Effects of marine reserves on adjacent fisheries. Science294, 1920–1923.
Roberts, C.M., Polunin, N.V.C., 1991. Are marine reserves effectivein management of reef fisheries? Reviews in Fish Biology andFisheries 1, 65–91.
Rowley, R.J., 1994. Case studies and reviews: marine reserves infisheries management. Aquatic Conservation: Marine andFreshwater Ecosystems 4, 233–254.
Russ, G.R., Alcala, A.C., 1996. Do marine reserves export adult fishbiomass? Evidence from Apo Island, central Philippines.Marine Ecology Progress Series 132, 1–9.
Russ, G.R., Alcala, A.C., Maypa, A.P., 2003. Spillover from marinereserves: the case of Naso vlamingii at Apo Island, thePhilippines. Marine Ecology Progress Series 264,15–20.
Russ, G.R., Alcala, A.C., Maypa, A.P., Calumpong, H.P., White, A.T.,2004. Marine reserve benefits local fisheries. EcologicalApplications 14, 597–606.
Russ, G.R., Stockwell, B., Alcala, A.C., 2005. Inferring versusmeasuring rates of recovery in no-take marine reserves.Marine Ecology Progress Series 292, 1–12.
Samoilys, M.A., Martin-Smith, K.M., Giles, B.G., Cabrera, B.,Anticamara, J.A., Brunio, E.O., Vincent, A.C.J., 2007.Effectiveness of five small Philippines coral reef reserves forfish populations depends on site-specific factors, particularlyenforcement history. Biological Conservation 136,584–601.
Sanchez-Jerez, P., Ramos-Espla, A.A., 1996. Detection ofenvironmental impacts of bottom trawling on Posidoniaoceanica (L.) Delile meadows: sensitivity of fish andmacroinvertebrate communities. Journal of AquaticEcosystem Health 5, 239–253.
Stelzenmuller, V., Maynou, F., Martın, P., 2007. Spatial assessmentof benefits of a coastal Mediterranean marine protected area.Biological Conservation 136, 571–583.
Topping, D.T., Lowe, C.G., Caselle, J.E., 2006. Site fidelity andseasonal movement patterns of adult California sheepheadSemicossyphus pulcher (Labridae): an acoustic monitoring study.Marine Ecology Progress Series 326, 257–267.
Underwood, A.J., 1997. Experiments in Ecology: Their LogicalDesign and Interpretation Using Analysis of Variance.Cambridge University Press, Cambridge.
Venables, W.N., Ripley, B.D., 2000. Modern Applied Statistics withS. Springer-Verlag, New York.
B I O L O G I C A L C O N S E R V A T I O N 1 4 1 ( 2 0 0 8 ) 1 8 2 9 – 1 8 3 9 1839
Top Related
Copyright © 2022 FDOKUMEN

