


Bahasa
Halaman
Hukum


Going Global: Predicting the Next Tight Oil Revolution
IHS CERA
Going Global: Predicting the Next
Tight Oil Revolution A comprehensive screening of tight oil opportunities beyond North America

Going Global: Predicting the Next Tight Oil Revolution
What is it?
The Going Global: Predicting the Next Tight Oil Revolution is a
Multiclient Study that will screen 148 potential tight oil plays
around the world, providing a consistent framework of data and
analysis that can be used to prioritize areas of possible investment
and opportunity
The Study will leverage the full breadth of IHS resources globally
including IHS databases and subsurface experts
Study opportunity to interact with IHS experts in workshops and
conference calls
Completed by May 2013
2

Going Global: Predicting the Next Tight Oil Revolution
Global Screening builds on IHS Experience
2010 2011 2012 2013 Q1
• First authoritative
study at play level of
unconventional gas
potential in North
America
• Integrated study
(from geological
screening to market
impact) of shale and
CBM potential in key
markets
• Europe
• East Europe
• South America
• Australia
• India
• China
Cream of the Crop
Unconventional Frontier: The Potential for
Gas Shale and CBM
Prospects North
American Tight
Oil
• First authoritative
study at play level of
Tight oil potential in
North America
• Covering 11
maturing plays and
17 emerging plays in
USA and Canada
Going Global:
Predicting the Next
Tight Oil Revolution
• Screening study of
potential tight oil
opportunities beyond
North America

Going Global: Predicting the Next Tight Oil Revolution
IHS Credentials and Sources
A team of regionally based basin/geological researchers will work
with several resources to create the analytical background for
international screening of tight oil plays
• IHS Upstream Researchers
• IHS International Exploration and Production Database — IRIS21.
This is the most comprehensive and reliable data set of E&P industry
professionals available, featuring a fully integrated data area with over
13,000 E&P data attributes
• IHS Global Exploration and Production Services (GEPS). This ongoing
service provides a worldwide picture of E&P activity
• IHS Petroleum Economics and Policy Solutions (PEPS). This ongoing
resource for the oil and gas industry reports on political, contractual,
environmental, and legal policies around the globe
• IHS Background Sources. Include several reports on worldwide basins
made as Multiclient Studies (i.e. Petroconsultants, IEDS, IHS)
4
• Databases and
services leverage 50
years of information
gathering and
analysis
• Locally based experts
keep databases
updated
• Publicly available
information
• Academic
publications
• Scientific reports
• All these resources
are leveraged by the
global tight oil team

Going Global: Predicting the Next Tight Oil Revolution
A Global Revolution Starts?
• The application of horizontal drilling technology
and hydraulic fracturing to tight oil formations
has led to an oil supply renaissance in North
America, reversing a two-decade production
decline
• Using production and well data, IHS CERA has
recently concluded an authoritative assessment
of tight oil prospects in North America for 27
plays*. IHS CERA estimates that tight oil will
add over 40 billion barrels to recoverable
Supply- and the global prospects could be
almost 500 billion barrels- but where, and
when?
• Going Global: Predicting the Next Tight Oil
Revolution will help companies screen and
indentify opportunities in regions outside North
America.
* Source: IHS CERA North America Tight Oil Multiclient Study
North America Tight Oil Play Areas
5

Going Global: Predicting the Next Tight Oil Revolution
North American Supply
North America’s Tight Oil Revolution will go global—Why?
– Tight Oil Supply Outlook confirms 40 billion barrels of recoverable oil by 2035
– U.S. and Canada will ramp up to and sustain an increase of 4.5 million barrels of
oil/condensate per day between 2018 and 2033
– Recoverable dry gas associated with Tight Oil plays is about 270 TCF
– Recoverable NGLs will increase to 4 million barrels per day by 2021 and exceed 5
million by 2035—a recoverable total of 36 billion barrels
– Total hydrocarbons production could be 9 million barrels per day by the end of the
decade
Implications:
– U.S Oil demand is about 18 million barrels per day with current imports at 8.8 million
per day—i.e. 48 percent of demand. Tight Oil almost cuts the imports in half!
– Add Canadian oil sands production to current U.S. imports from Canada and North
America becomes energy self sufficient
– Global rebalance of supply, investment and economies.
– Inspires tight oil exploitation worldwide—BUT where is the best potential?
Going Global: Predicting the Next Tight Oil Revolution
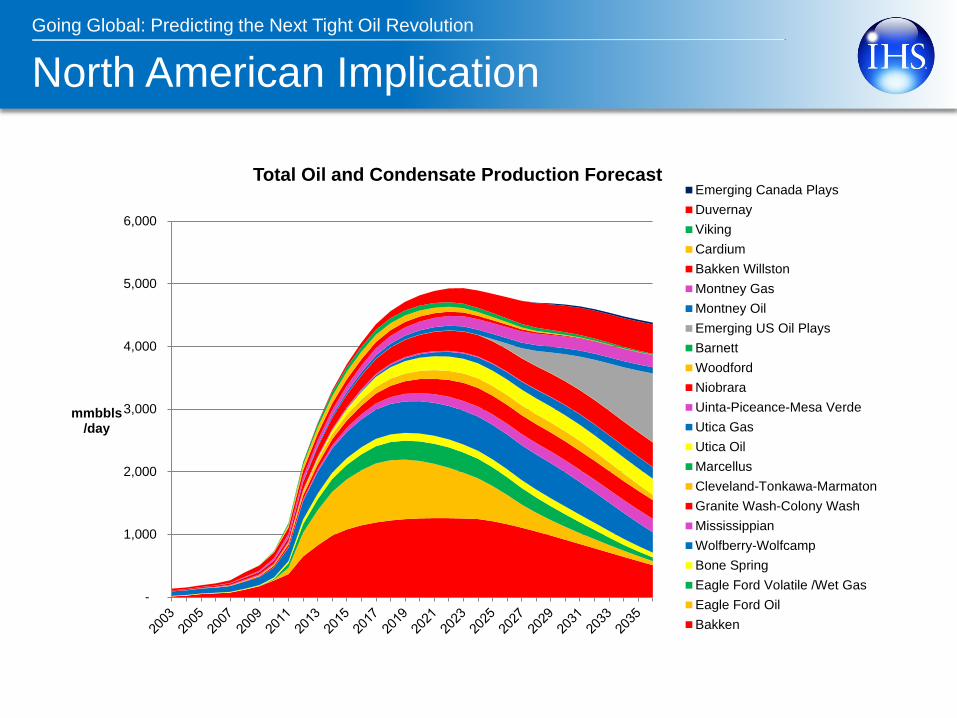
North American Implication
-
1,000
2,000
3,000
4,000
5,000
6,000
mmbbls /day
Total Oil and Condensate Production Forecast Emerging Canada Plays
Duvernay
Viking
Cardium
Bakken Willston
Montney Gas
Montney Oil
Emerging US Oil Plays
Barnett
Woodford
Niobrara
Uinta-Piceance-Mesa Verde
Utica Gas
Utica Oil
Marcellus
Cleveland-Tonkawa-Marmaton
Granite Wash-Colony Wash
Mississippian
Wolfberry-Wolfcamp
Bone Spring
Eagle Ford Volatile /Wet Gas
Eagle Ford Oil
Bakken
Going Global: Predicting the Next Tight Oil Revolution
Going Global: Predicting the Next
Tight Oil Revolution
A screening study

Going Global: Predicting the Next Tight Oil Revolution
Study Scope
The Study will provide members with a toolkit to
screen and prioritize possible Tight Oil plays. The
Study will also provide a more detailed analysis of
a smaller set of high ranking opportunities.
Study members will be able to:
– Identify potential tight oil areas and
analyze key parameters
– Understand main geological risks
for key areas
– View general information about above-
ground issues related to tight oil
– Assessment of commercial
characteristics of top opportunities
9
PHASE 3: OPPORTUNITY ANALYSIS
For top ranking opportunities
General play information
Distribution maps
Commercial characteristics and key above ground
parameters and risks
PHASE 2: OPPORTUNITY RISKING AND RANKING
Rank opportunities based parameters established in
conjunction with members
PHASE 1: GLOBAL SCREENING
Identify major potential tight oil plays outside
North America
Collection of key data per tight oil opportunity

Going Global: Predicting the Next Tight Oil Revolution
Geographic Scope
10
South America
14 play areas
Africa
15 play areas
Europe
27 play areas
CIS
13 play areas
South Asia
20 play areas
North Asia
26 play areas
Australasia
17 play areas

Going Global: Predicting the Next Tight Oil Revolution
General Statistics
• Total of 95 shale oil and 53 tight reservoirs plays analyzed
11
Number of Tight Reservoir Plays by Lithology
Carbonate
Mudstone
Sand/siltstone
Conglomerate
Granite

Going Global: Predicting the Next Tight Oil Revolution
Depositional Environments
Alluvial-fluvial
Lacustrine
Lacustrine-fluvial
Fluvial Delta Plain
Transition Zone
Restricted Marine
Shallow Marine
Open Marine
Deep Marine
Going Global: Predicting the Next Tight Oil Revolution
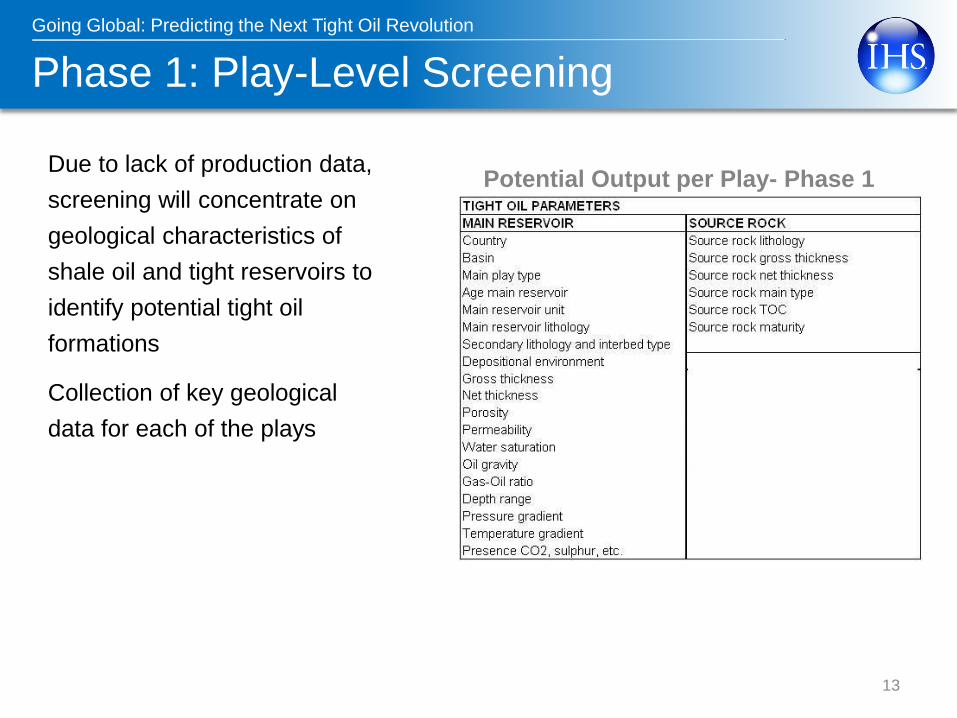
Phase 1: Play-Level Screening
Due to lack of production data,
screening will concentrate on
geological characteristics of
shale oil and tight reservoirs to
identify potential tight oil
formations
Collection of key geological
data for each of the plays
13
Potential Output per Play- Phase 1
Going Global: Predicting the Next Tight Oil Revolution
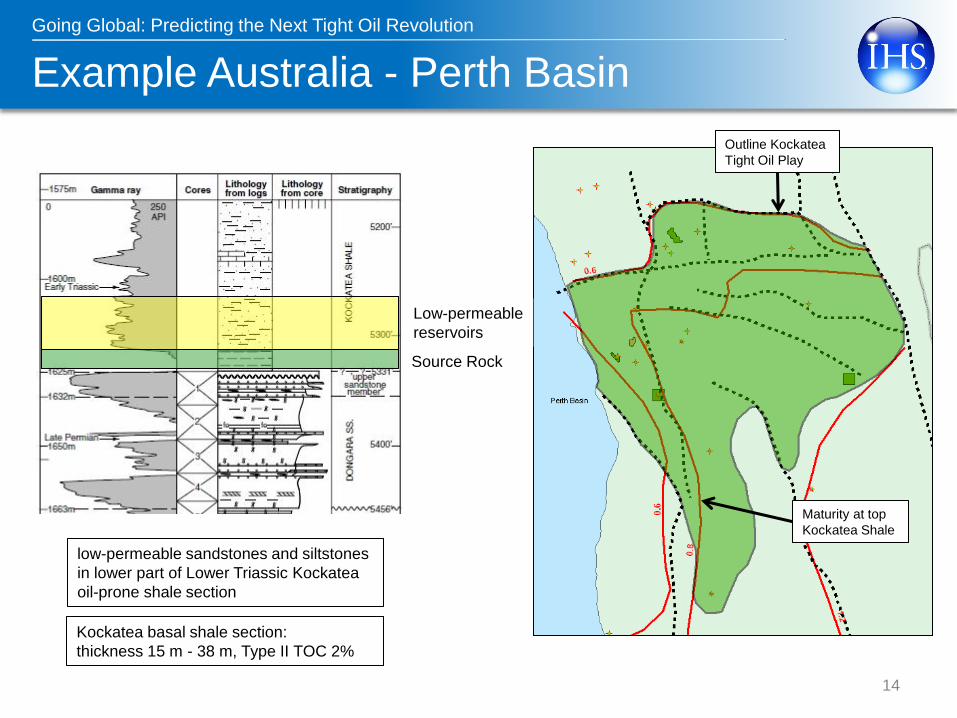
Example Australia - Perth Basin
14
Maturity at top
Kockatea Shale
Outline Kockatea
Tight Oil Play
low-permeable sandstones and siltstones
in lower part of Lower Triassic Kockatea
oil-prone shale section
Kockatea basal shale section:
thickness 15 m - 38 m, Type II TOC 2%
Source Rock
Low-permeable
reservoirs
Going Global: Predicting the Next Tight Oil Revolution
Phase 2 and 3
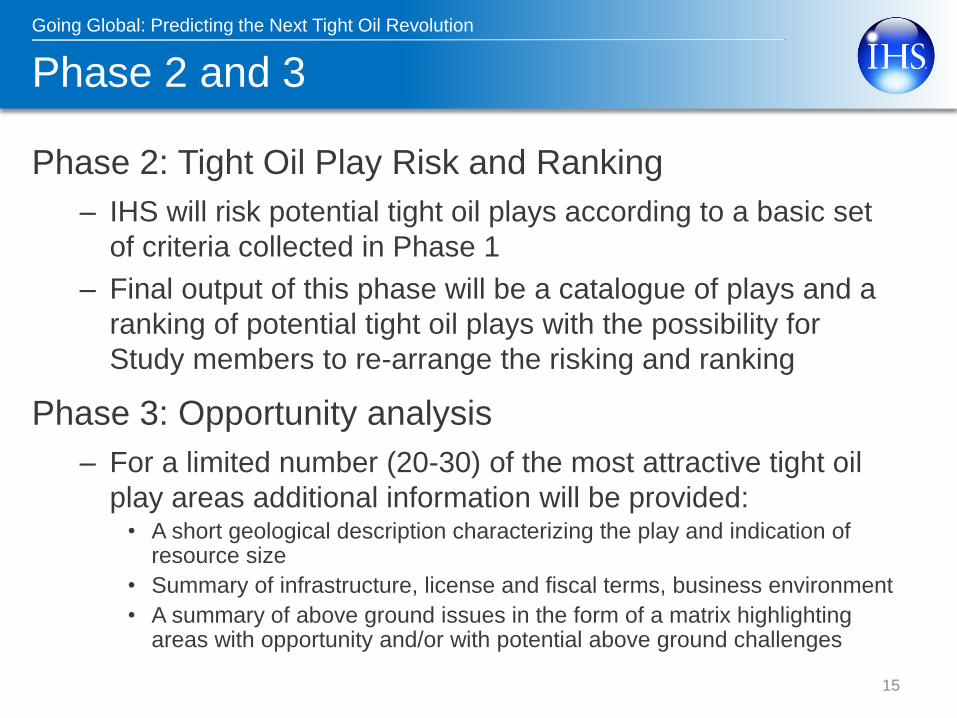
Phase 2: Tight Oil Play Risk and Ranking
– IHS will risk potential tight oil plays according to a basic set
of criteria collected in Phase 1
– Final output of this phase will be a catalogue of plays and a
ranking of potential tight oil plays with the possibility for
Study members to re-arrange the risking and ranking
Phase 3: Opportunity analysis
– For a limited number (20-30) of the most attractive tight oil
play areas additional information will be provided: • A short geological description characterizing the play and indication of
resource size
• Summary of infrastructure, license and fiscal terms, business environment
• A summary of above ground issues in the form of a matrix highlighting areas with opportunity and/or with potential above ground challenges
15
Going Global: Predicting the Next Tight Oil Revolution
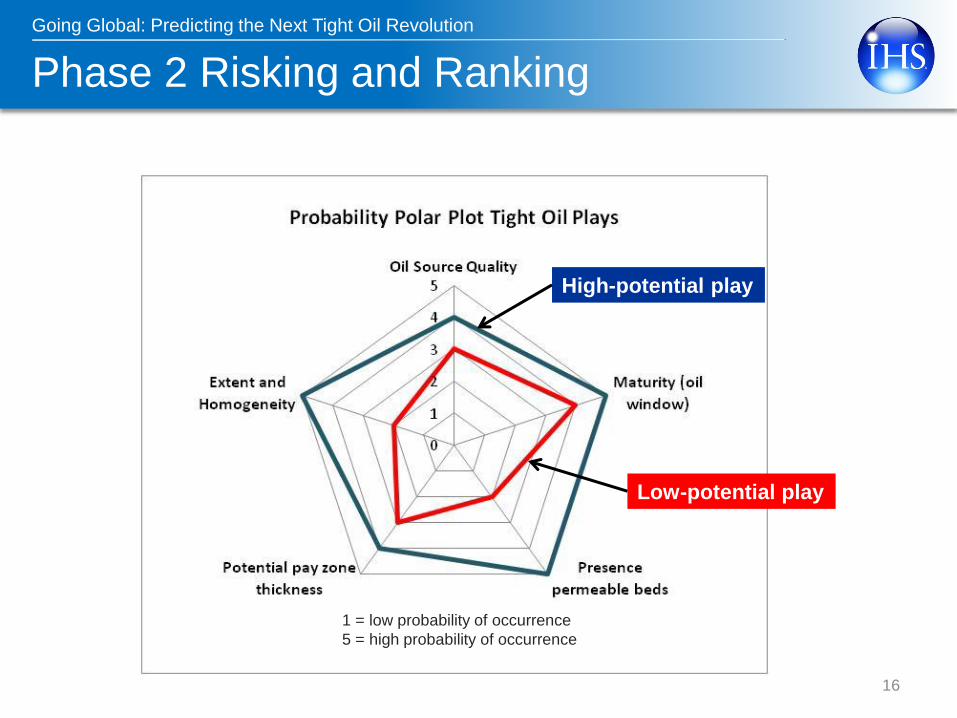
Phase 2 Risking and Ranking
16
1 = low probability of occurrence
5 = high probability of occurrence
Low-potential play
High-potential play
Going Global: Predicting the Next Tight Oil Revolution
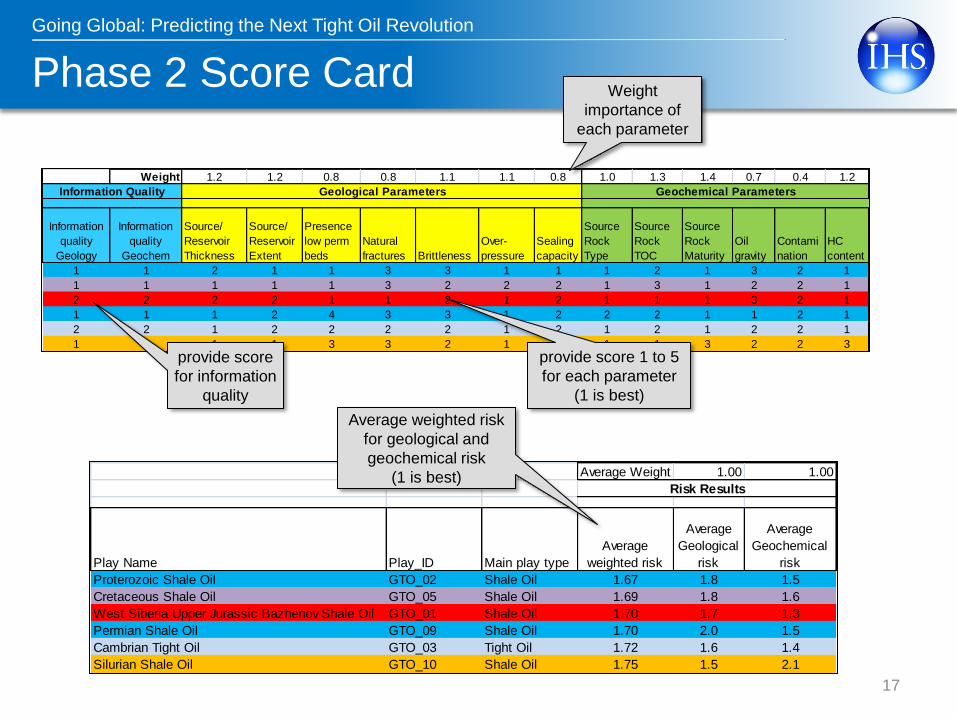
Phase 2 Score Card
17
Weight 1.2 1.2 0.8 0.8 1.1 1.1 0.8 1.0 1.3 1.4 0.7 0.4 1.2
Information
quality
Geology
Information
quality
Geochem
Source/
Reservoir
Thickness
Source/
Reservoir
Extent
Presence
low perm
beds
Natural
fractures Brittleness
Over-
pressure
Sealing
capacity
Source
Rock
Type
Source
Rock
TOC
Source
Rock
Maturity
Oil
gravity
Contami
nation
HC
content
1 1 2 1 1 3 3 1 1 1 2 1 3 2 1
1 1 1 1 1 3 2 2 2 1 3 1 2 2 1
2 2 2 2 1 1 2 1 2 1 1 1 3 2 1
1 1 1 2 4 3 3 1 2 2 2 1 1 2 1
2 2 1 2 2 2 2 1 2 1 2 1 2 2 1
1 1 1 1 3 3 2 1 1 1 1 3 2 2 3
Geological Parameters Geochemical ParametersInformation Quality
provide score 1 to 5
for each parameter
(1 is best)
provide score
for information
quality
Weight
importance of
each parameter
Average Weight 1.00 1.00
Play Name Play_ID Main play type
Average
weighted risk
Average
Geological
risk
Average
Geochemical
risk
Proterozoic Shale Oil GTO_02 Shale Oil 1.67 1.8 1.5
Cretaceous Shale Oil GTO_05 Shale Oil 1.69 1.8 1.6
West Siberia Upper Jurassic Bazhenov Shale Oil GTO_01 Shale Oil 1.70 1.7 1.3
Permian Shale Oil GTO_09 Shale Oil 1.70 2.0 1.5
Cambrian Tight Oil GTO_03 Tight Oil 1.72 1.6 1.4
Silurian Shale Oil GTO_10 Shale Oil 1.75 1.5 2.1
Risk Results
Average weighted risk
for geological and
geochemical risk
(1 is best)

Going Global: Predicting the Next Tight Oil Revolution
Detailed description: example Ordos, China
18
Play description:
• lithological variation, fractures, brittleness
• source potential, oil quality, GOR
• pressure regime

Going Global: Predicting the Next Tight Oil Revolution
Policy/ Public
opinion Land Access
Business
Terms Supply Chain
Downstream
Infrastructure
Water
Availability
and
Management
Other
Regulatory
Play 1
Play 2
Play 3
Play 4
Play 5
Play 6
Play 7
Play 8
Phase 3 Evaluation of Opportunities
Example of a scorecard to characterize, assess and rank unconventional gas
exploration regions. This will be adapted to score a set of criteria specific to
international tight oil opportunities.
19

Going Global: Predicting the Next Tight Oil Revolution
Study Timeline
PLAY-LEVEL SCREENING RISKING
AND RANKING OPPORTUNITY ANALYSIS
20
October November December January February March April May
2012 2013
Kick-off webinar Mid-project webinar Final workshop Final report
• Overview methodology
• Overview of key map
areas
• Present key data
parameters
• Short report describing the
first results of analysis and
risk analysis
• List of potential 20-30 tight oil
play areas to be analyzed in
more detailed in Phase 3
• Short description of the top
tight oil plays (20-30):
• General play
information
• Distribution maps
• Geological risk analysis
• Commercial
characteristics
• Overview of above ground
issues for selected key areas

Going Global: Predicting the Next Tight Oil Revolution
For more information about this presentation or IHS CERA in general,
please contact Roberto Futuro +33 1 7676 0092
Beijing San Francisco
Washington, DC
Cambridge, MA
Calgary
Mexico City
Rio de Janeiro
Paris
Oslo Moscow
Dubai
Singapore
Bangkok
Tokyo
Houston
Denver
London
Geneva
21
For technical questions, please contact [email protected] or [email protected]
Top Related
Copyright © 2022 FDOKUMEN

