


Bahasa
Halaman
Hukum

sustainability
Article
Expert Views on the Future Development of Biogas BusinessBranch in Germany, the Netherlands, and Finland until 2030
Erika Winquist 1,*, Michiel Van Galen 2, Simon Zielonka 3 , Pasi Rikkonen 1 , Diti Oudendag 2, Lijun Zhou 3
and Auke Greijdanus 2
�����������������
Citation: Winquist, E.; Van Galen, M.;
Zielonka, S.; Rikkonen, P.; Oudendag,
D.; Zhou, L.; Greijdanus, A. Expert
Views on the Future Development of
Biogas Business Branch in Germany,
The Netherlands, and Finland Until
2030. Sustainability 2021, 13, 1148.
https://doi.org/10.3390/su13031148
Academic Editor:
Alberto-Jesus Perea-Moreno
Received: 31 December 2020
Accepted: 20 January 2021
Published: 22 January 2021
Publisher’s Note: MDPI stays neutral
with regard to jurisdictional claims in
published maps and institutional affil-
iations.
Copyright: © 2021 by the authors.
Licensee MDPI, Basel, Switzerland.
This article is an open access article
distributed under the terms and
conditions of the Creative Commons
Attribution (CC BY) license (https://
creativecommons.org/licenses/by/
4.0/).
1 Natural Resources Institute Finland (Luke), P.O. Box 2, 00791 Helsinki, Finland; [email protected] Wageningen Economic Research, Wageningen University & Research, Prinses Beatrixlaan 582-528,
Postbus 29703, 2502 LS Den Haag, The Netherlands; [email protected] (M.V.G.);[email protected] (D.O.); [email protected] (A.G.)
3 State Institute of Agricultural Engineering and Bioenergy, University of Hohenheim, 70599 Stuttgart,Germany; [email protected] (S.Z.); [email protected] (L.Z.)
* Correspondence: [email protected]
Abstract: To be able to meet the European Union’s energy and climate targets for 2030, all memberstates need to rethink their energy production and use. One potential renewable energy source isbiogas. Its role has been relatively small compared to other energy sources, but it could have a morecentral role to solve some specific challenges, e.g., to reduce carbon dioxide (CO2) emissions fromtraffic, or to act as a buffer to balance electricity production with consumption. This research analyseshow the future of the biogas business in three case study countries is developing until 2030. The studyis based on experts’ views within the biogas business branch in Germany, The Netherlands, andFinland. Both similarities and differences were found among the experts’ answers, which reflectedalso the current policies in different countries. The role of biogas was seen much wider than justto provide renewable energy, but also to decrease emissions from agriculture and close loops in acircular economy. However, the future of the biogas branch is much dependent on political decisions.To be able to show the full potential of biogas technology for society, stable and predictable energypolicy and cross-sector co-operation are needed.
Keywords: expert survey; renewable energy; biogas; biomethane; biogas plant; business model;political support system
1. Introduction
Renewable energy production is growing fast in the European Union (EU) and globally.In the first half of 2020, renewable electricity generation in the EU exceeded fossil fuelgeneration for the first time ever. This was partly due to the 7% fall in electricity demandbecause of the coronavirus (COVID-19) pandemic. However, especially the electricitygeneration using wind and solar energy has grown over a longer time period, from 13% oftotal electricity generation in 2016 to 21% in the first half of 2020 [1].
The development is most welcomed because the EU aims to be carbon neutral by2050 [2]. Recently, even China announced to have CO2 emissions peak before 2030 andachieve carbon neutrality before 2060 [3]. China’s commitment is crucial when mitigatingclimate change as it is responsible for around 28% of global emissions. Finnish emissionsmight be less important globally, but the goal is even more ambitious; Finland aims toachieve carbon neutrality by 2035 [4].
Individual EU member countries have varying targets for the share of sustainableenergy sources and various ways of achieving their renewable energy targets. Replacingfossil fuels with renewable energy sources is, however, much more than just switching thefossil raw materials to renewable ones. Unlike many renewables, fossil fuels are flexibleto use in versatile applications and easy to store. Thus, the whole energy system needs
Sustainability 2021, 13, 1148. https://doi.org/10.3390/su13031148 https://www.mdpi.com/journal/sustainability

Sustainability 2021, 13, 1148 2 of 20
to be built again on a renewable basis [5]. Instead of few large energy sources, severalenergy sources are integrated in the renewable system [6]. Moreover, instead of centralisedsolutions, the energy is produced locally [7].
The new renewable energy system must tackle several problems—how to balanceelectricity production with consumption, how to arrange the energy needed for traffic, andhow to ensure local energy security and affordability. Biogas could provide solutions toeach of these questions, although not alone because biomass resources are limited. In addi-tion to biogas and biomethane obtained by upgrading biogas, corresponding renewablealternatives to natural gas can be produced by power-to-gas from hydrogen produced withrenewable electricity and CO2 captured from industrial processes, and synthetic naturalgas (SNG) from biomass gasification [8]. These can both increase the production potentialof biomethane and use the same existing infrastructure as natural gas.
The German energy transition (Energiewende) was the first attempt to transform acentralised fossil-based energy system into a local renewable-based system. The generousfeed-in tariffs (FiT) enabled renewable electricity production, especially from biogas. Today,Germany is the world leader, with 9527 biogas plants by the end of 2019 [9] and a 13.0%share of biogas/biomethane in renewables-based electricity generation [10]. However, bychanging the FiTs to a tendering based system, the current subsidy system favors windand solar over biogas and large production facilities over small ones [11]. To be able tomaintain the production, the biogas plants need to find cost savings, improvements inenergy efficiency, and new business models.
This research focusses on the biogas business and its prospects toward 2030. Based onexperts’ views in the biogas and energy branch in Germany, The Netherlands, and Finland,this research analyses how the future of the biogas business in three case study countries isdeveloping until 2030. By using an expert survey method, expert views of the future areused to map the probable and desirable future views.
The research questions are the following:
• How is the business environment of the renewable energy production evolving until2030 in the case study countries and the EU?
• How do experts see the probable and desirable future paths of the use of biogas andits role in the energy transition towards renewable energy?
• Which income sources will be more significant in the future for the biogas businessbranch?
2. Background
Biogas is a mixture of methane (50–70%) and carbon dioxide (30–50%), whereas naturalgas is almost pure methane (CH4). However, also biogas can be upgraded to biomethane(>92% CH4). Biogas is formed when micro-organisms degrade organic compounds inanaerobic conditions and the process is called anaerobic digestion (AD). Biogas is stillcollected from old landfill areas, but thanks to the Landfill Directive (1999/31/EC), whichobliges the member states to reduce the amount of biodegradable municipal waste that theylandfill to 35% of 1995 levels by 2016, the volumes are decreasing. On the contrary, biogasproduction in reactor plants is increasing. Suitable raw materials are municipal sewagesludge and biowaste, side streams from the food and paper processing industries, as well asfrom agriculture such as manure, grass, straw, and other crop residues. Biogas can be usedfor the production of heat, combined heat and power (CHP), and upgraded to biomethane,which can be used as traffic fuel or to replace natural gas in various applications.
2.1. Overview of Current Biogas Production in Europe
The biogas production in the European Union represents roughly half of the globalbiogas production [12]. The relative importance of biogas in the EU is mainly thanksto Germany which represents half of the EU production. Germany was one of the firstEuropean countries to implement a subsidy for renewable electricity and biogas production.Already in 1991, the Electricity Feed-In Law was introduced, and in 2000, the Renewable

Sustainability 2021, 13, 1148 3 of 20
Energy Sources Act (EEG, or Erneuerbare Energien Gesetz). The EEG had several updates(2004, 2009, 2012, and 2014) before, in 2017, the basis for its support changed fundamentallyto an auction model with lower maximum achievable tariffs. In addition, due to the strongposition of Germany in the European biogas production, the political changes in Germanyreflects the whole EU level.
The change in subsidy levels can be seen also in the biogas production developmentin Germany (Figure 1). Until 2015, there was strong growth, but after that, the productionhas stayed at the same level. The biomethane production data was not easily available.Thus, the biomethane addition to the natural gas network (or use as traffic fuel in thecase of Finland) has been used as an indicator of the development of the biomethanemarket (Figure 1). Biomethane addition to the gas grid decreased somewhat in Germany in2017. However, according to the EBA report published in 2020 [13], five new biomethaneupgrading plants were built in 2018, which would indicate that the interest in biomethaneupgrading is still increasing.
In The Netherlands, biogas production has continued the slow growth, whereasbiomethane addition to the natural gas network is growing fast (Figure 1). In Finland, therewas a stepwise growth in biogas production in 2017, but after that year, the production hasstayed at the same level. In 2016, the state-owned Gasum Ltd. entered the market, buyingtwo companies with seven biogas plants and becoming the largest biogas producer inFinland [14]. The same year, Gasum also built one additional larger biogas plant and startedbiogas upgrading to biomethane, as well as expanding the gas filling station network. Theuse of biomethane as traffic fuel has continued growing after that (Figure 1).
Sustainability 2021, 13, x FOR PEER REVIEW 3 of 20
Germany which represents half of the EU production. Germany was one of the first Euro-pean countries to implement a subsidy for renewable electricity and biogas production. Already in 1991, the Electricity Feed-In Law was introduced, and in 2000, the Renewable Energy Sources Act (EEG, or Erneuerbare Energien Gesetz). The EEG had several updates (2004, 2009, 2012, and 2014) before, in 2017, the basis for its support changed fundamen-tally to an auction model with lower maximum achievable tariffs. In addition, due to the strong position of Germany in the European biogas production, the political changes in Germany reflects the whole EU level.
The change in subsidy levels can be seen also in the biogas production development in Germany (Figure 1). Until 2015, there was strong growth, but after that, the production has stayed at the same level. The biomethane production data was not easily available. Thus, the biomethane addition to the natural gas network (or use as traffic fuel in the case of Finland) has been used as an indicator of the development of the biomethane market (Figure 1). Biomethane addition to the gas grid decreased somewhat in Germany in 2017. However, according to the EBA report published in 2020 [13], five new biomethane up-grading plants were built in 2018, which would indicate that the interest in biomethane upgrading is still increasing.
In The Netherlands, biogas production has continued the slow growth, whereas bio-methane addition to the natural gas network is growing fast (Figure 1). In Finland, there was a stepwise growth in biogas production in 2017, but after that year, the production has stayed at the same level. In 2016, the state-owned Gasum Ltd. entered the market, buying two companies with seven biogas plants and becoming the largest biogas pro-ducer in Finland [14]. The same year, Gasum also built one additional larger biogas plant and started biogas upgrading to biomethane, as well as expanding the gas filling station network. The use of biomethane as traffic fuel has continued growing after that (Figure 1).
Figure 1. Primary axis: production of electricity and heat from biogas (Germany) [15,16]/biogas production excl. flaring (The Netherlands, Finland) [17,18]; secondary axis: addition of biomethane to the natural gas grid (Germany, The Nether-lands) [19–21]/use of biomethane as traffic fuel (Finland) [22].
Biogas consumption and production potential in the case study countries can be es-timated both with the natural gas consumption, which describes the existing infrastruc-ture also available for biomethane use, and the availability of agricultural biomasses, which provide the largest raw material reserve for biogas production. In all case study countries, the estimated biogas production represents only a fraction of the natural gas consumption (Table 1). Especially in The Netherlands, natural gas consumption is at a high level compared to the population. However, because of safety reasons for the inhab-itants of the province of Groningen, where the production of natural gas has caused earth-quakes, the aim is to phase out natural gas until 2050 [23]. The focus in gas transition is on energy savings, replacing natural gas with biomethane or hydrogen gas, producing heat with other renewable energy options, and using natural gas only as feedstock for the chemical industry [24].
Although Finland has nearly the same total area as Germany, the cultivated area in Finland is at the same level as in The Netherlands (Table 1). The cultivated area correlates
Figure 1. Primary axis: production of electricity and heat from biogas (Germany) [15,16]/biogas production excl. flar-ing (The Netherlands, Finland) [17,18]; secondary axis: addition of biomethane to the natural gas grid (Germany, TheNetherlands) [19–21]/use of biomethane as traffic fuel (Finland) [22].
Biogas consumption and production potential in the case study countries can be esti-mated both with the natural gas consumption, which describes the existing infrastructurealso available for biomethane use, and the availability of agricultural biomasses, whichprovide the largest raw material reserve for biogas production. In all case study countries,the estimated biogas production represents only a fraction of the natural gas consump-tion (Table 1). Especially in The Netherlands, natural gas consumption is at a high levelcompared to the population. However, because of safety reasons for the inhabitants of theprovince of Groningen, where the production of natural gas has caused earthquakes, theaim is to phase out natural gas until 2050 [23]. The focus in gas transition is on energysavings, replacing natural gas with biomethane or hydrogen gas, producing heat withother renewable energy options, and using natural gas only as feedstock for the chemicalindustry [24].
Although Finland has nearly the same total area as Germany, the cultivated area inFinland is at the same level as in The Netherlands (Table 1). The cultivated area correlateswith the availability of energy crops for biogas production but also with side streams fromother crop production such as grass cultivated as green manure, catch and cover crops,straw, and crop residues. Despite the rather limited cultivated area in The Netherlands, thenumber of livestock is high, and thus the estimated biomethane potential in the collectablemanure is almost half of that in Germany (Table 1). If only manure biomethane potential

Sustainability 2021, 13, 1148 4 of 20
is considered, both The Netherlands and Finland could double their current biogas pro-duction. Only in Germany, manure biomethane potential is (22,130 GWh) just half of thecurrent production (48,747 GWh) (Table 1) [25].
Energy crops covered nearly half of the biogas raw material supply in Germany in2018. Almost the same share is covered by agricultural residues (including manure), andonly some biowaste/municipal waste (i.e., organic fraction of municipal solid waste) andindustrial side streams (food and drink) are used [13]. Previously, the share of energy crops,particularly maize, has been even larger in Germany, but the utilisation of maize silage andcorn has now been limited since the EEG 2017. Initially, from the beginning of 2017, maizewas limited to a maximum of 50% for the mass-based substrate input, then later to 47% in2019–2020 and further to 44% in 2021–2022 [26].
In The Netherlands, when the landfill plants are excluded, the produced biogas origi-nates from biowaste/municipal waste (ca. 40%), co-digestion of agricultural/municipal/industrial side streams (ca. 40%), and sewage sludge (ca. 20%) [27]. In Finland, biogasproduction relies strongly on biowaste/municipal waste (ca. 90%), the rest being sewagesludge (ca. 5%) and agricultural residues (ca. 5%) [13].
Table 1. Summary table of case study countries (data from 2019 unless reported otherwise).
Germany The Netherlands Finland Ref.
Population (106) 83.0 17.3 5.5Biogas production excl. flaring (GWh) 48,747 a 4210 740 [10,17,18]
Biogas production per capita (kWh) 587 a 243 135 [10,17,18]Biomethane production (GWh) b 10,292 1574 105 [13]
Biomethane production per capita (kWh) b 124 91 19 [13]Natural gas consumption (GWh) 887,000 368,000 20,360 [21,28]
Total area (103 km2) 357 42 338Cultivated area (103 km2) 185 18 23
Collectable manure (106 t) c 133 52 8 [25]Realistic manure biomethane potential (GWh) c 22,130 9620 1250 [25]
a elec. + heat + vehicle fuel, excl. efficiency losses, b data from 2018, c data from 2013 (1 Nm3 CH4 = 10 kWh).
2.2. EU Level Directives and Goals
The aim of the original Renewable Energy Directive (2009/28/EC) was to promoterenewable energy production in the EU, mitigate climate change, and increase the shareof local energy production vs. imported fossil energy sources. The Renewable EnergyDirective was revised in December 2018 (RED II) to better meet the emission reduction com-mitments under the Paris Agreement (December 2015) and to move the legal framework to2030 [29]. Special emphasis in the revision is on the sustainability criteria for bioenergy,which will also include biomass and biogas for heating, cooling, and electricity generation.This will further steer the development from first-generation biofuels, where raw materialsor land use is competing with food production, to second-generation biofuels exploitingvarious side streams and lignocellulosic raw materials.
Highlights of Revised Renewable Energy Directive (2018/2001/EU) [29] include thefollowing:
- renewables should be 32% of the final energy consumption by 2030;- national energy and climate plans (NECPs) for 2021–2030 (submitted to the European
Commission by the end of 2019);- renewable sources should account for 14% of transport fuels by 2030;- strengthened sustainability criteria for bioenergy (including biomass and biogas for
heating, cooling, and electricity generation);- enabling self-production and -consumption of renewable energy;- the original renewable energy directive will be replaced by 30 June 2021.
To meet the EU’s energy and climate targets for 2030, EU member states need toestablish a 10-year integrated national energy and climate plan (NECP) for the period

Sustainability 2021, 13, 1148 5 of 20
from 2021 to 2030. However, member states can decide the structure and scope of theirplans individually. Some member states (e.g., Finland and France) brought up the role ofbiogas and biomethane, whereas others hardly mentioned it at all (e.g., Germany and TheNetherlands) [13].
The next step in the EU’s climate goals is carbon-neutrality by 2050, which is one ofthe targets in the European Green Deal initiative. The initiative includes all sectors of theeconomy and requires even higher greenhouse gas (GHG) emission reductions for 2030than the RED II. Moreover, a European climate law was proposed in March 2020 to ensureto reach these goals [2]. In addition, to boost renewable energy and energy efficiency, theEuropean Green Deal also contains the ‘Circular Economy Action Plan’ for sustainableindustry and the ‘Farm to Fork Strategy’ for sustainable agriculture. Both initiatives opennew possibilities for biogas, which provides renewable energy and the technology to usevarious side streams and cut emissions from agriculture.
Also linked to more sustainable agriculture, the European Regulation on FertilizingProducts (FPR) was approved in June 2019 [30]. The FPR recognises that fertilising productscan be made from organic materials such as compost and digestate, and it establishesharmonised requirements to make them available on the internal market [13].
Furthermore, the ‘Directive on the deployment of alternative fuels infrastructure’(2014/94/EU) was enforced in October 2014 [31]. The aim of this directive was to min-imise the oil dependence of transport and reduce the environmental effects of transportthroughout the EU. The national policy frameworks had to contain targets for alternativetransport fuels and their distribution infrastructure, including pressurised gas fuellingpoints for 2020 and 2030. Although the requirements may be fulfilled with natural gasalone, biomethane can also be used.
2.3. Governmental Support Systems and Goals2.3.1. Germany
In Germany, biogas production, as well as wind and solar electricity production, aresupported through the latest version of the Renewable Energy Sources Act (EEG 2017),where the support system was switched from the feed-in tariffs (FiT) to the auction model(pay-as-bid). The newly built biogas plants with an installed electrical capacity of morethan 150 kWel and already existing biogas plants can participate in auctions [26]. Powergeneration within the framework of the tender model of the EEG 2017 offers a financingpossibility, especially for very cost-effective plants, which typically means very large plants.So far, the amount of electricity put out to tender is far from being used. This shows howtough the conditions of the tender are for plant operators. However, small units (up to amaximum of 100 kW), as well as liquid manure plants (higher FiT) and waste plants (FiTdid not change), are still supported by a FiT support scheme [32]. The EEG Amendment2021, which will come into effect on 1 January 2021, is sticking to the basic principle ofmaking renewable power producers more market-oriented. Currently, the majority of thebiogas plants in Germany, depend on the FiT, get lower price for feeding electricity to thegrid than in their original EEG contract. The overall number of biogas plants is projectedto face decreasing in 2020 for the first time [9].
Germany’s Integrated National Energy and Climate Plan (NECP) contains the follow-ing goals to contribute to the achievement of the EU energy targets in 2030: (1) increasingenergy efficiency by reducing primary energy consumption by 30% by 2030 compared to2008, and (2) expansion of the share of renewable energies to 30% of gross final energyconsumption in 2030. In addition, the NECP confirms the national GHG emission reductiontarget for 2030 of at least 55% compared to 1990, and the commitment to pursue GHGneutrality as a long-term goal by 2050 [33,34]. Specific biogas-related targets included inNECP are (1) 30% manure digestion by 2025 and (2) gas-tight storage of manure on up to70% of biogas plants [35].
Sustainability 2021, 13, 1148 6 of 20
2.3.2. The Netherlands
The main support instrument for biogas and biomethane in The Netherlands is cur-rently the so-called SDE++ regulation (Stimulering duurzame energieproductie en klimaat-transitie), which has replaced a former regulation SDE+ that was active between 2013and 2020. Both regulations, in addition to the earlier SDE regulation from 2008, intentto stimulate the production of renewable energy from all kinds of sources. The maindifference in the new SDE++ regulation is that it is also applicable to projects that aim toreduce CO2-emissions by, e.g., carbon capture or the use of excess heat from other sources.
The regulation in 2020 opens in four phases with an increased maximum amount ofsubsidy per reduced ton of CO2. The subsidy compensates for the difference between theproduction costs of the renewable energy or CO2 reduction technique and the market pricesof the competing non-renewable energy (FiT of the non-profitable portion of productioncosts) for 12 to 15 years. The tariffs are guaranteed minimum income, which means thatthe scheme only pays out if energy prices are lower than the prices in the FiT for a certaincategory [26].
In The Netherlands, one type of tax allowance is currently relevant for renewableenergy production from biomass—the ODE tax (Opslag Duurzame Energie- en Klimaat-transitie), i.e., the surcharge for sustainable energy and climate transition paid on electricityand natural gas. Energy Investment Allowance (EIA scheme) is also available for eligiblebiogas installations in The Netherlands [13]. The SDE++ subsidy, however, cannot be usedin combination with investment support due to EU restrictions on state support.
The biogas policies in The Netherlands are relatively stable in the sense that subsi-dies for biogas plants have continued in the so-called SDE regulation, now called SDE++.But there has been a significant shift in focus on agricultural biogas installations fromco-fermentation of manure towards mono-fermentation of manure. The agricultural bio-gas production has grown considerably until 2011, but since then, the number of co-fermentation plants decreased. In 2019, there were 89 installations left [17]. The decreasein co-fermentation projects was due to high costs of coproducts and low electricity pricesresulting from competition from solar and wind energy. In addition, government subsidiesfor co-fermentation have somewhat decreased, while projects that produce biomethaneare stimulated. Mono-fermentation is less demanding in terms of management becauseno off-farm inputs have to be bought. Furthermore, new mono-fermentation installationshave been developed and implemented that better suit the different scales of farms. InThe Netherlands, a large dairy cooperative, FrieslandCampina, has been the driving forcebehind mono-fermentation at farm scale in the so-called Jumpstart-program. In 2020, therewas considerable enthusiasm among dairy farmers to participate in the mono-fermentationproject. One of the aspects of the approach is for farmers to lease the installation from thecooperative instead of having to entirely buy it themselves. In recent years, therefore, ashift can be observed from co-fermentation to mono-fermentation of manure on farms.
The target for 2030 in the Climate Agreement is to replace 70 PJ (19 TWh) of natural gasused by households and industry with 2 billion m3 green gas. A roadmap for green gas wasinitiated in 2019. However, considering the current production, this will only be possible bydeveloping several big gasification and digestion plants in the future [26]. In the roadmap,the Dutch government acknowledges that gas will play a role in the future energy supply.The roadmap predicts that 30–50% of the final demand for energy will consist of gas, eitherin the form of methane or hydrogen gas. A major driver for developing green gas is thatthe Dutch government has committed to decreasing the role of natural gas. In the DutchClimate Agreement, the government, businesses, and societal organizations have agreed todisconnect all houses in The Netherlands from the natural gas grid by 2050 [23].
2.3.3. Finland
As in Germany, the FiTs for renewable energy were replaced with a premium systemfrom the beginning of 2019. The new system is technologically neutral, and those renewableenergy plants that offer electricity at the lowest premiums will be accepted into the system.

Sustainability 2021, 13, 1148 7 of 20
No biogas projects were proposed to the authorities in the auction in 2018 (1.4 TWh intotal), and all projects that were accepted into the premium program use wind power [36].New auctions have not been announced.
Biogas production is currently supported through two separate investment subsidyprograms—one for industrial and another for agricultural plants. The investment supportfor large-scale industrial plants is paid by the Ministry of Employment and Economy. Amaximum of 30% of the acceptable investment costs is covered.
The investment support for agricultural plants is paid from the EU Rural DevelopmentProgramme 2014–2020 by the Ministry of Agriculture and Forestry. Farm-scale plants,which mainly use the energy themselves and do not sell any energy other than electricityoutside the farm, are eligible for an investment subsidy of up to 40% of the acceptableinvestment costs. It is also possible to get the investment subsidy when most of the energyis sold outside the farm, or the farm sells traffic fuel. However, a separate company mustbe founded for this purpose. The agricultural company can then get an investment subsidyof up to 30% of the investment costs.
In addition, to support biogas production, the use of biomethane as traffic fuel has beenexempted from fuel tax. However, the taxation of biomethane as traffic fuel is currentlyunder discussion. The taxation would allow using the biofuel-blending obligation forbiomethane in traffic gas, i.e., the natural gas that is sold as traffic gas would contain acertain amount of biomethane. On the other hand, the farms selling only biomethane couldnot benefit from this, but instead, the demand could decline as the price increases. Evenwithout tax, biomethane is ca. 20% more expensive than natural gas for the consumer.
Finland’s Integrated Energy and Climate Plan [4] has the following main targetsby 2030:
- to reduce GHG emissions in the non-emissions trading sector by 39% (compared to2005);
- renewable energy share of final energy consumption at least 51%;- renewable energy share of final energy consumption 30% in road transport.
In addition, the plan has the following directly or indirectly biogas-related targets:
- to phase out the use of coal for energy production with minor exceptions;- to decrease the domestic use of imported oil by 50%;- to make electricity and heat production nearly emissions-free while also considering
the perspectives of security of supply;- have a minimum of 250,000 electric and 50,000 gas-driven passenger cars on the roads.
Some of these targets were already set by the former government in 2015, such as tohave 50,000 gas-driven passenger cars by 2030 [37]. Another biogas-related target was toprocess 50% of all manure (e.g., in biogas production) by 2025 [38].
Regarding biofuels and biogas, these targets are still far away from the present situa-tion. In 2019, the share of biofuels in road transport was 11% [22], and there were about9400 gas-driven passenger cars in use, of which 3800 were newly registered (Traficom2020) [39]. Approximately 6% of manure is currently processed [40]. Both the Ministryof Economic Affairs and Employment and the Ministry of Agriculture and Forestry areworking with the implementation of the biogas-specific targets (Ministry of EconomicAffairs and Employment 2020) [41]. The use of biomethane as traffic fuel is hoped to beencouraged with blending obligation. On the other hand, the use of manure as raw materialfor biogas production is planned to have an additional support tool.
3. Materials and Methods
The research data were gathered through three separate surveys in three EU memberstates, namely, Finland, Germany, and The Netherlands. The questionnaire was firstprepared for the Finnish expert community. The survey design and content were plannedthrough a pre-interview round in 2017 [14].
Sustainability 2021, 13, 1148 8 of 20
The questionnaire was divided into two parts and several sections. Part I includedquestions related to the business environment of renewable energy production in generaland contained two sections, namely, (A) development of energy policy until 2030, and(B) development of business environment until 2030. Part II included biogas-specificquestions and contained four sections, namely, (A) increasing and/or decreasing factorsfor biogas production and use, (B) income development for centralised biogas plants, (C)income development for farm-scale biogas plants, and (D) significance and roles of biogastechnology in the future. The respondents were asked to evaluate statements from thepresent day to the year 2030 in mind. In Part I, only probable future was considered,whereas in Part II, both probable and desirable futures were included.
The range of responses used a seven-step Likert scale. Answers in Part I variedfrom totally disagree to totally agree (−3 = totally disagree, −2 = disagree, −1 = slightlydisagree, 0 = do not agree or disagree, 1 = slightly agree, 2 = agree, and 3 = totallyagree), and answers in Part II varied from decreases significantly to increases significantly(−3 = decreases significantly, −2 = decreases, −1 = decreases slightly, 0 = stays on thecurrent level, 1 = increases slightly, 2 = increases, and 3 = increases significantly). It wasalso possible to answer “I cannot say” or not to answer at all.
The link to the online questionnaire (Webropol) was sent by email to the chosenrespondents (in Finland in November 2018, in Germany in January 2020, and in TheNetherlands in June 2020), and the survey was open for about one month. The questionnairewas sent to biogas producers in farm-scale and industrial-scale plants, technology suppliers,consultants, researchers, and policymakers/administration in the biogas field. The ideawas to have an extensive and well-balanced expertise coverage within the biogas valuechain.
Reminders were sent to the respondents, and a total of 84 responses (Finland21 responses, Germany 41 responses, and Netherlands 22 responses) were received. Notall respondents answered all questions. Especially in Finland, only 11 respondents outof 21 answered also to biogas-specific questions in Part II. The reason for this was thatthe original Finnish survey was sent to a wider group of renewable energy experts whichwere not all specialists in the biogas field. In The Netherlands, 20 respondents out of 22 an-swered also to Part II, and in Germany, all respondents answered both parts of the survey.Moreover, not all respondents answering Part II also answered the questions related to thedesirable future. In Finland, 9 respondents, in The Netherlands, 18 respondents, and inGermany, 40 respondents answered all questions related to both the probable and desirablefuture in Part II. Even in addition to that, few individual questions were left unansweredby some respondents.
The respondents’ expertise was evaluated through background questions. In allcountries, the degree of education was asked. Most of the respondents had at least a higherprofessional education (HBO) or university degree (Germany 93%, The Netherlands 100%,and Finland 86%). In Germany and The Netherlands, the field of education was also asked.Most of the respondents had been studying technology or natural sciences (Germany 80%and The Netherlands 77%) and most of the remainder were studying economics.
In Germany and The Netherlands, experience in the biogas field in years and profes-sional background were also asked. In Germany, 51% of the respondents had less than10 years’ experience in the biogas field and 49% more than 10 years. In The Netherlands,32% of the respondents had less than 10 years’ experience and 68% more than 10 years.For professional background, the respondents could choose farm-scale biogas producer,industrial-scale biogas producer, biogas technology supplier, consultant, researcher, policy-maker/administration, or other. In Germany, many of the respondents were researchers(56%). In The Netherlands, a large group of respondents had identified themselves as‘other’ (32%). These are most likely people representing some biogas-related associationbecause the survey was sent to several associations. However, the respondents’ expertisecovered different parts of the biogas value chain well. Furthermore, the aim of an expert

Sustainability 2021, 13, 1148 9 of 20
survey was not to have a statistically representative sample, but rather to reach differenttypes of experts through theoretical sampling.
4. Results and Discussion4.1. Part I: Business Environment of the Renewable Energy Production
A stable and predictable energy policy would encourage companies to do new invest-ments accordingly and thus achieve the policy goals. However, most respondents in allthree countries did not see the energy policy to be stable and predictable in the probablefuture (Figure 2, IA1). German respondents were most pessimistic followed by Finns andDutch. This reflects the common problem with changing governments and fluctuatingpolitical decisions. Especially in Germany, fundamental changes were made to the EEG in2017, when fixed FiTs were replaced by tenders. Yet, the respondents agreed on stricterclimate policies and targets (IA2).
Sustainability 2021, 13, x FOR PEER REVIEW 9 of 20
(Germany 80% and The Netherlands 77%) and most of the remainder were studying eco-nomics.
In Germany and The Netherlands, experience in the biogas field in years and profes-sional background were also asked. In Germany, 51% of the respondents had less than 10 years’ experience in the biogas field and 49% more than 10 years. In The Netherlands, 32% of the respondents had less than 10 years’ experience and 68% more than 10 years. For professional background, the respondents could choose farm-scale biogas producer, in-dustrial-scale biogas producer, biogas technology supplier, consultant, researcher, policy-maker/administration, or other. In Germany, many of the respondents were researchers (56%). In The Netherlands, a large group of respondents had identified themselves as ‘other’ (32%). These are most likely people representing some biogas-related association because the survey was sent to several associations. However, the respondents’ expertise covered different parts of the biogas value chain well. Furthermore, the aim of an expert survey was not to have a statistically representative sample, but rather to reach different types of experts through theoretical sampling.
4. Results and Discussion 4.1. Part I: Business Environment of the Renewable Energy Production
A stable and predictable energy policy would encourage companies to do new in-vestments accordingly and thus achieve the policy goals. However, most respondents in all three countries did not see the energy policy to be stable and predictable in the proba-ble future (Figure 2, IA1). German respondents were most pessimistic followed by Finns and Dutch. This reflects the common problem with changing governments and fluctuat-ing political decisions. Especially in Germany, fundamental changes were made to the EEG in 2017, when fixed FiTs were replaced by tenders. Yet, the respondents agreed on stricter climate policies and targets (IA2).
Figure 2. Development of energy policy until 2030 (probable future). IA1. The energy policy will be stable and predictable; IA2. climate policy and targets will become stricter; IA3. the best support form for renewable decentralised production is investment aid; IA4. the best support form for renewable decentralised production is long term production support; IA5. the best support form for renewable decentralised production is a combination of investment aid and production support; IA6. the best support form for renewable decentralised production is tax allowances; IA7. energy subsidies should be neutral in terms of scale and technology; IA8. the basis for energy subsidies should be energy efficiency; IA9. the basis for energy subsidies should be flexible production capacity; IA10. the basis for energy subsidies should be the capability of storing energy; and IA11. the basis for energy subsidies should be a reduction of GHGs; and IA12. any form of energy or fuel should not get permanent subsidies.
The opinion about the best support form for renewable decentralised energy produc-tion varied between countries (IA3–IA6). In Germany, 60% of the respondents chose long-term production support followed by a combination of investment aid and production support (59%). Likewise, in Germany, the biogas business branch is used to benefit from the long-term production support. Until the latest version of EEG 2017, the EEG offers 20
Figure 2. Development of energy policy until 2030 (probable future). IA1. The energy policy will be stable and predictable;IA2. climate policy and targets will become stricter; IA3. the best support form for renewable decentralised productionis investment aid; IA4. the best support form for renewable decentralised production is long term production support;IA5. the best support form for renewable decentralised production is a combination of investment aid and productionsupport; IA6. the best support form for renewable decentralised production is tax allowances; IA7. energy subsidies shouldbe neutral in terms of scale and technology; IA8. the basis for energy subsidies should be energy efficiency; IA9. the basisfor energy subsidies should be flexible production capacity; IA10. the basis for energy subsidies should be the capability ofstoring energy; and IA11. the basis for energy subsidies should be a reduction of GHGs; and IA12. any form of energy orfuel should not get permanent subsidies.
The opinion about the best support form for renewable decentralised energy pro-duction varied between countries (IA3–IA6). In Germany, 60% of the respondents choselong-term production support followed by a combination of investment aid and productionsupport (59%). Likewise, in Germany, the biogas business branch is used to benefit fromthe long-term production support. Until the latest version of EEG 2017, the EEG offers 20years of stability for the individual plant operator. This stability was the reason for thegrowth of the biogas branch in Germany.
In The Netherlands, most experts agreed with current support for renewable energy,which is mainly consisting of production support and also includes several investmentsupport measures. However, tax allowances were the most popular among the experts(65%). From the question, it is not a priori clear which type of tax allowances are meant.In The Netherlands, the use of electricity that businesses and private households producethemselves from renewable sources (e.g., biogas, landfill gas, sewage gas, and electricityfrom CHP installations) is exempted from ODE tax. The exemption does not apply toenergy consumption; renewable energy and grey energy have the same taxes for consumers.
In Finland, tax allowances were strongly favoured (82%), but investment aid was alsoseen positively (58%). Currently in Finland, the traffic use of biomethane is exempted fromfuel tax. Otherwise, investment support is the leading support measure in Finland, bothfor the industrial and farm-scale biogas plants.

Sustainability 2021, 13, 1148 10 of 20
In all three countries, the reduction of GHGs was considered as the most important ba-sis for energy subsidies (IA8–IA11). Likewise, the respective governments have announcedfurther increases in goals for the reduction of CO2 and ambitious plans to curb climatechange. In Germany and The Netherlands, the flexible production capacity was the secondpopular option, and in Finland, the capability of storing energy. Especially in Germany, thestrong growth in fluctuating wind and solar energy is causing a high demand for balancingenergy supply, which will continue to rise sharply in view of the political expansion targets.Therefore, the flexibilization of biogas plants has been promoted since the EEG 2014 and iseven a prerequisite for participating in the tenders of the EEG 2017.
Whether the energy subsidies should be neutral in terms of scale and technology(IA7), or any form of energy or fuel should not get permanent subsidies (IA12), dividedthe opinions both between and within countries. In Germany, neutrality in terms of plantsize and technology was never intended under the EEG. The different FiTs for the differentforms of energy, such as wind, solar, or biomass, were based on the financial needs ofthese technologies and their different plant sizes. In addition, bonuses were used to createincentives, e.g., for the use of certain substrates. Both in Germany and The Netherlands,the majority of the respondents were against scale- and technology-neutral subsidies. InFinland, scale- and technology-neutral subsidies were mainly supported (65%), and onlyFinns agreed strongly against permanent subsidies (88%).
The role of consumers as small producers of both electricity (IB1) and heat (IB2) wasseen to become more common in all three countries in the probable future until 2030(Figure 3).
Sustainability 2021, 13, x FOR PEER REVIEW 10 of 20
years of stability for the individual plant operator. This stability was the reason for the growth of the biogas branch in Germany.
In The Netherlands, most experts agreed with current support for renewable energy, which is mainly consisting of production support and also includes several investment support measures. However, tax allowances were the most popular among the experts (65%). From the question, it is not a priori clear which type of tax allowances are meant. In The Netherlands, the use of electricity that businesses and private households produce themselves from renewable sources (e.g. biogas, landfill gas, sewage gas, and electricity from CHP installations) is exempted from ODE tax. The exemption does not apply to en-ergy consumption; renewable energy and grey energy have the same taxes for consumers.
In Finland, tax allowances were strongly favoured (82%), but investment aid was also seen positively (58%). Currently in Finland, the traffic use of biomethane is exempted from fuel tax. Otherwise, investment support is the leading support measure in Finland, both for the industrial and farm-scale biogas plants.
In all three countries, the reduction of GHGs was considered as the most important basis for energy subsidies (IA8–IA11). Likewise, the respective governments have an-nounced further increases in goals for the reduction of CO2 and ambitious plans to curb climate change. In Germany and The Netherlands, the flexible production capacity was the second popular option, and in Finland, the capability of storing energy. Especially in Germany, the strong growth in fluctuating wind and solar energy is causing a high de-mand for balancing energy supply, which will continue to rise sharply in view of the po-litical expansion targets. Therefore, the flexibilization of biogas plants has been promoted since the EEG 2014 and is even a prerequisite for participating in the tenders of the EEG 2017.
Whether the energy subsidies should be neutral in terms of scale and technology (IA7), or any form of energy or fuel should not get permanent subsidies (IA12), divided the opinions both between and within countries. In Germany, neutrality in terms of plant size and technology was never intended under the EEG. The different FiTs for the differ-ent forms of energy, such as wind, solar, or biomass, were based on the financial needs of these technologies and their different plant sizes. In addition, bonuses were used to create incentives, e.g., for the use of certain substrates. Both in Germany and The Netherlands, the majority of the respondents were against scale- and technology-neutral subsidies. In Finland, scale- and technology-neutral subsidies were mainly supported (65%), and only Finns agreed strongly against permanent subsidies (88%).
The role of consumers as small producers of both electricity (IB1) and heat (IB2) was seen to become more common in all three countries in the probable future until 2030 (Fig-ure 3).
Figure 3. Development of business environment until 2030 (probable future). IB1. New technologies increase smart grids and enhance the role of consumers as small producers; IB2. various decentralised heat production technologies as part of wider heat grid become more common; IB3. energy production with wood chips is economically viable also without sup-port; IB4. energy production with biogas is economically viable also without support; IB5. wind energy is economically viable also without support; IB6. solar energy is economically viable also without support; IB7. local energy companies and farms are co-investing for local renewable energy production; IB8. as the consumer awareness of the energy choices
Figure 3. Development of business environment until 2030 (probable future). IB1. New technologies increase smart gridsand enhance the role of consumers as small producers; IB2. various decentralised heat production technologies as partof wider heat grid become more common; IB3. energy production with wood chips is economically viable also withoutsupport; IB4. energy production with biogas is economically viable also without support; IB5. wind energy is economicallyviable also without support; IB6. solar energy is economically viable also without support; IB7. local energy companiesand farms are co-investing for local renewable energy production; IB8. as the consumer awareness of the energy choicesincreases, their willingness to pay increases too; and IB9. the amount and quality of energy used in production becomesmore relevant for the image of the consumer product (branding).
Renewable energy production without any support was seen most probably economi-cally viable with wind energy (IB5: 55–88%) and second with solar energy (IB6: 50–75%).Wood chips (IB3) were mostly not considered economically viable without support, andbiogas (IB4) even less. For wind and solar power, cost reduction has been achieved bytechnology development, but this has not been the case for biogas because a large partof the costs for biogas plants are the substrates (or their logistical costs), which are notsubject to any technological development. Moreover, in Germany, increased administrativerequirements and safety regulations included in the EEG 2017 compensated for the costreduction achieved by technology development. Finns were most positive about the eco-nomic viability of biogas without support (47%) followed by Dutch (27%) and Germans(19%). One reason for this might be that, in Finland and The Netherlands, less energy crops

Sustainability 2021, 13, 1148 11 of 20
are used for biogas production and energy production itself has a smaller role besideswaste treatment and nutrient recycling.
The respondents in all three countries believed in co-operation between farms andlocal energy companies in local renewable energy production (IB7: 69–77%). There alsoseems to be a great trust in consumers regarding the willingness to pay for environmentallyfriendly energy and their consumption behaviour. All these possibilities could also benefitthe biogas business branch.
4.2. Part II: Biogas Specific Questions
The investment cost for a biogas plant was believed to increase in the probable futurein Germany and Finland (56% and 50%) but not so much in The Netherlands (Figure 4:IIA1). The investment costs of biogas plants have increased over time due to the increasedsafety requirements. However, in the desirable future, most respondents in all countrieshoped that the prices would decrease. The state of the biogas technology was believed toincrease in all countries in the probable future (70–100%) and even more in the desirablefuture (IIA2).
Sustainability 2021, 13, x FOR PEER REVIEW 11 of 20
increases, their willingness to pay increases too; and IB9. the amount and quality of energy used in production becomes more relevant for the image of the consumer product (branding).
Renewable energy production without any support was seen most probably econom-ically viable with wind energy (IB5: 55–88%) and second with solar energy (IB6: 50–75%). Wood chips (IB3) were mostly not considered economically viable without support, and biogas (IB4) even less. For wind and solar power, cost reduction has been achieved by technology development, but this has not been the case for biogas because a large part of the costs for biogas plants are the substrates (or their logistical costs), which are not subject to any technological development. Moreover, in Germany, increased administrative re-quirements and safety regulations included in the EEG 2017 compensated for the cost re-duction achieved by technology development. Finns were most positive about the eco-nomic viability of biogas without support (47%) followed by Dutch (27%) and Germans (19%). One reason for this might be that, in Finland and The Netherlands, less energy crops are used for biogas production and energy production itself has a smaller role be-sides waste treatment and nutrient recycling.
The respondents in all three countries believed in co-operation between farms and local energy companies in local renewable energy production (IB7: 69–77%). There also seems to be a great trust in consumers regarding the willingness to pay for environmen-tally friendly energy and their consumption behaviour. All these possibilities could also benefit the biogas business branch.
4.2. Part II: Biogas Specific Questions The investment cost for a biogas plant was believed to increase in the probable future
in Germany and Finland (56% and 50%) but not so much in The Netherlands (Figure 4: IIA1). The investment costs of biogas plants have increased over time due to the increased safety requirements. However, in the desirable future, most respondents in all countries hoped that the prices would decrease. The state of the biogas technology was believed to increase in all countries in the probable future (70–100%) and even more in the desirable future (IIA2).
Figure 4. Increasing and/or decreasing factors for biogas production and use (P = probable, D = desirable future). IIA1. Investment cost of biogas plants; IIA2. state of the biogas technology; IIA3. availability of suppliers and technologies of farm-scale biogas plants; IIA4. availability of suitable raw materials for biogas production; IIA5. the price (that a biogas plant can receive) for recycled fertilisers (digestate-based); and IIA6. extension of biogas filling station network.
The Germans were pessimistic about the availability of suppliers and technologies of farm-scale biogas plants in the probable future (IIA3). Of the respondents, 46% believed that the availability would decrease. This might be because the EEG 2017 led to a sharp reduction in plant construction. As a result, some plant manufacturers had to file for in-solvency. Suppliers of small liquid manure plants and suppliers with foreign business came through this crisis better. In The Netherlands and Finland, the availability of suppli-ers and technologies were believed to increase in the probable future, and in all countries, in the desirable future.
Figure 4. Increasing and/or decreasing factors for biogas production and use (P = probable, D = desirable future). IIA1.Investment cost of biogas plants; IIA2. state of the biogas technology; IIA3. availability of suppliers and technologies offarm-scale biogas plants; IIA4. availability of suitable raw materials for biogas production; IIA5. the price (that a biogasplant can receive) for recycled fertilisers (digestate-based); and IIA6. extension of biogas filling station network.
The Germans were pessimistic about the availability of suppliers and technologies offarm-scale biogas plants in the probable future (IIA3). Of the respondents, 46% believedthat the availability would decrease. This might be because the EEG 2017 led to a sharpreduction in plant construction. As a result, some plant manufacturers had to file forinsolvency. Suppliers of small liquid manure plants and suppliers with foreign businesscame through this crisis better. In The Netherlands and Finland, the availability of suppliersand technologies were believed to increase in the probable future, and in all countries, inthe desirable future.
In The Netherlands, the availability of suitable raw materials for biogas productionshared opinions in the probable future (IIA4). The somewhat unclear answer to thisquestion may be because current production focuses more on waste and residual materials.This increases the number of substrates used, but not their availability. The potential formanure digestion is still very high. In Germany, the respondents favoured an increase inthe raw material availability in the probable future (48%), although there are restrictionson the use of maize silage in the EEG 2017 (max. 44% from 2021). Also, in their research,Pehlken et al. concluded that bioenergy supply chains involving alternative biomass andgrass from grasslands provide optimisation potentials compared to the current corn-basedpractice [42]. In Finland, the availability of raw materials was believed to increase strongly.
The question IIA5 was formulated in the first Finnish query as ‘The price for recycledfertilisers’. Thus, in Finland, it could have been understood differently as the productioncost for recycled fertilisers. In that way, it would be considered positive if the productioncosts would decrease, and the biogas plant could sell the fertiliser product at a lower
Sustainability 2021, 13, 1148 12 of 20
price and thus get a larger market share for their products. Otherwise, in Germany andThe Netherlands, the price that a biogas plant can receive for recycled fertilisers werebelieved to increase in the probable future (45–67%). In practice, the achievable prices fordigestate-based recycled fertilisers vary greatly from region to region. In areas with a lot oflivestock farming and a high density of biogas plants, there is a large surplus of digestate.The processing of the digestate to a commercial fertiliser is cost-intensive and is mainlypracticed when the nutrient surplus of the region is so high that a long transport becomesnecessary.
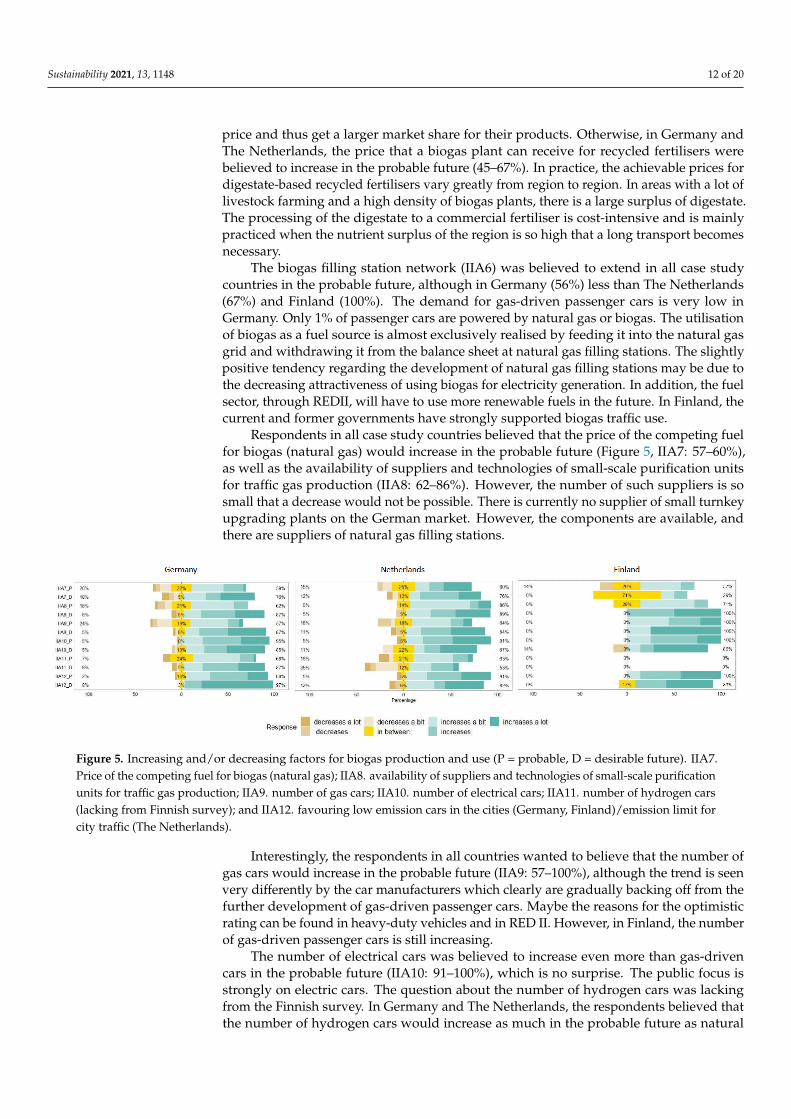
The biogas filling station network (IIA6) was believed to extend in all case studycountries in the probable future, although in Germany (56%) less than The Netherlands(67%) and Finland (100%). The demand for gas-driven passenger cars is very low inGermany. Only 1% of passenger cars are powered by natural gas or biogas. The utilisationof biogas as a fuel source is almost exclusively realised by feeding it into the natural gasgrid and withdrawing it from the balance sheet at natural gas filling stations. The slightlypositive tendency regarding the development of natural gas filling stations may be due tothe decreasing attractiveness of using biogas for electricity generation. In addition, the fuelsector, through REDII, will have to use more renewable fuels in the future. In Finland, thecurrent and former governments have strongly supported biogas traffic use.
Respondents in all case study countries believed that the price of the competing fuelfor biogas (natural gas) would increase in the probable future (Figure 5, IIA7: 57–60%),as well as the availability of suppliers and technologies of small-scale purification unitsfor traffic gas production (IIA8: 62–86%). However, the number of such suppliers is sosmall that a decrease would not be possible. There is currently no supplier of small turnkeyupgrading plants on the German market. However, the components are available, andthere are suppliers of natural gas filling stations.
Sustainability 2021, 13, x FOR PEER REVIEW 12 of 20
In The Netherlands, the availability of suitable raw materials for biogas production shared opinions in the probable future (IIA4). The somewhat unclear answer to this ques-tion may be because current production focuses more on waste and residual materials. This increases the number of substrates used, but not their availability. The potential for manure digestion is still very high. In Germany, the respondents favoured an increase in the raw material availability in the probable future (48%), although there are restrictions on the use of maize silage in the EEG 2017 (max. 44% from 2021). Also, in their research, Pehlken et al. concluded that bioenergy supply chains involving alternative biomass and grass from grasslands provide optimisation potentials compared to the current corn-based practice [42]. In Finland, the availability of raw materials was believed to increase strongly.
The question IIA5 was formulated in the first Finnish query as ‘The price for recycled fertilisers’. Thus, in Finland, it could have been understood differently as the production cost for recycled fertilisers. In that way, it would be considered positive if the production costs would decrease, and the biogas plant could sell the fertiliser product at a lower price and thus get a larger market share for their products. Otherwise, in Germany and The Netherlands, the price that a biogas plant can receive for recycled fertilisers were believed to increase in the probable future (45–67%). In practice, the achievable prices for digestate-based recycled fertilisers vary greatly from region to region. In areas with a lot of livestock farming and a high density of biogas plants, there is a large surplus of digestate. The pro-cessing of the digestate to a commercial fertiliser is cost-intensive and is mainly practiced when the nutrient surplus of the region is so high that a long transport becomes necessary.
The biogas filling station network (IIA6) was believed to extend in all case study countries in the probable future, although in Germany (56%) less than The Netherlands (67%) and Finland (100%). The demand for gas-driven passenger cars is very low in Ger-many. Only 1% of passenger cars are powered by natural gas or biogas. The utilisation of biogas as a fuel source is almost exclusively realised by feeding it into the natural gas grid and withdrawing it from the balance sheet at natural gas filling stations. The slightly pos-itive tendency regarding the development of natural gas filling stations may be due to the decreasing attractiveness of using biogas for electricity generation. In addition, the fuel sector, through REDII, will have to use more renewable fuels in the future. In Finland, the current and former governments have strongly supported biogas traffic use.
Respondents in all case study countries believed that the price of the competing fuel for biogas (natural gas) would increase in the probable future (Figure 5, IIA7: 57–60%), as well as the availability of suppliers and technologies of small-scale purification units for traffic gas production (IIA8: 62–86%). However, the number of such suppliers is so small that a decrease would not be possible. There is currently no supplier of small turnkey upgrading plants on the German market. However, the components are available, and there are suppliers of natural gas filling stations.
Figure 5. Increasing and/or decreasing factors for biogas production and use (P = probable, D = desirable future). IIA7. Price of the competing fuel for biogas (natural gas); IIA8. availability of suppliers and technologies of small-scale purifi-cation units for traffic gas production; IIA9. number of gas cars; IIA10. number of electrical cars; IIA11. number of
Figure 5. Increasing and/or decreasing factors for biogas production and use (P = probable, D = desirable future). IIA7.Price of the competing fuel for biogas (natural gas); IIA8. availability of suppliers and technologies of small-scale purificationunits for traffic gas production; IIA9. number of gas cars; IIA10. number of electrical cars; IIA11. number of hydrogen cars(lacking from Finnish survey); and IIA12. favouring low emission cars in the cities (Germany, Finland)/emission limit forcity traffic (The Netherlands).
Interestingly, the respondents in all countries wanted to believe that the number ofgas cars would increase in the probable future (IIA9: 57–100%), although the trend is seenvery differently by the car manufacturers which clearly are gradually backing off from thefurther development of gas-driven passenger cars. Maybe the reasons for the optimisticrating can be found in heavy-duty vehicles and in RED II. However, in Finland, the numberof gas-driven passenger cars is still increasing.
The number of electrical cars was believed to increase even more than gas-drivencars in the probable future (IIA10: 91–100%), which is no surprise. The public focus isstrongly on electric cars. The question about the number of hydrogen cars was lackingfrom the Finnish survey. In Germany and The Netherlands, the respondents believed thatthe number of hydrogen cars would increase as much in the probable future as natural
Sustainability 2021, 13, 1148 13 of 20
gas or biogas cars (IIA11: 63–68%). However, in The Netherlands, the experts’ opinionsabout hydrogen cars were divided on what comes to the desirable future. Currently, theavailability of filling stations and cars is so low that it is not a real alternative. Nevertheless,both German and Dutch governments have strong hydrogen strategy.
Favouring low emission cars in the cities or emission limits for city traffic will mostprobably increase in all countries (IIA12: 88–100%). However, the current debate is moreabout air quality than renewable fuels and GHG emissions.
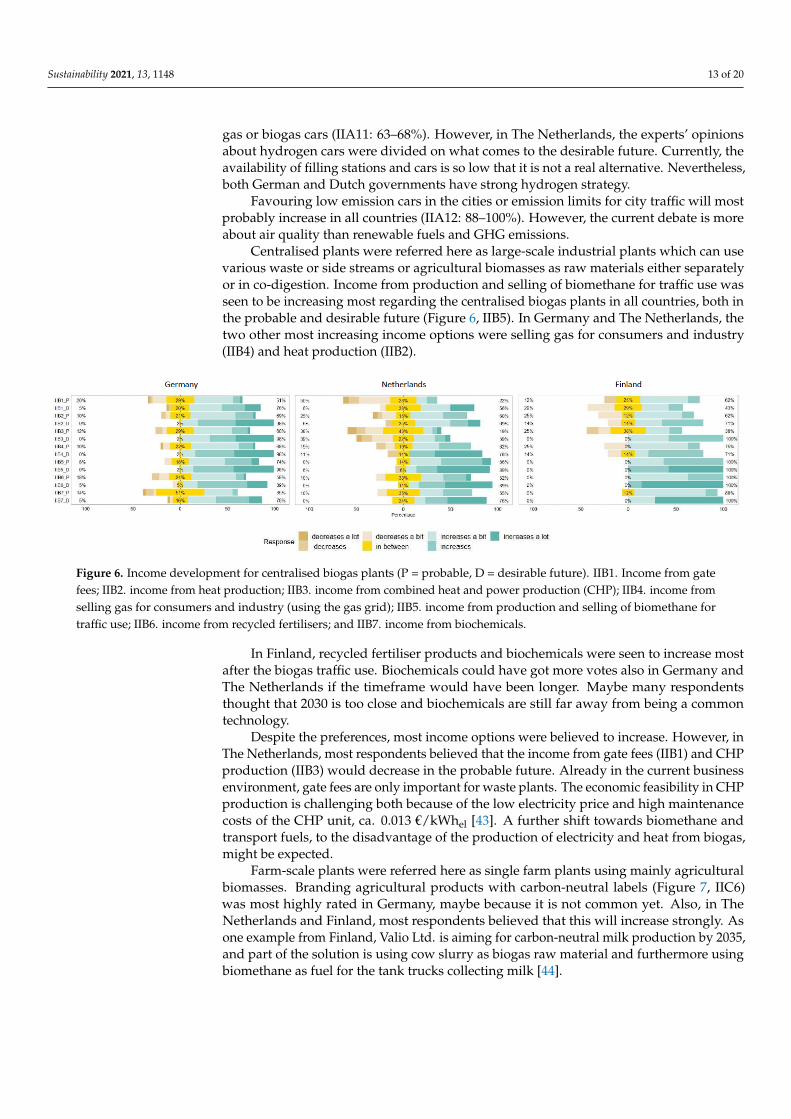
Centralised plants were referred here as large-scale industrial plants which can usevarious waste or side streams or agricultural biomasses as raw materials either separatelyor in co-digestion. Income from production and selling of biomethane for traffic use wasseen to be increasing most regarding the centralised biogas plants in all countries, both inthe probable and desirable future (Figure 6, IIB5). In Germany and The Netherlands, thetwo other most increasing income options were selling gas for consumers and industry(IIB4) and heat production (IIB2).
Sustainability 2021, 13, x FOR PEER REVIEW 13 of 20
hydrogen cars (lacking from Finnish survey); and IIA12. favouring low emission cars in the cities (Germany, Fin-land)/emission limit for city traffic (The Netherlands).
Interestingly, the respondents in all countries wanted to believe that the number of gas cars would increase in the probable future (IIA9: 57–100%), although the trend is seen very differently by the car manufacturers which clearly are gradually backing off from the further development of gas-driven passenger cars. Maybe the reasons for the optimistic rating can be found in heavy-duty vehicles and in RED II. However, in Finland, the num-ber of gas-driven passenger cars is still increasing.
The number of electrical cars was believed to increase even more than gas-driven cars in the probable future (IIA10: 91–100%), which is no surprise. The public focus is strongly on electric cars. The question about the number of hydrogen cars was lacking from the Finnish survey. In Germany and The Netherlands, the respondents believed that the num-ber of hydrogen cars would increase as much in the probable future as natural gas or biogas cars (IIA11: 63–68%). However, in The Netherlands, the experts’ opinions about hydrogen cars were divided on what comes to the desirable future. Currently, the availa-bility of filling stations and cars is so low that it is not a real alternative. Nevertheless, both German and Dutch governments have strong hydrogen strategy.
Favouring low emission cars in the cities or emission limits for city traffic will most probably increase in all countries (IIA12: 88–100%). However, the current debate is more about air quality than renewable fuels and GHG emissions.
Centralised plants were referred here as large-scale industrial plants which can use various waste or side streams or agricultural biomasses as raw materials either separately or in co-digestion. Income from production and selling of biomethane for traffic use was seen to be increasing most regarding the centralised biogas plants in all countries, both in the probable and desirable future (Figure 6, IIB5). In Germany and The Netherlands, the two other most increasing income options were selling gas for consumers and industry (IIB4) and heat production (IIB2).
Figure 6. Income development for centralised biogas plants (P = probable, D = desirable future). IIB1. Income from gate fees; IIB2. income from heat production; IIB3. income from combined heat and power production (CHP); IIB4. income from selling gas for consumers and industry (using the gas grid); IIB5. income from production and selling of biomethane for traffic use; IIB6. income from recycled fertilisers; and IIB7. income from biochemicals.
In Finland, recycled fertiliser products and biochemicals were seen to increase most after the biogas traffic use. Biochemicals could have got more votes also in Germany and The Netherlands if the timeframe would have been longer. Maybe many respondents thought that 2030 is too close and biochemicals are still far away from being a common technology.
Despite the preferences, most income options were believed to increase. However, in The Netherlands, most respondents believed that the income from gate fees (IIB1) and CHP production (IIB3) would decrease in the probable future. Already in the current busi-ness environment, gate fees are only important for waste plants. The economic feasibility in CHP production is challenging both because of the low electricity price and high
Figure 6. Income development for centralised biogas plants (P = probable, D = desirable future). IIB1. Income from gatefees; IIB2. income from heat production; IIB3. income from combined heat and power production (CHP); IIB4. income fromselling gas for consumers and industry (using the gas grid); IIB5. income from production and selling of biomethane fortraffic use; IIB6. income from recycled fertilisers; and IIB7. income from biochemicals.
In Finland, recycled fertiliser products and biochemicals were seen to increase mostafter the biogas traffic use. Biochemicals could have got more votes also in Germany andThe Netherlands if the timeframe would have been longer. Maybe many respondentsthought that 2030 is too close and biochemicals are still far away from being a commontechnology.
Despite the preferences, most income options were believed to increase. However, inThe Netherlands, most respondents believed that the income from gate fees (IIB1) and CHPproduction (IIB3) would decrease in the probable future. Already in the current businessenvironment, gate fees are only important for waste plants. The economic feasibility in CHPproduction is challenging both because of the low electricity price and high maintenancecosts of the CHP unit, ca. 0.013 €/kWhel [43]. A further shift towards biomethane andtransport fuels, to the disadvantage of the production of electricity and heat from biogas,might be expected.
Farm-scale plants were referred here as single farm plants using mainly agriculturalbiomasses. Branding agricultural products with carbon-neutral labels (Figure 7, IIC6)was most highly rated in Germany, maybe because it is not common yet. Also, in TheNetherlands and Finland, most respondents believed that this will increase strongly. Asone example from Finland, Valio Ltd. is aiming for carbon-neutral milk production by 2035,and part of the solution is using cow slurry as biogas raw material and furthermore usingbiomethane as fuel for the tank trucks collecting milk [44].

Sustainability 2021, 13, 1148 14 of 20
Sustainability 2021, 13, x FOR PEER REVIEW 14 of 20
maintenance costs of the CHP unit, ca. 0.013 €/kWhel [43]. A further shift towards bio-methane and transport fuels, to the disadvantage of the production of electricity and heat from biogas, might be expected.
Farm-scale plants were referred here as single farm plants using mainly agricultural biomasses. Branding agricultural products with carbon-neutral labels (Figure 7, IIC6) was most highly rated in Germany, maybe because it is not common yet. Also, in The Nether-lands and Finland, most respondents believed that this will increase strongly. As one ex-ample from Finland, Valio Ltd. is aiming for carbon-neutral milk production by 2035, and part of the solution is using cow slurry as biogas raw material and furthermore using biomethane as fuel for the tank trucks collecting milk [44].
Figure 7. Income development for farm scale biogas plants (P = probable, D = desirable future). IIC1. Improving farm energy self-sufficiency; IIC2. income from selling energy out of the farm—heat production; IIC3. income from selling en-ergy out of the farm—CHP production; IIC4. income from selling energy out of the farm—traffic gas purification; IIC5. improving nutrient self-sufficiency and crop yields; and IIC6. branding agricultural products with a carbon-neutral label (and thus getting higher price).
Both in The Netherlands and Finland, the largest growth potential for income devel-opment was believed to be in improving nutrient self-sufficiency and crop yields (IIC5). Biogas plant digestate is a better fertiliser than manure because during AD part of the organic nitrogen is degraded into ammonium nitrogen, which is directly available for the plants. Especially in organic farming, the nutrient use can be improved with biogas plant digestate instead of direct use of animal manure or green manure, i.e., grass or legumes cultivated as part of crop rotation [45].
In Germany, the second-largest income growth potential was seen in selling energy out of the farm in the form of traffic gas (IIC4), which was also highly rated in The Neth-erlands and Finland. However, Dutch and Finns preferred improving farm energy self-sufficiency as the second option (IIC1). In Finland, there is a clear reason for this. Farms are remotely located and district heating is not possible. Thus, at least some own heat production is needed. The most common heat source is wood chips, but biogas is also a viable option. The only clear decreasing income source was, according to Dutch respond-ents, selling energy out of the farm in the form of heat and electricity, i.e., CHP production (IIC3). Also, the Germans and Finns saw this among the least promising options. In Fin-land, the least favourable option was selling energy out of the farm in the form of heat (IIC2), which describes the current situation well. Because of the long distances between farms and other settlements, it is typically not possible to sell heat out of the farm in Fin-land.
The respondents in all countries were very positive about the many important roles of biogas technology in the future. Treatment of manure and cutting down emissions from agriculture (Figure 8, IID6) got the highest ranking both in the probable and in the desir-able future. Also, economically, manure digestion is an extra option with higher support in Germany.
Figure 7. Income development for farm scale biogas plants (P = probable, D = desirable future). IIC1. Improving farmenergy self-sufficiency; IIC2. income from selling energy out of the farm—heat production; IIC3. income from sellingenergy out of the farm—CHP production; IIC4. income from selling energy out of the farm—traffic gas purification; IIC5.improving nutrient self-sufficiency and crop yields; and IIC6. branding agricultural products with a carbon-neutral label(and thus getting higher price).
Both in The Netherlands and Finland, the largest growth potential for income devel-opment was believed to be in improving nutrient self-sufficiency and crop yields (IIC5).Biogas plant digestate is a better fertiliser than manure because during AD part of theorganic nitrogen is degraded into ammonium nitrogen, which is directly available for theplants. Especially in organic farming, the nutrient use can be improved with biogas plantdigestate instead of direct use of animal manure or green manure, i.e., grass or legumescultivated as part of crop rotation [45].
In Germany, the second-largest income growth potential was seen in selling energy outof the farm in the form of traffic gas (IIC4), which was also highly rated in The Netherlandsand Finland. However, Dutch and Finns preferred improving farm energy self-sufficiencyas the second option (IIC1). In Finland, there is a clear reason for this. Farms are remotelylocated and district heating is not possible. Thus, at least some own heat production isneeded. The most common heat source is wood chips, but biogas is also a viable option.The only clear decreasing income source was, according to Dutch respondents, sellingenergy out of the farm in the form of heat and electricity, i.e., CHP production (IIC3). Also,the Germans and Finns saw this among the least promising options. In Finland, the leastfavourable option was selling energy out of the farm in the form of heat (IIC2), whichdescribes the current situation well. Because of the long distances between farms and othersettlements, it is typically not possible to sell heat out of the farm in Finland.
The respondents in all countries were very positive about the many important roles ofbiogas technology in the future. Treatment of manure and cutting down emissions fromagriculture (Figure 8, IID6) got the highest ranking both in the probable and in the desirablefuture. Also, economically, manure digestion is an extra option with higher support inGermany.
The second most important role was seen in nutrient recycling (IID8). Unlike incomposting, where nitrogen is lost through denitrification in the form of nitrogen gasto the atmosphere, nitrogen compounds remain in the digestate, and their fertilisationeffect is even improved. Likewise, AD suits well for the treatment of biowaste (IID7). Themoisture content does not harm the process as in combustion and the process enablesnutrient recycling.
The third-most important role seen by the experts was reducing CO2 emissions fromtraffic and improving urban air quality (IID2). These challenges indeed provide greatpotential for improvement. The transport sector represented 25% of the GHG emissions in2018 within EU-27 member states [46]. Many European countries are currently promotingelectric vehicles (EVs) as a leading GHG mitigation solution for the transportation sector.However, EVs have a high level of production-related emissions. The emissions from theiruse, on the other hand, depend on the GHG intensity of the electric grid in question. In
Sustainability 2021, 13, 1148 15 of 20
the worst case, EVs can lead to greater life-cycle GHG emissions than comparable dieselvehicles. The probability that an EV will lead to lower life-cycle GHG emissions than adiesel vehicle is only 75% for Germany and The Netherlands, whereas for Finland it is99% because of the high share of renewables in electricity production. However, thereare several countries in the European Economic Area (EEA), such as Poland, Latvia, andEstonia, where the emissions from EVs most probably exceed those from diesel vehicles [47].The use of biomethane as a vehicle fuel has one the lowest well-to-wheels GHG emissions,comparable to the use of renewable electricity for EVs, according to the latest JEC Well-To-Wheels report [48]. Unfortunately, the current CO2 standards for car manufacturers do notrecognise biomethane, but the CO2 emissions for gas-driven cars are calculated based onnatural gas. The European Commission will propose a revision of the CO2 standards forcars and vans by June 2021 and will also review the CO2 standards for heavy-duty vehiclesby 2022 [49]. To be able to meet the aims of the EU’s ‘Sustainable and Smart MobilityStrategy’, i.e., a 90% reduction in transport-related GHG emissions by 2050, the policiesshould take into account the emissions from the whole life-cycle of a vehicle. In addition, asolution based on several technologies and energy sources would be more resilient andenables selecting the best solution according to the local conditions and needs.
Sustainability 2021, 13, x FOR PEER REVIEW 15 of 20
Figure 8. Significance and roles of biogas technology in the future (P = probable, D = desirable future). IID1. Replacing fossil raw materials in the production of energy and fuels; IID2. reducing CO2 emissions from traffic and improving urban air quality; IID3. replacing fossil raw materials in the production of chemicals and materials; IID4. using biogas for bal-ancing production and storing energy along with other renewable energy sources (e.g., wind, solar); IID5. biogas as part of the decentralised energy production for improving the security of supply; IID6. treatment of manure and cutting down emissions from agriculture; IID7. treatment of other types of biowaste; and IID8. recycling nutrients.
The second most important role was seen in nutrient recycling (IID8). Unlike in com-posting, where nitrogen is lost through denitrification in the form of nitrogen gas to the atmosphere, nitrogen compounds remain in the digestate, and their fertilisation effect is even improved. Likewise, AD suits well for the treatment of biowaste (IID7). The moisture content does not harm the process as in combustion and the process enables nutrient re-cycling.
The third-most important role seen by the experts was reducing CO2 emissions from traffic and improving urban air quality (IID2). These challenges indeed provide great po-tential for improvement. The transport sector represented 25% of the GHG emissions in 2018 within EU-27 member states [46]. Many European countries are currently promoting electric vehicles (EVs) as a leading GHG mitigation solution for the transportation sector. However, EVs have a high level of production-related emissions. The emissions from their use, on the other hand, depend on the GHG intensity of the electric grid in question. In the worst case, EVs can lead to greater life-cycle GHG emissions than comparable diesel vehicles. The probability that an EV will lead to lower life-cycle GHG emissions than a diesel vehicle is only 75% for Germany and The Netherlands, whereas for Finland it is 99% because of the high share of renewables in electricity production. However, there are several countries in the European Economic Area (EEA), such as Poland, Latvia, and Es-tonia, where the emissions from EVs most probably exceed those from diesel vehicles [47]. The use of biomethane as a vehicle fuel has one the lowest well-to-wheels GHG emissions, comparable to the use of renewable electricity for EVs, according to the latest JEC Well-To-Wheels report [48]. Unfortunately, the current CO2 standards for car manufacturers do not recognise biomethane, but the CO2 emissions for gas-driven cars are calculated based on natural gas. The European Commission will propose a revision of the CO2 standards for cars and vans by June 2021 and will also review the CO2 standards for heavy-duty vehicles by 2022 [49]. To be able to meet the aims of the EU’s ‘Sustainable and Smart Mo-bility Strategy’, i.e., a 90% reduction in transport-related GHG emissions by 2050, the pol-icies should take into account the emissions from the whole life-cycle of a vehicle. In ad-dition, a solution based on several technologies and energy sources would be more resil-ient and enables selecting the best solution according to the local conditions and needs.
5. Conclusions The three case study countries had different approaches relating to biogas due to
political aims and local conditions. In Germany, biogas has been used for electricity pro-duction based on generous FiTs. At present, with the tendering model and lower subsidy levels, research and practice are discussing ways to improve the economic efficiency of
Figure 8. Significance and roles of biogas technology in the future (P = probable, D = desirable future). IID1. Replacingfossil raw materials in the production of energy and fuels; IID2. reducing CO2 emissions from traffic and improvingurban air quality; IID3. replacing fossil raw materials in the production of chemicals and materials; IID4. using biogas forbalancing production and storing energy along with other renewable energy sources (e.g., wind, solar); IID5. biogas as partof the decentralised energy production for improving the security of supply; IID6. treatment of manure and cutting downemissions from agriculture; IID7. treatment of other types of biowaste; and IID8. recycling nutrients.
5. Conclusions
The three case study countries had different approaches relating to biogas due to polit-ical aims and local conditions. In Germany, biogas has been used for electricity productionbased on generous FiTs. At present, with the tendering model and lower subsidy levels,research and practice are discussing ways to improve the economic efficiency of biogasplants, such as the use of cost-effective substrates, improved heat utilisation, improvedutilisation of digestate as fertiliser, ecosystem services, flexible power production for gridstabilisation or demand-driven production (which is a requirement to enter the tender).However, alternatives without state subsidies are also being sought. One possibility couldbe biomethane production for gas grid injection or use as traffic fuel. Most of the ap-proaches currently show no economic viability or require the removal of legal hurdles fortheir implementation. How serious the situation is can be seen from the fact that 2020 isthe first year in which the number of biogas plants in Germany decreases.
In The Netherlands, natural gas has been used widely, both in households and by theindustry, and the country has a wide gas grid. Due to safety issues, the use of natural gashas been decided to phase down by 2050 and be replaced by biomethane and hydrogengas. Biomethane could also find more use in traffic, especially heavy-duty vehicles andinland shipping. The current biogas production could be more than doubled only by using

Sustainability 2021, 13, 1148 16 of 20
manure as a substrate due to the high density of livestock. Biogas production is growingsteadily, and biomethane injection to natural gas grid is growing fast.
In Finland, the biogas business branch is challenged with long distances and smallmarkets. Biogas is hoped to give a new income source for agriculture by combiningfood and energy production, and at the same time, cut down emissions. Both the formerand present Finnish governments have supported both biogas production and the use ofbiomethane as traffic fuel. Biogas production in Finland is still small, measured both inabsolute production amount and per capita, but especially, the use of biomethane as trafficfuel is growing fast.
Despite the differences, the biogas business branch in the case study countries alsohad common drivers and barriers based on expert survey. In the following Table 2, thedrivers and barriers are categorised based on a PESTE/PESTLE framework [50,51].
Table 2. The drivers and barriers of biogas production based on expert survey.
PESTE Drivers Barriers
Political- Renewable energy and GHG emission
reduction goals- Governmental support mechanisms
- Uncertainty of political decisions- Business models based on subsidies- Biomethane not recognised in CO2 standards
for car manufacturers
Economical
- New income sources from traffic fuel andcircular economy solutions (recyclednutrients and biochemicals)
- Branding agricultural products
- High logistical costs of raw materials- Low price of end products due to the low
price of fossil energy and mineral nutrients- Underdeveloped markets for
recycled nutrients
Social
- Significance of ’Green consumers’ increases- Co-operation between farms and local
energy companies- Decentralised energy production creates jobs
for rural communities
- Partly misleading negative images aboutbiogas production (‘not in mybackyard’ phrase)
- Too positive images about electrical cars
Technological- Increase in the number of technological
solutions regarding biogas plants andbiomethane up-grading
- Lack of interest from car manufacturers todevelop new gas-driven vehicles
Environmental- Emissions’ reduction from agriculture- Nutrients recycling- Replacing fossil fuels
- Emissions from biogas plants anddigestate storages
Finally, how did the experts see the future role and opportunities for biogas in thethree case study countries? The most important role was considered to be the treatmentof manure and cutting down emissions from agriculture. The next important role wasenabling nutrient recycling, and the third, reducing CO2 emissions from traffic and im-proving urban air quality, although they were all highly rated and the differences betweenthese options were small.
To be able to accomplish these tasks, the biogas business must be profitable. But howchould the businesses find new income sources or how could the policymakers create astable business environment? The promising income sources were different for centralisedand farm-scale plants. For centralised plants in all countries, the income from productionand selling of biomethane for traffic use was seen to be increasing most. This could indeedbe a win-win option for both the environment and the biogas branch. However, the futureof this path lies in the policymakers’ hands. How biomethane is rated in the future, interms of CO2 standards and in comparison to electrical vehicles, will be a central questionregarding the biomethane use as traffic fuel.

Sustainability 2021, 13, 1148 17 of 20
For farm-scale plants, branding agricultural products with a carbon-neutral label wasmost highly rated in Germany. Also, in The Netherlands and Finland, there seemed to bea great trust in consumers’ willingness to pay for food produced with environmentallyfriendly energy or with fewer emissions. However, both in The Netherlands and Finland,the largest growth potential for income development was believed to be in improvingnutrient self-sufficiency and crop yields.
The expert survey showed the versatile roles and opportunities of biogas technologyfor societies. While the EU aims to be carbon neutral by 2050, biogas technology could helpto achieve this goal by contributing to many sectors of the economy.
Author Contributions: Conceptualization, E.W., P.R., M.V.G., D.O. and S.Z.; Methodology, P.R. andM.V.G.; Formal Analysis, D.O. and A.G.; Investigation, E.W., P.R., M.V.G., D.O. and S.Z.; Writing–Original Draft Preparation, E.W., M.V.G., S.Z., P.R., D.O., L.Z., A.G.; Writing–Review & Editing,E.W.; Visualization, E.W. and D.O. All authors have read and agreed to the published version of themanuscript.
Funding: The Finnish study was part of the FutWend-project: Towards a future-oriented ‘En-ergiewende’, funded by the Academy of Finland (grant number 297747).
Institutional Review Board Statement: The survey study follows the regulations of the NationalAdvisory Board on Research Ethics (2009) and the American Psychological Association, includingthe informed consent, confidentiality and anonymity of the participants.
Informed Consent Statement: Informed consent was obtained from all subjects involved in thestudy.
Data Availability Statement: Data available on request due to that the surveys were conducted inGerman, Dutch and Finnish.
Acknowledgments: We gratefully acknowledge the experts in all three case study countries whoanswered the Webropol survey and gave their time and expertise to our use.
Conflicts of Interest: The authors declare no conflict of interest. The founding sponsors had no rolein the design of the study; in the collection, analysis, or interpretation of data; in the writing of themanuscript, and in the decision to publish the results.
Abbreviations
AD anaerobic digestionCBG compressed biogasCH4 methaneCHP combined heat and powerCO2 carbon dioxideEEG Erneuerbare Energien GesetzFiT feed-in tariffGHG greenhouse gasGWh gigawatt-hourkWh kilowatt-hourNECP national energy and climate planNm3 normal cubic meterRED II Revised Renewable Energy DirectiveSDE Stimulering duurzame energieproductie en klimaattransitieSNG synthetic natural gas
References1. Jones, D.; Moore, C. Renewables Beat Fossil Fuels-a Half-Yearly Analysis of Europe’s Electricity Transition. 2020. Available online:
https://ember-climate.org/wp-content/uploads/2020/07/2020-Europe-Half-Year-report.pdf (accessed on 27 December 2020).2. Proposal for a Regulation of the European Parliament and of the Council Establishing the Framework for Achieving Climate
Neutrality and Amending Regulation (EU) 2018/1999 (European Climate Law), COM/2020/80 Final. Available online: https://eur-lex.europa.eu/legal-content/EN/TXT/?qid=1588581905912&uri=CELEX:52020PC0080 (accessed on 22 January 2021).
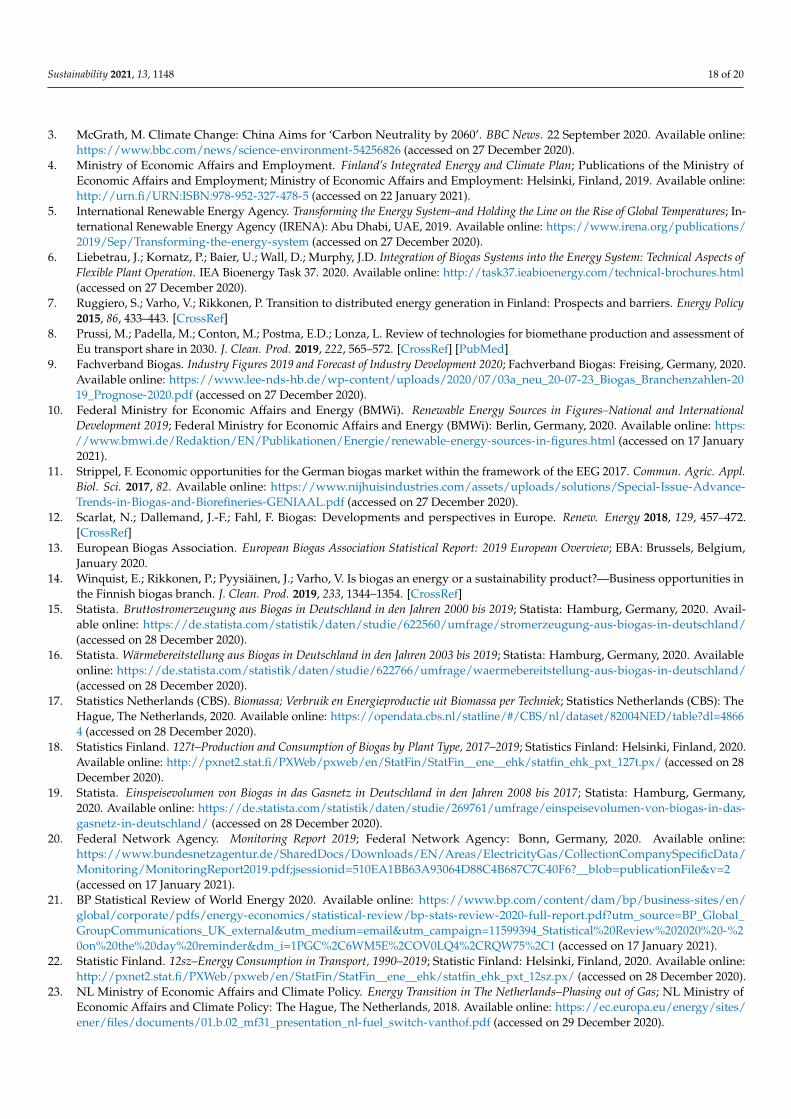
Sustainability 2021, 13, 1148 18 of 20
3. McGrath, M. Climate Change: China Aims for ‘Carbon Neutrality by 2060’. BBC News. 22 September 2020. Available online:https://www.bbc.com/news/science-environment-54256826 (accessed on 27 December 2020).
4. Ministry of Economic Affairs and Employment. Finland’s Integrated Energy and Climate Plan; Publications of the Ministry ofEconomic Affairs and Employment; Ministry of Economic Affairs and Employment: Helsinki, Finland, 2019. Available online:http://urn.fi/URN:ISBN:978-952-327-478-5 (accessed on 22 January 2021).
5. International Renewable Energy Agency. Transforming the Energy System–and Holding the Line on the Rise of Global Temperatures; In-ternational Renewable Energy Agency (IRENA): Abu Dhabi, UAE, 2019. Available online: https://www.irena.org/publications/2019/Sep/Transforming-the-energy-system (accessed on 27 December 2020).
6. Liebetrau, J.; Kornatz, P.; Baier, U.; Wall, D.; Murphy, J.D. Integration of Biogas Systems into the Energy System: Technical Aspects ofFlexible Plant Operation. IEA Bioenergy Task 37. 2020. Available online: http://task37.ieabioenergy.com/technical-brochures.html(accessed on 27 December 2020).
7. Ruggiero, S.; Varho, V.; Rikkonen, P. Transition to distributed energy generation in Finland: Prospects and barriers. Energy Policy2015, 86, 433–443. [CrossRef]
8. Prussi, M.; Padella, M.; Conton, M.; Postma, E.D.; Lonza, L. Review of technologies for biomethane production and assessment ofEu transport share in 2030. J. Clean. Prod. 2019, 222, 565–572. [CrossRef] [PubMed]
9. Fachverband Biogas. Industry Figures 2019 and Forecast of Industry Development 2020; Fachverband Biogas: Freising, Germany, 2020.Available online: https://www.lee-nds-hb.de/wp-content/uploads/2020/07/03a_neu_20-07-23_Biogas_Branchenzahlen-2019_Prognose-2020.pdf (accessed on 27 December 2020).
10. Federal Ministry for Economic Affairs and Energy (BMWi). Renewable Energy Sources in Figures–National and InternationalDevelopment 2019; Federal Ministry for Economic Affairs and Energy (BMWi): Berlin, Germany, 2020. Available online: https://www.bmwi.de/Redaktion/EN/Publikationen/Energie/renewable-energy-sources-in-figures.html (accessed on 17 January2021).
11. Strippel, F. Economic opportunities for the German biogas market within the framework of the EEG 2017. Commun. Agric. Appl.Biol. Sci. 2017, 82. Available online: https://www.nijhuisindustries.com/assets/uploads/solutions/Special-Issue-Advance-Trends-in-Biogas-and-Biorefineries-GENIAAL.pdf (accessed on 27 December 2020).
12. Scarlat, N.; Dallemand, J.-F.; Fahl, F. Biogas: Developments and perspectives in Europe. Renew. Energy 2018, 129, 457–472.[CrossRef]
13. European Biogas Association. European Biogas Association Statistical Report: 2019 European Overview; EBA: Brussels, Belgium,January 2020.
14. Winquist, E.; Rikkonen, P.; Pyysiäinen, J.; Varho, V. Is biogas an energy or a sustainability product?—Business opportunities inthe Finnish biogas branch. J. Clean. Prod. 2019, 233, 1344–1354. [CrossRef]
15. Statista. Bruttostromerzeugung aus Biogas in Deutschland in den Jahren 2000 bis 2019; Statista: Hamburg, Germany, 2020. Avail-able online: https://de.statista.com/statistik/daten/studie/622560/umfrage/stromerzeugung-aus-biogas-in-deutschland/(accessed on 28 December 2020).
16. Statista. Wärmebereitstellung aus Biogas in Deutschland in den Jahren 2003 bis 2019; Statista: Hamburg, Germany, 2020. Availableonline: https://de.statista.com/statistik/daten/studie/622766/umfrage/waermebereitstellung-aus-biogas-in-deutschland/(accessed on 28 December 2020).
17. Statistics Netherlands (CBS). Biomassa; Verbruik en Energieproductie uit Biomassa per Techniek; Statistics Netherlands (CBS): TheHague, The Netherlands, 2020. Available online: https://opendata.cbs.nl/statline/#/CBS/nl/dataset/82004NED/table?dl=48664 (accessed on 28 December 2020).
18. Statistics Finland. 127t–Production and Consumption of Biogas by Plant Type, 2017–2019; Statistics Finland: Helsinki, Finland, 2020.Available online: http://pxnet2.stat.fi/PXWeb/pxweb/en/StatFin/StatFin__ene__ehk/statfin_ehk_pxt_127t.px/ (accessed on 28December 2020).
19. Statista. Einspeisevolumen von Biogas in das Gasnetz in Deutschland in den Jahren 2008 bis 2017; Statista: Hamburg, Germany,2020. Available online: https://de.statista.com/statistik/daten/studie/269761/umfrage/einspeisevolumen-von-biogas-in-das-gasnetz-in-deutschland/ (accessed on 28 December 2020).
20. Federal Network Agency. Monitoring Report 2019; Federal Network Agency: Bonn, Germany, 2020. Available online:https://www.bundesnetzagentur.de/SharedDocs/Downloads/EN/Areas/ElectricityGas/CollectionCompanySpecificData/Monitoring/MonitoringReport2019.pdf;jsessionid=510EA1BB63A93064D88C4B687C7C40F6?__blob=publicationFile&v=2(accessed on 17 January 2021).
21. BP Statistical Review of World Energy 2020. Available online: https://www.bp.com/content/dam/bp/business-sites/en/global/corporate/pdfs/energy-economics/statistical-review/bp-stats-review-2020-full-report.pdf?utm_source=BP_Global_GroupCommunications_UK_external&utm_medium=email&utm_campaign=11599394_Statistical%20Review%202020%20-%20on%20the%20day%20reminder&dm_i=1PGC%2C6WM5E%2COV0LQ4%2CRQW75%2C1 (accessed on 17 January 2021).
22. Statistic Finland. 12sz–Energy Consumption in Transport, 1990–2019; Statistic Finland: Helsinki, Finland, 2020. Available online:http://pxnet2.stat.fi/PXWeb/pxweb/en/StatFin/StatFin__ene__ehk/statfin_ehk_pxt_12sz.px/ (accessed on 28 December 2020).
23. NL Ministry of Economic Affairs and Climate Policy. Energy Transition in The Netherlands–Phasing out of Gas; NL Ministry ofEconomic Affairs and Climate Policy: The Hague, The Netherlands, 2018. Available online: https://ec.europa.eu/energy/sites/ener/files/documents/01.b.02_mf31_presentation_nl-fuel_switch-vanthof.pdf (accessed on 29 December 2020).
Sustainability 2021, 13, 1148 19 of 20
24. Dumont, M. Circular economy in relation with biogas. In IEA Task 37 Luke Workshop: Circular Economy in the Food System; IEABioenergy: Jyväskylä, Finland, 8 March 2018. Available online: http://task37.ieabioenergy.com/workshops.html (accessed on29 December 2020).
25. Scarlat, N.; Fahl, F.; Dallemand, J.-F.; Monforti, F.; Motola, V. A spatial analysis of biogas potential from manure in Europe. Renew.Sustain. Energy Rev. 2018, 94, 915–930. [CrossRef]
26. Gustafsson, M.; Ammenberg, J.; Murphy, J.D. IEA Bioenergy Task 37 Country Report Summaries 2019. March 2020. Availableonline: http://task37.ieabioenergy.com/ (accessed on 27 December 2020).
27. Dumont, M.; Siemers, W. Country Update Netherlands. 2019. Available online: https://task37.ieabioenergy.com/country-reports.html (accessed on 29 December 2020).
28. Statistics Finland. 12st–Total Energy Consumption by Energy Source, 2010Q1–2020Q3; Statistics Finland: Helsinki, Finland, 2020.Available online: http://pxnet2.stat.fi/PXWeb/pxweb/en/StatFin/StatFin__ene__ehk/statfin_ehk_pxt_12st.px/ (accessed on28 December 2020).
29. Directive (EU) 2018/2001 of the European Parliament and of the Council of 11 December 2018 on the Promotion of the Use ofEnergy from Renewable Sources. Available online: https://eur-lex.europa.eu/legal-content/EN/TXT/?uri=uriserv:OJ.L_.2018.328.01.0082.01.ENG&toc=OJ:L:2018:328:TOC (accessed on 22 January 2021).
30. Regulation (EU) 2019/1009 of the European Parliament and of the Council of 5 June 2019 Laying down Rules on the MakingAvailable on the Market of EU Fertilising Products and Amending Regulations (EC) No 1069/2009 and (EC) No 1107/2009and Repealing Regulation (EC) No 2003/2003 (Text with EEA Relevance), PE/76/2018/REV/1. Available online: https://eur-lex.europa.eu/eli/reg/2019/1009/oj (accessed on 22 January 2021).
31. Directive 2014/94/EU of the European Parliament and of the Council of 22 October 2014 on the Deployment of Alternative FuelsInfrastructure. Available online: http://data.europa.eu/eli/dir/2014/94/2020-05-24 (accessed on 22 January 2021).
32. EBA. Statistical Report of the European Biogas Association 2018; EBA: Brussels, Belgium, December 2018.33. Federal Ministry of Environment, Nature Conservation and Nuclear Safety (BMU). Climate Action Plan 2050–Germany’s Long-Term
Low Greenhouse Gas Emission Development Strategy; Federal Ministry of Environment, Nature Conservation and Nuclear Safety(BMU): Bonn, Germany, 2019. Available online: https://www.bmu.de/en/topics/climate-energy/climate/national-climate-policy/greenhouse-gas-neutral-germany-2050/ (accessed on 27 December 2020).
34. Federal Ministry for Economic Affairs and Energy (BMWi). National Energy and Climate Plan; Federal Ministry for EconomicAffairs and Energy (BMWi): Berlin, Germany, 2020. Available online: https://www.bmwi.de/Redaktion/DE/Downloads/I/integrierter-nationaler-energie-klimaplan.pdf?__blob=publicationFile&v=8 (accessed on 27 December 2020).
35. Liebetrau, J.; Gromke, J.D.; Denysenko, V. IEA Bioenergy Task 37: Country Report Germany 2020. Available online: http://task37.ieabioenergy.com/country-reports.html (accessed on 27 December 2020).
36. Ministry of Economic Affairs and Employment and the Energy Authority. Support for Seven Projects Awarded through Auction–theAverage Price of Accepted Tenders EU2.5 per MWh; Press Release; Ministry of Economic Affairs and Employment and theEnergy Authority: Helsinki, Finland, 1 April 2019. Available online: https://energiavirasto.fi/tiedote/-/asset_publisher/uusiutuvan-energian-tarjouskilpailusta-tukea-seitsemalle-hankkeelle-hyvaksyttyjen-tarjousten-keskihinta-2-5-euroa-mwh?_101_INSTANCE_aRbx5sYgeQOs_languageId=en_US (accessed on 27 December 2020).
37. Ministry of Economic Affairs and Employment. Government Report on the National Energy and Climate Strategy for 2030; Publicationsof the Ministry of Economic Affairs and Employment; Ministry of Economic Affairs and Employment: Helsinki, Finland,December 2017. Available online: http://urn.fi/URN:ISBN:978-952-327-199-9 (accessed on 27 December 2020).
38. Strategic Programme of the Finnish Government. Finland, a Land of Solutions; Publications of the Finnish Government; StrategicProgramme of the Finnish Government: Helsinki, Finland, October 2015. Available online: https://vm.fi/julkaisu?pubid=6407(accessed on 27 December 2020).
39. Traficom. Passenger Cars in Traffic on 31 December by Region, Make, Driving Power and Year; Traficom: Helsinki, Finland, 2020.Available online: http://trafi2.stat.fi/PXWeb/pxweb/en/TraFi/TraFi__Liikennekaytossa_olevat_ajoneuvot/030_kanta_tau_103.px/table/tableViewLayout1/?rxid=714713ea-4df2-4b82-8e0a-68b51dad9956 (accessed on 10 October 2020).
40. Luostarinen, S.; Tampio, E.; Berlin, T.; Grönroos, J.; Kauppila, J.; Koikkalainen, K.; Niskanen, O.; Rasa, K.; Salo, T.; Turtola, E.; et al.Means for Advancing the Use of Organic Fertilising Products (Keinoja orgaanisten lannoitevalmisteiden käytön edistämiseen); Publicationsof the Ministry of Agriculture and Forestry; Ministry of Agriculture and Forestry: Helsinki, Finland, 2019. Available online:http://urn.fi/URN:ISBN:978-952-453-941-8 (accessed on 27 December 2020).
41. Ministry of Economic Affairs and Employment. Biokaasuohjelmaa Valmistelevan Työryhmän Loppuraportti (Final Report of theBiogas Working Group); Publications of the Ministry of Economic Affairs and Employment; Ministry of Economic Affairs andEmployment: Helsinki, Finland, 2020. Available online: http://urn.fi/URN:ISBN:978-952-327-482-2 (accessed on 27 December2020).
42. Pehlken, A.; Wulf, K.; Grecksch, K.; Klenke, T.; Tsydenova, N. More Sustainable Bioenergy by Making Use of Regional AlternativeBiomass? Sustainability 2020, 12, 7849. [CrossRef]
43. Hahn, H. Guideline for Financing Agricultural Biogas Projects-Training Material for Biogas Investors, IEE Project ‘BiogasIN’ D.3.7, WP 3;Fraunhofer Institute for Wind Energy and Energy System Technology (IWES): Bremerhaven, Germany, 2011. Available online:http://publica.fraunhofer.de/documents/N-413182.html (accessed on 15 January 2021).

Sustainability 2021, 13, 1148 20 of 20
44. Valio Ltd. Board of Directors’ Report and Financial Statements 1 Jan.–31 Dec. 2019; Valio Ltd.: Helsinki, Finland, 2020. Availableonline: https://www.valio.fi/vastuullisuus/raportit/ (accessed on 27 December 2020).
45. Koppelmäki, K.; Parviainen, T.; Virkkunen, E.; Winquist, E.; Schulte, P.O.R.; Helenius, J. Ecological intensification by integratingbiogas production into nutrient cycling: Modeling the case of Agroecological Symbiosis. Agric. Syst. 2019, 170, 39–48. [CrossRef]
46. Eurostat. Greenhouse Gas Emission Statistics–Emission Inventories; Eurostat, Statistics Explained: Luxembourg, 2020. Availableonline: https://ec.europa.eu/eurostat/statistics-explained/pdfscache/1180.pdf (accessed on 29 December 2020).
47. Dillman, K.V.; Árnadóttir, A.; Heinonen, J.; Czepkiewicz, M.; Davíðsdóttir, B. Review and Meta-Analysis of EVs: EmbodiedEmissions and Environmental Breakeven. Sustainability 2020, 12, 9390. [CrossRef]
48. Prussi, M.; Yugo, M.; De Prada, L.; Padella, M.; Edwards, R. JEC Well-to-Wheels Report v5. EUR 30284 EN; Publications Office ofthe European Union: Luxembourg, 2020. Available online: https://publications.jrc.ec.europa.eu/repository/handle/JRC121213(accessed on 29 December 2020).
49. European Commission. Questions and Answers: Sustainable and Smart Mobility Strategy; European Commission: Brussels, Belgium,9 December 2020. Available online: https://ec.europa.eu/commission/presscorner/detail/en/qanda_20_2330 (accessed on29 December 2020).
50. Oraman, Y. An Analytic Study of Organic Food Industry as Part of Healthy Eating Habit in Turkey: Market Growth, Challengesand Prospects. Procedia Soc. Behav. Sci. 2014, 150, 1030–1039. [CrossRef]
51. Rothaermel, F.T. Strategic Management: Concepts, 2nd ed.; McGraw-Hill Education: New York, NY, USA, 2014.
Copyright © 2022 FDOKUMEN

