


![Autoradiographic visualisation of [ 3H]5-carboxamidotryptamine binding sites in the guinea pig and rat brain](https://static.fdokumen.com/doc/165x107/631db97fb5acdf8d60026115/autoradiographic-visualisation-of-3h5-carboxamidotryptamine-binding-sites-in.jpg)


Bahasa
Halaman
Hukum


ANTIMICROBIAL AGENTS AND CHEMOTHERAPY, May 2010, p. 1820–1833 Vol. 54, No. 50066-4804/10/$12.00 doi:10.1128/AAC.01521-09Copyright © 2010, American Society for Microbiology. All Rights Reserved.
Evaluation of Standard Chemotherapy in theGuinea Pig Model of Tuberculosis�
Diane J. Ordway,1* Crystal A. Shanley,1 Megan L. Caraway,1 Eileen A. Orme,1 Daniel S. Bucy,2Laurel Hascall-Dove,1 Marcela Henao-Tamayo,1 Marisa R. Harton,1 Shaobin Shang,1
David Ackart,1 Susan L. Kraft,2 Anne J. Lenaerts,1Randall J. Basaraba,1 and Ian M. Orme1
Mycobacteria Research Laboratories, Department of Microbiology, Immunology, and Pathology,1 and Departments ofEnvironmental and Radiological Health Sciences,2 Colorado State University, Fort Collins, Colorado 80523
Received 27 October 2009/Returned for modification 18 December 2009/Accepted 3 February 2010
The purpose of this study was 2-fold. First, we evaluated standard chemotherapy in the guinea pig model oftuberculosis to determine if this animal species could productively be used for this purpose. Second, given thesimilarities of the pathology of disease in guinea pigs and humans, we wished to evaluate additional param-eters, including magnetic resonance imaging, microscopy, and cytokine expression and lymphocyte phenotypes,in response to an infection treated with drug therapy. This study shows that conventional rifampin-isoniazid-pyrazinamide chemotherapy significantly decreased the numbers of the highly virulent Erdman K01 strain ofMycobacterium tuberculosis, with most of the bacilli being eliminated in a month. Despite this result, bacteriacould still be detected in the lungs and other tissues for at least another 3 to 4 months. Resolution of thenonnecrotic granulomas in the lungs and lymph nodes could be clearly visualized by magnetic resonanceimaging at the macroscopic level. Microscopically, the majority of the pulmonary and extrapulmonary inflam-mation resolved spontaneously, leaving residual lesions composed of dystrophic calcification and fibrosismarking the site of necrosis of the primary lesion. Residual calcified lesions, which were also associated withpulmonary lymphangitis, contained acid-fast bacilli even following aggressive chemotherapy. The presence ofintact extracellular bacilli within these lesions suggests that these could serve as the primary sites of diseasereactivation. The chemotherapy reduced the level of T-cell influx into infected tissues and was accompanied bya large and sustained increase in TH1 cytokine expression. Chemotherapy also prevented the emergence inlung tissues of high levels of interleukin-10 and Foxp3-positive cells, known markers of regulatory T cells.
The global epidemic caused by the bacterial pathogenMycobacterium tuberculosis continues unabated, with the mostrecent figures indicating that there are approximately 8 millionnew cases and about 2.7 million deaths each year (13–15, 22).Of the 45 million individuals infected with HIV, it is nowestimated that about one-third are coinfected with M. tubercu-losis (16, 19); this situation is particularly serious in SaharanAfrica (2, 7, 17). Even more troubling is the fact that theincidence of M. tuberculosis isolates that have become resistantto multiple drugs has now reached 0.5 million cases per year (8,11). The latter situation is compounded by the fact that a newdrug for tuberculosis has not been introduced for a quarter ofa century, but there is cause for optimism here, given theestablishment of a pipeline of promising new compounds,some of which are now being introduced into controlled clin-ical trials (18, 42, 43).
Because it is highly cost-effective, the mouse is the animalmodel of choice for the initial screening of new drugs and drugcombinations (30); however, there is growing interest in thefurther evaluation of secondary animal models. This is drivenby the fact that the M. tuberculosis infection in conventionalinbred mice differs from that in other small-animal models,
notably, the guinea pig and rabbit, in terms of the pathology ofpulmonary and extrapulmonary lesions (3). While mice de-velop poorly organized foci of pulmonary inflammation mostlycomposed of macrophages interspersed with aggregates oflymphocytes, guinea pigs form well-organized granulomas withcentral necrosis, a hallmark of the disease in humans. In ad-dition, like humans, guinea pigs develop severe pyogranuloma-tous and necrotizing lymphadenitis of the draining lymphnodes as part of the primary lesion complex (4). Within ne-crotic lesions, whether they are pulmonary or extrapulmonary,individual and small clusters of extracellular acid-fast bacillican be found attached or enmeshed in a complex matrix that iscomposed of remnants of necrotic host cells and that ulti-mately heals by dystrophic calcification and fibrosis (3, 31).Given these important similarities, the purpose of the studydescribed here was to comprehensively evaluate the potentialusefulness of the guinea pig model for testing the effects ofdrug therapy.
MATERIALS AND METHODS
Guinea pigs. Female outbred Hartley guinea pigs (weight, �500 g) werepurchased from the Charles River Laboratories (North Wilmington, MA) andwere held under barrier conditions in a biosafety level 3 animal laboratory. Thespecific-pathogen-free nature of the guinea pig colonies was demonstrated bytesting sentinel animals. All experimental protocols were approved by the Ani-mal Care and Usage Committee of Colorado State University.
Experimental infections in guinea pigs. Guinea pigs were infected (n � 5) byusing a Madison chamber aerosol generation device, which delivered approxi-mately 20 Mycobacterium tuberculosis strain Erdman K01 bacilli into the lungs.
* Corresponding author. Mailing address: Department of Microbi-ology, Immunology, and Pathology, Colorado State University, FortCollins, CO 80523-1682. Phone: (970) 491-4117. Fax: (970) 491-1815.E-mail: [email protected].
� Published ahead of print on 16 February 2010.
1820

The animals were then harvested and analyzed for bacterial load determinations(n � 5), histopathology (n � 5), and flow cytometric analysis (n � 4) on days 25,50, 75, 100, 125, and 150 days of the infection. As described previously (31), thebacterial loads in the organs of the guinea pigs at each time point of the studywere determined by plating serial dilutions of homogenates of lungs (rightcranial lobe), spleen, and mediastinal lymph node tissues on nutrient Middle-brook 7H11 agar and counting the numbers of CFU after 6 weeks of incubationat 37°C. The bacterial load for each organ was calculated and converted tologarithmic units. The data were expressed as the mean log10 number of CFU �the standard error of the mean for each group.
Experimental chemotherapy in guinea pigs. On day 20 of the infection, fourguinea pigs were euthanized to determine the bacterial load prior to the start ofdrug treatment on day 25. The remaining animals were randomly assigned to twogroups: 25 guinea pigs in the control group and 60 guinea pigs in the drugtreatment group. Chemotherapy was then administered 5 days a week for theduration of the 19-week treatment regimen. The animals in the control groupwere treated with a formulation consisting of a mixture of 40% (wt/vol) sucroseand 20% (wt/vol) pumpkin (100% pure pumpkin; Libby) supplemented withvitamin C (50 mg/kg of mean body weight) and commercial Lactobacillus (BDLactinex) (all purchased from Walmart, Fort Collins CO), while the animals inthe experimental group were treated with rifampin (RIF; 50 mg/kg of mean bodyweight), isoniazid (INH; 30 mg/kg of mean body weight), and pyrazinamide(PZA; 100 mg/kg of mean body weight), which were incorporated into thesucrose vehicle. The doses were chosen on the basis of previous pharmacokineticand pharmacodynamic studies performed with this species (26, 31). A splitfeeding protocol was used, with INH and PZA being given in the morning andRIF being given in the afternoon to minimize drug toxicity interactions. Theanimals were carefully monitored on a daily basis using the Karnovsky scale (40);usually, about a week or so after the drug treatment was started, the animalsbegan to go off feed, necessitating oral feeding with a syringe of the nutrient-richpuree, vitamin C, and Lactobacillus (Lactobacillus was given to help stabilize thececal flora and prevent gastrointestinal dysbacteriosis or antibiotic-associatedenteritis). This was performed by gently cradling the animal in the crook of thearm and allowing the animal to consume the mixture from a 1-ml syringe. Twodays prior to necropsy, randomly selected guinea pigs were taken off the drugtherapy. These animals were then euthanized; and their lungs, spleens, andmediastinal lymph nodes (MLNs) were removed. The number of viable organ-isms was determined by plating serial dilutions of 10-ml organ tissue homoge-nates on nutrient Middlebrook 7H11 agar plates (Gibco BRL, Gaithersburg,MD). The bacterial colonies were then counted after 3 to 4 weeks of incubationat 37°C.
Histological analysis. The left caudal lung lobe, spleen, and lymph nodes fromeach guinea pig (n � 5) were collected at necropsy and fixed in 4% paraformal-dehyde in phosphate-buffered saline (PBS). Randomly selected tissue sectionswere embedded in paraffin and cut to 5 �m on a microtome. The tissue sectionswere mounted on glass slides, deparaffinized and stained with hematoxylin-eosinand carbolfuchsin by the Ziehl-Neelsen method, as reported previously (5). Thelung and lymph node lesion areas relative to the normal tissue area were quan-tified by a stereology-based method, referred to as the area fraction fractionator,with the investigator blind to all treatment groups. The stereology workstationconsisted of a Nikon 80i research microscope equipped for bright-field andfluorescence microscopy with chromatic aberration-free infinity (CFI) objectives(�2/0.01 Plan Apo, �4/0.2 Plan Apo, �10/0.30 Plan Fluor, �20/0.75 Plan Apo,�40/0.75 Plan Fluor, �100/1.40 Plan Apo), a three-axis computer-controlledstepping stage with linear grid encoders, a z-axis motorized specimen stage forautomated sampling, a personal computer with a frame grabber board, a colordigital camera, a 24-in. monitor, and stereology and virtual slice zoomify software(StereoInvestigator, version 8.2; MBF Bioscience, Williston, VT) with the fol-lowing: three-dimensional (3D) serial section reconstruction, solid modeling,virtual slice, and confocal and magnetic resonance imaging (MRI) modules.
The lung and lesion areas on representative hematoxylin-eosin-stained sec-tions were determined. In addition, acid-fast-stained sections were evaluated.The area of inflammation relative to the area of normal tissue parenchyma wasestimated from representative lung, lymph node, and spleen tissue sectionsevaluated at �20 magnification. A total of 8 to 12 fields were randomly selectedby the computer, and a counting frame (2,000 �m2) containing probe points witha grid spacing of 200 �m was used to define the areas of interest (lesions andlungs). The data are expressed as the mean ratio of the lesion area to the lungarea for all the animals within a treatment group. A lesion shown in a photomi-crograph represents the section that is closest to the mean value for each group.
MRI. Four lungs were harvested from the animals before the start of treat-ment, and thereafter, the lungs of two guinea pigs in each group were harvestedat the indicated time points. At the time of euthanasia, the lungs were inflated
with 20 ml of room air per kg of body weight by tracheal intubation. Thepulmonary vasculature was flushed free of blood with 60 ml of phosphate-buffered saline and perfusion fixed with 60 ml of 4% paraformaldehyde via theright ventricle. Once the lungs were perfusion fixed, they were removed en blocand immersion fixed for 1 week in 4% paraformaldehyde. After immersionfixation, the heart and esophagus of each animal were dissected from the lungs.The lungs and attached mediastinal lymph nodes were embedded in 4% low-melting-point agarose in phosphate-buffered saline. The embedded lungs werethen scanned by MRI. The lungs were harvested from the control guinea pigs ondays 29, 50, 73, and 100 following exposure to M. tuberculosis and from thedrug-treated guinea pigs on days 29, 50, 78, 105, and 134 following exposure toM. tuberculosis. MRI scans were performed with a 1.5-T Signa 9.1 LX magneticresonance instrument (General Electric Medical Systems, Milwaukee, WI), withthe specimens being placed in a phased-array extremity coil (28). A T1-weighted3D volume scan was acquired (repetition time, 20 ms; echo time, 6.4 ms; slicethickness, 1.2 mm; field of view, 6 cm) for an in-plane spatial resolution of 234�m. Images of the entire lung specimen obtained by MRI were evaluated bysegmentation thresholding analysis with the Amira 2.3 program (Visage Imaging,Andover, MA). A line probe technique was used to select the boundaries be-tween the signal intensities for healthy and diseased lungs. From that signalintensity boundary, a threshold value was used for automated selection of alltissues exhibiting that signal intensity and higher. Tissues such as heart andlymph nodes were segmented manually, and whole-lung tracings were also madeto quantify the total sample size.
Flow cytometry. To prepare single-cell suspensions, the lungs and lymph nodeswere perfused with 20.0 ml of a solution containing PBS and heparin (50 U/ml;Sigma-Aldrich, St. Louis, MO) through the pulmonary artery; and the caudallobe and portions of the lymph nodes were aseptically removed from the pul-monary cavity, weighed, placed in medium, and dissected. In addition, leukocyteswere separated from 10 ml of guinea pig blood as described before (40). Thedissected lung tissue was incubated with complete Dulbecco modified Eaglemedium (cDMEM) containing collagenase XI (0.7 mg/ml; Sigma-Aldrich) andtype IV bovine pancreatic DNase (30 �g/ml; Sigma-Aldrich) for 30 min at 37°C.The digested lungs were further disrupted by gently pushing the tissue twicethrough a cell strainer (BD Biosciences, Lincoln Park, NJ). Red blood cells werelysed with ammonium chloride-potassium (ACK) lysis buffer, washed, and re-suspended in cDMEM. Total cell numbers were determined by flow cytometrywith liquid counting beads, as described by the manufacturer (BD PharMingen,San Jose, CA).
Flow cytometric analysis of cell surface markers. Suspensions of single cellsfrom the lungs and portions of the whole spleens and lymph nodes were preparedas described recently (40). Thereafter, suspensions of cells from each guinea pigwere first incubated with CD4 (45), CD8 (45), pan-T-cell (44, 45), CD45 (23),MIL4 (24), B-cell (25), macrophage (27), and class II (27, 45) antibodies at 4°Cfor 30 min in the dark and after the cells were washed with PBS containing 0.1%sodium azide (Sigma-Aldrich). In addition, membrane permeabilization withLeucoperm permeabilizer (Serotec Inc, Raleigh, NC) was completed, accordingto the instructions of the manufacturer, before staining with macrophages (27)and major histocompatibility complex (MHC) class II (46) antibodies. Dataacquisition and analysis were done with a FACscalibur fluorescence-activatedcell sorter (FACS; BD Biosciences, Mountain View, CA) and CellQuest software(BD Biosciences, San Jose, CA). Compensation for the spectral overlap for eachfluorochrome was done by using CD4, MIL4, or CD3 antigens from cells gatedin the low forward scatter versus low side scatter, moderate to high forwardscatter versus moderate to high side scatter, low side scatter versus MIL4-positiveregions, high side scatter versus MIL4-negative regions, and high side scatterversus MIL4-positive regions. Analyses were performed with an acquisition of atleast T cells 100,000 total events.
RT-PCR analysis. The levels of expression of mRNAs encoding the cytokinesgamma interferon (IFN-�), interleukin-12p40 (IL-12p40), tumor necrosis factoralpha (TNF-�), IL-8, transforming growth factor � (TGF-�), and IL-10, as wellas the regulatory T-cell-associated intracellular marker Foxp3, were quantifiedby real-time reverse transcription-PCR (RT-PCR). One lobe from each guineapig (n � 5) lung was added to 1 ml of TRIzol RNA reagent (Invitrogen), and themixture was homogenized and immediately frozen. Total RNA was extractedaccording to the manufacturer’s protocol. RNA samples from each group andeach time point were reverse transcribed with reverse transcriptase (Moloneymurine leukemia virus reverse transcriptase; Invitrogen). cDNA samples of 4.0�l were then amplified with iQ SYBR green supermix (Bio-Rad), according tothe manufacturer’s protocol, on an iQ5 iCycler amplification detection system(Bio-Rad). A negative control prepared by the use of ultrapure molecular biol-ogy-grade water as the template and a nontemplate control were run to confirmthat the signals were derived from RNA and were not due to the presence of
VOL. 54, 2010 CHEMOTHERAPY OF TUBERCULOSIS IN GUINEA PIGS 1821

contaminating genomic DNA. In order to ensure that only the correct gene wasamplified and that the amplicon was not due to the presence of a primer-dimeror nonspecific secondary products, melting curve analysis was performed for eachrun. The fold induction of mRNA was determined by analyzing the cycle thresh-old (CT) values normalized for expression of the CT for hypoxanthine phospho-ribosyltransferase (HPRT). The primer sequences for guinea pig IFN-�, TNF-�,IL-8, TGF-�1, IL-12p40, and 18S rRNA were published previously (1, 10). Theprimer sequences for guinea pig Foxp3 and IL-10 were determined with assis-tance from Anand Damodaran (Genotypic Technology, Bangalore, India). Thesequences of the primers used for Foxp3 were as follows: forward primer,5-AGAAAGCACCCTTTCAAGCA-3; reverse primer, 5-GAGGAAGTCCTCTGGCTCCT-3. The sequences of the primers used for IL-10 were as follows:forward primer, 5-TTCTTCCAAACACAGGATCAGC-3; reverse primer, 5-TCATTTCCGATAGGGCTTGG-3.
Statistical analysis. The data presented here are representative of those fromtwo experiments and are presented with the mean values for individual guineapigs within each group (n � 5) � the standard errors of the means (SEMs).Analysis was performed by the use of analysis of variance.
RESULTS
Effect of chemotherapy on bacterial load. The course ofinfection was compared between control guinea pigs receivinga sucrose-nutrient vehicle and those receiving chemotherapywith INH, RIF, and PZA. Guinea pigs were exposed to ap-proximately 20 bacilli of the highly virulent strain M. tubercu-losis Erdman K01; and the bacterial loads in the lungs, spleens,and lymph nodes were determined at the time points indicatedin Fig. 1. In the control animals, the infection progressed rap-idly for about 50 days, before the tissue bacterial load peaked.Although some decline in the bacterial numbers in all threetarget organs was seen, by day 100 virtually all of these animalshad died or were humanely euthanized because they reachedthe predetermined value on the Karnovsky scale.
The administration of chemotherapy had a profound effecton the bacterial load over the first 30 days of treatment, rapidlyreducing the number of surviving bacilli to about 100 CFU.Similar effects were seen in the draining lymph nodes and thespleen. After 30 days of infection, the rate of reduction of thetissue bacterial counts continued to decline, but very slowly,with some residual bacterial colonies being found on day 100 ofinfection. Thus, as in the mouse model, the bacterial clearance
patterns followed a biphasic curve, with initially rapid reduc-tions being followed by a very slow second phase.
MRI scans and analysis. MRI scans of ex vivo specimenswere performed in order to quantify the lesion burden of thelungs and the draining lymph nodes from the two study groups.A representative scan is shown in Fig. 2A, which shows numer-ous lung lesions and affected lymph nodes on a typical imageobtained by MRI from a paraformaldehyde-fixed lung speci-men (collected on day 50 of infection). Serial images throughthe entire lung were used to quantify the relative lesion-to-lungand lesion-to-lymph node volumes, as shown in Fig. 2B and C.No differences between the control and the treated animalscould be seen early on, but after that initial lag, this radio-graphic approach showed smaller and smaller lesions in thelungs and lymph nodes relative to sizes of the lesions in thecontrol animals. The treated animals also had substantially lesslymph node involvement than the untreated controls at 100days postinfection (Fig. 2C). Comparison of representativeMRI slices obtained over the course of the infection clearlyillustrate the beneficial effects of the chemotherapy and thegradual resolution of the disease (Fig. 3).
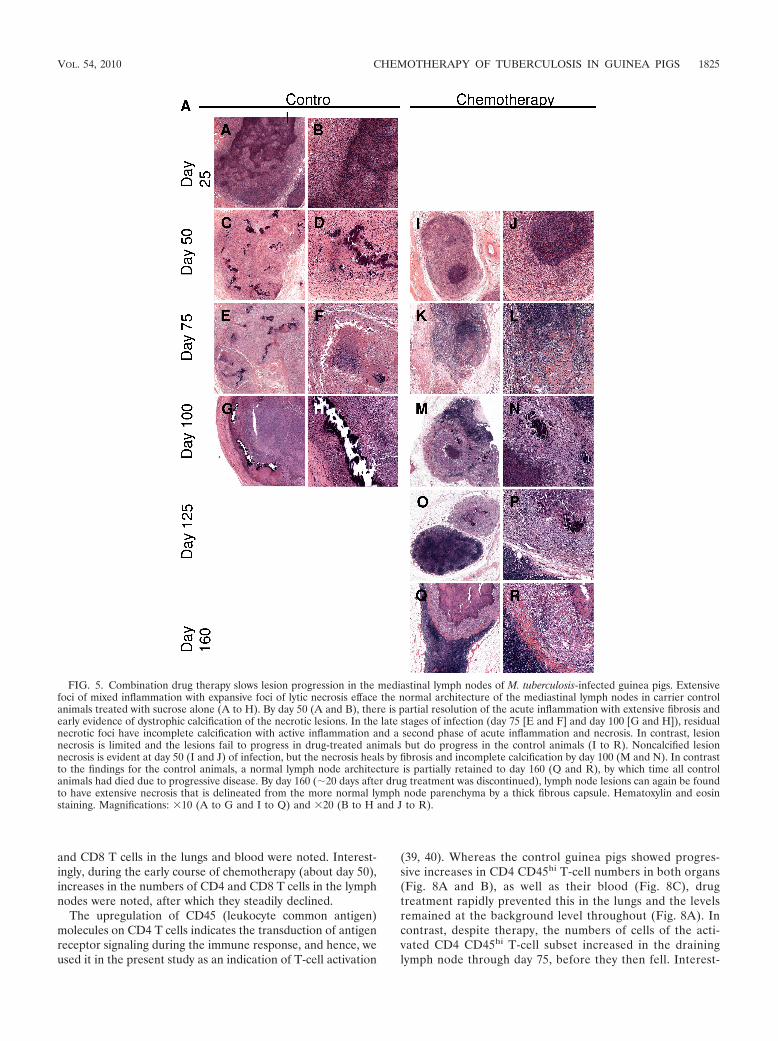
Progression of organ pathology. Low-dose aerosol infectionof guinea pigs produces multifocal to coalescing foci of gran-ulomatous inflammation in the lungs, followed by extrapulmo-nary dissemination that can involve any organ of the body (3).As shown in this study, primary lesions with necrosis developedin the lungs and draining mediastinal lymph nodes within thefirst 30 days of infection (Fig. 4 and 5). In the control animals,the lesions progressed to involve all or most of the normalparenchyma, resulting in the death of the animal by day 125 ofthe infection. Initiation of treatment of the animals with INH,RIF, and PZA slowed the progression of disease in the lungs,as well as in the spleen (data not shown). Data summarizingthe lesion areas relative to the area of more healthy tissue,including necrosis and the degree of calcification, are shown inFig. 6.
Collectively, the data shown in Fig. 4 to 6 show that therapyhad little or no effect on primary lesions with necrosis in the
FIG. 1. The bacterial counts in the lungs (A), lymph nodes (B), and spleens (C) from guinea pigs infected with a low dose of M. tuberculosisErdman K01 and treated with 40% sucrose (solid squares) and receiving chemotherapy (INH, PZA, and RIF; open squares) were compared ondays 25, 50, 75, 100, 125, and 150. The results are expressed as the average (n � 5) bacterial load in each group, expressed as the log10 numberof CFU (� SEM). It should be noted that the values at later time points are at or below the usual detection limits for these assays, and hence,their accuracy cannot be guaranteed.
1822 ORDWAY ET AL. ANTIMICROB. AGENTS CHEMOTHER.

lungs and lymph nodes (although treatment was more effectiveat preventing progressive inflammation and necrosis in thespleen; data not shown). In both the lungs and the lymphnodes, lesions with necrosis had incomplete dystrophic calcifi-cation, leaving residual necrosis with extensive fibrosis, despitedrug therapy. Dystrophic mineralization or calcification is a
pathological process associated with the intra- and extracellu-lar deposition of mixed calcium salts at sites of tissue necrosis.Calcification is a progressive process, and if it is complete, it isconsidered, along with fibrosis, to be a favorable healing re-sponse. Even after day 160 of the infection, while the lungswere again mostly clear, some mineralized primary lesions stillremained (Fig. 4Q and R). The significance of necrotic lesionswith or without calcification is that these lesions harbor apopulation of persistent extracellular bacilli that can be visu-alized by acid-fast staining, as shown in Fig. 6B (30). Drug
FIG. 2. MRI scans of guinea pigs receiving chemotherapy. (A) Nu-merous granulomas (white nodules) and enlarged lymph nodes (�) ona typical two-dimensional MRI slice from the 3D lung volume of afixed lung specimen from a control guinea pig (collected at 50 dayspostinfection); (B) granuloma disease burden (cm3) in treated (solidsquares) versus control (solid triangles) animals at the baseline (n � 4)and various other time points (n � 2) determined by MRI analyses ofex vivo lung specimens; (C) lymph node enlargement in treated (solidsquares) versus control (solid triangles) animals at various time pointsdetermined by MRI analyses of ex vivo lung specimens. PI, postinfec-tion.
FIG. 3. Comparative MRI scans of fixed lung specimens from con-trol guinea pigs and guinea pigs receiving chemotherapy performed ondays 29, 50, 78, 105, and 134 of infection. The images obtained by MRIshow severe lung consolidation through 100 days postinfection in thecontrol animals compared to the consolidation in the lungs of theanimals receiving chemotherapy, which show minimal disease burden.
VOL. 54, 2010 CHEMOTHERAPY OF TUBERCULOSIS IN GUINEA PIGS 1823

therapy was effective at preventing the development of nonne-crotic post-primary lesions in the lung but had little effect onthe progression of lymph node lesions that were less extensivebut that had residual necrosis with incomplete calcification(Fig. 5). In lesions that developed necrosis prior to the initia-tion of treatment, lesion progression was accompanied by heal-ing by incomplete dystrophic calcification and fibrosis.
Flow cytometric analysis. Using a recently described tech-nique (39, 40), we evaluated the influx of T lymphocytes intothe lungs and draining lymph nodes, as well as in the peripheral
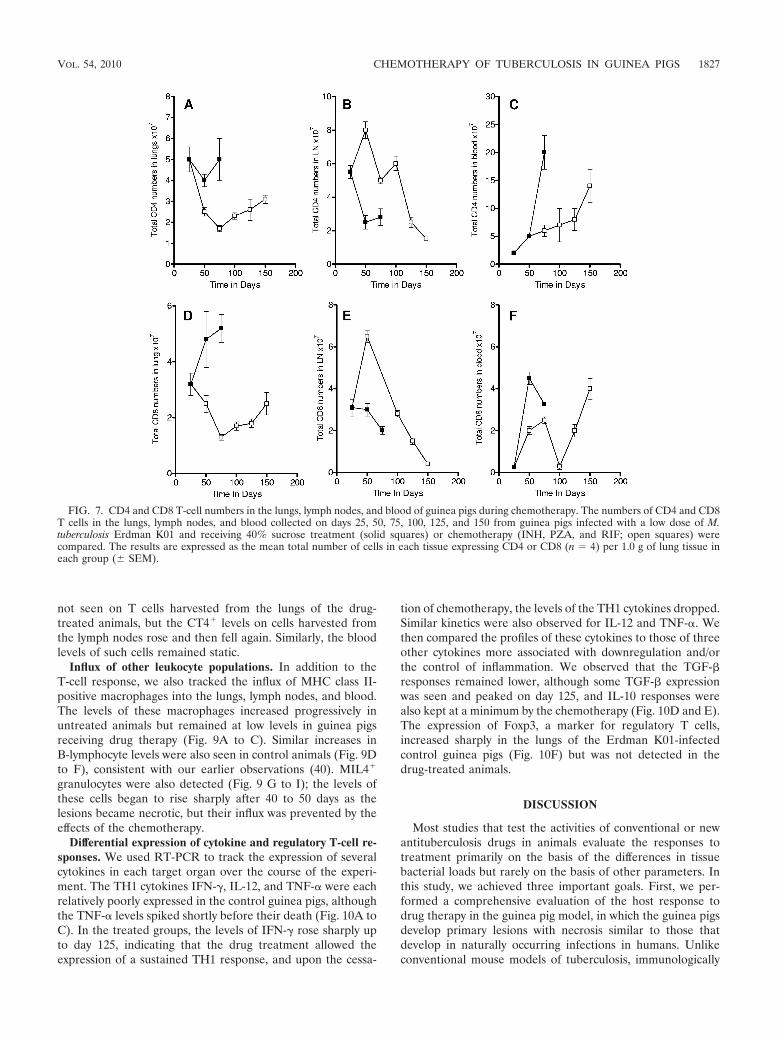
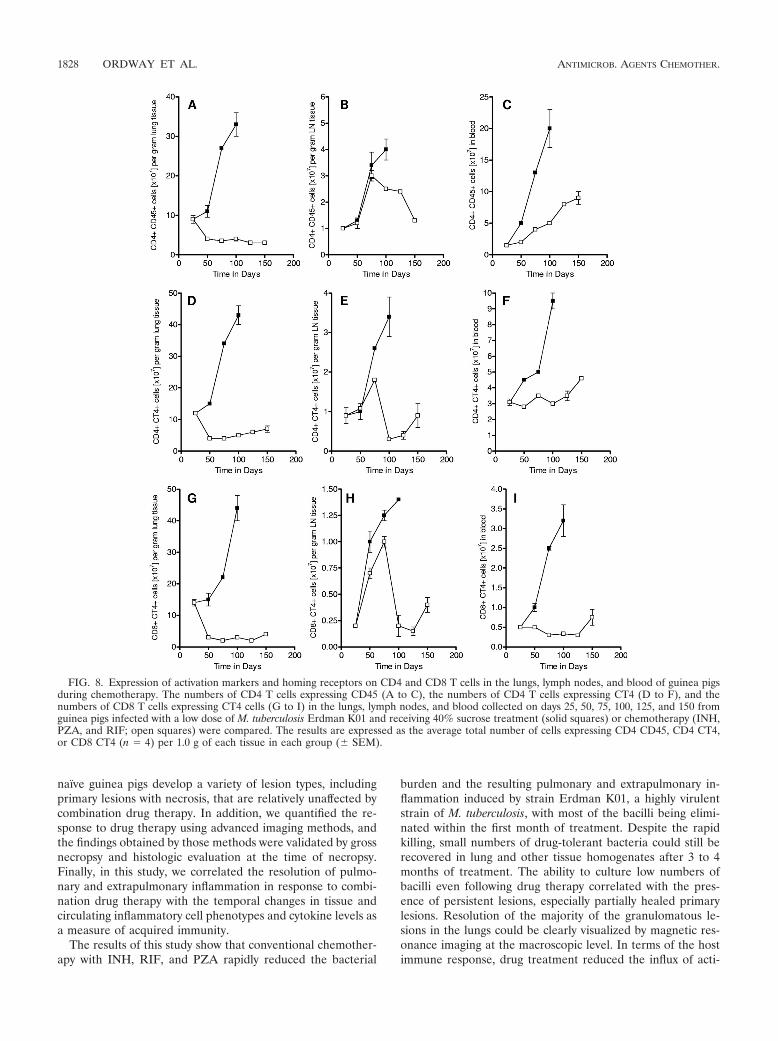
blood circulation, in the control and drug-treated guinea pigs.Figure 7 shows the total numbers of CD4 and CD8 cells inthese target organs over the course of the study. The controlanimals showed static numbers of CD4 cells and increases inthe numbers of CD8 cells in the lungs (Fig. 7A and D), de-creases in the numbers in the lymph nodes (Fig. 7B and E), andincreases in the numbers in blood (Fig. 7C and F). During drugtreatment, the numbers of cells in the lung and lymph nodesdropped as the lesions were resolved, and upon the cessationof drug treatment (day 133), increases in the numbers of CD4
FIG. 4. Combination drug therapy slows lesion progression in the lungs of M. tuberculosis-infected guinea pigs. Multifocal to coalescing foci ofmixed inflammation efface the normal pulmonary architecture by 25 days of infection in control animals receiving sucrose alone (A and B). By day50 (C, D, I, and J), lesions with central necrosis show evidence of healing by fibrosis and dystrophic calcification, which persists in the primarylesions throughout the course of infection in the control and the drug-treated animals. In the control animals, post-primary lesions efface theremainder of the parenchyma and develop a second phase of lytic necrosis (E and F) that also calcifies in drug-treated animals (K and L). In thedrug-treated animals, the post-primary lesions resolve or are prevented from developing, leaving only well-organized calcified lesions that are oftenperivascular and peribronchial and that correspond to pulmonary lymphatics (M to R), while in the control animals (G and H), the lesions continueto progress to form larger areas of multifocal coalescing inflammation and mineralization that efface large areas of pulmonary parenchyma,resulting in reduced survival. Hematoxylin and eosin staining. Magnifications, �10 (A to G and I to Q) and �20 (B to H and J to R).
1824 ORDWAY ET AL. ANTIMICROB. AGENTS CHEMOTHER.
and CD8 T cells in the lungs and blood were noted. Interest-ingly, during the early course of chemotherapy (about day 50),increases in the numbers of CD4 and CD8 T cells in the lymphnodes were noted, after which they steadily declined.
The upregulation of CD45 (leukocyte common antigen)molecules on CD4 T cells indicates the transduction of antigenreceptor signaling during the immune response, and hence, weused it in the present study as an indication of T-cell activation
(39, 40). Whereas the control guinea pigs showed progres-sive increases in CD4 CD45hi T-cell numbers in both organs(Fig. 8A and B), as well as their blood (Fig. 8C), drugtreatment rapidly prevented this in the lungs and the levelsremained at the background level throughout (Fig. 8A). Incontrast, despite therapy, the numbers of cells of the acti-vated CD4 CD45hi T-cell subset increased in the draininglymph node through day 75, before they then fell. Interest-
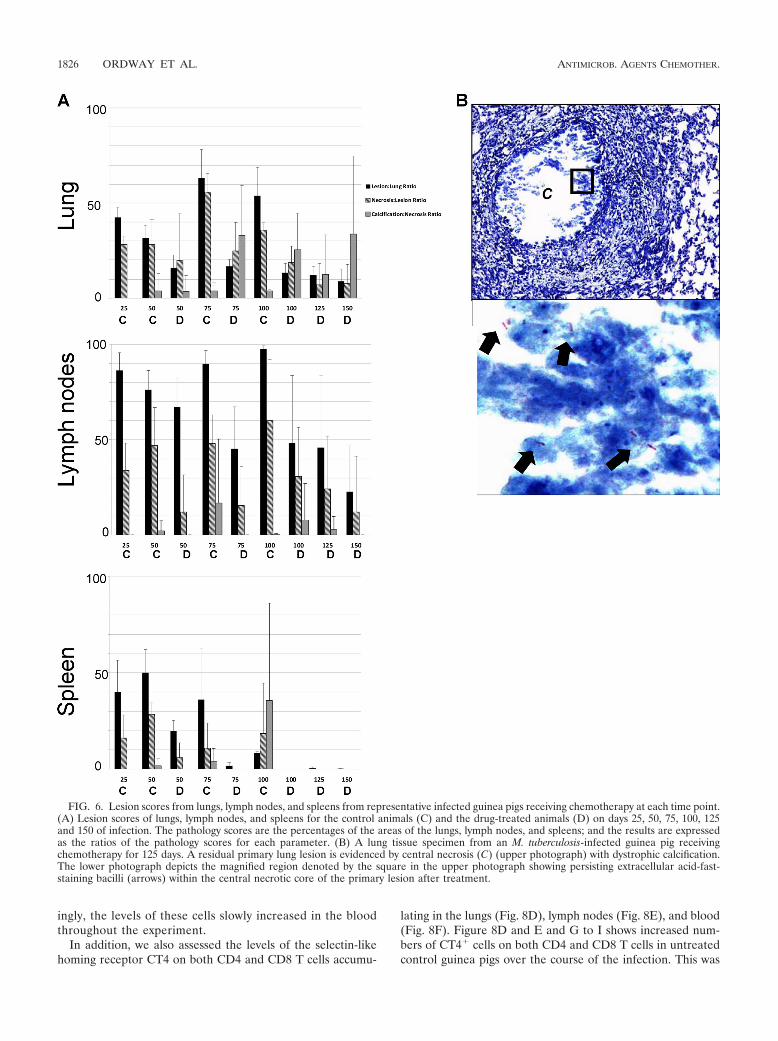
FIG. 5. Combination drug therapy slows lesion progression in the mediastinal lymph nodes of M. tuberculosis-infected guinea pigs. Extensivefoci of mixed inflammation with expansive foci of lytic necrosis efface the normal architecture of the mediastinal lymph nodes in carrier controlanimals treated with sucrose alone (A to H). By day 50 (A and B), there is partial resolution of the acute inflammation with extensive fibrosis andearly evidence of dystrophic calcification of the necrotic lesions. In the late stages of infection (day 75 [E and F] and day 100 [G and H]), residualnecrotic foci have incomplete calcification with active inflammation and a second phase of acute inflammation and necrosis. In contrast, lesionnecrosis is limited and the lesions fail to progress in drug-treated animals but do progress in the control animals (I to R). Noncalcified lesionnecrosis is evident at day 50 (I and J) of infection, but the necrosis heals by fibrosis and incomplete calcification by day 100 (M and N). In contrastto the findings for the control animals, a normal lymph node architecture is partially retained to day 160 (Q and R), by which time all controlanimals had died due to progressive disease. By day 160 (�20 days after drug treatment was discontinued), lymph node lesions can again be foundto have extensive necrosis that is delineated from the more normal lymph node parenchyma by a thick fibrous capsule. Hematoxylin and eosinstaining. Magnifications: �10 (A to G and I to Q) and �20 (B to H and J to R).
VOL. 54, 2010 CHEMOTHERAPY OF TUBERCULOSIS IN GUINEA PIGS 1825
ingly, the levels of these cells slowly increased in the bloodthroughout the experiment.
In addition, we also assessed the levels of the selectin-likehoming receptor CT4 on both CD4 and CD8 T cells accumu-
lating in the lungs (Fig. 8D), lymph nodes (Fig. 8E), and blood(Fig. 8F). Figure 8D and E and G to I shows increased num-bers of CT4 cells on both CD4 and CD8 T cells in untreatedcontrol guinea pigs over the course of the infection. This was
FIG. 6. Lesion scores from lungs, lymph nodes, and spleens from representative infected guinea pigs receiving chemotherapy at each time point.(A) Lesion scores of lungs, lymph nodes, and spleens for the control animals (C) and the drug-treated animals (D) on days 25, 50, 75, 100, 125and 150 of infection. The pathology scores are the percentages of the areas of the lungs, lymph nodes, and spleens; and the results are expressedas the ratios of the pathology scores for each parameter. (B) A lung tissue specimen from an M. tuberculosis-infected guinea pig receivingchemotherapy for 125 days. A residual primary lung lesion is evidenced by central necrosis (C) (upper photograph) with dystrophic calcification.The lower photograph depicts the magnified region denoted by the square in the upper photograph showing persisting extracellular acid-fast-staining bacilli (arrows) within the central necrotic core of the primary lesion after treatment.
1826 ORDWAY ET AL. ANTIMICROB. AGENTS CHEMOTHER.
not seen on T cells harvested from the lungs of the drug-treated animals, but the CT4 levels on cells harvested fromthe lymph nodes rose and then fell again. Similarly, the bloodlevels of such cells remained static.
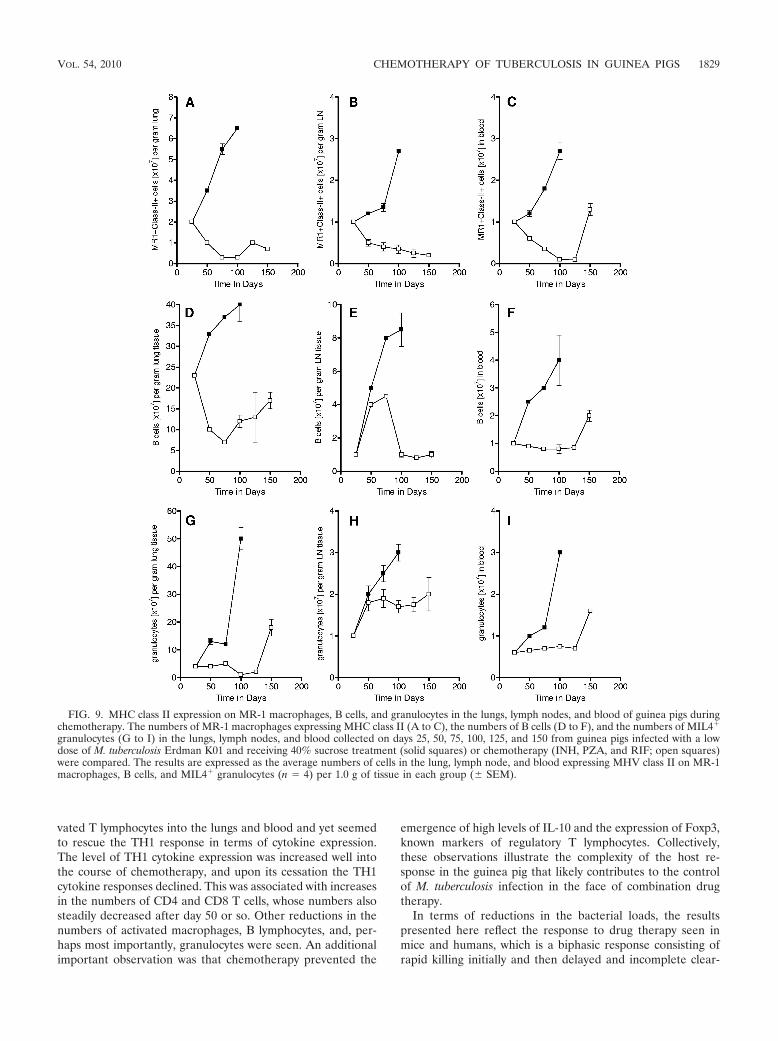
Influx of other leukocyte populations. In addition to theT-cell response, we also tracked the influx of MHC class II-positive macrophages into the lungs, lymph nodes, and blood.The levels of these macrophages increased progressively inuntreated animals but remained at low levels in guinea pigsreceiving drug therapy (Fig. 9A to C). Similar increases inB-lymphocyte levels were also seen in control animals (Fig. 9Dto F), consistent with our earlier observations (40). MIL4
granulocytes were also detected (Fig. 9 G to I); the levels ofthese cells began to rise sharply after 40 to 50 days as thelesions became necrotic, but their influx was prevented by theeffects of the chemotherapy.
Differential expression of cytokine and regulatory T-cell re-sponses. We used RT-PCR to track the expression of severalcytokines in each target organ over the course of the experi-ment. The TH1 cytokines IFN-�, IL-12, and TNF-� were eachrelatively poorly expressed in the control guinea pigs, althoughthe TNF-� levels spiked shortly before their death (Fig. 10A toC). In the treated groups, the levels of IFN-� rose sharply upto day 125, indicating that the drug treatment allowed theexpression of a sustained TH1 response, and upon the cessa-
tion of chemotherapy, the levels of the TH1 cytokines dropped.Similar kinetics were also observed for IL-12 and TNF-�. Wethen compared the profiles of these cytokines to those of threeother cytokines more associated with downregulation and/orthe control of inflammation. We observed that the TGF-�responses remained lower, although some TGF-� expressionwas seen and peaked on day 125, and IL-10 responses werealso kept at a minimum by the chemotherapy (Fig. 10D and E).The expression of Foxp3, a marker for regulatory T cells,increased sharply in the lungs of the Erdman K01-infectedcontrol guinea pigs (Fig. 10F) but was not detected in thedrug-treated animals.
DISCUSSION
Most studies that test the activities of conventional or newantituberculosis drugs in animals evaluate the responses totreatment primarily on the basis of the differences in tissuebacterial loads but rarely on the basis of other parameters. Inthis study, we achieved three important goals. First, we per-formed a comprehensive evaluation of the host response todrug therapy in the guinea pig model, in which the guinea pigsdevelop primary lesions with necrosis similar to those thatdevelop in naturally occurring infections in humans. Unlikeconventional mouse models of tuberculosis, immunologically
FIG. 7. CD4 and CD8 T-cell numbers in the lungs, lymph nodes, and blood of guinea pigs during chemotherapy. The numbers of CD4 and CD8T cells in the lungs, lymph nodes, and blood collected on days 25, 50, 75, 100, 125, and 150 from guinea pigs infected with a low dose of M.tuberculosis Erdman K01 and receiving 40% sucrose treatment (solid squares) or chemotherapy (INH, PZA, and RIF; open squares) werecompared. The results are expressed as the mean total number of cells in each tissue expressing CD4 or CD8 (n � 4) per 1.0 g of lung tissue ineach group (� SEM).
VOL. 54, 2010 CHEMOTHERAPY OF TUBERCULOSIS IN GUINEA PIGS 1827
naïve guinea pigs develop a variety of lesion types, includingprimary lesions with necrosis, that are relatively unaffected bycombination drug therapy. In addition, we quantified the re-sponse to drug therapy using advanced imaging methods, andthe findings obtained by those methods were validated by grossnecropsy and histologic evaluation at the time of necropsy.Finally, in this study, we correlated the resolution of pulmo-nary and extrapulmonary inflammation in response to combi-nation drug therapy with the temporal changes in tissue andcirculating inflammatory cell phenotypes and cytokine levels asa measure of acquired immunity.
The results of this study show that conventional chemother-apy with INH, RIF, and PZA rapidly reduced the bacterial
burden and the resulting pulmonary and extrapulmonary in-flammation induced by strain Erdman K01, a highly virulentstrain of M. tuberculosis, with most of the bacilli being elimi-nated within the first month of treatment. Despite the rapidkilling, small numbers of drug-tolerant bacteria could still berecovered in lung and other tissue homogenates after 3 to 4months of treatment. The ability to culture low numbers ofbacilli even following drug therapy correlated with the pres-ence of persistent lesions, especially partially healed primarylesions. Resolution of the majority of the granulomatous le-sions in the lungs could be clearly visualized by magnetic res-onance imaging at the macroscopic level. In terms of the hostimmune response, drug treatment reduced the influx of acti-
FIG. 8. Expression of activation markers and homing receptors on CD4 and CD8 T cells in the lungs, lymph nodes, and blood of guinea pigsduring chemotherapy. The numbers of CD4 T cells expressing CD45 (A to C), the numbers of CD4 T cells expressing CT4 (D to F), and thenumbers of CD8 T cells expressing CT4 cells (G to I) in the lungs, lymph nodes, and blood collected on days 25, 50, 75, 100, 125, and 150 fromguinea pigs infected with a low dose of M. tuberculosis Erdman K01 and receiving 40% sucrose treatment (solid squares) or chemotherapy (INH,PZA, and RIF; open squares) were compared. The results are expressed as the average total number of cells expressing CD4 CD45, CD4 CT4,or CD8 CT4 (n � 4) per 1.0 g of each tissue in each group (� SEM).
1828 ORDWAY ET AL. ANTIMICROB. AGENTS CHEMOTHER.
vated T lymphocytes into the lungs and blood and yet seemedto rescue the TH1 response in terms of cytokine expression.The level of TH1 cytokine expression was increased well intothe course of chemotherapy, and upon its cessation the TH1cytokine responses declined. This was associated with increasesin the numbers of CD4 and CD8 T cells, whose numbers alsosteadily decreased after day 50 or so. Other reductions in thenumbers of activated macrophages, B lymphocytes, and, per-haps most importantly, granulocytes were seen. An additionalimportant observation was that chemotherapy prevented the
emergence of high levels of IL-10 and the expression of Foxp3,known markers of regulatory T lymphocytes. Collectively,these observations illustrate the complexity of the host re-sponse in the guinea pig that likely contributes to the controlof M. tuberculosis infection in the face of combination drugtherapy.
In terms of reductions in the bacterial loads, the resultspresented here reflect the response to drug therapy seen inmice and humans, which is a biphasic response consisting ofrapid killing initially and then delayed and incomplete clear-
FIG. 9. MHC class II expression on MR-1 macrophages, B cells, and granulocytes in the lungs, lymph nodes, and blood of guinea pigs duringchemotherapy. The numbers of MR-1 macrophages expressing MHC class II (A to C), the numbers of B cells (D to F), and the numbers of MIL4
granulocytes (G to I) in the lungs, lymph nodes, and blood collected on days 25, 50, 75, 100, 125, and 150 from guinea pigs infected with a lowdose of M. tuberculosis Erdman K01 and receiving 40% sucrose treatment (solid squares) or chemotherapy (INH, PZA, and RIF; open squares)were compared. The results are expressed as the average numbers of cells in the lung, lymph node, and blood expressing MHV class II on MR-1macrophages, B cells, and MIL4 granulocytes (n � 4) per 1.0 g of tissue in each group (� SEM).
VOL. 54, 2010 CHEMOTHERAPY OF TUBERCULOSIS IN GUINEA PIGS 1829

ance from tissue (30). The first stage is generally thought torepresent the rapidly sterilizing activity of INH, RIF, and PZAtreatment against replicating bacilli (9, 35), but a thoroughexplanation for the second phase remains elusive. One possibleexplanation is that the residual bacteria are drug tolerant andare cleared less effectively because a minor population hasswitched to a nonreplicating state or bacilli have spontaneousmutations that render them drug resistant (20).
The central practical issue here, however, is whether a par-ticular regimen is sterilizing, defined as complete eradicationof the infection and, thus, there is no potential for diseaserelapse (21). In conventional methods for determining thecolony counts in tissues with confidence, particularly tissuescontaining low numbers of bacilli, the entire organ must beavailable for plating of undiluted tissue homogenates. Inter-pretation of the results for such homogenates on solid agarmay be subject to error, since incomplete homogenization maynot adequately disperse aggregates of bacilli. This factor, com-bined with the poor recovery of difficult-to-culture bacilli, canlead to an underestimate of the numbers of CFU, particularlywhen bacilli are present in low numbers. Because of this lim-itation, one can argue that estimates of the numbers of CFUwhen bacilli are present at low numbers may be statisticallyunderpowered (29). This may be further complicated by newevidence that M. tuberculosis can enter a biofilm-like state (37);
thus, it may not grow planktonically and therefore not formmeasurable colonies on agar.
There is an increasing interest in the application of advancedimaging techniques to evaluate the effects of chemotherapy(12). We have previously obtained ex vivo magnetic resonanceimages to monitor changes in lesion numbers and size in M.bovis BCG-vaccinated and nonvaccinated guinea pigs infectedwith M. tuberculosis (28). Because MRI under biosafety level 3containment is not yet available, we are limited to test theproof of principle with specimens that have been fixed byperfusion and in which the bacilli have been inactivated. None-theless, these data accurately reflect the whole-lung lesion bur-den, as validated histologically, and in addition provide athree-dimensional appreciation of the lesion distribution.Thus, the data obtained by imaging techniques can provide auseful adjunct to the data obtained by more traditional meth-ods. In vivo MRI is expected to provide a sensitive means ofmonitoring the progression and resolution of lung granulomasand lymphadenomegaly due to its excellent inherent ability toprovide contrast for soft tissue and the recent technologicaladvances that now enable ultrafast thoracic imaging as a meansof noninvasive longitudinal monitoring of vaccine and treat-ment efficacy.
A major advantage of the use of the guinea pig as a modelof human tuberculosis is the consistent development of pri-
FIG. 10. Cytokine mRNA expression in guinea pig lung cells during chemotherapy. The levels of expression of mRNA for IFN-� (A), IL-12p40(B), TNF-� (C), TGF-� (D), IL-10 (E), and Foxp3 (F) in the lung tissues collected on days 25, 50, 100, 125, and 150 from guinea pigs receiving40% sucrose treatment (solid squares) or chemotherapy (INH, PZA, and RIF; open squares) were compared. Cytokine mRNA expression wasquantified by real-time reverse transcription-PCR. The fold induction of mRNA was calculated from the CT values normalized to the CT valuesfor HPRT and then to the values for uninfected guinea pig lung cells. The results are expressed as the average (n � 4) of the fold induction ineach group (� SEM).
1830 ORDWAY ET AL. ANTIMICROB. AGENTS CHEMOTHER.
mary lesions with central caseous necrosis, similar to one of themorphological features of the naturally occurring disease inhumans (3, 32, 33, 36). In this regard, it can be argued that theefficacy of a given chemotherapeutic regimen is a reflection ofits capacity to resolve this important lesion type. Our resultspresented here demonstrate that while treatment with INH,RIF, and PZA effectively clears lymphocytic nonnecrotizingsecondary lung lesions, even aggressive combination chemo-therapy did not completely resolve primary lesions with necro-sis. We hypothesize that the association of extracellular bacilliwith the necrotic host debris in primary lesions represents abarrier to the cellular immune response and drug therapy. Wefurther suggest that the biological significance of these persist-ing populations resides in evidence that after sterilizing drugtherapy, secondary lesions which never form necrosis are curedand devoid of acid-fast-staining bacilli, while primary lesionswhich contain necrosis are a potential source of reactivationdisease in the guinea pig model. We propose that specificquantification of residual lesions by the methods describedhere could provide a specific measure of the efficacies of newdrug regimens in this relevant small-animal model.
One of the most intriguing findings of the current studieswas that the residual primary lesions that existed followingcombination drug therapy were those associated with pulmo-nary lymphatic vessels. We subsequently demonstrated thatthis is a consistent finding (4) in guinea pigs infected by use ofa low-dose aerosol, a model that closely mimics the naturalroute of infection in humans. We previously noted that gran-ulomatous inflammation of the lymphatics results in segmentalblockage and is a previously unappreciated but major elementof the disease in the context of persistence (3). Given thestructural nature of these vessels, which are embedded in theperivascular and peribronchial connective tissue matrix, per-sisting bacilli not only could be trapped inside these lesions butalso could be trapped there for decades in humans because ofthe poor vascularity and relative isolation from the functionalpulmonary parenchyma. The significance of this lesion in thenaturally occurring disease in humans is still not fully appre-ciated but is suggested by recent three-dimensional reconstruc-tions of lesions from patients that show a distinct tubular mor-phology consistent with lymphangitis (C. Barry, personalcommunication).
To date, the effects of the removal of the infection by che-motherapy on the immunological status of the animal has notbeen addressed, not even in the widely used mouse model, yetthis seems to be very important, because the status of the T-cellresponse not only should be expected to influence the rate ofclearance of the infection but also should have obvious conse-quences if residual bacilli begin to reactivate and produceantigen. In the current study, we monitored the status of theimmune response in the lungs during the course of the infec-tion using a newly developed flow cytometry protocol (40) andRT-PCR. Our results show that by reversing the progression ofdisease in the lung and blood with chemotherapy, the chemo-tactic stimulus for activated T cells and macrophages was re-duced during the early and chronic stages of disease, consistentwith the histopathology evidence. Interestingly, during theearly stage of drug treatment, increased numbers of activatedT cells migrated into the lymph nodes and then declined there-after. We have previously shown (3, 6) that during subacute
infection in control animals the lymph node tissue is destroyedand that it is likely that antigen presentation is therefore hin-dered. During the beginning of chemotherapy, bacterial deathand antigen release occur, and so the early increase in thenumbers of T cells in the lymph nodes may represent resumedantigen presentation permitted by organ tissue healing. In ad-dition, and importantly, the influx of MIL4 granulocytes,which is strongly associated with the appearance of necrosis(40), was completely prevented. Despite the apparent damp-ening of acquired immunity, we observed significant increasesin the levels of the TH1-associated cytokines IFN-�, IL-12, andTNF-� using RT-PCR. A recent report demonstrated thatPZA treatment of murine cutaneous leishmaniasis results in a100-fold reduction in the parasite burden and increased mac-rophage activation and TH1 cytokine levels (34). It is apparentfrom the findings of our studies that the cessation of chemo-therapy, including PZA therapy, resulted in a decline in TH1immunity, supporting the findings of that recent study. Overall,this seems to suggest that destruction of the bacilli provides asubstantial source of antigens that allows expansion of TH1immunity, something that we previously demonstrated (40)was lost in the lungs of untreated animals after about day 30 ofthe infection. This establishment of this T-cell response shouldconceivably involve an element of memory immunity and thusaffect the ability of the host to respond to reactivation orsecondary exogenous reexposure.
Many M. tuberculosis strains of high virulence, including theErdman K01 strain, are potent inducers of CD4 CD25hi
Foxp3 regulatory T cells (38). We demonstrate here thatchemotherapy negated the expression of Foxp3 regulatory Tcells and IL-10 in the lungs of treated guinea pigs. The role ofregulatory T cells in tuberculosis may be associated with areduction in the level of pulmonary inflammation, as previ-ously demonstrated in the mouse model (38). Therefore, theremoval of pulmonary inflammation by chemotherapy may sig-nificantly reduce the involvement of regulatory T cells, whichmay be an obvious benefit.
Finally, this study presented us with some serious challengesin animal husbandry, none of which were trivial. In addition totheir intrinsic susceptibility to tuberculosis, guinea pigs areeasily stressed. Because of this, we believed that it was impor-tant to avoid as far as possible any degree of restraint or forceddrug feeding. Guinea pigs are easily conditioned, however, andwe were able to acclimate the animals to gentle handling andvoluntary feeding via a pipette. Two major additional prob-lems, however, were (i) that at about 2 weeks after infection,the animals started to develop fevers, and (ii) once the drugswere introduced into the 40% sucrose delivery vehicle, onecould soon notice both behavioral and physical issues probablyrelated to the toxic effects of the drugs on the normal gastro-intestinal flora. The primary consequence of this was that theguinea pigs became lethargic and had reduced feed intake. Wewere able to very successfully alleviate these problems by gen-tly feeding the animals a mixture of drugs given in sucrose tomask the taste, a highly nutritious vegetable puree, a Lactoba-cillus preparation, and a vitamin C supplement. The animalsreadily ingested this formulation without any need for forcedfeeding or restraint.
In summary, in the present study, the guinea pig was shownto be a potentially useful model for evaluation of the effects of
VOL. 54, 2010 CHEMOTHERAPY OF TUBERCULOSIS IN GUINEA PIGS 1831

chemotherapy on the important necrotic lesion types that areseen in humans with naturally occurring disease. We havedeveloped a number of ways to monitor both the efficacy andthe effects of chemotherapy which could give important newinformation not only about the efficacy of the drug itself butalso about how the host response adapts at both the patholog-ical and the immunological levels. Moreover, given the ex-treme pathology caused by newly emerging strains of M. tuber-culosis, including W-Beijing and multidrug-resistant isolates,recently demonstrated (41) in this model, we propose thatguinea pigs be used to evaluate new regimens addressing theseserious developments in the clinical field.
ACKNOWLEDGMENTS
This study was supported by a generous grant from the Bill andMelinda Gates Foundation.
We thank Charles Peloquin for his help with performing the phar-macokinetic and pharmacodynamic determinations to identify the cor-rect drug doses in vivo.
REFERENCES
1. Allen, S. S., and D. N. McMurray. 2003. Coordinate cytokine gene expres-sion in vivo following induction of tuberculous pleurisy in guinea pigs. Infect.Immun. 71:4271–4277.
2. Aziz, M. A., A. Wright, A. Laszlo, A. De Muynck, F. Portaels, A. Van Deun,C. Wells, P. Nunn, L. Blanc, and M. Raviglione. 2006. Epidemiology ofantituberculosis drug resistance (the Global Project on Anti-TuberculosisDrug Resistance Surveillance): an updated analysis. Lancet 368:2142–2154.
3. Basaraba, R. J. 2008. Experimental tuberculosis: the role of comparativepathology in the discovery of improved tuberculosis treatment strategies.Tuberculosis (Edinb.) 88(Suppl. 1):S35–S47.
4. Basaraba, R. J., D. D. Dailey, C. T. McFarland, C. A. Shanley, E. E. Smith,D. N. McMurray, and I. M. Orme. 2006. Lymphadenitis as a major elementof disease in the guinea pig model of tuberculosis. Tuberculosis (Edinb.)86:386–394.
5. Basaraba, R. J., A. A. Izzo, L. Brandt, and I. M. Orme. 2006. Decreasedsurvival of guinea pigs infected with Mycobacterium tuberculosis after mul-tiple BCG vaccinations. Vaccine 24:280–286.
6. Basaraba, R. J., E. E. Smith, C. A. Shanley, and I. M. Orme. 2006. Pulmo-nary lymphatics are primary sites of Mycobacterium tuberculosis infection inguinea pigs infected by aerosol. Infect. Immun. 74:5397–5401.
7. Basu, S., and A. P. Galvani. 2007. Extensively drug-resistant tuberculosis inSouth Africa. Lancet 369:272–273.
8. Bifani, P., B. Mathema, N. Kurepina, E. Shashkina, J. Bertout, A. S. Blan-chis, S. Moghazeh, J. Driscoll, B. Gicquel, R. Frothingham, and B. N.Kreiswirth. 2008. The evolution of drug resistance in Mycobacterium tuber-culosis: from a mono-rifampin-resistant cluster into increasingly multidrug-resistant variants in an HIV-seropositive population. J. Infect. Dis. 198:90–94.
9. Botha, F. J., F. A. Sirgel, D. P. Parkin, B. W. van de Wal, P. R. Donald, andD. A. Mitchison. 1996. Early bactericidal activity of ethambutol, pyrazin-amide and the fixed combination of isoniazid, rifampicin and pyrazinamide(Rifater) in patients with pulmonary tuberculosis. S. Afr. Med. J. 86:155–158.
10. Cho, H., T. M. Lasco, S. S. Allen, T. Yoshimura, and D. N. McMurray. 2005.Recombinant guinea pig tumor necrosis factor alpha stimulates the expres-sion of interleukin-12 and the inhibition of Mycobacterium tuberculosisgrowth in macrophages. Infect. Immun. 73:1367–1376.
11. Cohen, T., C. Colijn, A. Wright, M. Zignol, A. Pym, and M. Murray. 2008.Challenges in estimating the total burden of drug-resistant tuberculosis.Am. J. Respir. Crit. Care Med. 177:1302–1306.
12. Davis, S. L., E. L. Nuermberger, P. Um, C. Vidal, B. Jedynak, M. G. Pomper,W. R. Bishai, and S. K. Jain. 2009. Noninvasive pulmonary [18F]-2-fluoro-deoxy-D-glucose positron emission tomography correlates with bactericidalactivity of tuberculosis drug treatment. Antimicrob. Agents Chemother. 53:4879–4884.
13. Dye, C. 2006. Global epidemiology of tuberculosis. Lancet 367:938–940.14. Dye, C., D. Maher, D. Weil, M. Espinal, and M. Raviglione. 2006. Targets for
global tuberculosis control. Int. J. Tuber. Lung Dis. 10:460–462.15. Dye, C., C. J. Watt, D. M. Bleed, S. M. Hosseini, and M. C. Raviglione. 2005.
Evolution of tuberculosis control and prospects for reducing tuberculosisincidence, prevalence, and deaths globally. JAMA 293:2767–2775.
16. Espinal, M. A., and C. Dye. 2005 Can DOTS control multidrug-resistanttuberculosis? Lancet 365:1206–1209.
17. Gandhi, N. R., A. Moll, A. W. Sturm, R. Pawinski, T. Govender, U. Lalloo,K. Zeller, J. Andrews, and G. Friedland. 2006. Extensively drug-resistant
tuberculosis as a cause of death in patients co-infected with tuberculosis andHIV in a rural area of South Africa. Lancet 368:1575–1580.
18. Ginsberg, A. M., and M. Spigelman. 2007. Challenges in tuberculosis drugresearch and development. Nat. Med. 13:290–294.
19. Githui, W. A. 2006. Multi drug resistant tuberculosis. East Afr. Med. J.83:585–587.
20. Gomez, J. E., and J. D. McKinney. 2004. M. tuberculosis persistence, latency,and drug tolerance. Tuberculosis (Edinb.) 84:29–44.
21. Grosset, J. 1978. The sterilizing value of rifampicin and pyrazinamide inexperimental short-course chemotherapy. Bull. Int. Union Tuberc. 53:5–12.
22. Harries, A. D., and C. Dye. 2006 Tuberculosis. Ann. Trop. Med. Parasitol.100:415–431.
23. Hart, I. J., H. Schafer, R. J. Scheper, and G. T. Stevenson. 1992. Subpopu-lations of guinea-pig T lymphocytes defined by isoforms of the leucocytecommon antigen. Immunology 77:377–384.
24. Haverson, K., M. Bailey, V. R. Higgins, P. W. Bland, and C. R. Stokes. 1994.Characterization of monoclonal antibodies specific for monocytes, macro-phages and granulocytes from porcine peripheral blood and mucosal tissues.J. Immunol. Methods 170:233–245.
25. Hiromatsu, K., C. C. Dascher, M. Sugita, C. Gingrich-Baker, S. M. Behar,K. P. LeClair, M. B. Brenner, and S. A. Porcelli. 2002. Characterization ofguinea-pig group 1 CD1 proteins. Immunology 106:159–172.
26. Hoff, D. R., M. L. Caraway, E. J. Brooks, E. R. Driver, G. J. Ryan, C. A.Peloquin, I. M. Orme, R. J. Basaraba, and A. J. Lenaerts. 2008. Metroni-dazole lacks antibacterial activity in guinea pigs infected with Mycobacte-rium tuberculosis. Antimicrob. Agents Chemother. 52:4137–4140.
27. Kraal, G., R. Shiamatey-Koolma, M. Hoffer, D. Baker, and R. Scheper. 1988.Histochemical identification of guinea-pig macrophages by monoclonal an-tibody MR-1. Immunology 65:523–528.
28. Kraft, S. L., D. Dailey, M. Kovach, K. L. Stasiak, J. Bennett, C. T. Mc-Farland, D. N. McMurray, A. A. Izzo, I. M. Orme, and R. J. Basaraba. 2004.Magnetic resonance imaging of pulmonary lesions in guinea pigs infectedwith Mycobacterium tuberculosis. Infect. Immun. 72:5963–5971.
29. Lenaerts, A. J., P. L. Chapman, and I. M. Orme. 2004. Statistical limitationsto the Cornell model of latent tuberculosis infection for the study of relapserates. Tuberculosis (Edinb.) 84:361–364.
30. Lenaerts, A. J., M. A. Degroote, and I. M. Orme. 2008. Preclinical testingof new drugs for tuberculosis: current challenges. Trends Microbiol.16:48–54.
31. Lenaerts, A. J., D. Hoff, S. Aly, S. Ehlers, K. Andries, L. Cantarero, I. M.Orme, and R. J. Basaraba. 2007. Location of persisting mycobacteria in aguinea pig model of tuberculosis revealed by r207910. Antimicrob. AgentsChemother. 51:3338–3345.
32. McMurray, D. N. 2001. Disease model: pulmonary tuberculosis. Trends Mol.Med. 7:135–137.
33. McMurray, D. N., S. S. Allen, A. Jeevan, T. Lasco, H. Cho, T. Skwor, T.Yamamoto, C. McFarland, and T. Yoshimura. 2005. Vaccine-induced cyto-kine responses in a guinea pig model of pulmonary tuberculosis. Tubercu-losis (Edinb.) 85:295–301.
34. Mendez, S., R. Traslavina, M. Hinchman, L. Huang, P. Green, M. H. Cyna-mon, and J. T. Welch. 2009. The antituberculosis drug pyrazinamide affectsthe course of cutaneous leishmaniasis in vivo and increases activation ofmacrophages and dendritic cells. Antimicrob. Agents Chemother. 53:5114–5121.
35. Mitchison, D. A. 1996. Pyrazinamide—on the antituberculosis drug frontline.Nat. Med. 2:635–636.
36. Mitsuyama, M., and D. N. McMurray. 2007. Tuberculosis: vaccine and drugdevelopment. Tuberculosis (Edinb.) 87(Suppl. 1):S10–S13.
37. Ojha, A. K., A. D. Baughn, D. Sambandan, T. Hsu, X. Trivelli, Y. Guer-ardel, A. Alahari, L. Kremer, W. R. Jacobs, Jr., and G. F. Hatfull. 2008.Growth of Mycobacterium tuberculosis biofilms containing free mycolicacids and harbouring drug-tolerant bacteria. Mol. Microbiol. 69:164–174.
38. Ordway, D., M. Henao-Tamayo, M. Harton, G. Palanisamy, J. Troudt, C.Shanley, R. J. Basaraba, and I. M. Orme. 2007. The hypervirulent Myco-bacterium tuberculosis strain HN878 induces a potent TH1 response fol-lowed by rapid down-regulation. J. Immunol. 179:522–531.
39. Ordway, D., M. Henao-Tamayo, C. Shanley, E. E. Smith, G. Palanisamy, B.Wang, R. J. Basaraba, and I. M. Orme. 2008. Influence of Mycobacteriumbovis BCG vaccination on cellular immune response of guinea pigs chal-lenged with Mycobacterium tuberculosis. Clin. Vaccine Immunol. 15:1248–1258.
40. Ordway, D., G. Palanisamy, M. Henao-Tamayo, E. E. Smith, C. Shanley,I. M. Orme, and R. J. Basaraba. 2007. The cellular immune response toMycobacterium tuberculosis infection in the guinea pig. J. Immunol. 179:2532–2541.
41. Palanisamy, G. S., N. DuTeau, K. D. Eisenach, D. M. Cave, S. A. Theus, B. N.Kreiswirth, R. J. Basaraba, and I. M. Orme. 2009. Clinical strains ofMycobacterium tuberculosis display a wide range of virulence in guinea pigs.Tuberculosis (Edinb.) 89:203–209.
42. Spigelman, M., and S. Gillespie. 2006. Tuberculosis drug development pipe-line: progress and hope. Lancet 367:945–947.
1832 ORDWAY ET AL. ANTIMICROB. AGENTS CHEMOTHER.

43. Spigelman, M. K. 2007. New tuberculosis therapeutics: a growing pipeline.J. Infect. Dis. 196(Suppl. 1):S28–S34.
44. Takizawa, M., J. Chiba, S. Haga, T. Asano, T. Yamazaki, N. Yamamoto, and M.Honda. 2006. Novel two-parameter flow cytometry (MIL4/SSC followed byMIL4/CT7) allows for identification of five fractions of guinea pig leukocytes inperipheral blood and lymphoid organs. J. Immunol. Methods 311:47–56.
45. Tan, B. T., F. Ekelaar, J. Luirink, G. Rimmelzwaan, A. J. De Jonge, and R. J.
Scheper. 1985. Production of monoclonal antibodies defining guinea pigT-cell surface markers and a strain 13 Ia-like antigen: the value of immu-nohistological screening. Hybridoma 4:115–124.
46. Wilcox, C. E., D. Baker, C. Butter, D. A. Willoughby, and J. L. Turk. 1989.Differential expression of guinea pig class II major histocompatibility com-plex antigens on vascular endothelial cells in vitro and in experimentalallergic encephalomyelitis. Cell. Immunol. 120:82–91.
VOL. 54, 2010 CHEMOTHERAPY OF TUBERCULOSIS IN GUINEA PIGS 1833
Top Related
Copyright © 2022 FDOKUMEN

