


Bahasa
Halaman
Hukum


Eustatic and hydrodynamic controls on the architectureof a deep shelf sand bank (Celtic Sea)
JEAN-YVES REYNAUD*1, BERNADETTE TESSIER*2, JEAN-NOEÈ L PROUST , ROBERTDALRYMPLEà , TANIA MARSSET§, MARC DE BATIST± , JEAN-FRANCË OIS BOURILLETàand GILLES LERICOLAISà*Laboratoire de SeÂdimentologie et GeÂodynamique. Universite des Sciences et Techniques de Lille, 59655Villeneuve d'Ascq CeÂdex, France (E-mail: [email protected]; [email protected]; Jean-NoeÈ[email protected]) GeÂosciences Rennes, UPR 4661 CNRS, Universite de Rennes 1, Campus de Beaulieu, 35042 Rennes,France.àDepartment of Geological Sciences, Queen's University, Kingston, Ontario, K7L 3N6, Canada(E-Mail: [email protected])§Institut FrancËais de Recherche pour l'Exploitation de la Mer (IFREMER), DeÂpartement GeÂosciencesMarines, BP 70-29280, Plouzane CeÂdex, France(E-Mail: [email protected]; [email protected]; [email protected])±Renard Centre of Marine Geology, Seismostratigraphy Set, University of Gent, Krijgslaan 281, S8 B 9000Gent, Belgium (E-Mail: [email protected])
ABSTRACT
The architecture of a tidal sand bank in the south-eastern Celtic Sea was
examined using very high-resolution seismic surveys. The bank comprises four
depositional units. The lowest unit 1 is characterized by gently dipping (1±8°)strata that strike parallel to the length of the bank. Unit 1 is erosionally overlain
by unit 2, which forms the bulk of the bank. This unit consists of stacked sets of
downcurrent-dipping (7±12°) master bedding formed by climbing, sinuous-
crested tidal dunes that are up to 20 m high. These deposits are locally incised
by an anastomosed channel network (unit 3) that may represent a buried
swatchway system. The upper part of the bank comprises wave-related
deposits that are mainly preserved on the bank ¯anks (unit 4). The outer bank
surface is erosional. The bank is believed to have formed during the last post-
glacial sea-level rise. The facies evolution from unit 1 to unit 3 indicates an
upward increase in tidal energy, mainly characterized by the thickening of
dune cross-bed sets in unit 2. The majority of bank growth is inferred to have
occurred in water depths of the order of 60 m. This evolution was controlled by
relative sea-level rise, which is likely to have caused an episode of tidal
resonance with associated strong tidal currents that were responsible for the
incision of the deep, cross-cutting channels of unit 3. The transition to wave-
dominated sedimentation in unit 4 is related to the decay of resonance with
continued sea-level rise.
Keywords Banks, Celtic Sea, ocean waves, sand, seismic stratigraphy, tidal
currents.
INTRODUCTION
Offshore tidal sand banks are created by tidalprocesses acting on unconsolidated sedimentover a long period of time (Van Veen, 1936).Among the processes listed by Pattiaratchi &
1Present addresses: Laboratoire de GeÂologie MuseÂumNational d'Histoire Naturelle, 43 rue Buffon, 75 000Paris, France.2Laboratoire de Morphodynamique Continentale etCotieÁre, UPRES-A 6143 CNRS, Universite de Caen, 24rue des Tilleuls, 14 000 Caen, France.
Sedimentology (1999) 46, 703±721
Ó 1999 International Association of Sedimentologists 703
Collins (1987), the most important involve theacceleration of tidal ¯ows across the bank crest(Smith, 1970) and the trapping of sand in eddiescaused by the interplay of the reversing tidalcurrents and the Coriolis effect (Zimmerman,1981; Huthnance, 1982a,b; Hulscher et al.,1993). The growing bank triggers feedback effectson the ¯ows across it, which may in turn erodeunconsolidated interbank areas, forming troughs.The simplest case results in a depositional sandbank resting unconformably on a ¯at surface. Assynthesized by Stride et al. (1982), such a bank isbelieved to contain a simple set of lateral accre-tion bedding formed by deposition on one ¯ank.This has been observed in re¯ection seismicstudies (e.g. Houbolt, 1968; Lapierre, 1975; Yang& Sun, 1988) and is in accordance with models ofbank migration (Caston, 1972; Kenyon et al.,1981; Stride et al., 1982; Collins et al., 1995).
In several examples, however, the processesresponsible for bank growth have led to a morecomplex bank structure, comprising, at its top, anaccumulation of shelf sand and, at its base, anerosional remnant of older deposits left behind bytidal scour. This is the case for transgressivebanks that have evolved from coastal and estua-rine complexes (Swift, 1975; Swift & Thorne,1991; Dalrymple, 1992; Berne et al., 1994). Forexample, the Flemish banks (NW Europe) are
composed of ¯uvio-estuarine, barrier and ebbdelta deposits, capped by offshore tidal dunedeposits (Berne et al., 1994). These transgressivedeposits are then reworked sur®cially by stormwave action as the constructional tidal forcesbecome weaker because of continued sea-levelrise (Stride et al., 1982; Swift & Thorne, 1991). Inother cases, the bank stratigraphy could recordsea-level falls (Berne et al., 1998). In all suchcases, the bank stratigraphy is more complex andre¯ects bank evolution in response to changingsea level.
Until now, however, the number of well-docu-mented examples of bank stratigraphy has beenvery small, mainly because of the relatively poorresolution of previous re¯ection seismic data andthe dif®culty of recovering complete cores. Thispaper provides new data on the internal structureof a complex tidal sand bank from the Celtic Seabanks (Fig. 1). The very high-resolution seismicdata described herein allow us to reconstruct theinternal architecture of one of these banks precise-ly and provide new insights into its growth history.
BACKGROUND
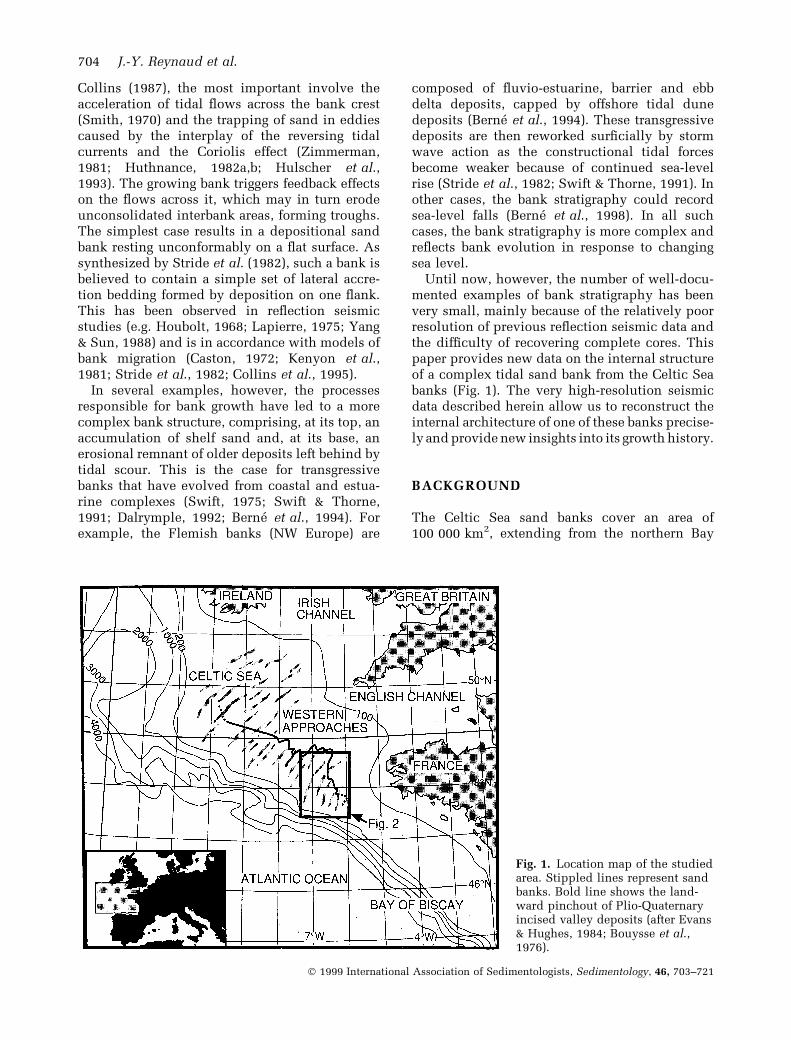
The Celtic Sea sand banks cover an area of100 000 km2, extending from the northern Bay
Fig. 1. Location map of the studiedarea. Stippled lines represent sandbanks. Bold line shows the land-ward pinchout of Plio-Quaternaryincised valley deposits (after Evans& Hughes, 1984; Bouysse et al.,1976).
704 J.-Y. Reynaud et al.
Ó 1999 International Association of Sedimentologists, Sedimentology, 46, 703±721
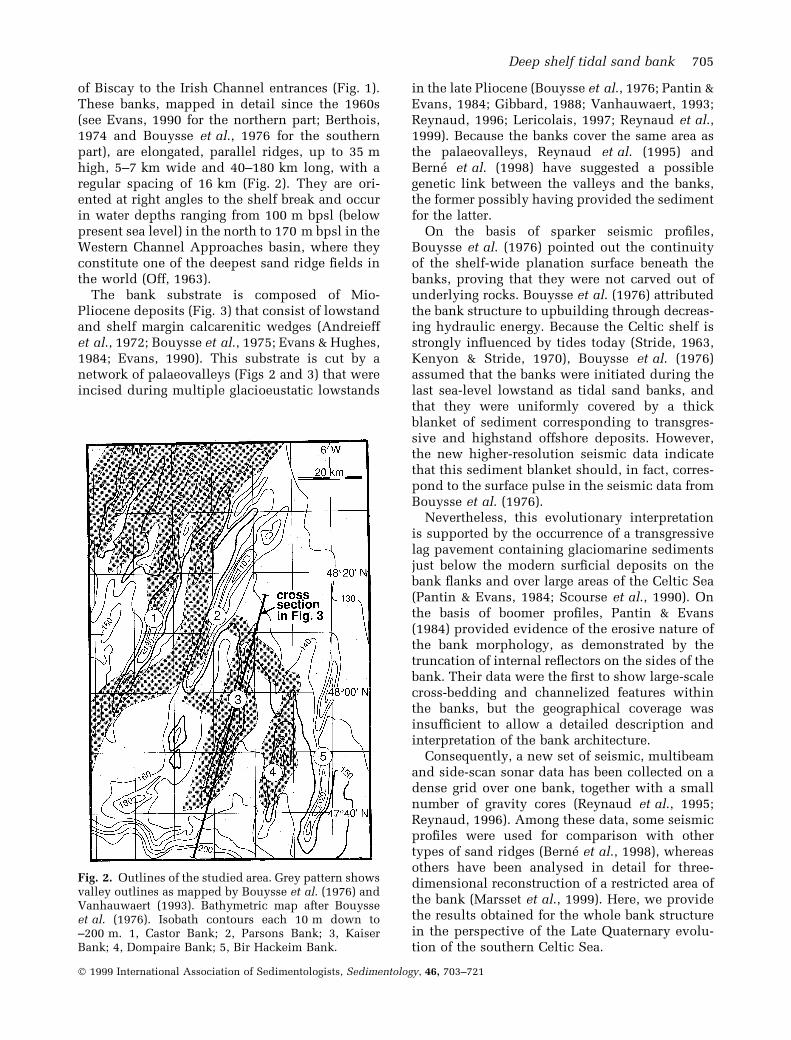
of Biscay to the Irish Channel entrances (Fig. 1).These banks, mapped in detail since the 1960s(see Evans, 1990 for the northern part; Berthois,1974 and Bouysse et al., 1976 for the southernpart), are elongated, parallel ridges, up to 35 mhigh, 5±7 km wide and 40±180 km long, with aregular spacing of 16 km (Fig. 2). They are ori-ented at right angles to the shelf break and occurin water depths ranging from 100 m bpsl (belowpresent sea level) in the north to 170 m bpsl in theWestern Channel Approaches basin, where theyconstitute one of the deepest sand ridge ®elds inthe world (Off, 1963).
The bank substrate is composed of Mio-Pliocene deposits (Fig. 3) that consist of lowstandand shelf margin calcarenitic wedges (Andreieffet al., 1972; Bouysse et al., 1975; Evans & Hughes,1984; Evans, 1990). This substrate is cut by anetwork of palaeovalleys (Figs 2 and 3) that wereincised during multiple glacioeustatic lowstands
in the late Pliocene (Bouysse et al., 1976; Pantin &Evans, 1984; Gibbard, 1988; Vanhauwaert, 1993;Reynaud, 1996; Lericolais, 1997; Reynaud et al.,1999). Because the banks cover the same area asthe palaeovalleys, Reynaud et al. (1995) andBerne et al. (1998) have suggested a possiblegenetic link between the valleys and the banks,the former possibly having provided the sedimentfor the latter.
On the basis of sparker seismic pro®les,Bouysse et al. (1976) pointed out the continuityof the shelf-wide planation surface beneath thebanks, proving that they were not carved out ofunderlying rocks. Bouysse et al. (1976) attributedthe bank structure to upbuilding through decreas-ing hydraulic energy. Because the Celtic shelf isstrongly in¯uenced by tides today (Stride, 1963,Kenyon & Stride, 1970), Bouysse et al. (1976)assumed that the banks were initiated during thelast sea-level lowstand as tidal sand banks, andthat they were uniformly covered by a thickblanket of sediment corresponding to transgres-sive and highstand offshore deposits. However,the new higher-resolution seismic data indicatethat this sediment blanket should, in fact, corres-pond to the surface pulse in the seismic data fromBouysse et al. (1976).
Nevertheless, this evolutionary interpretationis supported by the occurrence of a transgressivelag pavement containing glaciomarine sedimentsjust below the modern sur®cial deposits on thebank ¯anks and over large areas of the Celtic Sea(Pantin & Evans, 1984; Scourse et al., 1990). Onthe basis of boomer pro®les, Pantin & Evans(1984) provided evidence of the erosive nature ofthe bank morphology, as demonstrated by thetruncation of internal re¯ectors on the sides of thebank. Their data were the ®rst to show large-scalecross-bedding and channelized features withinthe banks, but the geographical coverage wasinsuf®cient to allow a detailed description andinterpretation of the bank architecture.
Consequently, a new set of seismic, multibeamand side-scan sonar data has been collected on adense grid over one bank, together with a smallnumber of gravity cores (Reynaud et al., 1995;Reynaud, 1996). Among these data, some seismicpro®les were used for comparison with othertypes of sand ridges (Berne et al., 1998), whereasothers have been analysed in detail for three-dimensional reconstruction of a restricted area ofthe bank (Marsset et al., 1999). Here, we providethe results obtained for the whole bank structurein the perspective of the Late Quaternary evolu-tion of the southern Celtic Sea.
Fig. 2. Outlines of the studied area. Grey pattern showsvalley outlines as mapped by Bouysse et al. (1976) andVanhauwaert (1993). Bathymetric map after Bouysseet al. (1976). Isobath contours each 10 m down to±200 m. 1, Castor Bank; 2, Parsons Bank; 3, KaiserBank; 4, Dompaire Bank; 5, Bir Hackeim Bank.
Deep shelf tidal sand bank 705
Ó 1999 International Association of Sedimentologists, Sedimentology, 46, 703±721

DATABASE
The chosen study area is the Kaiser-I-Hind (orKaiser) Bank, located in the south-eastern part ofthe Celtic Sea (Figs 1 and 2). About 1500 km ofSIMRAD EM12 and EM1000 multibeam echosounder and very high-resolution seismicpro®les were shot on a 400-m-square grid duringthree surveys in 1992, 1993 and 1994 (cam-paigns Belgica 92, SeÂdimanche 1 and 2, Belgica94; Fig. 4). These data were used to address thedetailed morphology (Fig. 5) and internal struc-ture (Figs 6 and 7) of the bank. The seismicdevice used was a SIG 1580A sparker, shootingat 1-s intervals with an energy of 700 J. Thereceiver was a single-channel streamer. Digitaldata were processed using the Elics Delph 2system (gain, bandpass ®lter, swell ®lter) andIFREMER SITHERE software (Lericolais et al., 1990,1994), providing a resolution of about 3 ms two-way travel time (twtt). The location of each shotwas calculated taking into account the distancebetween the receiver and the differential GPSship antenna, so that cross-over points betweenpro®les were located precisely. Our time±depthconversion assumes a constant sound velocity of1800 m s±1 in the sediment. The seismic sur-faces are described in terms of acoustic ampli-tude, frequency and continuity, as de®ned byAnstey (1977). In addition to the seismic data,six grab samples and six gravity cores (60±180 mlong) were collected from the bank surface(Fig. 4).
RESULTS
Geomorphology
The Kaiser Bank is 60 km long and 4±6 km wide(Fig. 5). Like most of the Celtic banks, it iscomposed of two linear segments of equal length,slightly oblique to each other, separated by a ¯atbathymetric low at 145 m bpsl (Fig. 5). Thenorthern segment of the bank is 15±35 m high,whereas the southern one, which is 30±50 mhigh, culminates at 115 m bpsl. In both segments,the bank is ¯at-topped at its higher locations.Elsewhere, the bank crest exhibits rounded,parallel undulations oriented 120° N (Fig. 5).The relief of these undulations increases towardsthe south, the southernmost of them being sepa-rated by 25-m-deep troughs (Fig. 5).
Seismic stratigraphy
Four architectural units are distinguished withinthe bank on the basis of stratal terminations anddifferences in internal characteristics (Fig. 6).Each unit is tens of metres thick, tens of kilometresin lateral extent and is elongated parallel to thebank axis (Fig. 7), with little geometric or faciesvariation along the length of the bank. They arebounded by erosional surfaces of high acousticamplitude and continuity. Each unit is composedof subunits that are metres to tens of metres thickand of the order of a kilometre in lateral extent.These subunits are referred to as `sets', becausethey are generally formed by migrating bedforms.Every set is bounded by erosional or conformablesurfaces of moderate to high acoustic amplitude
Fig. 3. Cross-section perpendicular to the shelf edge along the crest of the Kaiser Bank. Substratum structure afterVanhauwaert (1993).
706 J.-Y. Reynaud et al.
Ó 1999 International Association of Sedimentologists, Sedimentology, 46, 703±721

and variable continuity, and each set displays aconsistent architecture that is typical of the unit.The sets are not generally stacked vertically, butrather overlap each other laterally, so that the basalbounding surface of each unit is formed by thecoalescence of the set boundaries. The sets areinternally bedded, with seismic re¯ectors of mod-
erate to high acoustic amplitude that are paralleland conformable or display a slightly erosionalclinoform geometry. Less commonly, where the
Fig. 4. Seismic grid over Kaiser Bank. Stippled area isshallower than ±150 m. Bold lines and letters showlocation of seismic sections included herein.
Fig. 5. Bathymetric map of the Kaiser Bank, derivedfrom seismic and multibeam data SIMRAD EM12-EM1000. Contour interval 5 m (2á5 m inside multibeamboxes).
Deep shelf tidal sand bank 707
Ó 1999 International Association of Sedimentologists, Sedimentology, 46, 703±721

re¯ectors are of lower acoustic amplitude, theinternal structure is chaotic to transparent.
Unit 1
Description. Unit 1 is located below the lowerwestern ¯ank of the bank, except in the centrallower area and in the northernmost part of thebank (Fig. 7). The two parts of unit 1 formwedges elongated parallel to the bank axis.These wedges pinch out at the bank foot. Unit1 is 1±4 km wide and 5±18 m thick, mostlydeveloped in the southern bank segment(Fig. 7).
The lower bounding surface of the unit is are¯ector of medium to high acoustic amplitudeand low frequency. It is everywhere concaveupwards and dips towards the WNW, nearlyperpendicular to the bank axis, at a mean angle of0á5° (Fig. 8). It is formed by the coalescence of thelowest parts of set lower boundaries (Fig. 6B). Inits western part, the upper bounding surfacecorresponds to the outer bank surface; in itseastern part, it corresponds to the lower boundingsurface of unit 2 (Figs 7 and 8).
Unit 1 is made up of more than ®ve sets, each5±6 m thick. The set-bounding surfaces arere¯ectors of medium to high acoustic amplitudeand low to medium frequency (Fig. 8). These areslightly concave upwards erosional surfaces dip-ping 1±2° to the NW. In the southern banksegment, the sets are stacked on each other withan of¯apping relationship towards the NNW(Marsset et al., 1999). Each set is incised deeperthan the one below and truncates the north-westernmost part of the underlying set (Fig. 8).As a consequence, the youngest set scours morethan 5 m (Fig. 6B) into the in®ll of the underlyingincised valley (Figs 2 and 3).
The internal structure of the sets exhibits low-angle (1±8°, most often less than 3°) clinoforms ofmedium amplitude and high frequency that dipto the SW and downlap onto the base of the set(Fig. 8). The amplitude of these re¯ectors andtheir angle of dip increase from older to youngersets.
Interpretation. The NW dip of the set boundariesand the elongation of the unit parallel to thelength of the bank suggest that these deposits
Fig. 6. Synthetic longitudinal (A) and transverse (B) sections showing architecture of the Kaiser Bank. Surface slopesare exaggerated (´ 5±10 for all drawings). Note in (A), all units are displayed, although all may not appear together ona single cross-section along to the bank crest.
708 J.-Y. Reynaud et al.
Ó 1999 International Association of Sedimentologists, Sedimentology, 46, 703±721

were nucleated on the western ¯ank of an initialtidal sand bank that formed the core of thepresent-day bank. This type of low-angle beddingis similar to the large-scale lateral accretionfeatures observed in modern offshore tidal sandbanks (e.g. Houbolt, 1968; Lapierre, 1975; Yang &Sun, 1988) or interpreted from outcrop analogues(e.g. Rubino et al., 1985; Houthuys & Gullentrops,1988). The north-westward stacking of the setsinside the unit could be related to the landwardretreat of sediment sources during this initialstage of offshore bank build-up. The increasing
slope and scouring of the set boundaries throughunit 1 is attributed to increasing tidal scour in theinterbank area. The increasing seismic amplitudeof these surfaces presumably re¯ects an increas-ing lithological contrast at the base of the sets,perhaps because of the presence of lag deposits.
The dipping surfaces within the sets are inter-preted as the master bedding planes of climbing,superimposed dunes migrating to the north-eastunder the action of the (subordinate) ¯ood tidalcurrent, obliquely along and up the depositional(western) ¯ank of the bank. Their preservation
Fig. 7. Distribution of seismic units within Kaiser Bank. Open circles and numbers indicate the local thickness of theunit (in m). Isobaths every 10 m, deepest (bold) at 150 m below present sea level.
Fig. 8. Typical structure of unit 1(stipple). s, basal erosion surfaceof a set; i, internal progradationaldownlap; u, erosional unitbounding surface. Note that theset bases become more deeplyincised in the direction ofyounging. See Fig. 4 for pro®lelocation.
Deep shelf tidal sand bank 709
Ó 1999 International Association of Sedimentologists, Sedimentology, 46, 703±721

points to a short-term sediment transport andbank migration towards the SW under the actionof the (dominant) ebb tidal current, consistentwith the sand bank model of Houbolt (1968) andStride et al. (1982). It is remarkable that currentsinvolved in this interpretation are the same asthose observed at present in the study area, with atypical ebb dominance (Stride, 1963; Pingreeet al., 1982).
Unit 2
Description. Unit 2 constitutes the bulk of thebank. It forms a continuous lens-shaped body thatis elongated parallel to the bank axis (Fig. 7). Itseastern limit follows the eastern margin of thebank, whereas the western limit ends higher onthe western bank ¯ank. The width of unit 2 rangesfrom 3 km to 5 km. Its thickness ranges from 13 mto 35 m, increasing progressively to the south, butwith considerable thickness variations over shortdistances (Fig. 7).
The lower bounding surface of unit 2 is are¯ector of medium to high amplitude that dipstowards the ESE at a mean angle of 0á3°. Thissurface locally incises over 15 m into the under-lying incised valley deposits on the eastern sideof the bank (Fig. 9) and truncates unit 1 on its
western side (Figs 6A and 8). It is a polygeneticsurface formed by the coalescence of the basalsurfaces of the sets that constitute the unit(Fig. 6B). The upper bounding surface of unit 2generally corresponds to the lower boundary ofunit 4 (Fig. 10) or to the outer bank surface(Fig. 11).
Unit 2 is made up of numerous sharp-based,erosional sets. The thickness of these sets rangesfrom a few metres up to 20 m in the south(Fig. 10). The set-bounding surfaces are re¯ectorsof medium to high amplitude, which may locallydisappear, presumably because of the loss ofacoustic contrast. In sections parallel to thelength of the bank, these surfaces are irregular togently undulatory on a scale of hundreds ofmetres (Fig. 6A). They are of lesser extent andgreater irregularity on pro®les transverse to thebank (Fig. 6B). They generally dip 1±3° to theENE, displaying dips in sections both parallel andtransverse to the bank. Locally in the northernbank segment, they dip to the NNE±NNW. Highersurfaces locally truncate underlying surfaces atdeeper levels in the bank, whereas the upperbounding surface of the unit truncates the setboundaries at the top of the unit (Fig. 6B). Ontransverse pro®les, there is an increase in themaximum scour depth at the base of the sets
Fig. 9. Seismic unit 2 (stipple)showing erosional, concave-upward depression (d), erodingmore than 10 m into Pliocenevalley ®ll deposits beneath thebank. Note that the base of theoverlying unit 4 is conformablewith the upper surface of thebank. See Fig. 4 for pro®le loca-tion.
Fig. 10. Typical architecture ofunit 2 (stipple) as seen on pro®lesparallel to the bank axis. Note theangle of climb of the erosional setbase (S), the progradational mas-ter bedding planes (i) and thereactivation surfaces (r). SeeFig. 4 for pro®le location.
710 J.-Y. Reynaud et al.
Ó 1999 International Association of Sedimentologists, Sedimentology, 46, 703±721

towards the eastern, external part of the unit(Fig. 6B). Everywhere, the slope of the set-bound-ing surfaces increases with the set thickness andalso increases and then decreases from the base tothe top of the unit. These surfaces are locallymarked by elongate sinuous depressions that areup to 10 m deep, 100±300 m wide and more than1000 m long (Marsset et al., 1999). The sides ofthese are steep and may reach 10° (e.g. Fig. 11).The overall direction of these depressions isnorth±south. In some cases, the depressionscontain the only preserved part of a set that hasbeen eroded by a higher set (Fig. 6).
Unit 2 sets display internal re¯ectors of mod-erate acoustic amplitude and high frequency thatdip 1±12° (more than 8° in average) to the SSW,producing a distinctly cross-bedded character tothe unit. Typically, these inclined strata areconcave up, with tangential basal contacts; thisgeometry is most pronounced where these strata®ll depressions on the set bases (Fig. 11). Some ofthem are convex upwards in their upper part,where they may erosionally truncate underlyingstrata (Fig. 10).
Interpretation. Understanding the origin of there¯ectors within each set is essential to theinterpretation of unit 2. The steep dip of thesesurfaces (much greater than most bank sideslopes, which are generally less than 5°) andtheir SW orientation suggest that they cannothave formed by lateral accretion of the banksurface. Their steep dip is only similar to theprogradational face of dunes or channel bars. Theelongated sinuous depressions ®lled by the setsin unit 2 resemble the bar and channel features ofa meandering channel system (Reynaud, 1996).However, the set boundaries rise in the samemain direction, and the re¯ectors within each setdip overall to the SSW, whereas meanderingsystems would record point bar macroforms
dipping in almost all directions. For this reasonand because these sand bodies migrated onto aninferred tidal bank (unit 1), we propose that theunit 2 sets represent very large subtidal dunesthat migrated towards the SSW, as reported frommodern shallow tidal shelves (e.g. Berne et al.,1988).
In this interpretation, the internal re¯ectors ineach set are the leeface deposits of the dunes(Fig. 10). Their inclination falls into the range ofvalues reported for compound cross-bedding,closely matching the 12á5° dip related to the classIV tidal dunes of Allen (1980). The direction ofnet migration indicates that the dominant currentduring the accumulation of unit 2 was the ebbcurrent that ¯owed towards the SW (Fig. 10). Thelocal truncation of convex-upward re¯ectors inthe upper part of the sets are thus interpreted asreactivation surfaces, some of which could pos-sibly be caused by storm wave action (Dalrymple,1984; Berne et al., 1988; Fig. 10). The irregular,highly erosional base of the sets and the highlyvariable preserved thickness of the sets imply thatthe dunes were very sinuous with prominentscour pits (Fig. 12). The elongated depressions onthe set bases are interpreted as preserved scourpit tracks. However, their overall N±S direction isoblique to the average dip direction of the internalre¯ectors. Therefore, the crestlines of the duneswere oblique, with an obliquity (the angle be-tween the crestline and the migration direction)of about 80° (Rubin & Hunter, 1987; Rubin &Ikeda, 1990; Fig. 12). The WNW±ESE orientationof the dune crests is roughly parallel to theoblique undulations oriented 120° N that shapethe southern end of both bank segments (Figs 5and 6A). Thus, these undulations may representerosional remnants of the dunes.
If the individual sets represent the deposits of asingle compound dune, then the set bases arediachronous surfaces formed by migration of the
Fig. 11. Typical structure of unit 2(stipple) as seen on pro®les trans-verse to the bank axis. Note theelongated depression (d) sharplyincised into the underlying set. SeeFig. 4 for pro®le location.
Deep shelf tidal sand bank 711
Ó 1999 International Association of Sedimentologists, Sedimentology, 46, 703±721

dune troughs. Because the set bases rise in thedirection of dune migration, allowing the preser-vation of the deposits of the preceding dune,these bedforms must have been climbing. Theerosional nature of the set bases indicates that theangle of climb was subcritical (Allen, 1968); inother words, the angle of climb was less than thedune stoss slope. In consequence, the preservedset thickness is everywhere less than the originaldune height. Because the thickest sets reach20 m, it suggests that the highest dunes may havebeen even higher, as those observed today in theIrish Channel (Harvey, 1966) or southern EnglishChannel (Berne et al., 1989).
The water depth during deposition of unit 2can be estimated from this dune height using theequation of Yalin (1964), which states that theaverage dune height is about 17% of the waterdepth at the time of dune growth. The cross-bedset thickness varies greatly, but 10 m is a reason-able average value (Fig. 6). This yields a waterdepth of at least 60 m, given that each setthickness is less than the related dune height
was. One must treat this estimate with care,however, as several workers have noted that therecan be considerable discrepancy between thepredicted and observed heights of modern dunes(e.g. Allen, 1984, vol. 1, p. 333; Dalrymple &Rhodes, 1995). Nevertheless, this estimated waterdepth matches closely that proposed for unit 3(see below) and that deduced from the bankspacing according to the Huthnance (1982a)relationship (i.e. that the bank spacing is 250times the water depth). Indeed, the 16 km averagespacing of the Celtic banks today suggests thatthey were formed in a water depth of 65 m. Thissuggests that the event leading to the accumula-tion of unit 2 was regional in extent and wasresponsible for the creation of the Celtic banks asthey exist today. Thus, it seems likely that, as forunit 1, unit 2 originated in an offshore setting,although at water depths considerably less than atpresent.
Unit 3
Description. Unit 3 is present only in the southernsegment of the bank (Fig. 7). It is made up of anetwork of slightly sinuous to anastomosed,erosional channel forms that locally incise morethan 30 m into the top of unit 2 (Figs 6 and 13).These incisions, which extend down to 150 mbpsl, are 200±600 m wide and several kilometreslong, with most channel segments oriented in aNNW±SSE direction (Fig. 7). The lower boundaryof unit 3 is a medium- to high-amplitude re¯ectorcorresponding to the incision surface. This sur-face is smoothly concave upwards, with channelwalls that dip up to 12° (Fig. 13). The upperboundary of this unit corresponds either to thebank surface or to the lower boundary of unit 4.
No distinct sets or subunits are recognizedinside unit 3. Locally, the channel ®ll generateshyperbolic diffractions, and no coherent re¯ec-tors are visible. Generally, however, its internalstructure is made up of re¯ectors of variable
Fig. 12. Block diagram showing the relationship be-tween the sinuous dunes of unit 2, their cross-beddingand the direction of net migration (after Rubin, 1987).Forward migration of the scour pits produces theelongated depressions seen on the set bases (Fig. 11).
Fig. 13. Typical, deeply erosio-nal character of unit 3 (stipple)with lateral and aggradational®lling. See Fig. 4 for pro®le lo-cation.
712 J.-Y. Reynaud et al.
Ó 1999 International Association of Sedimentologists, Sedimentology, 46, 703±721
amplitude and very high frequency that dip to anoverall SSE direction (variable E to SW) at anglesranging between 8° and 15°. These surfaces areconcave upwards and downlap onto the lowerunit boundary. Overall, the slope of these sur-faces decreases towards the top of unit 3 (Figs 6and 13).
Interpretation. The deep scouring and channelform nature of unit 3 point to an abrupt base-levelfall, which could be related to either an increasein current speed or a drop in sea level. Thenumerous hyperbolic diffractions inside the in®llmay be caused by the steepness of the strata(Fig. 13) or may be the result of coarse lags thatwould be related to faster currents.
In a previous interpretation of the banks asremnants of mouth deposits of the Channel River(Gibbard, 1988; Lericolais, 1997), unit 3 wassuggested to belong to a tidal estuarine channelsystem (Reynaud, 1996; Tessier, 1997; BerneÂet al., 1998). However, we now feel that thisinterpretation is inconsistent with the offshoresetting deduced for the origin of unit 2 (»60 mwater depth). The existence of a relative sea-levelfall after the formation of unit 2 also seemsunlikely, given that the top of the bank, includingthe remnants of the dunes at the top of unit 2(Fig. 6A south), has not been planed off as mightbe expected if it had spent any length of time inshallow water (i.e. above fair-weather wavebase;cf. Harris et al., 1992). Thus, we are led toconclude that the unit 3 channels were incisedin an offshore setting.
Because the direction of progradation insidethe channel ®ll is the same overall as the channelorientation, it is likely that the processes ofchannel incision and ®lling were the same.Furthermore, because the orientation of thesechannels is nearly the same as that of the dunecrests in unit 2 (Fig. 12), it is inferred that thesedunes played a role in the origin of unit 3. Basedon an analogy with modern tidal sand bars, wehypothesize that these channels could representswatchways (Dalrymple & Rhodes, 1995) thatwere cut into the bank after it had grownsuf®ciently to constrict the tidal ¯ow. Thus, thesecross-bar channels were incised along the troughsof the large dunes in unit 2 by cross-bar tidal ¯ow.The branching aspect of unit 3 suggests thatseveral generations of swatchways may have beenactive, each of them existing for too short a time tomigrate laterally (Fig. 7). The inclined internalsurfaces within the channel ®lls would thencorrespond to master bedding produced by the
migration of smaller dunes along the channel¯oor. The decreasing concavity and extent ofthese internal surfaces from base to top re¯ectsthe diminishing intensity of cross-bar ¯ow andgradual channel ®lling (Fig. 13).
This hypothesis gives rise to several prob-lems. First, swatchways do not generally formin offshore settings and are reported almostexclusively from estuarine bank areas (Dalrymple& Rhodes, 1995), because shallow water depthsare required to create a signi®cant ¯owconstriction over the bank crest. The likelihoodof having such a ¯ow constriction over anoffshore tidal bank would be enhanced, how-ever, if the bank had high relief. This could bethe case for the Celtic banks, which are stilllocally more than 40 m high. Indeed, the bankheight±high-tide water depth ratio measured onsand bars with swatchways in the Bay of Fundy(15 m:20 m; Dalrymple et al., 1990) is not thatdifferent from that inferred for the Celtic banks(40 m:60 m). Another problem is that one seg-ment of the channel network in unit 3 isoriented NNE±SSW (Fig. 7), almost at rightangles to the orientation of the dunes in unit2 and the expected orientation of the swatch-ways (Dalrymple et al., 1990). However, thisswatchway orientation is close to that expectedif the ebb-dominant ¯ow seen on the eastern¯ank of the bank in unit 2 continued into thetime when unit 3 formed (Dalrymple & Rhodes,1995). But, in this case, why would some of theswatchways have kept the NNW±SSE orienta-tion and the others not? Furthermore, thesinuous pattern of unit 3 does not match theclassical idea of swatchways. Because of theseuncertainties, the swatchway interpretation ofthese channels must remain speculative.
Unit 4
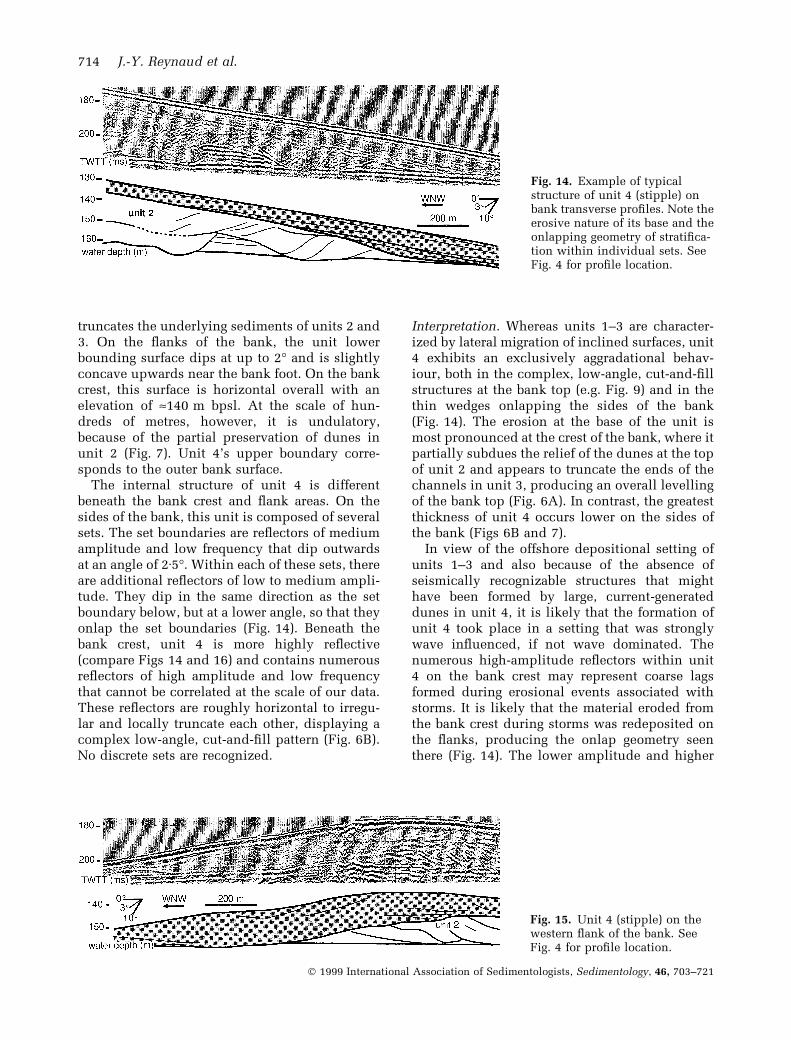
Description. Unit 4 forms a discontinuous blanketthat is present at the top of the bank where thecrest is high (Figs 6A and 7). It is absent in thecentral lower area. In the southern segment of thebank, it is also widespread on the eastern bank¯ank, where it extends down to the bank foot(Fig. 14). In the northern segment, it extendslocally down the western ¯ank (Fig. 15). Itsthickness ranges from 5 m to 15 m, and its widthincreases from 1 km to 4 km to the south (Fig. 7).
The lower bounding surface of the unit is are¯ector of moderate to high amplitude that isroughly conformable with the bank outer surface(Figs 9 and 16). It is an erosional surface that
Deep shelf tidal sand bank 713
Ó 1999 International Association of Sedimentologists, Sedimentology, 46, 703±721
truncates the underlying sediments of units 2 and3. On the ¯anks of the bank, the unit lowerbounding surface dips at up to 2° and is slightlyconcave upwards near the bank foot. On the bankcrest, this surface is horizontal overall with anelevation of »140 m bpsl. At the scale of hun-dreds of metres, however, it is undulatory,because of the partial preservation of dunes inunit 2 (Fig. 7). Unit 4's upper boundary corre-sponds to the outer bank surface.
The internal structure of unit 4 is differentbeneath the bank crest and ¯ank areas. On thesides of the bank, this unit is composed of severalsets. The set boundaries are re¯ectors of mediumamplitude and low frequency that dip outwardsat an angle of 2á5°. Within each of these sets, thereare additional re¯ectors of low to medium ampli-tude. They dip in the same direction as the setboundary below, but at a lower angle, so that theyonlap the set boundaries (Fig. 14). Beneath thebank crest, unit 4 is more highly re¯ective(compare Figs 14 and 16) and contains numerousre¯ectors of high amplitude and low frequencythat cannot be correlated at the scale of our data.These re¯ectors are roughly horizontal to irregu-lar and locally truncate each other, displaying acomplex low-angle, cut-and-®ll pattern (Fig. 6B).No discrete sets are recognized.
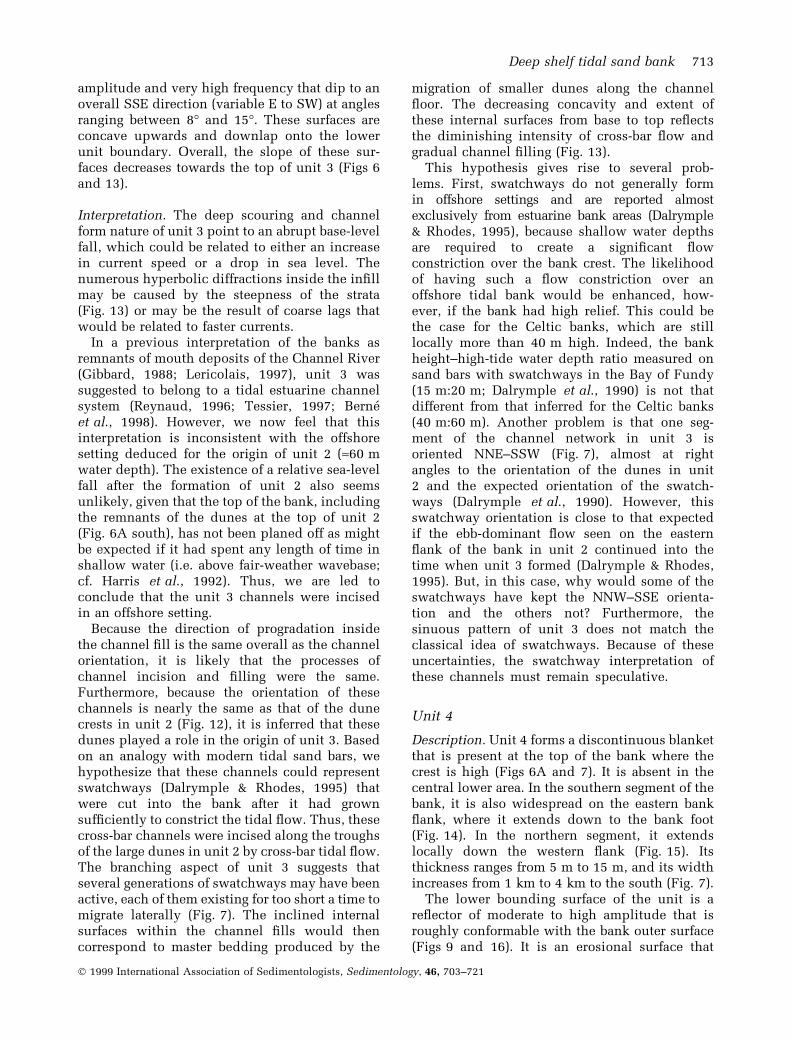
Interpretation. Whereas units 1±3 are character-ized by lateral migration of inclined surfaces, unit4 exhibits an exclusively aggradational behav-iour, both in the complex, low-angle, cut-and-®llstructures at the bank top (e.g. Fig. 9) and in thethin wedges onlapping the sides of the bank(Fig. 14). The erosion at the base of the unit ismost pronounced at the crest of the bank, where itpartially subdues the relief of the dunes at the topof unit 2 and appears to truncate the ends of thechannels in unit 3, producing an overall levellingof the bank top (Fig. 6A). In contrast, the greatestthickness of unit 4 occurs lower on the sides ofthe bank (Figs 6B and 7).
In view of the offshore depositional setting ofunits 1±3 and also because of the absence ofseismically recognizable structures that mighthave been formed by large, current-generateddunes in unit 4, it is likely that the formation ofunit 4 took place in a setting that was stronglywave in¯uenced, if not wave dominated. Thenumerous high-amplitude re¯ectors within unit4 on the bank crest may represent coarse lagsformed during erosional events associated withstorms. It is likely that the material eroded fromthe bank crest during storms was redeposited onthe ¯anks, producing the onlap geometry seenthere (Fig. 14). The lower amplitude and higher
Fig. 14. Example of typicalstructure of unit 4 (stipple) onbank transverse pro®les. Note theerosive nature of its base and theonlapping geometry of strati®ca-tion within individual sets. SeeFig. 4 for pro®le location.
Fig. 15. Unit 4 (stipple) on thewestern ¯ank of the bank. SeeFig. 4 for pro®le location.
714 J.-Y. Reynaud et al.
Ó 1999 International Association of Sedimentologists, Sedimentology, 46, 703±721
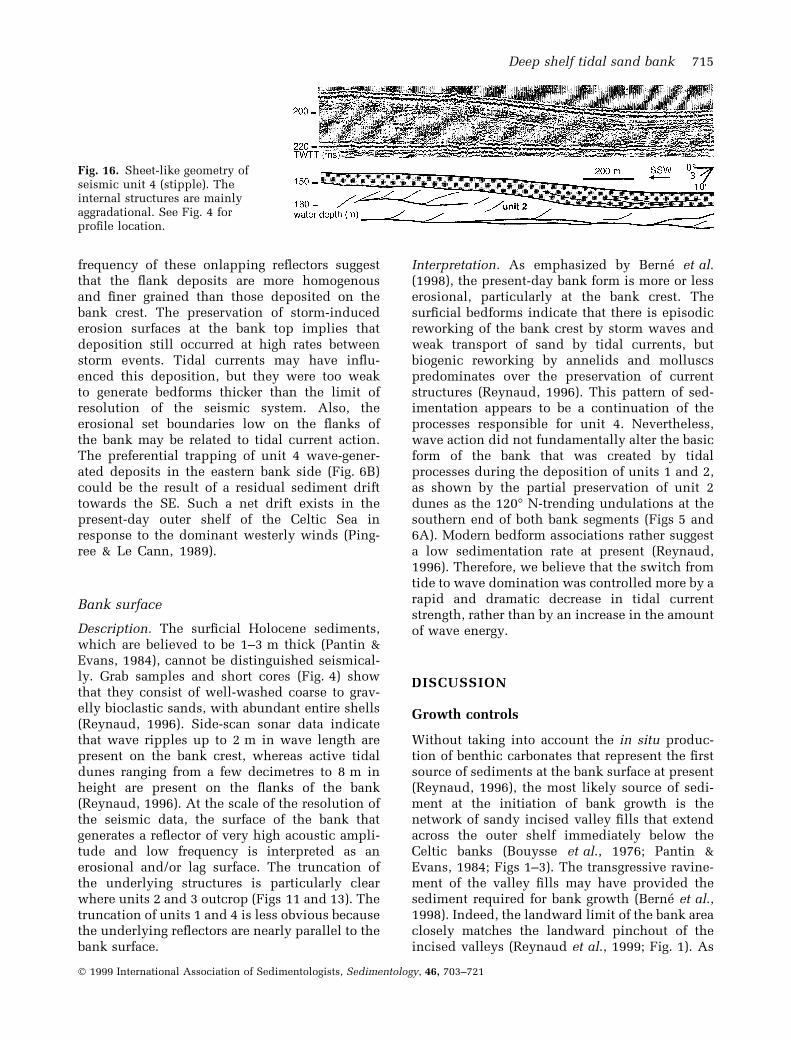
frequency of these onlapping re¯ectors suggestthat the ¯ank deposits are more homogenousand ®ner grained than those deposited on thebank crest. The preservation of storm-inducederosion surfaces at the bank top implies thatdeposition still occurred at high rates betweenstorm events. Tidal currents may have in¯u-enced this deposition, but they were too weakto generate bedforms thicker than the limit ofresolution of the seismic system. Also, theerosional set boundaries low on the ¯anks ofthe bank may be related to tidal current action.The preferential trapping of unit 4 wave-gener-ated deposits in the eastern bank side (Fig. 6B)could be the result of a residual sediment drifttowards the SE. Such a net drift exists in thepresent-day outer shelf of the Celtic Sea inresponse to the dominant westerly winds (Ping-ree & Le Cann, 1989).
Bank surface
Description. The sur®cial Holocene sediments,which are believed to be 1±3 m thick (Pantin &Evans, 1984), cannot be distinguished seismical-ly. Grab samples and short cores (Fig. 4) showthat they consist of well-washed coarse to grav-elly bioclastic sands, with abundant entire shells(Reynaud, 1996). Side-scan sonar data indicatethat wave ripples up to 2 m in wave length arepresent on the bank crest, whereas active tidaldunes ranging from a few decimetres to 8 m inheight are present on the ¯anks of the bank(Reynaud, 1996). At the scale of the resolution ofthe seismic data, the surface of the bank thatgenerates a re¯ector of very high acoustic ampli-tude and low frequency is interpreted as anerosional and/or lag surface. The truncation ofthe underlying structures is particularly clearwhere units 2 and 3 outcrop (Figs 11 and 13). Thetruncation of units 1 and 4 is less obvious becausethe underlying re¯ectors are nearly parallel to thebank surface.
Interpretation. As emphasized by Berne et al.(1998), the present-day bank form is more or lesserosional, particularly at the bank crest. Thesur®cial bedforms indicate that there is episodicreworking of the bank crest by storm waves andweak transport of sand by tidal currents, butbiogenic reworking by annelids and molluscspredominates over the preservation of currentstructures (Reynaud, 1996). This pattern of sed-imentation appears to be a continuation of theprocesses responsible for unit 4. Nevertheless,wave action did not fundamentally alter the basicform of the bank that was created by tidalprocesses during the deposition of units 1 and 2,as shown by the partial preservation of unit 2dunes as the 120° N-trending undulations at thesouthern end of both bank segments (Figs 5 and6A). Modern bedform associations rather suggesta low sedimentation rate at present (Reynaud,1996). Therefore, we believe that the switch fromtide to wave domination was controlled more by arapid and dramatic decrease in tidal currentstrength, rather than by an increase in the amountof wave energy.
DISCUSSION
Growth controls
Without taking into account the in situ produc-tion of benthic carbonates that represent the ®rstsource of sediments at the bank surface at present(Reynaud, 1996), the most likely source of sedi-ment at the initiation of bank growth is thenetwork of sandy incised valley ®lls that extendacross the outer shelf immediately below theCeltic banks (Bouysse et al., 1976; Pantin &Evans, 1984; Figs 1±3). The transgressive ravine-ment of the valley ®lls may have provided thesediment required for bank growth (Berne et al.,1998). Indeed, the landward limit of the bank areaclosely matches the landward pinchout of theincised valleys (Reynaud et al., 1999; Fig. 1). As
Fig. 16. Sheet-like geometry ofseismic unit 4 (stipple). Theinternal structures are mainlyaggradational. See Fig. 4 forpro®le location.
Deep shelf tidal sand bank 715
Ó 1999 International Association of Sedimentologists, Sedimentology, 46, 703±721
the coast transgressed landwards of this limit, thesediment supply presumably decreased signi®-cantly, thereby explaining why fewer banks arepresent in shallower areas to the north-east (in thewestern approaches to the English Channel).Bank growth in the outer Celtic Sea was alsofavoured by the fact that the sand transportedsouthwards by the ebb-dominant tidal currentsmay have been trapped on the outer Celtic shelfbecause of a current reversal near the shelf edgecaused by internal waves, a phenomenon that isstill observed today (Heathershaw et al., 1987).
Bank formation occurred as a result of bothtidal deposition of units 1 and 2 and also perhapsinterbank tidal scour, as indicated by the progres-sively deeper erosion of the set boundaries withinthese units (Fig. 8). Units 1 and 2 both exhibit aninternal south-westerly dipping cross-strati®ca-tion, indicating that they were ebb dominated.Unit 3 also has a southerly dipping strati®cationthat could be related to the same ebb dominance.The progressive increase in the size of thebedforms from unit 1 to unit 2 implies that waterdepth and/or current speed increased signi®cant-ly between the deposition of these units (Dalrymple& Rhodes, 1995). The deeply incised nature of thechannels comprising unit 3 (Fig. 13) suggests thatcurrent speeds increased even more at the time ofincision of this unit and/or that sediment supplydecreased suddenly. In contrast, tidal currentstrength decreased abruptly during the depositionof unit 4, leading to a correlative increase in waveaction at the bank surface.
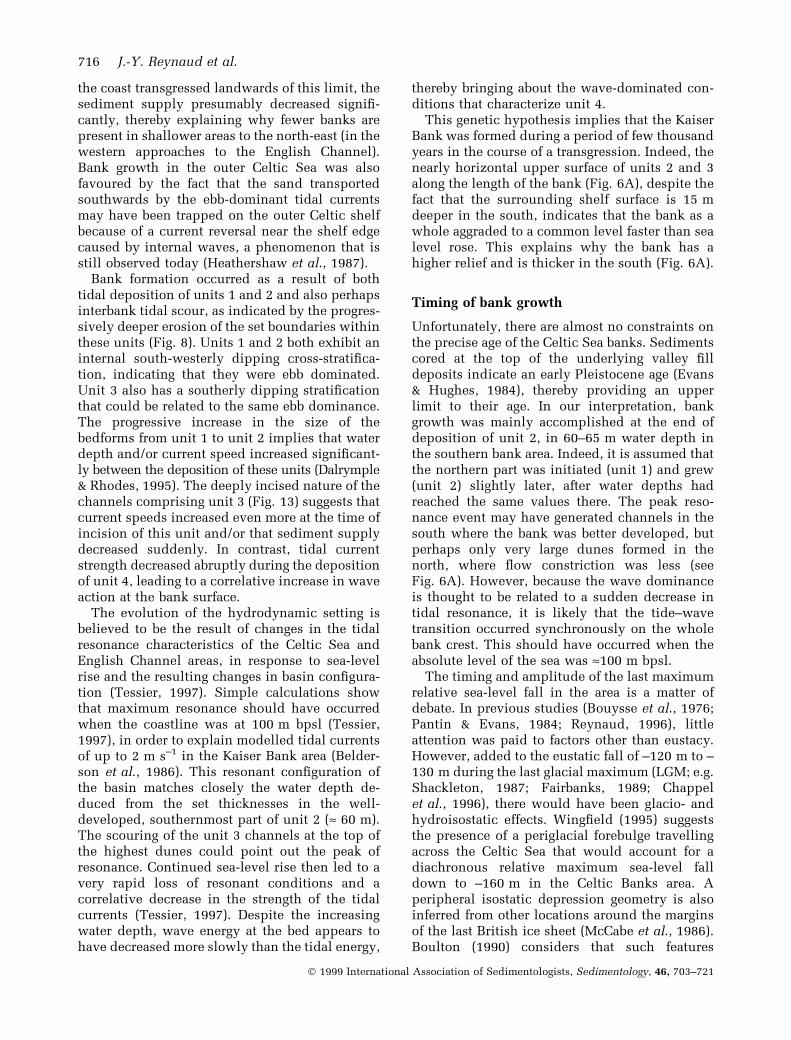
The evolution of the hydrodynamic setting isbelieved to be the result of changes in the tidalresonance characteristics of the Celtic Sea andEnglish Channel areas, in response to sea-levelrise and the resulting changes in basin con®gura-tion (Tessier, 1997). Simple calculations showthat maximum resonance should have occurredwhen the coastline was at 100 m bpsl (Tessier,1997), in order to explain modelled tidal currentsof up to 2 m s±1 in the Kaiser Bank area (Belder-son et al., 1986). This resonant con®guration ofthe basin matches closely the water depth de-duced from the set thicknesses in the well-developed, southernmost part of unit 2 (» 60 m).The scouring of the unit 3 channels at the top ofthe highest dunes could point out the peak ofresonance. Continued sea-level rise then led to avery rapid loss of resonant conditions and acorrelative decrease in the strength of the tidalcurrents (Tessier, 1997). Despite the increasingwater depth, wave energy at the bed appears tohave decreased more slowly than the tidal energy,
thereby bringing about the wave-dominated con-ditions that characterize unit 4.
This genetic hypothesis implies that the KaiserBank was formed during a period of few thousandyears in the course of a transgression. Indeed, thenearly horizontal upper surface of units 2 and 3along the length of the bank (Fig. 6A), despite thefact that the surrounding shelf surface is 15 mdeeper in the south, indicates that the bank as awhole aggraded to a common level faster than sealevel rose. This explains why the bank has ahigher relief and is thicker in the south (Fig. 6A).
Timing of bank growth
Unfortunately, there are almost no constraints onthe precise age of the Celtic Sea banks. Sedimentscored at the top of the underlying valley ®lldeposits indicate an early Pleistocene age (Evans& Hughes, 1984), thereby providing an upperlimit to their age. In our interpretation, bankgrowth was mainly accomplished at the end ofdeposition of unit 2, in 60±65 m water depth inthe southern bank area. Indeed, it is assumed thatthe northern part was initiated (unit 1) and grew(unit 2) slightly later, after water depths hadreached the same values there. The peak reso-nance event may have generated channels in thesouth where the bank was better developed, butperhaps only very large dunes formed in thenorth, where ¯ow constriction was less (seeFig. 6A). However, because the wave dominanceis thought to be related to a sudden decrease intidal resonance, it is likely that the tide±wavetransition occurred synchronously on the wholebank crest. This should have occurred when theabsolute level of the sea was »100 m bpsl.
The timing and amplitude of the last maximumrelative sea-level fall in the area is a matter ofdebate. In previous studies (Bouysse et al., 1976;Pantin & Evans, 1984; Reynaud, 1996), littleattention was paid to factors other than eustacy.However, added to the eustatic fall of ±120 m to ±130 m during the last glacial maximum (LGM; e.g.Shackleton, 1987; Fairbanks, 1989; Chappelet al., 1996), there would have been glacio- andhydroisostatic effects. Wing®eld (1995) suggeststhe presence of a periglacial forebulge travellingacross the Celtic Sea that would account for adiachronous relative maximum sea-level falldown to ±160 m in the Celtic Banks area. Aperipheral isostatic depression geometry is alsoinferred from other locations around the marginsof the last British ice sheet (McCabe et al., 1986).Boulton (1990) considers that such features
716 J.-Y. Reynaud et al.
Ó 1999 International Association of Sedimentologists, Sedimentology, 46, 703±721
would have decayed in situ, a plausible conclu-sion considering current models of rapid ice sheetdisintegration (e.g. McCabe & Clark, 1998).
Current viscoelastic lithospheric models thatare constrained by northern (Peltier & Andrews,1976; Nakada & Lambeck, 1987) and southernhemisphere (e.g. Nakada & Lambeck, 1988) pal-aeo-ice sheet reconstructions do not predict asigni®cant isostatic depression in the area of theKaiser Bank. According to these studies, emersionin the Western Channel Approaches would havebeen restricted to a tenuous land bridge betweenBritain and Ireland at 18±14 ky BP, landward ofour study area (Lambeck, 1995; Lambeck, 1996).Based on the most recent of these models (Flem-ing et al., 1998) and with the hypothesis that nosigni®cant vertical movements of tectonic originoccurred (Pantin & Evans, 1984), the last maxi-mum lowstand of relative sea level in the area of
the Kaiser Bank during the late Pleistocene wouldnot have exceeded ±125 m bpsl at 19 ka BP (K.Fleming, pers. comm.; Fig. 17). However, geolog-ical constraints in the form of deglacial `raised'deposits around the Irish coastline to the northstrongly question the model's predictions(McCabe, 1997). Devoy (1995) concludes thatmuch uncertainty still exists as a result of poorknowledge of geological boundary conditions,especially in models of crustal ¯exure.
Regardless of the details of isostatic movement,it seems likely that the main body of the KaiserBank is probably more recent than the LGM,because even with a minimized sea-level fall at ±105 m (Fig. 17), it is likely that the bank wouldhave been subjected to severe wave erosion downto tens of metres below this level. But the dunemorphology on the top of unit 2 (Fig. 6A) isrelatively well preserved, especially at the southern
Fig. 17. Schematic evolution of Kaiser Bank in a chronostratigraphic framework. The relative sea-level range iscalculated for the Kaiser Bank area using a model taking into account eustacy and glacio-hydro-isostatic compen-sation (Fleming et al., 1998). The model is run for a eustatic sea level of ±120 m (ocean volume adjusted, ±114 m forpresent-day ocean area) and for the following range of rheologies: lithosphere thickness 50±100 km; upper mantleviscosity 2±6 ´ 1020 Pa s; lower mantle viscosity 0á5±2 ´ 1022 Pa s (K. Fleming, pers. comm.). Tectonic in¯uence isneglected. Circled numbers refer to corresponding seismic units. The water depth and bank elevation at each stageare displayed for the southern, deepest part of the bank. The surface between both tide- and wave-dominateddomains is the limit (at a seismic scale) between tide- and wave-related deposits. The tide-dominated sedimentationoccurs until the bank crest reaches the wave-dominated space. The loss of tidal resonance brings about a decrease intidal energy much faster than that of waves controlled by rising sea level, so that the bank upper surface becomeswave dominated. Thereafter, the relative wave domination decreases again up to its present-day degree (an alternatetide and wave in¯uence at the bank crest; Reynaud, 1996).
Deep shelf tidal sand bank 717
Ó 1999 International Association of Sedimentologists, Sedimentology, 46, 703±721
end of the bank where wave attack would havebeen greatest. In consequence, we propose that atleast units 2±4 were deposited in the course ofthe last post-glacial sea-level rise (Fig. 17). Onerelative sea level curve modelled for the areasuggests a main building stage at 15±16 ky BP,but it could also be younger in the forebulgehypothesis (Wing®eld, 1995). Importantly, wecannot exclude the possibility that unit 1 isconsiderably older, perhaps dating from anearlier lowstand (Berne et al., 1998), consideringthat a ¯at wave ravinement surface at its topcould have been reworked at the base of thedunes of unit 2.
Comparison with sand bank model
The standard model of the internal architecture oftidal sand banks (e.g. Houbolt, 1968; Stride et al.,1982) emphasizes the importance of lateral accre-tion bedding deposited on the downcurrent sideof the bank, relative to the regionally dominanttidal ¯ow. This occurs because the bank isbelieved to migrate slowly in the net downcurrentdirection, in much the same way as a ¯ow-transverse bedform. The Kaiser Bank conforms tothis model in some ways, but differs in otherimportant respects.
At the most general level, the Kaiser Bankcontains lateral accretion bedding. In the ®rststages of the bank story, this bedding occurs atthe scale of the low-angle surfaces inside eachset of unit 1, interpreted as downcurrent accre-tion deposits (Fig. 8). This deposition on the netdowncurrent side of the bank relative to theregionally dominant (ebb) current matches themodel proposed by Houbolt (1968). More sur-prising, the deposits of the main bank-buildingphase (unit 2) are set up on the upcurrent side ofthe bank relative to the regionally dominantcurrent. There, the lateral accretion beddingoccurs at the scale of set-bounding surfaces ofunit 2 (Fig. 6B). Such an upcurrent accretion hasnot been seen before in shelf sand banks, but hasbeen reported from sand bars in the CobequidBay estuary, Bay of Fundy (Dalrymple & Zaitlin,1994). Thus, the Kaiser Bank appears to havegrown to such a level that the cross-bar compo-nent of ¯ow was signi®cantly retarded, causingsubstantial deposition on the upcurrent side ofthe bank. This effect is most pronounced on theside in¯uenced by the regionally dominantcurrent, because this is the current that isresponsible for the main introduction of newsediment to the bank.
The occurrence of an upcurrent accretion isconsistent with the Huthnance (1982a,b) model ofridge growth. In cases in which the banks do notgrow high enough to produce this retardation ofcross-bar ¯ow, either because there is insuf®cientsediment and/or sea level rises faster than theupward growth of the bank, the cross-bar ¯owcontinues to be accelerated over the bank crest,and the bank continues to grow upwards. How-ever, when the water over the crest becomes tooshallow, frictional retardation exceeds the effectof ¯ow constriction and the cross-bank ¯owslows, promoting deposition on the upcurrentside of the bank. This, in turn, promotes wideningrather than upward growth (Harris et al., 1992).
It is widely believed that the deposits of active,tidal sand banks consist of cross-bedded sands.However, the scale of the cross-bedding describedfrom unit 2 exceeds that from any previouslydescribed examples. The presence of this giantcross-bedding is indirectly related to the devel-opment of resonance in the system, therebyallowing the active growth of the bank in anoffshore (i.e. deep-water) setting where largedunes can form. Despite this relatively unusual(?) situation, the fundamental character of thebank sediments (cross-bedded, lateral accretiondeposits) remain as expected.
On the other hand, the presence of the unit 3channels (swatchways?) dissecting the bank crestis unexpected in a bank deposited in an offshoresetting. Previously, such channels have beenreported only from estuarine environments (Dal-rymple & Rhodes, 1995). This has been explainedabove as a result of the rapid upward growth ofthe crest to a level at which it represented aserious impediment to cross-bank ¯ow. Thus,these channels may be a unique feature of thisbank, related to the resonant conditions and thehigh availability of sand that permitted the bankto grow rapidly to a shallow level in an offshoresetting.
The evolution of bank sedimentation from tidedominated to wave dominated has been proposedfor numerous modern tidal banks (e.g. Chakhotinet al., 1972; Nelson et al., 1982; Davis & Balson,1992; Davis et al., 1993) and is an acceptedcomponent of the model of sand bank evolution(Stride et al., 1982; Dalrymple, 1992). Neverthe-less, this behaviour has rarely been demonstratedwith such clarity as in the present situation,perhaps because of the dramatic decrease in tidalenergy associated with the loss of resonance.However, this situation shows, that sea-levelchanges causing signi®cant modi®cations to the
718 J.-Y. Reynaud et al.
Ó 1999 International Association of Sedimentologists, Sedimentology, 46, 703±721

basin geometry can dramatically alter the degreeof resonance, thereby promoting a gain and/orloss of tidal energy as sea level rises. Therefore,the possibility exists that banks may show anupward increase in tidal energy, such as is seen inthe basal portion of the Kaiser Bank.
CONCLUSIONS
1 The seismic interpretation of one of the deepCeltic shelf sand banks suggests deposition in anoffshore setting, with a transition from a tide- to awave-dominated setting. Above an initial tidalbar system, the bulk of the bank is made up ofcross-bed sets up to 20 m thick, which wereproduced by very large sinuous-crested tidaldunes characterized by a downcurrent dippingmaster bedding inclined at 7±12°. These dunesare truncated by a network of channels up to 30 mdeep that could represent a particular type ofswatchway. The tidal sediment body is in¯u-enced at the top by wave action, which locallyerodes the bank into its present-day shape. Part ofthe eroded sediments are redeposited as wedgesonlapping the bank foot.2 The bank architecture is thought to re¯ect theevolution of the area throughout the last post-glacial sea-level rise, bringing about an increase intidal energy to a resonant condition, followed by anabrupt loss of resonance. The water depth in whichthe largest dunes formed is in agreement with thebasin con®guration for which tidal resonance ispredicted (c. relative sea level 100 m below thepresent). The loss of tidal resonance triggered asudden and strong decrease in tidal energy,explaining the in-place in®lling of the incisedchannels and the predominance of wave-in¯uenced features related to rising sea level.
ACKNOWLEDGEMENTS
This work, initiated as part of the FrenchSedimanche project, was supported ®nanciallyby the EEC-funded MAST2-Star®sh Europeanprogramme through the partnership of RCMG-Gent and IFREMER-Brest. Thanks are extended tothe scienti®c staff and crew who operated theships and equipment during the campaigns at sea:people from IFREMER and GENAVIR duringSedimanche 1 and 2; and people from the BelgianNavy and University of Gent during Belgica 92and 94. We thank Kevin Fleming (University ofCanberra) and Stephen McCarron (University of
Ulster) for their contribution to the discussion onrelative sea level changes. We also thank HerveÂChamley (University of Lille) and Richard Davis(University of South Florida) for their reviewsand comments, and editor Guy Plint for ®nalimprovement of the text.
REFERENCES
Allen, J.R.L. (1968) Current Ripples; Their Relation toPatterns of Water and Sediment Motion. North-Hol-land Publishing Company, Amsterdam.
Allen, J.R.L. (1980) Sand waves: a model of origin andinternal structure. Sedim. Geol., 26, 281±328.
Allen, J.R.L. (1984) Sedimentary structures: theircharacter and physical basis. Developments in Sedi-mentology 30. Elsevier Science, New York.
Andreieff, P., Bouysse, P., Horn, R. and Monciardini, C.(1972) Contribution aÁ l'eÂtude geÂologique des ap-proches occidentales de la Manche. MeÂm. Bur. Rech.GeÂol. Min., 79, 32±48.
Anstey, N.A. (1977) Seismic Interpretation: The Phys-ical Aspects. IHRDH, Boston.
Belderson, R.H., Pingree, R.D. and Grif®ths, D.K. (1986)Low sea-level tidal origin of Celtic sea sand banks ±evidence from numerical modelling of M2 tidalstreams. Mar. Geol., 73, 99±108.
BerneÂ, S., Auffret, J.-P. and Walker, P. (1988) Internalstructure of subtidal sandwaves revealed by high res-olution seismic re¯ection. Sedimentology, 35, 5±20.
BerneÂ, S., Allen, G., Auffret, J.-P., Chamley, H., Durand,J. and Weber, O. (1989) Essai de syntheÁse sur lesdunes hydrauliques geÂantes tidales actuelles. Bull.Soc. GeÂol. France, 5, 1145±1160.
BerneÂ, S., Trentesaux, A., Stolk, A., Missiaen, T. and DeBatist, M. (1994) Architecture and long-term evolu-tion of a tidal sandbank: the Middelkerke Bank,Southern North Sea. Mar. Geol., 121, 57±72.
BerneÂ, S., Lericolais, G., Marsset, T., Bourillet, J.-F. andDe Batist, M. (1998) Erosional offshore sand ridgesand lowstand shorefaces: examples from tide- andwave-dominated environments of France. J. Sedim.Res., 68, 540±555.
Berthois, L. (1974) Carte BathymeÂtrique du Golfe deGascogne. CNEXO, Brest.
Boulton, G.S. (1990) Sedimentation and sea-levelchanges during glacial cycles and their control onglacimarine facies architecture. In: Glacimarine En-vironments: Processes and Sediments (Ed. by J. A.Dowdeswell and J. D. Scourse), Geol. Soc. Lond.Spec. Publ., 53, 15±52.
Bouysse, P., Horn, R. and Le Lann, F. (1975) Etude de lastructure de la plate-forme continentale de la MerCeltique entre 7 et 8 degreÂs ouest. Rev. Inst. Fr. PeÂt-rol., 30, 855±863.
Bouysse, P., Horn, R., Lapierre, F. and Le Lann, F.(1976) Etude des grands bancs de sable du Sud-Est dela Mer Celtique. Mar. Geol., 20, 251±275.
Caston, V.N.D. (1972) Linear sand banks in the south-ern North Sea. Sedimentology, 18, 63±78.
Deep shelf tidal sand bank 719
Ó 1999 International Association of Sedimentologists, Sedimentology, 46, 703±721

Chakhotin, P.S., Medvedev, V.S. and Longinov, V.V.(1972) Sand ridges and waves on the shelf of tidalseas. Oceanology, 12, 386±394.
Chappel, J., Omura, A., Esat, T., McCulloch, M., Pan-dol®, J., Ota, Y. and Pilans, B. (1996) Reconciliationof late Quaternary sea levels derived from coral ter-races at Huon Peninsula with deep sea oxygen iso-tope records. Earth Planet. Sci. Lett., 141, 227±236.
Collins, M.B., Shimwell, S.J., Gao, S., Powell, H., He-witson, C. and Taylor, J.A. (1995) Water and sedi-ment movement in the vicinity of linear sandbanks:the Norfolk banks, southern North Sea. Mar. Geol.,123, 125±142.
Dalrymple, R.W. (1984) Morphology and internalstructure of sandwaves in the Bay of Fundy. Sedi-mentology, 31, 365±382.
Dalrymple, R.W. (1992) Tidal depositional systems. In:Facies Models, Response to Sea-Level Change, 3rdedn (Ed. by R. G. Walker and N. P. James), pp. 195±218. Geological Association of Canada, St. John's.
Dalrymple, R.W., Knight, R.J., Zaitlin, B.A. and Mid-delton, G.V. (1990) Dynamics and facies model of amacrotidal sand-bar complex, Cobequid Bay±SalmonRiver Estuary (Bay of Fundy). Sedimentology, 37,577±612.
Dalrymple, R.W. and Zaitlin, B.A. (1994) High-resolu-tion sequence stratigraphy of a complex, incised-val-ley succession, Cobequid Bay±Salmon River Estuary,Bay of Fundy, Canada. Sedimentology, 41, 1069±1092.
Dalrymple, R.W. and Rhodes, R.N. (1995) Estuarinedunes and bars. In: Geomorphology and Sedimento-logy of Estuaries (Ed. by G. M. E. Perillo), pp. 359±422. Developments in Sedimentology 53. ElsevierScience, New York.
Davis, R.A. and Balson, P. (1992) Stratigraphy of a NorthSea tidal sand ridge. J. Sedim. Petrol., 62, 116±121.
Davis, R.A., Klay, J. and Jewell, P. (1993) Sedimento-logy and stratigraphy of tidal sand ridges southwestFlorida inner shelf. J. Sedim. Petrol., 63, 91±104.
Devoy, R.J.N. (1995) Deglaciation, Earth crustal behav-iour and sea-level changes in the determination ofinsularity: a perspective from Ireland. In: IslandBritain: a Quaternary Perspective (Ed. by R. C. Pre-ece), Geol. Soc. Lond. Spec. Publ., 96, 181±208.
Evans, C.D.R. (1990) The Geology of the Western EnglishChannel and its Western Approaches. United King-dom Offshore Regional Reports 9. HMSO, London.
Evans, C.D.R. and Hughes, M.J. (1984) The Neogenesuccession of the South Western Approaches, GreatBritain. J. Geol. Soc. Lond., 141, 315±326.
Fairbanks, R.G. (1989) A 17000-years glacio-eustatic sealevel record: in¯uence of glacial melting rates on theYounger Dryas event and deep-ocean circulation.Nature, 342, 637±642.
Fleming, K., Johnston, P., Zwartz, D., Yokoyama, Y.,Lambeck, K. and Chappell, J. (1998) Re®ning theeustatic sea-level curve since the Last Glacial Maxi-mum using far- and intermediate-®eld sites. EarthPlanet. Sci. Lett., 163, 327±342.
Gibbard, P.L. (1988) The history of the great northwestEuropean rivers during the past three million years.Phil. Trans. R. Soc. London B, 318, 559±602.
Harris, P.T., Pattiaratchi, C.B., Cole, A.R. and Keene,J.B. (1992) Evolution of subtidal sandbanks in Mor-eton Bay, eastern Australia. Mar. Geol., 103, 225±247.
Harvey, J.G. (1966) Large sand waves in the Irish Sea.Mar. Geol., 4, 49±55.
Heathershaw, A.D., New, A.L. and Edwards, P.D. (1987)Internal tides and sediment transport at the shelf breakin the Celtic Sea. Cont. Shelf Res., 7, 485±517.
Houbolt, J.J.H.C. (1968) Recent sediments in thesouthern bight of the North Sea. Geol. Mijnbouw, 47,245±273.
Houthuys, R. and Gullentrops, F. (1988) Tidal trans-verse bars building up a longitudinal sand unit(Middle Eocene, Belgium). In: Tide-In¯uenced Sedi-mentary Environments and Facies (Ed. by P. L. deBoer, S. D. Nio and A. Van Gelder), pp. 153±166.Reidel, Dordrecht.
Hulscher, S.J.M.H., De Swart, H.E. and De Vriend, H.J.(1993) The generation of offshore tidal sand banksand sand waves. Cont. Shelf Res., 13, 1183±1204.
Huthnance, J.M. (1982a) On One Mechanism FormingLinear Sand Banks. Est. Coast. Shelf Sci., 14, 79±99.
Huthnance, J.M. (1982b) On the formation of sand banksof ®nite extent. Est. Coast. Shelf Sci., 15, 277±299.
Kenyon, N.H. and Stride, A.H. (1970) The tide-sweptcontinental shelf sediments between the ShetlandIsles and France. Sedimentology, 14, 159±173.
Kenyon, N.H., Belderson, R.H., Stride, A.H. and John-son, M.A. (1981) Offshore tidal sand-bank as indi-cator of net sand transport and as potential deposits.Spec. Publ. Int. Assoc. Sed., 5, 257±268.
Lambeck, K. (1995) Late Devensian and Holoceneshorelines of the British Isles and North Sea frommodels of glacio-hydro-isostatic rebound. J. Geol.Soc. Lond., 152, 437±448.
Lambeck, K. (1996) Glaciation and sea-level change forIreland and the Irish Sea since Late Devensian/Mid-landian time. J. Geol. Soc. London, 153, 853±872.
Lapierre, F. (1975) Contribution aÁ l'eÂtude geÂologique etseÂdimentologique de la Manche orientale. Phil.Trans. R. Soc. Lond. A, 279, 177±187.
Lericolais, G. (1997) Evolution Plio-Quaternaire duFleuve Manche: Stratigraphie et GeÂomorphologied'une Plateforme Continentale en reÂgime PeÂriglacia-ire (English abridged version included). UnpublishedPhD Thesis, University of Bordeaux 1.
Lericolais, G., Allenou, J.-P., BerneÂ, S. and Morvan, P.(1990) A new system for acquisition and processingof very-high-resolution seismic re¯ection data. Geo-physics, 55, 1036±1046.
Lericolais, G., Olagnon, M., Krone, R. and NouzeÂ, H.(1994) Multiple removal in very-high resolution seis-mic site survey data. In: Behaviour of Offshore Struc-tures (Ed. by M. S. T. C. Chryssostomidis, A. J. Whittleand M. S. Hoo Fatt), pp. 125±136. Boss, Boston.
McCabe, A.M. (1997) Geological constraints on geo-physical models of relative sea-level change duringdeglaciation of the western Irish Sea basin. J. Geol.Soc. London, 154, 601±604.
McCabe, A.M. and Clark, P.U. (1998) Ice-sheet vari-ability around the North Atlantic Ocean during thelast deglaciation. Nature, 392, 373±377.
720 J.-Y. Reynaud et al.
Ó 1999 International Association of Sedimentologists, Sedimentology, 46, 703±721

McCabe, A.M., Haynes, J.R. and MacMillan, N.F. (1986)Late-Pleistocene tidewater glaciers and glaciomarinesequences from north County Mayo, Republic ofIreland. J. Quat. Sci., 1, 73±84.
Marsset, T., Tessier, B., Reynaud, J.-Y., De Batist, M.and Plagnol, C. (1999) An example of sand bodyanalysis from very high resolution seismic data. Mar.Geol., (in press).
Nakada, N. and Lambeck, K. (1987) Glacial reboundand relative sea-level variations: a new appraisal.Geophys. J. Astron. Soc., 90, 171±224.
Nakada, N. and Lambeck, K. (1988) The melting historyof the Late Pleistocene Antarctic ice sheet. Nature,333, 36±40.
Nelson, C.H., DupreÂ, W., Field, M. and Howard, J.D.(1982) Variation in sand unit types on the easternBering Sea epicontinental shelf. Geol. Mijnbouw, 61,37±48.
Off, T. (1963) Rhythmic linear sand units caused bytidal currents. Bull. Am. Assoc. Petrol. Geol., 47,324±341.
Pantin, H.M. and Evans, C.D.R. (1984) The Quaternaryhistory of the central and southwestern Celtic Sea.Mar. Geol., 57, 259±293.
Pattiaratchi, C. and Collins, M. (1987) Mechanisms forlinear sandbank formation and maintenance in rela-tion to dynamical oceanographic observations. Progr.Oceanogr., 19, 117±176.
Peltier, W.R. and Andrews, J.T. (1976) Glacial-isostaticadjustment ± I. The forward problem. Geophys. J. R.Astron. Soc., 46, 605±646.
Pingree, R.D. and Le Cann, B. (1989) Celtic andArmorican slope and shelf residual currents. Progr.Oceanogr., 23, 303±338.
Pingree, R.D., Mardell, G.T., Holligan, P.M., Grif®ths,D.K. and Smithers, J. (1982) Celtic Sea and Armori-can current structure and the vertical distributions oftemperature and chlorophyll. Cont. Shelf Res., 1, 99±116.
Reynaud, J.-Y. (1996) Architecture et evolution d'unbanc sableux de Mer celtique MeÂridionale (Englishabridged version included). Unpublished PhD The-sis, University of Lille 1.
Reynaud, J.-Y., Tessier, B., Proust, J.-N., Lericolais, G.,Marsset, T., BerneÂ, S. and Chamley, H. (1995) Ap-ports de la sismique treÁs haute reÂsolution aÁ l'inter-preÂtation geÂneÂtique d'un banc sableux de la merCeltique. C. R. Acad. Sci. Paris (B), 320, 125±132.
Reynaud, J.-Y., Tessier, B., Proust, J.-N., Dalrymple,R.W., Bourillet, J.-F., De Batist, M., Lericolais, G.,BerneÂ, S. and Marsset, T. (1999) Architecture andsequence stratigraphy of a late Neogene incised val-ley at the shelf margin, Southern Celtic Sea. J. Sedim.Res., 69, 351±364.
Rubin, D.M. (1987) Cross-bedding, bedforms, andpaleocurrents. Concepts in Sedimentology and Pale-ontology 1. SEPM, Tulsa, OK.
Rubin, D.M. and Hunter, R.E. (1987) Bedform alignmentin directionally varying ¯ows. Science, 237, 276±278.
Rubin, D.M. and Ikeda, H. (1990) Flume experimentson the alignment of transverse, oblique, and longi-
tudinal dunes in directionally varying ¯ows. Sedi-mentology, 37, 673±684.
Rubino, J.L., Leo, M. and Fonnesu, F. (1985) Detailedstratigraphy of a tidal bar complex in the EoceneBaronia sandstone, Ager basin, south Central Pyren-nees. Abstracts Int. Assoc. Sedimentol., 6th Europe-an Regional Meeting, pp. 657±660, Lerida.
Scourse, J.D., Austin, W.E.N., Bateman, R.M., Catt, J.A.,Evans, C.D.R., Robinson, J.E. and Young, J.R. (1990)Sedimentology and micropaleontology of glacimarinesediments from the Central and Southwestern CelticSea. In: Glacimarine Environments: Processes andSedimentation (Ed. by J. A. Dowdeswell, and J. D.Scourse), Geol. Soc. London, Spec. Publ. 53, 329±347.
Shackleton, N.J. (1987) Oxygen isotopes, ice volumeand sea-level. Quat. Sci. Rev., 6, 183±190.
Smith, J.D. (1970) Stability of a sand bed subjected to ashear ¯ow of low Froude number. J. Geophys. Res.,75, 5428±5940.
Stride, A.H. (1963) Current-swept sea-¯oors near thesouthern half of Great Britain. Q. J. Geol. Soc. London,119, 175±199.
Stride, A.H., Belderson, R.H., Kenyon, N.H. and John-son, M.A. (1982) Offshore tidal deposits: sand sheetand sand bank facies. In: Offshore Tidal Sands: Pro-cesses and Deposits (Ed. by A. H. Stride), pp. 95±126,Chapman & Hall, London.
Swift, D.J.P. (1975) Tidal sand ridges and shoal retreatmassifs. Mar. Geol., 18, 105±134.
Swift, D.J.P. and Thorne, J.A. (1991) Sedimentation oncontinental margins: a general model for shelf sedi-mentation. In: Shelf Sand Sandstone Units: Geome-try, Facies Sequence Stratigraphy (Ed. by D. J. P.Swift, G. F. Oertel, R. W. Tillman and J. A. Thorne).Spec. Publ. Int. Assoc. Sed., 14, 3±32.
Tessier, B. (1997) Expression seÂdimentaire de ladynamique tidale. Unpublished Habilitation Mem-oir. University of Lille 1.
Van Veen, J. (1936) Onderzoekingen in de Hoofden's.Algemeene Landsdrukkerij, 'S-Gravenhage.
Vanhauwaert, P. (1993) Hoge-resolutie re¯ectie seis-mische studie van Neogene en kwartaire afzettingenin de keltische zee. MSc Thesis, University of Gent.
Wing®eld, R.T.R. (1995) A model of sea-levels in theIrish and Celtic seas during the end-Pleistocene toHolocene transition. In: Island Britain: a QuaternaryPerspective (Ed. by R. C. Preece), Geol. Soc. London,Spec. Publ., 96, 209±242.
Yalin, M.S. (1964) Geometrical properties of sandwaves. Proc. Am. Soc. Civil Eng., 90, 105±119.
Yang, C.S. and Sun, J.S. (1988) Tidal sand ridges on theEast China Sea shelf. In: Tide-In¯uenced Sedimen-tary Environments and Facies: Sedimentology andPetroleum Geology (Ed. by P. L. de Boer, A. VanGelder and S. D. Nio), pp. 23±38. Reidel, Dordrecht.
Zimmerman, J.T.F. (1981) Dynamics, diffusion andgeomorphological signi®cance of tidal residual ed-dies. Nature, 290, 549±555.
Manuscript received 28 November 1997;revision accepted 12 November 1998.
Deep shelf tidal sand bank 721
Ó 1999 International Association of Sedimentologists, Sedimentology, 46, 703±721
Top Related
Copyright © 2022 FDOKUMEN

