


Bahasa
Halaman
Hukum

Environmental Management and Manufacturing Performance: The Role of Collaboration in the Supply Chain
Stephan Vachon School of Business and Center for the Environment
Clarkson University P.O. Box 5790
Potsdam, New York, 13699-5790 315-268-3980
Fax: 315-268-3810 [email protected]
Robert D. Klassen Richard Ivey School of Business
The University of Western Ontario London, Ontario, N6A 3K7
519-661-3336 [email protected]
April 15, 2005
under first review by Journal of Operations Management
Keywords: Environmental Management, Supply Chain Management

2
Environmental Management and Manufacturing Performance: The Role of Collaboration in the Supply Chain
Abstract
As corporations attempt to move toward environmental sustainability, management must extend their efforts to improve environmental practices across their supply chain. The literature characterizing environmental management within the supply chain has been slowly building but remains sparse. Using a survey of North American manufacturers, this paper examines the impact of collaborative green supply chain practices (GSCP) on manufacturing performance. Collaborative GSCP were defined to include the interactions between organizations in the supply chain, including such aspects as joint environmental goal setting, shared environmental planning, and working together to reduce pollution or other environmental impacts. These practices can be directed either upstream toward suppliers or downstream toward customers. The influence of collaboration in each direction was empirically assessed for multiple objective and perceptual measures of manufacturing performance using a sample of plants in the package printing industry. Generally, the benefits of collaborative green practices were broadest with suppliers. In contrast, collaboration with customers yielded mixed outcomes. Overall, evidence emerged that upstream practices were more closely linked with process-based performance, while downstream collaboration was associated with product-based performance.
1. Introduction
Over the last decade, environmental management has become important for
manufacturers as they face intense scrutiny from diverse stakeholders groups, including
end-consumers, industrial customers, suppliers, and financial institutions (Henriques and
Sadorsky, 1999). Given this context, manufacturing managers have adopted various
strategies to address the impact of their operations and products on the natural
environment. To date, research has started to link some of these strategies, which can
take the form of an environmental management system (Melnyk et al., 2003), the

3
selection of different environmental technologies (Klassen and Whybark, 1999) and
waste reduction techniques (King and Lenox, 2002), to organizational performance.
In contrast, research is only beginning to examine the impact of boundary-spanning
activities such as green purchasing (Zsidisin and Siferd, 2001), reverse logistics (Carter
and Ellram, 1998), product stewardship (Snir, 2001) and design for the environment
(Chen, 2001) on organizational performance. All of these activities, related to supply
chain management, require varying degrees of interaction with other organizations in the
supply chain, whether upstream with the suppliers or downstream with the customers.
While some of these environment-related interactions have proven to be economically
desirable and serve as good complements to an organization’s environmental strategy
(Bowen et al., 2001; Florida, 1996; Geffen and Rothenberg, 2000), efforts continue to
identify clear patterns.
Along these lines of inquiry, this paper makes three contributions. First, the construct
of environmental collaboration in the supply chain is defined and operationalized within
the growing number of terms attached to green supply chain activities. Second, the
theoretical basis for linking environmental collaboration to manufacturing performance is
established from two related research streams. Finally, the implications of this form of
supply chain relationship for a multi-dimensional assessment of performance are
empirically examined.
This paper is structured into six additional sections. Next, a review of the relevant
literature helps to establish a link among environmental management, supply chain
management, and organizational performance. The third section introduces and defines

4
the construct of environmental collaboration, and hypothesizes how it might be
theoretically linked to the different dimensions of manufacturing and environmental
performance. Following the research methodology (Section 4), the results are presented
(Section 5) and the implications for research and practice are discussed (Section 6).
Finally, several conclusions are drawn, and several avenues for future research are
offered in Section 7.
2. Supply chain and environmental management
This section aims to bring together two important, but often studied separately, fields
in operations management: supply chain management and environmental management.
In doing so, a theoretical basis for the linkage emerges for bringing together
environmental initiatives in the supply chain and organizational performance. This basis
draws heavily on the resource-based view of the firm (RBV) (Barney, 1991) and recent
research applying it within operations management (Schroeder et al., 2002).
The RBV posits that a firm, through the set of resources it possesses, can develop
capabilities providing competitive advantage. In order for a resource to provide
sustainable competitive advantage it needs to be (i) valuable, (ii) rare, (iii) having only a
few substitutes, and (iv) difficult to imitate (Grant, 1996b). The application of RBV
within operations management is sparse but can provide important insights (Amundson,
1998; St. John et al., 2001). For example, manufacturing synergy among business units of
large corporations, measured by the number of common activities within their respective
value chain, can generate manufacturing competencies (St. John and Harrison, 1999). As
discussed in the following section, the RBV offers a sound theoretical lens to both

5
understand potential interactions between firms in supply chains on environmental issues,
as well as the basis for developing improved environmental performance.
2.1 Strategic resource development in the supply chain
Strategic resources can take on several forms, ranging from tacit, relational resources
to codified, proprietary technological resources. Inter-organizational learning, one of
such potential resource that can be developed through supply chain management, entails
a problem solving approach that involves suppliers and/or customers (Schroeder et al.,
2002). As such, this learning can instill additional capabilities in organizations (Dyer and
Singh, 1998; Grant, 1996a; Lorenzoni and Lipparini, 1999; Teece et al., 1997). This
supply chain-driven process of capability development is often referred to as the
relational view of supply chain management, and is a complementary perspective to the
RBV (Chen and Paulraj, 2004; Dyer and Singh, 1998). The relational view suggests that
organizational capabilities can be developed by the combination of resources existing in
different organizations in the supply chain (Dyer and Nobeoka, 2000; Dyer, 1996;
Kaufman et al., 2000; Takeishi, 2001). This perspective has been supported with recent
empirical evidence. For example, greater supply chain integration was associated with
enhanced operational performance such as manufacturing lead time, productivity, and on-
time delivery (Chen et al., 2004; Frohlich and Westbrook, 2001; Liker and Wu, 2000).
Organizations increasingly rely on their supply network to handle more complex
technologies and higher customer expectations. Greater collaboration among
organizations in the supply chain can lead to operational benefits including greater
innovation (Dyer and Nobeoka, 2000), faster time-to-market (Dyer, 1996) and better
financial performance (Carr and Pearson, 1999) – all critical to a firm’s competitiveness.
6
However, greater collaboration, taking the form of knowledge sharing or flexibility in
logistical management, is not always beneficial. Activities such as supplier development,
investment in information technologies, and inter-organizational product development
teams can require significant deployment of resources from the buying and/or supplying
organizations. Hence, several authors warn against blind application of these supply
chain practices throughout the entire supply network, as trade-offs exist and diminishing
returns occur (Buvik and John, 2000; Hartley and Choi, 1996; Rigging and
Mukhopadhyay, 1994). Recent studies have found that greater collaborative supply chain
strategies did not systematically improve flexibility and cost performance in the buying
organization (Dong et al., 2001; Shin et al., 2000).
7
2.2 RBV and the natural environment
The natural-resource-based view of the firm (NRBV), as its label implies, offers an
extension of RBV to environmental management (Hart, 1995). An environmental
management strategy founded on strategic resources that exhibit the properties proposed
by the RBV can theoretically create a sustained competitive advantage (Russo and Fouts,
1997; Sharma and Vredenburg, 1998). For instance, resources derived from proactive
environmental management can generate operational capabilities such as the ability to
more easily manage technological change (Russo and Fouts, 1997), increased stakeholder
integration (Sharma and Vredenburg, 1998), and continuous improvement routine (Hart,
1995).
The NBRV was the theoretical grounds for two survey-based studies involving
manufacturing organizations. Klassen and Whybark (1999) found evidence that the
selection of pollution prevention technologies enabled manufacturing organizations to
develop capabilities difficult for competitors to replicate. Using survey data from the
furniture industry, a greater emphasis on pollution prevention technologies improved
cost, delivery, flexibility, and environmental performance. From a related perspective,
Christmann (2000) argued that manufacturing organizations can develop complementary
capabilities that flow from environmental management to other areas of competitiveness.
For example, developing skills in the use of an early application of pollution prevention
technologies and in finding innovative solution to environmental challenges can build a
synergistic combination of process-related capabilities. This combination, in turn, was
found to yield a cost advantage relative to major competitors.

8
3. Environmental collaboration and manufacturing performance
The limited understanding of environmental management in the supply chain has
hampered the development of a widely-accepted framework that characterizes and
categorizes environmental activities. At this point, a wide variety of definitions, terms
and conceptualizations can be found in the research and practitioner literature (Zhu and
Sarkis, 2004; Zsidisin and Siferd, 2001). For example, Bowen et al. (2001) defined green
supply as the buying organization’s intent to improve the environmental performance of
purchased input and/or of the suppliers that provide them. As such, green supply
includes a wide variety of activities such as cooperation between organizations to
minimize the logistical impact of the material flows, and gathering environmentally
related information about purchased materials and components. Others have proposed
definitions more focused on the purchasing function, suggesting that green supply
activities consist of the involvement of the purchasing function in facilitating internally-
driven environmental activities such as recycle, reuse and source reduction (Carter and
Carter, 1998; Min and Galle, 2001; Zsidisin and Siferd, 2001). Yet others have proposed
definitions that extend beyond departmental functions (e.g., purchasing) to the
organization as a whole (Vachon and Klassen, forthcoming; Zhu and Sarkis, 2004).
Here, the focus is on collaboration between a focal plant and its suppliers and/or its
customers. Environmental collaboration in the supply chain includes a direct
involvement of an organization with its suppliers or customers to jointly develop
environmental solutions (Florida, 1996; Geffen and Rothenberg, 2000; Rao, 2002).

9
3.1 Environmental collaboration
While not unrelated to the definition of Bowen et al. (2001), the construct of
environmental collaboration shifts the focus from a product to characterizing the
supplier-customer relationship. Thus, environmental collaboration captures the notion of
joint planning and solution finding between organizations. Because supply chain
management is increasingly driven by multi-functional teams, activities outside the
purchasing or supply department also must be captured, including downstream customers
(e.g., Frohlich and Westbrook, 2001). Finally, this construct refines the concept of
‘external green supply chain management’ (Zhu and Sarkis, 2004), which combined two
set of activities and two directions in the supply chain. In terms of activities, it is
important to separate uni-directional, control-oriented activities (i.e., monitoring) and bi-
directional, relational activities targeting improvement (i.e., collaboration) (Vachon and
Klassen, forthcoming). Similarly, separating upstream supplier-related collaboration
from downstream customer-related collaboration has both theoretical and managerial
implications.
The focus on collaboration in this paper is important for several reasons. First, based
on the four criteria for defining a strategic resource (RBV), collaborative is expected to
offer a competitive advantage, as these activities are difficult to replicates and socially
complex. In contrast, monitoring activities of suppliers that entail audits, questionnaires
and environmental certification (e.g., ISO 14001) are easily replicated. Second,
collaboration can be initiated by either upstream or downstream supply chain partner, but
then requires long term commitment by both. However, given the likely imbalance in
power in the relationship, with either the supplier or customer wielding more power

10
depending on such factors as size and access to markets, to name a few; it is conceivable
the implications of upstream versus downstream collaboration could differ.
Environmental collaboration activities include knowledge sharing activities
pertaining to greener product design or process modification (Global Environmental
Management Initiative, 2004) and planning for reducing waste in the logistics process
(Bowen et al., 2001). Hence, environmental collaboration focuses less on the immediate
outcome of the supplier- or customer- environmental efforts (e.g., compliance to existing
regulations), and more on the means by which more environmentally-sound operations or
product might be achieved. Because each focal plant acts as a buying organization to its
suppliers and as a supplier to its customers, such collaboration can take place
simultaneously upstream with the suppliers as well as downstream with the customers.
Castrol, a lubricant producer supplying the automotive industry, offers anecdotal
evidence of the benefits and challenges of environmental collaboration (Reiskin et al.,
2000). Castrol worked with one of its customer’s plants to ensure proper use of its
chemical products. This interaction resulted in process modifications leading to
significant savings through less chemical use at the customer’s plant, hence improving
environmental performance. Similar anecdotal evidence has been reported for the
automotive industry (Geffen and Rothenberg, 2000; Global Environmental Management
Initiative, 2001). Specifically, a paint and coating supplier worked on-site in the paint
shop of an automaker to develop a better product-based solution to the ever-increasing
pressure faced by the automakers to reduce volatile organic compound (VOC) emissions.

11
3.2 Linking environmental collaboration to manufacturing performance
Environmental collaboration include the exchange of technical information and
require a mutual willingness to learn about each other’s operations in order to improve
environmental practices (Canning and Hanmer-Lloyd, 2001; Geffen and Rothenberg,
2000). They also include cooperation to reduce the environmental impact associated with
material flows in the supply chain (Bowen et al., 2001; Carter and Carter, 1998). As
noted earlier, these practices take the form of joint planning and decision-making
regarding environmental issues, which is consistent with examples and cases presented in
the green supply chain literature (Geffen and Rothenberg, 2000; Hall, 2000; Handfield et
al., 1997; Walton et al., 1998).
Again several cases in the literature illustrate the linkage between environmental
cooperation and operational performance. For example, Xerox, a leading firm in the
photocopier industry, leveraged its Asset Recycle Management program to generate an
annual savings of $300 to $400 million (Hart, 1997). These savings were the end result
of a broad array of managerial practices that have reshaped the Xerox supply chain. In
particular, Xerox favored partnerships with its suppliers as one critical approach to
fostering the design of more environmentally friendly products (Xerox, 1999). By
interacting with its key suppliers to design products that are easier to remanufacture,
Xerox developed a capability difficult for the competition to replicate, which lead to
improved environmental and operational performance (Reinhardt, 1999).
The competitive advantages generated by environmental collaboration are twofold.
First, collaboration includes knowledge integration and cooperation between
organizations, which are recognized as resources that might generate competitive

12
advantage (Grant, 1996a; Simonin, 1997). As such, manufacturing organizations
adopting collaborative activities with their suppliers and customers can develop
organizational capabilities (Lorenzoni and Lipparini, 1999), which can be expected to
translate not only into improved environmental performance, but also into other
dimensions such as cost and quality (Hart, 1997; Porter and van der Linde, 1995). Case
evidence supports the linkage to improved productivity (Geffen and Rothenberg, 2000),
while limited survey has highlighted improved product quality (Gavaghan et al., 1998)
and financial performance (Carter et al., 2000). Thus, collaboration is expected to
positively influence operational performance (Aragon-Correa, 1998; Porter and van der
Linde, 1995).
Hypothesis 1: As environmental collaboration increases, a plant’s manufacturing performance which includes cost, quality, delivery, and flexibility improves.
Second, environmental collaboration is directly associated with a proactive
environmental management orientation (Bowen et al., 2001), which extends beyond
supply chain management, to respond efficiently and effectively to new environmental
challenges and regulations (Bonifant et al., 1995; Klassen and Whybark, 1999).
Hypothesis 2: As environmental collaboration increases, a plant’s environmental performance improves.
4. Research design
4.1 Sample
The relationship between environmental collaboration and manufacturing
performance was tested using a plant-level survey of the North American package

13
printing industry (United States and Canada). A focused, single industry approach was
adopted to control for the type of manufacturing processes and workflow, which are quite
standardized in this industry, market expectations, echelon in the supply chain, and
environmental regulations. Legislative requirements and customers concerns in this
industry were actively pushing a number of plants to investigate and implement a range
of new environmental technologies that reduced waste and VOC emissions, including
both controls, such as oxidizers to burn emissions, and prevention, such water-based inks.
A survey instrument was developed based on the previously reviewed literature and a
series of extensive interviews with different stakeholders of the package printing
industry. A total of six semi-structured interviews with industry experts (three of which
reviewed the questionnaires) were conducted. These experts were former executives of
large package printing organizations, two government representatives (one from Canada
and one from the United States) and the environmental manager of a large printing
industry association. These interviews were supplemented by six plant visits and six
semi-structured interviews with plant managers. After these interviews and visits, the
questionnaire was further revised and modified to refine and clarify the constructs and
items.
A North American sample of 366 plants with at least 90 employees was compiled
from two exhaustive sources: the Packaging Sourcebook (United States) and Scott’s
Industrial Directory (Canada). After an initial telephone call to the plant manager to
confirm contact information and to introduce the research project, a three-wave survey
process similar to that prescribed by Dillman (2000) was followed. Conducted in 2002,
the survey was offered in both English and French to each potential respondent to

14
encourage participation. A total of 84 completed surveys were received, representing a
response rate of 23%. A chi-square test of independence revealed no evidence that the
respondent pool differed significantly from the target pool along (i) the geographical
location of the respondents (U.S. vs. Canada); (ii) the three segments of the industries
(folding box, flexible packaging and labels); and, (iii) parent company size (companies
with more than three plants vs. companies with three or less plants).
4.2 Environmental collaboration
Two scales were designed to capture the use of collaborative activities over the prior
two years to build a causal linkage with changes in performance over the same time
period. An existing scale in logistics (Ellinger et al., 2000) combined with specific
knowledge from the green supply chain literature (Bowen et al., 2001; Carter and Carter,
1998) was synthesized to construct new, multi-item scales to assess the extent of
environmental collaboration. One five-item scale focused on collaborative activities with
primary suppliers, and an analogous five-item scale focused on major customers
(Appendix A). It should be stressed that all items were structured such that the
responding plant manager could accurately assess the relationship from the perspective of
her/his plant, i.e., the manager did not have to speculate about the operations of another
organization. (For example, Did your plant engage in the following environmental
activities with your primary suppliers?; To what extent did your plant engage in the
following environmental activities with your major customers?).
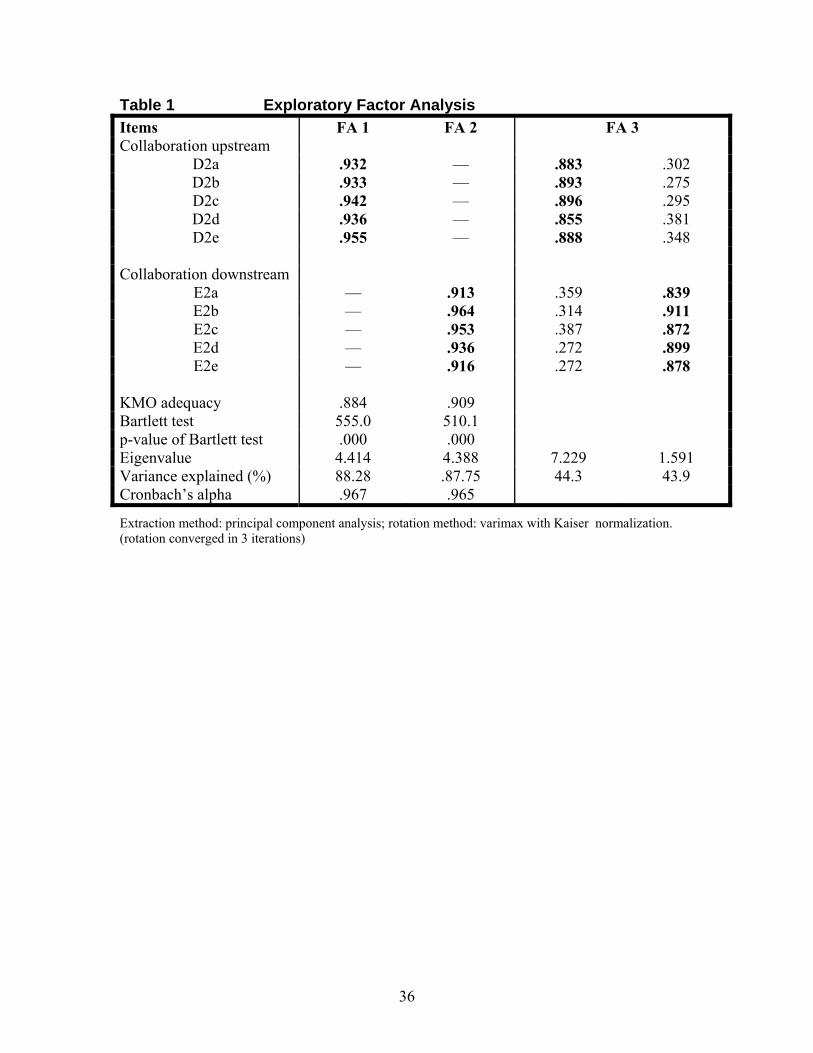
First, the measure of sampling adequacy was assessed, with a score above 0.8 being
considered meritorious (Hair et al., 1998). This measure was 0.88 for environmental
collaboration with suppliers and 0.91 for environmental collaboration with customers

15
(Table 1). In addition, the Bartlett test of sphericity assessed the significance of bivariate
correlation estimates for all items in each scale. The test was highly significant for both
scales with p-values below .001 (Table 1).
Next, exploratory factor analysis was used to clean and refine these scales. This
approach, rather than confirmatory factor analysis (CFA), was used because of the
relatively small sample size. To begin, the unidimensionality of each scale was explored
by conducting a factor analysis on each scale individually. For each, the items loaded on
only one factor, with variance extracted exceeding 87% in both cases (FA1 and FA2 in
Table 1). The reliability of each scale, measured using Cronbach-α, also was above the
recommended threshold of 0.7 (Nunnally, 1978). Finally, when evaluated collectively,
all ten items loaded on their expected scales (FA3, Table 1) with all factor loadings
exceeding .80. Items averages were used in subsequent analysis.
[Insert Table 1 Here]
4.3 Manufacturing performance
Manufacturing performance was defined and measured by a combination of multi-
item scales and objective metrics. While many studies of performance in operations
management have employed perceptual measures (Chen et al., 2004; Dong et al., 2001;
Rosenzweig et al., 2003; Zhu and Sarkis, 2004), relatively few have simultaneously used
objective measures (Flynn and Flynn, 1999; Frohlich and Westbrook, 2001; Vachon and
Klassen, 2002). For perceptual measures of performance, 13 items captured the four
traditional dimensions of manufacturing performance – cost, quality, delivery and
flexibility.

16
In addition, perceptual measures (three items) were added for environmental
performance, similar to Judge and Douglas (1998). These items required the respondent
to evaluate his/her plant’s performance against major competitors (see Appendix A).1
As before, exploratory factor analysis was performed on these multi-item scales
(Table 2). The test for sampling adequacy, at 0.726, was deemed acceptable (Hair et al.,
1998). The Bartlett’s test for sphericity also was highly significant (p < .001), and the
values of Cronbach alpha exceeded the recommended threshold of 0.70. The cumulative
variance extracted was above 70% for the four manufacturing performance dimensions
and the environmental management scale (Table 2). One item was deleted and not use
for further analysis because of cross-loading (i.e., g1_g). The items were averaged for
each of the five performance scales.
[Insert Table 2 Here]
Objective data were collected for two dimensions of manufacturing performance:
quality and delivery. For quality, the percent of production that is scrapped or returned
from the customers was requested from the respondent. On-time delivery, throughput
time, and set-up time (make-ready) are three additional metrics used to evaluate delivery
performance. Respondents were asked to report both current and prior performance
(previous two years). These figures permitted an assessment of the improvement (or
deterioration) experienced by the plant during the two-year period preceding the survey.
The percentage of improvement in each of the four objective metrics was computed and
used as a dependent variable. Because such improvement is highly contingent on the
1 At first glance, given the research objectives, there might be concern about social desirability. However, as noted later in Table 3, the overall scale mean was lower for environmental performance than any of the manufacturing performance dimensions, as the variance was higher. Thus, no evidence was found.

17
starting level of performance (e.g., it is easier to improve by 1% your cycle time when it
is 10 days then when it is 1 day), the lagged performance measures were introduced as an
independent variable in the regression analysis.
4.4 Control variables
Six variables were used to control for the following characteristics: plant size (the
natural logarithm of the number of employees), parent company size (the natural
logarithm of the number of employees), average age of the presses (a key piece of
process technology, in years), extent of investment in new manufacturing equipment
during the previous two years (as percentage of sales), supply base (number of suppliers
normalized by the number of employees at the plant), and customer concentration
(percentage of sales coming from the three largest customers).
5. Empirical results
5.1 Model development
In total, the empirical analyses considered nine models—five perceptual and four
objective performance measures. The independent variables were grouped into two
major sets to employ hierarchical regression:
1. Control variables that include plant size, parent company size, reinvestment rate,
age of presses, supplier base, and customer concentration. For the objective
performance measures, prior performance was also added.
2. Environmental collaboration, including both upstream, supplier collaboration and
downstream, customer-oriented collaboration.

18
For each regression model, the block of six control variables was first introduced,
followed by a block of the two environmental collaboration variables. By structuring the
analysis this way, the incremental variance explained by the environmental collaboration
variables could be assessed explicitly. The incremental squared multiple correlation
coefficient (R2) are reported for each model, along with the coefficient estimates for the
full model (i.e., all independent variables).
Pairwise correlations for performance metrics and all independent variables are
presented in Table 3. From these correlations, model specification adjustments were
needed to examine the impact of environmental collaboration on performance: the high
correlation between the supplier and customer environmental collaboration variables
(0.64) indicated that the two variables should be considered both individually and
simultaneously to assess their impact on manufacturing performance.
[Insert Table 3 Here]
5.2 Environmental collaboration
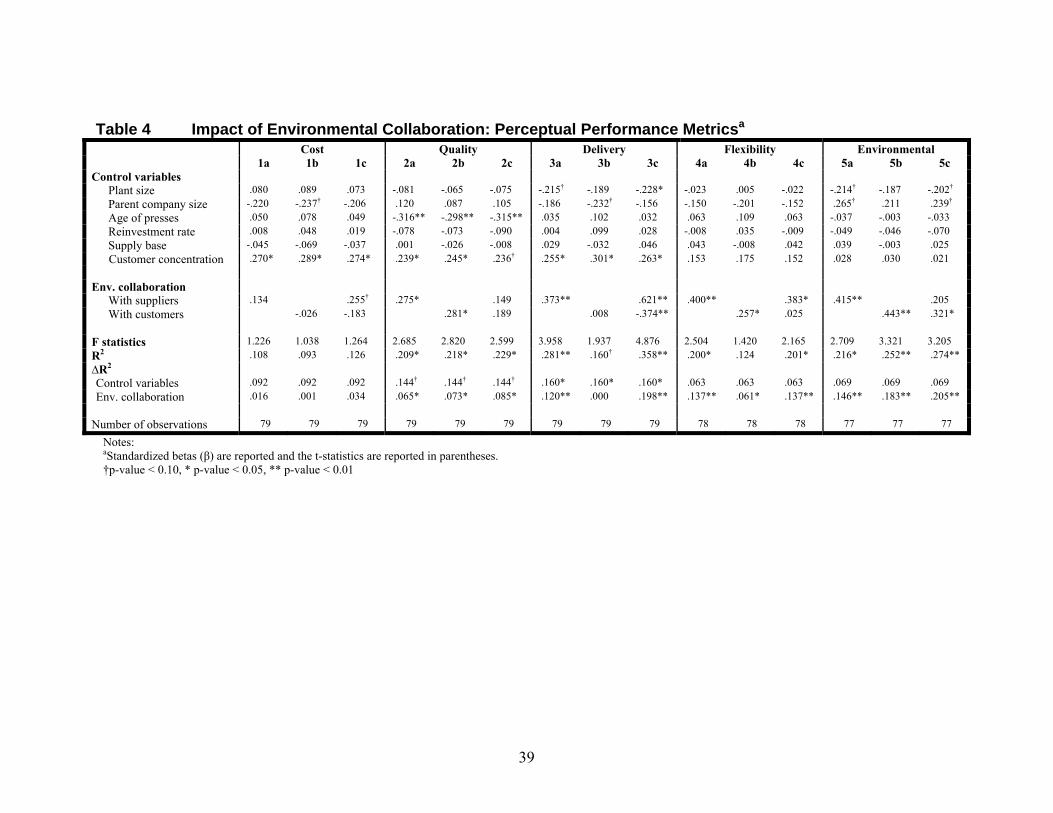
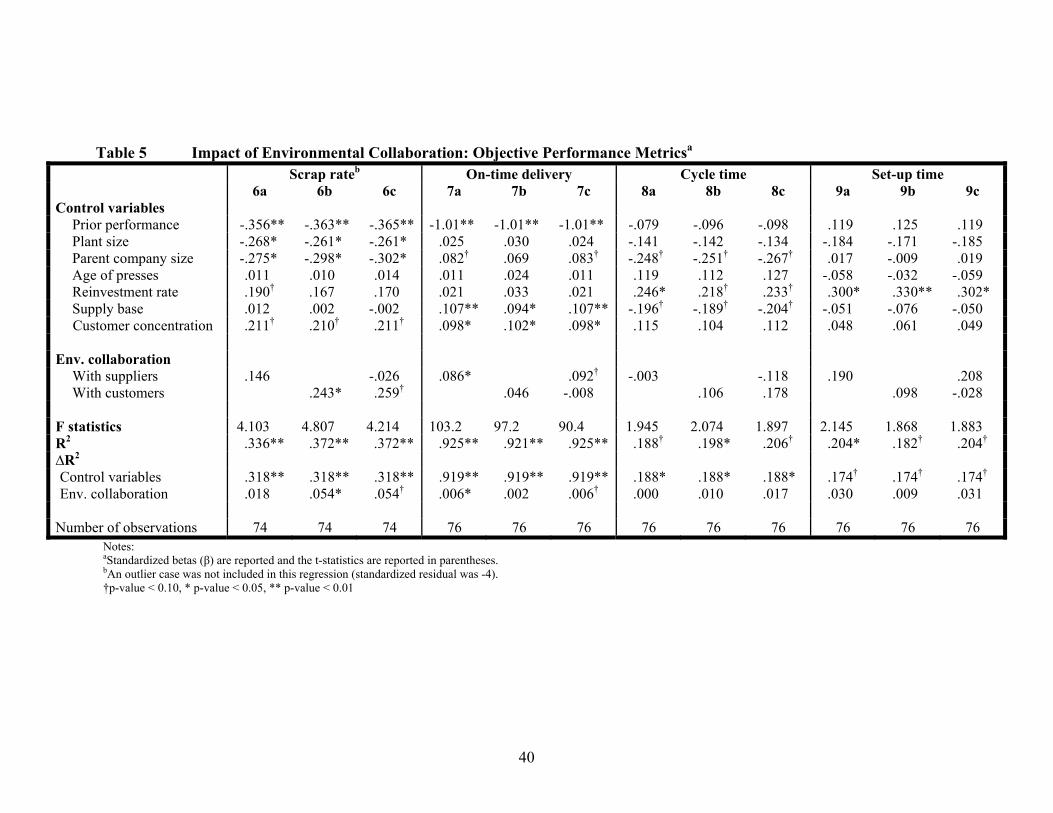
The regression analysis results are presented in Tables 4 and 5 for the perceptual and
objective performance measures, respectively. Overall, the results provide substantial
support for H1. Thus, empirical evidence was found that environmental collaboration
among organizations in the supply chain taking the form of cooperating in environmental
planning, establishing common environmental goals, and jointly addressing
product/process-related issues positively impact manufacturing performance.
First, although environmental collaboration was not significantly linked with cost
performance (Model 1), collaboration was positively linked with quality performance.

19
The results for the quality scale suggest that environmental collaboration with suppliers
(Models 2a, p < .05) and customers (Model 2b, p < .05) were related to at least two
aspects of quality: product durability and conformance to specifications. Environmental
collaboration with customers also was associated with greater quality improvement, as
measured by reduced scrap rates during the preceding two-year period (Model 6b, p <
.05; Model 6c, p < .10). Hence, collaboration with customers on environmental aspects
can create synergy that fosters improvement across the broader supply chain network
extending from supplier to customer.
[Insert Table 4 Here]
[Insert Table 5 Here]
Second, a positive relationship was found between environmental collaboration and
the delivery performance scale, providing support for another dimension of
manufacturing performance. For instance, collaboration upstream with suppliers was
linked to better delivery performance (Models 3a and 3c, p < .01). This result was
corroborated by the objective measure of on-time delivery (Model 7a, p < .05; Model 7c,
p < .10), where supplier collaboration was positively associated with improvement.
Hence, engaging in joint environmental planning and goal setting with the suppliers can
improve the competitiveness in regards to speed and delivery reliability, as measured
through perceived performance against primary competitors and the percentage of
deliveries made on-time. (Although customer collaboration appears to be make on-time
delivery worse (Model 3c), this spurious result is caused by collinearity, as indicated by
Model 3b.)

20
Finally, the analysis of the relationship between environmental collaboration and
flexibility performance identified another aspect in support of H1. A positive
relationship between collaboration with suppliers and the manufacturing flexibility was
identified (Models 4a, p < .01; Model 4c, p < .05). A similar result holds for
environmental collaboration with customers (Model 4b, p < .05).
For environmental performance (H2), as expected, strong support was found linking
collaboration with performance (as suggested by the substantial ∆R2 of 0.21 in Model
5c). Both environmental collaboration with suppliers (Model 5a, p < .01) and customers
(Models 5b, p < .01) were significantly linked to overall environmental performance.
This survey-based finding is consistent with the anecdotal evidence reported by other
researchers. An internal environmental planning and environmental problem-solving
culture – two characteristics of an environmental management system such as ISO 14001
– has been observed to improve environmental performance (Jayathirtha, 2001; Kitazawa
and Sarkis, 2000; Raiborn et al., 1999). The results here indicate that a plant’s
environmental performance can further benefit from extending these activities beyond
firm boundaries to collaborate actively with major customers and/or primary suppliers.
5.3 Control variables
While not the primary focus of this paper, it is interesting to quickly note that a
number of control variables were related to performance, for the most part in the
expected direction. First, customer concentration was related to better manufacturing
performance, or greater improvement, across several dimensions including cost (Model 1,
p < .05), quality (Model 2, p < .10; Model 6, p < .10), and delivery (Model 3, p < .05;
Model 7, p < .05). Together, these results suggest that a smaller customer base offers

21
significant competitive benefits. However, these findings must be tempered with
strategic concerns about a potential over-dependency on a few customers, and short-
versus long-term performance.
In contrast, having a larger supplier base was linked with greater improvements in on-
time deliveries (Model 7, p < .05). This last result is not counter-intuitive as more
suppliers can reduce the risk of material stock-out. Finally, recent investment in
equipment yielded significant improvements in several manufacturing performance
metrics, including cycle time and set up time (Model 8, p < .10; Model 9, p < .05). Again
this is not surprising as a lot of the investments in the printing industry in recent years
targeted presses automation (e.g., rolls auto-cleaner) and make-ready technologies (e.g.,
computer-to-plate).
6. Discussion
6.1. Linking the findings to the existing empirical literature.
The findings highlighted in the previous section indicate that environmental
collaboration with primary suppliers and major customers, defined as encompassing joint
environmental planning activities and cooperation in finding solution to environmental
challenges, can have a significant positive impact on both manufacturing and
environmental performance.
The positive linkage between environmental collaboration different dimensions of
manufacturing performance adds further support to the growing body of literature
espousing the natural resource-based view of the firm (Hart, 1995). The results obtained
here complement those reported in previous research. For example, a strong linkage has
22
been noted between the extent of involvement of external stakeholders, including
customers and distributors, in the implementation of an ISO-certified environmental
management systems and the degree of competitive advantage derived from the ISO
14001 certification (Delmas, 2001).
Empirically, the results are also consistent with a recent study that linked
environmental activities in supply chain to environmental performance and cost
competitiveness. For example, Rao (2002) found a significant and positive relationship
between the degree of dissemination of environmental knowledge by buying
organizations in the supply chain and these organizations’ environmental performance.
Another study found a positive link between green supply chain practices (including a
mix of collaboration and monitoring activities) and both environmental and economic
performance (Zhu and Sarkis, 2004). Furthermore, considering that environmental
performance, as one component of operational performance, ultimately has repercussions
for financial performance (Klassen and McLaughlin, 1996), the results here also enrich
our understanding of how different aspects of green supply chain management affect
operational performance (Carter et al., 2000; Christmann, 2000; Melnyk et al., 2003;
Sarkis and Cordeiro, 2001). For example, environmental purchasing, defined as the
involvement of the purchasing function in environment-related projects within the
organization, was positively linked to net income and negatively linked to cost (Carter et
al., 2000). Finally, the results provide support to proposition that an organization with
proactive environmental management will develop innovative solutions to environmental,
which in turn leads to improvement in other facets of the organization’s operations
(Aragon-Correa, 1998; Porter and van der Linde, 1995; Russo and Fouts, 1997).

23
6.2. Theoretical implications
While it is important to consider these findings against the backdrop of earlier
empirical work, assessing theoretical implications ultimately lays the groundwork for
systematic improvements in practice and future research. Environmental challenges
invariably demand complex solutions because of the numerous interactions between
firms, their supply chain networks, regulators, and the public. For the supply chain
network, environmental collaboration requires organizations’ respective know-how and
technologies to, first, be shared, and second, to be integrated. More specifically, two
direct outcomes of environmental collaboration are the development of knowledge
sharing routines and the development of the capability to integrate external resources
(Dyer and Singh, 1998). Such a combination of resources can lead to a competitive
advantage (Grant, 1996b; Lorenzoni and Lipparini, 1999; St. John and Harrison, 1999).
While not the only pathway to improvement, environmental collaboration can initiate or
prompt the development of capabilities for integration of internal and external know-how
and technologies. This tacit capability, as it expands and deepens, can build a resource
that is difficult to replicate, leading in turn to a competitive advantage, consistent with the
natural resource-based view (Hart, 1995).
Juxtaposed with RBV, further theoretical development based on the relational view of
the firm (Dyer and Singh, 1998) has contributed to the emergence of the collaborative
paradigm in the supply chain literature (Chen and Paulraj, 2004). This paradigm
proposes that organizations operate within a network of inter-dependent relationships
developed and fostered through strategic level interaction. The primary emphasis of the
research related to this view focuses on activities pertaining to supply chain performance
24
such as lower cost, faster time-to-market, and improved quality are considered. For
example, information sharing and integration improves supply chain efficiency through
lower inventory and better delivery performance (Cachon and Fisher, 2000; Lee et al.,
2000). Similarly, faster innovation cycle and product quality was positively linked to
strategic level integration (Dyer, 1996; Kaufman et al., 2000; Trent and Monczka, 1999).
All of these competitive dimensions are primarily associated with what could be viewed
as “core” operations or products.
However, the research conducted within the relational paradigm is rather silent on
historically peripheral (non-core) activities such as those related to the natural
environment. Yet, environmental issues increasingly cannot be managed in isolation
from other supply chain activities. Thus, not only must buyer-supplier relationships
evolve and mature through time (Dwyer et al., 1987; Webster, 1992), but as these
relationships develop, environmental collaboration can form one component. Hence, the
linkage between strategic core matters and non-core concerns (i.e., environmental
management in the supply chain) implies that the scope of collaborative paradigm must
be similarly expanded. One theoretical framework under which the boundaries of the
relational paradigm might be enlarged is to consider supply chain management within the
broader context of sustainable development (Lamming et al., 1999). Sustainable
development and the triple bottom-line capture the three dimensions of economic, social
and environmental performance (sometimes termed the 3Ps of profits, people and planet).
6.3. Managerial implications
Together, these results have direct implications for practice. Environmental
collaboration with suppliers contributed to a relatively broad range of competitive
25
benefits, while collaboration with customers offered a comparably narrower set.
Collaboration with suppliers on environmental issues was linked to improvement in three
traditional dimensions of manufacturing performance — quality, delivery and flexibility
— in addition to environmental performance. In contrast, if quality performance is
manufacturing’s primary strategic thrust, then collaboration with the customers can offer
a further synergistic mechanism to achieve competitive gains.
6.4. Limitations
While studying a single industry allows for greater control over contextual and
operational factors, it is not without its drawbacks. First, using a single industry that
forms a single echelon in the supply chain allowed greater specificity in detailing and
surveying the types of integration activities underway, but potentially limits external
generalizability. Future research would benefit from expanding this investigation across
multiple echelons in a supply chain, possibly using either a case- or survey-based
approach.
A second limitation of the design of this study is the fact that it used only one
respondent, which might potentially create grounds for bias. Second, any potential bias
introduced by the single respondent cannot be explicitly ruled out; however, earlier
research suggests no major concerns (Youndt et al., 1996), and careful targeting of a
knowledgeable respondent can assist in overcoming potential problems with common
method variance (Miller and Roth, 1994).

26
7. Conclusions and future research avenues
This study focused on the impact of environmental collaboration in the supply chain
on manufacturing and environmental performance. Environmental collaboration was
defined as the interaction between organizations in the supply chain pertaining to joint
environmental planning and shared environmental know-how or knowledge. As such,
any monitoring or control elements usually included in green purchasing or green supply
chain (e.g., plant audits, questionnaires) were explicitly excluded from the study. That
way it was possible to evaluate the impact of potential resource building environmental
activities in the supply chain.
Environmental collaboration with primary suppliers was predominantly linked to
superior delivery and flexibility performance. Similarly, environmental collaboration
with customers was predominantly linked to better quality performance. Hence,
upstream collaboration was essentially linked to process-based performance taking the
form of fast deliveries, reliable deliveries, and greater ability to cope with unforeseen
events. In contrast, downstream collaboration was associated with product-based
performance taking the form of conformance to specifications and durability. One key
supply management activity, if not the most important, is to assure the quality of inputs
used in the production process. Therefore, environmental collaboration with customers
can easily be predisposed to integrate product-based quality and environmental issues
explaining the results of this paper. On the other hand, buying organizations want quality
inputs because defective or sub-par inputs will ultimately be reflected in their own
product quality and in other performance dimensions such as delivery.

27
These results suggest a link that would exist between environmental management in
the supply chain and quality management practices within a plant. The link between
internal environmental management and quality management systems has been
established in the literature (Chen 2001; Curkovic et al. 2000; King and Lenox 2001).
However, very little research was conducted on the potential link between environmental
activities in the supply chain and internal quality management practices. Most likely,
environmental collaboration, being a form of proactive environmental management, will
be linked to quality management practices geared towards preventing failures rather than
having an emphasis on troubleshooting or on appraisal activities.
The dichotomy observed regarding the impact of upstream and downstream
collaboration on different manufacturing performance is important for future research in
the supply chain field. First, a lot of studies in recent years combined upstream and
downstream activities in one unified construct (Rosenzweig et al., 2003; Zhu and Sarkis,
2004). While conceptually correct, this approach can hide some important research
contributions as suggested by the results of this paper. Alternatively, some studies pulled
together different dimensions of manufacturing performance within one organizational
performance construct (Rao, 2002; Krause et al. 2000; Prahinski and Benton 2004) which
can lead to a similar shortcoming in the findings.
One important organizational characteristic, outside the scope of this paper, could
have furthered our understanding of the collaboration-performance relationship: the
capacity of an organization to absorb knowledge transfers. Such capacity varies greatly
among organizations (Cohen and Levinthal 1990; Lane and Lubatkin 1998) and can be
insightful in studying the collaboration-performance relationship. In fact, greater

28
absorptive capacity helps organizations to cultivate and transform knowledge acquired in
the supply chain more effectively. Hence, it can be expected that higher degree of
absorptive capacity will moderate the collaboration-performance relationship.
Finally, a possible extension to the current research would be to expand this line of
research to the service sector. The greater part of environmental management research
has been concentrated in the manufacturing sector, with special emphasis on industries
with a high environmental impact such as the chemical (Christmann 2000), furniture
(Klassen and Whybark 1999), electronics (Krut and Karasin 1999), and automotive
(Geffen and Rothenberg 2000) industries. While the service sector represents more than
75% of the industrialized economy, it has not attracted much attention in the
environmental management literature (Salzman 2000). Some studies based on anecdotal
evidence in the hospitality industry (Enz and Siguaw 1999) and in the health care
industry (Messelbeck and Whalley 1999) have started to build the recognition that service
operations can be harmful to the environment. However, theoretical and conceptual
development is practically nonexistent in the literature.

29
APPENDIX A Questionnaire Items
Environmental Collaboration with Suppliers During the past two years, to what extent did your plant engage in the following environmental activities with your primary suppliers (inks, substrates, equipment)? (1=not at all, 4 = moderately, 7 = great extent)
D2a Achieving environmental goals collectively. D2b Developing a mutual understanding of responsibilities regarding environmental performance. D2c Working together to reduce environmental impact of our activities. D2d Conducting joint planning to anticipate and resolve environmental-related problems. D2e Making joint decisions about ways to reduce overall environmental impact of our products.
Environmental Collaboration with Customers During the past two years, to what extent did your plant engage in the following environmental activities with your major customers? (1 = not at all, 4 = moderately, 7 = great extent)
E2a Achieving environmental goals collectively. E2b Developing a mutual understanding of responsibilities regarding environmental performance. E2c Working together to reduce the environmental impact of our activities. E2d Conducting joint planning to anticipate and resolve environmental-related problems. E2e Making joint decisions about ways to reduce the environmental impact of our product.
Manufacturing Performance For each of the items listed below, how does the plant compare relative to your primary competitors? (1 = far worse than competitors, 4 = about the same as competitors, 7 = far better than competitors)
g1_a Production costs. g1_b Total product costs. g1_c Labor productivity. g1_d Conformance to design (e.g., color intensity/structural property). g1_e Product durability (e.g., color fading, substrate resistance). g1_f Perceived overall product quality. g1_g Promptness in solving customer complaints. (dropped) g1_h Order fulfillment speed. g1_i Manufacturing throughput time. g1_j Meeting delivery due date. g1_k Ability to change delivery date. g1_l Ability to change output volume. g1_m Ability to change product mix. g1_n Solid waste disposal. g1_o Air emissions. g1_p Water emissions.
What percentage of customer orders is delivered accurately (e.g., quantity and specifications) at the time promised?
two years ago (2000) _______ % on time now (2002) ______ % on time
For a typical job, about how much time elapses from the start of the first operation until a batch of products is finished (including imaging, pre-press and post-press operations if any)?
two years ago (2000) _______ days now (2002) ______ days

30
On average, approximately how much time does it take to make a changeover on the press (i.e., set-up time or make ready time)?
two years ago (2000) _______ hours now (2002) ______ hours
What percentage of production does not meet specifications resulting in scrap or returns from customers (also known as spoilage or first-pass scrap rate):
two years ago (2000) _______ % scrap now (2002) ______ % scrap
Control Variables A4 Please indicate the number of suppliers that your plant has for each of the following: substrates
(all of them), inks, and all other suppliers (maintenance, equipment, transportation). (number of suppliers)
B3 Please indicate the percentage of your plant’s total sales represented by your three largest customers (customer concentration)
F3 On average over the past two years, what percentage of the plant’s total capital budget was
allocated to investments in environmental projects? (% of environmental investment)
H1 As of the beginning of January 2002, how many employees (full-time equivalent) work at your plant? (plant size)
H2 As of the beginning of January 2002, how many employees work in the entire organization (parent company) including your plant? (firm size)
H9 On average, over the last two years, about what percent of annual sales has been invested in new manufacturing equipment? (reinvestment rate)
H12 What is the average age of the presses (in year)? (age of presses)

31
References Amundson, S.D. (1998), "Relationships Between Theory-Driven Empirical Research in Operations Management and Other Disciplines.," Journal of Operations Management, 16 (4), 341-59.
Aragon-Correa, J.A. (1998), "Strategic Proactivity and Firm Approach to the Natural Environment," Academy of Management Journal, 41 (5), 556-67.
Barney, J. (1991), "Firm Resources and Sustained Competitive Advantage," Journal of Management, 17 (1), 99-120.
Bonifant, B.C., M.B. Arnold, and F.J. Long (1995), "Gaining Competitive Advantage Through Environmental Investments," Business Horizons, 38 (4), 37-47.
Bowen, F.E., P.D. Cousins, R.C. Lamming, and A.C. Faruk (2001), "The Role of Supply Management Capabilities in Green Supply," Production and Operations Management, 10 (2), 174-89.
Buvik, A. and G. John (2000), "When Does Vertical Coordination Improve Industrial Purchasing Relationships?," Journal of Marketing, 64 (4), 52-64.
Cachon, G.P. and M. Fisher (2000), "Supply Chain Inventory Management and the Value of Shared Information," Management Science, 46 (8), 1032-48.
Canning, L. and S. Hanmer-Lloyd (2001), "Managing the Environmental Adaptation Process in Supplier-Customer Relationships," Business Strategy and the Environment, 10, 225-37.
Carr, A.S. and J.N. Pearson (1999), "Strategically Managed Buyer-Supplier Relationships and Performance Outcomes," Journal of Operations Management, 17 (5), 497-519.
Carter, C.R. and J.R. Carter (1998), "Interorganizational Determinants of Environmental Purchasing: Initial Evidence from the Consumer Products Industries," Decision Sciences, 29 (3), 659-84.
Carter, C.R., R. Kale, and C.M. Grimm (2000), "Environmental Purchasing and Firm Performance: An Empirical Investigation," Transportation Research Part E, 36 (3), 219-28.
Carter, Craig R. and L.M. Ellram (1998), "Reverse Logistics: A Review of the Literature and Framework for Future Investigation," Journal of Business Logistics, 19 (1), 85-102.
Chen, C. (2001), "Design for the Environment: A Quality-Based Model for Green Product Development," Management Science, 47 (2), 250-63.
Chen, I.J. and A. Paulraj (2004), "Towards a Theory of Supply Chain Management: The Constructs and Measurements," Journal of Operations Management, 22 (2), 119-50.
Chen, I.J., A. Paulraj, and A.A Lado (2004), "Strategic Purchasing, Supply Management, and Firm Performance," Journal of Operations Management, 22 (5), 505-23.
Christmann, P. (2000), "Effect of 'Best Practices' of Environmental Management on Cost Advantage: The Role of Complementary Assets," Academy of Management Journal, 43 (4), 663-80.
Cohen, W.M. and D.A. Levinthal (1990), "Absorptive Capacity, A New Perspective on Learning and Innovation," Administrative Science Quarterly, 35 (1), 128-52.
Curkovic, S., S.A. Melnyk, R.B. Handfield, and R. Calantone (2000), "Investigating the Linkage Between Total Quality Management and Environmentally Responsible Manufacturing," IEEE Transactions on Engineering Management, 47 (4), 444-63.
32
Delmas, M. (2001), "Stakeholders and Competitive Advantage: The Case of ISO 14001," Production and Operations Management, 10 (3), 343-58.
Dillman, D.A. (2000), Mail and Internet Survey: The Tailored Design Method (Second ed.). New York (New York): John Wiley and Sons.
Dong, Y., C.R. Carter, and M.E. Dresner (2001), "JIT Purchasing and Performance: An Exploratory Analysis of Buyer and Supplier Perspectives," Journal of Operations Management, 19 (4), 471-83.
Dwyer, F.R., P.H. Schurr, and S. Oh (1987), "Developing Buyer-Seller Relationships," Journal of Marketing, 51, 11-27.
Dyer, J. and K. Nobeoka (2000), "Creating and Managing a High-Performance Knowledge-Sharing Network: The Toyota Case," Strategic Management Journal, 21 (3), 345-67.
Dyer, J.H. (1996), "Specialized Supplier Networks as a Source of Competitive Advantage: Evidence from the Auto Industry," Strategic Management Journal, 17 (4), 271-93.
Dyer, J.H. and H. Singh (1998), "The Relational View: Cooperative Strategy and Source of Interorganizational Competitive Advantage," Academy of Management Review, 23 (4), 660-79.
Ellinger, A.E., P.J. Daugherty, and S.B. Keller (2000), "The Relationship Between Marketing/Logistics Interdepartmental Integration and Performance in U.S. Manufacturing Firms: An Empirical Study," Journal of Business Logistics, 21 (1), 1-22.
Enz, C.A. and J.A. Siguaw (1999), "Best Hotel Environmental Practices," Cornell Hotel and Restaurant Administration Quarterly, 40 (5), 72-77.
Florida, R. (1996), "Lean and Green: The Move to Environmentally Conscious Manufacturing," California Management Review, 39 (1), 80-105.
Flynn, B. and E. Flynn (1999), "Information-Processing Alternatives for Coping with Manufacturing Environment Complexity," Decision Sciences, 30 (4), 1021-52.
Frohlich, M.T. and R. Westbrook (2001), "Arcs of Integration: An International Study of Supply Chain Strategies," Journal of Operations Management, 19 (2), 185-200.
Gavaghan, K., R. Calahan-Klein, J.P. Olson, and T.E. Pritchett (1998), "The Greening of the Supply Chain," Supply Chain Management Review, 2 (2), 76-84.
Geffen, C.A. and S. Rothenberg (2000), "Suppliers and Environmental Innovation: The Automotive Paint Process," International Journal of Operations and Production Management, 20 (2), 166-86.
Global Environmental Management Initiative (2004), "Forging New Links: Enhancing Supply Chain Value Through Environmental Excellence." (www.gemi.org)
---- (2001), "New Path to Business Value." (www.gemi.org)
Grant, R.M. (1996a), "Prospering in Dynamically-Competitive Environments: Organizational Capability as Knowledge Integration," Organization Science, 7 (4), 375-87.
---- (1996b), "Toward a Knowledge-Based Theory of the Firm," Strategic Management Journal, 17 (Special Issue), 109-22.
Hair, J.F., R.E. Anderson, R.L. Tatham, and W.C. Black (1998), Multivariate Data Analysis (Fifth Edition ed.). Upper Saddle River, NJ: Prentice Hall.
Hall, J. (2000), "Environmental Supply Chain Dynamics," Journal of Cleaner Production, 8, 455-71.

33
Handfield, R.B., S.V. Walton, L.K. Seegers, and S.A. Melnyk (1997), "'Green' Value Chain Practices in the Furniture Industry," Journal of Operations Management, 15 (4), 293-315.
Hart, S.L. (1997), "Beyond Greening: Strategies for a Sustainable World," Harvard Business Review, 75 (1), 66-76.
---- (1995), "A Natural-Resource-Based View of The Firm," Academy of Management Review, 20 (4), 986-1014.
Hartley, J.L. and T.Y. Choi (1996), "Supplier Development: Customers as a Catalyst of Process Change," Business Horizons, 39 (4), 37-44.
Henriques, I. and P. Sadorsky (1999), "The Relationship Between Environmental Commitment and Managerial Perceptions of Stakeholder Importance," Academy of Management Journal, 42 (1), 87-99.
Jayathirtha, R.V. (2001), "Combating Environmental Repercussions Through TQEM and ISO 14000," Business Strategy and the Environment, 10, 245-50.
Judge, W.Q. and T.J. Douglas (1998), "Performance Implications of Incorporating Natural Environmental Issues into the Strategic Planning Process: An Empirical Assessment," Journal of Management Studies, 35 (2), 241-62.
Kaufman, A.K., C.H. Wood, and G. Theyel (2000), "Collaboration and Technology Linkages: A Strategic Supplier Typology," Strategic Management Journal, 21 (6), 649-63.
King, A. and M. Lenox (2002), "Exploring the Locus of Profitable Pollution Reduction," Management Science, 48 (2), 289-99.
King, A.A. and M.J. Lenox (2001), "Lean and Green? An Empirical Examination of the Relationship Between Lean Production and Environmental Performance," Production and Operations Management, 10 (3), 244-56.
Kitazawa, S. and J. Sarkis (2000), "The Relationship Between ISO 14001 and Continuous Source Reduction Programs," International Journal of Operations & Production Management, 20 (2), 225-48.
Klassen, R. D. and C. McLaughlin (1996), "The Impact of Environmental Management on Firm Performance," Management Science, 42 (8), 1199-214.
Klassen, R.D and D.C. Whybark (1999), "The Impact of Environmental Technologies on Manufacturing Performance," Academy of Management Journal, 42 (6), 599-615.
Krut, R. and L. Karasin (1999), "Supply Chain Environmental Management: Lessons from Leaders in the Electronics Industry," United States-Asia Environmental Management.
Lamming, R., A. Faruk, and P.D. Cousins (1999), "Environmental Soundness: A Pragmatic Alternative to Expectations of Sustainable Development in Business Strategy," Business Strategy and the Environment, 8 (3), 177-88.
Lane, P.J. and M. Lubatkin (1998), "Relative Absorptive Capacity and Interorganizational Learning," Strategic Management Journal, 19 (5), 461-77.
Lee, H.L., K.C. So, and C.S. Tang (2000), "The Value of Information Sharing in a Two-Level Supply Chain," Management Science, 46 (5), 626-43.
Liker, J.K. and Y.C. Wu (2000), "Japanese Automakers, U.S. Suppliers and Supply-Chain Superiority," Sloan Management Review, 42 (1), 81-93.

34
Lorenzoni, G. and A. Lipparini (1999), "The Leveraging of Interfirm Relationships as a Distinctive Organizational Capability: a Longitudinal Study," Strategic Management Journal, 20 (4), 317-38.
Melnyk, S.A., R.P. Sroufe, and R. Calantone (2003), "Assessing the Impact of Environmental Management Systems on Corporate and Environmental Performance," Journal of Operations Management, 21 (2), 329-51.
Messelbeck, J. and M. Whalley (1999), "Greening the Health Care Supply Chain: Triggers of Change, Models for Success," Corporate Environmental Strategy, 6 (1), 38-45.
Miller, J.G. and A.V. Roth (1994), "A Taxonomy of Manufacturing Strategies," Management Science, 40 (3), 285-304.
Min, H. and W.P. Galle (2001), "Green Purchasing Practices of US Firms," International Journal of Operations and Production Management, 21 (9), 1222-38.
Nunnally, J.C. (1978), Psychonometric Theory. New York: McGraw-Hill.
Porter, M.E. and C. van der Linde (1995), "Green and Competitive: Ending the Stalemate," Harvard Business Review, 73 (5), 120-33.
Prahinski, C. and W.C. Benton (2004), "Supplier Evaluations: Communication Strategies to Improve Supplier Performance," Journal of Operations Management, 22 (1), 39-62.
Raiborn, C.A., B.E. Joyner, and J.W. Logan (1999), "ISO 14000 and the Bottom Line: Environmental Standard can Lead to Sustainable Competitive Advantage," Quality Progress, 32 (11), 89-93.
Rao, P. (2002), "Greening the Supply Chain: A New Initiative in South East Asia," International Journal of Operations and Production Management, 22 (6), 632-55.
Reinhardt, F.L. (1999), "Bringing the Environment Down to Earth," Harvard Business Review, 77 (4), 149-57.
Reiskin, E.D., A.L. White, J. Kauffman-Johnson, and T.J. Votta (2000), "Servicizing the Chemical Supply Chain," Journal of Industrial Ecology, 3 (2), 19-31.
Rigging, F.J. and T. Mukhopadhyay (1994), "Interdependent Benefits from Interorganizational Systems: Opportunities for Business Partner Reengineering," Journal of Management Information Systems, 11 (2), 37-57.
Rosenzweig, E.D., A.V. Roth, and J.W. Dean (2003), "The Influence of an Integration Strategy on Competitive Capabilities and Business Performance: An Exploratory Study of Consumer Products Manufacturers," Journal of Operations Management, 21 (4), 437-56.
Russo, M.V. and P.A. Fouts (1997), "A Resource-Based Perspective on Corporate Environmental Performance and Profitability," Academy of Management Journal, 40 (3), 534-59.
Salzman, J. (2000), "Environmental Protection Beyond the Smokestack: Addressing the Impact of the Service Economy," Corporate Environmental Strategy, 7 (1), 20-37.
Sarkis, J. and J.J. Cordeiro (2001), "An Empirical Evaluation of Environmental Efficiencies and Firm Performance: Pollution Prevention Versus End-of-Pipe Practice.," European Journal of Operational Research, 135 (1), 102-13.
Schroeder, R.G., K.A. Bates, and M.A. Junttila (2002), "A Resource-Based View of Manufacturing Strategy and the Relationship to Manufacturing Performance," Strategic Management Journal, 23 (1), 105-17.

35
Sharma, S. and H. Vredenburg (1998), "Proactive Corporate Environmental Strategy and the Development of Competitilevy Valuable Organizational Capabilites," Strategic Management Journal, 19 (8), 729-53.
Shin, H., D.A. Collier, and D.D. Wilson (2000), "Supply Management Orientation and Supplier/Buyer Performance," Journal of Operations Management, 18 (3), 317-33.
Simonin, B.L. (1997), "The Importance of Collaborative Know-How: An Empirical Test of the Learning Organization," Academy of Management Journal, 40 (5), 1150-74.
Snir, E.M. (2001), "Liability as a Catalyst for Product Stewardship," Production and Operations Management, 10 (2), 190-206.
St. John, C.H., A.R. Cannon, and R.W. Pouder (2001), "Change Drivers in the New Milllennium: Implications for Manufacturing Strategy Research," Journal of Operations Management, 19 (2), 143-60.
St. John, C.H. and J.S. Harrison (1999), "Manufacturing-Based Relatedness, Synergy, and Coordination," Strategic Management Journal, 20 (2), 129-45.
Takeishi, A. (2001), "Bridging Inter- and Intra-Firm Boundaries: Management of Supplier Involvement in Automobile Product Development," Strategic Management Journal, 22 (5), 403-33.
Teece, D.J., G. Pisano, and A. Shuen (1997), "Dynamic Capabilities and Strategic Management," Strategic Management Journal, 18 (7), 509-33.
Trent, R.J. and R.M. Monczka (1999), "Achieving World-Class Supplier Quality," Total Quality Management, 10 (6), 927-38.
Vachon, S. and R.D. Klassen (2002), "An Exploratory Investigation of the Effects of Supply Chain Complexity on Delivery Performance," IEEE Transactions in Engineering Management, 49 (3), 218-30.
---- (Forthcoming), "Extending Green Practices across the Supply Chain: The Impact of Upstream and Downstream Integration," International Journal of Operations and Production Management.
Walton, S.V., R.B. Handfield, and S.A. Melnyk (1998), "The Green Supply Chain: Integrating Suppliers into Environmental Management Processes," International Journal of Purchasing and Materials Management, 34 (2), 2-11.
Webster, F.E. (1992), "The Changing Role of Marketing in the Corporation," Journal of Marketing, 56 (4), 1-17.
Xerox (1999), "Environment, Health and Safety Report."
Youndt, M.A., S.A.. Snell, J. Dean, and D.P. Lepak (1996), "Human Resource Management, Manufacturing Strategy, and Firm Performance," Academy of Management Journal, 39 (4), 836-66.
Zhu, Q. and J. Sarkis (2004), "Relationships between Operational Practices and Performance Among Early Adopters of Green Supply Chain Management Practices in Chinese Manufacturing Enterprises," Journal of Operations Management, 22 (3), 265-89.
Zsidisin, G.A. and S.P. Siferd (2001), "Environmental Purchasing: A Framework for Theory Development," European Journal of Purchasing and Supply Management, 7 (1), 61-73.
36
Table 1 Exploratory Factor Analysis
Items FA 1 FA 2 FA 3 Collaboration upstream
D2a .932 — .883 .302 D2b .933 — .893 .275 D2c .942 — .896 .295 D2d .936 — .855 .381 D2e .955 — .888 .348
Collaboration downstream
E2a — .913 .359 .839 E2b — .964 .314 .911 E2c — .953 .387 .872 E2d — .936 .272 .899 E2e — .916 .272 .878
KMO adequacy .884 .909 Bartlett test 555.0 510.1 p-value of Bartlett test .000 .000 Eigenvalue 4.414 4.388 7.229 1.591 Variance explained (%) 88.28 .87.75 44.3 43.9 Cronbach’s alpha .967 .965
Extraction method: principal component analysis; rotation method: varimax with Kaiser normalization. (rotation converged in 3 iterations)

37
Table 2 Rotated Factor Matrix: Operational Performance Dimensions
Items Cost Quality Delivery Flexibility Environmentg1_a .888 -.028 .148 .092 .055 g1_b .794 -.143 .189 .132 .055 g1_c .738 .351 .119 .088 .031 g1_d .088 .856 .106 .043 .135 g1_e .028 .699 -.041 .340 .121 g1_f .003 .882 .011 -.035 .089 g1_g -.116 .493 .498 .074 .177 g1_h .064 -.066 .824 .183 .116 g1_i .295 .021 .719 .231 .005 g1_j .274 .171 .716 .177 .068 g1_k .293 -.012 .383 .610 .006 g1_l .110 .118 .192 .867 .104
g1_m .046 .143 .176 .867 .070 g1_n -.042 .090 .112 .045 .805 g1_o .059 .124 .001 .088 .898 g1_p .133 .154 .107 .045 .892
Eigenvalue 1.489 4.732 1.736 1.102 2.522 Cronbach α .799 .792 .765 .799 .857 1 Extraction method: principal component analysis. Rotation method: Varimax with Kaiser normalization.
Rotation converged in 6 iterations

38
Table 3 Correlations Mean s.d. 1 2 3 4 5 6 7 8 9 10 11 12 13 14 15 16
Manufacturing performance
1. Cost 4.8 0.8 2. Quality 5.6 0.7 .07 3. Delivery 5.6 0.8 .36 .23 4. Flexibility 5.5 0.8 .29 .31 .53 5. Environmental 5.2 1.0 .11 .31 .13 .17 6. On time deliverya 8.9 12.1 .07 -.07 -.17 -.05 .04 7. Cycle timea 31.7 22.9 .10 -.01 .16 .22 .23 .28 8. Setup timea 27.6 22.4 .19 .03 .33 .25 .20 -.05 .47 9. Scrap ratea 30.6 27.3 .16 .16 .31 .32 .20 .10 .43 .37
Environmental collaboration
10. with suppliers 3.4 1.5 .19 .25 .38 .40 .33 -.04 .07 .24 .18 11. with customers 2.8 1.4 .04 .31 .03 .27 .39 -.04 .07 .14 .14 .64
Plant characteristics
12. Plant sizeb 4.9 0.6 .04 -.03 -.26 -.04 -.10 -.02 -.19 -.14 -.25 .10 .06 13. Parent company sizec 7.0 2.2 -.07 .10 -.14 -.09 .17 -.10 -.22 -.07 -.25 -.02 .05 .33 14. Age of presses 11.3 6.7 .05 -.21 .05 .06 .13 .15 -.05 -.13 -.04 .09 .05 .06 .32 15. Reinvestment rated 7.5 8.0 .04 .03 .07 .06 -.01 -.10 .13 .30 .14 .21 .20 .04 -.18 -.29 16. Supplier basee 0.7 1.4 -.14 -.08 -.05 -.07 -.02 -.04 -.15 -.09 .02 -.23 -.11 -.19 -.02 -.05 -.06 17. Customer concentrationf 0.5 0.2 .20 .28 .22 .13 .16 -.13 .04 .06 .03 .12 .08 .02 .40 .13 .12 -.18
Notes: N for bivariate correlations varies from 76 to 83 because of missing data. Correlations greater than 0.285 are significant at p < 0.01; correlations greater than 0.230 are significant at p < 0.05. a The % improvement during the 2000-2002 period. b Natural logarithm of the number of employees in the plant. c Natural logarithm of the number of employees in the parent company. d Percentage of annual sales invested in new equipment over the last two years. e Total number of suppliers scaled by plant size (number of employees). f The % of sales coming from the three largest customers.
39
Table 4 Impact of Environmental Collaboration: Perceptual Performance Metricsa Cost Quality Delivery Flexibility Environmental 1a 1b 1c 2a 2b 2c 3a 3b 3c 4a 4b 4c 5a 5b 5c
Control variables Plant size .080 .089 .073 -.081 -.065 -.075 -.215† -.189 -.228* -.023 .005 -.022 -.214† -.187 -.202† Parent company size -.220 -.237† -.206 .120 .087 .105 -.186 -.232† -.156 -.150 -.201 -.152 .265† .211 .239† Age of presses .050 .078 .049 -.316** -.298** -.315** .035 .102 .032 .063 .109 .063 -.037 -.003 -.033 Reinvestment rate .008 .048 .019 -.078 -.073 -.090 .004 .099 .028 -.008 .035 -.009 -.049 -.046 -.070 Supply base -.045 -.069 -.037 .001 -.026 -.008 .029 -.032 .046 .043 -.008 .042 .039 -.003 .025 Customer concentration .270* .289* .274* .239* .245* .236† .255* .301* .263* .153 .175 .152 .028 .030 .021 Env. collaboration With suppliers .134 .255† .275* .149 .373** .621** .400** .383* .415** .205 With customers -.026 -.183 .281* .189 .008 -.374** .257* .025 .443** .321* F statistics 1.226 1.038 1.264 2.685 2.820 2.599 3.958 1.937 4.876 2.504 1.420 2.165 2.709 3.321 3.205 R2 .108 .093 .126 .209* .218* .229* .281** .160† .358** .200* .124 .201* .216* .252** .274** ∆R2 Control variables .092 .092 .092 .144† .144† .144† .160* .160* .160* .063 .063 .063 .069 .069 .069 Env. collaboration .016 .001 .034 .065* .073* .085* .120** .000 .198** .137** .061* .137** .146** .183** .205** Number of observations 79 79 79 79 79 79 79 79 79 78 78 78 77 77 77
Notes: aStandardized betas (β) are reported and the t-statistics are reported in parentheses. †p-value < 0.10, * p-value < 0.05, ** p-value < 0.01
40
Table 5 Impact of Environmental Collaboration: Objective Performance Metricsa
Scrap rateb On-time delivery Cycle time Set-up time 6a 6b 6c 7a 7b 7c 8a 8b 8c 9a 9b 9c
Control variables Prior performance -.356** -.363** -.365** -1.01** -1.01** -1.01** -.079 -.096 -.098 .119 .125 .119 Plant size -.268* -.261* -.261* .025 .030 .024 -.141 -.142 -.134 -.184 -.171 -.185 Parent company size -.275* -.298* -.302* .082† .069 .083† -.248† -.251† -.267† .017 -.009 .019 Age of presses .011 .010 .014 .011 .024 .011 .119 .112 .127 -.058 -.032 -.059 Reinvestment rate .190† .167 .170 .021 .033 .021 .246* .218† .233† .300* .330** .302* Supply base .012 .002 -.002 .107** .094* .107** -.196† -.189† -.204† -.051 -.076 -.050 Customer concentration .211† .210† .211† .098* .102* .098* .115 .104 .112 .048 .061 .049 Env. collaboration With suppliers .146 -.026 .086* .092† -.003 -.118 .190 .208 With customers .243* .259† .046 -.008 .106 .178 .098 -.028 F statistics 4.103 4.807 4.214 103.2 97.2 90.4 1.945 2.074 1.897 2.145 1.868 1.883 R2 .336** .372** .372** .925** .921** .925** .188† .198* .206† .204* .182† .204† ∆R2 Control variables .318** .318** .318** .919** .919** .919** .188* .188* .188* .174† .174† .174† Env. collaboration .018 .054* .054† .006* .002 .006† .000 .010 .017 .030 .009 .031 Number of observations 74 74 74 76 76 76 76 76 76 76 76 76
Notes: aStandardized betas (β) are reported and the t-statistics are reported in parentheses. bAn outlier case was not included in this regression (standardized residual was -4). †p-value < 0.10, * p-value < 0.05, ** p-value < 0.01
Top Related
Copyright © 2022 FDOKUMEN

