


Bahasa
Halaman
Hukum


Electrical Pulse Stimulation of Cultured Human SkeletalMuscle Cells as an In Vitro Model of ExerciseNatasa Nikolic1*, Siril Skaret Bakke1, Eili Tranheim Kase1, Ida Rudberg1,2, Ingeborg Flo Halle1, Arild C.
Rustan1, G. Hege Thoresen1, Vigdis Aas2
1 Department of Pharmaceutical Biosciences, School of Pharmacy, University of Oslo, Oslo, Norway, 2 Faculty of Health Sciences, Oslo and Akershus University College of
Applied Sciences, Oslo, Norway
Abstract
Background and Aims: Physical exercise leads to substantial adaptive responses in skeletal muscles and plays a central rolein a healthy life style. Since exercise induces major systemic responses, underlying cellular mechanisms are difficult to studyin vivo. It was therefore desirable to develop an in vitro model that would resemble training in cultured human myotubes.
Methods: Electrical pulse stimulation (EPS) was applied to adherent human myotubes. Cellular contents of ATP,phosphocreatine (PCr) and lactate were determined. Glucose and oleic acid metabolism were studied using radio-labeledsubstrates, and gene expression was analyzed using real-time RT-PCR. Mitochondrial content and function were measuredby live imaging and determination of citrate synthase activity, respectively. Protein expression was assessed byelectrophoresis and immunoblotting.
Results: High-frequency, acute EPS increased deoxyglucose uptake and lactate production, while cell contents of both ATPand PCr decreased. Chronic, low-frequency EPS increased oxidative capacity of cultured myotubes by increasing glucosemetabolism (uptake and oxidation) and complete fatty acid oxidation. mRNA expression level of pyruvate dehydrogenasecomplex 4 (PDK4) was significantly increased in EPS-treated cells, while mRNA expressions of interleukin 6 (IL-6), cytochromeC and carnitin palmitoyl transferase b (CPT1b) also tended to increase. Intensity of MitoTrackerHRed FM was doubled after48 h of chronic, low-frequency EPS. Protein expression of a slow fiber type marker (MHCI) was increased in EPS-treated cells.
Conclusions: Our results imply that in vitro EPS (acute, high-frequent as well as chronic, low-frequent) of human myotubesmay be used to study effects of exercise.
Citation: Nikolic N, Skaret Bakke S, Tranheim Kase E, Rudberg I, Flo Halle I, et al. (2012) Electrical Pulse Stimulation of Cultured Human Skeletal Muscle Cells as anIn Vitro Model of Exercise. PLoS ONE 7(3): e33203. doi:10.1371/journal.pone.0033203
Editor: Maria Moran, Instituto de Investigacion Hospital 12 de Octubre, Spain
Received May 10, 2011; Accepted February 13, 2012; Published March 22, 2012
Copyright: � 2012 Nikolic et al. This is an open-access article distributed under the terms of the Creative Commons Attribution License, which permitsunrestricted use, distribution, and reproduction in any medium, provided the original author and source are credited.
Funding: This work was funded by the University of Oslo, Oslo University College, the Norwegian Diabetes Foundation, the Freia Chocolade Fabriks MedicalFoundation and the Anders Jahre’s Foundation. The funders had no role in study design, data collection and analysis, decision to publish, or preparation of themanuscript.
Competing Interests: The authors have declared that no competing interests exist.
* E-mail: [email protected]
Introduction
Physical training leads to extensive adaptations in skeletal
muscles [1-4]. Regular physical activity plays central role in both
prevention and improvement of many chronic diseases, improve-
ment of life-style and increased life expectancy [2]. However,
molecular mechanisms underlying these adaptations are still
poorly understood, emphasizing the requirement for a cell culture
model resembling training ex vivo.
Motor neuron activation of muscle fibres can be replaced by
electrical pulse stimulation (EPS) of differentiated skeletal muscle
cells (myotubes) in culture [5,6]. Metabolic and genetic adapta-
tions caused by EPS in vitro have previously been described in
murine C2C12 cells [7-9], in L6 cells [10] and in primary rat
skeletal muscle cells [11]. In vivo, immediate effects of EPS, such as
activation of glucose uptake and glycogenolysis [12] can be clearly
distinguished from more profound changes in the metabolic and
transcriptional phenotypes of muscles occurring as a result of
chronically increased contractile activity evoked by chronic, low-
frequency EPS [12]. Likewise, acute changes in skeletal muscle
after a single bout of exercise in vivo differ considerably from those
observed after regular training, which, obviously, confers for the
most of the beneficial health effects of exercise in vivo [2,13].
Adaptations of metabolic properties in skeletal muscles after
exercise are reflected by both increased mitochondrial content
[14,15] and improved oxidative capacity [4,16,17]. Several
signalling pathways have been proposed to be involved in the
stimulation of mitochondrial biogenesis in a contracting muscle
[18-20]. Exercise has also been shown to enhance both lipid
synthesis and lipid oxidation [20-23]. As a consequence of these
metabolic adaptations, trained muscle takes more of its required
energy from lipids and less from carbohydrate compared to
untrained muscle during submaximal work (i.e. work performed
below the maximal oxygen utilization capacity) [24]. In addition to
fatty acids, trained fibers import and use more glucose than
untrained muscle fibers [25,26]. Glucose transporters 1 and 4
(GLUT1 and GLUT4) are the major glucose transporters in the
cell membrane of skeletal muscle cells [27], and regular physical
PLoS ONE | www.plosone.org 1 March 2012 | Volume 7 | Issue 3 | e33203

activity improves the ability of insulin to stimulate the uptake of
glucose at rest [28-30].
Plasticity of skeletal muscles in response to endurance exercise
extends beyond the metabolic changes. In human skeletal muscles,
three main muscle fiber types, type I (oxidative, slow twitch), IIa
(intermediate) and IIx (glycolytic, fast twitch), can be delineated
based on histochemical, functional and biochemical properties
[31]. Type I fibers are characterized by higher mitochondrial
content and increased glucose transport compared to type II
fibers, and whole-body insulin-sensitivity has been positively
correlated with the proportion of slow-twitch oxidative fibers in
humans [32]. Conversion from type II to type I muscle phenotype
has been shown in animals [33], but there is little evidence that this
type of transition actually happens in adult humans [15,24].
Chronic, low-frequency EPS in vivo has been shown to lead to the
transformation of fast-twitch glycolytic muscle fibres into slow-type
oxidative fibres [12]. Moreover, skeletal muscle has recently been
identified as an organ that produces and releases several cytokines,
which are termed ‘‘myokines’’, among these are interleukins 6, 8
and 5 (IL-6, IL-8 and IL-5) [34]. It has been demonstrated that
plasma concentration of IL-6 increases during muscular exercise
[35,36], and IL-6 appears to have positive effects on skeletal
muscle glucose metabolism [37,38]. These findings suggest that
also the immune system is affected by physical exercise; however,
the implications this might have on the metabolic responses are
not yet understood.
We have previously reported effects of acute electrical
stimulation on glucose metabolism in cultured human skeletal
muscle cells, both at high and low glucose concentrations [39].
In the past years, reports of several EPS models applied to cultured
skeletal muscle cells have increased in number, suggesting that
there is growing interest in establishing a method that would allow
to study cellular mechanisms of exercise under controlled
conditions in vitro [6-9,11,40]. However, to our knowledge, no
model of EPS has been applied to primary human skeletal muscle
cells. Cell culture systems derived from muscle biopsies have been
used to study glucose and lipid metabolism over the past 30 years.
Differentiated primary human myotubes represent the best
available alternative system to intact human skeletal muscle. They
have the most relevant genetic background to study human disease
as opposed to rodent culture systems, and they also display the
morphological, metabolic and biochemical properties of adult
skeletal muscles [41,42].
In the present study, we aimed to develop an in vitro model of
exercise in cultured human skeletal muscle cells, with main focus
on metabolic effects of chronic, low-frequency EPS. This model
could be used to study adaptive responses of skeletal muscle cells to
different types of contractile activity applied by electrical pulse
stimulation (EPS).
Materials and Methods
MaterialsDulbeccos modified Eagles medium (DMEM-GlutamaxTM),
heat-inactivated fetal calf serum (FCS), penicillin/streptomycin
(P/S) and amphotericin B were purchased from Gibco (Gibco,
Life Technologies Paisley, UK). BSA (Bovine Serum Albumin)
(essentially fatty acid-free), L-carnitine, and Dulbecco’s phosphate-
buffered saline (DPBS; with Mg2+ and Ca2+), oleic acid,
extracellular matrix (ECM) gel and HEPES were obtained from
Sigma (St Louis, MO). Ultroser G was purchased from Ciphergen
(Cergy-Saint-Christophe, France), and insulin (ActrapidH) was
from NovoNordisk (Bagsvaerd, Denmark). [1-14C]oleic acid
(55 mCi/mmol) and D-[14C(U)]glucose (5 mCi/mmol) were from
NEN Radiochemicals, PerkinElmer (Boston, MA). [3H]deoxyglu-
cose (10 Ci/mmol) was from American Radiolabeled Chemicals
Inc. (St. Louis, MO). Ecoscint A scintillation solution was from
National diagnostics (Hessle, England, UK). Glass bottom plates
were from MatTek (Ashland, MA). Protein assay reagens was
purchased from BioRad (Copenhagen, Denmark). Phospho-Akt
(Ser473) and Akt antibodies were from Cell Signaling Technology
(Beverly, MA), OXPHOS human cocktail antibodies were from
MitoSciences (Eugene, OR) and Anti-Myosin, slow muscle
(MAB1628) was from Millipore (Billerica, MA). MitoTrackerHRed
FM and Hoechst 33258 were obtained from Molecular Probes,
Invitrogen (Carlsbad, CA). NuPAGEH 4–12% (w/v) Bis-Tris Gel,
1 mm612 well was from Invitrogen (Carlsbad, CA). Citrate
Synthase Activity Assay Kit was from Sigma-AldrichH (St. Louis,
MO). Cytotoxicity Detection Kit Plus (LDH) was from Roche
Applied Science, Mannheim, Germany. The primers for TaqMan
Real Time PCR were provided by Invitrogen (Carlsbad, CA).
SYBR green and TaqMan reverse transcription kit reagents were
obtained from Applied Biosystems (Warrington, UK). Agilent
Total RNA isolation Kit was purchased from Agilent Technolo-
gies (Santa Clara, CA). All chemicals used were of standard
commercial high-purity quality.
Ethics statementThe biopsies were obtained with informed written consent and
approval by the National Committee for Research Ethics (Oslo,
Norway). The research performed in this study was approved, as a
part of a larger project, by the National Committee for Research
Ethics (Oslo, Norway).
Human skeletal muscle cell culturesA cell bank of satellite cells was established from muscle biopsy
samples of the Musculus obliquus internus abdominis of twelve healthy
volunteers (10 females, 2 males), age range 34–70 years (50.969
years), body mass index (BMI) range 19.6–29.7 kg/m2
(23.960.9 kg/m2), fasting glucose range range 4.9–6.9 mM
(5.260.2 mM), and plasma lipids and blood pressure within
normal range. Not all donors were used in each experiment.
Muscle cell cultures free of fibroblasts were established by the
method of Henry et al [42]. Briefly, muscle tissue was dissected in
Ham’s F-10 medium at 4uC and dissociated by three successive
treatments with 0.05% trypsin/EDTA, and satellite cells were
resuspended in skeletal muscle DMEM-GlutamaxTM with 2%
FCS, 2% Ultroser G, 50 U/mL penicillin, 50 mg/mL streptomy-
cin, 1.25 mg/mL amphotericin B, and no added insulin. The cells
were grown on culture wells or flasks coated with extracellular
matrix gel [43]. After 1–2 weeks, at ,80% confluence, growth
medium was replaced by DMEM-GlutamaxTM with 2% FCS,
50 U/mL penicillin, 50 mg/mL streptomycin, 1.25 mg/mL am-
photericin B and 25 pM insulin to induce the differentiation of
myoblasts into multinucleated myotubes. The cells were cultured
in a humidified 5% CO2 atmosphere at 37uC, and medium was
changed every 2–3 days. All myotube cultures were used for
analysis on day 8 or 9 after the onset of differentiation.
Electrical pulse stimulation of muscle cellsMultinucleated myotubes grown in ECM-coated 6-well plates
were stimulated via carbon electrodes either by applying acute,
high-frequency EPS (pulse trains of bipolar pulses 100 Hz for
200 ms given every 5th second, 30 V, for 5–60 min), or by
applying chronic, low-frequency EPS (single, bipolar pulses of
2 ms, with 30 V and 1 Hz continuously for the last 24 or 48 h of
differentiation period). Culturing medium was changed every
12th h during chronic, low-frequency EPS. Electrical pulses were
In Vitro Exercise of Human Skeletal Muscle Cells
PLoS ONE | www.plosone.org 2 March 2012 | Volume 7 | Issue 3 | e33203

generated by a muscle stimulator built at the Electronics Lab,
Institute of Chemistry, University of Oslo.
Contents of ATP, PCr and lactateThe myotubes were preincubated for 1 h (37uC, 5% CO2) with
DMEM-GlutamaxTM. Medium was then changed to fresh
DMEM-GlutamaxTM and acute, high-frequency EPS was applied
for 5–60 min. After stimulation, the cells were immediately placed
on ice, the media were removed, and the cells were washed three
times with ice-cold phosphate-buffered saline (PBS) before being
harvested in 200 mL of ice-cold perchloric acid (3 M). Analyses of
ATP, PCr and lactate contents were performed at the Institute for
Experimental Medical Research, Ulleval University Hospital,
Oslo. The cells were analyzed for ATP and PCr levels with
luminescence spectrometry, and lactate content in cells was
analyzed with fluorescence spectrometry as described by Lowry
et al. [44].
Measurement of lactate dehydrogenase (LDH)in culture media from myotubes treated with chronic,low-frequency EPS
Cytotoxic effect of EPS was determined in a colorimetric assay
based on the measurement of lactate dehydrogenase (LDH)
activity in the supernatant with the use of Cytotoxicity Detection
KitPLUS (LDH) (Roche Applied Science, Mannheim, Germany).
Multinucleated myotubes grown in ECM-coated 6-well plates
were stimulated via carbon electrodes by applying chronic, low-
frequency EPS continuously for the last 24 h or 48 h of the
differentiation, and LDH activity in the supernatant was
determined according to the supplier’s protocol. Triton-X-100-
lysed cells were used for determination of maximum values.
Glucose metabolismInitial experiments with frequency-dependent deoxy-
glucose uptake: The myotubes were starved for 60 min in serum-
free DMEM-GlutamaxTM (5.5 mM glucose) in a 5% CO2
incubator at 37uC. Then, the medium was changed to serum-free
DMEM-GlutamaxTM with [3H]deoxyglucose (1 mCi/mL) +/2
cytochalasin B (20 mM), and acute EPS was applied for the first
15 min of the 60 min deoxyglucose uptake period, using frequen-
cies of 2 to 10 Hz. Deoxyglucose uptake at acute, high-frequency EPS: The myotubes were starved for 60 min in serum-
free DMEM-GlutamaxTM (5.5 mM glucose) in a 5% CO2
incubator at 37uC. Then, the medium was changed to serum-free
DMEM-GlutamaxTM with [3H]deoxyglucose (1 mCi/mL) +/2
insulin (100 nM) and +/2 cytochalasin B (20 mM), and acute, high-
frequency EPS was applied for 5–60 min. Deoxyglucose uptakeafter chronic, low-frequency EPS: Chronic, low-frequency
EPS was applied to myotubes continuously for the last 24–48 h of
the differentiation period. After ended EPS, the myotubes were
starved for 60 min in serum-free DMEM-GlutamaxTM (5.5 mM
glucose) in a 5% CO2 incubator at 37uC, and then exposed to
[3H]deoxyglucose (1 mCi/mL) +/2 insulin (100 nM) and +/2
cytochalasin B (20 mM). Deoxyglucose uptake was measured for
60 min for both acute, high-frequency EPS and chronic, low-
frequency EPS. After ended uptake, the cells were immediately
placed on ice and washed three times with ice-cold PBS, lysed with
0.05 M NaOH, and radioactivity was counted by liquid scintilla-
tion. The protein content of each sample was measured according
to Bradford [45]. Non-carrier-mediated uptake was determined in
the presence of cytochalasin B and subtracted from all presented
values. Glucose oxidation after chronic, low-frequencyEPS: Chronic, low-frequency EPS was applied to myotubes for 24
or 48 h. Then, the myotubes were incubated with glucose-free
DMEM and D-[14C(U)]glucose (2 mCi/mL) (1 mL/well) in a 5%
CO2 incubator at 37uC. After 2 h, 500 mL cell medium was
transferred to airtight flasks, and 300 mL of phenyl ethylamine-
methanol (1:1, v/v) was added with a syringe to a center well
containing a folded filter paper. Subsequently, 100 mL of 1 M
perchloric acid was added to the media through the stopper tops
using a syringe. The flasks were placed for a minimum of 2 h at
room temperature to trap labeled CO2, and radioactivity was
counted by liquid scintillation The protein content of each sample
was measured according to Bradford [45].
Fatty acid metabolism after chronic, low-frequency EPSAfter 24–48 h of chronic, low-frequency EPS, the myotubes
were exposed to 1 mL/well of DPBS supplemented with HEPES
(10 mM), NaHCO3 (44 mM), [1-14C]oleic acid (1 mCi/mL,
0.1 mM), 0.24 mM BSA and 1 mM L-carnitine in a 5% CO2
incubator at 37uC. After 2 h, 500 mL of cell medium was
transferred to airtight flasks, and 300 mL of phenyl ethylamine-
methanol (1:1, v/v) was added with a syringe to a center well
containing a folded filter paper. Subsequently, 100 mL of 1 M
perchloric acid was added to the media through the stopper tops
using a syringe. The flasks were placed for a minimum of 2 h at
room temperature to trap labeled CO2. To measure ß-oxidation
products (acid-soluble metabolites (ASMs)), aliquots of 250 mL of
the cell media were precipitated with 100 mL of 6% BSA and
1 mL of 1 M perchloric acid. After centrifugation (20000 g,
10 min, 4uC, Heraues Fresco21 Centrifuge, Thermo Scientific),
250 mL of the supernatant was counted by liquid scintillation. No-
cell controls were included and subtracted from all presented
values. The cells were placed on ice and washed three times with
ice-cold PBS, lysed with 0.05 M NaOH, and cell-associated (CA)
radioactivity was counted by liquid scintillation to determine the
uptake of oleic acid. The protein content of each sample was
measured according to Bradford [45].
Immunoblotting after chronic, low-frequency EPSAliquots of 40 mg cell protein from total cell lysates prepared in
Laemmli buffer were electrophoretically separated on NuPAGEH 4–
12%(w/v) Bis-Tris Gel (Invitrogen) followed by immunoblotting with
antibodies recognizing total Akt kinase [protein kinase B (PKB)], Akt
phosphorylated at Ser478, and protein complexes of the electron
transport chain (OXPHOS human cocktail containing antibodies
against Complex I subunit NDUFB8, Complex II subunit, Complex
III subunit core 2, Complex IV subunit II and ATP synthase subunit
alpha) and Myosin, slow muscle (MHCI). Immunoreactive bands
were visualized with enhanced chemiluminescence and quantified
with Gel-Pro Analyzer (version 2.0) software.
Staining and live imaging of mitochondria and enzymeactivity assay after chronic, low-frequency EPS
Myotubes were cultured in ECM-coated 6-well glass bottom
plates. Chronic, low-frequency EPS was applied to cultured
myotubes for the last 48 h of the differentiation period, and in
addition, on day 8 of the differentiation, myotubes were incubated
at 37uC and 5% CO2 with MitoTrackerHRed FM (100 nM) for
15 min to stain mitochondria and Hoechst 33258 (2.5 mg/mL) for
15 min to stain nuclei and washed with PBS in between.
Automated image acquisition was performed in culture medium
without phenol red with an Olympus ScanR platform (Olympus
IX81 inverted fluorescence microscope) equipped with a temper-
ature and CO2-enrichment incubator for long-term live imaging,
as described in Hessvik et al [46]. We used a 20X objective and
In Vitro Exercise of Human Skeletal Muscle Cells
PLoS ONE | www.plosone.org 3 March 2012 | Volume 7 | Issue 3 | e33203
live images were aquired in 25 positions per well and 3 wells per
treatment per donor were examined. The background-subtracted
maximal intensity projection from 7 images taken in z-direction
(1 mm apart) was used for both color channels at each position.
Olympus ScanR software was used for automated image analysis,
using edge detection algorithm for object segmentation to quantify
the number of nuclei and mitochondrial content(total intensity of
MitoTrackerHRed) per image. After gating out aggregates and
dead cells the results were determined from about 386 images per
treatment (average of 3964 nuclei per image). After 48 h of
chronic, low-frequency EPS, citrate synthase (CS) activity was
determined spectrophotometrically from cell homogenates pre-
pared from the myotubes according to the supplier’s protocol
(Citrate Synthase Activity Assay Kit, Sigma-AldrichH, St. Louis,
MO). Citrate synthase activity in cell homogenates from myotubes
stimulated for 48 h was compared to activity in homogenates from
unstimulated control myotubes.
RNA isolation and analysis of gene expression byTaqManH Real-Time RT-PCR
Cells were harvested and total RNA was isolated by Agilent
Total RNA isolation kit according to the supplier’s total RNA
isolation protocol. Total RNA was reverse-transcribed with oligo
primers using a Perkin-Elmer Thermal Cycler 9600 (25uC for
10 min, 37uC for 1 h 20 min, and 85uC for 5 min) and a TaqMan
reverse transcription reagents kit. Two micrograms of total RNA
were added per 20 mL of total TaqMan reaction solution. Real-
time PCR was performed using an ABI PRISMT 7000 Detection
System (Applied Biosystems, Warrington, UK). RNA expression
was determined by SYBRT Green, and primers were designed
using Primer ExpressT (Applied Biosystems, Warrington, UK).
Each target gene was quantified in triplicate and carried out in a
25 mL reaction volume according to the supplier’s protocol. All
assays were run for 40 cycles (95uC for 12 s followed by 60uC for
60 s. The transcription levels were normalized to the housekeeping
control gene 36B4. Another housekeeping control gene tested,
GAPDH, gave similar results as 36B4. Following forward and
reverse primers were used at concentration of 30 mM: 36B4(acc_no M17885): F:CCATTCTATCATCAACGGGTACAA,
R: AGCAAGTGGGAAGGTGTAATCC; GAPDH (acc_noNM002046): F: TGCACCACCAACTGCTTAGC, R: GGC-
ATGGACTGTGGTCATGAG; CPT1b (acc_no : L39211): F:
GAGGCCTCAATGACCAGAATGT, R: GTGGACTCGCTG-
GTACAGGAA; cytochrome C (acc_no NM001916): F: CT-
GCCAACAACGGAGCATT, R: CGTGAGCAGGGAGAAGA-
CGTA; PGC-1a (acc.no NM013261.3): AAAGGATGCGC-
TCTCGTTCA, R: TCTACTGCCTGGAGACCTTGATC; IL-6 (acc_no NM000600): F: CGGGAACGAAAGAGAAGCTC-
TAT, R: AGGCGCTTGTGGAGAAGGA; PDK4 (acc_noBC040239): F: TTTCCAGACCAACCAATTCACA, R: TGC-
CCGCATTGCATTCTTA; GLUT1 (acc_no K03195): F: CA-
GCAGCCCTAAGGATCTTCTCA, R: CCGGCTCGGCT-
GACATC; GLUT4 (acc_no M20747): F: ACCCTGGTC-
CTTGCTGTGTT, R: ACCCCAATGTTGTACCCAAACT;
MHCI (acc_no NM005963) : F: CCAGACTGTGTCTGCTC-
TCTTCAG, R: CAGGACAAGCTCATGCTCC-AT; MHCIIa(acc_no NM017534): F: AAGGTCGGCAATGAGTATGTCA,
R: CAACCATCCACAGGAACATCTTC.
Data presentation and statisticsStatistical analysis of the overall effects of acute, high-frequency
EPS on the contents of ATP, PCr and lactate was performed using
linear mixed models (LMM) (SPSS version 17, SPSS Inc.,
Chicago, IL). In experiments where effects of 24 h and 48 h
EPS were compared to unstimulated control cells, data were
analyzed using non-parametric Kruskal-Wallis test, while in
experiments where two groups were compared (EPS-treatment
versus unstimulated control cells), non-parametric Wilcoxon
matched pair tests were performed (GraphPad Prism 5.0 for
Windows, GraphPad Software Inc., San Diego, CA). All values in
figures are presented as means6SEM, with n representing the
number of experiments performed, each experiment were
performed with cells from separate (different) donors, with
triplicate samples in each experiment. Statistical significance was
set at P,0.05. In most experiments, results are presented
normalized to unstimulated control cells, and the absolute values
of unstimulated control cells are stated in the figure text.
Results
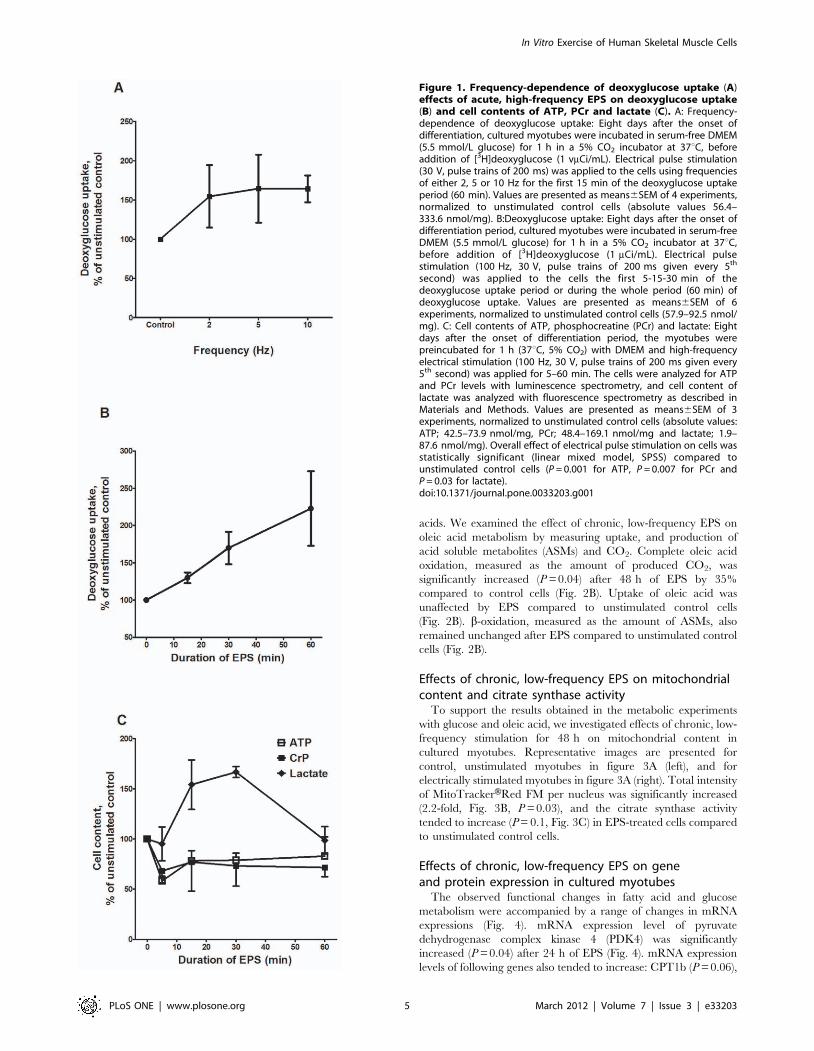
Effects of acute, high-frequency EPS on deoxyglucoseuptake, cell contents of ATP, PCr and lactatein cultured myotubes
To verify that electrical stimulation of cultured human
myotubes leads to expected metabolic changes, the myotubes
were exposed to acute, high-frequency EPS, and deoxyglucose
uptake and cellular contents of ATP, PCr and lactate were
examined. Frequency-dependence of deoxyglucose uptake dur-
ing EPS is showed in Figure 1A. Acute, high-frequency EPS
increased deoxyglucose uptake in cultured myotubes (Fig. 1B).
This uptake was specific, since it was inhibited by cytochalasin B
(20 mM) (data not shown). In addition, the amount of
deoxyglucose taken up by electrically stimulated myotubes
correlated positively with the duration of stimulation. Cell
contents of ATP and PCr in electrically stimulated myotubes
were compared to unstimulated control cells incubated for the
same period of time. In response to 5–60 min of electrical
stimulation, the contents of both ATP and PCr decreased
significantly (P = 0.001 and P = 0.007, respectively), while the
amount of lactate significantly increased (P = 0.03) (Figure 1C,
overall effect, linear mixed model, SPSS). Together, these
findings indicated that the cells were contracting and consuming
energy, and that they responded to acute EPS in a similar way as
a single bout of exercise in vivo.
Effects of chronic, low-frequency EPS on glucosemetabolism in cultured human skeletal muscle cells
We were further interested in whether the effects of chronic,
low-frequency EPS on cultured human skeletal cells could mimic
the effects of regular exercise in vivo. A movie showing contractions
of cultured skeletal muscle cells under EPS is attached as Video S1.
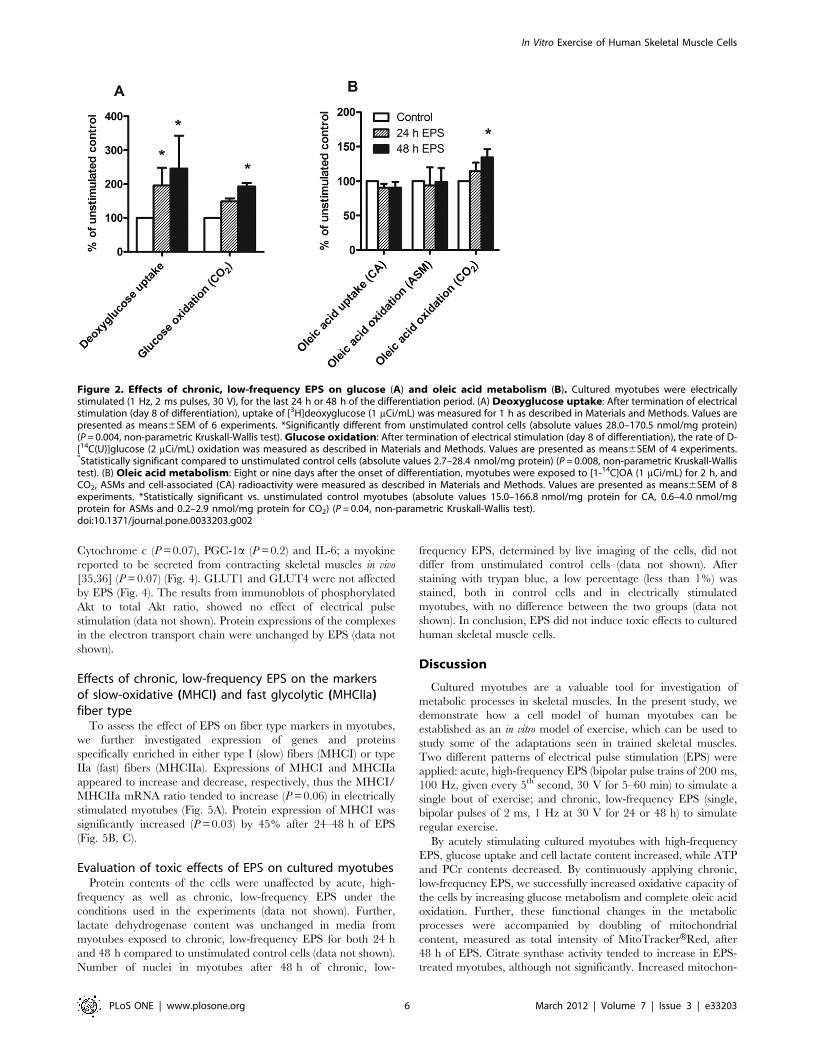
Deoxyglucose uptake was significantly increased (P = 0.004) in
cultured myotubes after both 24 and 48 h of chronic, low-
frequency EPS by 96% and 145%, respectively, compared to
unstimulated control cells. The insulin effect was unaffected by
EPS (data not shown). As with acute, high-frequency EPS, the
observed increase in deoxyglucose uptake after chronic, low-
frequency EPS was specific, since it was inhibited by cytochalasin
B (20 mM) (data not shown). Glucose oxidation, measured as the
amount of CO2 produced, was also significantly increased
(P = 0.008) after 48 h of chronic, low-frequency EPS compared
to unstimulated control (Fig. 2A).
Effects of chronic, low-frequency EPS on fatty acidmetabolism in cultured myotubes
A known effect of exercise is to increase oxidative capacity of the
cells, resulting in increased oxidation of both glucose and fatty
In Vitro Exercise of Human Skeletal Muscle Cells
PLoS ONE | www.plosone.org 4 March 2012 | Volume 7 | Issue 3 | e33203
acids. We examined the effect of chronic, low-frequency EPS on
oleic acid metabolism by measuring uptake, and production of
acid soluble metabolites (ASMs) and CO2. Complete oleic acid
oxidation, measured as the amount of produced CO2, was
significantly increased (P = 0.04) after 48 h of EPS by 35%
compared to control cells (Fig. 2B). Uptake of oleic acid was
unaffected by EPS compared to unstimulated control cells
(Fig. 2B). b-oxidation, measured as the amount of ASMs, also
remained unchanged after EPS compared to unstimulated control
cells (Fig. 2B).
Effects of chronic, low-frequency EPS on mitochondrialcontent and citrate synthase activity
To support the results obtained in the metabolic experiments
with glucose and oleic acid, we investigated effects of chronic, low-
frequency stimulation for 48 h on mitochondrial content in
cultured myotubes. Representative images are presented for
control, unstimulated myotubes in figure 3A (left), and for
electrically stimulated myotubes in figure 3A (right). Total intensity
of MitoTrackerHRed FM per nucleus was significantly increased
(2.2-fold, Fig. 3B, P = 0.03), and the citrate synthase activity
tended to increase (P = 0.1, Fig. 3C) in EPS-treated cells compared
to unstimulated control cells.
Effects of chronic, low-frequency EPS on geneand protein expression in cultured myotubes
The observed functional changes in fatty acid and glucose
metabolism were accompanied by a range of changes in mRNA
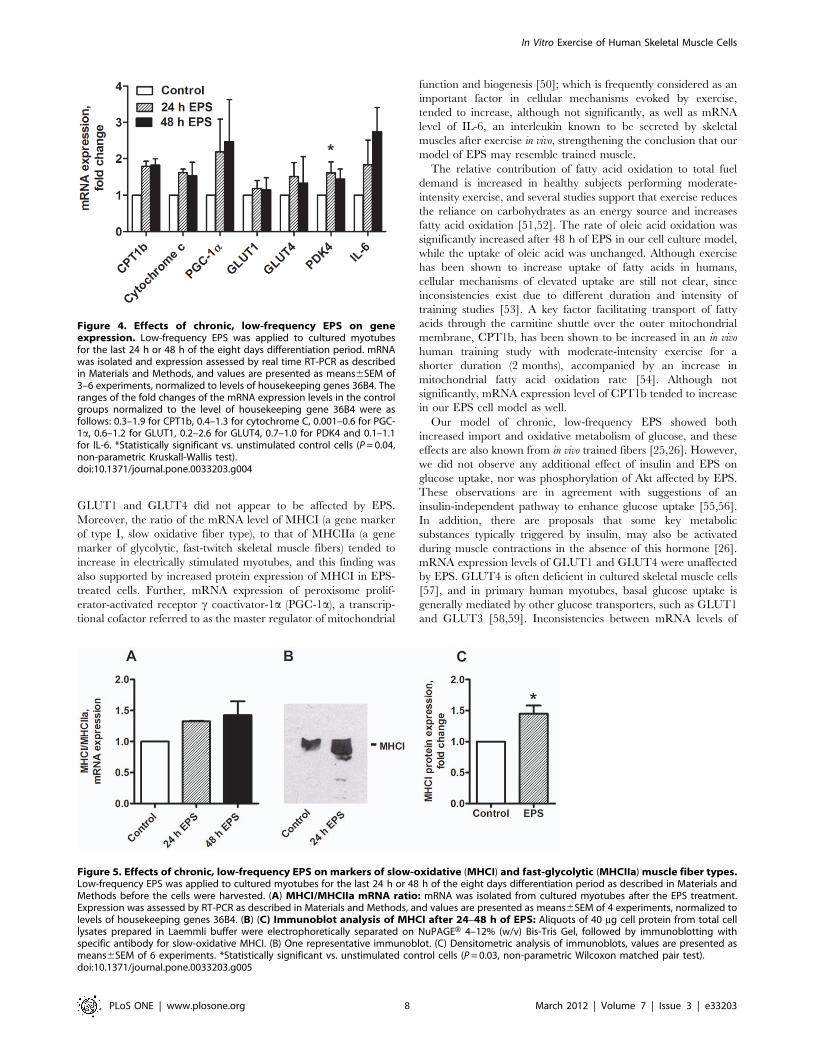
expressions (Fig. 4). mRNA expression level of pyruvate
dehydrogenase complex kinase 4 (PDK4) was significantly
increased (P = 0.04) after 24 h of EPS (Fig. 4). mRNA expression
levels of following genes also tended to increase: CPT1b (P = 0.06),
Figure 1. Frequency-dependence of deoxyglucose uptake (A)effects of acute, high-frequency EPS on deoxyglucose uptake(B) and cell contents of ATP, PCr and lactate (C). A: Frequency-dependence of deoxyglucose uptake: Eight days after the onset ofdifferentiation, cultured myotubes were incubated in serum-free DMEM(5.5 mmol/L glucose) for 1 h in a 5% CO2 incubator at 37uC, beforeaddition of [3H]deoxyglucose (1 vmCi/mL). Electrical pulse stimulation(30 V, pulse trains of 200 ms) was applied to the cells using frequenciesof either 2, 5 or 10 Hz for the first 15 min of the deoxyglucose uptakeperiod (60 min). Values are presented as means6SEM of 4 experiments,normalized to unstimulated control cells (absolute values 56.4–333.6 nmol/mg). B:Deoxyglucose uptake: Eight days after the onset ofdifferentiation period, cultured myotubes were incubated in serum-freeDMEM (5.5 mmol/L glucose) for 1 h in a 5% CO2 incubator at 37uC,before addition of [3H]deoxyglucose (1 mCi/mL). Electrical pulsestimulation (100 Hz, 30 V, pulse trains of 200 ms given every 5th
second) was applied to the cells the first 5-15-30 min of thedeoxyglucose uptake period or during the whole period (60 min) ofdeoxyglucose uptake. Values are presented as means6SEM of 6experiments, normalized to unstimulated control cells (57.9–92.5 nmol/mg). C: Cell contents of ATP, phosphocreatine (PCr) and lactate: Eightdays after the onset of differentiation period, the myotubes werepreincubated for 1 h (37uC, 5% CO2) with DMEM and high-frequencyelectrical stimulation (100 Hz, 30 V, pulse trains of 200 ms given every5th second) was applied for 5–60 min. The cells were analyzed for ATPand PCr levels with luminescence spectrometry, and cell content oflactate was analyzed with fluorescence spectrometry as described inMaterials and Methods. Values are presented as means6SEM of 3experiments, normalized to unstimulated control cells (absolute values:ATP; 42.5–73.9 nmol/mg, PCr; 48.4–169.1 nmol/mg and lactate; 1.9–87.6 nmol/mg). Overall effect of electrical pulse stimulation on cells wasstatistically significant (linear mixed model, SPSS) compared tounstimulated control cells (P = 0.001 for ATP, P = 0.007 for PCr andP = 0.03 for lactate).doi:10.1371/journal.pone.0033203.g001
In Vitro Exercise of Human Skeletal Muscle Cells
PLoS ONE | www.plosone.org 5 March 2012 | Volume 7 | Issue 3 | e33203
Cytochrome c (P = 0.07), PGC-1a (P = 0.2) and IL-6; a myokine
reported to be secreted from contracting skeletal muscles in vivo
[35,36] (P = 0.07) (Fig. 4). GLUT1 and GLUT4 were not affected
by EPS (Fig. 4). The results from immunoblots of phosphorylated
Akt to total Akt ratio, showed no effect of electrical pulse
stimulation (data not shown). Protein expressions of the complexes
in the electron transport chain were unchanged by EPS (data not
shown).
Effects of chronic, low-frequency EPS on the markersof slow-oxidative (MHCI) and fast glycolytic (MHCIIa)fiber type
To assess the effect of EPS on fiber type markers in myotubes,
we further investigated expression of genes and proteins
specifically enriched in either type I (slow) fibers (MHCI) or type
IIa (fast) fibers (MHCIIa). Expressions of MHCI and MHCIIa
appeared to increase and decrease, respectively, thus the MHCI/
MHCIIa mRNA ratio tended to increase (P = 0.06) in electrically
stimulated myotubes (Fig. 5A). Protein expression of MHCI was
significantly increased (P = 0.03) by 45% after 24–48 h of EPS
(Fig. 5B, C).
Evaluation of toxic effects of EPS on cultured myotubesProtein contents of the cells were unaffected by acute, high-
frequency as well as chronic, low-frequency EPS under the
conditions used in the experiments (data not shown). Further,
lactate dehydrogenase content was unchanged in media from
myotubes exposed to chronic, low-frequency EPS for both 24 h
and 48 h compared to unstimulated control cells (data not shown).
Number of nuclei in myotubes after 48 h of chronic, low-
frequency EPS, determined by live imaging of the cells, did not
differ from unstimulated control cells (data not shown). After
staining with trypan blue, a low percentage (less than 1%) was
stained, both in control cells and in electrically stimulated
myotubes, with no difference between the two groups (data not
shown). In conclusion, EPS did not induce toxic effects to cultured
human skeletal muscle cells.
Discussion
Cultured myotubes are a valuable tool for investigation of
metabolic processes in skeletal muscles. In the present study, we
demonstrate how a cell model of human myotubes can be
established as an in vitro model of exercise, which can be used to
study some of the adaptations seen in trained skeletal muscles.
Two different patterns of electrical pulse stimulation (EPS) were
applied: acute, high-frequency EPS (bipolar pulse trains of 200 ms,
100 Hz, given every 5th second, 30 V for 5–60 min) to simulate a
single bout of exercise; and chronic, low-frequency EPS (single,
bipolar pulses of 2 ms, 1 Hz at 30 V for 24 or 48 h) to simulate
regular exercise.
By acutely stimulating cultured myotubes with high-frequency
EPS, glucose uptake and cell lactate content increased, while ATP
and PCr contents decreased. By continuously applying chronic,
low-frequency EPS, we successfully increased oxidative capacity of
the cells by increasing glucose metabolism and complete oleic acid
oxidation. Further, these functional changes in the metabolic
processes were accompanied by doubling of mitochondrial
content, measured as total intensity of MitoTrackerHRed, after
48 h of EPS. Citrate synthase activity tended to increase in EPS-
treated myotubes, although not significantly. Increased mitochon-
Figure 2. Effects of chronic, low-frequency EPS on glucose (A) and oleic acid metabolism (B). Cultured myotubes were electricallystimulated (1 Hz, 2 ms pulses, 30 V), for the last 24 h or 48 h of the differentiation period. (A) Deoxyglucose uptake: After termination of electricalstimulation (day 8 of differentiation), uptake of [3H]deoxyglucose (1 mCi/mL) was measured for 1 h as described in Materials and Methods. Values arepresented as means6SEM of 6 experiments. *Significantly different from unstimulated control cells (absolute values 28.0–170.5 nmol/mg protein)(P = 0.004, non-parametric Kruskall-Wallis test). Glucose oxidation: After termination of electrical stimulation (day 8 of differentiation), the rate of D-[14C(U)]glucose (2 mCi/mL) oxidation was measured as described in Materials and Methods. Values are presented as means6SEM of 4 experiments.*Statistically significant compared to unstimulated control cells (absolute values 2.7–28.4 nmol/mg protein) (P = 0.008, non-parametric Kruskall-Wallistest). (B) Oleic acid metabolism: Eight or nine days after the onset of differentiation, myotubes were exposed to [1-14C]OA (1 mCi/mL) for 2 h, andCO2, ASMs and cell-associated (CA) radioactivity were measured as described in Materials and Methods. Values are presented as means6SEM of 8experiments. *Statistically significant vs. unstimulated control myotubes (absolute values 15.0–166.8 nmol/mg protein for CA, 0.6–4.0 nmol/mgprotein for ASMs and 0.2–2.9 nmol/mg protein for CO2) (P = 0.04, non-parametric Kruskall-Wallis test).doi:10.1371/journal.pone.0033203.g002
In Vitro Exercise of Human Skeletal Muscle Cells
PLoS ONE | www.plosone.org 6 March 2012 | Volume 7 | Issue 3 | e33203

drial content in skeletal muscles after exercise is believed to result
from the cumulative effects of transient increases in mRNA
transcripts encoding mitochondrial proteins after repeated exercise
sessions [3,47]. Temporal sequences of molecular effects that
occur in human muscle when mitochondrial biogenesis is induced
with exercise training were investigated in a study by Perry et al.
[48]. Although CS mRNA increased already after first training
session, increase in the activity of CS was not observed until the
end of the 3rd of the seven performed training sessions. In general,
repeated transient bursts of mRNA were shown to occur in the
early phases of training, before increases in the activities of
mitochondrial proteins, but the time and magnitude of mRNA
and protein responses of different transcriptional and mitochon-
drial proteins also showed considerable variation, depending on
the phase of the exercise they were measured in [48]. Thus, the
lack of significant increase in CS activity in our experiments after
only 48 hours of EPS is in agreement, or at least reflects the
complexity and precise time-dependence of molecular events that
were described to occur in mitochondrial biogenesis during
exercise in human skeletal muscles. At applied conditions, we
did show expected functional changes (lipid oxidation and glucose
metabolism), as well as changes in mRNA and protein expressions
of some factors, but in order to demonstrate other changes, both
on mRNA and protein level, we would perhaps have to use
different patterns and time periods, and with the present model,
this is something that can be done in the future work. The same
inconsistency between citrate synthase activity and MitoTrack-
erHRed intensity has also been reported in a recent work
presenting a novel, exercise-mimicking approach to remodel lipid
metabolism in cultured human myotubes [49]. Interestingly, this
was a cell system like ours, but the exercise-mimicking effects were
induced by a pharmacological activation. Thus, for future studies,
time aspect may be an important factor to be considered when
performing exercise-mimicking studies in cell cultures.
Changes in expression levels of a range of genes were also
observed after chronic EPS. mRNA level of PDK4 was
significantly increased in electrically stimulated cells, while mRNA
levels of Cytochrome c and CPT1b also tended to increase.
Figure 3. Effects of 48 h of chronic, low-frequency EPS on mitochondrial content and citrate synthase activity. Low-frequency EPS wasapplied to cultured myotubes for the last 48 h of the eight days differentiation period as described in Materials and Methods. (A) Live imaging ofmitochondria: The cells were stained for nuclei (blue) and mitochondria (red) as described in Materials and Methods. Scale bar is 50 mm. Left:Unstimulated control myotubes. Right: Myotubes after 48 h of chronic, low-frequency EPS. (B) Mitochondrial content in electrically stimulatedmyotubes: Mitochondrial content was measured by live imaging after 48 h of chronic, low-frequency EPS. Values are presented as means6SEM of 6experiments. *Statistically significant vs. unstimulated control (P = 0.03, non-parametric Wilcoxon matched pair test). (C) Citrate synthase activityin electrically stimulated myotubes: Enzyme activity was determined spectrophotometrically from cell homogenates prepared from themyotubes after 48 h of chronic, low-frequency EPS as described in Materials and Methods, and compared to activity in unstimulated control cells.Values are presented as means6SEM of 5 experiments.doi:10.1371/journal.pone.0033203.g003
In Vitro Exercise of Human Skeletal Muscle Cells
PLoS ONE | www.plosone.org 7 March 2012 | Volume 7 | Issue 3 | e33203
GLUT1 and GLUT4 did not appear to be affected by EPS.
Moreover, the ratio of the mRNA level of MHCI (a gene marker
of type I, slow oxidative fiber type), to that of MHCIIa (a gene
marker of glycolytic, fast-twitch skeletal muscle fibers) tended to
increase in electrically stimulated myotubes, and this finding was
also supported by increased protein expression of MHCI in EPS-
treated cells. Further, mRNA expression of peroxisome prolif-
erator-activated receptor c coactivator-1a (PGC-1a), a transcrip-
tional cofactor referred to as the master regulator of mitochondrial
function and biogenesis [50]; which is frequently considered as an
important factor in cellular mechanisms evoked by exercise,
tended to increase, although not significantly, as well as mRNA
level of IL-6, an interleukin known to be secreted by skeletal
muscles after exercise in vivo, strengthening the conclusion that our
model of EPS may resemble trained muscle.
The relative contribution of fatty acid oxidation to total fuel
demand is increased in healthy subjects performing moderate-
intensity exercise, and several studies support that exercise reduces
the reliance on carbohydrates as an energy source and increases
fatty acid oxidation [51,52]. The rate of oleic acid oxidation was
significantly increased after 48 h of EPS in our cell culture model,
while the uptake of oleic acid was unchanged. Although exercise
has been shown to increase uptake of fatty acids in humans,
cellular mechanisms of elevated uptake are still not clear, since
inconsistencies exist due to different duration and intensity of
training studies [53]. A key factor facilitating transport of fatty
acids through the carnitine shuttle over the outer mitochondrial
membrane, CPT1b, has been shown to be increased in an in vivo
human training study with moderate-intensity exercise for a
shorter duration (2 months), accompanied by an increase in
mitochondrial fatty acid oxidation rate [54]. Although not
significantly, mRNA expression level of CPT1b tended to increase
in our EPS cell model as well.
Our model of chronic, low-frequency EPS showed both
increased import and oxidative metabolism of glucose, and these
effects are also known from in vivo trained fibers [25,26]. However,
we did not observe any additional effect of insulin and EPS on
glucose uptake, nor was phosphorylation of Akt affected by EPS.
These observations are in agreement with suggestions of an
insulin-independent pathway to enhance glucose uptake [55,56].
In addition, there are proposals that some key metabolic
substances typically triggered by insulin, may also be activated
during muscle contractions in the absence of this hormone [26].
mRNA expression levels of GLUT1 and GLUT4 were unaffected
by EPS. GLUT4 is often deficient in cultured skeletal muscle cells
[57], and in primary human myotubes, basal glucose uptake is
generally mediated by other glucose transporters, such as GLUT1
and GLUT3 [58,59]. Inconsistencies between mRNA levels of
Figure 4. Effects of chronic, low-frequency EPS on geneexpression. Low-frequency EPS was applied to cultured myotubesfor the last 24 h or 48 h of the eight days differentiation period. mRNAwas isolated and expression assessed by real time RT-PCR as describedin Materials and Methods, and values are presented as means6SEM of3–6 experiments, normalized to levels of housekeeping genes 36B4. Theranges of the fold changes of the mRNA expression levels in the controlgroups normalized to the level of housekeeping gene 36B4 were asfollows: 0.3–1.9 for CPT1b, 0.4–1.3 for cytochrome C, 0.001–0.6 for PGC-1a, 0.6–1.2 for GLUT1, 0.2–2.6 for GLUT4, 0.7–1.0 for PDK4 and 0.1–1.1for IL-6. *Statistically significant vs. unstimulated control cells (P = 0.04,non-parametric Kruskall-Wallis test).doi:10.1371/journal.pone.0033203.g004
Figure 5. Effects of chronic, low-frequency EPS on markers of slow-oxidative (MHCI) and fast-glycolytic (MHCIIa) muscle fiber types.Low-frequency EPS was applied to cultured myotubes for the last 24 h or 48 h of the eight days differentiation period as described in Materials andMethods before the cells were harvested. (A) MHCI/MHCIIa mRNA ratio: mRNA was isolated from cultured myotubes after the EPS treatment.Expression was assessed by RT-PCR as described in Materials and Methods, and values are presented as means6SEM of 4 experiments, normalized tolevels of housekeeping genes 36B4. (B) (C) Immunoblot analysis of MHCI after 24–48 h of EPS: Aliquots of 40 mg cell protein from total celllysates prepared in Laemmli buffer were electrophoretically separated on NuPAGEH 4–12% (w/v) Bis-Tris Gel, followed by immunoblotting withspecific antibody for slow-oxidative MHCI. (B) One representative immunoblot. (C) Densitometric analysis of immunoblots, values are presented asmeans6SEM of 6 experiments. *Statistically significant vs. unstimulated control cells (P = 0.03, non-parametric Wilcoxon matched pair test).doi:10.1371/journal.pone.0033203.g005
In Vitro Exercise of Human Skeletal Muscle Cells
PLoS ONE | www.plosone.org 8 March 2012 | Volume 7 | Issue 3 | e33203

GLUTs and functional data have previously been reported in
cultured human skeletal muscle cells [60,61]. On the other hand,
PDK4, an inhibitor of pyruvate dehydrogenase complex, which is
an important factor in switching oxidation towards fatty acids [62],
was significantly increased in EPS-treated cells, indicating a
possible switch in the fuel preference of the myotubes. When
grown in culture, satellite cells mature to myotubes that generally
display the characteristics of glycolytic type II muscle fibers [41],
and are characterized by low mitochondrial oxidative capacity
[63,64], with higher fuel preference for carbohydrates over lipids
[65]. This could be due to lack of proliferation of mitochondria in
vitro in the absence of appropriate environmental signals, such as
contractions. Thus, approaches that increase mitochondrial
oxidative potential of human myotubes are highly relevant with
respect to studies on cellular energy metabolism.
Even though it is difficult to directly compare effects of in vivo
exercise to the observed effects in our model of EPS in cultured
human myotubes, several of our observations display important
aspects of the in vivo effects of exercise. In summary, by applying
our model of chronic continuous, low-frequency EPS, we observed
important functional changes in cell culture: improved lipid
oxidation and glucose metabolism, which are known effects of
exercise in vivo. Further, we also demonstrated a possible fiber-type
switch, measured by increased protein expression of MHCI in
EPS-treated cells. To our knowledge, such changes have not
previously been reported in human cell cultures. Thus, we believe
that our model of EPS in cultured human skeletal muscle cells
represents a unique, physiologically relevant ex vivo model, which
can be used to further study interrelationship between exercise-
induced cellular mechanisms and underlying signalling pathways
under controlled conditions. Particularly, the present model might
be of great interest in clarifying the potential of contractions on
energy metabolism in skeletal muscle cells obtained from different
groups of individuals (obese, glucose intolerant, athletes etc.).
Currently, contraction-induced effects on energy metabolism in
human skeletal muscle cells originating from extremely obese
individuals with or without type 2 diabetes are being investigated.
Supporting Information
Video S1 A film showing contractions of culturedhuman skeletal muscle cells exposed to chronic, low-frequency EPS. Cultured human skeletal muscle cells were
exposed to chronic, low-frequency EPS (single, bipolar pulses of
2 ms, with 30 V and 1 Hz continuously for the last 24 or 48 h of
differentiation period). The observed contractions were synchro-
nous with the electrical pulses.
(M4V)
Acknowledgments
The authors are thankful to Ph.D. Geir Florholmen for doing the
measurements of lactate, ATP and PCr, to Dr. Gerbrand Koster and
Professor Oddmund Bakke of the NORMIC-UiO imaging platform,
Department of Molecular Biosciences, University of Oslo, for support and
use of equipment, and to Ase-Karine Fjeldheim and Robert Smith, for
excellent technical assistance.
Author Contributions
Conceived and designed the experiments: NN SSB ETK IR IFH ACR
GHT VA. Performed the experiments: NN SSB ETK IR IFH ACR GHT
VA. Analyzed the data: NN SSB ETK IR IFH ACR GHT VA.
Contributed reagents/materials/analysis tools: NN SSB ETK IR IFH
ACR GHT VA. Wrote the paper: NN.
References
1. Booth FW, Thomason DB (1991) Molecular and cellular adaptation of muscle inresponse to exercise: perspectives of various models. Physiol Rev 71: 541–585.
2. Booth FW, Lees SJ (2007) Fundamental questions about genes, inactivity, andchronic diseases. Physiological genomics 28: 146–157.
3. Fluck M, Hoppeler H (2003) Molecular basis of skeletal muscle plasticity--fromgene to form and function. Rev Physiol Biochem Pharmacol 146: 159–216.
4. Fluck M (2006) Functional, structural and molecular plasticity of mammalianskeletal muscle in response to exercise stimuli. J Exp Biol 209: 2239–2248.
5. Thelen MH, Simonides WS, van Hardeveld C (1997) Electrical stimulation of
C2C12 myotubes induces contractions and represses thyroid-hormone-depen-
dent transcription of the fast-type sarcoplasmic-reticulum Ca2+-ATPase gene.The Biochemical journal 321 (Pt 3): 845–848.
6. Fujita H, Nedachi T, Kanzaki M (2007) Accelerated de novo sarcomere
assembly by electric pulse stimulation in C2C12 myotubes. Exp Cell Res 313:
1853–1865.
7. Park H, Bhalla R, Saigal R, Radisic M, Watson N, et al. (2008) Effects ofelectrical stimulation in C2C12 muscle constructs. Journal of tissue engineering
and regenerative medicine 2: 279–287.
8. Nedachi T, Fujita H, Kanzaki M (2008) Contractile C2C12 myotube model for
studying exercise-inducible responses in skeletal muscle. Am J Physiol En-
docrinol Metab 295: E1191–1204.
9. Burch N, Arnold AS, Item F, Summermatter S, Brochmann Santana Santos G,et al. (2010) Electric pulse stimulation of cultured murine muscle cells reproduces
gene expression changes of trained mouse muscle. PloS one 5: e10970.
10. Yano S, Morino-Koga S, Kondo T, Suico MA, Koga T, et al. (2011) Glucose
uptake in rat skeletal muscle L6 cells is increased by low-intensity electricalcurrent through the activation of the phosphatidylinositol-3-OH kinase (PI-3K)/
Akt pathway. Journal of pharmacological sciences 115: 94–98.
11. Silveira LR, Pilegaard H, Kusuhara K, Curi R, Hellsten Y (2006) The
contraction induced increase in gene expression of peroxisome proliferator-activated receptor (PPAR)-gamma coactivator 1alpha (PGC-1alpha), mitochon-
drial uncoupling protein 3 (UCP3) and hexokinase II (HKII) in primary rat
skeletal muscle cells is dependent on reactive oxygen species. Biochimica etbiophysica acta 1763: 969–976.
12. Pette D, Dusterhoft S (1992) Altered gene expression in fast-twitch muscle
induced by chronic low-frequency stimulation. Am J Physiol 262: R333–338.
13. Coffey VG, Hawley JA (2006) Training for performance: insights from
molecular biology. International journal of sports physiology and performance
1: 284–292.
14. Holloszy JO, Booth FW (1976) Biochemical adaptations to endurance exercise inmuscle. Annu Rev Physiol 38: 273–291.
15. Holloszy JO, Coyle EF (1984) Adaptations of skeletal muscle to enduranceexercise and their metabolic consequences. J Appl Physiol 56: 831–838.
16. Coffey VG, Hawley JA (2007) The molecular bases of training adaptation.
Sports medicine 37: 737–763.
17. Chow LS, Greenlund LJ, Asmann YW, Short KR, McCrady SK, et al. (2007)
Impact of endurance training on murine spontaneous activity, musclemitochondrial DNA abundance, gene transcripts, and function. Journal of
applied physiology 102: 1078–1089.
18. Baar K, Wende AR, Jones TE, Marison M, Nolte LA, et al. (2002) Adaptations
of skeletal muscle to exercise: rapid increase in the transcriptional coactivatorPGC-1. FASEB J 16: 1879–1886.
19. Hood DA (2001) Invited Review: contractile activity-induced mitochondrial
biogenesis in skeletal muscle. J Appl Physiol 90: 1137–1157.
20. Tarnopolsky MA, Rennie CD, Robertshaw HA, Fedak-Tarnopolsky SN,
Devries MC, et al. (2007) Influence of endurance exercise training and sex onintramyocellular lipid and mitochondrial ultrastructure, substrate use, and
mitochondrial enzyme activity. Am J Physiol Regul Integr Comp Physiol 292:
R1271–1278.
21. Hood DA, Irrcher I, Ljubicic V, Joseph AM (2006) Coordination of metabolicplasticity in skeletal muscle. J Exp Biol 209: 2265–2275.
22. van Loon LJ (2004) Use of intramuscular triacylglycerol as a substrate sourceduring exercise in humans. J Appl Physiol 97: 1170–1187.
23. Kiens B (2006) Skeletal muscle lipid metabolism in exercise and insulin
resistance. Physiol Rev 86: 205–243.
24. Harridge SD (2007) Plasticity of human skeletal muscle: gene expression to in
vivo function. Exp Physiol 92: 783–797.
25. Richter EA, Ruderman NB (2009) AMPK and the biochemistry of exercise:implications for human health and disease. The Biochemical journal 418:
261–275.
26. Santos JM, Ribeiro SB, Gaya AR, Appell HJ, Duarte JA (2008) Skeletal muscle
pathways of contraction-enhanced glucose uptake. International journal ofsports medicine 29: 785–794.
27. Ebeling P, Koistinen HA, Koivisto VA (1998) Insulin-independent glucosetransport regulates insulin sensitivity. FEBS letters 436: 301–303.
28. Hayashi T, Wojtaszewski JF, Goodyear LJ (1997) Exercise regulation of glucose
transport in skeletal muscle. The American journal of physiology 273:E1039–1051.
In Vitro Exercise of Human Skeletal Muscle Cells
PLoS ONE | www.plosone.org 9 March 2012 | Volume 7 | Issue 3 | e33203

29. Richter EA, Garetto LP, Goodman MN, Ruderman NB (1982) Muscle glucose
metabolism following exercise in the rat: increased sensitivity to insulin. TheJournal of clinical investigation 69: 785–793.
30. Tomas E, Zorzano A, Ruderman NB (2002) Exercise and insulin signaling: a
historical perspective. Journal of applied physiology 93: 765–772.31. Bottinelli R, Reggiani C (2000) Human skeletal muscle fibres: molecular and
functional diversity. Prog Biophys Mol Biol 73: 195–262.32. Lillioja S, Young AA, Culter CL, Ivy JL, Abbott WG, et al. (1987) Skeletal
muscle capillary density and fiber type are possible determinants of in vivo
insulin resistance in man. J Clin Invest 80: 415–424.33. Lin J, Wu H, Tarr PT, Zhang CY, Wu Z, et al. (2002) Transcriptional co-
activator PGC-1 alpha drives the formation of slow-twitch muscle fibres. Nature418: 797–801.
34. Pedersen BK, Akerstrom TC, Nielsen AR, Fischer CP (2007) Role of myokinesin exercise and metabolism. J Appl Physiol 103: 1093–1098.
35. Pedersen BK, Steensberg A, Fischer C, Keller C, Keller P, et al. (2003)
Searching for the exercise factor: is IL-6 a candidate? J Muscle Res Cell Motil24: 113–119.
36. Pedersen BK, Steensberg A, Fischer C, Keller C, Keller P, et al. (2004) Themetabolic role of IL-6 produced during exercise: is IL-6 an exercise factor? Proc
Nutr Soc 63: 263–267.
37. Carey AL, Steinberg GR, Macaulay SL, Thomas WG, Holmes AG, et al. (2006)Interleukin-6 increases insulin-stimulated glucose disposal in humans and
glucose uptake and fatty acid oxidation in vitro via AMP-activated proteinkinase. Diabetes 55: 2688–2697.
38. Ruderman NB, Keller C, Richard AM, Saha AK, Luo Z, et al. (2006)Interleukin-6 regulation of AMP-activated protein kinase. Potential role in the
systemic response to exercise and prevention of the metabolic syndrome.
Diabetes 55 Suppl 2: S48–54.39. Aas V, Torbla S, Andersen MH, Jensen J, Rustan AC (2002) Electrical
stimulation improves insulin responses in a human skeletal muscle cell model ofhyperglycemia. Ann N Y Acad Sci 967: 506–515.
40. Nedachi T, Hatakeyama H, Kono T, Sato M, Kanzaki M (2009) Character-
ization of contraction-inducible CXC chemokines and their roles in C2C12myocytes. American journal of physiology Endocrinology and metabolism 297:
E866–878.41. Gaster M, Kristensen SR, Beck-Nielsen H, Schroder HD (2001) A cellular
model system of differentiated human myotubes. Apmis 109: 735–744.42. Henry RR, Abrams L, Nikoulina S, Ciaraldi TP (1995) Insulin action and
glucose metabolism in nondiabetic control and NIDDM subjects. Comparison
using human skeletal muscle cell cultures. Diabetes 44: 936–946.43. Gaster M, Beck-Nielsen H, Schroder HD (2001) Proliferation conditions for
human satellite cells. The fractional content of satellite cells. APMIS 109:726–734.
44. Lowry OH, Rosebrough NJ, Farr AL, Randall RJ (1951) Protein measurement
with the Folin phenol reagent. The Journal of biological chemistry 193:265–275.
45. Bradford MM (1976) A rapid and sensitive method for the quantitation ofmicrogram quantities of protein utilizing the principle of protein-dye binding.
Anal Biochem 72: 248–254.46. Hessvik NP, Bakke SS, Fredriksson K, Boekschoten MV, Fjorkenstad A, et al.
(2010) Metabolic switching of human myotubes is improved by n-3 fatty acids.
J Lipid Res 51: 2090–2104.47. Pilegaard H, Ordway GA, Saltin B, Neufer PD (2000) Transcriptional regulation
of gene expression in human skeletal muscle during recovery from exercise.Am J Physiol Endocrinol Metab 279: E806–814.
48. Perry CG, Lally J, Holloway GP, Heigenhauser GJ, Bonen A, et al. (2010)
Repeated transient mRNA bursts precede increases in transcriptional and
mitochondrial proteins during training in human skeletal muscle. J Physiol 588:
4795–4810.
49. Sparks LM, Moro C, Ukropcova B, Bajpeyi S, Civitarese AE, et al. (2011)
Remodeling lipid metabolism and improving insulin responsiveness in human
primary myotubes. PLoS One 6: e21068.
50. Gleyzer N, Vercauteren K, Scarpulla RC (2005) Control of mitochondrial
transcription specificity factors (TFB1M and TFB2M) by nuclear respiratory
factors (NRF-1 and NRF-2) and PGC-1 family coactivators. Mol Cell Biol 25:
1354–1366.
51. Turcotte LP, Richter EA, Kiens B (1992) Increased plasma FFA uptake and
oxidation during prolonged exercise in trained vs. untrained humans.
Am J Physiol 262: E791–799.
52. Coggan AR, Raguso CA, Gastaldelli A, Sidossis LS, Yeckel CW (2000) Fat
metabolism during high-intensity exercise in endurance-trained and untrained
men. Metabolism 49: 122–128.
53. Turcotte LP, Fisher JS (2008) Skeletal muscle insulin resistance: roles of fatty
acid metabolism and exercise. Phys Ther 88: 1279–1296.
54. Eriksen L, Dahl-Petersen I, Haugaard SB, Dela F (2007) Comparison of the
effect of multiple short-duration with single long-duration exercise sessions on
glucose homeostasis in type 2 diabetes mellitus. Diabetologia 50: 2245–2253.
55. Douen AG, Ramlal T, Rastogi S, Bilan PJ, Cartee GD, et al. (1990) Exercise
induces recruitment of the "insulin-responsive glucose transporter". Evidence for
distinct intracellular insulin- and exercise-recruitable transporter pools in skeletal
muscle. The Journal of biological chemistry 265: 13427–13430.
56. Wallberg-Henriksson H, Constable SH, Young DA, Holloszy JO (1988) Glucose
transport into rat skeletal muscle: interaction between exercise and insulin.
Journal of applied physiology 65: 909–913.
57. Michael LF, Wu Z, Cheatham RB, Puigserver P, Adelmant G, et al. (2001)
Restoration of insulin-sensitive glucose transporter (GLUT4) gene expression in
muscle cells by the transcriptional coactivator PGC-1. Proc Natl Acad Sci U S A
98: 3820–3825.
58. Al-Khalili L, Cartee GD, Krook A (2003) RNA interference-mediated reduction
in GLUT1 inhibits serum-induced glucose transport in primary human skeletal
muscle cells. Biochem Biophys Res Commun 307: 127–132.
59. Gaster M, Handberg A, Schurmann A, Joost HG, Beck-Nielsen H, et al. (2004)
GLUT11, but not GLUT8 or GLUT12, is expressed in human skeletal muscle
in a fibre type-specific pattern. Pflugers Arch 448: 105–113.
60. Kase ET, Wensaas AJ, Aas V, Hojlund K, Levin K, et al. (2005) Skeletal muscle
lipid accumulation in type 2 diabetes may involve the liver X receptor pathway.
Diabetes 54: 1108–1115.
61. Kase ET, Thoresen GH, Westerlund S, Hojlund K, Rustan AC, et al. (2007)
Liver X receptor antagonist reduces lipid formation and increases glucose
metabolism in myotubes from lean, obese and type 2 diabetic individuals.
Diabetologia 50: 2171–2180.
62. Buck MJ, Squire TL, Andrews MT (2002) Coordinate expression of the PDK4
gene: a means of regulating fuel selection in a hibernating mammal.
Physiological genomics 8: 5–13.
63. Sarabia V, Lam L, Burdett E, Leiter LA, Klip A (1992) Glucose transport in
human skeletal muscle cells in culture. Stimulation by insulin and metformin.
J Clin Invest 90: 1386–1395.
64. Ukropcova B, McNeil M, Sereda O, de Jonge L, Xie H, et al. (2005) Dynamic
changes in fat oxidation in human primary myocytes mirror metabolic
characteristics of the donor. J Clin Invest 115: 1934–1941.
65. Aas V, Hessvik NP, Wettergreen M, Hvammen AW, Hallen S, et al. (2010)
Chronic hyperglycemia reduces substrate oxidation and impairs metabolic
switching of human myotubes. Biochim Biophys Acta.
In Vitro Exercise of Human Skeletal Muscle Cells
PLoS ONE | www.plosone.org 10 March 2012 | Volume 7 | Issue 3 | e33203
Top Related

Copyright © 2022 FDOKUMEN

