
![5. Harry Potter dan Orde Phoenix [EbookGratis.Web.id].pdf](https://static.fdokumen.com/doc/165x107/6324a72fe491bcb36c09edf6/5-harry-potter-dan-orde-phoenix-ebookgratiswebidpdf.jpg)


Bahasa
Halaman
Hukum

ORIGINAL
Distribution and characteristics of marine habitats in a subpolarbay based on hydroacoustics and bed shear stressestimates—Potter Cove, King George Island, Antarctica
Anne-Cathrin Wölfl & Chai Heng Lim & H. Christian Hass &Sebastian Lindhorst & Gabriela Tosonotto & Karsten Alexander Lettmann &
Gerhard Kuhn & Jörg-Olaf Wolff & Doris Abele
Received: 13 January 2014 /Accepted: 25 May 2014# Springer-Verlag Berlin Heidelberg 2014
Abstract Marine habitats worldwide are increasingly pres-surized by climate change, especially along the AntarcticPeninsula. Well-studied areas in front of rapidly retreatingtidewater glaciers like Potter Cove are representative for sim-ilar coastal environments and, therefore, shed light on habitatformation and development on not only a local but alsoregional scale. The objective of this study was to provideinsights into habitat distribution in Potter Cove, KingGeorge Island, Antarctica, and to evaluate the associatedenvironmental processes. Furthermore, an assessmentconcerning the future development of the habitats is provided.To describe the seafloor habitats in Potter Cove, an acousticseabed discrimination system (RoxAnn) was used in combi-nation with underwater video images and sediment samples.Due to the absence of wave and current measurements in thestudy area, bed shear stress estimates served to delineate zonesprone to sediment erosion. On the basis of the investigations,two habitat classes were identified in Potter Cove, namelysoft-sediment and stone habitats that, besides influences from
sediment supply and coastal morphology, are controlled bysediment erosion. A future expansion of the stone habitat ispredicted if recent environmental change trends continue.Possible implications for the Potter Cove environment, andother coastal ecosystems under similar pressure, includechanges in biomass and species composition.
Introduction
The delineation of seafloor habitats and associated oceano-graphic processes is fundamental for understanding how ma-rine environments will respond to global warming. As a resultof climate change, valuable habitats may shift, dissect or evendisappear, especially in vulnerable localities such as theAntarctic Peninsula. This region recently has been experienc-ing rapid regional warming with serious consequences for themarine and terrestrial environments (Vaughan et al. 2001).Cook et al. (2005) detected glacier front retreat all along theAntarctic Peninsula during the latter part of the past century.Since the mid 1950s, glacier fronts on King George Island(KGI) have retreated by hundreds of meters up to 1 km(Simões et al. 1999). In an arctic study, Kruss et al. (2006)pointed out that glacier retreat can have serious impacts onseafloor environments and habitats of fjords. It is thereforeimportant to continuously observe these environments if po-tential impacts and future trends are to be predicted.
During the last few decades, hydroacoustic devices such assidescan sonars, as well as single-beam and multi-beam echo-sounder systems have increasingly been used for detailedseafloor mapping applications (e.g. Hobbs 1985; Magorrianet al. 1995; Kostylev et al. 2001) because they represent fastand low-budget alternatives to conventional mapping tech-niques such as grab sampling or direct observation by diving
A.<C. Wölfl (*) :H. C. HassAlfred Wegener Institute, Wadden Sea Research Station, 25992 List,Germanye-mail: [email protected]
C. H. Lim :K. A. Lettmann : J.<O. WolffICBM, Physical Oceanography, University of Oldenburg,Oldenburg, Germany
S. LindhorstInstitute of Geology and Paleontology, University of Hamburg,Hamburg, Germany
G. TosonottoInstituto Antártico Argentino, Buenos Aires, Argentina
G. Kuhn :D. AbeleAlfred Wegener Institute, Bremerhaven, Germany
Geo-Mar LettDOI 10.1007/s00367-014-0375-1
(Chivers et al. 1990). In addition to the delineation of abioticseafloor characteristics such as grain size, numerous studieshave also demonstrated the capability of hydroacoustics todetect changes in seafloor habitats and benthic communities(e.g. McRea et al. 1999; Bartholomä 2006; Jerosch et al. 2007;Ierodiaconou et al. 2011; Dumke et al. 2014).
Seafloor habitat maps based on surveys using theRoxAnn system (Sonavision Ltd.) have been producedby several authors (e.g. Greenstreet et al. 1997; Brownet al. 2005; Mielck et al. 2014). However, Humborstadet al. (2004), who used the RoxAnn system to assesstrawling impacts in the Barents Sea, have stressed theimportance of applying multiple independent observa-tions to avoid misinterpretations. Furthermore, differentkinds of multivariate statistics have been applied toassist in the evaluation of large data structures obtainedby hydroacoustics (e.g. Sotheran et al. 1997; Krusset al. 2008; Greenstreet et al. 2010).
The Potter Cove study area has been the focus ofnumerous biological investigations over past decades.Several studies have provided crucial information onthe ecosystem structure in Potter Cove (e.g. Sahadeet al. 1998; Quartino and Boraso de Zaixso 2008;Schloss et al. 2012). However, investigations includingthe spatial distribution of seafloor habitats are needed toreveal and capture very recent changes. Although gen-eral oceanographic processes have been reconstructed inthe area on the basis of the regional wind field (e.g.Roese and Drabble 1998), direct measurements ofwaves and currents are still missing. The availabilityof such data, however, is deemed important becausesediment stability and benthic associations have beenshown to be closely linked to bed shear stress (e.g.Warwick and Uncles 1980). In earlier years, the influ-ence of these processes on marine environments weremostly determined by direct observations (e.g. Aller 1989).More recently, hydrodynamic models have been applied tocompute bed shear stresses that are capable of altering thedistribution of sediments and benthic organisms (e.g. Hemer2006). For these reasons, field observations in Potter Covehave here been combined with shear stress estimates derivedfrom current and wave models.
Within this context, the aims of the present study were (1)to provide an up-to-date seafloor habitat map with detailedinformation on sediment distribution in Potter Cove usinghydroacoustic data, underwater video recordings and sedi-ment samples, (2) to define how environmental parameterscontrol habitat distribution in this particular environment, and(3) to compare the recent distribution patterns with those offormer studies. These results then served to predict the futuredevelopment of the area as a representative case for applica-tion to other coastal ecosystems experiencing similar environ-mental pressures.
Physical setting
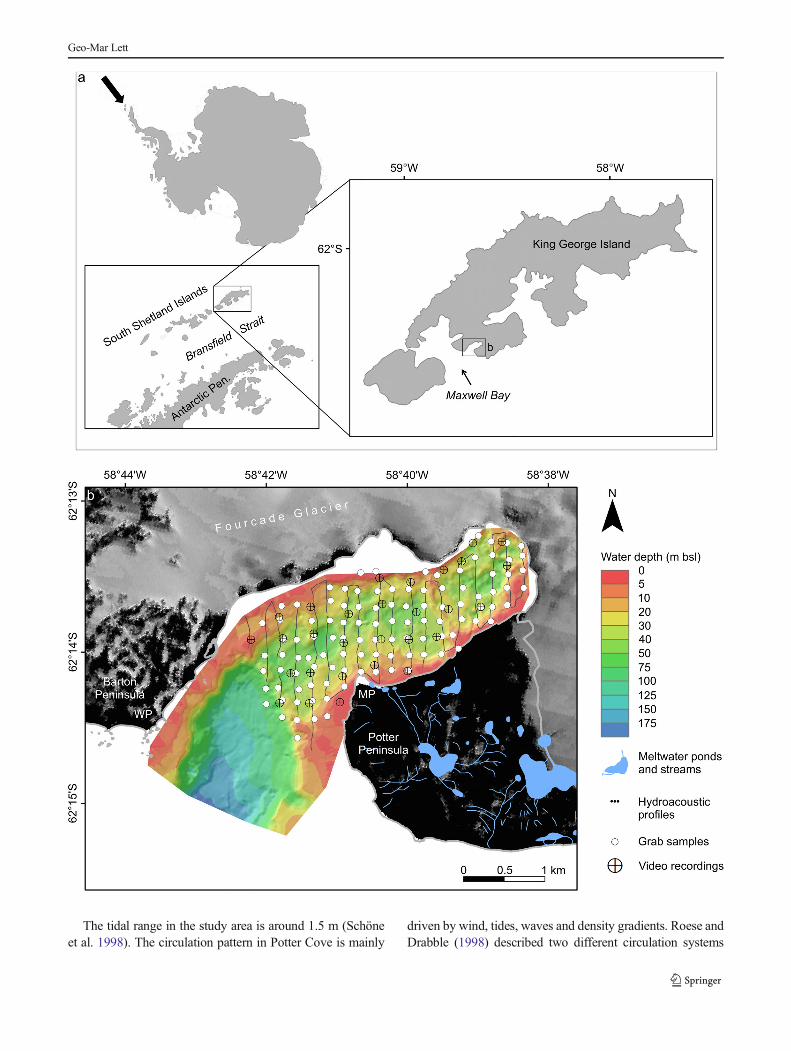
KGI is the largest island of the South ShetlandArchipelago, being located about 120 km north of theAntarctic Peninsula from which it is separated by theBransfield Strait (Fig. 1a). Towards the north, the islandis framed by the Drake Passage.
The study area is characterized by a maritime Antarcticclimate, leading to a temperate glacial setting with a thinice cover and fragmented coastal ice fields with rock andgravel beaches in between. Icebergs containing debrislayers are a typical feature near the terminus of calvingglaciers. Large discharges of glacial meltwater are com-mon, resulting in sediment-laden surface plumes in thebays. Sediment fallout from these surface plumes anddeposition of coarser materials mobilized by heavy rains,as well as exceptional discharges via meltwater creeks,form the principal sediment sources (Griffith andAnderson 1989; Yoon et al. 1992). A study from KGIshows the importance of meltwater as transporting agentfor lithogenic particles from the coastal drainage duringsummer months (Khim et al. 2007). Sediment mass accu-mulation rates in Maxwell Bay have increased up to of0.66 g cm–2 year–1 during the last 100 years (Monienet al. 2011). Sea ice usually starts to form at the end ofJuly and begins to break up in late October (Khim andYoon 2003).
The Potter Cove tributary inlet is located in the southwestof KGI, opening up towards the fjord-studded coast ofMaxwell Bay. The cove is about 4 km long and 2.5 km wide,and is divided into an inner and outer part by a 30-m-deepunderwater sill. Water depths in the inner cove do not exceedabout 50 m, whereas depths in the outer cove reach 100 to 200m (Klöser et al. 1994). The eastern and northern coasts arecharacterized by steep slopes partly occupied by the FourcadeGlacier, a retreating tidewater glacier that releases ice andsediment-laden meltwater into the cove. The southern coastof the cove has a flat topography dissected by two meltwaterstreams, Matías and Potter Creek, which discharge suspendedsediments into the cove (Varela 1998). The coastal area in thesouthwest of Potter Peninsula is characterized by flat terrainwith occasional steep surfaces and outcropping bedrock bothon land and below sea level. According to Veit-Köhler (1998),fine sediments can be found in protected locations, whereasmore exposed areas are dominated by coarser material.
�Fig. 1 a Location of King George Island and Potter Cove. bMap of thestudy area in Potter Cove. Single beam bathymetric data are from the IAA(Instituto Antártico Argentino, Buenos Aires, Argentina), and Landsatsatellite image data from the Antarctic Digital Database. Meltwatersystems have been digitized from Kraus and del Valle (2008), and thecoastline extracted from Rückamp et al. (2011).MPMirounga Point,WPWinship Point
Geo-Mar Lett
The tidal range in the study area is around 1.5 m (Schöneet al. 1998). The circulation pattern in Potter Cove is mainly
driven by wind, tides, waves and density gradients. Roese andDrabble (1998) described two different circulation systems
Geo-Mar Lett
that result from the bidirectional (E–W) wind field. One is acyclonic gyre, where water renewal commences along thenorthern coast with clear water entering from Maxwell Bayand leaving on the southern side. In response to the winddirection, the associated vertical circulation results in eitherdownwelling or upwelling. Furthermore, strong westerlywinds enhance water pile-up in the inner cove, therebyexpanding the subsurface layer that flows out of the cove.
Materials and methods
The RoxAnn GD-X acoustic ground discrimination system
The single-beam RoxAnn GD-X (Sonavision Ltd.) systemuses an echo-integration methodology to derive the two pa-rameters E1 and E2 that are related to seabed conditions(Kenny et al. 2003). The first echo from the emitted ultrasonicwave is the direct reflection from the seafloor. It consists oftwo parts, an echo peak mainly derived from specular reflec-tion of the acoustic wave, and a second part assumed to be afunction of more diffuse backscatter. Only this second part isintegrated in the calculation of the parameter E1, which isconsidered to be an indicator of bottom roughness. The sec-ond echo, which is received after having been reflected at thesea surface and a second time at the seafloor, is included in itsentirety for the calculation of parameter E2. It is used topredict the hardness of the seafloor (Hamilton et al. 1999).
Bathymetric changes are compensated by a pulse integra-tion constant that adjusts the E1 and E2 gate areas.Furthermore, signal variation due to increasing water depthsare compensated by means of time varying gain (Chandu,SonaVision, pers. comm., 2014). Slope effects are assumedto be minor because of a mean slope of only 4°, this beingconfirmed by the comparison of along-slope (not shown inthis study) and cross-slope profiles (as suggested by Hamiltonet al. 1999), the two showing only minor differences at inter-sections. Furthermore, agglomerations of E1 and E2 pairingsin two-dimensional space are related to certain seafloor char-acteristics (Penrose et al. 2005). The relationship betweenthem can be defined by calibrating the signals by, for example,using underwater photographs or video images and/or sedi-ment samples.
The RoxAnnGD-X device was equippedwith a Furuno LS4100 echo-sounder using an operational frequency of 200kHz, a beam width with an opening angle of 10° and a depthrange of 50 m. The system was set up according to thespecifications provided by the manufacturer. Prior to actualsurveys, RoxAnn was run for about 20 minutes to stabilize thesystem. Surveys were performed at a vessel speed of approx-imately 4 knots using a Zodiac Mk4 inflatable dinghy.Acoustic transect lines were run at 200 m intervals duringvery calm and stable sea states in November 2011 (Fig. 1b).
The water depth in the study area varied between 1 and 55 m.Data recorded at water depths greater than 50 m, as well asblank and erroneous values caused by slow vessel speed,sharp movements, air bubbles, shoals or technical failures(cf. Foster-Smith and Sotheran 2003), were subsequentlyremoved.
Underwater video images
An underwater video survey was performed at a vessel speedof approximately 1 knot using the same ZodiacMk4 inflatabledinghy. A Kongsberg colour zoom camera (oe1366/67 Mk II)fitted with a miniature underwater lampwas used for real-timerecordings of the seafloor. The resolution was set at 352×288pixels. Time and GPS positions were tracked by a loggingdevice and displayed on a monitor. Following the RoxAnnsurveys, 29 short video profiles were obtained during slightsea conditions from the end of December 2011 until the end ofJanuary 2012. These were evaluated for calibration purposes(Fig. 1b).
Sediment sampling and analysis
During the field campaign in the austral summer season of2010/2011, 136 sampling stations were occupied in PotterCove using a small van Veen grab sampler. At 121 of these,surficial sediments were successfully recovered. At the re-maining 15 stations, sediment recovery failure is assumed tohave been due to either operational difficulties or the presenceof boulders at the seabed. For the present study, only samplingstations located on or in direct proximity of the hydroacousticsurvey lines were selected for investigation (Fig. 1b).
Prior to grain-size analysis, carbonate and organic matterwere removed by treatment with acetic acid and hydrogenperoxide. Sodium polyphosphate was subsequently added todisaggregate and prevent new aggregation of particles beforeshaking the samples overnight by means of an orbital shaker.Before and during grain-size analysis, the samples were keptdispersed by ultrasonic treatment. Grain-size analyses wereperformed using a Cilas 1180L particle-size analyser, whichmeasures particles in 100 size classes between 0.04 and 2,500μm, the data output being expressed in volume percentages.Grain-size statistics were calculated using the GRADISTATprogram of Blott and Pye (2001). For the purpose of thisstudy, the percentile statistics of Folk and Ward (1957) wereused for further applications. In order to classify the sedimentsin Potter Cove, mean grain sizes were interpolated andexpressed in terms of sediment classes according to the mod-ified Wentworth scale (cf. Wentworth 1922; Tanner 1969).Changes in sediment distribution in Potter Cove are assumedto be negligible from one year to another.
Geo-Mar Lett
Statistical analyses
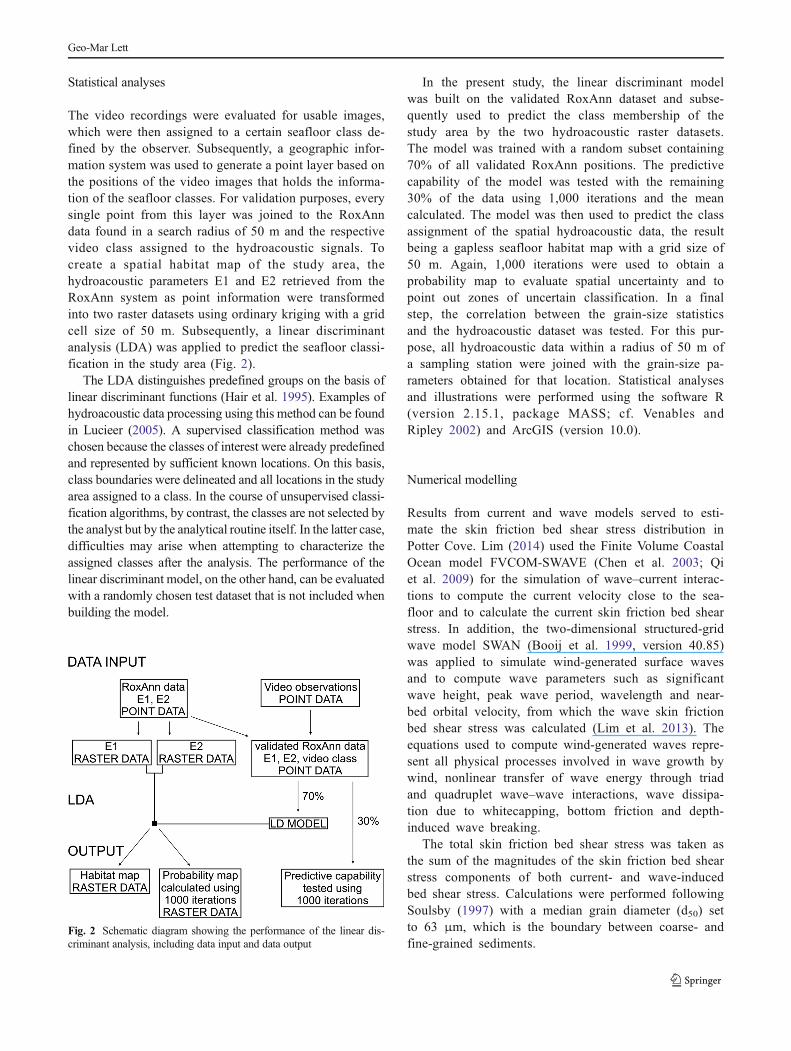
The video recordings were evaluated for usable images,which were then assigned to a certain seafloor class de-fined by the observer. Subsequently, a geographic infor-mation system was used to generate a point layer based onthe positions of the video images that holds the informa-tion of the seafloor classes. For validation purposes, everysingle point from this layer was joined to the RoxAnndata found in a search radius of 50 m and the respectivevideo class assigned to the hydroacoustic signals. Tocreate a spatial habitat map of the study area, thehydroacoustic parameters E1 and E2 retrieved from theRoxAnn system as point information were transformedinto two raster datasets using ordinary kriging with a gridcell size of 50 m. Subsequently, a linear discriminantanalysis (LDA) was applied to predict the seafloor classi-fication in the study area (Fig. 2).
The LDA distinguishes predefined groups on the basis oflinear discriminant functions (Hair et al. 1995). Examples ofhydroacoustic data processing using this method can be foundin Lucieer (2005). A supervised classification method waschosen because the classes of interest were already predefinedand represented by sufficient known locations. On this basis,class boundaries were delineated and all locations in the studyarea assigned to a class. In the course of unsupervised classi-fication algorithms, by contrast, the classes are not selected bythe analyst but by the analytical routine itself. In the latter case,difficulties may arise when attempting to characterize theassigned classes after the analysis. The performance of thelinear discriminant model, on the other hand, can be evaluatedwith a randomly chosen test dataset that is not included whenbuilding the model.
In the present study, the linear discriminant modelwas built on the validated RoxAnn dataset and subse-quently used to predict the class membership of thestudy area by the two hydroacoustic raster datasets.The model was trained with a random subset containing70% of all validated RoxAnn positions. The predictivecapability of the model was tested with the remaining30% of the data using 1,000 iterations and the meancalculated. The model was then used to predict the classassignment of the spatial hydroacoustic data, the resultbeing a gapless seafloor habitat map with a grid size of50 m. Again, 1,000 iterations were used to obtain aprobability map to evaluate spatial uncertainty and topoint out zones of uncertain classification. In a finalstep, the correlation between the grain-size statisticsand the hydroacoustic dataset was tested. For this pur-pose, all hydroacoustic data within a radius of 50 m ofa sampling station were joined with the grain-size pa-rameters obtained for that location. Statistical analysesand illustrations were performed using the software R(version 2.15.1, package MASS; cf. Venables andRipley 2002) and ArcGIS (version 10.0).
Numerical modelling
Results from current and wave models served to esti-mate the skin friction bed shear stress distribution inPotter Cove. Lim (2014) used the Finite Volume CoastalOcean model FVCOM-SWAVE (Chen et al. 2003; Qiet al. 2009) for the simulation of wave–current interac-tions to compute the current velocity close to the sea-floor and to calculate the current skin friction bed shearstress. In addition, the two-dimensional structured-gridwave model SWAN (Booij et al. 1999, version 40.85)was applied to simulate wind-generated surface wavesand to compute wave parameters such as significantwave height, peak wave period, wavelength and near-bed orbital velocity, from which the wave skin frictionbed shear stress was calculated (Lim et al. 2013). Theequations used to compute wind-generated waves repre-sent all physical processes involved in wave growth bywind, nonlinear transfer of wave energy through triadand quadruplet wave–wave interactions, wave dissipa-tion due to whitecapping, bottom friction and depth-induced wave breaking.
The total skin friction bed shear stress was taken asthe sum of the magnitudes of the skin friction bed shearstress components of both current- and wave-inducedbed shear stress. Calculations were performed followingSoulsby (1997) with a median grain diameter (d50) setto 63 μm, which is the boundary between coarse- andfine-grained sediments.
Fig. 2 Schematic diagram showing the performance of the linear dis-criminant analysis, including data input and data output
Geo-Mar Lett
The incipient motion of a sediment grain occurs when theforces exerted by the total skin friction bed shear stress actingon a grain exceed the submerged weight of the graincounteracting them (Soulsby 1997). The sediment density inPotter Cove was set to 2,650 kg m–3. The critical bed shearstress was calculated to be 0.13 Nm–2, i.e. the sediment grainsbegin to move when the calculated total skin friction bed shearstress exceeds this value.
Results
Numerical modelling
Model results such as tide-, wind- and wave-driven currentspeed in the lowest water layer, wave orbital velocity near theseabed and wave parameters were extracted from theFVCOM-SWAVE and SWAN models for the total bed shearstress calculation (Lim 2014). A comparison of bed shearstresses induced by currents and waves shows that the lattersignificantly exceeds the critical value in the northern part ofPotter Cove, as well as in the western and southern coastalzones along Potter Peninsula, whereas current-induced bedshear stress is generally very low and only becomes moresignificant during rough sea conditions, especially in shallowwater (Lim 2014).
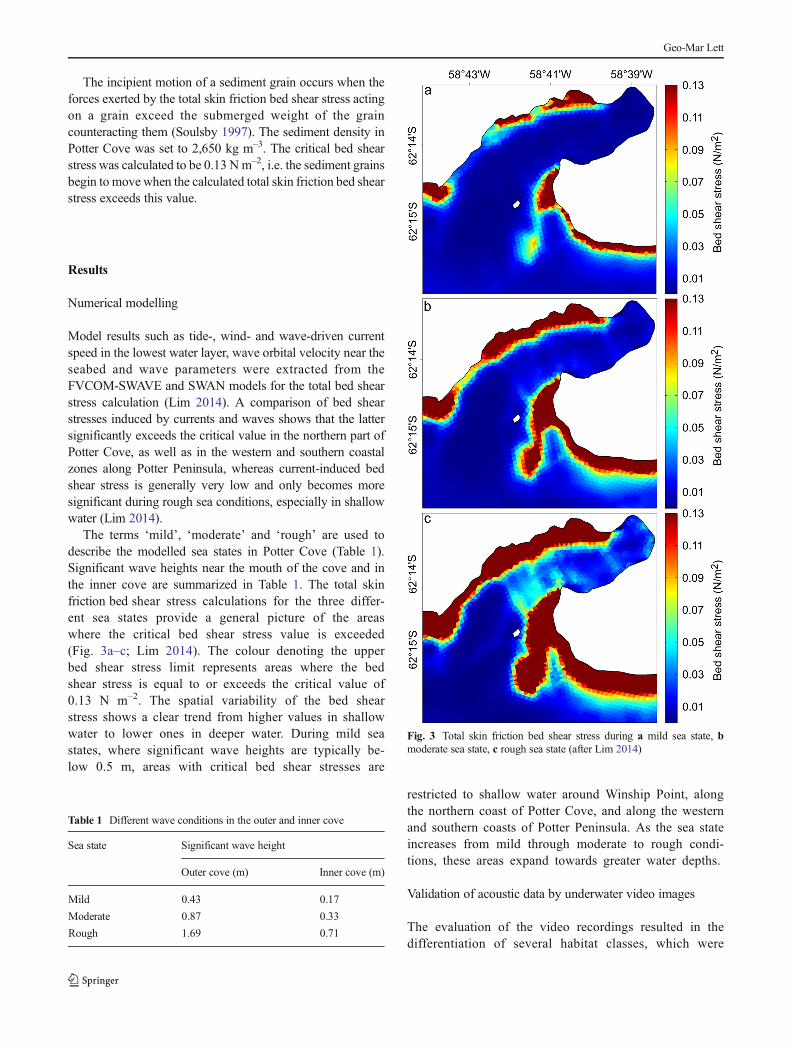
The terms ‘mild’, ‘moderate’ and ‘rough’ are used todescribe the modelled sea states in Potter Cove (Table 1).Significant wave heights near the mouth of the cove and inthe inner cove are summarized in Table 1. The total skinfriction bed shear stress calculations for the three differ-ent sea states provide a general picture of the areaswhere the critical bed shear stress value is exceeded(Fig. 3a–c; Lim 2014). The colour denoting the upperbed shear stress limit represents areas where the bedshear stress is equal to or exceeds the critical value of0.13 N m–2. The spatial variability of the bed shearstress shows a clear trend from higher values in shallowwater to lower ones in deeper water. During mild seastates, where significant wave heights are typically be-low 0.5 m, areas with critical bed shear stresses are
restricted to shallow water around Winship Point, alongthe northern coast of Potter Cove, and along the westernand southern coasts of Potter Peninsula. As the sea stateincreases from mild through moderate to rough condi-tions, these areas expand towards greater water depths.
Validation of acoustic data by underwater video images
The evaluation of the video recordings resulted in thedifferentiation of several habitat classes, which were
Table 1 Different wave conditions in the outer and inner cove
Sea state Significant wave height
Outer cove (m) Inner cove (m)
Mild 0.43 0.17
Moderate 0.87 0.33
Rough 1.69 0.71
Fig. 3 Total skin friction bed shear stress during a mild sea state, bmoderate sea state, c rough sea state (after Lim 2014)
Geo-Mar Lett
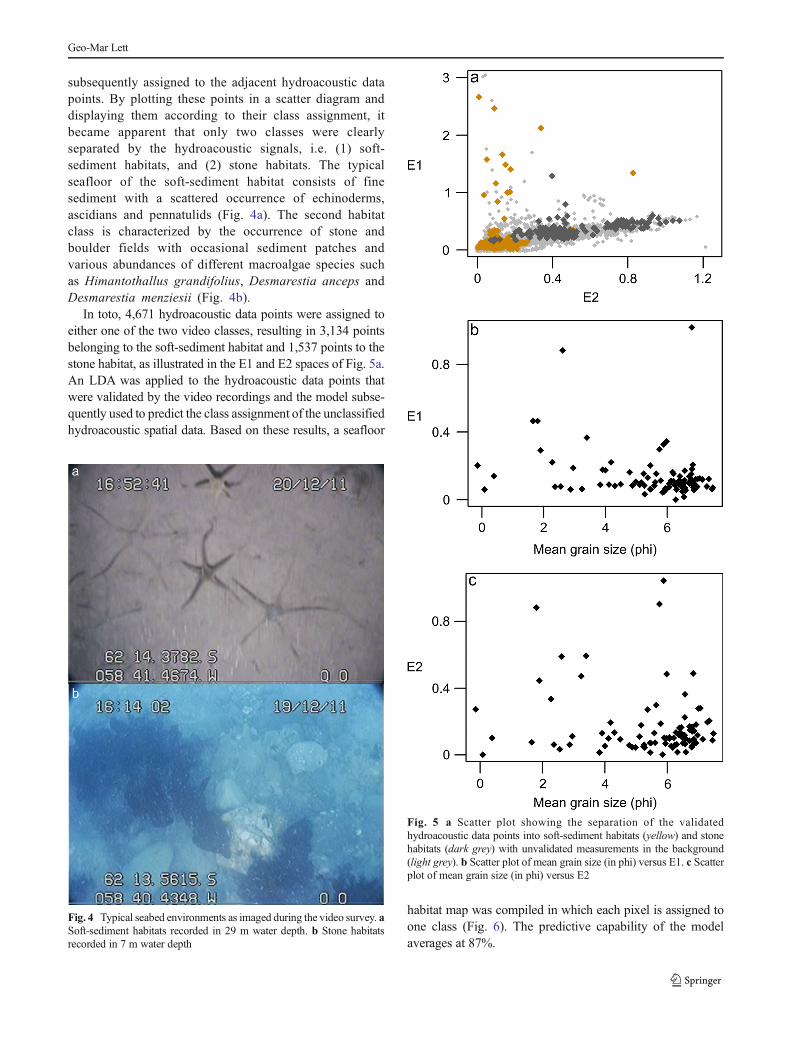
subsequently assigned to the adjacent hydroacoustic datapoints. By plotting these points in a scatter diagram anddisplaying them according to their class assignment, itbecame apparent that only two classes were clearlyseparated by the hydroacoustic signals, i.e. (1) soft-sediment habitats, and (2) stone habitats. The typicalseafloor of the soft-sediment habitat consists of finesediment with a scattered occurrence of echinoderms,ascidians and pennatulids (Fig. 4a). The second habitatclass is characterized by the occurrence of stone andboulder fields with occasional sediment patches andvarious abundances of different macroalgae species suchas Himantothallus grandifolius, Desmarestia anceps andDesmarestia menziesii (Fig. 4b).
In toto, 4,671 hydroacoustic data points were assigned toeither one of the two video classes, resulting in 3,134 pointsbelonging to the soft-sediment habitat and 1,537 points to thestone habitat, as illustrated in the E1 and E2 spaces of Fig. 5a.An LDA was applied to the hydroacoustic data points thatwere validated by the video recordings and the model subse-quently used to predict the class assignment of the unclassifiedhydroacoustic spatial data. Based on these results, a seafloor
habitat map was compiled in which each pixel is assigned toone class (Fig. 6). The predictive capability of the modelaverages at 87%.
Fig. 4 Typical seabed environments as imaged during the video survey. aSoft-sediment habitats recorded in 29 m water depth. b Stone habitatsrecorded in 7 m water depth
Fig. 5 a Scatter plot showing the separation of the validatedhydroacoustic data points into soft-sediment habitats (yellow) and stonehabitats (dark grey) with unvalidated measurements in the background(light grey). b Scatter plot of mean grain size (in phi) versus E1. c Scatterplot of mean grain size (in phi) versus E2
Geo-Mar Lett
Sediment samples
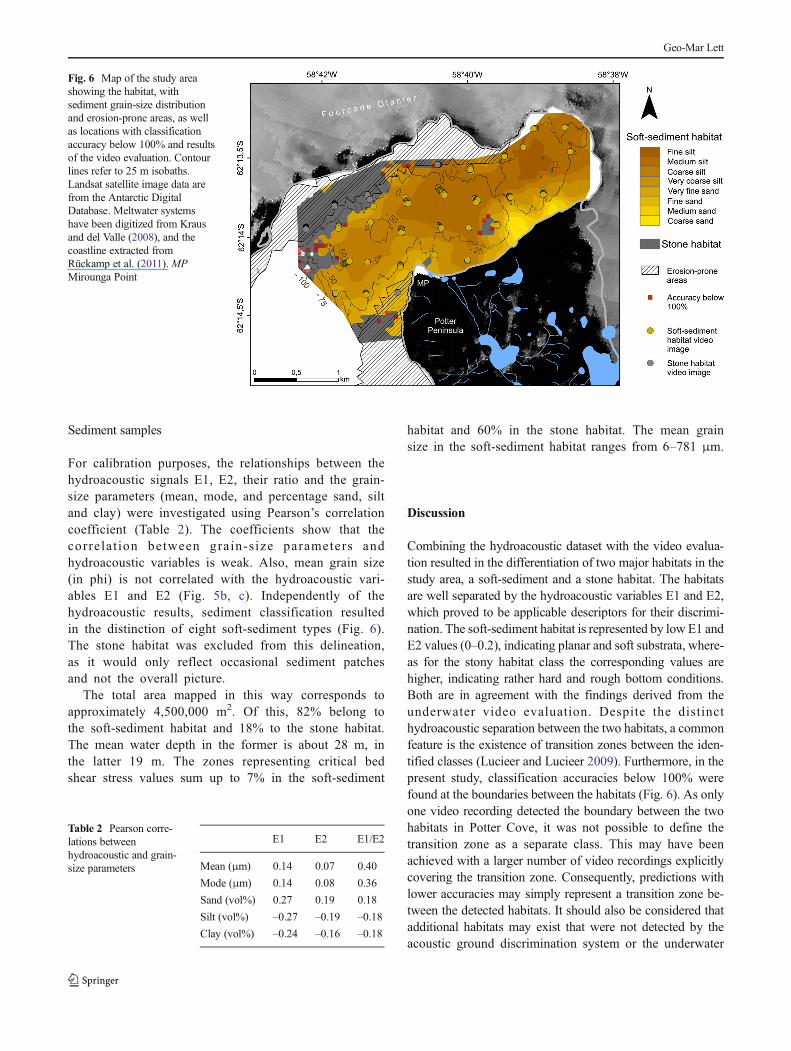
For calibration purposes, the relationships between thehydroacoustic signals E1, E2, their ratio and the grain-size parameters (mean, mode, and percentage sand, siltand clay) were investigated using Pearson’s correlationcoefficient (Table 2). The coefficients show that thecorrela t ion between grain-s ize parameters andhydroacoustic variables is weak. Also, mean grain size(in phi) is not correlated with the hydroacoustic vari-ables E1 and E2 (Fig. 5b, c). Independently of thehydroacoustic results, sediment classification resultedin the distinction of eight soft-sediment types (Fig. 6).The stone habitat was excluded from this delineation,as it would only reflect occasional sediment patchesand not the overall picture.
The total area mapped in this way corresponds toapproximately 4,500,000 m2. Of this, 82% belong tothe soft-sediment habitat and 18% to the stone habitat.The mean water depth in the former is about 28 m, inthe latter 19 m. The zones representing critical bedshear stress values sum up to 7% in the soft-sediment
habitat and 60% in the stone habitat. The mean grainsize in the soft-sediment habitat ranges from 6–781 μm.
Discussion
Combining the hydroacoustic dataset with the video evalua-tion resulted in the differentiation of two major habitats in thestudy area, a soft-sediment and a stone habitat. The habitatsare well separated by the hydroacoustic variables E1 and E2,which proved to be applicable descriptors for their discrimi-nation. The soft-sediment habitat is represented by low E1 andE2 values (0–0.2), indicating planar and soft substrata, where-as for the stony habitat class the corresponding values arehigher, indicating rather hard and rough bottom conditions.Both are in agreement with the findings derived from theunderwater video evaluation. Despite the distincthydroacoustic separation between the two habitats, a commonfeature is the existence of transition zones between the iden-tified classes (Lucieer and Lucieer 2009). Furthermore, in thepresent study, classification accuracies below 100% werefound at the boundaries between the habitats (Fig. 6). As onlyone video recording detected the boundary between the twohabitats in Potter Cove, it was not possible to define thetransition zone as a separate class. This may have beenachieved with a larger number of video recordings explicitlycovering the transition zone. Consequently, predictions withlower accuracies may simply represent a transition zone be-tween the detected habitats. It should also be considered thatadditional habitats may exist that were not detected by theacoustic ground discrimination system or the underwater
Fig. 6 Map of the study areashowing the habitat, withsediment grain-size distributionand erosion-prone areas, as wellas locations with classificationaccuracy below 100% and resultsof the video evaluation. Contourlines refer to 25 m isobaths.Landsat satellite image data arefrom the Antarctic DigitalDatabase. Meltwater systemshave been digitized from Krausand del Valle (2008), and thecoastline extracted fromRückamp et al. (2011).MPMirounga Point
Table 2 Pearson corre-lations betweenhydroacoustic and grain-size parameters
E1 E2 E1/E2
Mean (μm) 0.14 0.07 0.40
Mode (μm) 0.14 0.08 0.36
Sand (vol%) 0.27 0.19 0.18
Silt (vol%) –0.27 –0.19 –0.18
Clay (vol%) –0.24 –0.16 –0.18
Geo-Mar Lett
video recordings. The broad scattering of hydroacoustic sig-nals in the stony-habitat class suggests some variability inseafloor conditions, but it was not possible to identify anyadditional habitats.
The correlation analysis shows no relationship betweengrain-size parameters and hydroacoustic signals. It is thereforeassumed either that the hydroacoustic device is not able todetect small-scale changes in grain size or that other(unknown) seafloor properties influence the hydroacousticsignal. An example of this is the scattered occurrence ofbenthic organisms in the soft-sediment habitat. Even thoughthe sediment distribution in Potter Cove is assumed to be moreor less stable from one year to the next, small shifts insediment composition may occur between seasons and there-by reduce the correlation between parameters.
The bed shear stress estimates have revealed areas prone tosediment erosion in Potter Cove. Waves generated by strongwinds are typical for this region (Schloss and Ferreyra 2002;Schloss et al. 2012) and have an enormous impact on the bedshear stress, especially in shallow water. This is in contrast tocurrent-induced bed shear stresses, which are much weaker(cf. Lim et al. 2013). Lim (2014) also shows that the areasprone to sediment erosion expand into deeper water as seastates become rougher, such fluctuations being episodic ratherthan continuous in nature. This indicates the importance ofconsidering oceanographic processes when characterizingseafloor habitats, even if direct measurements are missing.
In the present study, model results were not only used toexplain the spatial distribution of the two habitats, but alsoprovided information about the conditions during which hab-itat formation takes place. The estimated bed shear stress inthe centre of the cove and near the eastern and southern coastof the inner cove is markedly lower than in the other areas,which is attributed to a decreasing influence of wave action onthe seabed in deeper waters and smaller wave heights in theinner cove. In addition, the coast in the southern inner cove ispartially sheltered by Mirounga Point (Fig. 1b). According tothe model results, the distribution of the stone habitat is ingood agreement with areas shown to be prone to bed erosion.Stony or hard bottoms are indicative of areas potentiallysubject to high bed sediment movement, any finer-grainedsediment being evidently removed when bed shear stressesexceed critical values. Sedimentation rates are, in any case,expected to be rather low because the clear water massesentering the cove from Maxwell Bay do not carry substantialquantities of sediment with them (Roese and Drabble 1998),and largemeltwater streams are absent along the north coast ofPotter Cove. The stones and boulders building up this habitatappear either to have been derived from the adjacent slopesover time or to represent the remnants of moraines depositedby the Fourcade Glacier. The same applies to the stone habitatin the southern part of the cove where bed shear stresses reachcritical values along the entire coast.
The soft-sediment habitat occurs throughout the central andsouthern inner cove, where the availability of stones andboulders is limited but large amounts of fine material aresupplied by the Fourcade Glacier and meltwater streams.Here, low bed shear stresses associated with low wave actionand small wave heights impair the movement of sediment. Asimilar habitat is found in the shallow waters at the head of thecove, where large amounts of fine sediment are depositedfrom sediment-laden surface plumes generated by glacialdischarge and meltwater streams draining the PotterPeninsula. As before, low bed shear stresses in this part ofthe cove prevent sediment erosion. West of Mirounga Point,by contrast, a soft-sediment habitat occurs in an area prone tosediment erosion. Here, the occurrence of coarser material isindicative of higher energy, though evidently not high enoughto remove the coarser-grained sediments characterizing thisarea.
The reason for the occurrence of two isolated stone habitatspots near the southern coast of the cove remains unclear, thelocations being rather unfavourable for the formation of stonehabitats. Due to their sheltered location and greater waterdepth, the areas exhibit low bed shear stresses. In addition,finer-grained sediments line these areas. The isolated habitatsactually have low accuracy values, which might indicate anundetected habitat class or simply a misclassification due toerroneous hydroacoustic data points.
Quartino and Boraso de Zaixso (2008) reported the distri-bution of habitats above the 30 m isobath in Potter Cove. Thesoft bottoms identified above the 30 m isobaths in their studyare relatively congruent with the soft-sediment habitat andmacroalgal assemblages on rocky substrate in the stone habitatclass of the present study. The only difference is that themacroalgal assemblages did not extend as far to the east alongthe northern and the southern coast as the stone habitat iden-tified in the present study. In an older study (Klöser et al.1996) this limit is located even further to the west than in the2008 study, the investigation having been carried out by scubadiving from the waterline down to about 35 m. This could bean indication that erosion since 1996 has progressively ex-humed a boulder field that was subsequently occupied bymacroalgae. The sediment distribution map reveals that thesoft-sediment habitat in Potter Cove is mainly composed ofsilt. Originating from the Fourcade Glacier and adjacent melt-water streams (Griffith and Anderson 1989), silty sedimentsoccur in the inner cove and in the deeper basins, suggestinglow-energy conditions. This is also supported by the model-ling results, which suggest low or even no erosion at theselocations. Sandy sediments are found near the southern coast-line and adjacent to areas prone to fine sediment erosion, thetransition being associatedwith a gradual increase in bed shearstresses. The coarser material found in the southern inner covecan be attributed to the influence of temporary meltwateroutlets on Potter Peninsula (Fig. 6). One reason for the
Geo-Mar Lett
occurrence of coarser sediments in areas dislocated fromerosion-prone areas might be the enhancement of bed shearstresses due to meltwater discharges, a parameter not includedin the model. As a result, this issue cannot be completelyresolved at this stage. Another explanation for these coarsersediments could be enhanced transport through temporarymeltwater discharges from Potter Peninsula. Generally speak-ing, the sediments actually grade from fine silt near the head ofthe cove (NE) to very coarse silt at the cove mouth (SW). Thiscan be interpreted by downfjord increasing energy conditionsas well as increasing distance from the main sediment sources.This, however, stands in contrast to the study of Domack andIshman (1993), who documented a gradual downfjord de-crease in sand content.
Quartino et al. (2013), who investigated the spatial distri-bution of macroalgae in Potter Cove, postulated thatmacroalgae assemblages would expand into the inner part ofthe cove. The future development of these habitats, however,remains speculative; an expansion of the stone habitat into allerosion-prone areas, and therefore also into the inner part ofthe cove, cannot be excluded. At present, such a developmentis not yet evident in the northern and south-eastern cove, eventhough the conditions seem favourable for the establishmentof stone habitats. In the past, the Fourcade Glacier was locatedfurther downfjord, covering the area prone to erosion today.During glacier retreat, large amounts of fine material werereleased and deposited at the glacier front. It can therefore notbe excluded that remnants of this material can still be found inthe eastern erosion-prone areas today, erosion having simplynot been active long enough to remove all the fine material toexpose the rocky bottom beneath. Alternatively, depositionmay have outpaced erosion and/or the bed shear stress mayhave been different at that time. Clearly, these issues requirefurther investigations.
With respect to future developments, potential changes inthe wind field associated with global warming may affect thedistribution of habitats in Potter Cove. Thus, a general pole-ward strengthening of south-westerly winds has been reported(e.g. Thompson and Salomon 2002). Furthermore, Montes-Hugo et al. (2009) found an increase in wind intensity by up to60% along the western Antarctic Peninsula since the 1970s,with monthly mean wind speeds up to 8 m s–1. Stronger windsshould extend the areas with higher bed shear stress intodeeper waters, which would favour an expansion of the stonehabitat. However, stronger winds can also modify the circu-lation systems in Potter Cove, especially the vertical circula-tion that is directly influenced by the wind field. Furtherconsequences of global warming may also include an in-creased turbidity in the water column, as postulated bySchloss et al. (2002), which would affect the habitats and theirbenthic assemblages. Whichever the case, an expansion of thestone habitat, and therefore macroalgae coverage, would havea substantial impact on all those benthic communities that rely
on macroalgal carbon production as a direct or indirect foodsource (e.g. Iken et al. 1998).
Conclusions
In this study, an up-to-date habitat distribution map of PotterCove, defined on the basis of hydroacoustic data and model-ling results, is presented. The controlling environmental pro-cesses are represented by estimates of bed shear stresses basedon currents and waves as forcing agents, the critical bed shearstress for fine-grained sediment serving as criterion for poten-tial bed erosion. It is shown that habitat formation is notcontinuous, but rather the result of storms that cause moderateto rough sea state conditions.
Two major habitats have been identified, namely soft-sediment and stone habitats. The soft-sediment habitat ismainly composed of silt and sandy silt with a scattered occur-rence of a variety of marine benthic organisms. This habitatoccupies the inner cove and greater water depths in the centralcove. The sediments originate mainly from the FourcadeGlacier and adjacent meltwater streams. These show a coars-ening trend from the inner towards the outer cove and alsofrom the central axis towards the coast. This indicates asheltered environment at the head of the cove and a higher-energy environment downfjord, as well as an increase inenergy levels from the centre of the cove towards the coast.The stone habitat exhibits stone and boulder fields that arepartly covered by macroalgae. These are interrupted by occa-sional fine sediment deposits. This habitat principally occursat shallow water depths in the northwest and southeast ofPotter Cove, distinctly correlating with areas prone to finesediment erosion. It is located near slopes and bedrock out-crops, and remote from fine sediment sources.
Under the recent environmental conditions, an eastwardadvance of the stone habitat following the retreating glacierfront is postulated. This implies an exposure of suitable sub-strates for macroalgal colonization with long-term effects onthe biomass and species composition in the cove. It is expect-ed that these findings can be applied to other polar coastalecosystems similarly affected by climate warming and asso-ciated glacier retreat.
Acknowledgements This study is part of the ESF IMCOAST project(grant no. 03F0617A) and the EU project IMCONet (FP7 IRSES, actionno. 319718). The authors acknowledge the IAA (Instituto AntárticoArgentino, Buenos Aires, Argentina) for providing bathymetric data.Manythanks go to Prof. Changsheng Chen, Dr. Jianhua Qi and the MEDMresearch group in SMAST, University of Massachusetts, Dartmouth, forproviding the FVCOM source codes and advisory help.Wewould also liketo express our gratitude to the crews of Carlini (formerly Jubany) Stationfrom 2010/2011 and 2011/2012, with special thanks to Gastón Rihedel,Alejandro Ulrich, Verónica Fuentes, Alejandro Olariaga, DoloresDeregibus, Nina Wittenberg, Eduardo Ruiz Barlett and Marta Sierra for
Geo-Mar Lett
their unfailing support during field campaigns. Two anonymous reviewersare thanked for their constructive comments on the manuscript.
References
Aller JY (1989) Quantifying sediment disturbance by bottom currentsand its effect on benthic communities in a deep-sea westernboundary zone. Deep-Sea Res I 36:901–934
Bartholomä A (2006) Acoustic bottom detection and seabed classifica-tion in the German Bight, southern North Sea. Geo-Mar Lett 26:177–184. doi:10.1007/s00367-006-0030-6
Blott SJ, Pye K (2001) Gradistat: a grain size distribution and statisticspackage for the analysis of unconsolidated sediments. Earth SurfProcess Landforms 26(11):1237–1248
Booij N, Ris RC, Holthuijsen LH (1999) A third-generation wave modelfor coastal regions. 1. Model description and validation. J GeophysRes 104(C4):7649–7666
Brown CJ, Mitchell A, Limpenny DS, Robertson MR, Service M,Golding N (2005) Mapping seabed habitats in the Firth of Lornoff the west coast of Scotland: evaluation and comparison of habitatmaps produced using the acoustic ground-discrimination systemRoxAnn, and sidescan sonar. ICES J Mar Sci 62:790–802
Chen C, Liu H, Beardsley RC (2003) An unstructured grid, finite-volume, three-dimensional, primitive equations ocean model: appli-cation to coastal ocean and estuaries. J Atmos Ocean Tech 20(1):159–186
Chivers RC, Emerson NC, Burns D (1990) New acoustic processing forunderway surveying. Hydrogr J 56:9–17
Cook AJ, Fox AJ, Vaughan DG, Ferrigno JG (2005) Retreating glacierfronts on the Antarctic Peninsula over the past half-century. Science308:541–544
Domack EW, Ishman SE (1993) Oceanographic and physiographic con-trols onmodern sedimentation within Antarctic fjords. Geol Soc AmBull 105:1175–1189
Dumke I, Klaucke I, Berndt C, Bialas J (2014) Sidescan backscattervariations of cold seeps on the Hikurangi Margin (New Zealand):indications for different stages in seep development. Geo-Mar Lett34:169–184. doi:10.1007/s00367-014-0361-7
Folk RL, Ward WC (1957) Brazos River bar: a study in the significanceof grain-size parameters. J Sediment Petrol 27(1):3–26
Foster-Smith RL, Sotheran IS (2003) Mapping marine benthic biotopesusing acoustic ground-discrimination systems. Int J Remote Sens24(13):2761–2784
Greenstreet SPR, Tuck ID, Grewar GN, Armstrong E, Reid DG, WrightPJ (1997) An assessment of the acoustic survey technique, RoxAnn,as a means of mapping seabed habitat. ICES J Mar Sci 54:939–959
Greenstreet SPR, Holland GJ, Guirey EJ, Armstrong E, Fraser HM, GibbIM (2010) Combining hydroacoustic seabed survey and grab sam-pling techniques to assess “local” sandeel population abundance.ICES J Mar Sci 67(5):971–984
Griffith TW, Anderson JB (1989) Climatic controls of sedimentation inbays and fjords of the northern Antarctic Peninsula. Mar Geol85(2/4):181–204
Hair JF, Anderson RE, Tatham RL, Black WC (1995) Multivariate dataanalysis. Prentice Hall, New Jersey
Hamilton LJ, Mulhearn PJ, Poeckert R (1999) Comparison of RoxAnnand QTC-View acoustic bottom classification system performancefor the Cairns area, Great Barrier Reef, Australia. Cont Shelf Res19(12):1577–1597
Hemer MA (2006) The magnitude and frequency of combined flow bedshear stress as a measure of exposure on the Australian continentalshelf. Cont Shelf Res 26(11):1258–1280
Hobbs CA (1985) Side-scan sonar as a tool for mapping spatial variationsin sediment type. Geo-Mar Lett 5:241–245. doi:10.1007/BF02233809
Humborstad O-B, Nøttestad L, Løkkeborg S, Rapp HT (2004) RoxAnnbottom classification system, side-scan sonar and video-sledge:spatial resolution and their use in assessing trawling impacts. ICESJ Mar Sci 61:53–63
Ierodiaconou D, Monk J, Rattray A, Laurenson L, Versace VL (2011)Comparison of automated classification techniques for predictingbiological communities using hydroacoutics and video observa-tions. Cont Shelf Res 31:28–38
Iken K, Quartino ML, Barrera-Oro E, Palermo J, Wiencke C, Brey T(1998) Trophic relations between macroalgae and herbivores inPotter Cove (King George Island, Antarctica). In: Wiencke C,Ferreyra GA, Arntz W, Rinaldi C (eds) The Potter Cove CoastalEcosystem, Antarctica. Reports on Polar Research 299. KarlKamloth, Bremen, pp 258–262
Jerosch K, Schlüter M, Foucher J-P, Allais A-G, Klages M, Edy C (2007)Spatial distribution of mud flows, chemoautotrophic communitiesand biogeochemical habitats at Håkon Mosby Mud Volcano. MarGeol 243:1–17
Kenny AJ, Cato I, DesprezM, Fader G, Schüttenhelm RTE, Side J (2003)An overview of seabed-mapping technologies in the context ofmarine habitat classification. ICES J Mar Sci 60(2):411–418
Khim BK, Yoon HI (2003) Postglacial marine environmental changes inMaxwell Bay, King George Island, West Antarctica. Polar Res22(2):341–353
Khim BK, Shim J, Yoon HI, Kang YC, Jang YH (2007) Lithogenic andbiogenic particle deposition in an Antarctic coastal environment(Marian Cove, King George Island): seasonal patterns from a sedi-ment trap study. Estuar Coast Shelf Sci 73(1/2):111–122
Klöser H, Ferreyra G, Schloss I, Mercuri G, Laturnus F, Curtosi A (1994)Hydrography of Potter Cove, a small fjord-like inlet on King GeorgeIsland (South Shetlands). Estuar Coast Shelf Sci 38(5):523–537
Klöser H, Quartino ML, Wiencke C (1996) Distribution of macroalgae andmacroalgal communities in gradients of physical conditions in PotterCove, King George Island, Antarctica. Hydrobiologia 333(1):1–17
Kostylev VE, Todd BJ, Fader GBJ, Courtney RC, Cameron GDM,Pickrill RA (2001) Benthic habitat mapping on the Scotian Shelfbased on multibeam bathymetry, surficial geology and seafloorphotographs. Mar Ecol Prog Ser 219:121–137
Kraus S, del Valle R (2008) Geological map of Potter Peninsula (KingGeorge Island, South Shetland Islands, Antarctic Peninsula).Instituto Antártico Chileno, Punta Arenas & Instituto AntárticoArgentino, Buenos Aires. doi:10.1594/PANGAEA.667386
Kruss A, Tęgowski J, Wiktor J, Tatarek A (2006) Acoustic estimation ofmacrophytes in the Hornsund fjord (the Svalbard Archipelago).Hydroacoustics 9:89–96
Kruss A, Blondel P, Tęgowski J, Wiktor J, Tatarek A (2008) Estimation ofmacrophytes using single-beam and multibeam echosounding for en-vironmental monitoring of Arctic fjords (Kongsfjord, West SvalbardIsland). J Acoust Soc Am 123:3213. doi:10.1121/1.2933397
Lim CH (2014) Modelling waves and currents in Potter Cove, KingGeorge Island, Antarctica. PhD thesis, Carl von OssietzkyUniversity, Oldenburg, Germany
Lim CH, Lettmann K, Wolff J-O (2013) Numerical study on wavedynamics and wave-induced bed erosion characteristics in PotterCove, Antarctica. Ocean Dyn 63(11/12):1151–1174. doi:10.1007/s10236-013-0651-z
Lucieer V (2005) Applying discriminate analysis to characterise shallowrocky reef habitat. In: Chinese Bureau of Surveying and Mapping,Proc Symp Spatial-temporal Modeling, Spatial Reasoning,Analysis, Data Mining and Data Fusion (STM’05), 27–29 August2005, Peking University, Beijing, pp 215–219
Lucieer V, Lucieer A (2009) Fuzzy clustering for seafloor classification.Mar Geol 264(3/4):230–241
Geo-Mar Lett
Magorrian BH, Service M, Clarke W (1995) An acoustic bottom-classification survey of Strangford Lough, Northern Ireland. J MarBiol Assoc UK 75:987–992
McRea JE Jr, Greene HG, O’Connell VM, Wakefield WW (1999)Mapping marine habitats with high resolution sidescan sonar.Oceanol Acta 22:679–686
Mielck F, Bartsch I, Hass HC, Wölfl A-C, Bürk D, Betzler C (2014)Predicting spatial kelp abundance in shallow coastal waters usingthe acoustic ground discrimination system RoxAnn. Estuar CoastShelf Sci 143:1–11
Monien P, Schnetger B, Brumsack H-J, Hass HC, Kuhn G (2011) Ageochemical record of late Holocene palaeoenvironmental changes atKingGeorge Island (maritimeAntarctica). Antarctic Sci 23(3):255–267
Montes-Hugo M, Doney SC, Ducklow HW, Fraser W, Martinson D,Stammerjohn SE, Schofield O (2009) Recent changes in phyto-plankton communities associated with rapid regional climate changealong the western Antarctic Peninsula. Science 323(5920):1470–1473. doi:10.1126/science.1164533
Penrose JD, Siwabessy PJW, GavrilovA, Parnum I, Hamilton LJ, BickersA, Brooke B, Ryan DA, Kennedy P (2005) Acoustic Techniques forSeabed Classification. Cooperative Research Centre for CoastalZone, Estuary and Waterway Management, Indooroopilly,Queensland, Australia, Technical Report 32
Qi J, Chen C, Beardsley RC, Perrie W, Cowles GW, Lai Z (2009) Anunstructured-grid finite-volume surface wave model (FVCOM-SWAVE): implementation, validations and applications. OceanModel 28:153–166
Quartino ML, Boraso de Zaixso AL (2008) Summer macroalgal biomassin Potter Cove, South Shetland Islands, Antarctica: its productionand flux to the ecosystem. Polar Biol 31(3):281–294
Quartino ML, Deregibus D, Campana GL, Latorre GEJ, Momo FR(2013) Evidence of macroalgal colonization on newly ice-free areasfollowing glacial retreat in Potter Cove (South Shetland Islands),Antarctica. PLOS ONE 8(3):e58223
Roese M, Drabble M (1998) Wind driven circulation in Potter Cove. In:Wiencke C, Ferreyra GA, Arntz W, Rinaldi C (eds) The Potter CoveCoastal Ecosystem, Antarctica. Reports on Polar Research 299. KarlKamloth, Bremen, pp 40–46
Rückamp M, Braun M, Suckro S, Blindow N (2011) Observed glacialchanges on the King George Island ice cap, Antarctica, in the lastdecade. Global Planet Change 79:99–109
Sahade R, Tatián M, Kowalke J, Kuehne S, Esnal G (1998) Benthicfaunal associations on soft substrates at Potter Cove, King GeorgeIsland, Antarctica. Polar Biol 19(2):85–91
Schloss IR, Ferreyra GA (2002) Primary production, light and verticalmixing in Potter Cove, a shallow bay in the maritime Antarctic.Polar Biol 25(1):41–48
Schloss IR, Ferreyra GA, Ruiz-Pino D (2002) Phytoplankton biomass inAntarctic Shelf Zones: a conceptual model based on Potter Cove,King George Island. J Mar Syst 36:129–143
Schloss IR, Abele D, Moreau S, Demers S, Bers AV, González O,Ferreyra GA (2012) Response of phytoplankton dynamics to 19-year (1991-2009) climate trends in Potter Cove (Antarctica). J MarSyst 92(1):53–66
Schöne T, Pohl M, Zakrajsek A, Schenke H (1998) Tide gauge measure-ments, a contribution for the long term monitoring of sea level. In:Wiencke C, Ferreyra GA, Arntz W, Rinaldi C (eds) The Potter CoveCoastal Ecosystem, Antarctica. Reports on Polar Research 299. KarlKamloth, Bremen, pp 12–14
Simões JC, Bremer UF, Aquino FE, Ferron FE (1999) Morphology andvariations of glacial drainage basins in the King George Island icefield, Antarctica. Ann Glaciol 29:220–224
Sotheran IS, Foster-Smith RL, Davies J (1997) Mapping of marinebenthic habitats using image processing techniques within a rasterbased Geographic Information System. Estuar Coast Shelf Sci44(A):25–31
Soulsby R (1997) Dynamics of marine sands. Thomas TelfordPublications, London
Tanner WF (1969) The particle size scale. J Sediment Petrol 39:809–812Thompson DWJ, Solomon S (2002) Interpretation of recent southern
hemisphere climate change. Science 296:895–899. doi:10.1126/science.1069270
Varela L (1998) Hydrology of Matias and Potter Creeks. In: Wiencke C,Ferreyra GA, Arntz W, Rinaldi C (eds) The Potter Cove CoastalEcosystem, Antarctica. Reports on Polar Research 299. KarlKamloth, Bremen, pp 33–39
Vaughan DG, Marshall GJ, Connolley WM, King JC, Mulvaney R(2001) Devil in the detail. Science 293:1777–1779
Veit-Köhler G (1998) Meiofauna study in the Potter Cove. Sedimentsituation and resource availability for small crustaceans (Copepodaand Peracarida). In: Wiencke C, Ferreyra GA, Arntz W, Rinaldi C(eds) The Potter Cove Coastal Ecosystem, Antarctica. Reports onPolar Research 299. Karl Kamloth, Bremen, pp 132–136
Venables WN, Ripley BD (2002) Modern applied statistics with S, 4thedn. Springer, New York
Warwick RM, Uncles RJ (1980) Distribution of benthic macrofaunalassociations in the Bristol Channel in relation to tidal stress. MarEcol Prog Ser 3:97–103
Wentworth CK (1922) A scale of grade and class terms for clasticsediments. J Geol 30:377–392
Yoon HI, Han MW, Park BK, Han SJ, Oh JK (1992) Distribution,provenance, and dispersal pattern of clay minerals in surface sedi-ments, Bransfield Strait, Antarctica. Geo-Mar Lett 12(4):223–227.doi:10.1007/BF02091842
Geo-Mar Lett
Top Related
Copyright © 2022 FDOKUMEN

