


Bahasa
Halaman
Hukum

Diffuse hydrothermal methane output and evidence ofmethanotrophic activity within the soils at Sousaki (Greece)
W. D’ALESSANDRO1, L. BRUSCA1, K. KYRIAKOPOULOS2, M. MARTELLI1 , G. MICHAS2,
G. PAPADAKIS2 AND F. SALERNO1
1Istituto Nazionale di Geofisica e Vulcanologia – Sezione di Palermo, Palermo, Italy; 2Department of Geology and
Geoenvironment, National and Kapodistrian University of Athens, Panepistimioupolis, Ano Ilissia, Greece
ABSTRACT
Methane soil flux measurements have been made in 38 sites at the geothermal system of Sousaki (Greece) with
the closed chamber method. Fluxes range from )47.6 to 29 150 mg m)2 day)1, and the diffuse CH4 output of
the system has been estimated at 19 t a)1. Contemporaneous CO2 flux measurements showed a moderate posi-
tive correlation between CO2 and CH4 fluxes. Comparison of the CO2 ⁄ CH4 soil flux ratios with the CO2 ⁄ CH4
ratio of the gases of the main gas manifestations provided evidence for methanotrophic activity within the soil.
Laboratory CH4 consumption experiments confirmed the presence of methanotrophic microorganisms in soil sam-
ples collected at Sousaki. Consumption was generally in the range from )4.9 to )38.9 pmolCH4 h)1 g)1 but
could sometimes reach extremely high values ()33 000 pmolCH4 h)1 g)1). These results are consistent with
recent studies on other geothermal systems that revealed the existence of thermoacidophilic bacteria exerting
methanotrophic activity in hot, acid soils, thereby reducing methane emissions to the atmosphere.
Key words: accumulation chamber, hydrothermal systems, methane output, methanotrophic activity, soil
degassing, Sousaki
Received 4 August 2010; accepted 3 December 2010
Corresponding author: W. D’Alessandro, Istituto Nazionale di Geofisica e Vulcanologia – Sezione di Palermo, Via
U. La Malfa 153, 90146 Palermo, Italy.
Email [email protected]. Tel: +39 091 6809409.
Fax: +39 091 6809449.
Geofluids (2011) 11, 97–107
INTRODUCTION
With the current rise in global atmospheric concentrations
of CH4, an important ‘greenhouse gas’, much effort is
being spent in delineating CH4 sources and sinks. The
atmospheric concentration of CH4 has more than doubled
since the early 1800s reaching concentrations of about
1.8 lmol mol)1 at present (IPCC 2001). The global
growth rates, which showed a distinct decrease since the
1990s, reaching values close to zero in the period 1999–
2005, started again to increase in 2007–2008 (Dlugo-
kencky et al. 2003, 2009).
Methane is released to the atmosphere by a large num-
ber of sources, both natural and anthropogenic, with the
latter being twice as large as the former (Intergovernmen-
tal Panel on Climate Change 2001). While the largest nat-
ural sink for atmospheric CH4 is oxidation by OH, the
major biological sink is aerobic bacteria in nonsaturated
soils that use CH4 as an energy and carbon source. The
latter sink accounts for a significant flux in the global bud-
get of atmospheric CH4, which has been estimated at 20–
45 Tg a)1 (Intergovernmental Panel on Climate Change
2001; Dutaur & Verchot 2007). The soil consumption of
CH4 occurs via oxidation by several varieties of methano-
trophs (Hanson & Hanson 1996). Methane exchange rates
with the atmosphere have been linked empirically to a
diverse and often overlapping group of soil properties that
include water content, pore size distribution, organic mat-
ter quality, temperature and the presence of vascular root-
ing systems (Kruger et al. 2002). Methane exchange can
be viewed as resulting from the local balance of CH4 pro-
duction and consumption within the soil. Net CH4 fluxes
to the soil may be controlled by local CH4 consumption
by methanotrophic bacteria if the consumptive activity of
methanotrophs tracks or exceeds rates of CH4 production.
The importance of methanotrophic activity within the soils
Geofluids (2011) 11, 97–107 doi: 10.1111/j.1468-8123.2010.00322.x
� 2011 Blackwell Publishing Ltd
has sometimes been overlooked, because it is not only an
important sink of atmospheric CH4 but also limits emis-
sion to the atmosphere of the CH4 produced within the
soil or derived from deeper levels. Hutsch (2001) sug-
gested that if this sink were absent, the rate of atmospheric
increase would be 1.5 times greater.
Soils exposed to elevated CH4 concentrations can
develop a high capacity for CH4 oxidation, presumably by
selection of methanotrophic bacteria (Kightley et al.
1995). For example, large methanotrophic populations,
and high rates of CH4 oxidation, have been reported in
landfill cover soils exposed to high CH4 fluxes (Whalen
et al. 1990).
It has recently been established that geogenic gases con-
tribute significantly to the natural CH4 flux to the atmo-
sphere (Etiope et al. 2008). Volcanic ⁄ geothermal areas
contribute to this flux, being the site of widespread diffuse
degassing of endogenous gases (Chiodini et al. 2005). In
such an environment, soils are a source rather than a sink
for atmospheric CH4 (Cardellini et al. 2003; Castaldi &
Tedesco 2005; D’Alessandro et al. 2009a). Preliminary
studies (Etiope et al. 2007) estimated a total CH4 emission
from European geothermal and volcanic systems in the
range 4–16 kt a)1. This estimate was obtained indirectly
from CO2 or H2O output data and from CO2 ⁄ CH4 or
H2O ⁄ CH4 values measured in the main gaseous manifesta-
tions. Such methods, although acceptable to obtain
order-of-magnitude estimates, completely disregard possi-
ble methanotrophic activity within the soil. Until recently,
soils in volcanic ⁄ geothermal areas have been considered to
be an environment with no methanotrophic activity.
Indeed, ‘normal’ methanotrophs cannot survive the high
temperatures and sulphur gas concentrations, low pH and
anoxic conditions that characterize these soils (Bender &
Conrad 1995). Notwithstanding such harsh conditions, it
has been demonstrated that methanotrophic consumption
in soils occurs (Castaldi & Tedesco 2005) and extremely
acidophilic and thermophilic methanotrophic bacteria of the
phylum Verrucomicrobia have been isolated at Campi Fle-
grei, Italy (Pol et al. 2007), at Hell’s Gate, New Zealand
(Dunfield et al. 2007) and in Kamchatka, Russia (Islam
et al. 2008). Further, a recent study at the volcanic ⁄ geo-
thermal system of Pantelleria, Italy (D’Alessandro et al.
2009a) found evidence that CH4 consumption by methano-
trophic microorganisms within the soil can decrease the
estimated CH4 output by about one order of magnitude.
Greece with its widespread geothermal manifestations
(Fytikas et al. 1995) is one of the three European coun-
tries that most contribute to the release of geothermal
CH4 (Etiope et al. 2007). Previous studies determined a
CO2 gas output from the Sousaki geothermal system of
about 20 000 t a)1 almost exclusively from diffuse soil
emission (D’Alessandro et al. 2006). The same authors
made also a preliminary estimate of the CH4 output by
cross-correlating the measured CO2 soil fluxes with the
CH4 ⁄ CO2 mass ratio measured in the soil gases at 50 cm
depth, obtaining a value of approximately 36 t a)1. With
the aim of defining such estimates more precisely in the
light of possible methanotrophic activity, we present here
the results of two CH4 flux measurement campaigns made
in October 2008 and in June 2009 with a total of 38 mea-
surement sites. During the June 2009 campaign, soil sam-
ples were also collected at nine sites. These samples were
used for laboratory incubation experiments to highlight
and measure possible methanotrophic activity.
STUDY AREA AND METHODS
The Sousaki geothermal system
The Sousaki area (Fig. 1) is located about 65 km west of
Athens, near the Isthmus of Corinth, and is considered the
NW end of the active south Aegean volcanic arc. Here,
sparse outcrops of dacitic rocks are the remnants of
late-Pliocene to Quaternary volcanic activity (4.0–2.3 Ma –
Pe-Piper & Hatzipanagiotou 1997). Both the vent distri-
bution and the shape of the edifices are controlled by the
E–W and the NW–SE extensional tectonic lineaments of
the area, which have been present since the Pliocene and
continue to be active up to the present (Francalanci et al.
2005). In addition to volcanic rocks, the following forma-
tions crop out in the area (IGME 1985):
(1) Quaternary sediments consisting of unconsolidated
material with sand, rounded and angular pebbles in
the torrent beds, loose sandy – clayey material and
alluvial sediments;
(2) Neogene sediments composed of marly conglomerates
and marly sandstones;
(3) postupper Cretaceous ophiolithic nappe consisting of
slightly serpentinized peridotites, serpentinites and
bodies of basic composition; and
(4) upper Triassic–lower Cretaceous limestones.
Exploration drilling defined a low-enthalpy geothermal
field, revealing two permeable formations at shallow depth
(<200 m) and one at deeper levels (500–1100 m). All geo-
thermal waters are of Na-Cl type and display temperatures
in the range of 50–80�C and salinities in the range of 39–
49 g l)1 (Fytikas et al. 1995).
Extensive argillification-silicification of the rocks charac-
terizes an area of about 100 · 300 m called Theochoma.
The most affected rocks are those of the ophiolitic
sequence and, secondarily, the marly Neogene sediments.
Surface emanations and widespread diffuse degassing affect
a smaller area estimated at approximately 50 · 200 m
(D’Alessandro et al. 2006).
The main gas vents are found at the bottom of two
caves on the flank of a hill. The caves, informally called
‘big’ and ‘small’, have the following dimensions (height ·
98 W. D’ALESSANDRO et al.
� 2011 Blackwell Publishing Ltd, Geofluids, 11, 97–107

width · depth): 8 · 3 · 10 m and 4 · 1.5 · 4 m, respec-
tively. Measured cave air temperatures range from 37 to
44�C (D’Alessandro et al. 2006). The emanating gases,
being denser than atmospheric air, flow on the floors of
the caves and eventually spill out from their mouths, dis-
persing in the atmosphere after descending the flanks of
the hill. This phenomenon can be seen when atmospheric
temperature is very low and the water vapour contained in
the geothermal gases condenses, creating a thin fog layer
at the contact between the cold atmospheric air and the
warm geothermal gases.
Less defined gas vents are also found along the nearby
ravine extending along the most altered area. D’Alessandro
et al. (2006) identified, outside the main diffuse degassing
area, two minor degassing anomalies. The first is about
200 m south of the main gas manifestations and is proba-
bly due to a leaking exploratory well. Signs of hydrother-
mal alteration can be seen only on the corroded well
casing. The second anomaly is about 800 m WSW of the
main gas manifestations and is characterized by rock alter-
ation over an area of about 2000 m2.
Sampling and analytical methods
Sampling sites for CH4 flux measurements were selected
on the basis of previous CO2 flux measurement campaigns
(D’Alessandro et al. 2006). Most of the 38 CH4 flux mea-
surements were made within the CO2 anomalous degassing
area of about 0.015 km2. One CH4 flux measurement site
was established well outside the main degassing area, in an
abandoned olive grove, to obtain insight on background
CH4 fluxes in the area (SOU38 – Fig. 1).
Almost all sampling sites had no vegetation cover, prob-
ably because of the environmental conditions within the
soil (high CO2 flux, low nutrient content, etc.). Only the
background site (SOU38) and the four sites around
the exploratory well (SOU21–SOU24) had a partial low
grass cover.
Measurements were made with the accumulation cham-
ber method (Livingston & Hutchinson 1995 Baciu et al.
2008; D’Alessandro et al. 2009a). The flux chamber has a
cross-sectional area of 0.07 m2 and height of 10 cm. The
chamber top has two fixed capillary tubes, one used to col-
lect chamber gas samples and the other used to balance
the pressure between inside and outside. Three gas samples
were drawn from the headspace in the chamber at fixed
intervals after deployment (5, 10 and 15 min). The 20 ml
samples are collected using a syringe and injected through
a three-way valve and a needle into a 10-ml pre-evacuated
sampling vial (Exetainer�; Labco Ltd.). The overpressured
vials were sent to the laboratory for CH4 and CO2
analysis.
The flux of CO2 and CH4 from the soil can be calcu-
lated as the rate of concentration increases in the chamber:
U ¼ dC
dt� V
Að1Þ
where F is the flux of a gas, V is the volume of air in
the chamber (m3), A is the area covered by the chamber
(m2), C is the chamber concentration of a gas and dC ⁄ dt
(D)
100 m
200 m(C)
200 km
N
Nisyros
Santorini
Saronic Gulf
Canal
Peloponnese
Highway
Study area
Attika
Corinth
Loutraki
A.Theodori
MethanaSousaki
Milos
Greece
(A)
(B)
5 km
SOU38
SOU18 SOU37
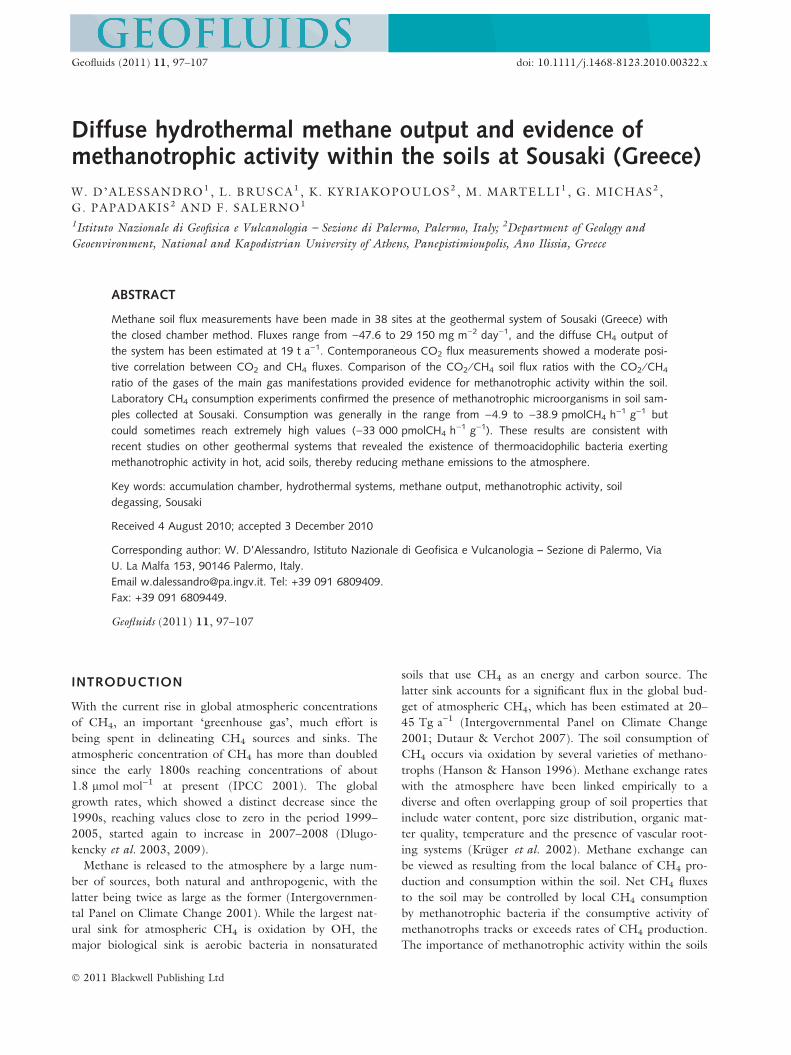
Fig. 1. (A) Location of the Sousaki geothermal system with respect to the south Aegean volcanic arc (volcanoes with historical activity are marked with a tri-
angle); (B) area of the Isthmus of Corinth; (C) study area with CH4 flux measurements points and main gas manifestations (stars). Symbols as follows: cir-
cles = sampling campaign of October 2008; squares = sampling campaign of June 2009; white symbols = extremely negative fluxes <)10 mg m)2 day)1;
pale grey symbols = negative values )10 to 0 mg m)2 day)1; dark grey symbols = 0–1000 mg m)2 day)1; black symbols ‡ 1000 mg m)2 day)1;
star = exploratory well; (D) enlargement of the high flux area; stars = caves.
Diffuse hydrothermal methane output at Sousaki (Greece) 99
� 2011 Blackwell Publishing Ltd, Geofluids, 11, 97–107
is the rate of concentration change in the chamber air for
each gas. Volumetric concentrations are converted to
mass concentrations accounting for atmospheric pressure
and temperature. Flux values are expressed as g m)2 day)1
for CO2 and as mg m)2 day)1 for CH4. Positive values
indicate fluxes directed from the soil to the atmosphere,
and negative values indicate flow from the atmosphere
into the soil.
Ground temperature measurements were taken at 10
and 50 cm depth using thermal probes and a digital ther-
mometer. Samples of soil gas were collected at each site at
a depth of 50 cm through a Teflon tube of 5 mm ID
using a syringe. At ten sites, soil gases were collected
through a special sampling device with three 2 mm ID
tubes tapping soil gases at 13, 25 and 50 cm depth. Soil
gas samples were collected and stored for subsequent labo-
ratory analyses in the same way as gases from the flux
chamber. Samples of the gas manifestations were collected
in Pyrex bottles with two vacuum stopcocks and analysed
in the laboratory for He, H2, O2, N2, CH4 and CO2.
Gas concentrations were measured using the GC Perkin
Elmer Clarus 500 equipped with Carboxen 1000 columns,
hot wire and flame ionization detectors with methanizer.
The gas samples were injected through an automated injec-
tion valve with a 1000 ll loop. Calibration was made with
certified gas mixtures. Analytical precision (±1r) was
always better than ±5%. The detection limit for CH4 was
about 0.1 lmol mol)1. Hydrogen sulphide in the samples
from the gas manifestations was semiquantitatively deter-
mined in the field with Drager tubes.
After collection of gas samples for CH4 flux determi-
nation, soil samples for CH4 consumption experiments
were collected at 9 of the sites in June 2009. Samples
collected at 15 cm depth were stored in commercially
available sterilized PP bottles. Air drying of the soil sam-
ples did not produce significant weight loss. Soil samples
were dry because no significant rainfall was registered in
the previous 2 months. The gases released by the gas
manifestations of the area were also nearly dry. Water
vapour upflow from the hydrothermal system, if any, will
condense deep within the soil, with no significant contri-
bution to the sampled soil layers, as confirmed by the
temperature measurements in the soil (Table 3). Never-
theless, values of CH4 consumption were referred to the
dry weight calculated from separate oven-dried aliquots.
In the laboratory the soils were sieved to 2 mm mesh
and pH was determined in a 1:2.5 w ⁄ w soil ⁄ water sus-
pension. To determine CH4 consumption, soil samples
(15 g) were incubated in 160-ml glass jars closed with
neoprene rubber stoppers, with CH4-enriched atmo-
spheric air (about 10 lmol mol)1 CH4) at nearly con-
stant ambient temperature (22–25�C). Gas samples,
withdrawn immediately after closure and 24, 48 and
72 h after closure, were analysed as previously described.
All analyses were performed in duplicate. One of the
samples did not show any detectable CH4 after 24 h;
consequently, the experiment was repeated, withdrawing
the gas sample 2, 4, 6 and 8 h after closure, on this soil
sample only.
To test that CH4 oxidation was because of biological
activity, consumption rates were also measured on steril-
ized soil samples. For this purpose, soil samples in closed
jars were held overnight in an oven at 110�C. The experi-
ments were performed on nine soil samples, and starting
CH4 concentrations were about 10 lmol mol)1 CH4.
Obtained values were expressed in pmolCH4 h)1 g)1 of
soil (dry weight), where a negative sign indicated CH4
consumption.
RESULTS
Geochemistry of the gas samples
For this study, two samples from the big cave and six sam-
ples from the exploratory well were collected and analysed.
Results are shown in Table 1 together with some previous
analyses from D’Alessandro et al. (2006). Carbon dioxide
is the dominant species displaying values from 926 000 to
991 000 lmol mol)1. Concentrations of atmospheric gases
were generally low (O2 < 4400 lmol mol)1; N2 < 59 700
lmol mol)1). Hydrothermal species show variable content:
CH4 33–10 800 lmol mol)1; H2S <100–5000 lmol -
mol)1; H2 (only in the well samples) <5–94 lmol mol)1.
Helium concentrations range from 0.9 to 42 lmol mol)1.
The gases collected at the exploratory well, which are rep-
resentative of the deeper geothermal aquifer, display some
significant differences with respect to the other samples,
which are representative of the shallower hydrothermal lev-
els. Gases whose solubility in water is lower (He, CH4,
N2) are always enriched in the latter samples, whereas
more soluble gases (CO2, H2S) are depleted. However,
methane enrichment in the cave samples cannot be exclu-
sively attributed to solubility-dependent chemical fraction-
ation, but rather provides evidence for an additional source
which is probably ascribable to the shallower hydrothermal
system.
Enriched 13C and 2H isotopic values of CH4 in the big
cave gas sample ()20.5& and )98&, respectively – J. Fie-
big, University Frankfurt a.M., Germany, written commu-
nication, July 2009) point to a possible abiogenic origin of
this gas (Fiebig et al. 2009). This hypothesis is also sup-
ported by the very high C1 ⁄ (C2 + C3) ratio in these gases
(9070 – J. Fiebig written communication). The low tem-
perature of the hydrothermal system at Sousaki would gen-
erally not allow the formation of abiogenic CH4, but the
presence of ophiolithic rocks rich in metals (Ni, Cr)
that act as catalysts could favour its formation (Horita &
Berndt 1999).
100 W. D’ALESSANDRO et al.
� 2011 Blackwell Publishing Ltd, Geofluids, 11, 97–107
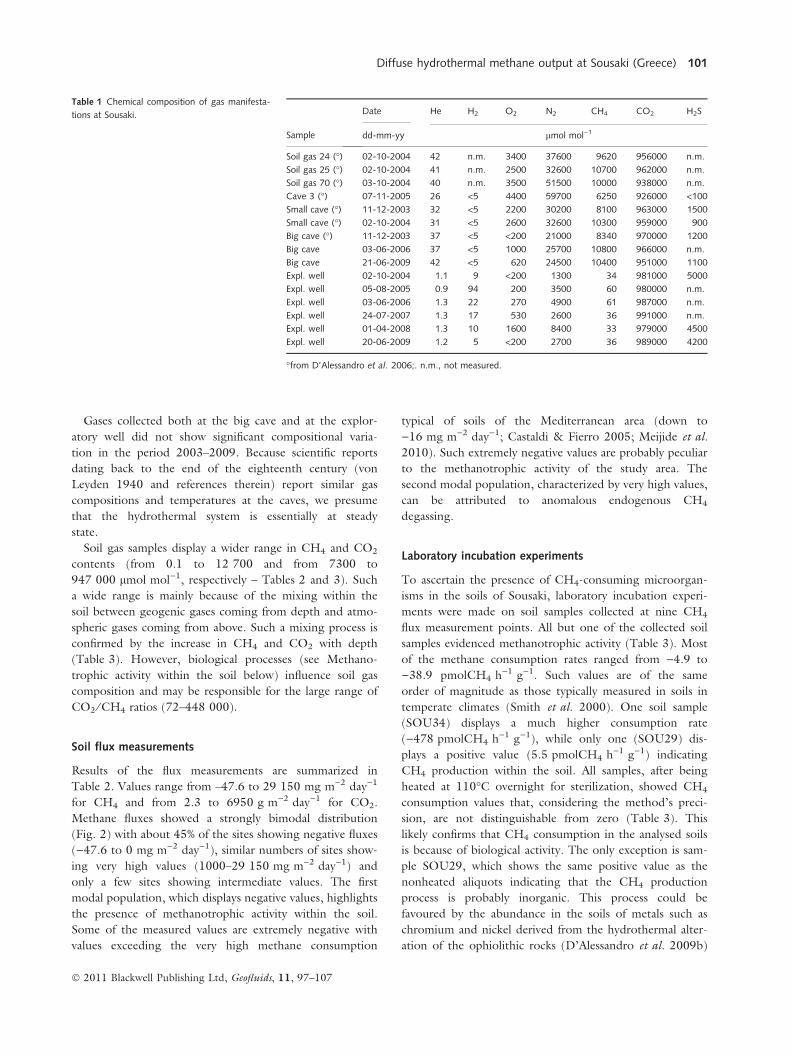
Gases collected both at the big cave and at the explor-
atory well did not show significant compositional varia-
tion in the period 2003–2009. Because scientific reports
dating back to the end of the eighteenth century (von
Leyden 1940 and references therein) report similar gas
compositions and temperatures at the caves, we presume
that the hydrothermal system is essentially at steady
state.
Soil gas samples display a wider range in CH4 and CO2
contents (from 0.1 to 12 700 and from 7300 to
947 000 lmol mol)1, respectively – Tables 2 and 3). Such
a wide range is mainly because of the mixing within the
soil between geogenic gases coming from depth and atmo-
spheric gases coming from above. Such a mixing process is
confirmed by the increase in CH4 and CO2 with depth
(Table 3). However, biological processes (see Methano-
trophic activity within the soil below) influence soil gas
composition and may be responsible for the large range of
CO2 ⁄ CH4 ratios (72–448 000).
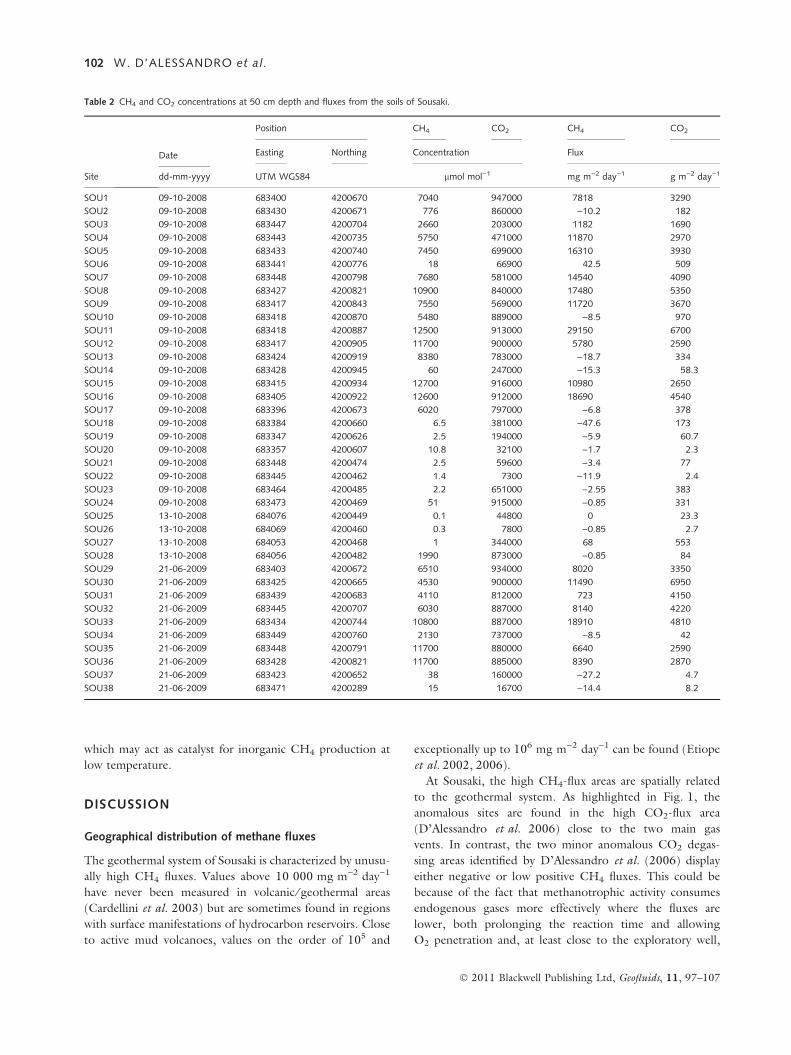
Soil flux measurements
Results of the flux measurements are summarized in
Table 2. Values range from –47.6 to 29 150 mg m)2 day)1
for CH4 and from 2.3 to 6950 g m)2 day)1 for CO2.
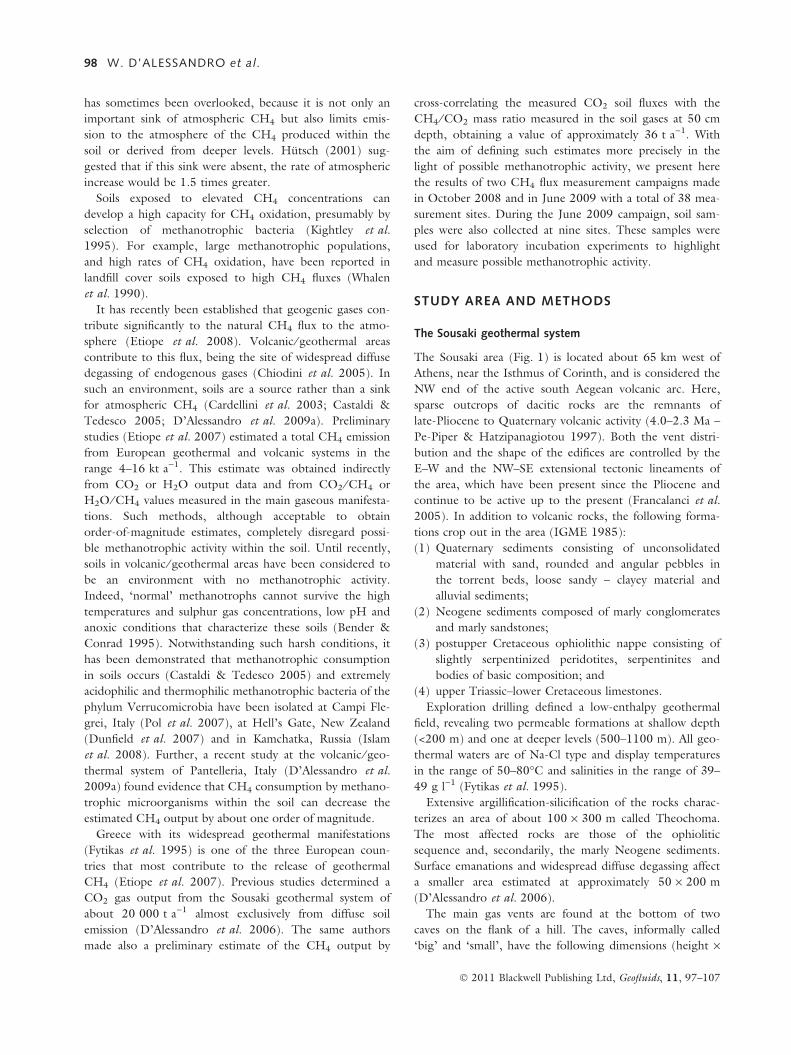
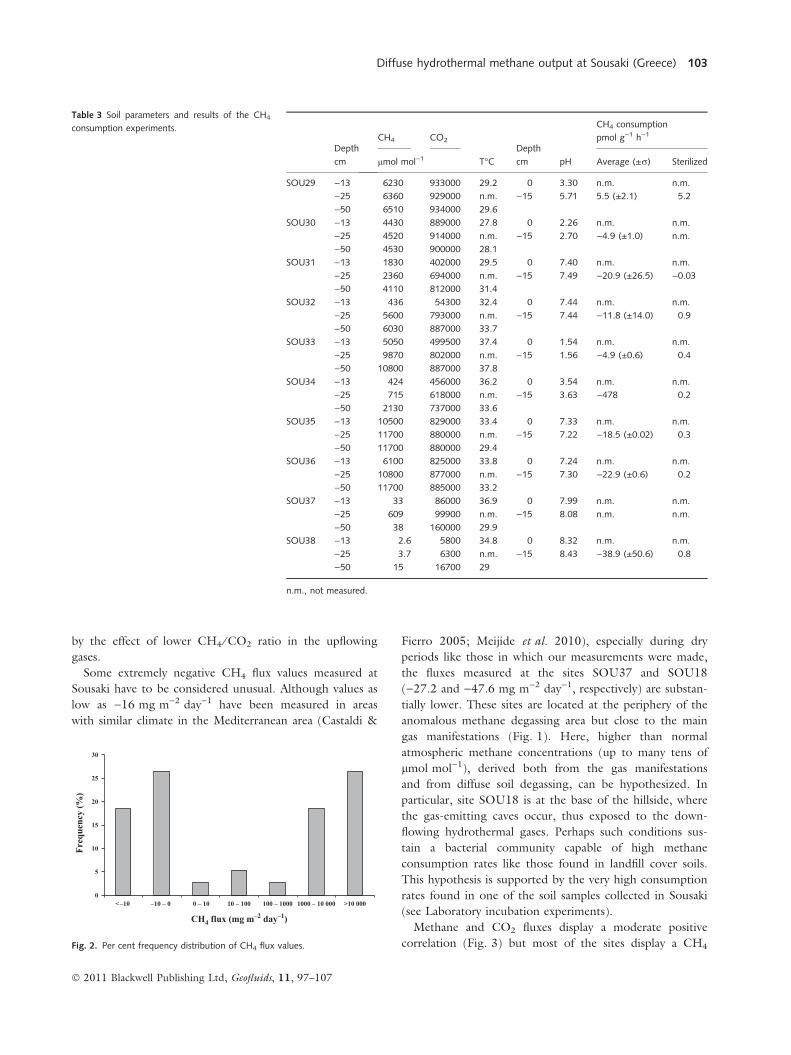
Methane fluxes showed a strongly bimodal distribution
(Fig. 2) with about 45% of the sites showing negative fluxes
()47.6 to 0 mg m)2 day)1), similar numbers of sites show-
ing very high values (1000–29 150 mg m)2 day)1) and
only a few sites showing intermediate values. The first
modal population, which displays negative values, highlights
the presence of methanotrophic activity within the soil.
Some of the measured values are extremely negative with
values exceeding the very high methane consumption
typical of soils of the Mediterranean area (down to
)16 mg m)2 day)1; Castaldi & Fierro 2005; Meijide et al.
2010). Such extremely negative values are probably peculiar
to the methanotrophic activity of the study area. The
second modal population, characterized by very high values,
can be attributed to anomalous endogenous CH4
degassing.
Laboratory incubation experiments
To ascertain the presence of CH4-consuming microorgan-
isms in the soils of Sousaki, laboratory incubation experi-
ments were made on soil samples collected at nine CH4
flux measurement points. All but one of the collected soil
samples evidenced methanotrophic activity (Table 3). Most
of the methane consumption rates ranged from )4.9 to
)38.9 pmolCH4 h)1 g)1. Such values are of the same
order of magnitude as those typically measured in soils in
temperate climates (Smith et al. 2000). One soil sample
(SOU34) displays a much higher consumption rate
()478 pmolCH4 h)1 g)1), while only one (SOU29) dis-
plays a positive value (5.5 pmolCH4 h)1 g)1) indicating
CH4 production within the soil. All samples, after being
heated at 110�C overnight for sterilization, showed CH4
consumption values that, considering the method’s preci-
sion, are not distinguishable from zero (Table 3). This
likely confirms that CH4 consumption in the analysed soils
is because of biological activity. The only exception is sam-
ple SOU29, which shows the same positive value as the
nonheated aliquots indicating that the CH4 production
process is probably inorganic. This process could be
favoured by the abundance in the soils of metals such as
chromium and nickel derived from the hydrothermal alter-
ation of the ophiolithic rocks (D’Alessandro et al. 2009b)
Table 1 Chemical composition of gas manifesta-
tions at Sousaki.
Sample
Date He H2 O2 N2 CH4 CO2 H2S
dd-mm-yy lmol mol)1
Soil gas 24 (�) 02-10-2004 42 n.m. 3400 37600 9620 956000 n.m.
Soil gas 25 (�) 02-10-2004 41 n.m. 2500 32600 10700 962000 n.m.
Soil gas 70 (�) 03-10-2004 40 n.m. 3500 51500 10000 938000 n.m.
Cave 3 (�) 07-11-2005 26 <5 4400 59700 6250 926000 <100
Small cave (�) 11-12-2003 32 <5 2200 30200 8100 963000 1500
Small cave (�) 02-10-2004 31 <5 2600 32600 10300 959000 900
Big cave (�) 11-12-2003 37 <5 <200 21000 8340 970000 1200
Big cave 03-06-2006 37 <5 1000 25700 10800 966000 n.m.
Big cave 21-06-2009 42 <5 620 24500 10400 951000 1100
Expl. well 02-10-2004 1.1 9 <200 1300 34 981000 5000
Expl. well 05-08-2005 0.9 94 200 3500 60 980000 n.m.
Expl. well 03-06-2006 1.3 22 270 4900 61 987000 n.m.
Expl. well 24-07-2007 1.3 17 530 2600 36 991000 n.m.
Expl. well 01-04-2008 1.3 10 1600 8400 33 979000 4500
Expl. well 20-06-2009 1.2 5 <200 2700 36 989000 4200
�from D’Alessandro et al. 2006;. n.m., not measured.
Diffuse hydrothermal methane output at Sousaki (Greece) 101
� 2011 Blackwell Publishing Ltd, Geofluids, 11, 97–107
which may act as catalyst for inorganic CH4 production at
low temperature.
DISCUSSION
Geographical distribution of methane fluxes
The geothermal system of Sousaki is characterized by unusu-
ally high CH4 fluxes. Values above 10 000 mg m)2 day)1
have never been measured in volcanic ⁄ geothermal areas
(Cardellini et al. 2003) but are sometimes found in regions
with surface manifestations of hydrocarbon reservoirs. Close
to active mud volcanoes, values on the order of 105 and
exceptionally up to 106 mg m)2 day)1 can be found (Etiope
et al. 2002, 2006).
At Sousaki, the high CH4-flux areas are spatially related
to the geothermal system. As highlighted in Fig. 1, the
anomalous sites are found in the high CO2-flux area
(D’Alessandro et al. 2006) close to the two main gas
vents. In contrast, the two minor anomalous CO2 degas-
sing areas identified by D’Alessandro et al. (2006) display
either negative or low positive CH4 fluxes. This could be
because of the fact that methanotrophic activity consumes
endogenous gases more effectively where the fluxes are
lower, both prolonging the reaction time and allowing
O2 penetration and, at least close to the exploratory well,
Table 2 CH4 and CO2 concentrations at 50 cm depth and fluxes from the soils of Sousaki.
Site
Date
Position CH4 CO2 CH4 CO2
Easting Northing Concentration Flux
dd-mm-yyyy UTM WGS84 lmol mol)1 mg m)2 day)1 g m)2 day)1
SOU1 09-10-2008 683400 4200670 7040 947000 7818 3290
SOU2 09-10-2008 683430 4200671 776 860000 )10.2 182
SOU3 09-10-2008 683447 4200704 2660 203000 1182 1690
SOU4 09-10-2008 683443 4200735 5750 471000 11870 2970
SOU5 09-10-2008 683433 4200740 7450 699000 16310 3930
SOU6 09-10-2008 683441 4200776 18 66900 42.5 509
SOU7 09-10-2008 683448 4200798 7680 581000 14540 4090
SOU8 09-10-2008 683427 4200821 10900 840000 17480 5350
SOU9 09-10-2008 683417 4200843 7550 569000 11720 3670
SOU10 09-10-2008 683418 4200870 5480 889000 )8.5 970
SOU11 09-10-2008 683418 4200887 12500 913000 29150 6700
SOU12 09-10-2008 683417 4200905 11700 900000 5780 2590
SOU13 09-10-2008 683424 4200919 8380 783000 )18.7 334
SOU14 09-10-2008 683428 4200945 60 247000 )15.3 58.3
SOU15 09-10-2008 683415 4200934 12700 916000 10980 2650
SOU16 09-10-2008 683405 4200922 12600 912000 18690 4540
SOU17 09-10-2008 683396 4200673 6020 797000 )6.8 378
SOU18 09-10-2008 683384 4200660 6.5 381000 )47.6 173
SOU19 09-10-2008 683347 4200626 2.5 194000 )5.9 60.7
SOU20 09-10-2008 683357 4200607 10.8 32100 )1.7 2.3
SOU21 09-10-2008 683448 4200474 2.5 59600 )3.4 77
SOU22 09-10-2008 683445 4200462 1.4 7300 )11.9 2.4
SOU23 09-10-2008 683464 4200485 2.2 651000 )2.55 383
SOU24 09-10-2008 683473 4200469 51 915000 )0.85 331
SOU25 13-10-2008 684076 4200449 0.1 44800 0 23.3
SOU26 13-10-2008 684069 4200460 0.3 7800 )0.85 2.7
SOU27 13-10-2008 684053 4200468 1 344000 68 553
SOU28 13-10-2008 684056 4200482 1990 873000 )0.85 84
SOU29 21-06-2009 683403 4200672 6510 934000 8020 3350
SOU30 21-06-2009 683425 4200665 4530 900000 11490 6950
SOU31 21-06-2009 683439 4200683 4110 812000 723 4150
SOU32 21-06-2009 683445 4200707 6030 887000 8140 4220
SOU33 21-06-2009 683434 4200744 10800 887000 18910 4810
SOU34 21-06-2009 683449 4200760 2130 737000 )8.5 42
SOU35 21-06-2009 683448 4200791 11700 880000 6640 2590
SOU36 21-06-2009 683428 4200821 11700 885000 8390 2870
SOU37 21-06-2009 683423 4200652 38 160000 )27.2 4.7
SOU38 21-06-2009 683471 4200289 15 16700 )14.4 8.2
102 W. D’ALESSANDRO et al.
� 2011 Blackwell Publishing Ltd, Geofluids, 11, 97–107
by the effect of lower CH4 ⁄ CO2 ratio in the upflowing
gases.
Some extremely negative CH4 flux values measured at
Sousaki have to be considered unusual. Although values as
low as )16 mg m)2 day)1 have been measured in areas
with similar climate in the Mediterranean area (Castaldi &
Fierro 2005; Meijide et al. 2010), especially during dry
periods like those in which our measurements were made,
the fluxes measured at the sites SOU37 and SOU18
()27.2 and )47.6 mg m)2 day)1, respectively) are substan-
tially lower. These sites are located at the periphery of the
anomalous methane degassing area but close to the main
gas manifestations (Fig. 1). Here, higher than normal
atmospheric methane concentrations (up to many tens of
lmol mol)1), derived both from the gas manifestations
and from diffuse soil degassing, can be hypothesized. In
particular, site SOU18 is at the base of the hillside, where
the gas-emitting caves occur, thus exposed to the down-
flowing hydrothermal gases. Perhaps such conditions sus-
tain a bacterial community capable of high methane
consumption rates like those found in landfill cover soils.
This hypothesis is supported by the very high consumption
rates found in one of the soil samples collected in Sousaki
(see Laboratory incubation experiments).
Methane and CO2 fluxes display a moderate positive
correlation (Fig. 3) but most of the sites display a CH4
0
5
10
15
20
25
30
<–10 –10 – 0 0 – 10 10 – 100 100 – 1000 1000 – 10 000 >10 000
CH4 flux (mg m–2 day–1)
Freq
uenc
y (%
)
Fig. 2. Per cent frequency distribution of CH4 flux values.
Table 3 Soil parameters and results of the CH4
consumption experiments.
Depth
cm
CH4 CO2
T�CDepth
cm pH
CH4 consumption
pmol g)1 h)1
lmol mol)1 Average (±r) Sterilized
SOU29 )13 6230 933000 29.2 0 3.30 n.m. n.m.
)25 6360 929000 n.m. )15 5.71 5.5 (±2.1) 5.2
)50 6510 934000 29.6
SOU30 )13 4430 889000 27.8 0 2.26 n.m. n.m.
)25 4520 914000 n.m. )15 2.70 )4.9 (±1.0) n.m.
)50 4530 900000 28.1
SOU31 )13 1830 402000 29.5 0 7.40 n.m. n.m.
)25 2360 694000 n.m. )15 7.49 )20.9 (±26.5) )0.03
)50 4110 812000 31.4
SOU32 )13 436 54300 32.4 0 7.44 n.m. n.m.
)25 5600 793000 n.m. )15 7.44 )11.8 (±14.0) 0.9
)50 6030 887000 33.7
SOU33 )13 5050 499500 37.4 0 1.54 n.m. n.m.
)25 9870 802000 n.m. )15 1.56 )4.9 (±0.6) 0.4
)50 10800 887000 37.8
SOU34 )13 424 456000 36.2 0 3.54 n.m. n.m.
)25 715 618000 n.m. )15 3.63 )478 0.2
)50 2130 737000 33.6
SOU35 )13 10500 829000 33.4 0 7.33 n.m. n.m.
)25 11700 880000 n.m. )15 7.22 )18.5 (±0.02) 0.3
)50 11700 880000 29.4
SOU36 )13 6100 825000 33.8 0 7.24 n.m. n.m.
)25 10800 877000 n.m. )15 7.30 )22.9 (±0.6) 0.2
)50 11700 885000 33.2
SOU37 )13 33 86000 36.9 0 7.99 n.m. n.m.
)25 609 99900 n.m. )15 8.08 n.m. n.m.
)50 38 160000 29.9
SOU38 )13 2.6 5800 34.8 0 8.32 n.m. n.m.
)25 3.7 6300 n.m. )15 8.43 )38.9 (±50.6) 0.8
)50 15 16700 29
n.m., not measured.
Diffuse hydrothermal methane output at Sousaki (Greece) 103
� 2011 Blackwell Publishing Ltd, Geofluids, 11, 97–107
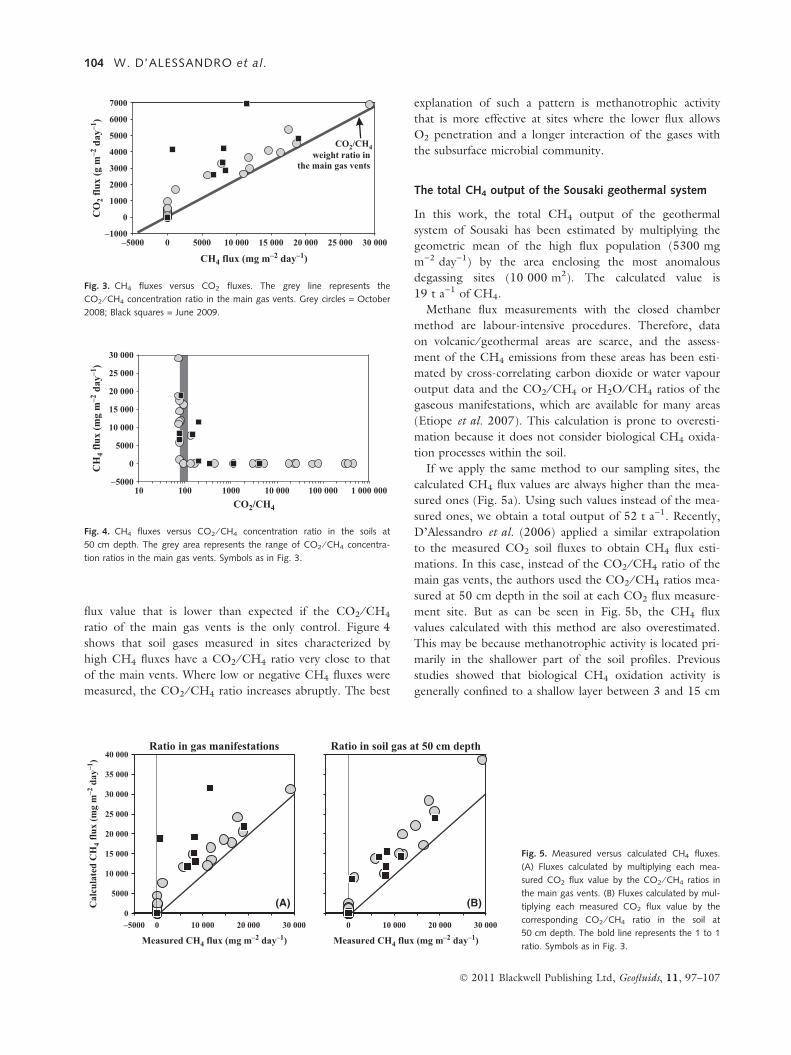
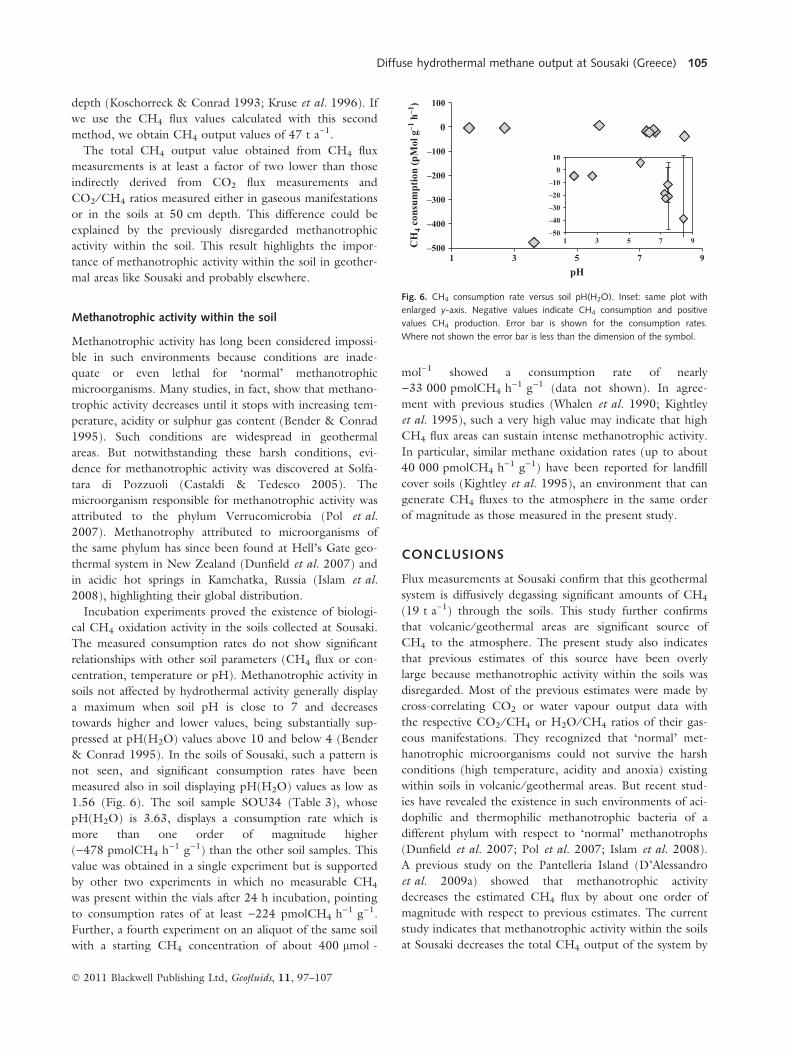
flux value that is lower than expected if the CO2 ⁄ CH4
ratio of the main gas vents is the only control. Figure 4
shows that soil gases measured in sites characterized by
high CH4 fluxes have a CO2 ⁄ CH4 ratio very close to that
of the main vents. Where low or negative CH4 fluxes were
measured, the CO2 ⁄ CH4 ratio increases abruptly. The best
explanation of such a pattern is methanotrophic activity
that is more effective at sites where the lower flux allows
O2 penetration and a longer interaction of the gases with
the subsurface microbial community.
The total CH4 output of the Sousaki geothermal system
In this work, the total CH4 output of the geothermal
system of Sousaki has been estimated by multiplying the
geometric mean of the high flux population (5300 mg
m)2 day)1) by the area enclosing the most anomalous
degassing sites (10 000 m2). The calculated value is
19 t a)1 of CH4.
Methane flux measurements with the closed chamber
method are labour-intensive procedures. Therefore, data
on volcanic ⁄ geothermal areas are scarce, and the assess-
ment of the CH4 emissions from these areas has been esti-
mated by cross-correlating carbon dioxide or water vapour
output data and the CO2 ⁄ CH4 or H2O ⁄ CH4 ratios of the
gaseous manifestations, which are available for many areas
(Etiope et al. 2007). This calculation is prone to overesti-
mation because it does not consider biological CH4 oxida-
tion processes within the soil.
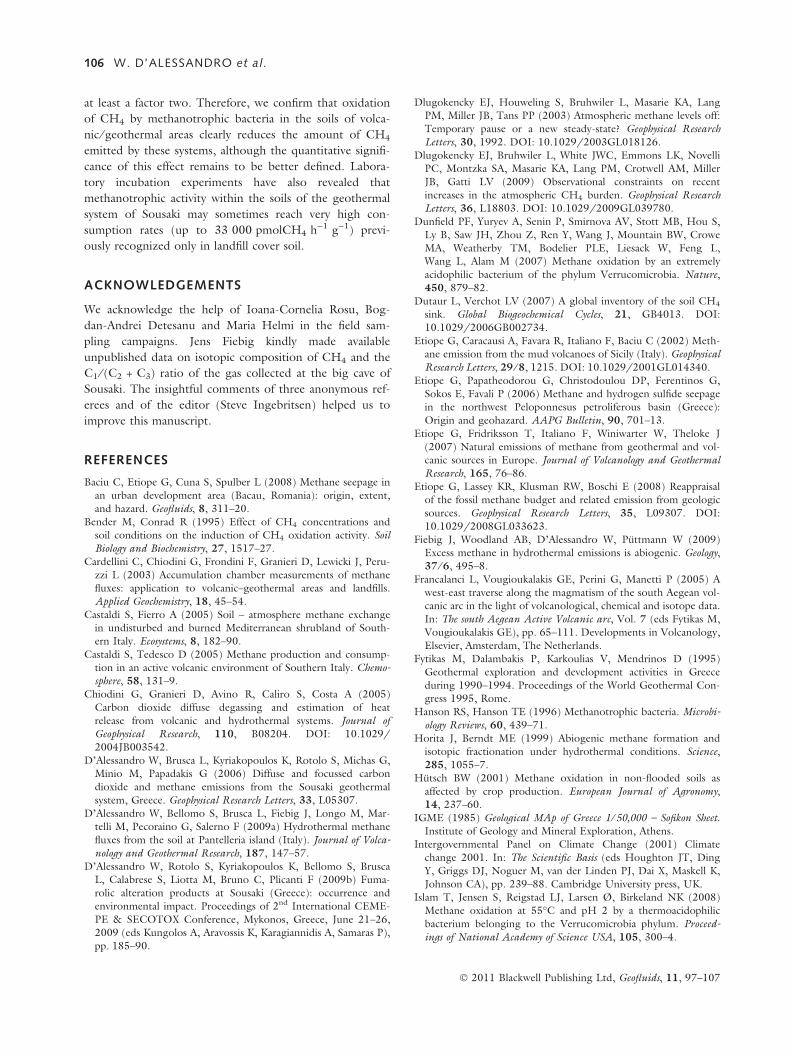
If we apply the same method to our sampling sites, the
calculated CH4 flux values are always higher than the mea-
sured ones (Fig. 5a). Using such values instead of the mea-
sured ones, we obtain a total output of 52 t a)1. Recently,
D’Alessandro et al. (2006) applied a similar extrapolation
to the measured CO2 soil fluxes to obtain CH4 flux esti-
mations. In this case, instead of the CO2 ⁄ CH4 ratio of the
main gas vents, the authors used the CO2 ⁄ CH4 ratios mea-
sured at 50 cm depth in the soil at each CO2 flux measure-
ment site. But as can be seen in Fig. 5b, the CH4 flux
values calculated with this method are also overestimated.
This may be because methanotrophic activity is located pri-
marily in the shallower part of the soil profiles. Previous
studies showed that biological CH4 oxidation activity is
generally confined to a shallow layer between 3 and 15 cm
–1000
0
1000
2000
3000
4000
5000
6000
7000
–5000 0 5000 10 000 15 000 20 000 25 000 30 000
CO2/CH4weight ratio in
the main gas vents
CH4 flux (mg m–2 day–1)
CO
2 flu
x (g
m–2
day
–1)
Fig. 3. CH4 fluxes versus CO2 fluxes. The grey line represents the
CO2 ⁄ CH4 concentration ratio in the main gas vents. Grey circles = October
2008; Black squares = June 2009.
–5000
0
5000
10 000
15 000
20 000
25 000
30 000
10 100 1000 10 000 100 000 1 000 000CO2/CH4
CH
4 flu
x (m
g m
–2 d
ay–1
)
Fig. 4. CH4 fluxes versus CO2 ⁄ CH4 concentration ratio in the soils at
50 cm depth. The grey area represents the range of CO2 ⁄ CH4 concentra-
tion ratios in the main gas vents. Symbols as in Fig. 3.
0
5000
10 000
15 000
20 000
25 000
30 000
35 000
40 000Ratio in gas manifestations
0 10 000 20 000 30 000
(A) (B)
0 10 000 20 000 30 000–5000
Measured CH4 flux (mg m–2 day–1)
Cal
cula
ted
CH
4 flu
x (m
g m
–2 d
ay–1
)
Measured CH4 flux (mg m–2 day–1)
Ratio in soil gas at 50 cm depth
Fig. 5. Measured versus calculated CH4 fluxes.
(A) Fluxes calculated by multiplying each mea-
sured CO2 flux value by the CO2 ⁄ CH4 ratios in
the main gas vents. (B) Fluxes calculated by mul-
tiplying each measured CO2 flux value by the
corresponding CO2 ⁄ CH4 ratio in the soil at
50 cm depth. The bold line represents the 1 to 1
ratio. Symbols as in Fig. 3.
104 W. D’ALESSANDRO et al.
� 2011 Blackwell Publishing Ltd, Geofluids, 11, 97–107
depth (Koschorreck & Conrad 1993; Kruse et al. 1996). If
we use the CH4 flux values calculated with this second
method, we obtain CH4 output values of 47 t a)1.
The total CH4 output value obtained from CH4 flux
measurements is at least a factor of two lower than those
indirectly derived from CO2 flux measurements and
CO2 ⁄ CH4 ratios measured either in gaseous manifestations
or in the soils at 50 cm depth. This difference could be
explained by the previously disregarded methanotrophic
activity within the soil. This result highlights the impor-
tance of methanotrophic activity within the soil in geother-
mal areas like Sousaki and probably elsewhere.
Methanotrophic activity within the soil
Methanotrophic activity has long been considered impossi-
ble in such environments because conditions are inade-
quate or even lethal for ‘normal’ methanotrophic
microorganisms. Many studies, in fact, show that methano-
trophic activity decreases until it stops with increasing tem-
perature, acidity or sulphur gas content (Bender & Conrad
1995). Such conditions are widespread in geothermal
areas. But notwithstanding these harsh conditions, evi-
dence for methanotrophic activity was discovered at Solfa-
tara di Pozzuoli (Castaldi & Tedesco 2005). The
microorganism responsible for methanotrophic activity was
attributed to the phylum Verrucomicrobia (Pol et al.
2007). Methanotrophy attributed to microorganisms of
the same phylum has since been found at Hell’s Gate geo-
thermal system in New Zealand (Dunfield et al. 2007) and
in acidic hot springs in Kamchatka, Russia (Islam et al.
2008), highlighting their global distribution.
Incubation experiments proved the existence of biologi-
cal CH4 oxidation activity in the soils collected at Sousaki.
The measured consumption rates do not show significant
relationships with other soil parameters (CH4 flux or con-
centration, temperature or pH). Methanotrophic activity in
soils not affected by hydrothermal activity generally display
a maximum when soil pH is close to 7 and decreases
towards higher and lower values, being substantially sup-
pressed at pH(H2O) values above 10 and below 4 (Bender
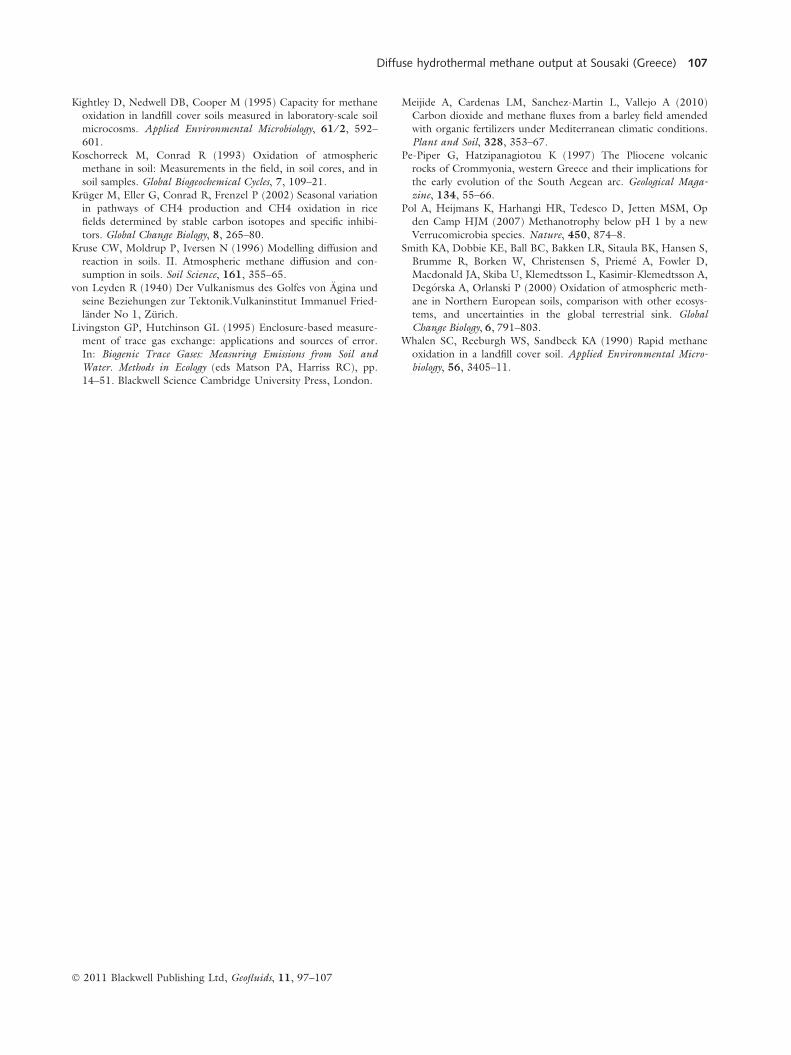
& Conrad 1995). In the soils of Sousaki, such a pattern is
not seen, and significant consumption rates have been
measured also in soil displaying pH(H2O) values as low as
1.56 (Fig. 6). The soil sample SOU34 (Table 3), whose
pH(H2O) is 3.63, displays a consumption rate which is
more than one order of magnitude higher
()478 pmolCH4 h)1 g)1) than the other soil samples. This
value was obtained in a single experiment but is supported
by other two experiments in which no measurable CH4
was present within the vials after 24 h incubation, pointing
to consumption rates of at least )224 pmolCH4 h)1 g)1.
Further, a fourth experiment on an aliquot of the same soil
with a starting CH4 concentration of about 400 lmol -
mol)1 showed a consumption rate of nearly
)33 000 pmolCH4 h)1 g)1 (data not shown). In agree-
ment with previous studies (Whalen et al. 1990; Kightley
et al. 1995), such a very high value may indicate that high
CH4 flux areas can sustain intense methanotrophic activity.
In particular, similar methane oxidation rates (up to about
40 000 pmolCH4 h)1 g)1) have been reported for landfill
cover soils (Kightley et al. 1995), an environment that can
generate CH4 fluxes to the atmosphere in the same order
of magnitude as those measured in the present study.
CONCLUSIONS
Flux measurements at Sousaki confirm that this geothermal
system is diffusively degassing significant amounts of CH4
(19 t a)1) through the soils. This study further confirms
that volcanic ⁄ geothermal areas are significant source of
CH4 to the atmosphere. The present study also indicates
that previous estimates of this source have been overly
large because methanotrophic activity within the soils was
disregarded. Most of the previous estimates were made by
cross-correlating CO2 or water vapour output data with
the respective CO2 ⁄ CH4 or H2O ⁄ CH4 ratios of their gas-
eous manifestations. They recognized that ‘normal’ met-
hanotrophic microorganisms could not survive the harsh
conditions (high temperature, acidity and anoxia) existing
within soils in volcanic ⁄ geothermal areas. But recent stud-
ies have revealed the existence in such environments of aci-
dophilic and thermophilic methanotrophic bacteria of a
different phylum with respect to ‘normal’ methanotrophs
(Dunfield et al. 2007; Pol et al. 2007; Islam et al. 2008).
A previous study on the Pantelleria Island (D’Alessandro
et al. 2009a) showed that methanotrophic activity
decreases the estimated CH4 flux by about one order of
magnitude with respect to previous estimates. The current
study indicates that methanotrophic activity within the soils
at Sousaki decreases the total CH4 output of the system by
–500
–400
–300
–200
–100
0
100
1 3 5 7 9pH
CH
4 con
sum
ptio
n (p
Mol
g–1
h–1
)
–50
–40
–30
–20
–10
0
10
1 3 5 7 9
Fig. 6. CH4 consumption rate versus soil pH(H2O). Inset: same plot with
enlarged y-axis. Negative values indicate CH4 consumption and positive
values CH4 production. Error bar is shown for the consumption rates.
Where not shown the error bar is less than the dimension of the symbol.
Diffuse hydrothermal methane output at Sousaki (Greece) 105
� 2011 Blackwell Publishing Ltd, Geofluids, 11, 97–107
at least a factor two. Therefore, we confirm that oxidation
of CH4 by methanotrophic bacteria in the soils of volca-
nic ⁄ geothermal areas clearly reduces the amount of CH4
emitted by these systems, although the quantitative signifi-
cance of this effect remains to be better defined. Labora-
tory incubation experiments have also revealed that
methanotrophic activity within the soils of the geothermal
system of Sousaki may sometimes reach very high con-
sumption rates (up to 33 000 pmolCH4 h)1 g)1) previ-
ously recognized only in landfill cover soil.
ACKNOWLEDGEMENTS
We acknowledge the help of Ioana-Cornelia Rosu, Bog-
dan-Andrei Detesanu and Maria Helmi in the field sam-
pling campaigns. Jens Fiebig kindly made available
unpublished data on isotopic composition of CH4 and the
C1 ⁄ (C2 + C3) ratio of the gas collected at the big cave of
Sousaki. The insightful comments of three anonymous ref-
erees and of the editor (Steve Ingebritsen) helped us to
improve this manuscript.
REFERENCES
Baciu C, Etiope G, Cuna S, Spulber L (2008) Methane seepage in
an urban development area (Bacau, Romania): origin, extent,
and hazard. Geofluids, 8, 311–20.
Bender M, Conrad R (1995) Effect of CH4 concentrations andsoil conditions on the induction of CH4 oxidation activity. SoilBiology and Biochemistry, 27, 1517–27.
Cardellini C, Chiodini G, Frondini F, Granieri D, Lewicki J, Peru-
zzi L (2003) Accumulation chamber measurements of methanefluxes: application to volcanic–geothermal areas and landfills.
Applied Geochemistry, 18, 45–54.
Castaldi S, Fierro A (2005) Soil – atmosphere methane exchangein undisturbed and burned Mediterranean shrubland of South-
ern Italy. Ecosystems, 8, 182–90.
Castaldi S, Tedesco D (2005) Methane production and consump-
tion in an active volcanic environment of Southern Italy. Chemo-sphere, 58, 131–9.
Chiodini G, Granieri D, Avino R, Caliro S, Costa A (2005)
Carbon dioxide diffuse degassing and estimation of heat
release from volcanic and hydrothermal systems. Journal ofGeophysical Research, 110, B08204. DOI: 10.1029/
2004JB003542.
D’Alessandro W, Brusca L, Kyriakopoulos K, Rotolo S, Michas G,Minio M, Papadakis G (2006) Diffuse and focussed carbon
dioxide and methane emissions from the Sousaki geothermal
system, Greece. Geophysical Research Letters, 33, L05307.
D’Alessandro W, Bellomo S, Brusca L, Fiebig J, Longo M, Mar-telli M, Pecoraino G, Salerno F (2009a) Hydrothermal methane
fluxes from the soil at Pantelleria island (Italy). Journal of Volca-nology and Geothermal Research, 187, 147–57.
D’Alessandro W, Rotolo S, Kyriakopoulos K, Bellomo S, BruscaL, Calabrese S, Liotta M, Bruno C, Plicanti F (2009b) Fuma-
rolic alteration products at Sousaki (Greece): occurrence and
environmental impact. Proceedings of 2nd International CEME-
PE & SECOTOX Conference, Mykonos, Greece, June 21–26,2009 (eds Kungolos A, Aravossis K, Karagiannidis A, Samaras P),
pp. 185–90.
Dlugokencky EJ, Houweling S, Bruhwiler L, Masarie KA, LangPM, Miller JB, Tans PP (2003) Atmospheric methane levels off:
Temporary pause or a new steady-state? Geophysical ResearchLetters, 30, 1992. DOI: 10.1029/2003GL018126.
Dlugokencky EJ, Bruhwiler L, White JWC, Emmons LK, NovelliPC, Montzka SA, Masarie KA, Lang PM, Crotwell AM, Miller
JB, Gatti LV (2009) Observational constraints on recent
increases in the atmospheric CH4 burden. Geophysical ResearchLetters, 36, L18803. DOI: 10.1029/2009GL039780.
Dunfield PF, Yuryev A, Senin P, Smirnova AV, Stott MB, Hou S,
Ly B, Saw JH, Zhou Z, Ren Y, Wang J, Mountain BW, Crowe
MA, Weatherby TM, Bodelier PLE, Liesack W, Feng L,Wang L, Alam M (2007) Methane oxidation by an extremely
acidophilic bacterium of the phylum Verrucomicrobia. Nature,450, 879–82.
Dutaur L, Verchot LV (2007) A global inventory of the soil CH4
sink. Global Biogeochemical Cycles, 21, GB4013. DOI:
10.1029/2006GB002734.
Etiope G, Caracausi A, Favara R, Italiano F, Baciu C (2002) Meth-ane emission from the mud volcanoes of Sicily (Italy). GeophysicalResearch Letters, 29 ⁄ 8, 1215. DOI: 10.1029/2001GL014340.
Etiope G, Papatheodorou G, Christodoulou DP, Ferentinos G,
Sokos E, Favali P (2006) Methane and hydrogen sulfide seepagein the northwest Peloponnesus petroliferous basin (Greece):
Origin and geohazard. AAPG Bulletin, 90, 701–13.
Etiope G, Fridriksson T, Italiano F, Winiwarter W, Theloke J
(2007) Natural emissions of methane from geothermal and vol-canic sources in Europe. Journal of Volcanology and GeothermalResearch, 165, 76–86.
Etiope G, Lassey KR, Klusman RW, Boschi E (2008) Reappraisalof the fossil methane budget and related emission from geologic
sources. Geophysical Research Letters, 35, L09307. DOI:
10.1029/2008GL033623.
Fiebig J, Woodland AB, D’Alessandro W, Puttmann W (2009)Excess methane in hydrothermal emissions is abiogenic. Geology,37 ⁄ 6, 495–8.
Francalanci L, Vougioukalakis GE, Perini G, Manetti P (2005) A
west-east traverse along the magmatism of the south Aegean vol-canic arc in the light of volcanological, chemical and isotope data.
In: The south Aegean Active Volcanic arc, Vol. 7 (eds Fytikas M,
Vougioukalakis GE), pp. 65–111. Developments in Volcanology,
Elsevier, Amsterdam, The Netherlands.Fytikas M, Dalambakis P, Karkoulias V, Mendrinos D (1995)
Geothermal exploration and development activities in Greece
during 1990–1994. Proceedings of the World Geothermal Con-gress 1995, Rome.
Hanson RS, Hanson TE (1996) Methanotrophic bacteria. Microbi-ology Reviews, 60, 439–71.
Horita J, Berndt ME (1999) Abiogenic methane formation andisotopic fractionation under hydrothermal conditions. Science,285, 1055–7.
Hutsch BW (2001) Methane oxidation in non-flooded soils as
affected by crop production. European Journal of Agronomy,14, 237–60.
IGME (1985) Geological MAp of Greece 1 ⁄ 50,000 – Sofikon Sheet.Institute of Geology and Mineral Exploration, Athens.
Intergovernmental Panel on Climate Change (2001) Climate
change 2001. In: The Scientific Basis (eds Houghton JT, Ding
Y, Griggs DJ, Noguer M, van der Linden PJ, Dai X, Maskell K,
Johnson CA), pp. 239–88. Cambridge University press, UK.Islam T, Jensen S, Reigstad LJ, Larsen Ø, Birkeland NK (2008)
Methane oxidation at 55�C and pH 2 by a thermoacidophilic
bacterium belonging to the Verrucomicrobia phylum. Proceed-ings of National Academy of Science USA, 105, 300–4.
106 W. D’ALESSANDRO et al.
� 2011 Blackwell Publishing Ltd, Geofluids, 11, 97–107
Kightley D, Nedwell DB, Cooper M (1995) Capacity for methaneoxidation in landfill cover soils measured in laboratory-scale soil
microcosms. Applied Environmental Microbiology, 61 ⁄ 2, 592–
601.
Koschorreck M, Conrad R (1993) Oxidation of atmosphericmethane in soil: Measurements in the field, in soil cores, and in
soil samples. Global Biogeochemical Cycles, 7, 109–21.
Kruger M, Eller G, Conrad R, Frenzel P (2002) Seasonal variationin pathways of CH4 production and CH4 oxidation in rice
fields determined by stable carbon isotopes and specific inhibi-
tors. Global Change Biology, 8, 265–80.
Kruse CW, Moldrup P, Iversen N (1996) Modelling diffusion andreaction in soils. II. Atmospheric methane diffusion and con-
sumption in soils. Soil Science, 161, 355–65.
von Leyden R (1940) Der Vulkanismus des Golfes von Agina und
seine Beziehungen zur Tektonik.Vulkaninstitut Immanuel Fried-lander No 1, Zurich.
Livingston GP, Hutchinson GL (1995) Enclosure-based measure-
ment of trace gas exchange: applications and sources of error.In: Biogenic Trace Gases: Measuring Emissions from Soil andWater. Methods in Ecology (eds Matson PA, Harriss RC), pp.
14–51. Blackwell Science Cambridge University Press, London.
Meijide A, Cardenas LM, Sanchez-Martin L, Vallejo A (2010)Carbon dioxide and methane fluxes from a barley field amended
with organic fertilizers under Mediterranean climatic conditions.
Plant and Soil, 328, 353–67.
Pe-Piper G, Hatzipanagiotou K (1997) The Pliocene volcanicrocks of Crommyonia, western Greece and their implications for
the early evolution of the South Aegean arc. Geological Maga-zine, 134, 55–66.
Pol A, Heijmans K, Harhangi HR, Tedesco D, Jetten MSM, Op
den Camp HJM (2007) Methanotrophy below pH 1 by a new
Verrucomicrobia species. Nature, 450, 874–8.
Smith KA, Dobbie KE, Ball BC, Bakken LR, Sitaula BK, Hansen S,Brumme R, Borken W, Christensen S, Prieme A, Fowler D,
Macdonald JA, Skiba U, Klemedtsson L, Kasimir-Klemedtsson A,
Degorska A, Orlanski P (2000) Oxidation of atmospheric meth-
ane in Northern European soils, comparison with other ecosys-tems, and uncertainties in the global terrestrial sink. GlobalChange Biology, 6, 791–803.
Whalen SC, Reeburgh WS, Sandbeck KA (1990) Rapid methaneoxidation in a landfill cover soil. Applied Environmental Micro-biology, 56, 3405–11.
Diffuse hydrothermal methane output at Sousaki (Greece) 107
� 2011 Blackwell Publishing Ltd, Geofluids, 11, 97–107
Top Related
Copyright © 2022 FDOKUMEN

