


Bahasa
Halaman
Hukum


World Journal of Electrical and Electronic Engineering, 2021, 1, 51-65
www.scipublications.org/journal/index.php/wjeee
DOI: 10.31586/wjeee.2021.151
DOI:https://doi.org/10.31586/wjeee.2021.151 World Journal of Electrical and Electronic Engineering
Article
Development of an Improved Solid Waste Collection System
using Smart Sensors
Promise Elechi 1,*, Sunny Orike 2, Augusta Ogonda Igbudu 1
1 Department of Electrical/Electronic Engineering, Rivers State University, Port Harcourt, Nigeria
2 Department of Computer Engineering, Rivers State University. Port Harcourt, Nigeria
*Correspondence: [email protected]
Abstract: Waste collection system has become a challenging task, occasioned by the overflowing
garbage bins littered all over the environment, causing environmental hazard and further leading
to incurable diseases which endanger life. The present-day waste collection system has proven to
be inefficient, taking into consideration the advancement in the technologies on the rise in recent
years as well as the continuous increase in population growth. As a result of this inefficiency ob-
served, this work developed a model for electronic waste collection system in a telecommunication
driven environment. In the system's implementation, PIC18F4620 based instrumentation, integrated
with proximity sensor for external monitoring and level sensors for internal monitoring was
adopted, while the controlling of the opening and closing of the cabins was implemented using a
smart switching board. A remote reporting to the waste management authority so as to systemati-
cally plan route-map for garbage collection when the waste cabin is fully filled was done by deploy-
ing a 900MHz transmitter interfaced with the system’s controller. The result shows that with this
model the waste cabin opens only on account of a user approaching the sensing distance of the
system and the cabin is not filled. But when the cabin gets filled and a user approaches the sensing
distance of the system, it directs the user to use the nearest waste cabin by displaying a message on
the LCD (Liquid Crystal Display), while communicating with relevant authority for the evacuation
of the cabin via SMS. It was obviously seen that the automation incorporated into the system had
zero impact on the success rate of the system or system availability while introducing a latency of
5.6seconds, which is just 28.0% of the maximum allowable latency of this kind of system, while
protecting the environment from environmental pollution and spread of diseases. This work high-
lights the potentials of (EWCS) Electronic Waste Collection System in monitoring and controlling
waste disposal for healthy and clean environment.
Keywords: Waste Collection, Transmitter, Sensor, Controlling
1. Introduction
1.1. Background of the Study
Solid waste which is the main cause of environmental pollution, has been defined
under Resource Conservation and Recovery Act as any solid, semisolid or contained gas-
eous material from agricultural, commercial, mining or industrial operations and from
community activities, be it locally or globally, waste control is a continuously increasing
problem as population increases [1]. Solid wastes arise mainly from the activities of hu-
mans and animals. In general terminology, solid wastes can be defined as the organic and
inorganic waste materials produced by various activities of the society and which have
lost their value to the first user.
How to cite this paper: Elechi, P.,
Orike, S., & Ogonda Igbudu, A.
(2021). Development of an Improved
Solid Waste Collection System using
Smart Sensors. World Journal of Elec-
trical and Electronic Engineering, 1(1),
51–65. Retrieved from
https://www.scipublica-
tions.com/journal/in-
dex.php/wjeee/article/view/151
Received: September 20, 2021
Accepted: October 27, 2021
Published: October 28, 2021
Copyright: © 2021 by the authors.
Submitted for possible open access
publication under the terms and
conditions of the Creative Commons
Attribution (CC BY) license
(http://creativecommons.org/licenses
/by/4.0/).
Promise Elechi et al. 2 of 15
The day-to-day domestic waste is collected as a whole, by placing a dustbin at a par-
ticular place either in lanes or streets [2]. The process of checking the status of the bin is
the toughest part. In the existing method, the municipal worker has to look through all
the different areas where the bins are placed in order to collect the waste. This is a tiring
and a time-consuming task. The existing method of the waste control system is consider-
ably inefficient, when the current development in technology is taken into consideration.
There is no guarantee that the waste management worker(s) will be at the right place as
well as the right time to collect the waste. In order to overcome the problems faced due to
the existing method, a new way of approaching the waste control system automatically is
proposed. It is the leap taken in the direction of automating the waste management to
make it more efficient [3]. A recent advancement in the technology has enhanced the con-
nection of everything via the Internet, using internet, it is possible to build an intranet and
coordinate all the bins there by having a centralized system [4].
Electronics waste control system designed here is to implement a smarter way of
conventional waste control using smart sensors to sense the presence of human around
the waste bin, monitor the garbage level within the waste bin and relays information as
regards the filled level status of the waste cabin to the waste control authority. The data
acquired as above, can be used to systematically plan route-map to collect garbage. The
information from the waste bins to the configured number at waste control office is sent
using a communicating module (GSM module). The entire operation is controlled using a
microcontroller [5].
1.2. Statement of the Problem
Convectional waste control system which is currently deployed in Nigeria has static
routes and schedules where garbage from waste bins is collected on fixed schedules, re-
gardless if the bins are full or not. Most times the waste bins are filled and the garbage
spreads on open streets, thereby severely affecting the health and hygiene of the people.
However, with the adoption of an improved waste collection system using proximity sen-
sors, microcontroller and GSM module, the above problem is taking care of, and by this
means, the waste control authority can effectively handle the waste disposal problem of
the society without stress and at a very low cost as relevant information will be relayed
by the system to them concerning system’s state. This significantly, will improve the
healthy state of the environment.
The aim of this project was to improve on the operation of a solid waste collection
system using proximity sensors, microcontroller, and GSM module.
1.3. Review of Related Works
Srikanth et al. (2017)[6] carried out a work on overview for solid waste bin monitor-
ing and collection system. The technologies used in the work are Radio Frequency Identi-
fication (RFID), Global Position System (GPS), General Packet Radio Service (GPRS), Ge-
ographical Information System (GIS) and web camera. The collection trucks are embed-
ded with RFID reader which helps in retrieving all the customers as well as the bin infor-
mation from the RFID tags placed in each bin. The locations of the bins are giving by GPS.
Authentication by the use of driver id is needed to start the collection session. The waste
disposal trucks with the help of RFID reader picks up the RFID tagged bins. The RFID
tags are the keys for retrieving the information stored in the back-end database.
In RFID for the business of waste control, a similar work was carried out “Smart Gar-
bage Collection System in Residential Area”. The work is based on a concept that includes
a camera being mounted on each garbage collection marker as well as a load sensor fitted
at the bottom of the trash bin. The camera is used to take regular snapshots of the trash
bin. The camera and the load sensors are set with a threshold value so that they can be
compared. A microcontroller is used to perform the comparison. An idea about the gar-
bage level can be conceived by performing image analysis and the weight of garbage can

Promise Elechi et al. 3 of 15
be evaluated by using the load sensor. The threshold level of the trash bin is checked by
the controller. The controller, with the help of GSM module, sends a message to the local
central office of the garbage collection unit so that it can notify that the garbage needs to
be collected. Due to this, the authorities send the garbage collecting vehicle to dispose the
wastes, which is performed by implementing a robot mechanism.
[7] designed a smart waste control with self-describing object. This work was based
on the concept of associating smart waste control with digital information. The digital
information which is associated to a waste can be stored within a QR code or a RFID tag
memory. If the QR codes are used, the objects are needed to be in the line of sight. In the
case of RFID technology, the information in the RFID tags can be retrieved without re-
quiring the object to be in a particular position during the operation. Nowadays, the UHF
tags are being used in the area of supply chain management since the data can be read
easily within a distance of five meters from the antenna of the reader. This UHF tag-based
concept uses the memory of the tags to store the information in data banks memory. This
tag memory is used to store the digital information of the associated waste. The smart
waste system requires only RFID reader to read the data. The work also proposes a clas-
sification system of the wastes. According to this proposal, a particular type of waste is
allocated to a unique identification number. The classification is used to store the reference
number which represents the waste type in the memory of each tag connected to each
type of waste.
[8] designed an approach for monitoring and smart planning of urban solid waste
control using smart-M3 platform. This work was based on a waste management system
which has a bin in which there are two types of sensors: a proximity sensor located on the
upper part of the bin and a weight sensor located in the bottom of the bin. The proximity
sensor is used to measure the level of the wastes in the bin and the weight sensor is used
to find the weight of the wastes present in the bin. Every bin has a ZigBee module installed
which will be able to measure the physical quantities to the nearest light pole. The gate-
way of the system is implemented by a Raspberry PI which is used to collect process and
transmit the data measured by the two sensors to the central control center. The control
center uses the data retrieved by the sensors to implement efficient and effective optimi-
zation strategies as well as to find solutions for problems based on organization of re-
sources on solid waste control. The control center is also responsible to inform any vehicle
whether and when the bin is empty or full.
Another related work was done by [9]. RFID-Based Real-Time Smart Waste Collec-
tion System. This work is based on a system which proposed a RFID based waste collec-
tion system. This proposed system consists of a smart waste RFID tag, a RFID Reader as
well as a Waste Control IT System (WCITS). A passive unique RFID tag is used in this
system since passive tags do not require battery. These tags are powered by the RFID
Reader and have a read range of about 10 meters. The antenna in the RFID Reader picks
up the radio waves. The RFID Reader is attached to the Personal Digital Assistant (PDA)
and the unique identification number of the bin is displayed. The PDA is installed in the
garbage collecting vehicle. The waste collector truck consists of a robotic arm and the
weighing system is present in the arm. The weight of the bin can be determined by the
help of load sensors present in the weighing system. The Bin ID is used in the calculation
of waste disposal charges of individual houses and the result is stored in a temporary
storage in the PDA. At the end of the work shift, all the data is stored in a SQL back-end
server for storage and processing of information. This data transfer is implemented by
using Wi-Fi connection and the internet.
2. Materials and Method
2.1. Materials
The materials used in the implementation of this work are:

Promise Elechi et al. 4 of 15
1. PIC 18F4520 Microcontroller
2. 16x2 Alphanumeric LCD (LMO16L)
3. GSM Module (SM 900A)
4. PIR Sensor
5. LDR (Light Dependent Resistor)
6. LED (light emitting diode)
7. LM 358 OP AMP
8. DC Motor
9. Relay
10. ULN 2003A
11. Resistor (10k)
12. 5V voltage regulator
13. Capacitor (2200uF, 15pF)
14. Bridge Rectifier
15. 12VOLTS 2AMPS Transformer
16. Variable Resistor
2.2. Methods
Following the standard systematic approach for engineering design and implemen-
tation for proper and reliable solid waste collection system design in accordance with its
aim and objective, series of effectual and adequate steps were followed. The end output
of one step serves as the basic stand of the next proceeding step beginning according to
hierarchical order. The project was carried out using the following design steps;
• Design consideration
• Power specification
• Physical structure
• Circuit design
• Component interfacing and simulation
2.2.1 Design Consideration:
The very first step of every project is to determine the exact requirements of the indi-
vidual parts of the system, this in general enables the system designer to have a concrete
idea on what the system is required to achieve at the end and also enable the designer to
have a standard of measurement of how much of the specified qualities of the system is
achieved at the end of the system design.
2.2.2. Power Specification
The design and functionality of this project requires the use of two DC power sup-
plies, a 5 Vdc power supply and a 12 Vdc power supply. The sensors, GSM Module, LCD
display, LM358, ULN2003A, relays and the microcontroller require a 5 Vdc power supply
while the DC motor that will wheel up the waste bin cover required a 12 Vdc power sup-
ply.
Promise Elechi et al. 5 of 15
Figure 1. Power Supply
The power supply in Figure 1 shows the 220V source directly transformed to a 12V
AC by the transformer, the transformed output is rectified to equivalently 11.6 volts which
is then filtered and regulated by the capacitor and regulator respectively. The LM7805 was
used to obtain 5V DC output for the sensors, relay, drivers and the GSM module and a
direct 12V DC was used to power only the DC motor. The PIC 18F4520 Microcontroller is
supplied with 5V DC because it doesn’t have an internal regulator of its own. The calcu-
lation to obtain the capacitor value for the filtration using Q=CV.
2.2.3. Circuit Design
This part describes the individual electronic components that came together to make
up the entire system. This starts with the block diagram of the system, which illustrates
how the individual subsystems ties up together to form the entire system. It is as shown
in the Figure 2.
Figure 2. Block Diagram of a Solid Waste Collection System.
Figure 2 shows the interconnection of the units that makes up the smart solid waste
collection system. It consists of two power supply units, 5V DC power supply and 12V
DC power supply. The power supply unit of 5V DC supplies voltage to the microcontrol-
ler, the level sensor, PIR sensor, GSM modem, LCD display, ULN 2003 driver, LM 358 and
the relay, while the 12V power supply supplies voltage to the DC motor that wheels up
the waste bin cover. When someone comes closer (predefined sensing distance) to the

Promise Elechi et al. 6 of 15
waste bin to dispose waste, the PIR sensor senses the person and immediately signals the
microcontroller. The microcontroller on receiving the signal activates the DC motor by
sending a HIGH state signal to the ULN2003 driver that drives the relays which eventually
activates the DC motor. The DC motor then wheels up the waste bin cover. After disposal,
the waste bin closes back through the help of the DC motor as well. After the closure, the
microcontroller deactivates the ULN2003 driver by sending a LOW state signal to it which
then de-energizes the relay and in turn deactivates the DC motor. The level sensor moni-
tors the level of waste in the waste bin. The LDR, LED and LM358 are the three main
components that act as the level sensor. The LDR and LED are placed directly opposite
each other in the waste container, its designed in such a way that Light rays coming from
the LED will constantly fall on the LDR surface, so when the waste disposed in the con-
tainer reaches a level that it begins to block the light rays from getting to the LDR, this
signifies that the waste bin is full, then the LM 358 OPAMP will detect a voltage drop at
the LDR as a result of reduced light intensity. After this detection the OPAMP will send a
high state to the microcontroller which then activates the GSM module to communicate
the waste control authority concerning the fill level of the waste bin. Upon activation of
the GSM module, the microcontroller will write to the LCD to display the status fill infor-
mation on the display panel after which the PIR sensor will receive a low state from the
microcontroller disconnecting it from the circuit until the entire system is being RESET
manually on arrival of the municipal workers. The signal transmitted by the GSM Mod-
ule is received as text message at the local base station. After receiving the signal, the local
base station decodes the waste bin location and accordingly sends a dispatch signal to the
nearest monitoring vehicular system about the location of the waste bin for immediate
pickup of trashes in the waste.
2.2.4. Proximity Sensor and Microcontroller
The proximity sensor used in this project is the PIR sensor. It is interfaced to the mi-
crocontroller by connecting it directly to the pin 23(RC4/SD1/SDA) of the microcontroller.
The PIR sensor is mounted on the body of the waste bin so that it can be able to detect
when someone is coming towards the waste bin to drop waste. When the presence of a
human is detected, the PIR sensor will send a high state signal to the microcontroller. The
microcontroller will in turn send a high state to the ULN 2003A driver that will energize
the relay to trigger on the DC motor so that the container can be wheeled open. Figure 3
shows the schematic of how the PIR sensor was interfaced with the microcontroller.
Figure 3. Schematic Diagram Showing the PIR Sensor Interfaced to the Microcontroller.

Promise Elechi et al. 7 of 15
2.2.5. DC Motor and Microcontroller
The major function of the DC motor in this project is to wheel up the top cover of the
waste bin on detection of human presence by the PIR sensor. The DC motor is interfaced
with the microcontroller in such a way that it is being driven by a 5V relay and ULN2003A
driver. The ULN2003A driver is made up of seven Darlington paired NPN transistors
fabricated into one chip, this driver is connected to pin 15(RC2) and pin 16(RC1) of the
microcontroller. On sensing a high state signal from the microcontroller, the ULN2003A
driver will give a low output that will energize the 5V relay which in turn triggers the 12V
DC motor. Figure 4 is the schematic diagram showing the interfaced sections of the mi-
crocontroller and the DC motor.
Figure 4. Schematic Diagram of the PIC Microcontroller Interfaced with the DC Motor.
2.2.6. Level Sensor and Microcontroller
The level sensor in this project is responsible for monitoring the fill level of the waste
bin. This was carried out by interfacing the two LDR sensors directly facing two LEDs in
the waste container to the microcontroller through LM358 OPAMP. Both LDR sensors are
interfaced to LM358 OPAMP that gives feedback to the microcontroller about the current
fill level of the container. The LM358 OPAMP is connected to pin 19(RDO/PSPO) and pin
20(RD1/PSP1) of the microcontroller. When the ray of light from the LED falling on the
LDR sensor is being blocked completely by the waste in the waste bin, the LM358 OPAMP
will send a high state signal to the microcontroller so as to enable it activate the GSM
module. Figure 5 is the schematic diagram of how the LDR was interfaced with the mi-
crocontroller to perform this function.
Figure 5. Schematic Diagram of the Microcontroller Interfaced with the two LDR Sensors.

Promise Elechi et al. 8 of 15
2.2.7. LCD and Microcontroller
The LCD panel used in this work is a 16x2 alphanumeric display type. This was in-
terfaced directly to the microcontroller by connecting it to pin 36 (RB3/PGM), pin 35 (RB2),
pin 34 (RB1), pin 33 (RBO/INT), pin 37 (RB4) and pin 38 (RB5) of the microcontroller. The
LCD panel acts as a graphical interface between the smart waste bin and the human in-
tending to dispose a waste in the waste bin. During implementation of the work, we pro-
grammed the LCD panel to function at two states which are:
• Empty State and,
• Filled-up State
When it is in the empty state, it is programmed to display that the bin is still empty
and therefore has room to contain more waste in the trash system. The filled-up state
comes up when the LM358 OP AMP which monitors the fill level of the container sends a
high state signal to the microcontroller indicating that the waste container is full. Figure 6
is the schematic diagram showing how the LCD was interfaced with the microcontroller
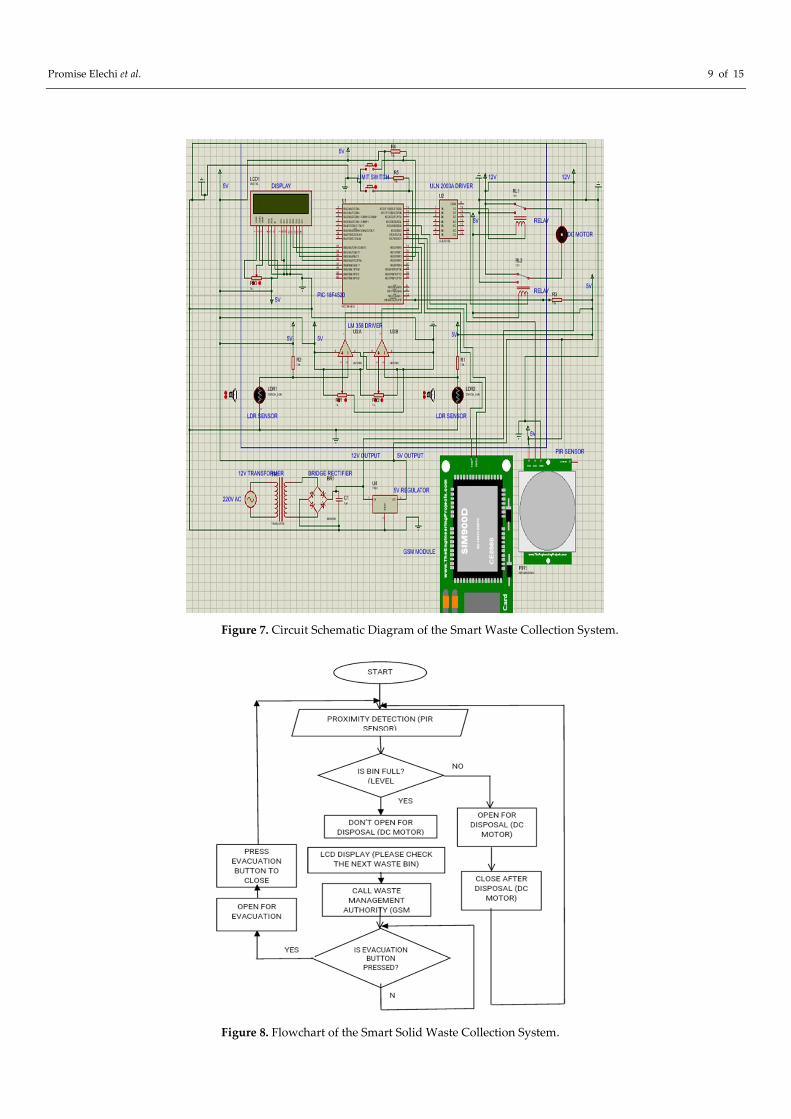
while Figure 7 shows the complete circuit diagram. Also, Figure 8 shows the flow chart of
the smart solid waste collection system.
Figure 6. Schematic Diagram Showing how the LCD was Interfaced with the Microcontroller.
Promise Elechi et al. 9 of 15
Figure 7. Circuit Schematic Diagram of the Smart Waste Collection System.
Figure 8. Flowchart of the Smart Solid Waste Collection System.

Promise Elechi et al. 10 of 15
3. Results and Discussion
3.1. Implementing the Output Unit of the System
The output unit of the system in this project is the LCD display, this acts as the user
interface between the user and the system as a whole, it displays the current status of the
system and tells the user about the next phase of instruction that is being carried out by
the controller. Figures 9 and 10 are the simulation and real-time images of the LCD dis-
playing the current status of the system.
Figure 9. Proteus Simulation of the System Showing its Initialization Mode.
Figure 10. Image View of the Output Unit Displaying the Current Status of the System.
3.2. Implementing the Sensing Unit
During the implementation of this unit, we tested the major components that make
up the unit, which includes the PIR sensor and LDR device. During the design of this
work, the sensors were first simulated on Proteus by representing them with logic states.
These states determine the exact behavior of the system and the general ideology involved
in running the system. Figures 11, 12 and 13 are images showing the different responses
of the system when different states are assigned to the sensors. When a high state is being
assigned to the motion sensor. The result of the output above was gotten when the PIR
sensor was activated on detection of motion. In Figure 122, the current reaction of the
system was as a result of deactivation of the PIR sensor, i.e., a low state was assigned to
the sensor. This was achieved physically by stopping motion in front of the PIR sensor.

Promise Elechi et al. 11 of 15
Figure 133 shows the current state of the system, this was achieved when a low state was
assigned to both LDR devices acting as level sensors in the waste container, this condition
can only occur when the waste bin is full.
Figure 11. Circuit Simulations Showing the Reaction of the System.
Figure 12. Circuit Simulation of the System Showing its Current Status.
Figure 13. Circuit Simulation showing the Current Status of the System.

Promise Elechi et al. 12 of 15
3.3. Implementing the SMS Sending unit using the GSM Module
The reaction of this unit was as a result of the low state assigned to the level sensor
when the waste bin was filled up. The microcontroller sends a high state to activate the
GSM module which is connected to its serial port. The GSM module sends a message
across to waste authorities notifying them that the waste bin is filled and is ready for evac-
uation. Figure 144 is a circuit simulation that shows the serial transmitter displaying the
SMS text that is to be sent to the waste authority.
Figure 14. Circuit Simulation of the Current Status of the System.
3.4. System Testing
After the units of the system were integrated together, an open-circuit test was car-
ried out where the individual connections of the system were tested to ensure continuity.
Satisfied with the continuity test, the power supply test was carried out to ensure that
the power requirements of the various branches were met. The functionality of the indi-
vidual sensors and components were also tested. The testing of the application was not
done at once after it was completed, rather each unit of the application was tested indi-
vidually. The second unit was not tested until the first unit gave the expected result and
until it was working according to the necessity of the application. After all of the units
were working correctly, the units were kept together and then the whole system was de-
veloped and tested. It was easy to figure out the bugs and the problem of the system as
the behavior of each unit was known while testing it. It would be impossible to figure out
the problems and the bugs in the system if the system was developed and tested after it
was completed. Table 1 shows the testing results.

Promise Elechi et al. 13 of 15
Table 1. Test Result of the System.
Unit Logic State Microcontroller Ongoing
Operation
Waste Container
Status
Output of the System as Dis-
played by the LCD Panel
Motion sensing Low SSWM system in operation
Motion
Sensing
High Checking fill level of waste
container
Not full Opening for waste disposal
Motion sensing High Checking fill level of waste
container
Full Container full check elsewhere
Level sensing
(both LDR)
High Activating DC motor Not full Opening for waste disposal
Level sensing
(both LDR)
Low Activating GSM module Full Container full check elsewhere
GSM module High SMS sending in progress Full Waiting for waste evacuation
Evacuation but-
ton
Low Activating DC motor Full Opening for waste evacuation
Evacuation but-
ton
Low Activating DC motor Empty Closing cabin
Table 2. Latency experienced at every successful waste bin opening.
Number of Trials (N) Waste Bin Latency (sec)
0 0
1 05
2 05
3 07
4 05
5 06
6 07
7 05
8 05
9 06
10 05
Total average 5.6

Promise Elechi et al. 14 of 15
Figure 15. The Graphical Representation of the Latency Experienced at every Successful Waste Bin
Opening.
3.5. System Availability on Demand and Latency Experienced at Every Successful Waste
Bin Opening of the System
The service availability on demand was ascertained by switching ON and accessing
the functionalities of the system. This was done ten (10) successive times and each of them
was successful. The latency (the time delay for the waste bin to be fully opened and ready
for use) of the system was also noted as shown in Table 2. It can be seen that its average
latency is 5.6 sec, giving that the maximum allowable latency for such a system should be
20 seconds, it means that the latency of the existing system is 28.0% of the maximum al-
lowable latency.
3.6. Performance Evaluation of The Electronic Waste Bin System
The developed electronic waste bin system was evaluated by comparing its availa-
bility on demand with that of the existing waste bin system. Table 2 shows the availability
of the electronic waste bin system. It can be seen that the system success rate which is a
function of the system’s availability is the same as the existing system. This means that
the intelligent features incorporated in this system had zero (0) impact on success rate or
system availability.
On the other hand, the Figure 155 shows the graphical representation of the latency
experienced at every successful waste bin opening, it can be seen that the automation in-
troduced an average delay of 5.6 seconds (28.0%) into the electronic waste bin system.
Now, environmental safety and availability are the key performance indicators for
evaluating environmental waste bin system. In this system, the safety of the environment
where it is deployed is of great importance, while availability which is measured by la-
tency of the system, is not critical as compared to environmental safety.
4. Conclusions
The automatic waste collection process is a step that is taken in order to reduce the
hardship of manual collection and detection of wastes in an automatic manner. The pur-
pose of designing the automatic collection system is in terms of its efficiency and time
saving nature when compared to the already existing one. In the currently employed
method the concerned municipal worker has to locate the bins manually and check the
status of the trash bin. This is a very complex, tasking and a time-consuming process.
Hence, there is an immediate need to automate the process of waste collection to reduce
the human effort and therefore reduces the cost of the whole process.

Promise Elechi et al. 15 of 15
As a result of the above needs a model for electronic waste collection system lever-
aging on wireless communication for effective waste disposal was developed, which au-
tomatically manages waste collection and disposal, eliminates the need of regular check-
ing of the waste bin as well as spreading of diseases as a result of the continuous opening
of the traditional waste bin. This was actually realized by the incorporation of remote re-
porting device to the host controller so as to alert relevant authority when a particular
waste bin is full.
This system can be deployed anywhere effective waste collection is required. The
reduced cost of the entire process makes it affordable.
Hence, the entire method used for the detection and collection of waste makes the
system efficient and intelligent.
References
[1] Ivey, K. N., Muth, A., Arnold, J., King, F. W., Yeh, R. F., Fish, J. E., Hsiao, E. C., Schwartz, R. J., Conklin, B. R., Bernstein, H.
S., and Srivastava, D. (2008). Microrna regulation of cell lineages in mouse and human embryonic stem cells, Cell Stem Cell, 2:
219–229.
[2] Chen, J. F., Mandel, E. M., Thomson, M., Wu, Q., Callis, T. E., Hammond, S. M., Conlon, F. L. and Wang, D. Z. (2008). Theroleof-
microrna-1 and microrna-133 in skeletal muscle proliferation and differentiation. Natural Genetics, 38:228–233
[3] Boileau, H. and Bjork, H. (2006). Comparing household waste treatment policies between two medium size cities: Boras (sweden)
and chambery (france),” in Proceedings of the 7th World Congress on Recovery, Recycling and Re-integration. Available:
http://csp.eworlding.com/3r/congress/manu pdf/420.pdf.
[4] Ramesh, S. N., Shreenivas, P. N, Akshay, N., and Akhil, S. N, (2016). A study on Internet of Things Enabled Smart Store. Institute
of Integrative Omics and applied Biotechnology (IIOABJ), 7 (2): 61–67
[5] Shyamala, S. C. and Satpal, S. (2016). “Smart Waste Management System”. International Journal of Scientific Development and
Research (IJSDR), 2, (3); 45- 78. Available at www.ijsdr.org.
[6] Srikanth, S. V., Pramod, K. D., Tapas, Patil, S. M., and Sarat, C. (2017). Design and implementation of a prototype smart parking
(spark) system using wireless sensor networks. International Conference on Advanced Information Networking and Applica-
tions Workshops, WAINA 401–406.
[7] Faccio, M. Persona, A. and Zanin, G. (2011). “Waste collection multi objective model with real time, traceability data”, science
direct, Waste Management, 31(12):2391–2405
[8] Kai, Y., Junmei, Z, Wenbin, L. Liu, Y., Linand, G., and Huixia, X. (2011). Weighing System of Fruit-Transportation Gyrocar
Based on ARM,” Third International Conference on Measuring Technology and Mechatronics Automation (ICMTMA), Shang-
shai, 1146–1149.
[9] Mohd, N.H., Theng, L.C., Mizanur, (2016). Radio Frequency Identification (RFID). for the Business of Waste Management,
“Smart Garbage Collection System in Residential Area”. www.falkensecurenetworks.com.
Top Related
Copyright © 2022 FDOKUMEN

