


Bahasa
Halaman
Hukum


11 and 13 October 2017
Deep dive into IEV and views from the market
Sanket KawatkarPrincipal and Consulting Actuary
Philip JacksonConsulting Actuary
Shamit GuptaConsulting Actuary

Disclaimer
The views expressed here are the personal views of the presenters and not that of
Milliman.
This presentation is intended solely for educational purposes and presents
information of a general nature. It is not intended to guide or determine any specific
individual situation and persons should consult qualified professionals before taking
specific actions. Neither the presenters, nor the presenters’ employer, shall have any
responsibility or liability to any person or entity with respect to damages alleged to
have been caused directly or indirectly by the content of this presentation.

Disclosures and views from investors / analysts

Adjusted NetWorth
Present Value ofFuture Profits
Frictional Costs Time Value ofOptions andGuarantees
Cost of Non-Hedgeable Risks
Embedded Value
Components of a market consistent embedded valueV
IFA
NW
4
ANW
PVFP
FCTVFOG
CRNHR
EV

ICICI Prudential
SBI Life
HDFC Standard
LifeMax LifeBirla Sunlife
Kotak Mahindra
Bajaj Allianz
Reliance Life
PNB Metlife
Tata AIA
Exide Life Others
Private life insurers’ weighted new business premiumFY16-17
Source:- IRDAI statistics

ICICI Prudential
SBI Life
HDFC Standard
LifeMax Life
Bajaj Allianz
Reliance Life
Exide Life
Companies who disclose EV and / or VNB

ICICI Prudential
SBI Life
HDFC Standard
LifeMax Life
Detailed market consistent disclosures
Listed on 29th September 2016
Track record of disclosing EV
Indirect listing through Max Financial Services
Track record of disclosing EV
Track record of disclosing EV. Listing planned.
First embedded value disclosure in FY15-16.
Listed on 3rd October 2017

Disclosed EVs / VNBs
Valuation
DateMarch 2017 March 2017 March 2017 March 2017 March 2017 Sept 2016 March 2017
0.00%
5.00%
10.00%
15.00%
20.00%
25.00%
30.00%
35.00%
0
2,000
4,000
6,000
8,000
10,000
12,000
14,000
16,000
18,000
SBI Life ICICI Prudential HDFC Life Max Life Bajaj Allianz Reliance Life Exide Life
INR
Crs
EV VNB margin (post-overrun) VNB margin (undisclosed overrun)

Expenses
Others
Views / questions from analysts (1)
• Technical aspects
• Clarity important
• Reasons for differences across companies
Very difficult to understand!
• Prefer stability and consistency from year to year
Generally changes are disliked
• Are the ‘operating variances’ low?
• Is the ‘unexplained’ variance low?
• Consider assumption changes and operating variances together
Credibility of assumptions

Expenses
Others
Views / questions from analysts (2)
Technical questions
Why is the VNB margin different across companies?
Why is the CRNHR as a % of VIF different across companies?
Why is the assumed risk free rate (RFR) different across companies?
Is the EVOP margin (i.e. EV operating profit / opening EV) ‘manipulated’?
Why are the sensitivities different across companies?
What EVOP margin is sustainable?
What VNB margin is sustainable?

IEV vs. MCEV

Difference between MCEV and IEV
MCEV IEV = “MCEV+”
Productivity gains / expense efficiencies after valuation date should not be considered
“Materiality” limit
Data audit requirements
A large number of sensitivity disclosures and detailed analysis of movement

Expenses
Others
Implementing IEV – Operational issues (1)
• First time implementation
• IPO disclosures
• Post-IPO disclosures
Timelines achievable?
• Treatment consistent across all financial reports?
• Is it suitable to calculate EV for all types of business?
Single / regular premium plans

Expenses
Others
Implementing IEV – Operational issues (2)
• Set by the Board
• How to set?
Materiality limit
• Minor lines of business
• Simplified models / approximations?
• Subsidiaries?
Covered business includes all?

Expenses
Others
Implementing IEV – Operational issues (3)
• Allowance for historical tax losses?
• Timing for release of participating fund FFA – consistency with internal framework and allowance in FC calculations
• EV opening reserves match those in balance sheet?
• Release of global reserves – basis and timelines?
• Recognition of savings in commission on orphan policies?
• Allowance for service tax – consistent with the actual practice?
• Reinsurance cash-flows allowed for?
PVFP
• What’s the RC? Allowance for FFA to be consistent with treatment of FFA
• FC on encumbered capital in subsidiaries?
FC
Expenses
Others
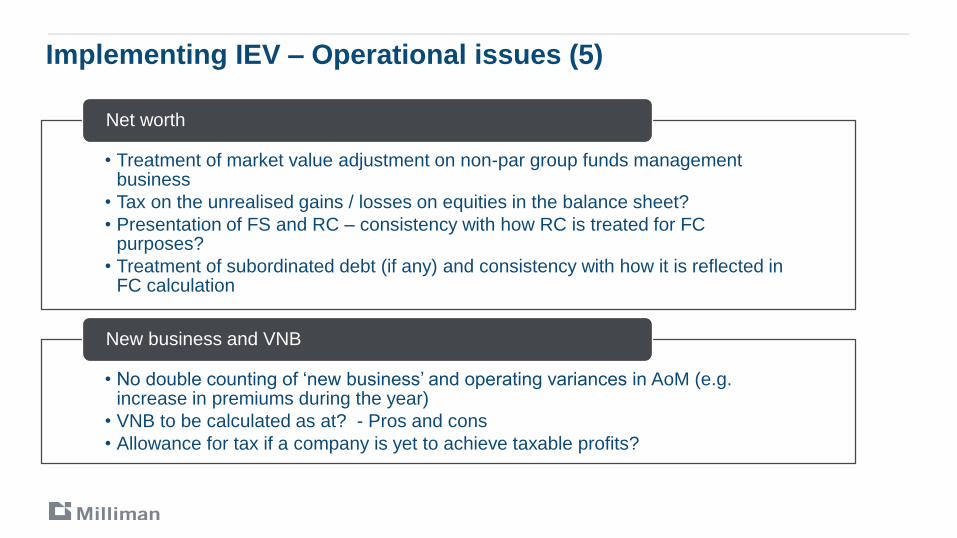
Implementing IEV – Operational issues (5)
• Treatment of market value adjustment on non-par group funds management business
• Tax on the unrealised gains / losses on equities in the balance sheet?
• Presentation of FS and RC – consistency with how RC is treated for FC purposes?
• Treatment of subordinated debt (if any) and consistency with how it is reflected in FC calculation
Net worth
• No double counting of ‘new business’ and operating variances in AoM (e.g. increase in premiums during the year)
• VNB to be calculated as at? - Pros and cons
• Allowance for tax if a company is yet to achieve taxable profits?
New business and VNB

Expenses
Others
Implementing IEV – Operational issues (6)
• Granular enough?
• Dynamic validation of assumptions?
• Illiquidity premium for illiquid liabilities (e.g. annuities)?
• One off costs excluded from expense loadings?
• Allowance for CSR?
Assumptions
• Product category specific impacts analysed?
• Market value adjustments in economic sensitivities?
Sensitivities

Reference rates

Reference rates – Key topics
Selection of source data
Refinement of source data and selection of fitting methods
Comparison of common yield curves in the market

Swaps versus G-Sec – 29 September 2017
Maturity Weighted average rate (%) Volume (Crs.) No. of trades
3M 5.9975 300 3
6M 6.0735 5,400 26
9M 6.0754 1,300 13
1Y 6.0948 3,050 31
2Y 5.9922 925 20
3Y 6.0812 525 19
4Y 6.1879 350 12
5Y 6.2693 2,025 52
Total 13,875 176
Maturity Volume (Crs.)
Up to 3 years 1,805
3 to 7 years 5,339
7 to 10 years 38,265
More than 10 years 22,638
Total 68,046

Comparison of common yield curves
6.0%
6.5%
7.0%
7.5%
8.0%
8.5%
0 5 10 15 20 25 30
Spot
rate
Year
FIMMDA CCIL

Curve fitting
Coupon MaturityFIMMDA
price
Yield to
maturity
FIMMDA
price
FIMMDA price
errorCCIL price
CCIL price
error
7.59% 11/01/2026 1.0480 6.85 1.0570 0.86% 1.0313 1.59%
8.33% 09/07/2026 1.0725 7.24 1.1104 3.53% 1.0810 0.79%
6.97% 06/09/2026 1.0215 6.66 1.0180 0.35% 0.9888 3.20%
10.18% 11/09/2026 1.2194 6.97 1.2391 1.61% 1.2091 0.85%

Availability of data and G-Sec curve fitting
5.50%
6.00%
6.50%
7.00%
7.50%
8.00%
- 5 10 15 20 25 30
Yie
ld t
o m
atu
rity
(sem
i-annually
com
poundin
g)
Year
"Input data"
FIMMDA
CCIL

Time value of financial options and guarantees

Time value of financial options and guarantees – Key topics
Identification of products for which
there may be a TVFOG
Identify a method of assessing
the TVFOG
Develop an ESG
Stochastic modelling

Identification of products for which there may be a TVFOG (1)
Non-par savings plans
Participating plans
ULIPs
Term assurances
Group funds products
Annuities

Identification of products for which there may be a TVFOG (1)
Participating plans
ULIP – with guarantees
Group funds products

Identification of products for which there may be a TVFOG (2)
The key to deciding whether a TVFOG may be present is….. asymmetryAre the good scenarios as good as the bad scenarios are bad?
LiabilitiesAssets
LiabilitiesAssetsLiabilitiesAssets
Gain
Loss
Non-participating plan:
Net Gain Net Loss

Identification of products for which there may be a TVFOG (3)
LiabilitiesAssets
LiabilitiesAssets
LiabilitiesAssets
Gain
Loss
Participating plan:
Gain
Gain
Gain
Net Loss

Identification of products for which there may be a TVFOG (4)
Product Feature of the product that leads to asymmetry in shareholder return
Guaranteed maturity
benefits – ULIP
In low investment return scenarios, the insurer must honour the guarantee, even if the fund can no
longer support this.
Group traditional
products
The insurer must guarantee the account value on most exits, and market value adjustments may
be ineffective
Traditional
participating plans /
universal life
Annual bonuses are added to sum assured and maturity benefit. In low investment return
scenarios, the insurer must honour the accrued benefits, even if they are no longer supported by
asset shares
Highest NAV
guarantees - ULIP
The highest NAV guarantee is managed using Constant Proportion Portfolio Insurance (CPPI) and
losses can occur if the insurer cannot reverse out of equity positions before a crash – “Gap risk”
Reduction in yield –
ULIP & VIP
Insurers must offer products where the 'Reduction in Yield' is less than X% (where X% is given by
a table). This means that if the unit growth rate is 10%, the policyholder IRR must be at least (10-
X)%. Given that this can lead to the insurer having to add units to the fund in certain scenarios, an
asymmetric impact is observed.

Identify a method of assessing the TVFOG
Stochastic asset-liability
modelling
Assessing the implied
guarantee
Immaterial lines?
Option replication / replicating portfolio

-
0.5
1.0
1.5
2.0
2.5
3.0
3.5
4.0
4.5
Fund v
alu
e
Scenario 1 Scenario 2 Scenario 3
Deterministic scenarios

Stochastic asset-liability modelling – Develop an ESG
Decide on assets
Decide on a risk-neutral
projection model’
Find your calibrating information
Obtain external scenarios e.g. from a third party or from a group company
• Paucity of interest rate and equity derivatives
• Little information on corporate bonds
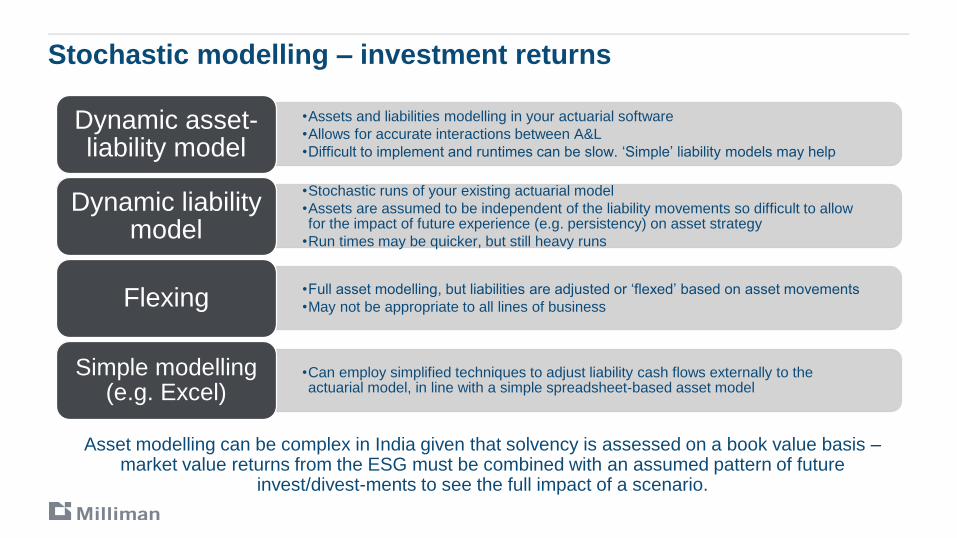
Stochastic modelling – investment returns
•Assets and liabilities modelling in your actuarial software
•Allows for accurate interactions between A&L
•Difficult to implement and runtimes can be slow. ‘Simple’ liability models may help
Dynamic asset-liability model
•Stochastic runs of your existing actuarial model
•Assets are assumed to be independent of the liability movements so difficult to allow for the impact of future experience (e.g. persistency) on asset strategy
•Run times may be quicker, but still heavy runs
Dynamic liability model
•Full asset modelling, but liabilities are adjusted or ‘flexed’ based on asset movements
•May not be appropriate to all lines of businessFlexing
•Can employ simplified techniques to adjust liability cash flows externally to the actuarial model, in line with a simple spreadsheet-based asset model
Simple modelling (e.g. Excel)
Asset modelling can be complex in India given that solvency is assessed on a book value basis –market value returns from the ESG must be combined with an assumed pattern of future
invest/divest-ments to see the full impact of a scenario.

Stochastic modelling – others
Participating fund bonus management framework?
Dynamic bonus rates
Any historic information?
Can we protect ourselves through choice of bonus methodology?
Dynamic policyholder
behavior

Cost of residual non-hedgeable risks

Cost of residual non-hedgeable risks – Key topics
Definition of non-hedgeable
capital
Projection of economic
capitalCost of capital
Company SBI Life ICICI Prudential HDFC Life Max Life
Cost of capital charge 5% 4% 3.5% 5%
CRNHR / PVFP 4.9% 3.1% 4.9% 11.7%

Identifying the economic capital
Most companies already doing some calculations for the IRDAI
Identify non-hedgeable risks from your economic capital. Non-hedgeable financial risks?
Solvency II is a common starting point
Common to make adjustments to the standard formula - How to find 99.5th percentile
risks?
How to allow for participating business?

Projection of economic capital (1)S
tress 1
Str
ess 2
Str
ess 2
Str
ess 1
1 2 3 4 5 6 7 8 9 10Year
Capital BEL

Projection of economic capital (2)
0%
50%
100%
150%
200%
250%
300%
PV Premiums PV Death benfits PV Surrender payments PV Expenses
PV Shareholder transfers Solvency margin IF PVFP

Sensitivities

Increase / decrease in reference rates by 100 bps
Increase / decrease in reference rates by 200 bps
Shock to the value of equities of -10%
Shock to the value of equities of -20%
25% in the swaption / equity volatilities used to value the options and guarantees
Investment assumptions
Expenses
Discontinuance -proportionate
Discontinuance –‘shape change’
Others
Minimum disclosures under APS 10
+/- 10% change in maintenance expenses
+/- 10% change in acquisition expenses
+/- 10% change in discontinuance (lapse, surrender, paid up etc.) rates
+/- 50% change in discontinuance (lapse, surrender, paid up etc.) rates
Mass lapsation of 25% and 50% of policies at the end of the surrender penalty period (ULIP)
+/- 50% change in discontinuance rates after the end of any surrender penalty period
An absolute increase / decrease of 5% in non-zero policy lapse rates
An increase / decrease of 5% (multiplicative) in the mortality / morbidity rates
Required capital set equal to the level of solvency capital
Assumed tax rate increased to match corporation tax rate for other industries

Overall
Sensitivities – scenario specific considerations (1)
Impact on asset values?
Impact on reserves?
Trade-off between high market value
adjustments and changing reserving
assumptions.
Where do you apply these sensitivities for
VNB?
Investment assumptions
LiabilitiesAssets
ANW
VIF
ANW
Liabilities
Assets
ANW
VIF
ANW
No change in reserving
assumptions
Change in reserving assumptions
Base scenario
LiabilitiesAssets
ANW
VIF
ANW ?
Decrease in reference rates
scenario

Sensitivities – scenario specific considerations (2)
Would you expect symmetrical results?
Investment assumptions
0%
20%
40%
60%
80%
100%
1 2 3 4 5 6 7 8 9 10
Sample survivorship under various proportional discontinuance
scenarios
Base Base +10% Base -10%
Base +50% Base -50%
Discontinuance -proportionate
Overall
How do you define “surrender penalty period”?
For new ULIPs, should this be applied at the
end of the 4th year or 5th year?
What about old ULIPs?
Should the mass lapse scenario be applied as an
addition or a replacement?
How do you define the “+/- 50% change in
discontinuance rates after the end of any surrender
penalty period” scenario? Only applicable for ULIPs?
How do you define “non-zero policy lapse rates”?
Are upper / lower caps required?
Investment assumptions
Discontinuance –‘shape change’
Others Any additional sensitivities (e.g. GST)?

Overall
Sensitivities – general considerations (3)
Where do you apply the sensitivity for VNB – at POS or as at the valuation date?
Do you change the reserving assumptions?
Do you re-do the CRNHR?
Do you re-do the TVFOG?
Do you re-do the other adjustments?

Analysis of movement
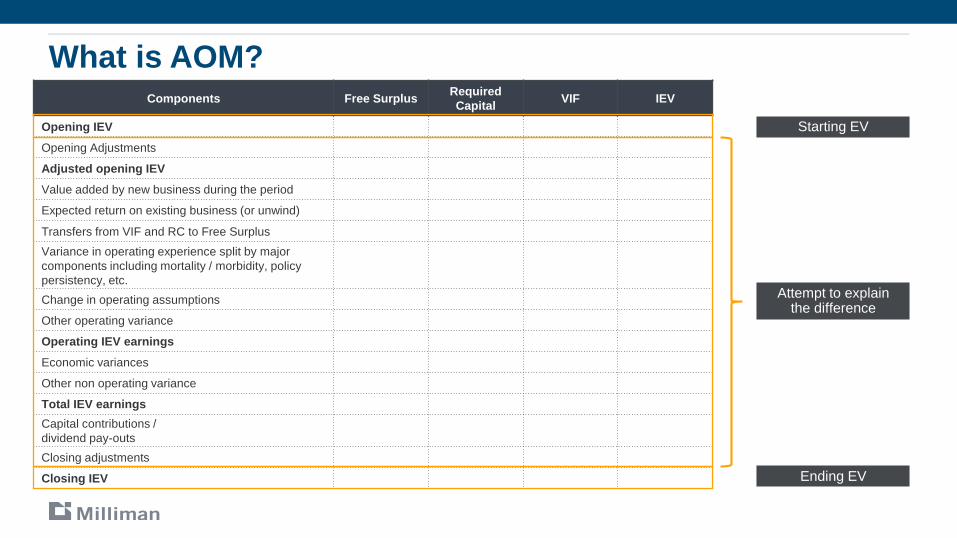
What is AOM?Components Free Surplus
Required
CapitalVIF IEV
Opening IEV
Opening Adjustments
Adjusted opening IEV
Value added by new business during the period
Expected return on existing business (or unwind)
Transfers from VIF and RC to Free Surplus
Variance in operating experience split by major
components including mortality / morbidity, policy
persistency, etc.
Change in operating assumptions
Other operating variance
Operating IEV earnings
Economic variances
Other non operating variance
Total IEV earnings
Capital contributions /
dividend pay-outs
Closing adjustments
Closing IEV
Starting EV
Ending EV
Attempt to explain the difference

AOM – changes from last valuationComponents Free Surplus
Required
CapitalVIF IEV
Opening IEV
Opening Adjustments
Adjusted opening IEV
Value added by new business during the period
Expected return on existing business (or unwind)
Transfers from VIF and RC to Free Surplus
Variance in operating experience split by major
components including mortality / morbidity, policy
persistency, etc.
Change in operating assumptions
Other operating variance
Operating IEV earnings
Economic variances
Other non operating variance
Total IEV earnings
Capital contributions /
dividend pay-outs
Closing adjustments
Closing IEV
Change in model / methodology
Change in operating assumptions:demographic /
expenses – BE and reserving.
Change in economic assumptions:
reference rates, inflation, valuation
interest rate

AOM – value of new businessComponents Free Surplus
Required
CapitalVIF IEV
Opening IEV
Opening Adjustments
Adjusted opening IEV
Value added by new business during the period
Expected return on existing business (or unwind)
Transfers from VIF and RC to Free Surplus
Variance in operating experience split by major
components including mortality / morbidity, policy
persistency, etc.
Change in operating assumptions
Other operating variance
Operating IEV earnings
Economic variances
Other non operating variance
Total IEV earnings
Capital contributions /
dividend pay-outs
Closing adjustments
Closing IEV
1. Reporting period surplus + contribution to closing VIF.
2. Consistency with reported VNB.
3. Dealing with unwind.

AOM – unwind and transfersComponents Free Surplus
Required
CapitalVIF IEV
Opening IEV
Opening Adjustments
Adjusted opening IEV
Value added by new business during the period
Expected return on existing business (or unwind)
Transfers from VIF and RC to Free Surplus
Variance in operating experience split by major
components including mortality / morbidity, policy
persistency, etc.
Change in operating assumptions
Other operating variance
Operating IEV earnings
Economic variances
Other non operating variance
Total IEV earnings
Capital contributions /
dividend pay-outs
Closing adjustments
Closing IEV
Split into:• Expected investment
income at opening reference rate
• Expected investment income using real world assumptions
• The amount of first year surplus expected in the opening VIF –i.e. transfer from VIF to FS
• Different in closing and opening RC
• Impact on IEV should be zero.
VIF(t) = [VIF(t+1) + CF(t)]/(1+FR(t+1))
VIF(t+1) = VIF(t) X [1+FR(t+1)] + CF(t)

AOM – variance in operating experienceComponents Free Surplus
Required
CapitalVIF IEV
Opening IEV
Opening Adjustments
Adjusted opening IEV
Value added by new business during the period
Expected return on existing business (or unwind)
Transfers from VIF and RC to Free Surplus
Variance in operating experience split by major
components including mortality / morbidity, policy
persistency, etc.
Change in operating assumptions
Other operating variance
Operating IEV earnings
Economic variances
Other non operating variance
Total IEV earnings
Capital contributions /
dividend pay-outs
Closing adjustments
Closing IEV
• Assess the impact on each component of IEV by changing each item of ‘expected’ experience during the reporting period to ‘actual’ one at a time.
• Difference between actual cash-flows from financial statements and ‘expected’ cash-flows is reflected in FS
• The impact on VIF represents the difference between expected and actual survivorship.
• The goal is to reduce operating variance (includes some items not considered above e.g. bonuses and unexplained)

Experience variance – approaches / considerations
Traditional approach
• Modify the actuarial model to allow for a different set of
assumptions during the reporting period.
• Update each assumption for the reporting period in the “opening”
model to closely match the “actual” experience and re-run the
actuarial model until the variance from the closing VIF is small.
• Allocate changes from each model run to the various sources of
surplus and adjust cash-flows in the first year using actual
financial statements.
Advantage:
• Easy to setup / understand.
Disadvantages:
• A lot of tweaking required to reduce “unexplained” variances in
closing VIF.
• Assumptions may need to be varied across products or even
more granular.
• Many re-runs might be required; slowing down results
production.
Data-led approach
• Modify the policy data to include opening and closing policy
statuses and dates of change, e.g. in-force to lapse, lapse to in-
force etc.
• Modify the actuarial model code to capture the impact on the
cash-flows form each status change.
• Run the actuarial model for each status change that should be
analysed to separate sources of surplus.
• The cash-flows during the reporting period should replicate the
actual revenue account, with some adjustments required.
• Unexplained is expected to be very low.
Advantage:
• One run should suffice; quicker results production.
Problems / disadvantages:
• Model setup and ongoing data development can be difficult to
understand / setup.
Other hybrid approaches

AOM – economic and other non-operating varianceComponents Free Surplus
Required
CapitalVIF IEV
Opening IEV
Opening Adjustments
Adjusted opening IEV
Value added by new business during the period
Expected return on existing business (or unwind)
Transfers from VIF and RC to Free Surplus
Variance in operating experience split by major
components including mortality / morbidity, policy
persistency, etc.
Change in operating assumptions
Other operating variance
Operating IEV earnings
Economic variances
Other non operating variance
Total IEV earnings
Capital contributions /
dividend pay-outs
Closing adjustments
Closing IEV
• Change in economic assumptions: reference rates, inflation, valuation interest rate
• Difference between ‘actual’ investment return earned and the ‘real world’ return considered in the unwind step.
• How do you allow for new business?
• Any items of variance not considered above –e.g. taxation?

AOM – additional itemsComponents Free Surplus
Required
CapitalVIF IEV
Opening IEV
Opening Adjustments
Adjusted opening IEV
Value added by new business during the period
Expected return on existing business (or unwind)
Transfers from VIF and RC to Free Surplus
Variance in operating experience split by major
components including mortality / morbidity, policy
persistency, etc.
Change in operating assumptions
Other operating variance
Operating IEV earnings
Economic variances
Other non operating variance
Total IEV earnings
Capital contributions /
dividend pay-outs
Closing adjustments
Closing IEV
Pay-outs from FS to shareholders or from shareholders into FS.
Not in common use in India – may be things like currency movements?

Other considerations
• Where do you allow for TVFOG?
• Where do you allow for CRNHR?
• Where do you allow for other adjustments?

AOM – key resultsComponents Free Surplus
Required
CapitalVIF IEV
Opening IEV
Opening Adjustments
Adjusted opening IEV
Value added by new business during the period
Expected return on existing business (or unwind)
Transfers from VIF and RC to Free Surplus
Variance in operating experience split by major
components including mortality / morbidity, policy
persistency, etc.
Change in operating assumptions
Other operating variance
Operating IEV earnings
Economic variances
Other non operating variance
Total IEV earnings
Capital contributions /
dividend pay-outs
Closing adjustments
Closing IEV
Return on EV measure used to measure company’s performance.
Value comes from:1. Unwind 2. VNB3. Operating variance
(hopefully small)
Actual measure of performance of a company, but economic variance is not totally in company’s control.

Utilising your work

Where can you utilize this work?
• Regular reporting:
Post IPO public disclosures
Building a narrative for shareholder’s / analysts
• Performance management – appraisals / ESOPs?
• Pricing based on IEV?
• Refining assumptions?
• Economic capital calculations using the CRNHR models?
• IFRS 17?
• ALM using the TVFOG models?
• Implicit check on policy data?

Questions?

Questions?

Thank you

Top Related
Copyright © 2022 FDOKUMEN

