


Bahasa
Halaman
Hukum


August 11, 2016
Creating A Premier Play on India’s Growth

2
Transaction Overview
Merger of Aditya Birla Nuvo Limited (“Aditya Birla Nuvo”)
into Grasim Industries Limited (“Grasim”)
Restructuring results in listing of our financial services
business
57% owned by post-merger Grasim and balance being held
by its shareholders (post-merger Grasim) on a
proportionate basis
1
2

3
A ‘play on the India growth story’ with
market leading manufacturing and services
businesses

4
Transaction Highlights
Consolidation of fast growing businesses with a
strong, stable cash flow portfolio
Value un-locking for shareholders via the listing of
financial services
Simplifies Group structure – consolidation of similar
businesses and stakes

5
Consolidated Financial Performance
Notes: Aggregate financials are only for illustrative purposes and may not be the exact presentation of consolidated accounts. EBITDA for Aditya Birla Nuvo has been adjusted for NBFC finance costs
Grasim Aditya Birla
Nuvo
PAT
Revenue
EBITDA
Aggregate
36,637
7,025
2,359
23,129
4,935
1,886
59,766
11,961
4,245
+
+
+
=
=
=
FY16 figures in Rs. Crores

6
Creating A Premier Play on India’s Growth
Merger of the businesses provides shareholders with a well-diversified portfolio
Cement, Financial Services and Telecom represent three high growth sectors in the economy – creating a play on India’s consumption story
Services
(32%)
Financial services
Financing
Insurance
Asset Management
Wealth Management
Payments Bank
Telecom
Manufacturing
(68%)
Textiles
Chemicals
Cement
Insulators
The Best Proxy to India’s Economy
Financial Services
15%
Telecom16%
Cement 42%
Textiles17%
Chemicals 9%
Others1%
Solar
(1) Textiles includes VSF & Pulp, VFY and Linen; (2) Chemicals includes Chlor-Alkali and Agri-Inputs; (3) Others includes Insulators, Solar Power; (4) Represents proportionate share of Grasim and Aditya Birla Nuvo in the revenues of Idea Cellular. Above aggregate financials are for illustrative purposes only.
Post-restructuring (Aggregate Revenue FY16)
Aggregate revenue: Rs. 61,475 crores (including proportionate share of Idea’s revenues in Grasim)
1
2
3
4

7
Making of A New Bluechip
Unique portfolio of businesses with a well-capitalized asset base, diversified revenue stream and strong cash-flow generation
Financial Strength
Operational Finesse
High Quality Management Team
Leadership Position Across Sectors
Strong Free Cash Flow From
Traditional Businesses
Large Asset Base with Well Capitalized and Strong Balance
Sheet
New Age Sectors Offering
Tremendous Growth
Prospects

8
Current Holding Structure
Grasim Aditya Birla Nuvo
Grasim
UltraTech Cement
OthersDivisions(4)
Promoters Public
31.3%(1) 68.7%(1)
Aditya Birla Nuvo
Promoters Public
58.4% 41.6%
Birla Sun Life
Insurance(3)
Idea Cellular
60.2% 51.0% 23.3%
2.3%
2.6%
4.7%
2.6%
Others
9.1%
1.6%
Aditya Birla Financial
Services (2)
100.0%
49.0%
51.0%
Note: Shareholding as of June 30, 2016(1) Includes GDRs listed on Luxembourg Stock Exchange; (2) Financial services businesses reside in separate subsidiaries / Joint Ventures under Aditya Birla
Financial Services Limited; (3) Aditya Birla Nuvo will enter into an agreement to transfer this stake to Aditya Birla Financial Services Limited subject to regulatory approvals; (4) Divisions have underlying investments
Aditya Birla Fashion & Retail
Aditya Birla Nuvo
Idea Cellular
Hindalco
Aditya Birla Fashion &
Retail
Hindalco
Payments Bank
Solar Power51.0%
Divisions (4)
NBFC
Housing Finance
Asset Management
General Insurance Advisory
Broking
Wealth Management
Private Equity
Online Money Management
Health Insurance
VSF & Pulp
Chemicals
Textiles
Textiles
Agri- Inputs
Rayon
Insulators
Financial Services

9
Resultant Holding Structure
1 Merger of Grasim and Aditya Birla Nuvo
Demerger of financial services business as a separate listed entity 2
Grasim + Aditya Birla Nuvo
60.2%57%
UltraTech Cement
Aditya Birla Financial Services
Idea Cellular OthersDivisions
Aditya Birla Fashion & Retail
Hindalco
Promoter Public
39% 61%
17%
26%
2
All of financial services including life insurance and payments bank
11.4%
4.3%
Textiles
Chemicals
Others (Insulators)
28.0%
1
Solar
51.0%

10
Resulting Swap Ratios
3 equity shares of Grasim for every 10 equity shares of Aditya Birla Nuvo
7 shares of Aditya Birla Financial Services for every 1 equity shares of Grasim (post merger)
For Illustrative Purposes
A shareholder holding 100 shares in Aditya Birla Nuvo will get 30 shares of Grasim and 210 shares of Aditya Birla Financial Services
A shareholder holding 100 shares in Grasim will continue to hold 100 shares in Grasim and in addition will get 700 shares of Aditya Birla Financial Services
(*) Pursuant to the sub division of the face value of equity shares of Grasim, the swap ratio will be adjusted accordingly

11
Post Merger Grasim…
• Largest Chlor-Alkali manufacturer in India
• One of the most energy efficient urea plants in India
• #1 cement company in India with largest selling brand
• Market leader in RMC and white cement
• Amongst the most profitable and fastest growing with pan-India operations
• Leading global player in VSF
• #1 producer and exporter of VFY in India
• India’s leading linen manufacturer
• Fastest growing large operator in India
• 3rd largest operator by revenue market share
• 16% shareholding in Indus, one of the world’s largest tower companies
• AUM of ~Rs. 196,545 crores (Q1FY17)
• Broad based portfolio with 12 lines of businesses
• Top 4 private sector life insurers & asset management companies in India
• One of the fastest growing large NBFCs with best-in-class asset quality
ChemicalsTextiles CementTelecomFinancial Services


13
Transaction Details
Advisors
Financial Advisor DSP Merrill Lynch Limited(1)
Independent Fairness Opinion
Grasim – JM Financial Institutional Securities Limited
Aditya Birla Nuvo – Kotak Mahindra Capital Company Limited
Legal Advisor Khaitan & Co (for overall transaction)
Cyril Amarchand Mangaldas (for Financial Services)
Joint IndependentValuers
Price Waterhouse & Co LLP
Bansi S Mehta & Co
(1) Financial advisor to Grasim
The transaction is subject to regulatory approvals including the Stock Exchanges; High
Courts (Madhya Pradesh & Gujarat); Competition Commission of India etc.
The transaction is likely to be completed by Q4 FY17 / Q1 FY18

14
Aditya Birla Financial Services – A Significant Non-Bank Financial Services Player
Aditya Birla Financial Services
Public
Life Insurance
Payments Bank
NBFC
Promoters
Among the top 5 fund managers in India (excl. LIC)
Rs. 196,545 crores Funds under management (As of Q1 FY17: Includes AUM of Life Insurance, Private Equity and quarterly average
AUM of Asset Management business)
Rs. 28,700 crores Lending book (incl. Housing
Finance)
Among the top 10 diversified private NBFCs in India
Among top 4 private sector life insurers and asset
management companies in India
#1 online personal finance management playerAMC
Broking (75%)
Insurance Advisory (50.01%)
Private Equity (100%)
Online Money Management
Serving 8.8mn customers through nationwide
distribution network of 1,350 points of presence
and > 120,000 channel partners
Grasim
17% 57% 26%
Others100%(1)
51%
51%
51%
Housing Finance
Health Insurance 51%
100%
(1) 0.2% stake will be directly held by Grasim

15
88,201
1,84,276
FY11 FY16
Aditya Birla Financial Services – Sound Growth in Key Metrics
AUM (Rs. Crores)

16
Overview of Businesses
NBFC – Robust Growth Profile With Quality Loan Book
AMC – Gaining Market Share Consistently
Among the top 10 diversified private NBFCs in India
Diversified portfolio with All-India presence
One of the lowest NPAs in the industry – GNPA 0.63% and 0.71% and NNPA 0.22% and 0.29% for FY16 and Q1FY17 respectively
Net worth of Rs. 3,823 crores (1) as of 30 June 2016
Loan Book of Rs. 26,267 crores as of 30 June 2016
AA+ credit rating
1,850
25,755
FY11 FY16
Loan book (Rs. Crores)
497
3,696
FY11 FY16
Net Worth (Rs. Crores)
196
2,442
FY11 FY16
Revenues (Rs. Crores)
37
409
FY11 FY16
Net Profit (Rs. Crores)

17
Life Insurance – Top 4 Private Life Insurer Portfolio of Other Businesses
Among top 4 private insurers in India (by APE) with new business market share of 8.4% in Q1FY17
#1 in group business with 25% market share in Q1FY17
Multi-channel distribution
Diversified product portfolio
Embedded Value of Rs. 3,275 crores with VNB margin of 15.2% (as of Mar-16)
19,760
30,811
Mar '11 Mar '16
AUM (Rs. Crores)
5,534
5,708
FY11 FY16
Revenues (Rs. Crores)
Aditya Birla Housing Finance: Commenced operations in October 2014 and currently has a loan book of Rs. 2,432 crores and Networth of Rs. 291 crores (June 2016)
Aditya Birla Insurance Brokers: Consistently gaining market share (0.5% in FY 12 growing to 1.7% in FY16); Premium placement of Rs. 1,600 crores in FY16
Aditya Birla Capital Advisors: Funds under management of Rs. 1,035 crores
Aditya Birla Health Insurance: 51:49 JV with MMI Holdings. Plans to launch services in H2FY17
Broking and wealth management player under the brand name “Aditya Birla Money”
MyUniverse is India’s #1 online personal finance management platform and 7th largest SIP distributor by numbers in India
Enjoying trust of > 2.6mn registered users who are managing > Rs. 20,000 crores through the platform
Payments Bank: 51:49 JV with Idea. Capitalising on Idea’s nationwide reach and subscriber base of ~183mn
Notes: APE: Annual Premium Equivalent = 100% of regular premium + 10% of single premium
Overview of Businesses (Cont’d)

18
Direct exposure to businesses with strong free cash flow generation – Cement & VSF
Larger capitalization with better liquidity
Value unlocking through the listing of the financial services business
Simplifies group structure and consolidates similar businesses and stakes
Option for shareholders to invest in Grasim post merger or directly into the operating companies
of the Group
Win-Win For All
Common Benefits
Benefits to Aditya Birla Nuvo Shareholders
Exposure to fast growing sectors – Financial Services & Telecom
Diverse portfolio of businesses with leadership positions
Long horizon of growth
Benefits to Grasim Shareholders

Thank You

Appendix
21
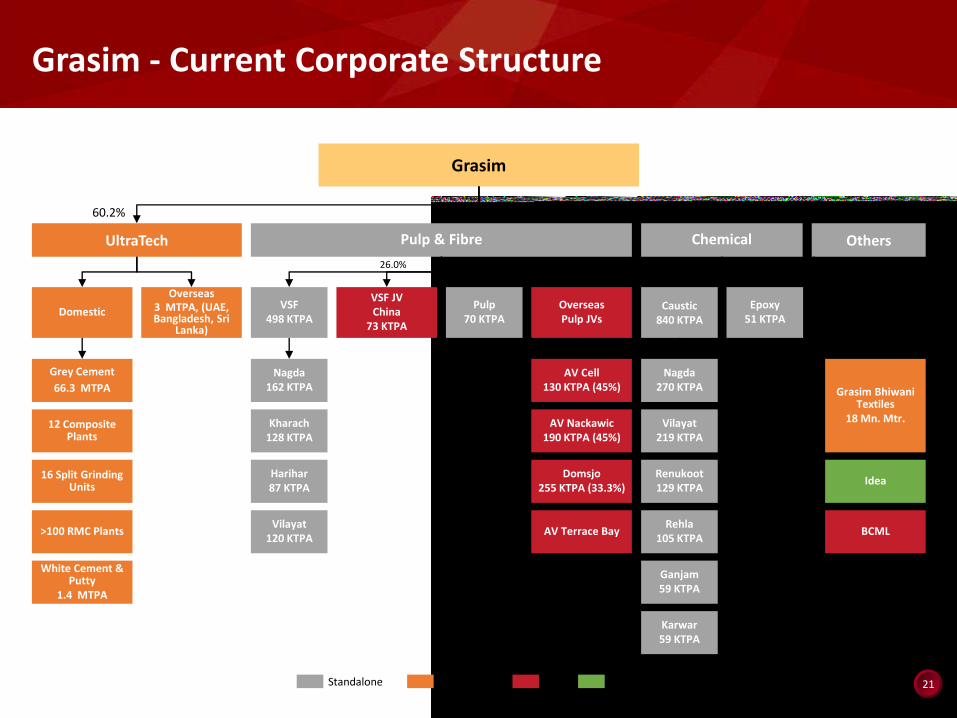
Grasim - Current Corporate Structure
Grasim Bhiwani Textiles
18 Mn. Mtr.
Idea
Others
BCML
Chemical
Grasim
Pulp & Fibre
VSF498 KTPA
VSF JVChina
73 KTPA
AV Terrace Bay
Domsjo 255 KTPA (33.3%)
AV Nackawic 190 KTPA (45%)
AV Cell 130 KTPA (45%)
Nagda162 KTPA
Kharach128 KTPA
Harihar87 KTPA
Vilayat120 KTPA
Pulp 70 KTPA
OverseasPulp JVs
Nagda270 KTPA
Vilayat219 KTPA
Epoxy51 KTPA
Caustic840 KTPA
Renukoot129 KTPA
Rehla105 KTPA
Ganjam59 KTPA
Karwar59 KTPA
UltraTech
Overseas3 MTPA, (UAE, Bangladesh, Sri
Lanka)
12 Composite Plants
16 Split Grinding Units
>100 RMC Plants
White Cement & Putty
1.4 MTPA
Grey Cement
66.3 MTPA
Domestic
Standalone Subsidiary JV Associate
60.2%
4.7%
26.0%
100.0%
26.0%

22
19,232 25,552
FY12 FY16
2,403 2,287
FY12 FY16
4,565 5,109
FY12 FY16
42.1 50.6 51.8
67.7
FY12 FY16
Production Capacity
India’s largest cement company -
~17% of India’s total capacity
Best positioned to capture the upside
The Largest Selling Brand
The Best Distribution Network
Cost Leadership
#1 RMC player in India with ~ 100
plants
#1 player of white cement & cement
based putty
Different products to provide
complete building solutions; > 1,200
stores
Post Ongoing Acquisition: 91.1mtpaCurrent: 69.3mtpa
UltraTech Cement – India’s Largest Cement Company
Business Highlights Key metrics
North 27%
East 17%
West 30%
South 22%
Overseas 4%
North 26%
Satna Cl. 13%
East 13%
West 22%
South 22%
Overseas 4%
Revenue (Rs. crores)Production (MT)
PAT (Rs. crores)EBITDA (Rs. crores)
Note: Production, capacity and financials all pertain to the consolidated entity

23
Chinese58%
Lenzing19%
Other ABG Group
8%
Grasim9%
Others5%
Integrated model with six
decades of experience
VSF market poised for
growth as textile
consumption in India
expected to grow
Grasim continues to focus
on expanding in domestic
market
Working closely to
leverage Liva brand
Focused on increasing
share of specialty
products
FY16 Revenue: Rs. 7,609 cr
FY16 EBITDA: Rs. 1,093 cr
Viscose Staple Fibre – Leading Global Player
Leading Global Player 5 VSF Plants and 5 Pulp Plants Across 4 Countries
VSF Business Global Market Share
VSF Plant - Own
VSF Plant - JV
VSF Plant - Group Cos.
Pulp Plant - Own
Pulp Plant - JV
• 4 VSF plants
• 1 Pulp plant
• 6 Caustic soda
plants
India
• 3 Pulp plants
JVs
Canada
• 2 VSF plants of
AVB Group Cos.
South East Asia
• VSF JV
China, Hubei
• Domsjo pulp plant
JV
Sweden
Sustainable Competitive Advantage through Integrated Business Model
Input % of Cost Capacity Requirement Met
Dissolving Grade Pulp 55% - 60% 645 ktpa 55% - 60%
Caustic Soda 10% - 15% 840 ktpa Fully captive
Power & Steam 10% 290 MW Fully captive
996 KTPA
424 KTPA
498 KTPA
Total AVB Group17% (922
KTPA)

24
NagdaVilayatKarwarRenukootRehlaGanjam�9Largest Chlor-alkali manufacturer in India�yCapacity: 840 ktpa�yCapacity to increase by 25% on brownfield expansion and debottlenecking�9Largest producer of epoxy resins in India�9Largest chlorine derivative value-added product portfolio �9Market share doubled since FY14 post merger of ABCIL & Vilayat greenfield capacity�9Continued growth prospects driven by demand from textiles, aluminum, soaps & detergents and paper industries �yFY16 Revenue( 2 ): Rs. 2,868 cr�yFY16 EBITDA: Rs. 7 4 7 c rGrasim plantsABCIL Plants1 1 %1 3 %2 2 %FY14FY15FY163 1 44 0 97 6 3FY14FY15FY162 9 94 6 4Chemicals -Largest Chlor-Alkali ManufacturerBusiness Highlights Market Share and Volume Doubled Since FY14Market Share( 1 )�^���o���•���s�}�o�µ�u�����~�Z�ì�ì�ì���d�}�v( 3 )(1)Source : AMAI and Company data. Market share refers to the total demand including imports(2)Revenues excludes inter-segment sales (3)Includes captive consumption

25
Aditya Birla Nuvo - Current Corporate Structure
Notes: Percentage figures indicated above represent ABNL’s Shareholding in its subsidiaries/JV’s; Major investments include 9.1% stake in Aditya Birla Fashion & Retail Ltd.
Standalone Subsidiary JV
49.0%
51.0%
Aditya Birla Nuvo
Life InsuranceAditya Birla Financial
Services Solar Power
51.0% 100.0%23.3% 51.0%
Payments Bank
Telecom
NBFC
Housing Finance
AMC
General Insurance Advisory
Broking/Wealth Management
Private Equity
Online Money Management
Health Insurance (JV)
Divisions
Jaya Shree
Agri
Rayon
Insulators
Finance services

26
19,489
35,935
26%
37%
15%
25%
35%
45%
0
10,000
20,000
30,000
40,000
FY12 FY16Revenues EBITDA Margin
Fastest growing telecom operator in the world’s most attractive telecom market
Idea Cellular – Fastest Growing Telco in India
#3 mobile operator with ~183 million (VLR) subscribers
3G / 4G spectrum covering 87% of revenues Entering digital content services
16% shareholding in Indus. One of the world’s largest tower companies
Pan India Operator with Competitive 3G/4G Spectrum
Robust Financial Performance Consistent Gains in Market Share
(Rs. cr)
14.3%
18.9%
15.4%
19.6%
FY12 FY16
Revenue Market Share
Active Subscriber Market Share
Strong Data Growth
5.6% 8.9%
14.6% 19.4%
FY13 FY14 FY15 FY16
Data as a % of Service Revenues
3G + 4G Coverage
3G Coverage2G Coverage
4G Coverage
Notes: Subscriber numbers and market share based on VLR

27
141175
FY 12 FY 16
211 209
FY12 FY16
128
266
FY12 FY16
67114
FY12 FY16
Jaya Shree Indo-Gulf FertilisersIndian Rayon
Market Position
Opportunity & Outlook
1,046 1,459
FY 12 FY 16
2,1072,498
FY12 FY16
Revenue(Rs. crores)
EBITDA(Rs. crores)
Aditya Birla Nuvo – Other Businesses
India’s #1 Linen player
Leading manufacturer of wool tops & worsted yarn
8th largest urea manufacturer
Amongst top 2 energy efficient urea plants in India
Aditya Birla Insulators
Largest manufacturer & exporter of VFY in India
India’s largest & world’s 4th largest manufacturer
70% of linen yarn demand in India is met through imports
Acute deficit of urea in India – 28% of demand via imports during FY 16
Gas pooling policy will benefit the urea sector
Premium is driven by quality & value added yarns
Indian market continues to favour fine & super fine denier yarn
Long term anti-dumping duty (till September 2019) to benefit domestic manufacturers
680 928
FY12 FY16
468 581
FY12 FY16
44% 30% 11% 22%ROACE (FY16)

28
Disclaimer
This presentation has been prepared by Grasim Industries Limited ("Grasim"), Aditya Birla Nuvo Limited (“ABNL”) and Aditya Birla Financial Services Limited ("ABFSL") for informationpurposes only in relation to a potential arrangement between Grasim, ABNL and ABFSL pursuant to a scheme of arrangement and is solely for the use of persons to whom it isaddressed. By attending the meeting where this presentation is made, or by reading the slides of this presentation, you agree to be bound by the following conditions.
This presentation and its contents are confidential and should not be distributed, published or reproduced, in whole or part, or disclosed by recipients directly or indirectly to anyother person. This presentation (including any oral briefing and any question-and-answer in connection with it) is not intended to, and does not constitute, represent or form part ofany offer, invitation or solicitation of any offer to purchase, otherwise acquire, subscribe for, sell or otherwise dispose of, any securities or the solicitation of any vote or approval inany jurisdiction. No shares are being offered to the public by means of this presentation. The release, presentation, publication or distribution of this presentation in jurisdictions otherthan India may be restricted by law and, accordingly, recipients of this presentation represent that they are able to receive this presentation without contravention of any unfulfilledregistration requirements or other legal restrictions in the jurisdiction in which they reside or conduct business or have received this presentation. Any persons who are subject to thelaws of any jurisdiction other than India should inform themselves about and observe any applicable requirements. Any failure to comply with these restrictions may constitute aviolation of applicable laws. Accordingly, any persons in possession of this presentation should inform themselves about and observe any such restrictions.
No statement in this presentation (including any statement of estimated synergies) is intended as a profit forecast or estimate for any period and no statement in this presentationshould be interpreted to mean that cash flow from operations, free cash flow, earnings, earnings per share basis for any of Grasim or ABNL, as appropriate, for the current or futurefinancial years would necessarily match or exceed the historical published cash flow from operations, free cash flow, earnings, earnings per share or income on a clean current cost ofsupplies basis for any of Grasim, ABNL or ABFSL, as appropriate.
This presentation includes statements that are, or may be deemed to be "forward-looking statements" and other estimates and projections with respect to management’s subjectiveviews of the anticipated future performance, financial condition, results of operations and businesses of Grasim, ABNL or ABFSL. Forward-looking statements are statements of futureexpectations that are based on management’s current expectations and assumptions and involve known and unknown risks and uncertainties inter alia relating to price fluctuations,changes in demand, currency fluctuations, competition, environment, international sanctions, political, legislative, fiscal and regulatory developments etc. as a result of which actualresults, performance or events may differ materially from those expressed or implied in these statements. Forward-looking statements include, among other things, statementsconcerning the potential exposure of any of Grasim, ABNL or ABFSL to market risks and statements expressing management’s expectations, beliefs, estimates, forecasts, projectionsand assumptions including as to future potential cost savings, synergies, earnings, cash flow, return on average capital employed, production and prospects. All forward-lookingstatements contained in this presentation are expressly qualified in their entirety by the cautionary statements contained or referred to in this section. No assurance can be given thatthe forward-looking statements in this presentation will be realised. None of Grasim, ABNL or ABFSL undertakes any obligation to provide the results of any revisions or updates to anyforward-looking statements in this presentation that may occur due to any change in its expectations or to reflect events or circumstances after the date of this presentation (exceptto the extent required by applicable law or regulation or any appropriate regulatory authority). As a result of such risks, uncertainties and assumptions, recipients should not placeundue reliance on these forward-looking statements as a prediction of actual results or otherwise. These projections have not been independently verified.
INFORMATION PRESENTED HERE IS NOT AN OFFER FOR SALE OF ANY EQUITY SHARES OR ANY OTHER SECURITY OF GRASIM AND/OR ABNL
This presentation is not for publication or distribution, directly or indirectly, in or into the United States, Canada or Japan. These materials are not an offer of securities for sale in orinto the United States, Canada or Japan
Copyright © 2022 FDOKUMEN

