


Bahasa
Halaman
Hukum

Contracting out schools at scale: evidence from Pakistan
Article (Published Version)
http://sro.sussex.ac.uk
Crawfurd, Lee (2018) Contracting out schools at scale: evidence from Pakistan. RISE Working Paper Series.
This version is available from Sussex Research Online: http://sro.sussex.ac.uk/id/eprint/71897/
This document is made available in accordance with publisher policies and may differ from the published version or from the version of record. If you wish to cite this item you are advised to consult the publisher’s version. Please see the URL above for details on accessing the published version.
Copyright and reuse: Sussex Research Online is a digital repository of the research output of the University.
Copyright and all moral rights to the version of the paper presented here belong to the individual author(s) and/or other copyright owners. To the extent reasonable and practicable, the material made available in SRO has been checked for eligibility before being made available.
Copies of full text items generally can be reproduced, displayed or performed and given to third parties in any format or medium for personal research or study, educational, or not-for-profit purposes without prior permission or charge, provided that the authors, title and full bibliographic details are credited, a hyperlink and/or URL is given for the original metadata page and the content is not changed in any way.

Fundedby:
Contracting Out Schools at Scale: Evidence from Pakistan
Lee Crawfurd
RISE-WP-18/022
WORKING PAPER Apri l 2018
Thefindings,interpretations,andconclusionsexpressedinRISEWorkingPapersareentirelythoseoftheauthor(s).CopyrightforRISEWorkingPapersremainswiththeauthor(s).www.riseprogramme.org

Contracting Out Schools at Scale: Evidence from Pakistan
Lee Crawfurd*
April 2018
Abstract Can governments contract out the management of schools to private operators at scale? This paper estimates the effect of a school reform in Punjab, Pakistan, in which 4,276 poorly performing public primary schools (around 10 percent of the total) were contracted out to private operators in a single school year. These schools remain free to students and the private operator receives a per-student subsidy equivalent to less than half of spending in government schools. Using a difference-in-difference framework we estimate that enrolment in converted schools increased by over 60 percent. Converted schools see a slight decline in overall average test scores, but this may be a composition effect rather than a treatment effect. Schools with the same number or fewer students as in the previous year saw no change in average test scores. Keywords: Charter Schools, Difference-in-difference, Pakistan, PPPs, Public-Private Partnerships JEL Codes: I25, O15 * University of Sussex & Ark Education Partnerships Group. [email protected] I’m grateful for helpful comments and advice to Andy McKay, Iftikhar Hussain, Abhijeet Singh, Jishnu Das, Justin Sandefur, Edward Davis, Ahmad Jawad Asghar, Nadia Naviwala, Rahila Fatima, Imtiaz Dossa and Maryam Akmal. All errors are my own.

2
1. Introduction
The number of children attending private schools in low and middle-income
countries more than doubled between 2000 and 2015, growing at around 5 percent
per year (compared to growth of 0.2 percent per year in government schools).
Though private schools may offer some benefits over government schools, they are
typically inaccessible to the poorest households due to higher fees. Many
governments have responded by experimenting with different forms of public
financing for privately operated schools.
Can public-private partnerships provide equitable access to cost-effective private
schools, and if so what types of arrangements are most effective? In advanced
economies, evidence increasingly suggests that charter schools are a more promising
form of market-orientated school reform than vouchers (Epple et al., 2017) (Epple et
al., 2016). Evidence from developing countries is more positive on vouchers and
subsidies for private schools (Aslam et al., 2017) (Shakeel et al., 2016), but given the
limited number of studies it is not yet possible to make a clear distinction between
the effectiveness of different types of model. As yet there is no rigorous study on a
large scale Charter-style public school management programme in a low or middle-
income country, in which contexts the capacity of the state to manage effective
procurement and regulation are likely to be particularly low. One study looks at the
Partnership Schools for Liberia (PSL) pilot which involved 93 schools in its first year,
with a randomized evaluation finding strong impacts on learning, but with high and
potentially unsustainable costs, and from a sample of schools that were relatively

3
easier to access than the average school in the country (Romero et al., 2017). Two
other studies have looked at the Colombia Colegios en Concesión (CEC) programme
that involved 25 schools, suggesting that these schools outperform traditional public
schools in test scores, driven by a longer school day (Bonilla-Angel, 2011) (Termes et
al., 2015). Another looks at the Pakistan ‘Adopt a School’ programme with around
1,000 schools in Punjab and 500 schools in Sindh but presents only descriptive
analysis without making claims for causal inference (Malik et al 2015). In higher
income countries, there is a wider literature on similar programmes, which have
grown to around 7,000 charter schools in the US over 26 years (Epple et al., 2016),
and around 5,000 academies in the UK over 16 years (Eyles et al., 2017).
In this study we provide the first causal estimates of the effect of the Punjab Public
School Support Programme (PSSP), which involved the largest ever number of public
schools being contracted out to private management in a single year - 4,276 schools.
We estimate the causal effect of school conversion on enrolment using a difference-
in-difference estimator, comparing early converters to later converters. We find a
large increase in enrolment, concentrated in Katchi (Kindergarten). Overall there is a
decline in exam scores in converting schools, though we present some evidence that
this may be driven by the entry of new lower performing students. For schools that
entered the same or fewer exam candidates than in the previous year, there was no
change in test scores.

4
2. Pakistan context
Like many low and middle-income countries around the world, Pakistan faces a
learning crisis. 43 percent of Grade 3 children in rural Punjab are unable to read a
simple sentence in Urdu aimed at Grade 2 students (ASER Pakistan, 2017). 73
percent of primary age children (aged 6-10 years old) are in school, with a further 11
percent in pre-primary and 16 percent never having attended any kind of school1.
Private schooling began to expand in Pakistan in the 1990s – the share of private
schooling in total enrolment doubled from 15 to 30 percent between 1991 and 2001.
Private school teachers are more likely to be female, lower paid than government
teachers, and with less security of tenure (Andrabi et al., 2008). Pakistan also has a
long history of government engagement with the non-state sector in education. The
federal education policy of 1972 declared “education will be made free and universal
up to Class X [10] for all children throughout the country ... in both Government and
privately-managed schools. Private schools will be suitably supported for the loss of
fees incurred by them” (Bengali, 1999). This position was repeated in 1992 when a
new policy “declared the State's intent for emphasizing the private sector's role in
education through “viable partnership[s]” … and reiterated strongly in 2001:
“Acknowledging the shift in government's role from being a provider to a facilitator
[…] it is vital to rethink the parameters of public private partnership in the provision
of education” (Malik et al., 2015).
1 Pakistan Social And Living Standards Measurement Survey (PSLM) 2014-15

5
Most Public Private Partnerships (PPPs) in Pakistan have been either subsidies for
private schools to enable them to accept more pupils, or vouchers targeted at
students to enable them to attend private schools. More recently provincial
governments have begun to explore ‘contract management’ PPPs akin to US Charter
and UK academy schools, in which private organisations are contracted to take over
the management and operations of existing public schools, which remain
government owned, financed, and regulated.
Figure 1: Private school participation rate age 6–10, 1998-2011
Source: (Nguyen and Raju, 2014)

6
Table 1: Enrolment by Class, Children Aged 6-10, Punjab
Government Non-State Total Percentage Never attended 1,926 0.16 Less than 1 626 671 1,297 0.11 Class 1 1,541 1,258 2,799 0.23 Class 2 1,311 1,014 2,324 0.19 Class 3 941 804 1,745 0.14 Class 4 602 499 1,100 0.09 Class 5 313 326 639 0.05 Class 1 - 5 4,707 3,901 8,608 0.71 Class 6 + 130 128 258 0.02 Total 12,088 1 Data from the Pakistan Social and Living Standards Measurement Survey 2014-15
Education PPPs in Punjab are managed by the Punjab Education Foundation (PEF),
itself a quasi-independent body. PEF was established in 1991, and made
autonomous in 2004. PEF has three main programmes of support for private schools,
all of which have grown over the past decade. The largest programme is the
Foundation Assisted Schools, through which 1.8 million children are educated in
registered private schools, with fees paid by PEF. The Education Voucher Scheme
supports 400,000 children. PEF also has a New School Programme, which has
contracted private organisations to build around 2,000 schools in remote and under-
served areas, which have enrolled 200,000 students.
7
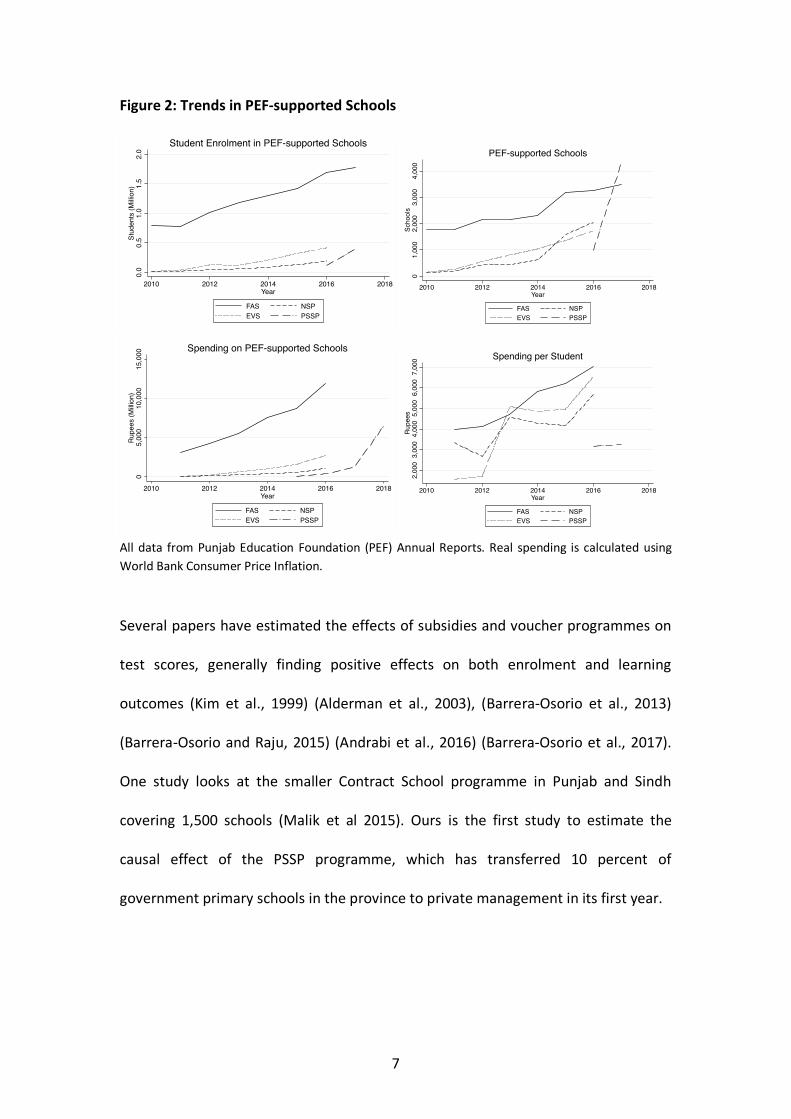
Figure 2: Trends in PEF-supported Schools
All data from Punjab Education Foundation (PEF) Annual Reports. Real spending is calculated using World Bank Consumer Price Inflation.
Several papers have estimated the effects of subsidies and voucher programmes on
test scores, generally finding positive effects on both enrolment and learning
outcomes (Kim et al., 1999) (Alderman et al., 2003), (Barrera-Osorio et al., 2013)
(Barrera-Osorio and Raju, 2015) (Andrabi et al., 2016) (Barrera-Osorio et al., 2017).
One study looks at the smaller Contract School programme in Punjab and Sindh
covering 1,500 schools (Malik et al 2015). Ours is the first study to estimate the
causal effect of the PSSP programme, which has transferred 10 percent of
government primary schools in the province to private management in its first year.
0.0
0.5
1.0
1.5
2.0
Stud
ents
(Milli
on)
2010 2012 2014 2016 2018Year
FAS NSPEVS PSSP
Student Enrolment in PEF-supported Schools
01,
000
2,00
03,
000
4,00
0Sc
hool
s
2010 2012 2014 2016 2018Year
FAS NSPEVS PSSP
PEF-supported Schools0
5,00
010
,000
15,0
00R
upee
s (M
illion
)
2010 2012 2014 2016 2018Year
FAS NSPEVS PSSP
Spending on PEF-supported Schools
2,00
03,
000
4,00
05,
000
6,00
07,
000
Rup
ees
2010 2012 2014 2016 2018Year
FAS NSPEVS PSSP
Spending per Student

8
Table 2: Literature on Public-Private Partnerships in Pakistan
Author Date Province PPP Type Outcome Type
Outcome Study Type
Alderman et al 2003 Balochistan Subsidy Enrolment Positive RCT Amjad & Macleod 2014 National Subsidy &
Voucher Learning Positive OLS
Andrabi et al 2016 Punjab Subsidy Learning Positive RCT Barrera-Osorio et al
2013 Sindh Subsidy Learning Positive (0.16 SD)
RCT
Barrera-Osorio and Raju
2015 Punjab Subsidy Enrolment Positive RD
Kim et al 1999 Balochistan Subsidy Enrolment Positive RCT Malik et al 2015 Punjab &
Sindh Contract Schools
Learning Positive PSM
The Public School Support Programme (PSSP)
The province of Punjab is the largest of the four provinces in Pakistan, with a
population of 110 million people. Education policy is substantially decentralized from
the federal government to the provincial governments. In December 2015 the
Punjab government announced that around 5,000 failing government schools (10
percent of all primary schools in the province) would be transferred to private
operators, as part of the Public School Support Programme (PSSP). Phase 1 began at
the start of the school year in April 2016, with Phase 2 beginning after the summer
break in August 2016, and Phase 3 beginning at the start of the next school year in
April 2017. So far 4,276 schools with around 400,000 students have been
transferred. Schools were tendered competitively, with eligibility criteria laid out for
two categories of bidders – organisations (non-governmental organisations (NGOs)
and existing school operators), and individuals. Government received 19,000
applications for the first phase of 1,000 schools. Organisations, particularly those
with experience running schools, were prioritized in the bidding process over

9
individuals. There are now around 2,600 schools contracted to organisations (with
each having at least ten schools) and 1,700 schools contracted to individuals.
Organisations are paid 700 Pakistani Rupees per child per month, and individual
operators 550 Rupees2. This is equivalent to less than half of government per pupil
spending in public schools (1,507 Rupees per pupil per month)3. Students may enter
Katchi (Kindergarten) at age four. Each PSSP school has a 2-year contract with PEF,
with renewal subject to adequate performance on ‘Quality Assurance Tests’ (QATs).
PSSP schools are spread across the province, as shown in Figure 3.
Figure 3: Map of Treatment and Control Schools
Note: We refer here to phase 1 schools as “treatment” and phase 3 as “control”.
2 550 Rupees is the same amount provided to private schools through the Foundation Assisted Schools (FAS) programme (reaching 1.8 million students), and the Education Voucher Scheme (EVS) (reaching 0.5 million students). 3 Institute of Social and Policy Sciences report on Public Financing of Education in Pakistan 2010-11 to 2016-17.
Control (1903)Treatment (922)

10
On paper PSSP schools are not allowed to charge fees, make profit, or select their
students. They are allowed to hire their own teachers and head teachers, at market
salaries (which are typically less than half of government teacher salaries). Existing
government teachers were given the option of being transferred to other
government schools. PSSP schools teach the regular curriculum, and their students
sit both the Grade 5 exams administered to students in both public and private
schools by the Punjab Examinations Commission (PEC), as well as the Quality
Assurance Test (QAT) exams administered to PEF-partnering private schools for all
grades. PSSP schools must meet minimum standards in the QAT for continued
participation in the programme, and may be eligible for financial bonuses for good
performance. The Punjab government School Education Department (SED) maintains
ownership of school buildings, and responsibility for maintenance of facilities. PSSP
school operators are required to submit quarterly expenditure statements detailing
how income from government was spent. Payments are made monthly to school
bank accounts. For the first six months schools are due a fixed amount regardless of
enrolment – after this period they are due a variable amount based on the number
of enrolled students (regardless of grade). Schools continue to teach in the existing
medium of instruction, using textbooks provided by the Schools Education
Department (SED) or PEF. Students wear the same uniforms as worn in government
schools.
Schools were eligible to be selected into the programme if they fulfilled any one of a
set of five criteria primarily around enrolment and learning outcomes - being either
overcrowded, under-utilised, with low enrolment, low standardized passing rates, or

11
being fully non-functional. Overall 10,664 schools fulfilled one of these criteria,
leaving a large number of schools that may still be selected into any future Phase 4.
Schools were recommended for transfer by Executive District Officers (EDOs) for
education. The process for selection of schools by EDOs within each category is
unclear.
Table 3: PSSP Selection Criteria
Criteria Definition Schools
selected (Phase 1 – 3)
All Eligible Schools in
Punjab
% Selected
1. Multi grade & over crowded
1 teacher, requires additional classrooms, & enrolment above 80
103 943 11%
2. Under utilized 2 or more teachers & enrolment below 30 430 1,464 29% 3. Low enrolment Grade 1-5 enrolment below 21 1,504 5,320 28%
4. Poor learning outcomes
0% PEC passing rate (Phase I handover) or Less than 25% PEC passing rate (Phase II handover)
872 1,317 66%
5. Non-functional & closed
Non-operational / Merged 520 1,620 32%
Total 3,429 10,664 32%

12
3. Data and Methodology
Methodology
Our key challenge in estimating the causal effect of school conversion is finding an
appropriate counterfactual. As schools were selected for PSSP based on low
enrolment and exam scores, they are not comparable to non-PSSP schools.
We use a standard difference-in-difference strategy similar to that used by
(Abdulkadiroğlu et al., 2016) and (Eyles et al., 2017) in the context of US Charter
school and UK Academy converters, respectively, comparing the change in outcomes
for early converting schools with the change in outcomes for slightly later
converters. We treat schools converted in Phase 1 as treatment schools, and schools
selected later in Phase 3 as control schools, focusing on the difference in outcomes
for the one school year when Phase 1 treatment school had already been converted
and Phase 3 control schools were not yet. Both treatment and control schools were
selected into the programme according to the same criteria.
We estimate the following standard difference-in-difference equation in which T is a
binary indicator for treatment status, ‘Post’ is a binary indicator for pre or post
status, 𝜸𝒊 are school fixed effects, δt are year fixed effects, and our main coefficient
of interest is 𝜷𝟑 looking at the effect of the interaction between treatment and post.
The key identifying assumption is that trends in the outcome would be the same in
our treatment and control schools in the absence of the treatment. We can test

13
these common trends assumption using data on pre-assignment trends in school
enrolment, to determine if they were parallel.
yit=α+β1Tit+β2Postit+β3TitPostit+γi+δt+εit
Enrolment Data
We use data on enrolment from three sources; the Government Annual School
Census, monthly monitoring data, and data collected from ASER.
The primary source is the annual Government of Punjab School Census data (also
known as Education Management Information System (EMIS) data). This is reported
by all headteachers in October each year4, and includes information on student
enrolment by grade, facilities, staffing, and location. The main weakness of the EMIS
data for our purpose is that the outcome variable of interest (enrolment) is self-
reported by schools. We address this by cross-checking the data against other
sources. We compile EMIS data for all schools from 2012-13 to 2017-18.
Monitoring and Evaluation Assistants (MEAs) from the Programme Monitoring and
Implementation Unit (PMIU) of the School Education Department visit schools each
month and directly observe student enrolment, teacher presence, and the
availability of utilities. A team of 856 monitors covers 47,725 government schools
(on average 56 schools each). Data is entered using a tablet-based mobile app,
4 For 2017 we use enrolment data from monthly independent monitors collected from schools.

14
allowing for built-in validation checks. The correlation between enrolment reported
by headteachers through the EMIS and reported by the independent monitors is 0.8.
The Annual Status of Education Report (ASER) is a citizen-led survey of students and
schools. The survey covers over 250,000 children each year, tested at their home
rather than at school in order to capture those not enrolled. The survey also gathers
basic data about the government and private schools that are available to children,
including school enrolment. The survey is conducted between September and
November each year. The ASER dataset is limited to a sample of 734 schools in
Punjab, of which fewer than 20 are PSSP schools. However the dataset does allow
for the comparison of figures for the 734 Punjab schools in both datasets. There is a
high correlation (0.94) between the number of teachers reported in the EMIS and
ASER datasets.
Learning Data
For learning we use three different sources of data, from the Punjab Examinations
Commission (PEC), the PMIU Learning and Numeracy Drive (LND), and the Punjab
Education Foundation (PEF) Quality Assurance Tests (QAT).
The primary source is the Punjab Examinations Commission (PEC) data. All students
in both government and private schools are tested at Grade 5 and Grade 8 if they
want to progress to the next level of schooling. These exams are high stakes for the
student but not for the school. Exams are sat in February each year. Students must

15
be at least 8 years old to sit the Grade 5 exam. The Grade 5 exam is 1 hour long, with
a total of 34 items (questions), of which 30 are multiple-choice focused on
knowledge and 4 are open ended focused on comprehension. PEC reports average
percentage marks (from 1 – 100) for exam candidates from each school in five
subjects; Urdu, Maths, English, Science, and Islam. We standardize test scores by
subject and year.
Second, we also use Learning and Numeracy Drive (LND) collected on a monthly
basis for a sample of Grade 2 and 3 students by PMIU staff.
Third, PEF collects test data from all of the (mostly private) schools under its
jurisdiction, as part of its accountability framework. At the primary school level tests
are conducted in two randomly selected classrooms. Students sit a two hour exam
covering four subjects; English, Urdu, Science, and Mathematics. Schools which fail
two consecutive QATs lose their entitlement to public funds. For a school to pass, at
least half of students must get at least 40 percent of the available marks on the test.
In our data, we have the average pass mark for all students at each school. The
majority of schools in the PSSP first phase were managed by non-governmental
organisations. Of these schools, 43 percent passed the QAT (Table 4). Schools are
provided with model papers and past exam papers to enable them to prepare
students for the exams.

16
Table 4: QAT Pass Results for Phase 1 NGO Schools
Schools
Percentage of schools
passing All Phase 1 NGO Schools 626 0.43 Ghazali Education Trust 30 0.90 Learning Zone 10 0.80 National Rural Support Programme (NRSP) 100 0.60 Idara-e-Taleem-o-Aagahi (ITA) 30 0.53 Akhuwat 100 0.41 Punjab Rural Support Programme (PRSP) 70 0.41 CARE Foundation 100 0.40 The Citizens Foundation (TCF) 80 0.36 Ghazali Society 45 0.24 Developments in Literacy (DIL) 31 0.19 Muslim Hands 30 0.13
Phase 1 (Treatment) schools began operation at the start of the school year in April
2016. The primary outcome data we use comes from the following year EMIS
collected in October 2016 (6 months after conversion) and PEC exams from February
2017 (10 months after conversion). Phase 3 (Control) schools then began operations
at the start of the school year in April 2017. We discard data on Phase 2 schools that
began 4 months into the school year and therefore may have faced considerable
disruption.

17
Table 5: Data and Programme Timing
Month PSSP Programme Enrolment Data Learning Data
EMIS MEA ASER PEC LND QAT Oct-15 2015-16 Y Nov Y Dec Jan-16 Feb G5 Mar Apr Phase 1 (Treatment) Starts May Jun Jul Aug Sep Y Oct 2016-17 Y Nov Y Dec Jan-17 Y G2-3 Feb Y G5 G2-3 Mar Y G2-3 P1 Endline Apr Phase 3 (Control) Starts Y G2-3 P3 Baseline May Y G2-3 Jun Jul Aug Y G2-3 Sep Y Y G2-3
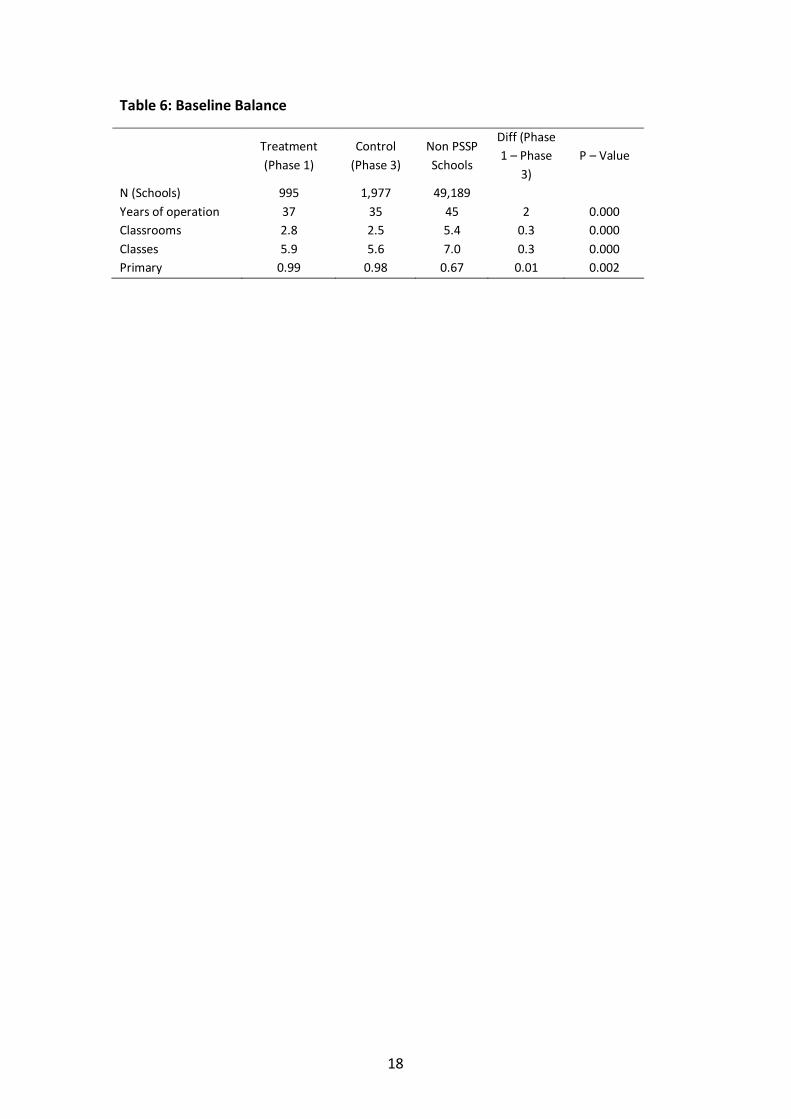
Although our identification does not rest on baseline balance in covariates between
schools, we nonetheless present baseline descriptive statistics between the groups
of schools. The differences between the treatment and control schools are
statistically significant but small, across prior enrolment, years of operation, number
of classrooms and classes, and statistically insignificant between the number of
books. PSSP schools (both treatment and control) are however clearly different to
the average school across the whole state. PSSP schools are almost all primary
schools, compared to 67% of all Punjab schools, and PSSP schools are much smaller
on average.
18
Table 6: Baseline Balance
Treatment (Phase 1)
Control (Phase 3)
Non PSSP Schools
Diff (Phase 1 – Phase
3) P – Value
N (Schools) 995 1,977 49,189 Years of operation 37 35 45 2 0.000 Classrooms 2.8 2.5 5.4 0.3 0.000 Classes 5.9 5.6 7.0 0.3 0.000 Primary 0.99 0.98 0.67 0.01 0.002

19
4. Results
Our empirical strategy rests on the assumption that Phase 3 schools can serve as a
valid control group for Phase 1 schools. We do not need schools to have the same
level of prior enrolment, but the same trends. In the following analysis I first focus
on enrolment as an outcome before moving to learning outcomes. For each, I first
inspect graphs of the average outcomes over time for treatment and control schools,
second present a descriptive analysis showing average outcomes pre- and post-
reform, and finally present the same analysis in an OLS regression framework
including controls for school and time fixed effects.
Enrolment
We can observe a parallel trend in enrolment for treatment and control schools
between 2012 and 2015, with a break between 2015-16 and 2016-17 when
treatment schools are treated and their enrolment rises. In the 2017-18 school year
enrolment continues to rise in treatment schools, control schools are treated, and
enrolment in control schools begins to increases in parallel with treatment schools.
20
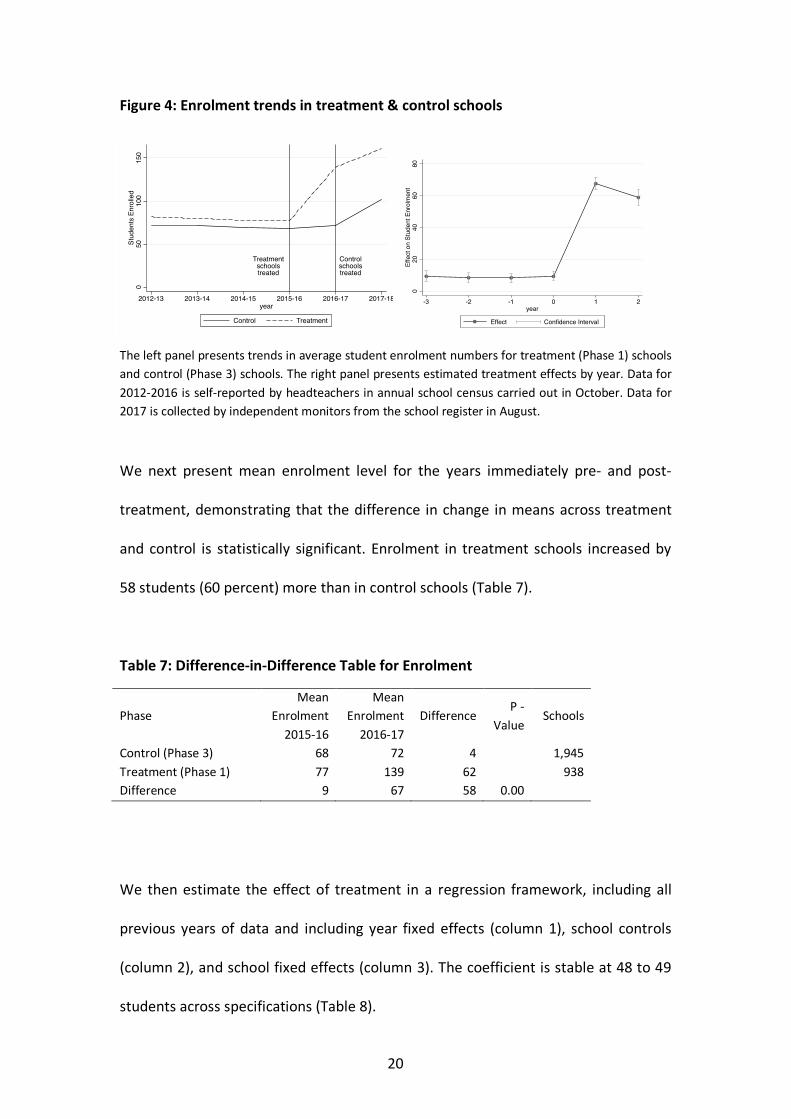
Figure 4: Enrolment trends in treatment & control schools
The left panel presents trends in average student enrolment numbers for treatment (Phase 1) schools and control (Phase 3) schools. The right panel presents estimated treatment effects by year. Data for 2012-2016 is self-reported by headteachers in annual school census carried out in October. Data for 2017 is collected by independent monitors from the school register in August.
We next present mean enrolment level for the years immediately pre- and post-
treatment, demonstrating that the difference in change in means across treatment
and control is statistically significant. Enrolment in treatment schools increased by
58 students (60 percent) more than in control schools (Table 7).
Table 7: Difference-in-Difference Table for Enrolment
Phase Mean
Enrolment 2015-16
Mean Enrolment
2016-17 Difference
P - Value
Schools
Control (Phase 3) 68 72 4 1,945 Treatment (Phase 1) 77 139 62 938 Difference 9 67 58 0.00
We then estimate the effect of treatment in a regression framework, including all
previous years of data and including year fixed effects (column 1), school controls
(column 2), and school fixed effects (column 3). The coefficient is stable at 48 to 49
students across specifications (Table 8).
Treatmentschoolstreated
Controlschoolstreated
050
100
150
Stud
ents
Enr
olle
d
2012-13 2013-14 2014-15 2015-16 2016-17 2017-18year
Control Treatment
020
4060
80Ef
fect
on
Stud
ent E
nrol
men
t
-3 -2 -1 0 1 2year
Effect Confidence Interval

21
Table 8: OLS Estimate on Enrolment
(1) (2) (3) Treatment x Post 48.607*** 48.611*** 48.366*** (1.488) (1.499) (1.484) Year FE Yes Yes Yes School Controls Yes School FE Yes Baseline Control Mean 76.6 76.6 76.6 N 17,099 16,701 17,099 N (Schools) 2,884 2,794 2,884 R-squared 0.207 0.313 0.335 Dependent variable is number of students enrolled. School controls include prior number of years in operation, number of classrooms and classes, and district fixed effects. Coefficients on the treatment and post dummies are omitted. * p<0.1, ** p<0.05, *** p<0.01
Breaking down this change in enrolment by grade, we observe that the increase is
concentrated in Katchi (Kindergarten) (40 students) and the early grades. The
difference in Grade 5 is just 1 additional student in treatment over control schools.5
Table 9: OLS Estimate on Enrolment by Grade
K 1-5 1 2 3 4 5 Treatment x Post
39.928***
18.488*** 6.961*** 3.923*** 3.956*** 1.857*** 1.027***
(1.254) (1.022) (0.439) (0.311) (0.259) (0.225) (0.203) Year FE Yes Yes Yes Yes Yes Yes Yes Baseline Control Mean
26.4 40.9 12.3 9.8 7.4 6.5 4.9
N 5,588 5,588 5,588 5,588 5,588 5,588 5,588 N (Schools) 2,794 2,794 2,794 2,794 2,794 2,794 2,794 R-squared 0.505 0.290 0.207 0.174 0.167 0.069 0.044 The outcome variable in each regression is the number of students in that grade. Coefficients on the treatment and post dummies are omitted. * p<0.1, ** p<0.05, *** p<0.01
5 We do not have data on student attendance, but unpublished analysis by McKinsey of MEA data suggests a slight decrease in the student attendance rate of Phase 1 schools after conversion.

22
Enrolment Spillovers
Were newly enrolled children previously out of school, or enrolled elsewhere?
Whilst we find a strong effect of treatment on enrolment at PSSP schools, an
important policy question is whether total enrolment increased – whether PSSP
schools attract students who would not otherwise have attended school at all, or
whether they attract students from other schools. The data presented so far on
enrolment at the individual school level does not allow us to determine whether
these newly enrolled students were previously out of school altogether or enrolled
in a different school. That most of the new enrolment is in Katchi rather than higher
grades may be suggestive that at least some of this enrolment was from previously
out of school children. However, we should also note that schools may also have
more actively recruited younger children, as schools are subject to high-stakes (for
the school) QAT tests for students in grades two to five, with penalties attached for
poor performance, making the recruitment of older students riskier.
We perform one other test; looking at enrolment of the closest neighbouring school
of our treatment and control schools, which should capture any spillover from other
public schools (we do not have data on enrolment in private schools).
We first link schools geographically to their nearest neighbouring public school. We
estimate the same difference-in-difference model as in the previous section, but in
this case using the treatment status of the closest neighbouring public school rather
than of the school itself. Results suggest that schools whose closest neighboring

23
public schools is a PSSP treatment school see increases in enrolment compared with
those whose closest neighbor is a PSSP control school. This increase is again focused
in Katchi. This is the opposite of the negative effect that we would expect if
enrolment in treatment schools were driven by the movement of students from
neighbouring schools.
Table 10: OLS Estimate on enrolment of neighbouring a PSSP school
(1) (2) (3) (4) All All K All Primary Neighbour Treated X Post -0.790 11.504*** 14.337*** 1.649 (7.878) (3.903) (3.368) (2.125) Year FE Yes Yes Yes School FE Yes Baseline Control Mean 124.2 124.2 26.4 40.9 N 8,956 8,956 824 824 N (Schools) 2,589 2,589 414 414 R-squared 0.015 0.119 0.234 0.132 Coefficients on the treatment and post dummies are omitted. * p<0.1, ** p<0.05, *** p<0.01
Robustness
In studies with a large number of time periods, serial correlation in both the
outcome and the independent variable of interest may be a concern, biasing our
standard errors. Following (Bertrand et al., 2004) we address this concern by
collapsing the data into a single pre- and post- reform period, finding qualitatively
similar results.

24
Mechanisms
How do schools increase student enrolment? The main data we have on potential
mechanisms is on teacher numbers, finding large increases in the number of
teachers in treatment schools. We first estimate the effect of school conversion on
the number of teachers at the school, finding an increase of 3 teachers per school.
Though we do not have data on teacher salaries paid in these schools, we know from
other studies that teacher salaries are substantially lower in private schools than in
government schools in Punjab. One estimate put average monthly salaries in private
schools at 1,407 rupees ($12), and in government schools at 7,671 rupees ($66) (Bau
and Das, 2017).
Table 11: OLS estimate on Number of Teachers at School
(1) (2) (3) Treatment x Post 3.068*** 3.062*** 3.087*** (0.084) (0.085) (0.085) Year FE Yes Yes Yes School FE Yes Baseline Control Mean 2.1 2.1 2.1 N 5,679 5,504 5,679 N (Schools) 2,880 2,791 2,880 R-squared 0.478 0.534 0.551 Coefficients on the treatment and post dummies are omitted.
* p<0.1, ** p<0.05, *** p<0.01
This increase in the number of teachers in treatment schools translates into an
overall reduction in class sizes of 9 pupils per teacher, compared to control schools.
Analysis of MEA data by McKinsey found no change in teacher presence rates for

25
PSSP Phase 1 and 2 schools after conversion, and no change in school facilities
(boundary walls, toilets, electricity, drinking water).
Table 12: OLS estimate on class size (Pupil-Teacher Ratio)
(1) (2) (3) Treatment x Post -9.323*** -8.816*** -9.324*** (1.052) (1.066) (1.063) Year FE Yes Yes Yes School FE Yes Baseline Control Mean 34.5 34.5 34.5 N 5,664 5,491 5,664 N (Schools) 2,879 2,791 2,879 R-squared 0.013 0.135 0.038 Coefficients on the treatment and post dummies are omitted. * p<0.1, ** p<0.05, *** p<0.01
Student performance
How do these schools perform in terms of learning? We estimate the same
difference-in-difference model as used previously, using the province-wide
standardized Grade 5 exam test score data as the outcome. We first look at the
number of students taking the exam. The average number of students taking the
exam in treatment schools increased from 5.8 in 2015-16 to 7.9 in 2016-17, an
increase of two students. The difference-in-difference estimate falls from 2 to 1.5
students when controlling for school fixed effects (columns 1 and 3, Table 13).

26
Table 13: OLS estimate on Number of Grade 5 Exam Candidates
(1) (2) (3) Treatment x Post 1.960*** 1.717*** 1.513*** (0.195) (0.196) (0.193) Year FE Yes Yes Yes School Controls Yes School FE Yes Baseline Control Mean 5.5 5.5 5.5 N 7,592 7,472 7,592 N (Schools) 2,780 2,726 2,780 R-squared 0.023 0.214 0.071 School controls include prior number of years in operation, number of classrooms and classes, and district fixed effects. Coefficients on the treatment and post dummies are omitted. * p<0.1, ** p<0.05, *** p<0.01
This increase in the number of students taking the Grade 5 exam makes it difficult to
interpret the effect on average test scores, as we are unable to distinguish between
a treatment effect on pre-enrolled students and a compositional effect via the entry
of new candidates. We might expect the increase in new exam takers to come from
marginal students with lower than average expected results. There are effectively 10
months of treatment between the start of school and the end of term exam.
The graph of mean exam scores shows a slight decline for treatment schools relative
to control schools after treatment, but also that trends from the prior three years
are not parallel, and there is a negative difference in test scores for treatment
schools the year prior to their treatment.

27
Figure 5: Trends in Grade 5 Scores for treatment & control schools
The left panel presents trends in average student exam scores for treatment (Phase 1) schools and control (Phase 3 schools). The right panel shows estimated treatment effects by year. All data is at the school-level from the Punjab Examinations Commission.
In the OLS regression framework we estimate a small negative difference in overall
average test scores (-0.08 school-level standard deviations) and on Maths and
English, (-0.1 school-level standard deviations), but no change in Urdu, Science, or
Islam scores.6
Table 14: OLS estimate on Grade 5 Test Scores, by Subject
All Urdu Maths Eng Sci Isl
Treatment x Post -0.082** -0.027 -0.105*** -0.105*** -0.032 -0.046
(0.038) (0.041) (0.036) (0.040) (0.041) (0.034)
Year FE Yes Yes Yes Yes Yes Yes
School FE Yes Yes Yes
Baseline Control Mean 0.0 0.0 0.0 0.0 0.0 0.0
N 9,758 9,758 9,758 9,758 9,758 9,758
6 Note that the interpretation of effect sizes in terms of school average test score standard deviations is different to the interpretation of effect sizes in terms of individual student standard deviations. The variation in school average test scores is roughly half of the variation in student test scores, so to compare this effect size with estimates from impact evaluations using individual student data, one should divide this estimate by half.
Treatmentschoolstreated
Controlschoolstreated
3045
60Av
erag
e Ex
am S
core
(%)
2012-13 2013-14 2014-15 2015-16 2016-17 2017-18year
Control Treatment
-4-2
02
-3 -2 -1 0 1 2year
Effect Confidence Interval

28
N (Schools) 2,749 2,749 2,749 2,749 2,749 2,749
R-squared 0.328 0.095 0.409 0.231 0.278 0.174
The dependent variable is standardized to mean zero and standard deviation of one by year and subject. Coefficients on the treatment and post dummies are omitted.
* p<0.1, ** p<0.05, *** p<0.01
Ideally, we would address the conflation of treatment and compositional effects by
limiting our analysis to students who would have taken the test without treatment,
but with our data we are unable to identify these students. What we can identify is
the change in the total number of candidates entered by the school. We estimate
heterogenous effects by splitting the sample into schools that had an increase in the
number of candidates, schools that had the same number as the previous year, and
schools that had fewer candidates. Here we see a difference - schools that did not
increase the number of candidates after treatment saw no statistically significant
change in overall scores or most subjects. Only schools that increased the number of
candidates saw a drop in their overall average test score, suggesting that the overall
drop in test scores may be driven in part by a compositional effect, with treatment
schools on average entering a greater number of weaker candidates.

29
Table 15: OLS estimate on Grade 5 Test Scores, by School Type
Panel A: Schools with fewer candidates after treatment All Urdu Maths Eng Sci Isl Treatment x Post 0.018 0.080 -0.035 -0.060 0.131* -0.025 (0.072) (0.076) (0.066) (0.074) (0.075) (0.068) Year FE Yes Yes Yes Yes Yes Yes School FE Yes Yes Yes N 3,114 3,114 3,114 3,114 3,114 3,114 N (Schools) 895 895 895 895 895 895 R-squared 0.314 0.095 0.410 0.210 0.262 0.169
Panel B: Schools with the same number of candidates after treatment All Urdu Maths Eng Sci Isl Treatment x Post -0.002 0.060 -0.060 0.042 -0.035 -0.004 (0.092) (0.099) (0.100) (0.100) (0.113) (0.086) Year FE Yes Yes Yes Yes Yes Yes School FE Yes Yes Yes N 1,401 1,401 1,401 1,401 1,401 1,401 N (Schools) 425 425 425 425 425 425 R-squared 0.378 0.129 0.450 0.263 0.295 0.219
Panel C: Schools with more candidates after treatment All Urdu Maths Eng Sci Isl Treatment x Post -0.158*** -0.107** -0.154*** -0.163*** -0.130** -0.064 (0.049) (0.054) (0.048) (0.053) (0.053) (0.043) Year FE Yes Yes Yes Yes Yes Yes School FE Yes Yes Yes N 5,243 5,243 5,243 5,243 5,243 5,243 N (Schools) 1,429 1,429 1,429 1,429 1,429 1,429 R-squared 0.327 0.090 0.401 0.239 0.287 0.168 The dependent variable is standardized to mean zero and standard deviation of one by year and subject. Coefficients on the treatment and post dummies are omitted. * p<0.1, ** p<0.05, *** p<0.01

30
We can also use the monthly Literacy and Numeracy Drive (LND) data for 2017 to
look at the change in performance for Phase 3 schools following their conversion.
Here we don’t have the same natural control group, but can show a comparison with
Phase 1 schools, and with other schools. Here there is a substantial fall in test scores
following conversion, but again we are again unable to precisely distinguish between
the treatment effect on pre-existing students and the compositional effect of the
enrolment of new students. What appears to be a steeper decline in grade 2-3 test
scores than grade 5 test scores is consistent with a purely compositional effect –
enrolment increased by 4 students in grades 2 and 3, and by just 1 in grade 5. The
speed of the drop in test scores (in a single month) may also be more consistent with
a compositional effect than a treatment effect.
Figure 6: Trends in Grade 2-3 Test Scores (2017)
This figure presents trends in average student test scores for PSSP and all schools. Phase 1 schools were converted in the prior year, and Phase 3 schools in April.
Phase 3schoolstreated
.6.6
5.7
.75
.8.8
5%
Per
cent
age
Cor
rect
Jan Feb Mar Apr May Aug Sep
PSSP Phase 1 PSSP Phase 3All other schools
-.05
0.0
5.1
-4 -2 0 2 4 6month
Effect Confidence Interval

31
The visual inspection of the figure is supported by the simple difference in mean test
scores (Table 16) and the OLS estimate with subject, grade, and school fixed effects
(Table 17), which is -0.11 percentage points lower test scores.
Table 16: Difference-in-difference table for Grade 2-3 Test Scores
Jan-Mar 2017 Apr-Sep 2017 Difference Phase 1 0.74 0.67 -0.07 Phase 3 0.81 0.63 -0.18 Other 0.83 0.78 -0.05 Phase 3 - Phase 1 0.07 -0.04 -0.11
Table 17: OLS estimate on Grade 2-3 Test Scores
(1) (2) Treatment x Post -0.107*** -0.112*** (0.006) (0.006) Subject FE Yes Yes Grade FE Yes Yes Student Controls Yes Yes School FE Yes N 70,967 70,967 N (Schools) 2,801 2,801 R-squared 0.103 0.102 The dependent variable is standardized to mean zero and standard deviation of one by year and subject. Coefficients on the treatment and post dummies are omitted. * p<0.1, ** p<0.05, *** p<0.01
In contrast to the findings so far, results from the Quality Assurance Tests (which are
high stakes for schools) do suggest improvement in treatment schools. We only have
tests from a single point in time, but can compare results for phase 1 schools at the
end of their first year with phase 3 schools at the start of their first year. In these
tests the average pass mark in treatment schools was 55 percent, compared with 41
percent in control schools. 425 treatment PSSP schools (43 percent) failed the QAT
test at the end of their first year.

32
Figure 7: Quality Assurance Tests (QAT) (2017)
Bounds on the compositional effect
Arithmetically, we can estimate a bound on the size of any possible negative
compositional bias. Our test score data comes from Grades 2, 3, and 5. Although the
increase in enrolment was concentrated in Katchi, there was a small increase in
enrolment in these grades as well, which as numbers were low to begin with means
that 23 to 31 percent of students taking tests after the reform were new students. If
we assume that the true treatment effect on the original students was zero, we can
calculate how much worse the performance must have been amongst the new
students for the overall estimated average effect to be the size that it was. This
calculation is laid out in Table 18 below, and the implied performance of new
students ranges from -0.35 standard deviations worse in Grade 5 to -0.45 in Grade 2.
0.0
05.0
1.0
15.0
2.0
25kd
ensi
ty re
sult
0 20 40 60 80 100Average Marks
Control Treatment

33
Table 18: Minimum required bias from compositional effect consistent with a null treatment effect
(1) (2) (3) (4) (5) Increase in candidates
Total newcandidates
New Students as % of Total
Students
Overall testscore reduction
(SD)
Minimum required negative effect of
new students (SD) Grade 5 1.5 6.5 0.23 -0.08 -0.35Grade 3 4 13 0.31 -0.112 -0.36Grade 2 4 16 0.25 -0.112 -0.45Column 4 shows the observed reduction in test scores for each grade. Column 5 assumes that the treatment effect was in fact zero for existing students, and calculates what the required negative ‘effect’ of the new students would have to be if they were alone responsible for the overall reduction observed in column 4.
There could also have been selection in the other direction – some new students
may have come from private schools, and be more advantaged than the average
student. We aren’t able to place a bound on this possible positive selection.
Are the Results Externally Valid?
Whether these results are relevant for schools outside of our sample depends upon
a) whether conditions are similar elsewhere, b) whether we have identified a
generalizable behavioural mechanism, and c) whether implementation can be
replicated elsewhere (Bates and Glennerster, 2017). We begin by noting that our
sample and treatment estimate already includes all schools in the first phase of the
PSSP, suggesting that our results are at least valid for all schools in this programme.
Would our results replicate if the PSSP was scaled up to other schools in the Punjab?
As the programme was targeted explicitly at “failing” schools with low enrolment or
exam scores, we can’t with confidence assume that similar results would be found in

34
other schools in the Punjab. In the UK, contracting out the management of
government schools (through the academy programme) was most successful in its
first stage, when particularly weak government schools were targeted for
academisation. The more recent opening of the programme to more successful
schools seems to have been less effective (Eyles et al., 2017) (Eyles et al., 2016). A
similar interpretation can be applied to results found in evaluations of US charter
schools – where charter schools appear to be most effective in urban areas then
they are being compared to particularly low-quality traditional public schools
(Angrist et al., 2013) (Clark et al., 2015). In non-urban areas, where traditional public
schools are better, the estimated effects of charter schools on learning are negative
or null.
Second, is there a generalizable behavioural mechanism at play here? The underlying
principle behind PSSP is the provision of autonomy to schools on operations, with
discretion over hiring and spending received on a per student basis, and
accountability on outcomes (test-scores). There is evidence from public schools that
the provision of grants on a per student basis can incentivize schools to increase
their enrolment (Blimpo et al., 2015) (Carneiro et al., 2015) (Reinikka and Svensson,
2011). In this sense, the financing of non-state school operators is just an
intensification of common financing relationships with government schools. The
addition of new test-based accountability for schools does not seem to have
improved learning outcomes, at least in the short term, consistent with mixed
findings on the value of test-based accountability systems in the US (Holbein and
Ladd, 2017) (Figlio and Loeb, 2011).

35
Implications for government finances and access to education in Pakistan
Converting schools to private management through the PSSP reduces per pupil
spending by government in those schools from an average of 1,507 rupees to 550
rupees. For 400,000 students this is a saving of 382 million rupees ($3.6m USD), or
around 0.14 percent of the total Punjab provincial budget for education of 296
billion rupees ($2.5bn USD). This is therefore a small overall saving, and furthermore
is counteracted by the increased expenditure elsewhere. When schools are
converted to PSSP, the existing teachers are moved to other schools rather than laid
off altogether, with PSSP schools then being permitted to hire their own new
teachers at lower pay scales. An important question therefore is how effectively the
original PSSP school teachers are used in other schools, and whether they fill teacher
gaps elsewhere or duplicate existing effort.
We are unable to estimate how much of the increase in enrolment comes from
children who were previously out of school. If we take the increase in Katchi alone as
an estimate of the increase in new enrolment into PSSP schools, this amounts to an
additional 40 students enrolled per school for over 4,000 schools, or over 170,000 in
total. The cost of this increase is thus around 93.5 million rupees ($0.9m USD).
The province of Punjab has around 2.5 million children aged 5-9 who have never
been enrolled in school. Enrolling all these in government schools at current
spending levels would cost 3.8 billion rupees ($35m USD) per year, compared to 1.4
billion rupees ($13m USD) in Punjab Education Foundation-supported schools. This

36
potential saving ($22m USD) is still small relative to total annual provincial spending
on education ($2.5bn USD).
Thus, though the policy is large for its kind, it remains small in the context of primary
schooling in Punjab. For the policy to make a substantial contribution to improved
primary education it will need to continue to grow both in pupils per school and in
the number of schools in the programme. For the policy to be expanded further
though careful continued attention is warranted to the quality of these schools.
An important further caveat is whether the payment of market salaries in PSSP
schools is sustainable, or whether teachers at PSSP schools may be able to lobby to
receive regular government teacher salaries. Policies of hiring teaching assistants in
government schools on temporary contracts and at market wages in Kenya
(Sandefur, 2013) and India7 have eventually failed after unions were successfully
able to lobby for contract teachers to be regularized and put on permanent civil
service payrolls with union wage levels.
7 https://scroll.in/article/846589/in-uttar-pradeshs-botched-effort-at-regularising-contract-teachers-a-lesson-for-other-states

37
5. Conclusion
In this paper we have estimated the effect of the fastest ever programme of
contracting out government schools to private management. We find a large
increase in enrolment and a modest decline in test scores. We are unable to say with
full confidence how much of the increase in enrolment came from students who
were not already in another school, or whether the observed decline in test scores is
due to a negative treatment effect or a purely compositional effect.
We are also unable to determine whether the effect on school enrolment is inherent
to private management, or simply a function of a system of school financing in which
schools are reimbursed on a per student basis.
Any further expansion of the programme should include some attention to
identifying and tracking students who were enrolled in schools before transition, in
order to estimate the actual treatment effect on learning outcomes. Using
randomization for the selection of any additional schools could also allow for clearer
causal identification of effects on enrolment and learning.

38
References
Abdulkadiroğlu, A., Angrist, J.D., Hull, P.D., Pathak, P.A., 2016. Charters without Lotteries: Testing Takeovers in New Orleans and Boston. American Economic Review 106, 1878–1920. https://doi.org/10.1257/aer.20150479 Alderman, H., Kim, J., Orazem, P.F., 2003. Design, evaluation, and sustainability of private schools for the poor: The Pakistan urban and rural fellowship school experiments. Economics of Education Review. Andrabi, T., Das, J., Khwaja, A.I., 2008. A dime a day: The possibilities and limits of private schooling in Pakistan. Comparative Education Review 52, 329–355. Andrabi, T., Das, J., Khwaja, A.I., Singh, N., Ozyurt, S., 2016. Upping the Ante: The Equilibrium Effects of Unconditional Grants to Private Schools. Angrist, J.D., Pathak, P.A., Walters, C.R., 2013. Explaining charter school effectiveness. AEJ: Applied. ASER Pakistan, 2017. Annual Status of Education Report (ASER) 2016. Aslam, M., Rawal, S., Saeed, S., 2017. Public Private Partnerships (PPPs) in Education in Developing Countries: A Rigorous Review of the Evidence. Barrera-Osorio, F., Blakeslee, D.S., Hoover, M., Linden, L., Raju, D., Ryan, S.P., 2017. Delivering education to the underserved through a public-private partnership program in Pakistan. National Bureau of Economic Research. Barrera-Osorio, F., Blakeslee, D.S., Hoover, M., Linden, L.L., Raju, D., 2013. Expanding Educational Opportunities in Remote Parts of the World: Evidence from a RCT of a Public-Private Partnership in Pakistan. Barrera-Osorio, F., Raju, D., 2015. Evaluating the Impact of Public Student Subsidies on Low-Cost Private Schools in Pakistan. The Journal of Development Studies 51, 808–825. https://doi.org/10.1080/00220388.2015.1028535 Bates, M.A., Glennerster, R., 2017. The Generalizability Puzzle, Stanford Social Innovation Review. Bau, N., Das, J., 2017. The Misallocation of Pay and Productivity in the Public Sector: Evidence from the Labour Market for Teachers. Presented at the Policy Research Working Paper 8050, World Bank. Bengali, K., 1999. History of educational policy making and planning in Pakistan. Sustainable Development Policy Institute.

39
Bertrand, M., Duflo, E., Mullainathan, S., 2004. How Much Should We Trust Differences-In-Differences Estimates? Q J Econ 119, 249–275. https://doi.org/10.1162/003355304772839588 Blimpo, M.P., Lahire, N., Evans, D., 2015. Parental human capital and effective school management : evidence from The Gambia (No. WPS7238). The World Bank. Bonilla-Angel, J.D., 2011. Contracting out Public Schools and Academic Performance: Evidence from Colombia. Carneiro, P., Koussihouèdé, O., Lahire, N., Meghir, C., Mommaerts, C., 2015. Decentralizing education resources: school grants in Senegal. National Bureau of Economic Research. Clark, M.A., Gleason, P.M., Tuttle, C.C., Silverberg, M.K., 2015. Do Charter Schools Improve Student Achievement? Educational Evaluation and Policy Analysis 37, 419–436. https://doi.org/10.3102/0162373714558292 Epple, D., Romano, R., Zimmer, R., 2016. Charter Schools: A Survey of Research on Their Characteristics and Effectiveness, in: Hanushek, E.A., Machin, S., Woessmann, L. (Eds.), Handbook of the Economics of Education. Elsevier, pp. 139–208. https://doi.org/10.1016/B978-0-444-63459-7.00003-8 Epple, D., Romano, R.E., Urquiola, M., 2017. School Vouchers: A Survey of the Economics Literature. Journal of Economic Literature 55, 441–492. https://doi.org/10.1257/jel.20150679 Eyles, A., Hupkau, C., Machin, S., 2016. Academies, charter and free schools: do new school types deliver better outcomes? Economic Policy 31, 453–501. https://doi.org/10.1093/epolic/eiw006 Eyles, A., Machin, S., McNally, S., 2017. Unexpected school reform: Academisation of primary schools in England. JPubE. https://doi.org/10.1016/j.jpubeco.2017.09.004 Figlio, D., Loeb, S., 2011. School Accountability, in: Hanushek, E.A., Machin, S., Woessmann, L. (Eds.), Handbook of the Economics of Education. Vol. 3: [...], Handbooks in Economics. North-Holland, Amsterdam. Holbein, J.B., Ladd, H.F., 2017. Accountability Pressure: Regression Discontinuity Estimates of how No Child Left Behind Influenced Student Behavior. Economics of Education Review. https://doi.org/10.1016/j.econedurev.2017.03.005 Kim, J., Alderman, H., Orazem, P.F., 1999. Can Private School Subsidies Increase Enrollment for the Poor? The Quetta Urban Fellowship Program. World Bank Economic Review.

40
Malik, R., Bari, F., Muzaffar, I., Khan, M.S., 2015. Partnerships for Management: Evidence from Punjab and Sindh. Nguyen, Q., Raju, D., 2014. Private school participation in Pakistan. Reinikka, R., Svensson, J., 2011. The power of information in public services: Evidence from education in Uganda. JPubE 95, 956–966. https://doi.org/10.1016/j.jpubeco.2011.02.006 Romero, M., Sandefur, J., Sandholtz, W.A., 2017. Can Outsourcing Improve Liberia’s Schools? Preliminary Results from Year One of a Three-Year Randomized Evaluation of Partnership Schools for Liberia, in: Working Paper 462. Centre for Global Development. Sandefur, J., 2013. Scaling Up What Works: Experimental Evidence on External Validity in Kenyan Education - Working Paper 321. Center For Global Development. Shakeel, M., Anderson, K.P., Wolf, P.J., 2016. The participant effects of private school vouchers across the globe: A meta-analytic and systematic review. Termes, A., Bonal, X., Verger, A., Zancajo, A., López, L., Ramírez, Y.C., Sierra, A., 2015. Public-Private Partnerships in Colombian Education: The Equity and Quality Impications of “Colegios en concesión,” 201ESP5Working Paper Series.
Top Related
Copyright © 2022 FDOKUMEN

