


Bahasa
Halaman
Hukum

Continuing Caste inequalities in Rural
Uttar Pradesh
Srinivas Goli Assistant Professor
Email id: [email protected]
Nagendra Kumar Maurya Assistant Professor
Email id: [email protected]
Manoj Kumar Sharma Technical Assistant
Email id: [email protected]
August 2014
GIRI INSTITUTE OF DEVELOPMENT STUDIES Aliganj, Lucknow-226024, U.P., INDIA
© Giri Institute of Development Studies
Lucknow
Title: Continuing Caste inequalities in Rural Uttar Pradesh
August 2014
Acknowledgement
The authors would like to Thank Prof. A.K. Singh, former director of the Giri Institute of
Development Studies, Lucknow for his valuable comments on various drafts of this
manuscript. The authors also thank Prof. R.B. Bhagat and Prof. R.P. Mamgain, and Five
anonymous reviewers for their insightful comments on the manuscript.
Disclaimer: Opinions and recommendations in the paper are exclusively of the
author(s) and not of any other individual or institution including GIDS.
Published by the Giri Institute of Development Studies, Lucknow
Contents
Pg. no.
Background and Rationale 1
Data 3
Methods 3
Human Opportunity Index 4
Multidimensional Poverty Index (MPI): Identification of Indicators 4
Weights 6
Decomposition Models 6
Pyatt's Gini Decomposition Model 6
Theil Decomposition Model 7
Atkinson's Decomposition Model 8
Results 9
Socioeconomic Differentials by Caste Groups 9
Human Opportunity Index 12
Multidimensional Poverty 14
Decomposing Inequalities 15
Discussion 17
Conclusion 17
References 20
Continuing Caste inequalities in Rural Uttar Pradesh
Abstract
A continuous mixed opinion on the relevance of caste based reservations and caste as a factor
of socioeconomic disparity in the recent period demands update of evidence on
socioeconomic inequalities among caste groups for effective policy making. This study
investigates whether the caste inequalities in terms of socioeconomic opportunities and
poverty are still persisting in rural Uttar Pradesh based on village census surveys? This study
used data primarily collected from four village census surveys under the project rural
transformation in Uttar Pradesh, 2013. Bivariate analyses, Human Opportunity Index (HOI),
Multidimensional Poverty Index (MPI) and inequality decomposition analyses used as
methods of analyses. Our findings suggest that in spite of more than six decades of welfare
policies and major political mobilization movements among lower castes in the state, the
huge inequalities in terms of critical socioeconomic indicators such as landholding, higher
education and wealth distribution and multi-dimensional poverty across the castes are still
persisting in the state. Decomposition results suggest that between group inequalities
contribute more to the total inequality in landholding whereas within group inequalities
contribute maximum to total inequality in education and wealth status of different castes in
rural Uttar Pradesh. However, within inequalities much less in general castes compared to
SCs/OBCs. Based on its latest empirical evidence, this study strengthens the argument that
caste still matters in socioeconomic achievements of the population in India even after
decades of planning and financing of social welfare schemes to uplift the lower castes in
India. Thus, provides critical inputs to current debates on the relevance of caste as a
determinant of socioeconomic status in India.
Keywords: HOI, MPI, Caste, Inequality, Uttar Pradesh.
JEL Code: I32, J16, O15, P25.

Background and Rationale
Historically, the socioeconomic progress in India continues to suffer from the inflexibility of a rigid
caste system and caste based discriminations (Deshpande 2000; Omvedt 2011). The traditional Hindu
Varnas (translated into English as castes) were five, Brahmins (priests, teachers), Kshatriyas (warriors,
royalty), Vaisyas (moneylender, traders), and the Sudras (menial job) and the Ati Sudhra and Dalits (the
untouchables, doing lowest of the menial jobs). There are thousands of sub-castes within these five castes.
However, for the political and developmental planning and policy perspective, the constitution of India
classified traditional caste groups into four broad categories: Scheduled Castes (SCs), Scheduled Tribes
(STs), Other Backward Castes (OBCs) and General Castes (Srinivasan 1986, 1996). The critical reason
why caste has distinctive sociological imagination is because it is viewed as a representation of
unadulterated status, based on religion and ideological grounds with class inequalities being rooted from
caste (Dumont 1980; Milner 1994).
Since its emergence, caste has been a determining factor of access to productive resources such as
land, education and health as well as discrimination in the labour market. A strong link has been
identified between caste and economic status (Gerth and Mills 1946; Dumont 1980; Gupta 2000; Kapur et
al 2010; Desai 2010; De and Gollerkeri 1986; Kopparty 1994; Mehta and Kapoor 1998; Deshpande 2000;
Nayar 2007; Thorat and Newman 2009; Desai and Dubey 2012; IIPS and Macro Internationals 1992-93,
1998-99, 2005-06; Goli et al. 2013; Goli and Apollo, 2014; Singh 2014). In order to root out this problem,
since independence, Government of India (GoI) has initiated a number of affirmative action plans
including land reforms, reservation in education and employment etc. In spite of decades of planning and
a sizeable amount of public resources being channelled in the name of welfare of SCs/STs but actual
benefits have hardly reached these groups. However, this claim needs a strong evidential support.
Though, caste as a phenomenon has been extensively researched in its myriad facets by the other
social scientists, but many of these studies either theoretical or their evidence become a decade old by
now (e.g. Gerth and Mills 1946; Dumont 1980; De and Gollerkeri 1986; Gupta 2000; Kapur et al 2010;
Desai 2010; Kopparty 1994; Mehta and Kapoor 1994; Deshpande 2000; IIPS and Macro Internationals
1992-93, 1998-99, 2005-06; Deshpande 2000; Subramanian et al 2006; Nayar 2007; Thorat and Newman
2009; Desai and Dubey 2012; Deshpande 2012; Goli et al. 2013; Singh 2014). Also among those studies
which used recent data have limitations in their assessment. For instance, Bhagat (2013) has assessed the
latest Census information on the economic and living conditions of the SCs and STs vis a vis other caste,
but the Census based study has limitation as it does not provide data on OBCs. According to Bhagat
(2013) “there has been considerable progress in the well-being of SCs and STs during the last decade, but
the gap between SCs and STs and of both these groups compared to the rest of the population has
widened”. Mamgain (2013) argued for a post-2015 development framework that ensures faster reduction
2
in poverty and inequality in SCs and STs. He also argued for the elimination of all forms of
discrimination against them and ensures social inclusion with dignity, but the study presents only a set of
theoretical postulations but need to be supported with empirical evidences on the current levels of poverty
and inequality of socioeconomic opportunities across the caste groups. Another recent study by Singh
(2014) demonstrated that the root cause of inequality among caste groups is actually grounded in a
hierarchy of land rights, political power and driven by religious and secular ideology but lacks supports to
the argument based on empirical evidence.
Thus, the evidence on current scenario of different social groups in terms of socioeconomic standing
becomes important in the context where increasing of privatisation of education and employment resorted
to do away with the reservation quotas. The demand is also increasing from the non-reserved groups to
take away reservation in higher education and certain fields of government employment. The recent
debates regarding inclusion of caste in Census 2011 have raised questions about whether caste still
matters in modern India because an equal number of intellectual groups supported (e.g. Khachane 2010;
Desai and Dubey 2012) and opposed (e.g. Shah 1998; Bhagat 2007, 2010; Sudarshan 2010) to include
caste questions in the Census enumeration. Moreover, these questions become much more important in
the context of Uttar Pradesh, which is the focus of our study. Uttar Pradesh has unique place when we talk
about caste. It is one of the major states in India, which has mass political mobilisation and previously
ruled by a party dominated and headed by a Dalit leader. Like, rest of the country, it has huge caste
inequalities and rampant caste discrimination and atrocities against Dalits (The Hindu, 2014, 31 May). A
status report of discrimination in schools submitted by 41 independent monitoring institutes (MI) to the
Union Human Resource Development Ministry (UHRD) highlights instances of caste discrimination and
untouchability in Uttar Pradesh along with the other four states (UHRD, 2012). Two stories published in
India Together magazine (August 17, 2007) on caste discrimination reported that
“Dalit children wait for mid-day meals until other caste will finish taking their mid-day meal at a
government run primary school of village Bhagwanpura of Jalaun district”.
An another story of class fourth student in a government run primary school of village Bhagwanpura
of Jalaun district of UP says his teacher does not permit him to sit on the mat. He says
"The Thakurs and Brahmin students in my class ask me to keep away from the mat. My teacher asks
me to sit on the ground. In school during mid day meal (MDM), we are forcibly seated very far. The
children from the general castes don't like to play with us. If I go to the teachers for checking the home
work or class work, they see it without touching it." (India Together, August 17, 2007).
These discriminations will definitely affect the social and economic status of scheduled and backward
class children in the villages. Therefore, it is imperative to learn that after more than six decades of
3
affirmative policies still how much inequality exist in socioeconomic opportunities and poverty between
and within caste groups in rural Uttar Pradesh, is an important research question needs empirical
investigation. Therefore, in this context, this study has attempted to assess the current standing of social
groups (SCs/STs, OBCs and General castes) in terms of key socioeconomic indicators. This study has
three key objectives: 1) To assess the inequality of opportunities in landholding, education and wealth
status. 2) To assess the multi-dimensional poverty among social groups. 3) To estimate within and
between caste inequalities in landholding, educational and wealth status.
Data
In this study, we have used the data from a survey of four villages undertaken by the Giri Institute
of Development Studies (GIDS), Lucknow in 2013 under the project 'Rural Transformation in Uttar
Pradesh'. This survey was conducted in four villages selected from the four different economic regions of
Uttar Pradesh. We have purposively selected Gohanakala village in Lucknow district of the Central
region, Senapur village in Jaunpur district of the Eastern region, Pandari village in Chitrakoot district in
Bundelkhand region, a Seemli village in Muzzafarnagar district of the Western region. While Gohanakala
village is near to an urban center, Senapur village is located neither very near to an urban center nor
located in a remote area and neither in the very poor economic region nor in the very rich economic
region. While Pandari village is located in remote and economically backward region, Seemli village is
located in economically prosperous region of the state. We have conducted a Census survey in the
villages that all the households in the villages were enumerated with a structured schedule. The sample
size of Gohanakala (503), Senapur (471), Pandari (368) and Seemli (296) and their distribution across
caste group were sufficient for testing Pearson Chi square test of significance of differences in
socioeconomic status across the caste groups. In Uttar Pradesh as a whole, the presence of the scheduled
tribe population is insignificant and the same thing also reflected in our sample villages. However, in case
of Seemli village, we could not find a sufficient number of General caste households.
Methods
The inequalities in the socioeconomic status of caste groups in the villages of Uttar Pradesh were
assessed in four ways. First, bivariate percentage differences in different socioeconomic indicators were
presented by caste groups. The statistical significance of these differences was measured by Pearson Chi-
square test. Second, Human Opportunity Index (HOI) was measured to assess inequalities in
socioeconomic opportunities in selected villages of Uttar Pradesh. Third, we have estimated
Multidimensional Poverty Index (MPI) to assess the overall socioeconomic deprivation among caste
groups. Fourth, inequalities in key socioeconomic outcome indicators by caste groups were decomposed
4
to estimate the contribution of within and between group inequalities. The statistical procedure of the
estimation of HOI, MPI and decomposition is discussed below.
Human Opportunity Index
Barros et al.'s (2009, 2011) Human opportunity index (HOI) has been widely used to highlight
inequalities of socioeconomic opportunities. The HOI synthesizes two measures into a single indicator–
first, the level or efficiency of basic opportunities in a society was measured through the average coverage
rate for a given opportunity and second, how equitably those opportunities distributed were measured
through the index of dissimilarity. Thus, this measure was computed in two stages, the first step was to
estimate the index of dissimilarity for each factor. It was obtained by following formula
DI =1
2p ∝𝑘 [ 𝑃𝐾 − 𝑝
𝑛
𝑘−1
]
Where DI represents the index of dissimilarity and p is the coverage rates or average access. 𝑃𝐾 is
coverage for group k and ∝𝑘 is the weight of group k in total population.
The second step is the estimation of the HOI. It was obtained by the following formula.
HOI = 𝑃 (1 − 𝐷)
Where HOI represents Human Opportunities Index, 𝑃 the mean of the variable for population, D is
the index of dissimilarity. HOI value represents the amount of gap that should be reduced to reach the
perfect equality in a given population for given indicator.
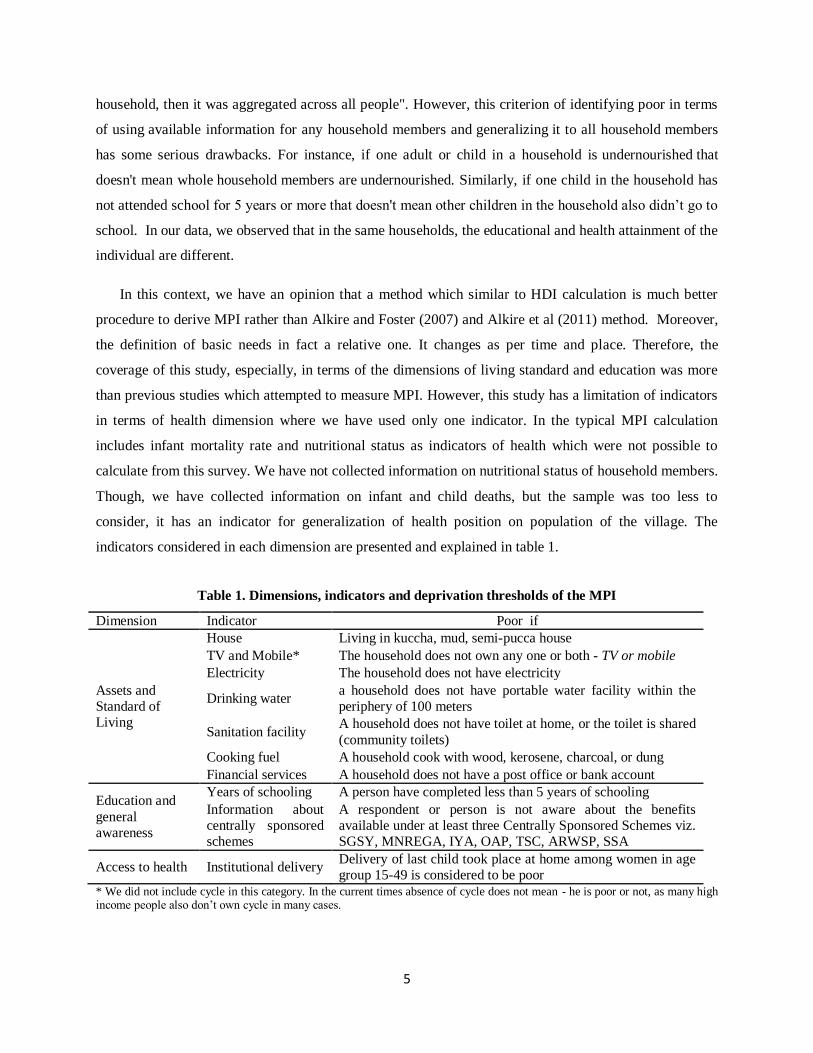
Multidimensional Poverty Index (MPI): Identification of Indicators
Multidimensional poverty captures the deprivations of different basic needs of an individual. The
MPI generally presents a different picture of poverty than income poverty. Amartya Sen has argued the
need to take a multidimensional approach to poverty as well as development: “Human lives are battered
and diminished in different ways, and the first task is to acknowledge that deprivations of very different
kinds have to be accommodated within a general overarching framework” (Sen 2000). The operational
procedure of estimation of Multidimensional Poverty Index (MPI) was developed in 2010 by Oxford
Poverty & Human Development Initiative and the United Nations Development Programme and uses
different factors to determine poverty which are beyond income-based lists (Alkire and Foster 2007).
Typically, the MPI has been measured on the basis of three dimensions: living standards, education
and health. Each dimension includes a different set of indicators. According to Alkire et al (2011), “The
MPI identifies an individual as deprived based on household achievements so the unit of analysis is the
5
household, then it was aggregated across all people". However, this criterion of identifying poor in terms
of using available information for any household members and generalizing it to all household members
has some serious drawbacks. For instance, if one adult or child in a household is undernourished that
doesn't mean whole household members are undernourished. Similarly, if one child in the household has
not attended school for 5 years or more that doesn't mean other children in the household also didn‟t go to
school. In our data, we observed that in the same households, the educational and health attainment of the
individual are different.
In this context, we have an opinion that a method which similar to HDI calculation is much better
procedure to derive MPI rather than Alkire and Foster (2007) and Alkire et al (2011) method. Moreover,
the definition of basic needs in fact a relative one. It changes as per time and place. Therefore, the
coverage of this study, especially, in terms of the dimensions of living standard and education was more
than previous studies which attempted to measure MPI. However, this study has a limitation of indicators
in terms of health dimension where we have used only one indicator. In the typical MPI calculation
includes infant mortality rate and nutritional status as indicators of health which were not possible to
calculate from this survey. We have not collected information on nutritional status of household members.
Though, we have collected information on infant and child deaths, but the sample was too less to
consider, it has an indicator for generalization of health position on population of the village. The
indicators considered in each dimension are presented and explained in table 1.
Table 1. Dimensions, indicators and deprivation thresholds of the MPI
Dimension Indicator Poor if
Assets and
Standard of
Living
House Living in kuccha, mud, semi-pucca house
TV and Mobile* The household does not own any one or both - TV or mobile
Electricity The household does not have electricity
Drinking water a household does not have portable water facility within the
periphery of 100 meters
Sanitation facility A household does not have toilet at home, or the toilet is shared
(community toilets)
Cooking fuel A household cook with wood, kerosene, charcoal, or dung
Financial services A household does not have a post office or bank account
Education and
general
awareness
Years of schooling A person have completed less than 5 years of schooling
Information about
centrally sponsored
schemes
A respondent or person is not aware about the benefits
available under at least three Centrally Sponsored Schemes viz.
SGSY, MNREGA, IYA, OAP, TSC, ARWSP, SSA
Access to health Institutional delivery Delivery of last child took place at home among women in age
group 15-49 is considered to be poor
* We did not include cycle in this category. In the current times absence of cycle does not mean - he is poor or not, as many high income people also don‟t own cycle in many cases.
6
Weights
Principal Component Analysis (PCA) method was used for creating the individual dimension index
score. Each of the components used in the computation of the individual dimension index was assigned a
weight (factor score) generated through PCA, except, in case of access to the health dimension where
there was only one component. The resulting scores were standardized in relation to a normal distribution
with the mean of zero and standard deviation of one. Then, poverty cut-off from standardised scores
divided as 33.3% population of first lower quintiles considered as a poor and rest 33.3% middle and
33.3% rich were considered as non-poor. In the next step, unlike traditional approach giving equal
weights to three dimensions, we have calculated two set of MPI. First, the geometric mean of individual
dimension scores and second, the weighted mean of individual dimensions where weights were –
education and awareness (E) = 0.25, health (H) = 0.25 and assets and living standard (L) = 0.50. The
mathematical form of MPI calculation is as follows:
MPI = L*0.50 + E*0.25 + H*0.25
Decomposition models
We have decomposed caste inequalities through three main measures: the Gini, Theil, and Atkinson
inequality decomposition models. To decompose inequality in continuous variable like household
landholding of caste groups, we have used the Gini decomposition model. On the other hand, to
decompose inequality in categorical variables like education and health status, we have used Theil and
Atkinson decomposition models.
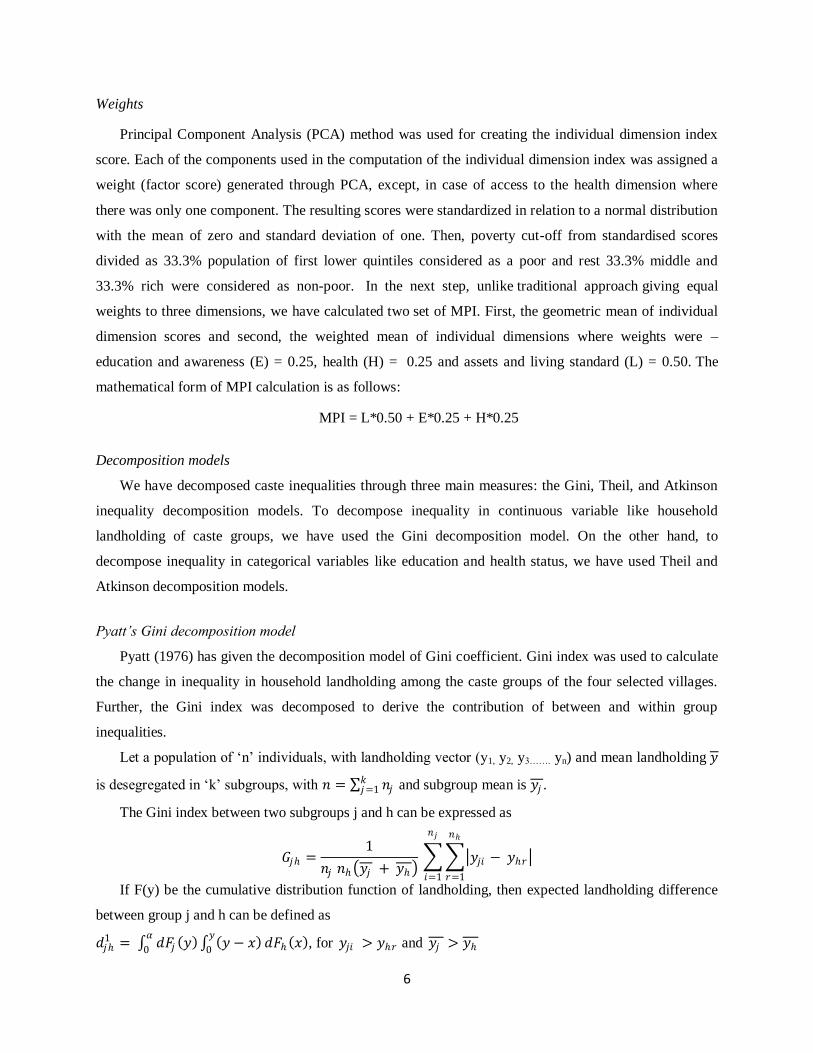
Pyatt’s Gini decomposition model
Pyatt (1976) has given the decomposition model of Gini coefficient. Gini index was used to calculate
the change in inequality in household landholding among the caste groups of the four selected villages.
Further, the Gini index was decomposed to derive the contribution of between and within group
inequalities.
Let a population of „n‟ individuals, with landholding vector (y1, y2, y3……. yn) and mean landholding 𝑦
is desegregated in „k‟ subgroups, with 𝑛 = 𝑛𝑗𝑘𝑗=1 and subgroup mean is 𝑦𝑗 .
The Gini index between two subgroups j and h can be expressed as
𝐺𝑗ℎ =1
𝑛𝑗 𝑛ℎ 𝑦𝑗 + 𝑦ℎ 𝑦𝑗𝑖 − 𝑦ℎ𝑟
𝑛ℎ
𝑟=1
𝑛𝑗
𝑖=1
If F(y) be the cumulative distribution function of landholding, then expected landholding difference
between group j and h can be defined as
𝑑𝑗ℎ1 = 𝑑𝐹𝑗 𝑦 𝑦 − 𝑥
𝑦
0
𝛼
0𝑑𝐹ℎ 𝑥 , for 𝑦𝑗𝑖 > 𝑦ℎ𝑟 and 𝑦𝑗 > 𝑦ℎ
7
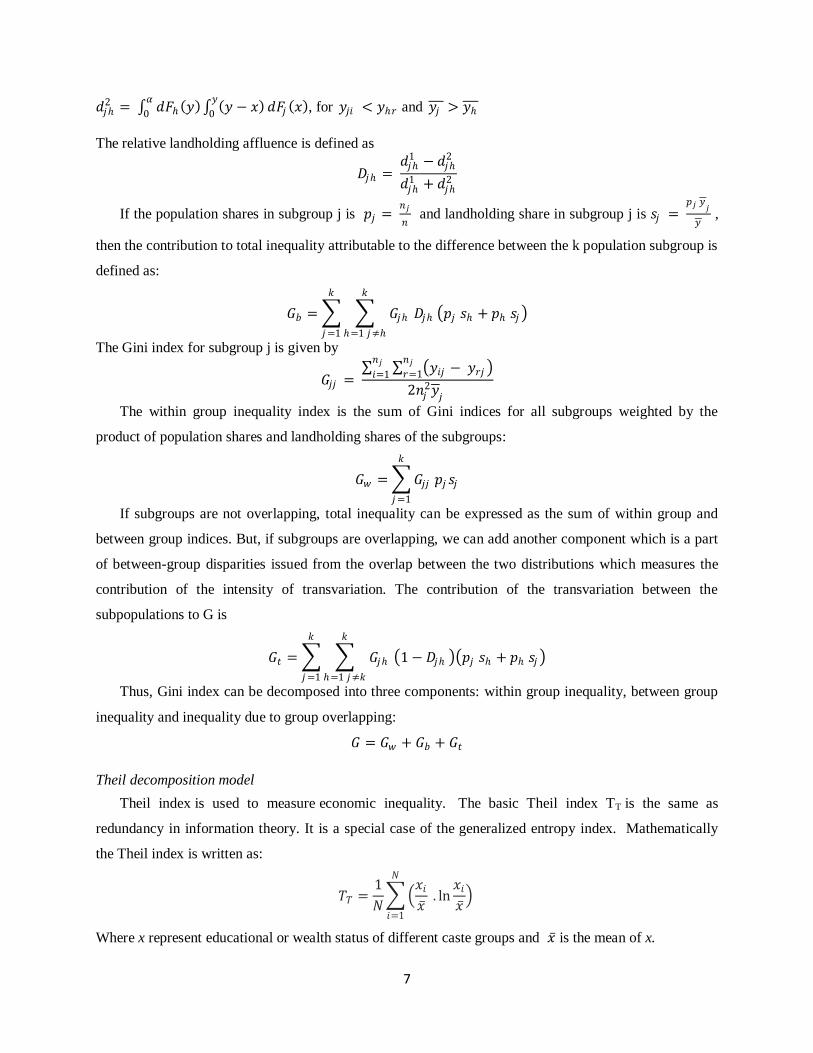
𝑑𝑗ℎ2 = 𝑑𝐹ℎ 𝑦 𝑦 − 𝑥
𝑦
0
𝛼
0𝑑𝐹𝑗 𝑥 , for 𝑦𝑗𝑖 < 𝑦ℎ𝑟 and 𝑦𝑗 > 𝑦ℎ
The relative landholding affluence is defined as
𝐷𝑗ℎ = 𝑑𝑗ℎ
1 − 𝑑𝑗ℎ2
𝑑𝑗ℎ1 + 𝑑𝑗ℎ
2
If the population shares in subgroup j is 𝑝𝑗 = 𝑛𝑗
𝑛 and landholding share in subgroup j is 𝑠𝑗 =
𝑝𝑗 𝑦𝑗
𝑦 ,
then the contribution to total inequality attributable to the difference between the k population subgroup is
defined as:
𝐺𝑏 = 𝐺𝑗ℎ
𝑘
ℎ=1 𝑗≠ℎ
𝑘
𝑗=1
𝐷𝑗ℎ 𝑝𝑗 𝑠ℎ + 𝑝ℎ 𝑠𝑗
The Gini index for subgroup j is given by
𝐺𝑗𝑗 = 𝑦𝑖𝑗 − 𝑦𝑟𝑗
𝑛𝑗𝑟=1
𝑛𝑗𝑖=1
2𝑛𝑗2𝑦
𝑗
The within group inequality index is the sum of Gini indices for all subgroups weighted by the
product of population shares and landholding shares of the subgroups:
𝐺𝑤 = 𝐺𝑗𝑗
𝑘
𝑗=1
𝑝𝑗 𝑠𝑗
If subgroups are not overlapping, total inequality can be expressed as the sum of within group and
between group indices. But, if subgroups are overlapping, we can add another component which is a part
of between-group disparities issued from the overlap between the two distributions which measures the
contribution of the intensity of transvariation. The contribution of the transvariation between the
subpopulations to G is
𝐺𝑡 = 𝐺𝑗ℎ
𝑘
ℎ=1 𝑗≠𝑘
𝑘
𝑗=1
1 − 𝐷𝑗ℎ 𝑝𝑗 𝑠ℎ + 𝑝ℎ 𝑠𝑗
Thus, Gini index can be decomposed into three components: within group inequality, between group
inequality and inequality due to group overlapping:
𝐺 = 𝐺𝑤 + 𝐺𝑏 + 𝐺𝑡
Theil decomposition model
Theil index is used to measure economic inequality. The basic Theil index TT is the same as
redundancy in information theory. It is a special case of the generalized entropy index. Mathematically
the Theil index is written as:
𝑇𝑇 =1
𝑁
𝑥𝑖𝑥
. ln𝑥𝑖𝑥
𝑁
𝑖=1
Where x represent educational or wealth status of different caste groups and 𝑥 is the mean of x.
8
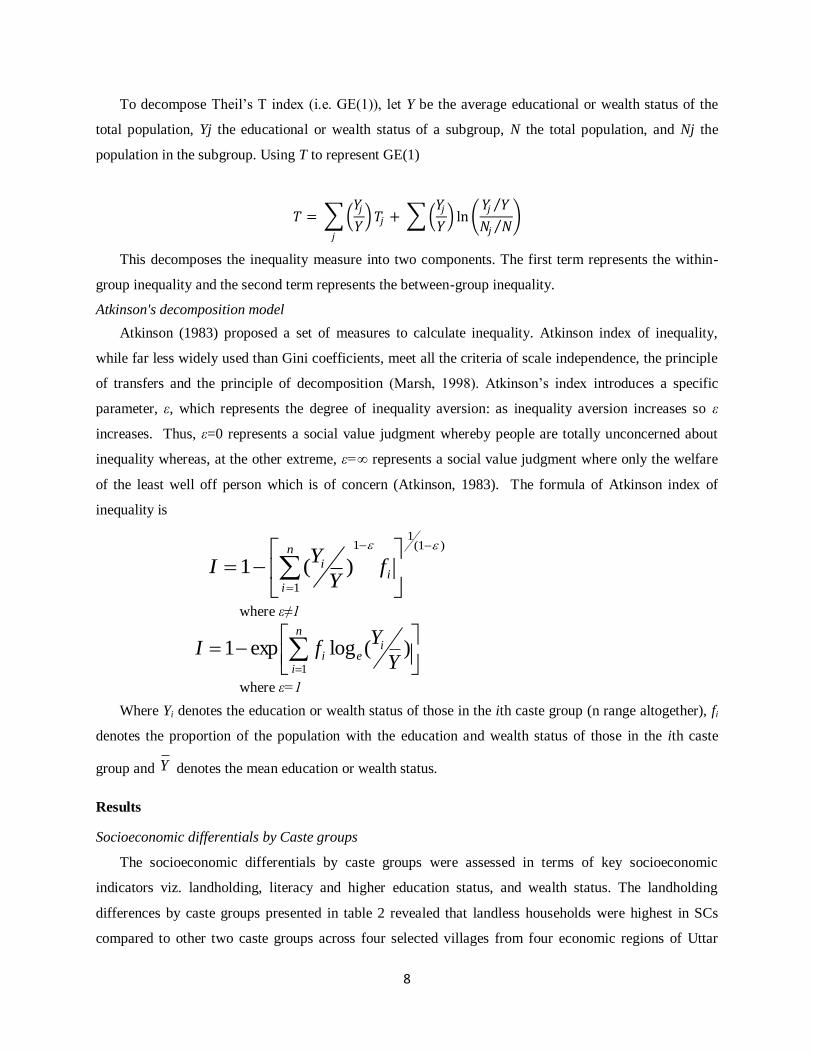
To decompose Theil‟s T index (i.e. GE(1)), let Y be the average educational or wealth status of the
total population, Yj the educational or wealth status of a subgroup, N the total population, and Nj the
population in the subgroup. Using T to represent GE(1)
𝑇 = 𝑌𝑗
𝑌
𝑗
𝑇𝑗 + 𝑌𝑗
𝑌 ln
𝑌𝑗 𝑌
𝑁𝑗 𝑁
This decomposes the inequality measure into two components. The first term represents the within-
group inequality and the second term represents the between-group inequality.
Atkinson's decomposition model
Atkinson (1983) proposed a set of measures to calculate inequality. Atkinson index of inequality,
while far less widely used than Gini coefficients, meet all the criteria of scale independence, the principle
of transfers and the principle of decomposition (Marsh, 1998). Atkinson‟s index introduces a specific
parameter, ε, which represents the degree of inequality aversion: as inequality aversion increases so ε
increases. Thus, ε=0 represents a social value judgment whereby people are totally unconcerned about
inequality whereas, at the other extreme, ε=∞ represents a social value judgment where only the welfare
of the least well off person which is of concern (Atkinson, 1983). The formula of Atkinson index of
inequality is
)1(1
1
1
)(1
i
n
i
i fY
YI
where ε≠1
n
i
iei Y
YfI
1
)(logexp1
where ε=1
Where Yi denotes the education or wealth status of those in the ith caste group (n range altogether), fi
denotes the proportion of the population with the education and wealth status of those in the ith caste
group and Y denotes the mean education or wealth status.
Results
Socioeconomic differentials by Caste groups
The socioeconomic differentials by caste groups were assessed in terms of key socioeconomic
indicators viz. landholding, literacy and higher education status, and wealth status. The landholding
differences by caste groups presented in table 2 revealed that landless households were highest in SCs
compared to other two caste groups across four selected villages from four economic regions of Uttar

9
Pradesh. In case of the Gohanakala village of Lucknow district in Central region of the state, the results
indicate that the landless households among scheduled caste were nearly two times higher (45%, p<0.01)
compared to OBCs (18%, p<0.01) and General caste (26%, p<0.01). The differences were more pervasive
at large landholdings. In comparison with scheduled caste households the large landholdings were several
times greater among General caste households. Also, such differences were statistically significant at
p<0.01. Similar results also observed in other three villages. In the Senapur village of the Jaunpur district
in the Eastern region of the state, the percentage of households without any land was two times greater in
SCs (58%, p<0.01) in comparison with General caste (26%, p<0.01). These differences become manifold
at large landholdings that, the SCs in this village were highly deprived in terms of large landholdings.
Table 2. Landholding among Caste Groups in selected Villages of Uttar Pradesh, 2013
Caste Groups Land
Less 0.1 to 1.00 1.00 to 2.5 2.5 to 5.0
Above
5.0
Chi square
test value and
significance
Mean
Distributio
n of Land
(in acres)
N
(Sample
Size)
Gohanakala (Lucknow District, Central Region)
General 25.80 28.10 29.20 15.70 1.10
64.547***
1.44 89
OBC 17.90 43.70 32.10 5.20 1.20 0.94 252
SC 45.10 39.50 13.00 1.90 0.60 0.78 162
Total 28.00 39.60 25.40 6.00 1.00 1.07 503
Senapur (Jaunpur District, Eastern Region)
General 26.40 26.40 32.60 7.00 7.80
93.897***
2.05 129
OBC 35.90 43.70 17.50 2.90 0.00 0.55 103
SC 58.60 31.60 8.90 0.80 0.00 0.52 237
Total 45.00 32.70 17.20 3.00 2.10 1.56 471
Pandari (Chitrakoot, Bundelkhan Region)
General 17.00 0.00 38.30 17.00 27.70
65.038*** 5.68 47
OBC 23.10 20.70 29.60 22.50 4.10 1.68 171
SC 36.20 29.60 18.40 11.20 4.60 1.44 122
Total 27.70 21.70 26.10 17.10 7.30 2.98 368
Seemli (Muzaffarnagar, Western Region)
General 33.30 66.70 0.00 0.00 0.00
24.141***
0.23 3
OBC 60.80 13.50 10.50 6.40 8.80 2.83 171
SC 47.50 19.70 25.40 4.90 2.50 2.04 122
Total 55.10 16.60 16.60 5.70 6.10 2.51 296 Note: Significance level *** = P value <0.01
The situation of Pandari village in Chitrakoot districts was also more or less same. In comparison
with General caste households, the scheduled caste households were two times higher in terms of
percentage of landless category households. These differences become manifold in case of large
landholdings and statistically significant at p<0.01. In case of the Seemli village in Muzaffarnagar district
10
of Western Uttar Pradesh, we found only three General caste households. Among other two caste groups,
although, OBCs as compared to SCs were in disadvantageous position in terms of landless but in terms of
large size of landholdings they were better-off in comparison with SCs.
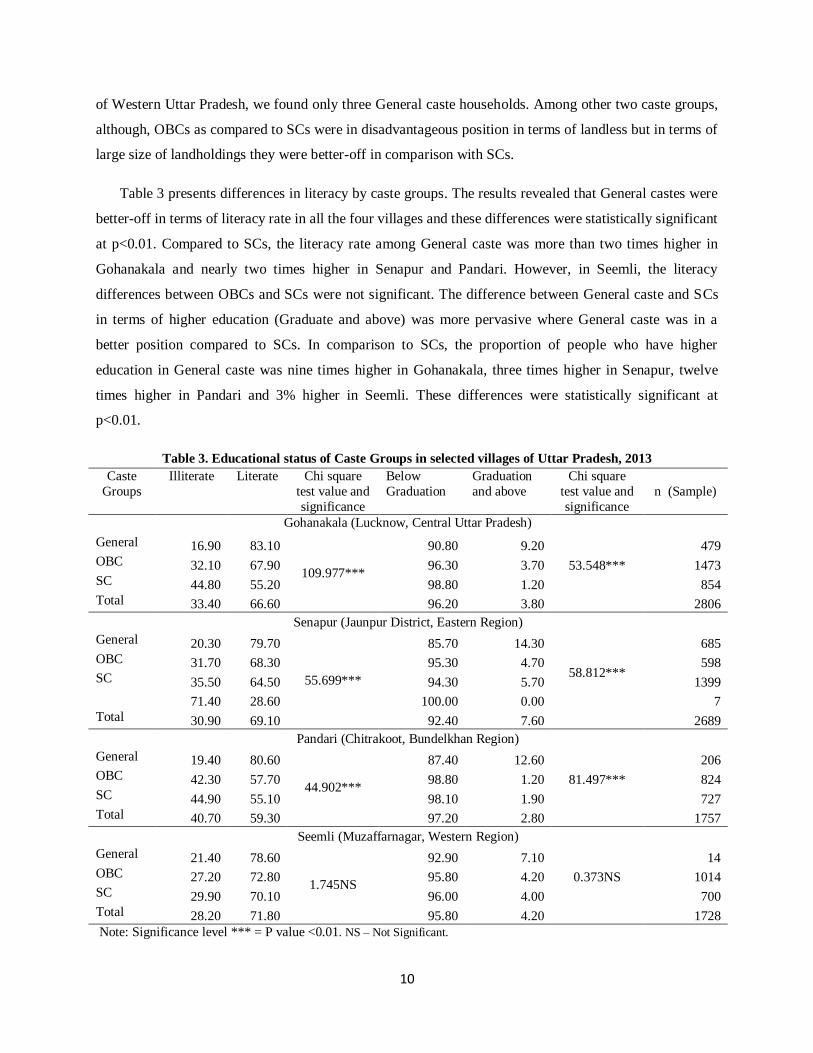
Table 3 presents differences in literacy by caste groups. The results revealed that General castes were
better-off in terms of literacy rate in all the four villages and these differences were statistically significant
at p<0.01. Compared to SCs, the literacy rate among General caste was more than two times higher in
Gohanakala and nearly two times higher in Senapur and Pandari. However, in Seemli, the literacy
differences between OBCs and SCs were not significant. The difference between General caste and SCs
in terms of higher education (Graduate and above) was more pervasive where General caste was in a
better position compared to SCs. In comparison to SCs, the proportion of people who have higher
education in General caste was nine times higher in Gohanakala, three times higher in Senapur, twelve
times higher in Pandari and 3% higher in Seemli. These differences were statistically significant at
p<0.01.
Table 3. Educational status of Caste Groups in selected villages of Uttar Pradesh, 2013
Caste
Groups
Illiterate Literate Chi square
test value and
significance
Below
Graduation
Graduation
and above
Chi square
test value and
significance
n (Sample)
Gohanakala (Lucknow, Central Uttar Pradesh)
General 16.90 83.10
109.977***
90.80 9.20
53.548***
479
OBC 32.10 67.90 96.30 3.70 1473
SC 44.80 55.20 98.80 1.20 854
Total 33.40 66.60 96.20 3.80 2806
Senapur (Jaunpur District, Eastern Region)
General 20.30 79.70
55.699***
85.70 14.30
58.812***
685
OBC 31.70 68.30 95.30 4.70 598
SC 35.50 64.50 94.30 5.70 1399
71.40 28.60 100.00 0.00 7
Total 30.90 69.10 92.40 7.60 2689
Pandari (Chitrakoot, Bundelkhan Region)
General 19.40 80.60
44.902***
87.40 12.60
81.497***
206
OBC 42.30 57.70 98.80 1.20 824
SC 44.90 55.10 98.10 1.90 727
Total 40.70 59.30 97.20 2.80 1757
Seemli (Muzaffarnagar, Western Region)
General 21.40 78.60
1.745NS
92.90 7.10
0.373NS
14
OBC 27.20 72.80 95.80 4.20 1014
SC 29.90 70.10 96.00 4.00 700
Total 28.20 71.80 95.80 4.20 1728
Note: Significance level *** = P value <0.01. NS – Not Significant.
11
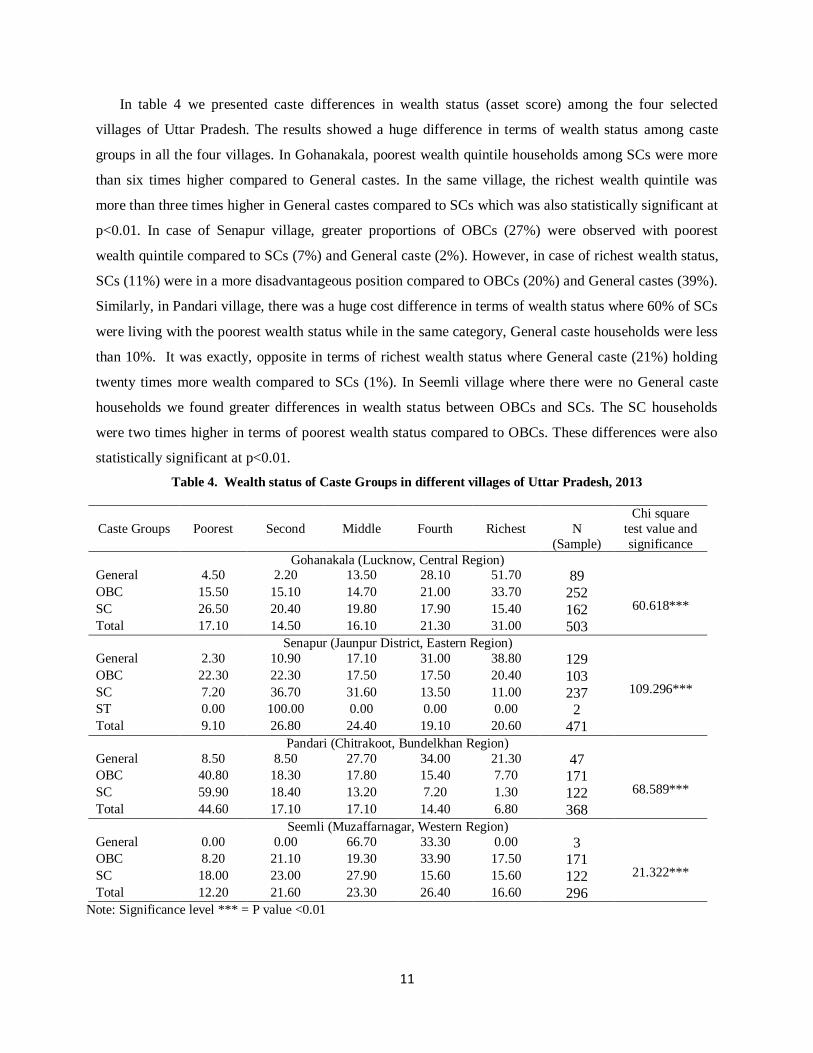
In table 4 we presented caste differences in wealth status (asset score) among the four selected
villages of Uttar Pradesh. The results showed a huge difference in terms of wealth status among caste
groups in all the four villages. In Gohanakala, poorest wealth quintile households among SCs were more
than six times higher compared to General castes. In the same village, the richest wealth quintile was
more than three times higher in General castes compared to SCs which was also statistically significant at
p<0.01. In case of Senapur village, greater proportions of OBCs (27%) were observed with poorest
wealth quintile compared to SCs (7%) and General caste (2%). However, in case of richest wealth status,
SCs (11%) were in a more disadvantageous position compared to OBCs (20%) and General castes (39%).
Similarly, in Pandari village, there was a huge cost difference in terms of wealth status where 60% of SCs
were living with the poorest wealth status while in the same category, General caste households were less
than 10%. It was exactly, opposite in terms of richest wealth status where General caste (21%) holding
twenty times more wealth compared to SCs (1%). In Seemli village where there were no General caste
households we found greater differences in wealth status between OBCs and SCs. The SC households
were two times higher in terms of poorest wealth status compared to OBCs. These differences were also
statistically significant at p<0.01.
Table 4. Wealth status of Caste Groups in different villages of Uttar Pradesh, 2013
Caste Groups Poorest Second Middle Fourth Richest
N
(Sample)
Chi square
test value and
significance
Gohanakala (Lucknow, Central Region) General 4.50 2.20 13.50 28.10 51.70 89
60.618*** OBC 15.50 15.10 14.70 21.00 33.70 252 SC 26.50 20.40 19.80 17.90 15.40 162 Total 17.10 14.50 16.10 21.30 31.00 503
Senapur (Jaunpur District, Eastern Region)
General 2.30 10.90 17.10 31.00 38.80 129
109.296*** OBC 22.30 22.30 17.50 17.50 20.40 103 SC 7.20 36.70 31.60 13.50 11.00 237 ST 0.00 100.00 0.00 0.00 0.00 2 Total 9.10 26.80 24.40 19.10 20.60 471
Pandari (Chitrakoot, Bundelkhan Region)
General 8.50 8.50 27.70 34.00 21.30 47
68.589*** OBC 40.80 18.30 17.80 15.40 7.70 171 SC 59.90 18.40 13.20 7.20 1.30 122 Total 44.60 17.10 17.10 14.40 6.80 368
Seemli (Muzaffarnagar, Western Region)
General 0.00 0.00 66.70 33.30 0.00 3
21.322*** OBC 8.20 21.10 19.30 33.90 17.50 171 SC 18.00 23.00 27.90 15.60 15.60 122 Total 12.20 21.60 23.30 26.40 16.60 296
Note: Significance level *** = P value <0.01
12
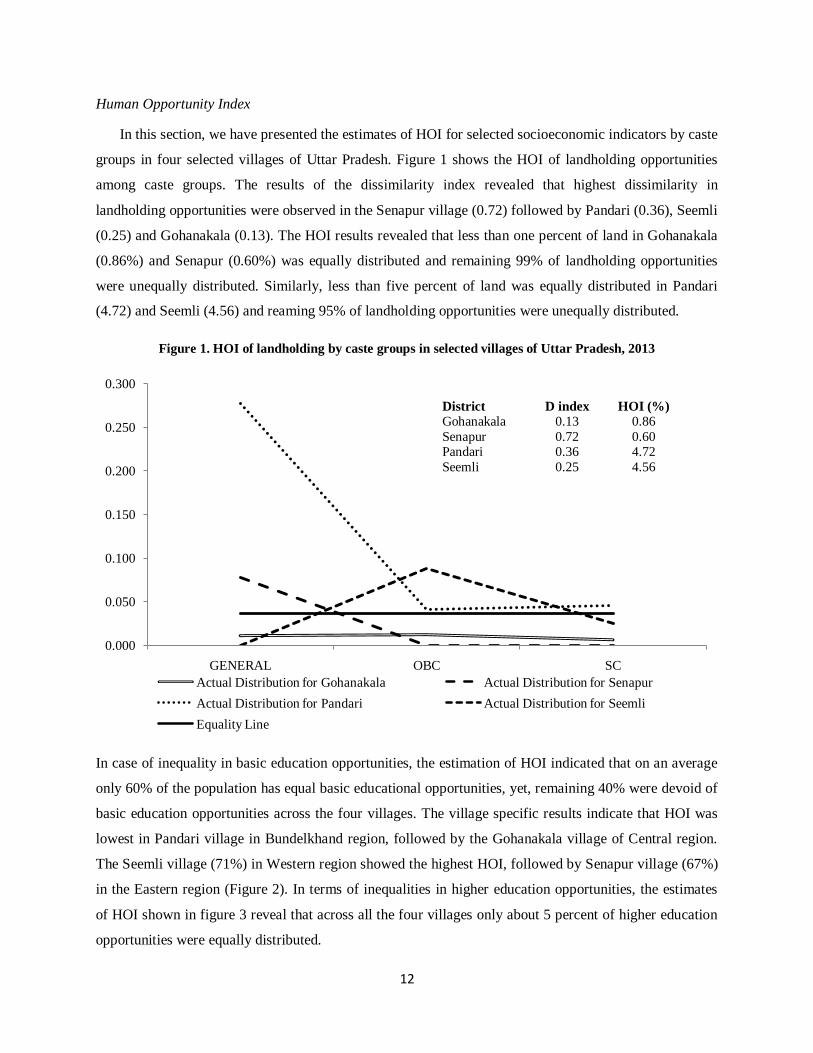
Human Opportunity Index
In this section, we have presented the estimates of HOI for selected socioeconomic indicators by caste
groups in four selected villages of Uttar Pradesh. Figure 1 shows the HOI of landholding opportunities
among caste groups. The results of the dissimilarity index revealed that highest dissimilarity in
landholding opportunities were observed in the Senapur village (0.72) followed by Pandari (0.36), Seemli
(0.25) and Gohanakala (0.13). The HOI results revealed that less than one percent of land in Gohanakala
(0.86%) and Senapur (0.60%) was equally distributed and remaining 99% of landholding opportunities
were unequally distributed. Similarly, less than five percent of land was equally distributed in Pandari
(4.72) and Seemli (4.56) and reaming 95% of landholding opportunities were unequally distributed.
Figure 1. HOI of landholding by caste groups in selected villages of Uttar Pradesh, 2013
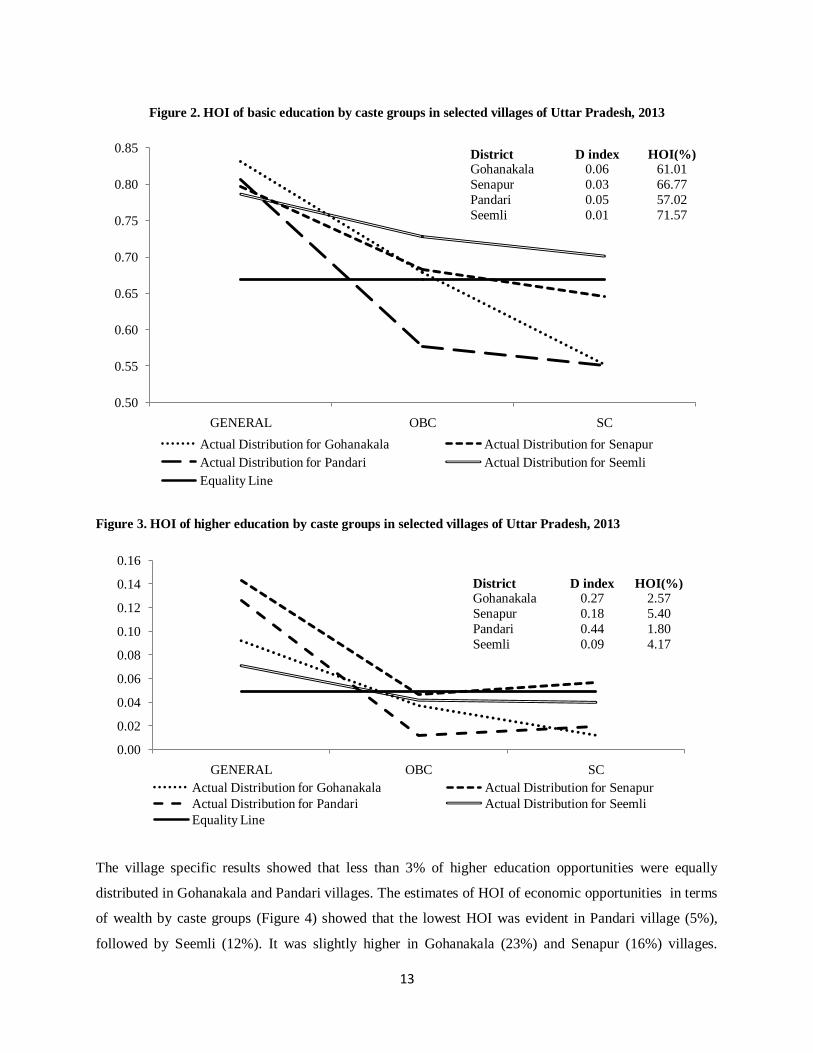
In case of inequality in basic education opportunities, the estimation of HOI indicated that on an average
only 60% of the population has equal basic educational opportunities, yet, remaining 40% were devoid of
basic education opportunities across the four villages. The village specific results indicate that HOI was
lowest in Pandari village in Bundelkhand region, followed by the Gohanakala village of Central region.
The Seemli village (71%) in Western region showed the highest HOI, followed by Senapur village (67%)
in the Eastern region (Figure 2). In terms of inequalities in higher education opportunities, the estimates
of HOI shown in figure 3 reveal that across all the four villages only about 5 percent of higher education
opportunities were equally distributed.
0.000
0.050
0.100
0.150
0.200
0.250
0.300
GENERAL OBC SC
Actual Distribution for Gohanakala Actual Distribution for Senapur
Actual Distribution for Pandari Actual Distribution for Seemli
Equality Line
District D index HOI (%)
Gohanakala 0.13 0.86
Senapur 0.72 0.60 Pandari 0.36 4.72
Seemli 0.25
4.56
13
Figure 2. HOI of basic education by caste groups in selected villages of Uttar Pradesh, 2013
Figure 3. HOI of higher education by caste groups in selected villages of Uttar Pradesh, 2013
The village specific results showed that less than 3% of higher education opportunities were equally
distributed in Gohanakala and Pandari villages. The estimates of HOI of economic opportunities in terms
of wealth by caste groups (Figure 4) showed that the lowest HOI was evident in Pandari village (5%),
followed by Seemli (12%). It was slightly higher in Gohanakala (23%) and Senapur (16%) villages.
0.50
0.55
0.60
0.65
0.70
0.75
0.80
0.85
GENERAL OBC SC
Actual Distribution for Gohanakala Actual Distribution for Senapur
Actual Distribution for Pandari Actual Distribution for Seemli
Equality Line
0.00
0.02
0.04
0.06
0.08
0.10
0.12
0.14
0.16
GENERAL OBC SC
Actual Distribution for Gohanakala Actual Distribution for Senapur
Actual Distribution for Pandari Actual Distribution for Seemli
Equality Line
District D index HOI(%) Gohanakala 0.06 61.01
Senapur 0.03 66.77
Pandari 0.05 57.02
Seemli 0.01 71.57
District D index HOI(%) Gohanakala 0.27 2.57
Senapur 0.18 5.40
Pandari 0.44 1.80
Seemli 0.09 4.17
14
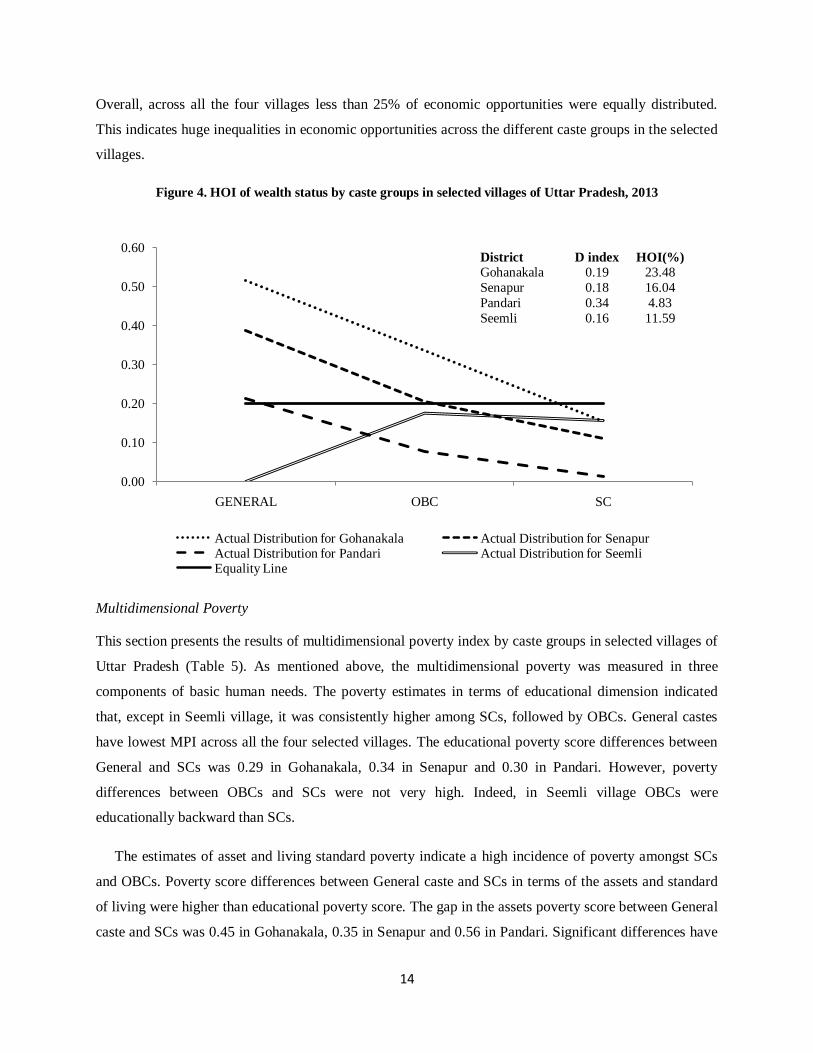
Overall, across all the four villages less than 25% of economic opportunities were equally distributed.
This indicates huge inequalities in economic opportunities across the different caste groups in the selected
villages.
Figure 4. HOI of wealth status by caste groups in selected villages of Uttar Pradesh, 2013
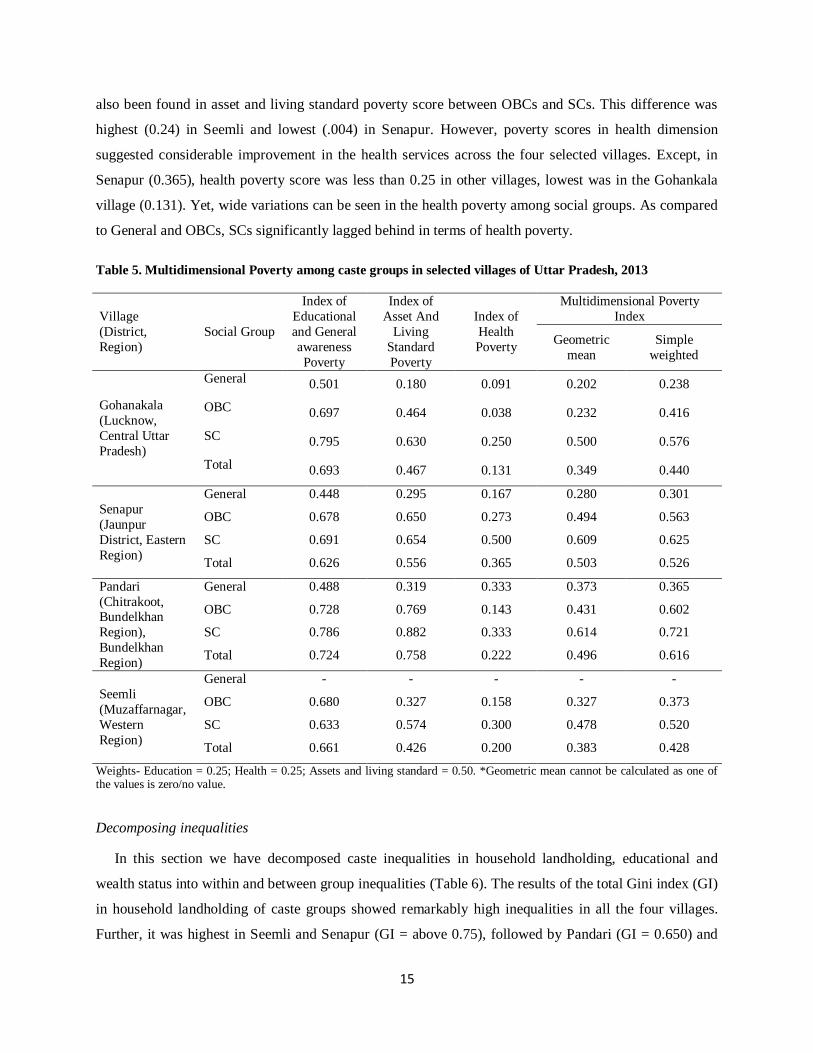
Multidimensional Poverty
This section presents the results of multidimensional poverty index by caste groups in selected villages of
Uttar Pradesh (Table 5). As mentioned above, the multidimensional poverty was measured in three
components of basic human needs. The poverty estimates in terms of educational dimension indicated
that, except in Seemli village, it was consistently higher among SCs, followed by OBCs. General castes
have lowest MPI across all the four selected villages. The educational poverty score differences between
General and SCs was 0.29 in Gohanakala, 0.34 in Senapur and 0.30 in Pandari. However, poverty
differences between OBCs and SCs were not very high. Indeed, in Seemli village OBCs were
educationally backward than SCs.
The estimates of asset and living standard poverty indicate a high incidence of poverty amongst SCs
and OBCs. Poverty score differences between General caste and SCs in terms of the assets and standard
of living were higher than educational poverty score. The gap in the assets poverty score between General
caste and SCs was 0.45 in Gohanakala, 0.35 in Senapur and 0.56 in Pandari. Significant differences have
0.00
0.10
0.20
0.30
0.40
0.50
0.60
GENERAL OBC SC
Actual Distribution for Gohanakala Actual Distribution for SenapurActual Distribution for Pandari Actual Distribution for SeemliEquality Line
District D index HOI(%)
Gohanakala 0.19 23.48
Senapur 0.18 16.04
Pandari 0.34 4.83
Seemli 0.16 11.59
15
also been found in asset and living standard poverty score between OBCs and SCs. This difference was
highest (0.24) in Seemli and lowest (.004) in Senapur. However, poverty scores in health dimension
suggested considerable improvement in the health services across the four selected villages. Except, in
Senapur (0.365), health poverty score was less than 0.25 in other villages, lowest was in the Gohankala
village (0.131). Yet, wide variations can be seen in the health poverty among social groups. As compared
to General and OBCs, SCs significantly lagged behind in terms of health poverty.
Table 5. Multidimensional Poverty among caste groups in selected villages of Uttar Pradesh, 2013
Village
(District,
Region)
Social Group
Index of
Educational
and General
awareness
Poverty
Index of
Asset And
Living
Standard
Poverty
Index of
Health
Poverty
Multidimensional Poverty
Index
Geometric
mean
Simple
weighted
Gohanakala
(Lucknow,
Central Uttar
Pradesh)
General 0.501 0.180 0.091 0.202 0.238
OBC 0.697 0.464 0.038 0.232 0.416
SC 0.795 0.630 0.250 0.500 0.576
Total 0.693 0.467 0.131 0.349 0.440
Senapur
(Jaunpur
District, Eastern
Region)
General 0.448 0.295 0.167 0.280 0.301
OBC 0.678 0.650 0.273 0.494 0.563
SC 0.691 0.654 0.500 0.609 0.625
Total 0.626 0.556 0.365 0.503 0.526
Pandari
(Chitrakoot, Bundelkhan
Region),
Bundelkhan
Region)
General 0.488 0.319 0.333 0.373 0.365
OBC 0.728 0.769 0.143 0.431 0.602
SC 0.786 0.882 0.333 0.614 0.721
Total 0.724 0.758 0.222 0.496 0.616
Seemli
(Muzaffarnagar,
Western
Region)
General - - - - -
OBC 0.680 0.327 0.158 0.327 0.373
SC 0.633 0.574 0.300 0.478 0.520
Total 0.661 0.426 0.200 0.383 0.428
Weights- Education = 0.25; Health = 0.25; Assets and living standard = 0.50. *Geometric mean cannot be calculated as one of the values is zero/no value.
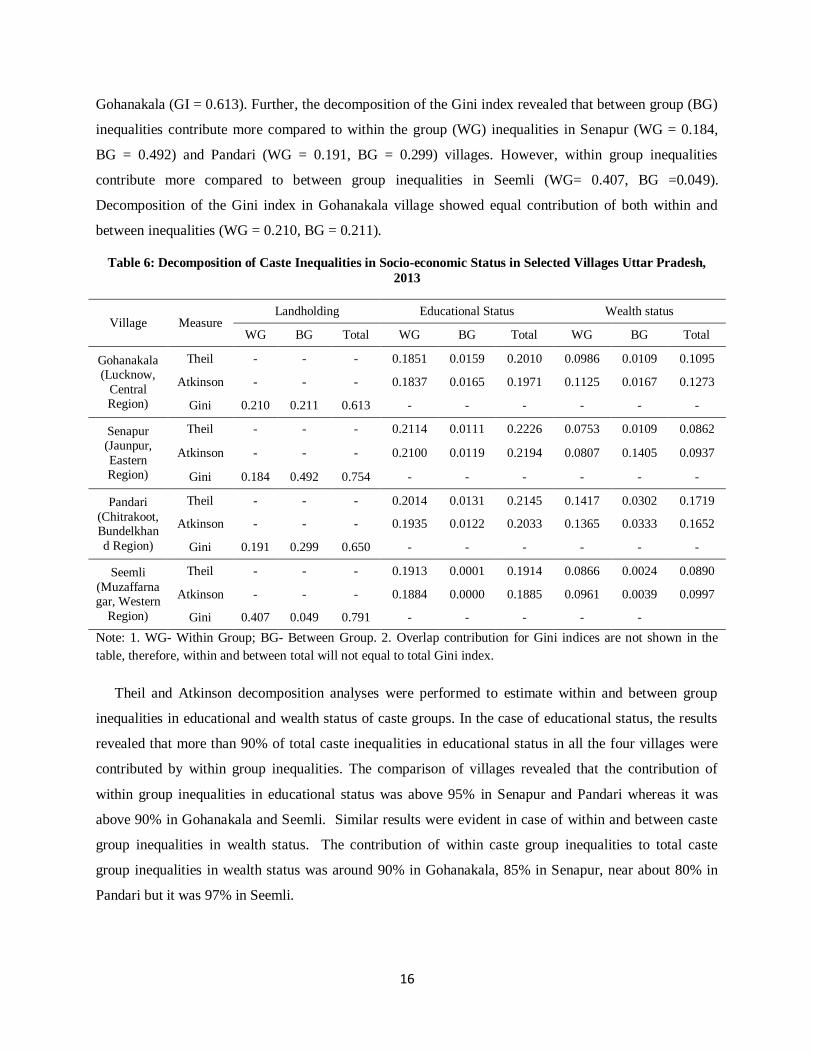
Decomposing inequalities
In this section we have decomposed caste inequalities in household landholding, educational and
wealth status into within and between group inequalities (Table 6). The results of the total Gini index (GI)
in household landholding of caste groups showed remarkably high inequalities in all the four villages.
Further, it was highest in Seemli and Senapur (GI = above 0.75), followed by Pandari (GI = 0.650) and
16
Gohanakala (GI = 0.613). Further, the decomposition of the Gini index revealed that between group (BG)
inequalities contribute more compared to within the group (WG) inequalities in Senapur (WG = 0.184,
BG = 0.492) and Pandari (WG = 0.191, BG = 0.299) villages. However, within group inequalities
contribute more compared to between group inequalities in Seemli (WG= 0.407, BG =0.049).
Decomposition of the Gini index in Gohanakala village showed equal contribution of both within and
between inequalities (WG = 0.210, BG = 0.211).
Table 6: Decomposition of Caste Inequalities in Socio-economic Status in Selected Villages Uttar Pradesh,
2013
Village Measure Landholding Educational Status Wealth status
WG BG Total WG BG Total WG BG Total
Gohanakala (Lucknow,
Central Region)
Theil - - - 0.1851 0.0159 0.2010 0.0986 0.0109 0.1095
Atkinson - - - 0.1837 0.0165 0.1971 0.1125 0.0167 0.1273
Gini 0.210 0.211 0.613 - - - - - -
Senapur (Jaunpur,
Eastern Region)
Theil - - - 0.2114 0.0111 0.2226 0.0753 0.0109 0.0862
Atkinson - - - 0.2100 0.0119 0.2194 0.0807 0.1405 0.0937
Gini 0.184 0.492 0.754 - - - - - -
Pandari
(Chitrakoot, Bundelkhan
d Region)
Theil - - - 0.2014 0.0131 0.2145 0.1417 0.0302 0.1719
Atkinson - - - 0.1935 0.0122 0.2033 0.1365 0.0333 0.1652
Gini 0.191 0.299 0.650 - - - - - -
Seemli
(Muzaffarnagar, Western
Region)
Theil - - - 0.1913 0.0001 0.1914 0.0866 0.0024 0.0890
Atkinson - - - 0.1884 0.0000 0.1885 0.0961 0.0039 0.0997
Gini 0.407 0.049 0.791 - - - - -
Note: 1. WG- Within Group; BG- Between Group. 2. Overlap contribution for Gini indices are not shown in the
table, therefore, within and between total will not equal to total Gini index.
Theil and Atkinson decomposition analyses were performed to estimate within and between group
inequalities in educational and wealth status of caste groups. In the case of educational status, the results
revealed that more than 90% of total caste inequalities in educational status in all the four villages were
contributed by within group inequalities. The comparison of villages revealed that the contribution of
within group inequalities in educational status was above 95% in Senapur and Pandari whereas it was
above 90% in Gohanakala and Seemli. Similar results were evident in case of within and between caste
group inequalities in wealth status. The contribution of within caste group inequalities to total caste
group inequalities in wealth status was around 90% in Gohanakala, 85% in Senapur, near about 80% in
Pandari but it was 97% in Seemli.
17
Discussion
In this study, we have assessed inequalities in socioeconomic opportunities and multi-dimensional
poverty among social groups in rural Uttar Pradesh by collecting evidence from four village census
surveys. The findings of this study provided evidence for huge inequalities in socioeconomic
opportunities and multi-dimensional poverty across the caste groups in all the four villages of Uttar
Pradesh. It was consistently found across all the four villages that scheduled castes were in a
disadvantageous position in terms of landholding, educational and economic opportunities. Though, other
backward castes were better than scheduled castes but worse compared to General castes in terms of all
socioeconomic indicators. These inequalities were worse in terms of landholding and higher education
opportunities compared to other assets distribution and literacy rate. A composite measure of multi-
dimensional poverty also indicated huge inequalities across the caste groups. Moreover, caste group
inequalities in MPI were greater in Pandari village located in the backward region like Bundelkhand,
followed by the Senapur village of Eastern region but comparatively less in Seemli village located in the
developed Western region of the state.
Decomposing caste group inequalities into between and within group inequalities in landholding,
education and wealth status foster that between group inequalities among caste continue to persist in
landholding, especially, among the villages (Pandari and Senapur) located in poorer region of the state.
Gohankala village which is near to urban center suggest the presence of both within and between
inequalities. Seemli village which has only OBCs and SCs suggest a greater contribution from within
group inequalities. However, in case of both education and wealth status, within group inequalities
contributed 80-90% of total inequalities. Yet, HOI plots indicated that within group inequalities greater in
SCs compared to General Castes. Overall, the findings of this study suggested huge inter-caste
inequalities in landholding, intra-caste inequalities in education and wealth status in selected villages of
Uttar Pradesh.
Conclusion
With the help of analyses of information collected from four village census in four regions of Uttar
Pradesh, we made some important conclusions related to each dimension. First, huge inequalities of
opportunities in terms of landholding, especially, large landholdings reflect the failure of Uttar Pradesh
Government in the implementation of land reforms. Some of the previous studies have theoretically
argued that the land ceiling law has been ineffective to make any dent on the landholding structure of the
state in Uttar Pradesh. Further, the recently notified Uttar Pradesh revenue Code 2006 has weakened the
pro-poor provisions of the UP Zamindari Abolition and Land Reforms Act, 1950. It is a huge blow to
18
efforts in the direction of uniform distribution of land resources in Uttar Pradesh (Trivedi, 2013). The
affirmative action efforts in terms of bringing equity in landholding are less intensive and effective
compared to education and employment. The affirmative policies rather failed to fight against „caste-
feudal system‟ in landholding. This could be one reason why between group caste inequalities in
landholding still dominant in remote villages of Uttar Pradesh.
Second, in terms of education, though, the literacy rate has improved across all the caste groups, yet,
higher education failed to penetrate into scheduled castes in comparison to other backward and general
castes. The continued discrimination and unequal treatment of Dalit children in schools (Union Human
Resource Development, 2012) and poor economic status are possibly the major reason for SCs not
reaching higher education. Majority of them dropping before completion of high schools, thus, not
reaching higher education. Third, the skewed wealth distribution and high prevalence of multidimensional
poverty among SCs can also be attributed for continued chronic caste inequalities in major resources like
landholding and higher education in the villages of Uttar Pradesh. Uttar Pradesh had a major political
movement to mobilise the Dalits and the other backward castes in the state. However, like previous
studies (Pai and Singh, 1997; Mehrotra, 2006; Narayan, 2014), our newest empirical findings revealed
that UP‟s lower castes had, before the mobilisation began, and still have, the worst social indicators in the
state. Moreover, our decomposition analyses provide an hint that reservation policies advantage in
education may not reaching the entire lower caste group equally rather its fruits unequally distributed
within the SCs and OBCs as evident from huge within group inequalities. Furthermore, very less within
caste inequalities in education and assets holding among General caste compared to SCs and OBCs foster
that at macro level still General caste are at standing with better socioeconomic status compared to SCs
and OBCs.
Though, the conclusions of this study mayn‟t sound entirely unmarked but they are re-assuring
evidence towards huge existing socioeconomic inequalities among caste groups with the latest evidence
primarily collected from the village census surveys. Thus, the findings of the study definitely refresh our
thought on the persisting socioeconomic inequalities among the caste groups in the villages of Uttar
Pradesh. Also, re-stress the relevance of caste system in understanding socioeconomic position of
individuals in modern society in India. Moreover, we agreed with some of the previous study's findings to
change in the idealism of traditional caste practices across the scheduled castes who continued to imitate
their counterparts (Pai and Singh, 1997; Mehrotra, 2006; Narayan, 2014) but still a huge gap need to be
closed in terms of material and status holding across the caste groups in Uttar Pradesh. Land holdings and
higher education are crucial instruments to uplift the scheduled caste of Uttar Pradesh. The government of
Uttar Pradesh and Central government need to take note of these huge inequalities in landholding and
higher education. Especially, the Uttar Pradesh Government needs to take back recently notified Uttar
19
Pradesh revenue Code 2006 which weakens the equidistribution of land in the state. In order to prevent
the dropout rates of Dalit students from schools, there is need to eliminate the social and cultural
discrimination and unequal treatment of Dalits children at schools. The government needs to bring higher
education opportunities and strengthen the financial support mechanism for higher education in order to
improve higher education enrollment among lower social groups in the state.
However, a new challenge is to address an emerging strong argument that reservations tend to benefit
a „creamy layer‟ of SCs and STs. In their direct impact, reservation policies have increased inequalities
within the SCs and STs populations (Weisskopf, 2004; Verma, 2010). By taking this argument into
consideration some states have introduced 'quota to backward SC/ST within SC/ST quota' but it invited a
serious protest from other SCs/STs as evident in the state of Andhra Pradesh ultimately led to cancellation
of such provisions. Moreover, Desai and Kulkarni (2008) said “they do not find any evidence that the so-
called creamy layer of Dalits and adivasis, disproportionately benefit from the affirmative action program
at the expense of their lower-income counterparts”. Further, bringing the general caste poor under the
protection of affirmative programs is gaining grounds in the opinion of the academic community and
policy makers. However, our findings also support that within inequalities in General caste is much less
compared to within inequalities in SCs and OBCs, thus, on an average General caste have a much better
socioeconomic status compared SCs and OBCs. The absolute number of poor in General caste is very less
compared to their counterparts. Looking towards an alternative policy option, Deshpande (2012) said “in
order to reduce caste discrimination, increasing quotas in higher education and formal employment cannot
be a solution rather increased access to productive assets such as land through land reforms, and to
alternative sources of livelihoods through rural non-farm employment should be the targeted strategy”.
This is a crucial juncture to strengthen existing protective measures, address the loopholes and ensure
proper implementation to reach the benefits to the SCs/STs in general and most backward SCs/STs in
particular to avoid the both within and between caste inequalities. Furthermore, historically breaking
endogamy system of marriage practices is treated to be an important affirmative action to reduce caste
inequalities in India because still there is a huge resistance for inter-caste marriage. Even if the higher
educated and higher economic status scheduled caste boy/girls are rarely allowed to marrying even poor
upper caste girls/boys. Thus, there is also need to bring change in caste mindset of the people (Goli et al.,
2013). Therefore, any efforts to break caste order should adopt multiple approaches ranging from cultural
to social and economic discriminations in Uttar Pradesh as well as in India.
20
References
Alkire, S and J, Foster. (2007), Counting and Multidimensional Poverty, OPHI Research in Progress 1a.
Alkire, S., Roche, J. M., Santos, M. E. and Seth, S. (2011), Multidimensional Poverty Index 2011: Brief
Methodological Note, Oxford Poverty & Human Development Initiative (OPHI).
Atkinson, A.B. (1970), “On the measurement of inequality”. Journal of Economic Theory, Vol. 2 No. 3,
pp. 244–263.
Barros, R and Ferreira, F. et al. (2011), “Measuring Progress toward Basic Opportunities for All”,
Brazilian Review of Econometrics, Vol.30, No. 2, pp. 335-367.
Barros, R and Ferreira, F. et al. (2009), Measuring Inequality of Opportunity in Latin America and the
Caribbean, Washington, DC: The World Bank.
Bhagat, R. B. (2007), "Caste Census Looking Back, Looking Forward", Economic & Political Weekly,
Vol. 42, No. 21, pp. 1902-07.
Bhagat, R. B. (2010), "Why Count Caste in the Census of 2011?", Economic & Political Weekly, Vol. 45,
No. 30, pp. 4.
Bhagat, R. B. (2013), “Conditions of SC/ST Households A Story of Unequal Improvement”, Economic and Political Weekly, Vol. 48, No. 41, pp. 62-66.
De, J. and Gollerkeri, R. S. (1986), “Socio-Cultural Aspects of Infectious Hepatitis in Vadodara, India”, Asian Geographer, Vol. 5, No. 1, 99-105.
Desai, S and Dubey, A. (2012), “Caste in 21st Century India: Competing Narratives”, Economic Political
Weekly, Vol.46, No. 11, pp. 40–49.
Desai, S. (2010), "Caste and Census: A Forward Looking Strategy", Economic & Political Weekly, Vol. 45, No. 29, pp. 10-13.
Desai, S. and Dubey, A. (2011), "Caste in 21st Century India: Competing Narratives march", Economic &
Political Weekly, Vol. 45, No. 11, pp. 40-49.
Deshpande, A. (2000), “Does Caste Still Define Disparity? A Look at Inequality in Kerala, India”, The
American Economic Review, Vol. 90, No. 2, pp. 322–325.
Deshpande, A. (2012), The Grammar of Caste- Economic Discrimination in Contemporary India, Oxford
University Press, New Delhi.
Dumont, L. (1980), Homo Hierarchicus: The Caste System and Its Implications, (Chicago: University of
Chicago Press).
Gerth, H. H. and Mills, C. W. (1946), From Max Weber: Essays in sociology, Oxford University
Press, New York .
Goli, S. Singh, D. and Shekar T.V. (2013). Exploring the Myth of Mixed Marriages in India: Evidence
from a Nation-wide Survey. Journal of Comparative Family Studies, Vol. 44 No.2.
21
Goli S., Riddhi, D., and Arokiasamy, P. (2013). Pathways of economic inequalities in maternal and child
health in urban India: A Decomposition analysis. PLOS One medical Journal. DOI 10.1371/journal.pone.0058573.
Goli, S. and Apollou LMP. (2014). „Landholding-Patriarchy Hypothesis‟ and Women‟s Autonomy in Rural India: An Exploration of Linkagee, International Journal of Social-economics, Vol. 41 No.3.
Gouda, J., Das, K.C., Srinivas, G. and Apollo LMP. (2013). Government versus Private Primary Schools
in India: An Assessment of Physical Infrastructure, Schooling Costs and Performance. International Journal of Sociology and Social Policy, Vol. 33 Iss: 11/12, pp.708 – 724.
Gupta, D. (2000), Interrogating Caste: Understanding Hierarchy and Difference in Indian Society, New Delhi: Penguin Books.
IIPS and Macro-Internationals (1992-93, 1998-99, 2005-06), National Family Health Survey 1-3, International Institute for Population Sciences, Mumbai.
Jeffrey, C., Jeffery, P. and Jeffery, R. (2008), Dalit Revolution? New Politicians in Uttar Pradesh, India. The Journal of Asian Studies, Vol. 67, pp. 1365-1396. Doi: 10.1017/S0021911808001812.
Jodhka, SS. (2012), Village Society: Essays in Economic and Political Weekly, Mumbai: Orient
Blackswan.
Kapur, D. and Prasad, C. B. et al. (2010), “Rethinking Inequality: Dalits in Uttar Pradesh in the Market
Reform Era”, Economic & Political Weekly, Vol.45 , No. 35, pp. 39-49.
Khachane, R. B. (2010), “Counting Backward, Moving Forward”, Economic & Political Weekly Vol. 44 ,
No. (33), pp. 4.
Kopparty, S. N. M. (1994), Social Inequality and Health Care: A Study in Health Behaviour in Rural
Andhra Pradesh, Northern Book Centre, New Delhi.
Mamgain, R. P. (2013), "Situating Scheduled Castes and Scheduled Tribes in the Post-2015 Development
Framework", Oxfam India Working Paper Series, OIWPS-XIX.
Mehrotra, S. (2006), "Well-being and Caste in Uttar Pradesh: Why UP Is Not Like Tamil Nadu",
Economic & Political Weekly, Vol.41, No. 40, pp. 4261-71.
Mehta, B. C. and Kapoor, K. (1998), "Caste, Education and Class Relationship in India", Journal of
Higher Education, Vol.21, No. (1), pp. 37-58.
Milner, M. (1994), Status and Sacredness: A General Theory of Status Relations and an Analysis of
Indian Culture, New York: Oxford University Press.
Narayan, B. (2014), "The Politics of Reservation, Categories in Uttar Pradesh", Economic & Political
Weekly, Vol.49, No. 5, pp. 18-20.
Nayar, K. R. (2007), "Social exclusion, caste & health: A review based on the social determinants framework", Indian Journal of Medical Research, 126, pp. 355-363.
Omvedt, G. (2013), Understanding Caste: From Buddha to Ambedkar and beyond, Second Edition, Orient Blackswan Private Limited, New Delhi.
22
Pai, S. and Sing, J. (1997), "Politicisation of Dalits and Most Backward Castes Study of Social Conflict
and Political Preferences in Four Villages of Meerut District", Economic & Political Weekly, Vol. 32, No. 23, pp. 1356-61.
Sen, A. (2000), "Social Exclusion: Concept, Application, and Scrutiny", Social Development Papers No. 1, Office of Environment and Social Development, Asian Development Bank, Manila.
Shah, A. M. (1998), “Can the Caste Census Be Reliable”? Economic and Political Weekly, Vol. 26:
pp.2498-2499.
Singh, H. (2014), Recasting Caste-From the Sacred to the Profane, Sage Publication, India.
Singh, A. K. and Mehrotra, S. (2014). Land Policies for equality and growth: Transforming the
agrarian structure in Uttar Pradesh. New Delhi, SAGE Publications India Pvt. Ltd.
Srinivas, M. N. (1986): The Dominant Caste and Other Essays, New Delhi, Oxford India Paperbacks,
1987.
Srinivas, M. N. (1996): Caste: It’s Twentieth Century Avatar, New Delhi, Penguin Books.
Subramanian, S. V. and Shailen, N. et al. (2006): “The Mortality Divide in India: The Differential
Contributions of Gender, Caste, and Standard of Living across the Life Course”, American Journal of Public Health, Vol. 96, No. 5, pp. 818–825.
Sudarshan, R. M. (2010), “The Irrelevance of Caste Census”, Economic & Political Weekly, Vol. 44 , No. 33, pp. 4.
Thorat, S. and Newman, K. S. (eds) (2009): Blocked by Caste: Economic Discrimination and Social Exclusion in Modern India, New Delhi: Oxford University Press.
The Hindu (2014), UP Dalit Sisters Raped: Five accused held, The Hindu, 31st May,
www.thehindu.com/news/national/other-states/up/2/seek/cbi-probe-into-badaun-rape-murder-
article6070483.ece
Trivedi, P. K. (2013), "Reversal of Land Reforms: New Revenue Code of Uttar Pradesh", Economic and Political Weekly, Vol. 48, No. 48, pp. 26-28.
Union Human Resource Development (2012). A status report of discrimination in schools submitted by 41 independent monitoring institutes (MI), Union Human Resource Development, New Delhi.
Verma, A. K. (2010). Subalterns in Uttar Pradesh, A New Trajectory, Economic & Political Weekly, Vol. 44, No. 48, pp. 11-13
Weisskopf, T. E. (2004). Impact of Reservation on Admissions to Higher Education in India, Economic and Political Weekly, Vol. 25, pp. 4339-4349.
Top Related
Copyright © 2022 FDOKUMEN

