


Bahasa
Halaman
Hukum

Journal of Agricultural Economics Volume 55 Number 1 March 2004 Pages 41-58
Agricultural Economics Society
Consumer Welfare and the Loss Induced by Withholding Information The Case of BSE in Italy
Mario Mazzocchi Gianluca Stefani Spencer J Henson1 (Original submitted November 2002 revision received October 2003 accepted January 2004)
The paper develops a measure of consumer welfare losses associated with withholding information about a possible link between BSE and vCJD The Cost of Ignorance (COI) is measured by comparing the utility of the informed choice with the utility of the uninformed choice under conditions of improved information Unlike previous work that is largely based on a single equation demand model the measure is obtained retrieving a cost function from a dynamic Almost Ideal Demand System The estimated perceived loss for Italian consumers due to delayed information ranges from 12 percent to 54 percent of total meat expenditure depending on the month assumed to embody correct beliefs about the safety level of beef 1 Introduction In general food scares imply a welfare loss for households and a related reallocation of expenditure among goods because of the objective change in the safety level of available food products However when relevant information about potential risks to health is withheld for a period of time a specific cost is borne by consumers since they are not able to change their behaviour as they would have done if warned This cost has been termed the Cost of Ignorance (COI) (Foster and Just 1989) and takes the form of regret when consumers eventually are informed about the potential risks that they face and look back to the actions they could have taken in response Concerns about the consequences of consuming unsafe food under conditions of ignorance affect consumer decisions This is particularly the case when uncertainty persists after the release of information However the analysis of actual purchasing behaviour does not provide a complete assessment of the impact of new information Thus a monetary assessment through the COI approach has great relevance for evaluating the welfare effects of policy actions It is generally recognised that information about the potential risks to human health remained undisclosed for some time during the BSE crisis of the early to mid-
1 Mario Mazzocchi is a lecturer at the University of Reading Department of Agricultural and Food Economics
PO Box 237 Reading RG6 6AR UK E-mail mmazzocchireadingacuk Gianluca Stefani is Associate Professor at the University of Florence (I) Department of Agricultural and Resource Economics and PhD student at the University of York (UK) Department of Environment Spencer J Henson is Associate Professor at the University of Guelph (CA) Department of Agricultural Economics and Business No senior authorship is granted The authors would like to thank the anonymous referees and the Editor for their helpful comments The usual caveats apply Research supported by the European Commission Quality of Life Programme Key Action 1 - Food Nutrition and Health Research Project Food Risk Communication and Consumers Trust in the Food Supply Chain - TRUST (contract no QLK1-CT-2002-02343)
42 Mario Mazzocchi Gianluca Stefani and Spencer Henson
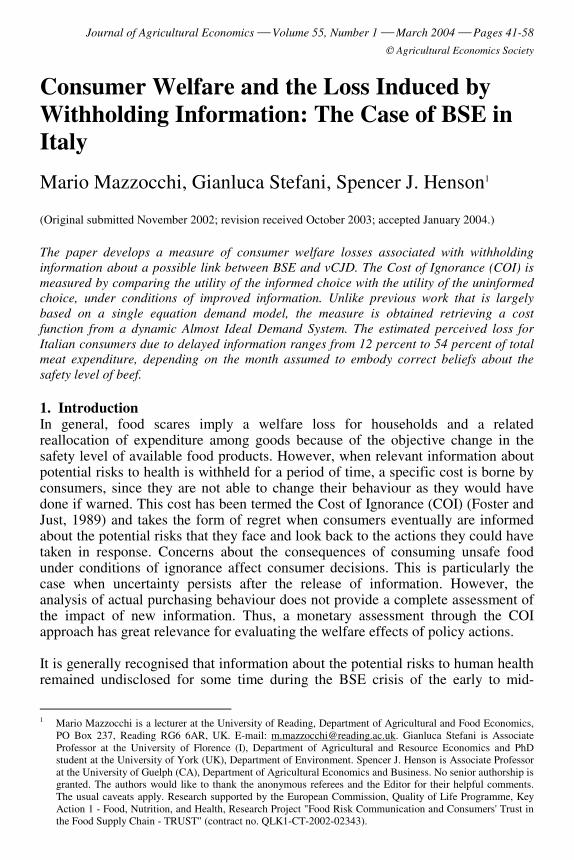
1990s Drawing on the work of Foster and Just (1989) this study develops an approach to measure the consumer welfare loss from the BSE crisis focusing on the effects of consumption decisions under conditions of imperfect information In March 1996 the news about a possible linkage between BSE and vCJD in humans triggered a major food scare in Europe A sudden fall in beef consumption all over Europe was just the first sign of a crisis which soon became structural influencing purchasing and consumption habits towards meats specifically and food in general A crucial issue in the BSE debate was the effect of withheld information on the potential risk for beef consumers More specifically the BSE issue highlighted asymmetries in food safety information and undermined consumer trust towards institutions This paper uses the COI measure to assess the impact on consumer welfare of non-disclosure of information due to concerns by consumers at their inability to adjust their consumption behaviour The COI measure and the underlying concepts are described in Section 2 A methodology for deriving a COI measure based upon the estimation of a dynamic Almost Ideal Demand System is presented in Section 3 whereas the results of an empirical implementation to the 1996 BSE scare in Italy are reported in Section 4 The main findings of the study are summarised in Section 5 2 Theoretical aspects of cost of ignorance (COI) Within the traditional consumer surplus framework welfare change measures are given by areas under the relevant demand curves A paradoxical result may be obtained when new information reveals the potential hazards linked to the consumption of a particular good As a consequence of this informational change the demand curve for the affected good is likely to shift inwards Thus using the area under the curve as a measure of consumer surplus leads to the conclusion that the provision of information makes consumers worse-off In other words ignorance is bliss and there are no consequent costs (Teisl and Roe 1998) To address this paradox we need to bear in mind the timing of the adaptation process triggered by the crisis Figure 1 illustrates the different steps involved in the decision process once the crisis has occurred As information is withheld for some time steps 0 and 1 take place In this case choices are made under ignorance and agents rely only on their prior beliefs that is they assume the food is as safe as it used to be As information about the health threat is released agents update their beliefs and a modified consumption pattern emerges The paradox of blissful ignorance arises because welfare comparison is made under different informational states If the utility function (or alternatively the cost function) depends on the subjective perceptions of the safety level of food then consumption under ignorance would yield higher utility than informed consumption However welfare measures should be undertaken under improved information because only in this state can the different allocations of consumption (under ignorance and informed) be correctly judged Indeed COI is measured by comparing the utility of the informed choice with the utility of the uninformed choice under conditions of improved information This also explains why an ex post measure with respect to information release is needed In addition COI refers
Consumer Welfare and the Loss Induced by Withholding Information The Case of BSE in Italy 43
to a given informational state that impinges on the subjective beliefs about the safety level of food As the distribution is subjective it can evolve in the course of time even if the underlying objective distribution no longer changes This is a well known pattern associated with food scares when extensive media coverage of health threats causes an initial dramatic drop in consumption of the allegedly unsafe food (Burton Young and Cromb 1999 Verbeke and Ward 2001) Initial panic is then followed by a slow (although often incomplete) recovery of the previous level of consumption even after new information is released assuming that the crisis is over or that the actual level of risk is lower than supposed Furthermore such recovery in consumption is usually associated with substantially lower prices for the food concerned (and higher ones for substitutes) so that the shift in demand persists beyond that which emerges from observing crude consumption data (Thompson and Tallard 2003)
Figure 1 Timing
The delay in demand recovery may be explained by the asymmetric impact of good and bad news on consumption as found by Liu et al (1998) This in turn relates to the role of trust in information sources As is widely acknowledged trust is fragile and once it is lost it may take a long time to recover to previous levels There are a number of reasons for this First negative events are generally more visible than positive ones Second negative events have a larger impact than positive ones because of their low frequency-high consequence nature Third sources of bad news tend to be trusted more than sources of good news In addition once distrust has arisen subsequent events tend to be interpreted in a distorted way leading to a reinforcement of prior beliefs (Slovic 1993) All of these factors help to explain the observed evolution of beliefs and consumption behaviour over time As a consequence different COI measures can be obtained by referring the informed status to ensuing dates Following this approach a food safety crisis (as well as other quality changes in goods or the environment) may be represented by a shift in a quality parameterθ concerning a good whose level of consumption (in quantity terms) is x
0 1θ θge (1)
More generally we may refer to θ as a vector of distribution parameters (such as the mean and standard deviation) associated with uncertain quality As illustrated
Step 0 Step 1 Step 2 Step 3 Step 4
Time
Agent has priorbeliefs about safetyof food
Choices are madeunder ignoranceresulting inallocation ofconsumptionacross goods
An informationmessage isreleased
Agent updatesbeliefs via bayesanrule
Informed choicesare made based onupdated beliefs Anew allocation ofconsumption acrossgoods takes place
44 Mario Mazzocchi Gianluca Stefani and Spencer Henson
above it is the subjective estimate of θ rather than the objective value that is relevant since only the former enters the consumerrsquos utility or cost functions As the safety level of food is stochastic consumers solve an expected utility maximisation problem whose solution can be represented by
( )x f p y= (2)
where x is the quantity of the good of interest which maximises the utility function p is the price of the good of interest and y is income while pyg minus= x is the expenditure on all other goods and considered a numeraire Let the cost function or the minimum expenditure attaining the level of utility U be
( ) ( ) ( )[ ] yUgxuEgpxUpe =ge+= min θ (3)
Taking the absence of contamination as a baseline the measure of consumer loss when contamination occurs and consumers are informed without delay is given by the compensating variation (CV)
0 1 0 0 0 0( ) ( )CV e p U e p U= minus (4)
where θ1 now describes posterior beliefs that are the result of updating priors beliefs (θ0) after the release of information about the food safety crisis As information is promptly released consumers are free to adapt their consumption bundles The most likely reaction to the news is a reduction in consumption of the unsafe food so
that 0 0 0( )x f p y= will be greater than
1 0 1( )x f p y= Conversely if
consumers are not informed about the crisis they will maintain the same consumption patterns that they adopted in the safe context However ex post they will realise that a deterioration of the food safety levels has occurred and suffer a greater welfare loss since they had not put in place any countermeasures In this case the measure for the correspondent welfare loss is the compensating surplus (CS)
0 1 0 0 0 0 0( ) ( )CS e p U x x e p U= = minus (5)
The first term on the right hand side of equation (5) is a restricted cost function as consumer choice is restricted to the bundle chosen under the original set of beliefs In other words consumers are forced to consume the same quantities that they would have chosen under ignorance even if they are actually aware of the health threat Thus an excessive quantity of the possibly unsafe food is consumed The second term on the right hand side is a standard cost function measured before the release of information Since CS and CV differ only because of the restricted choice in CS the difference between the two measures provides the COI
0 1 0 0 0 1 0( ) ( )COI CS CV e p U x x e p U= minus = = minus (6)
Noticeably both terms of the COI expression refer to the same subjective distribution of quality parameters (θ1) That is consumer welfare is measured under conditions of improved information by comparing the consequence of informed actions (consumption of quantity x1) with those of uninformed actions
Consumer Welfare and the Loss Induced by Withholding Information The Case of BSE in Italy 45
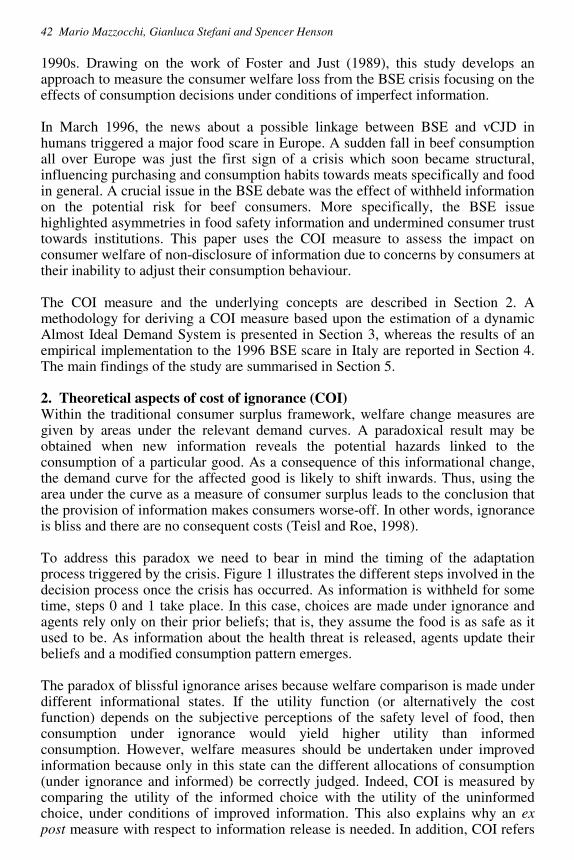
(consumption of quantity x0) In this situation COI is a measure of the welfare improvement following the adoption of self-protection activities such as avoiding consumption of unhealthy food and self-insurance activities aimed at reducing the prospective severity of any health consequences
Figure 2 The Cost of Ignorance
Since constrained cost functions are difficult to retrieve Foster and Just (1989) suggest an alternative strategy to measure COI
1 1 0 0 1 0 0 1 0( ) ( ) ( )COI e p U e p U p p x= minus + minus (7)
where p1 is defined as the price ldquohellip that would need to be charged to cause the individual to choose x0 given a Hicksian demand curve conditioned on U0 and θ1rdquo (Teisl et al 2001)2 The measure is illustrated in Figure 2 as the difference between the area (p0-p1)x0 and the area under the informed Hicksian demand curve between the two price lines corresponding to p1 and p0 The measure can be adapted to deal with changes in quality of n goods Defining p1 as the 1timesn vector of prices such that the compensated demand with the perceived quality level θ1 is equal to the initial level of consumption represented by the 1timesn vector x0 The quality levels before and after the disclosure of information are now represented by the mn times matrices Θ0 and Θ1 containing the m distribution parameters associated with each good Thus it is straightforward to derive the cost function as ( )p0 0Ue and the COI expression is then given by
2 The proof is given by Foster and Just (1989) and is based on e(p1θ1U0) having the same (xg) solution of the
constrained cost function The unconstrained function then must be corrected to account for the fact that the price of x is actually p0 rather than p1
h(pθ0U0)
p
x x 0 x 1
p 0
p 1
COI
h(pθ1U0)
46 Mario Mazzocchi Gianluca Stefani and Spencer Henson
( ) ( ) ( )0 0 COI e U e U= minus + minus1 0 0 1 0p (8)
It is worth noting that while the adopted framework allows for changes in quality of all goods this need not be the case When strong substitution effects are likely to occur after a quality change for even only one of the goods a multiple good framework is recommended 3 A dynamic empirical model The original work on COI dealt with a milk contamination case in the Hawaiian Isles where information was upheld from consumers for a time (Foster and Just 1989) Subsequently Teisl and Roe (1998) found COI to be a suitable measure to assess the benefit of a labelling policy An empirical application by Teisl et al (2001) assessed the welfare impact of nutritional information in the context of an experimental labelling program All studies used a revealed preference approach based on estimation of a demand function which permits the retrieval of a cost function and the COI measure Foster and Just (1989) obtained the cost function from a single equation Marshallian demand function following the Hausmann method (Hausmann 1981) Conversely Teisl et al (2001) estimated a demand system theoretically derived within a cost-minimisation framework As mentioned above this latter approach is less restrictive as it allows for substitution effects among related goods The retrieval of a cost function and the related welfare measurement raises some important methodological issues First basing welfare measures on cost functions estimated from systems of demand equations is theoretically correct only for complete demand system taking into account all goods consumed by households However due to data limitations most estimated systems are not complete In empirical work weak separability is often invoked to allow estimation of a demand system for a set of goods conditional on the total expenditure on the group Unfortunately cost functions recovered from conditional demand systems do not provide unbiased welfare measures3 Conversely La France and Hanemann (1989) demonstrate that under fairly general conditions welfare measures derived from incomplete demand systems are unbiased In order to define an incomplete demand system let us consider a set of goods whose price vector p is known and a residual set of goods associated with the generally unknown price vector q If the system is integrable as would be the case under fairly general conditions then a cost function exists which is well-behaved with respect to p but not jointly to (pq)
[ ]( ) ( )e U Uε η=p q p q q (9)
where η(qU) is an arbitrary constant of integration that does not depend on p and whose structure is not recoverable Given that
( ) 0jq U pηpart part = (10)
3 It has been demonstrated by La France (1993) and Hanemann and Morey (1992) that CV measures derived
from conditional demand systems correspond to true CV only when consumption of the excluded goods is assumed to be fixed at the initial level Furthermore conditional CV provides only a lower bound for the true welfare change
Consumer Welfare and the Loss Induced by Withholding Information The Case of BSE in Italy 47
the cost function recovered from the incomplete system reveals the welfare effects of changes in p Hence estimation of incomplete demand systems is an interesting option if data are available for x p q and θ and the aim is to derive a CV measure for a change in the subset of the prices in p (Hanemann and Morey 1992) A second methodological issue is raised by the need to account for dynamics due to serially correlated residuals frequently found in demand system models estimated with time series data4 In this work we rely on the flexible cost function provided in the context of the incomplete Almost Ideal Demand System (AIDS) (Deaton and Muellbauer 1980) Several dynamic structures for the AIDS have been proposed (see Ray 1984 Alessie and Kaptein 1991 Attfield 1997 among others) Here we refer to a partial adjustment structure as in Kesavan et al (1993) Rickertsen (1996) and Edgerton (1996) The equations of the incomplete partial adjustment AIDS model for n-1 items and a numeraire good (such as the residual composite item) are specified as follows
1
1
log logn
tit it ij jt i
j t
yw p
Pα γ β
minus
=
= + +
sum i 1hellip n (11)
where wit is the share of total expenditure for item i at time t pjt is the price of item j at time t deflated by the price of the numeraire good pnt and yt is the total per capita expenditure at time t deflated by pnt The price of the numeraire good usually a price index for the composite item enters the system as a deflator for prices and expenditure This deals with the lack of data for the price vector of the goods excluded from the incomplete system (q) (as in LaFrance 1993) Following Deaton and Muellbauer (1980) the nonlinear price index Pt is defined as follows
1 1
0
1 1
1log log log log
2
n n
t it it ij it jti i j
P p p pα α γminus minus
= =
= + +sum sumsum (12)
The intercept for the i-th equation accounting for monthly seasonality information and dynamics is given by the following expression
12 1
1
1 1
(1 log )n
cit is st ij j t i zt z
s j
a w b d tα δ ψminus
minus= =
= + + +sum sum i 1hellipn (13)
The first addendum on the right hand side of (13) represents the seasonal intercept with ast = 1 when the t-th observation falls in month s and ast = 0 otherwise The second addendum allows for dynamic behaviour by entering the vector of lagged expenditure shares Finally the last addendum is a non-linear intercept shift (similar to the one proposed by Foster and Just 1989) that embodies the effects of retained
4 Indeed Deaton and Muellbauer (1980) themselves remarked that serial correlation may arise due to the
imposition of homogeneity constraints when the expenditure on certain items is inflexible in the short run which is quite likely when working with high-frequency (monthly or weekly) data The economic meaning of lagged expenditure shares entering the model has been explained by myopic habit persistence behaviour (as for example in Pashardes 1986)
48 Mario Mazzocchi Gianluca Stefani and Spencer Henson
information5 Such an intervention structure implies that the sign and relevance of the disclosed information on the i-th intercept depends on the item-specific coefficient bi and evolves over time according to a parameter c that is held constant across equations The a priori information about the timing of the disclosure of
information (say time z) enters the system through ztd which equals to 1 if zt ge
and zero otherwise By setting 1+minus=lowast zttz we allow the impact of disclosed information to evolve over time with a direction and a rate which depends on c where 0=c implies a constant effect 0ltc a decreasing effect and 0gtc an increasing effect For 0ltc the intervention tends asymptotically to 0 The evolution over a ten years time span according to a set of values of c is shown in Figure 36 The system in (11) is non-linear due to non-linearities in the price index Pt and in the modified intercept
itα The problem of singularity is not present here since the demand system is incomplete and the numeraire item equation is dropped by construction As the lagged expenditure shares are pre-determined these can be considered as exogenous and (11) is still a seemingly unrelated regression (SUR) system We exploit a two-stage method for obtaining maximum likelihood estimates similar to that of Deaton and Muellbauer (1980) In the first stage the system coefficients are estimated by iterating the Zellner (1962) SUR estimator conditional to the value of the nonlinear price index Pt In the second stage the index Pt is explicitly computed using the coefficient estimates obtained in the first stage This procedure is iterated until convergence which is achieved when the estimates of the system coefficients are stable7 The COI measure can be derived from the coefficient estimates according to (8) The first step involves computing the vector of prices p1t as in (7) for each time period following the crisis As described above the vector p1t represents the price that would need to be charged to cause individuals to purchase at time t the same quantity they would have chosen before the release of information keeping the utility level constant at the level U0 This can be derived by holding the quantities8 and the total expenditure fixed at their value at the time r=z-1 (the last time period before the release of information) and solving numerically system (11) with respect to prices
5 Alternatively if data are available one can define the shift in demand as a function of ldquopositiverdquo and ldquonegativerdquo
information released by the media (as in eg Liu et al 1998 and Verbeke et al 2000) 6 It can be shown analytically that the shift becomes negligible (lt001) in ten years when c lt -262 in five years
when c lt -283 and in three years when c lt -302 7 The final estimates will be maximum likelihood estimates as the Oberhofer-Kmenta conditions are met for the
SUR model (Greene 1997 p 681) 8 Defined as the ratio between expenditure and price for each good
Consumer Welfare and the Loss Induced by Withholding Information The Case of BSE in Italy 49
Figure 3 Value of the Intervention Variable Over 12 years for Different Values of c
Once p1t has been computed it is possible to estimate the COI measure by exploiting the AIDS model cost function For the system in (11) given that the utility level is U0 after inversion of the utility function the cost functions can be written as follows
1 1 1
0 0 1 1 11 1 1
1 1 1 11
01 1 11
1log ( ) log log log
2
1 + log log log log
2
j
n n n
it it ij it jti i j
n n n njt
r it ir ij ir jrjr i i jj
e U p p p
py p p pp
β
α α γ
α α γ
minus minus minus
= = =
minus minus minus minus
= = ==
= + + +
minus minus minus
sum sumsum
sum sumsumprod
1 1p
(14)
1 1 1
0 0 11 1 1
1 1 1
01 1 1
1log ( ) log log log
2
1 log log log log
2
n n n
it ir ij ir jri i j
n n n
r it ir ij ir jri i j
e U p p p
y p p p
α α γ
α α γ
minus minus minus
= = =
minus minus minus
= = =
= + + +
+ minus minus minus
sum sumsum
sum sumsum
0 1p
(15)
where p1it is the i-th element of the vector p1t computed as previously described and pir are the actual prices for the i-th good at the benchmark time r (the last period
00
02
04
06
08
10
20 40 60 80 100 120
c=-302
00
02
04
06
08
10
20 40 60 80 100 120
c=-262
00
02
04
06
08
10
20 40 60 80 100 120
c=-1
04
05
06
07
08
09
10
20 40 60 80 100 120
c=-05
070
075
080
085
090
095
100
20 40 60 80 100 120
c=-02
094
096
098
100
102
104
106
20 40 60 80 100 120
c=0
08
12
16
20
24
28
20 40 60 80 100 120
c=+05
0
1
2
3
4
5
6
20 40 60 80 100 120
c=+1
0
10
20
30
40
20 40 60 80 100 120
c=+2
50 Mario Mazzocchi Gianluca Stefani and Spencer Henson
prior to the information release) From (14) and (15) it is possible to compute a measure of the cost of ignorance
( )1
1 0 0 11
( ) ( )n
t ir it iri
COI e U e U p p qminus
=
= minus + minussum1 r 1p (16)
where ir r
irir
w xq
p= are the quantity indices and
irw are the fitted values for the
expenditure shares at the baseline period r computed through (11) 4 An application to the BSE scare in Italy News about the BSE crisis had a strong impact on Italian consumers Despite the fact that the first Italian case of BSE was only officially identified in 20019 the prevailing uncertainty led to a significant fall in consumption especially in the aftermath of the scare In April 1996 real household beef expenditure fell by 184 compared to April 1995 and by 127 compared to the previous month In December 1996 consumption was still 87 below its 1995 level Indeed markets for beef in Italy were amongst the hardest hit within the European Union According to FAO-AGROSTAT figures10 average per capita beef consumption in 2001 was 103 percent below its 1995 level Only Germany (-425) and Portugal (-119) experienced a larger decline11 On the other hand UK per-capita consumption in 2001 was slightly above its 1995 level (+06) However these figures make little sense if relative price dynamics are not taken into account (Thompson and Tallard 2003) Considering the real beef retail price index between 1995 and 2001 a decrease of 91 was observed in Italy compared to a 14 decline in the UK12 In order to evaluate the costs of withholding information prior to March 1996 the empirical model detailed in the previous section was applied to Italian data provided by the Household Expenditure Survey of the National Institute of Statistics (ISTAT) The event of interest was the release of information about a possible linkage between BSE and the human disease vCJD at the end of March 1996 Total per capita household expenditure and consumer expenditure on the following four food groups was considered beef poultry other meats and fish Aggregate (monthly) data was constructed from individual household data drawn from the nationally representative ISTAT Italian Household Expenditure Survey13 over the
9 Two imported cases were identified in 1994 10 The FAO figures on per-capita consumption is based on the disappearance method and on data provided by the
official national sources 11 These consumption and expenditure data were also influenced by the EC-led introduction of compulsory testing
of cattle starting January 2001 and the subsequent discovery of BSE cases within national territories 12 Considering the number of cases of BSE as a proxy for an objective risk assessment in 2001 Italian authorities
detected 48 cases of BSE against 1113 in the UK The above figures and discrepancies can be explained by assuming that the reaction of the Italian households to the BSE scare has been characterised by a stronger emotional response (probably widened by media coverage) and partly by a lower trust in the concerned authorities and control procedures
13 Istat (2001) Indagine sui consume delle famiglie file standard Users manual Rome Istat wwwistatit
Consumer Welfare and the Loss Induced by Withholding Information The Case of BSE in Italy 51
period 1986-1999 Nominal price data were constructed using the nominal 1996 price data from the ISMEA-Nielsen household budget survey and the time series of the ISTAT price indices The price index for the residual (numeraire) good was the ISTAT Consumer Price Index Summary sample descriptive statistics are provided in Table 1
Table 1 Sample Descriptive Statistics
Average Std Dev Minimum Maximum
Monthly number of households surveyed 252163 50959 168800 347900 Monthly beef expenditure 4052 280 3467 4752 Monthly chicken expenditure 1328 150 987 1669 Monthly other meats expenditure 3215 595 2090 4732 Monthly fish expenditure 2391 525 1459 4026 Total meat and fish expenditure 10986 1330 8085 14142 Total expenditure 144774 30436 88489 193658 Beef price 674 098 511 789 Chicken price 359 051 279 456 Other meats price 530 078 397 625 Fish price 661 099 445 795
NOTE Price and expenditure data are in Model estimates are reported in Table 2 As illustrated in the previous section the non-linear intercept shift which embodies the effects of information depends on both an item specific coefficient bi and a common parameter c acting as an exponent of a function of time elapsed from the release of information14 The item-specific coefficient for the beef equation was significant and had the expected negative sign whereas the shifts on the other equations were insignificant The c parameter shaping the evolution of the effects was -085 corresponding to a decreasing impact of information The estimated pattern for each equation is reported in Figure 4 The impact of the event on beef poultry and other meats had the expected sign and trend whereas fish had a negative shift as in the case of beef However it is worth emphasising that the impact was negligible for all equations except beef These results show that the impact on beef consumption was negative and decreasing in absolute value as expected Once trust in meat safety had been lost it took a long time to recover given the asymmetric impact of alarming and reassuring news 14 Conversely to Foster and Just (1989) in (14) we suggest to use the logarithm of t which involves a more
gradual evolution of the impact
52 Mario Mazzocchi Gianluca Stefani and Spencer Henson
Table 2 Model Estimates and Diagnostics
Beef Poultry Other meats Fish
Intercept (avg) -0103 -0129 0233 0229 (0103) (0032) (0091) (0079) ψ1 0429 0044 0080 -0008 (0075) (0024) (0068) (0059) ψ2 -0267 0001 -0055 -0113 (0278) (0089) (0255) (0222) ψ3 0132 0004 0218 0007 (0091) (0029) (0082) (0071) ψ4 -0065 -0006 0343 0514 (0113) (0036) (0103) (0090) b -0006 0000 0000 0000 (0001) (0000) (0001) (0001) c -0852 -0852 -0852 -0852 (0231) (0231) (0231) (0231) γ1 0000 0001 0000 -0011 (0012) (0004) (0011) (0010) γ2 0014 0003 0018 -0001 (0008) (0002) (0007) (0006) γ3 0005 0010 -0026 -0005 (0020) (0006) (0018) (0016) γ4 0012 0004 -0006 0003 (0004) (0001) (0004) (0003) β -0016 -0003 -0008 -0008 (0002) (0001) (0002) (0002)
R-square 096 091 080 052 NOTE Standard errors in brackets value significant at a 001 confidence level are reported in bold Seasonal shifts in the intercept are not reported here but are available on request from the authors
According to the estimated value of c the impact of the crisis on beef demand was permanent as the BSE impact becomes negligible only asymptotically15 Price and expenditure elasticity estimates computed from the appropriate coefficients are reported in Table 3 Mean values for the period before and after the release of the BSE news are shown In line with the above results little change emerged in price elasticities for the poultry other meats and fish equations In the 15 Indeed at the end of 2000 there was a new and even larger BSE scare due to the detection of BSE cases in Italy
and France (the largest exporter to Italy) so that the asymptotical disappearance of the shock has little meaning
Consumer Welfare and the Loss Induced by Withholding Information The Case of BSE in Italy 53
case of beef demand however there was an increase in the absolute value of the elasticity with respect to both own price and cross prices Expenditure elasticities remained largely unchanged for other meats and fish whereas there was a dramatic decrease in expenditure elasticity for beef and a less prominent decline for poultry Figure 4 Values of the Intervention Variable for Each Food Group (Apr 96-Dec 99)
These results are consistent with other studies of the impact of the BSE crisis on meat demand (see for example Burton and Young 1996) Elasticity values did not show any significant discrepancy with estimates from other studies of Italian meat demand (see for example Dono and Thompson 1994 Fanelli and Mazzocchi 2002) apart from a lower own price elasticity for poultry and expenditure elasticity for beef compared to Fanelli and Mazzocchi (2002) However these discrepancies are explained by differences in model specification and the estimation period Following Foster and Just (1989) the COI for the four meat groups and a numeraire was calculated according to (16) With regard to the BSE crisis COI is a measure of the welfare improvement that could have been obtained if the news about the possible link between BSE and human vCJD had been released earlier In particular an earlier warning would have allowed consumers to reallocate their consumption across the foods of the meat group as they actually did once the BSE crisis was publicised It is worth noting that having included lagged expenditure shares in the cost function the measure obtained also takes account of the cost of adapting to new consumption patterns that differ from habitual ones
-0007
-0006
-0005
-0004
-0003
-0002
-0001
1997 1998 1999
Beef
000005
000010
000015
000020
000025
000030
000035
000040
1997 1998 1999
Poultry
000002
000004
000006
000008
000010
1997 1998 1999
Other meats
-00005
-00004
-00003
-00002
-00001
1997 1998 1999
Fish
54 Mario Mazzocchi Gianluca Stefani and Spencer Henson
Table 3 Price and expenditure elasticities before and after March 1996
Beef Poultry Other meats
Fish Expenditure
Before March 1996
Beef -115 033 006 028 051
(035) (025) (043) (016) (008)
Poultry 009 -068 109 051 069 (039) (027) (063) (015) (007)
Other meats -002 084 -209 -022 063 (042) (029) (093) (022) (011)
Fish -056 010 -015 -064 053 (066) (040) (104) (029) (013)
After March 1996
Beef -122 047 008 040 029
(052) (037) (061) (025) (011)
Poultry 011 -061 134 062 062 (048) (030) (073) (019) (010)
Other meats -002 086 -212 -023 062 (042) (031) (098) (022) (011)
Fish -055 009 -014 -065 054 (067) (040) (104) (029) (013)
NOTE Bootstrap standard errors in brackets based on 1000 replications As a baseline for the COI measure the informational regime of February 1996 was taken which was assumed to represent a state of ignorance Prior to March 1996 the scare about BSE had not started and consumers generally believed consuming beef was safe However some reports indicate that public authorities may have been aware of risks from BSE as early as 1988 when the results of first studies on transmissibility became available16 The actual crisis began on 20 March 1996 and fully developed its effects on consumption in the following month Taking February as a baseline the COI for that month can be measured with respect to different informational statuses as reflected by the beliefs of consumers With reference to Figure 1 February 1996 represents Step 1 (choices under ignorance) March 1996 is the time of information release (Step 2) and the observed purchasing behaviours from April 1996 to the end of the sample reflect informed choices (Steps 3 and 4)
16 In 1990 after evidence of transmission to cats mice pigs and sheep public concern rose consistently Even if
risks for human health could not be excluded all the governmental reactions were aimed to reassure the consumer about the safety of beef until March 1996 (source BSE Inquiry 2000 httpwwwbseinquirygovuk)
Consumer Welfare and the Loss Induced by Withholding Information The Case of BSE in Italy 55
Estimates of the intervention parameters suggest an immediate strong impact of information release on consumption followed by a relatively slow decline Indeed as illustrated in Section 2 subjective beliefs about the safety of beef changed over time for a number of reasons The original over-reaction to bad news probably explains the sharp drop in consumption in the immediate aftermath of the crisis However the slow recovering of consumption may have depended not only on a more rational reassessment of the actual risk but also on the change in objective safety level following the adoption of counter-measures by public authorities
Table 4 Measures of the per capita Cost of Ignorance (April 1996-December 1999)
Month COI ( p-value of per capita expenditure on meat and fish
(Feb 1996)
Apr-96 2276 (1155) 005 5441
Oct-96 809 (493) 010 1934
Apr-97 673 (424) 011 1608
Oct-97 608 (391) 012 1452
Apr-98 569 (371) 013 1359
Oct-98 540 (357) 013 1290
Apr-99 520 (356) 014 1242
Oct-99 502 (337) 014 1201
NOTE Standard errors and p-values are bootstrapped based on 1000 replications Table 4 presents COI estimates based on subjective risk perception in selected reference months A time series of COI estimates is obtainable as the perceived quality level θ1 changes over time because of the updating process in risk perception following flows of information (for example media coverage) (Liu et al 1998) The April 1996 data of 13 13 13 bound of the COI measure17 as we can safely assume that this was when the scare and the affective reaction reach their peak This figure amounts to about 54 percent of the actual expenditure on meat It measures the minimum amount the consumer would have been willing to accept given the level of risk perception in April 1996 as compensation for being kept uninformed in the previous months On the other hand a lower bound can be identified at a level of about
18 which takes into account the sanitary countermeasures put in place to deal with the crisis From a policy perspective it may be necessary to identify a COI value which reflects as closely as possible to the objective risk level and which does not embody emotiveness and rsquoirrationallsquo reactions Smith et al (1988) for example argue that rsquounnecessarylsquo welfare losses can derive from negative media coverage besides those due to the objective food contamination itself19 In order to devise a rule for
17 The measure is calculated at 1995 prices 18 From April 1998 the monthly percentage variation of COI is always below 1 19 Beardsworth and Keil (1996) examine in detail the process of lsquomoral panicrsquo in a food scare situation intended
as the ldquorapid surge of public concern which commonly accompanies intensive media coveragerdquo and observe
56 Mario Mazzocchi Gianluca Stefani and Spencer Henson
selecting a policy-relevant measure we assume that the affective component becomes marginal when the rate of change in the monthly COI estimate slows down As a rule of thumb20 a monthly percentage change of 5 percent in the measure can be adopted as a threshold level This would correspond to October 1996 as the representative reference month for subjective risk perceptions obtaining a COI value of about It is worth noting that basing COI estimates on a demand system rather than a single equation allows for substitution effects In other words converse to the leftward shift of the Hicksian demand curve for beef observed in Figure 2 the demand curve for beef substitutes perceived as safer after the release of information could shift rightwards If informed about the risk of beef consumers could have purchased the same quantities of substitute meats at higher prices Hence the COI measure in (9) also accounts for effects of information acting in the opposite direction and the system based measure is more appropriate than that based on a single equation In all cases the estimates seem plausible Thus Foster and Just (1989) investigate the case of retained information about milk contamination in Ohau (Hawaii) and obtained a COI higher than the value of milk normally consumed 5 Conclusions This paper has applied the COI approach of Foster and Just (1989) for the measurement of consumer welfare losses associated with withheld information about food safety to the BSE scare in Italy The Cost of Ignorance is computed comparing the value of the cost function associated with the informed choice of food in the meat group with the value related to an uninformed choice assuming consumers are aware of the crisis Unlike previous work which has been based on a single equation demand model COI is measured retrieving a cost function from a dynamic Almost Ideal Demand System This allows for reallocation of expenditure among substitute foods behaviour actually observed in the aftermath of the BSE scare The computed COI measure could be of use in determining how much the Government should spend in providing timely information or to quantify the damage attributable to those who did not disclose the information in due time The results of the analysis show that Italian consumers bore a sizeable loss because of the delayed release of information about a possible link between BSE and human vCJD The estimated loss per person per month ranged from 12 to around 50 of total expenditure on the meat group depending on the period assumed to embody correct beliefs about the safety level of beef Further methodological refinements could improve the accuracy of the measure Lack of data has prevented subjective beliefs about the safety of beef from being modelled as a function of the flow of positive and negative information to consumers during the BSE scare Alternative parameterisations of the intervention
that the sensitisation of the audience lead to a ldquospiralling level of anxiety to build uprdquo Such anxiety lsquoamplificationrsquo is described as a self-limiting process as the public and media interest start to decline
20 Foster and Just (1989) simply refer to the first month after the crisis Teisl et al (2001) and Rousu et al (2002) do not incur this problem as the reference period is clearly identified by the design adopted in their field and laboratory experiments
Consumer Welfare and the Loss Induced by Withholding Information The Case of BSE in Italy 57
variable should be explored as well as further checks on the robustness of the results Explicitly taking into account the choice of not purchasing meat as in Burton et al (2000) would also allow a further insight on the effect of the BSE crisis21 By providing an estimate of the welfare losses induced by non-disclosure of information our work allows a first insight into the theoretical and methodological intricacies of the assessment of the economic impacts of food-borne risk communication policies The BSE scare as a case example demonstrates the importance of risk communication in maintaining consumer trust in the food chain Indeed the EU has recognised the importance of this aspect in its White paper on Food Safety22 As a result interest in the value of communication policies is growing and further studies are needed in order to provide a sound economic basis for policy decisions References Alessie R and Kapteyn A (1991) Habit Formation Interdependent Preferences and
Demographic Effects in the Almost Ideal Demand System Economic Journal 101404-419
Attfield CTF (1997) Estimating a Cointegrating Demand System European Economic Review 4161-73
Beardsworth A and Keil T (1996) Sociology on the menu An invitation to the study of food and society London Routledge
Burton M Dorsett Rand Young T (2000) An investigation of the increasing prevalence of nonpurchase of meat by British households Applied Economics 321985-1991
Burton M and Young T (1996) The impact of BSE on the demand for beef and other meats in Great Britain Applied Economics 28687-693
Burton M Young T and Cromb R (1999) Meat consumersrsquo long-term response to perceived risks associated with BSE in Great Britain Cahiers dEacuteconomie et Sociologie Rurales 508-19
Deaton A and Muellbauer J (1980) An Almost Ideal Demand System American Economic Review 70312-326
Dono G and Thompson G (1994) Explaining changes in Italian consumption of meat Parametric and non-parametric analysis European Review of Agricultural Economics 21175-198
Edgerton DL (1996) The Specification and Estimation of Demand Systems in Edgerton Assarsson et al The Econometric of Demand System Norwell MA Kluwer Academic 63-92
Fanelli L and Mazzocchi M (2002) A cointegrated VECM demand system for meat in Italy Applied Economics 341593-1605
Foster W and Just RE (1989) Measuring welfare effects of Product Contamination with Consume Uncertainty Journal of Environmental and Resource Economics and Management 17266-283
Greene WH (1997) Econometric Analysis 3rd edition Upper Saddle River NJ Prentice Hall
21 We are grateful to an anonymous referee for pointing this out 22 COMM(1999) 719 final
58 Mario Mazzocchi Gianluca Stefani and Spencer Henson
Hanemann M and Morey E (1992) Separability Partial Demand Systems and Consumerrsquos Surplus Measures Journal of Environmental Economics and Managemen 22241-258
Hausmann JA (1981) Exact Consumerrsquos surplus and Deadweight Loss American Economic Review 71662-676
Kesavan T Hassan ZA Jensen HH and Johnson SR (1993) Dynamics and Long-Run Structure in US Meat Demand Canadian Journal of Agricultural Economics 41139-153
La France JT (1993) Weak Separability in Applied Welfare Analysis American Journal of Agricultural Economics 75770-775
La France JT and Hanemann M (1989) The Dual Structure of Incomplete Demand Systems American Journal of Agricultural Economics 71262-274
Lewbel A (1985) A Unified Approach to Incorporating Demographic or Other Effects into Demand Systems Review of Economic Studies 521-18
Liu S Huang J and Brown GL (1998) Information and Risk Perception A Dynamic Adjustment Process Risk Analysis 18689-699
Pashardes P (1986) Myopic and Forward Looking Behaviour in a Dynamic Demand System International Economic Review 27387-397
Ray R (1984) A Dynamic Generalisation of the Almost Ideal Demand System Economics Letters 14235-239
Rickertsen K (1996) Structural Change and the Demand for Meat and Fish in Norway European Review of Agricultural Economics 23316-330
Slovic P (1993) Perceived Risk Trust and Democracy Risk Analysis 13675-682 Rousu M Huffman WE Shogren JF and Tegene A (2002) The Value of Verifiable
Information in a Controversial Market Evidence from Lab Auctions of Genetically Modified Foods Department of Economics Working Paper Series 02003 Iowa State University
Smith ME van Ravenswaay EO and Thompson SR (1988) Sales Loss Determination in Food Contamination Incidents An Application to Milk Bans in Hawaii American Journal of Agricultural Economics 70513-520
Teisl MF and Roe B (1998) The Economics of Labeling An Overview of Issues for Health and Environmental Disclosure Agricultural and Resource Economics Review October 28140-150
Teisl MF Bockstael NE and Levy A (2001) Measuring the welfare Effects of Nutrition Information American Journal of Agricultural Economics 83133-149
Thompson Wand Tallard G (2003) Consumption versus Demand Recovery after BSE Eurochoices 2(1)24-25
Verbeke W and Ward RW (2001) A fresh meat almost ideal demand system incorporating negative TV press and advertising impact Agricultural Economics 25359-374
Verbeke W Ward RW and Viaene J (2000) Probit Analysis of Fresh Meat Consumption in Belgium Exploring BSE and Television Communication Impact Agribusiness 16215ndash234
Zellner A (1962) An Efficient Method of Estimating Seemingly Unrelated Regression Equations and Test of Aggregation Bias Journal of the American Statistical Association 57500-509
42 Mario Mazzocchi Gianluca Stefani and Spencer Henson
1990s Drawing on the work of Foster and Just (1989) this study develops an approach to measure the consumer welfare loss from the BSE crisis focusing on the effects of consumption decisions under conditions of imperfect information In March 1996 the news about a possible linkage between BSE and vCJD in humans triggered a major food scare in Europe A sudden fall in beef consumption all over Europe was just the first sign of a crisis which soon became structural influencing purchasing and consumption habits towards meats specifically and food in general A crucial issue in the BSE debate was the effect of withheld information on the potential risk for beef consumers More specifically the BSE issue highlighted asymmetries in food safety information and undermined consumer trust towards institutions This paper uses the COI measure to assess the impact on consumer welfare of non-disclosure of information due to concerns by consumers at their inability to adjust their consumption behaviour The COI measure and the underlying concepts are described in Section 2 A methodology for deriving a COI measure based upon the estimation of a dynamic Almost Ideal Demand System is presented in Section 3 whereas the results of an empirical implementation to the 1996 BSE scare in Italy are reported in Section 4 The main findings of the study are summarised in Section 5 2 Theoretical aspects of cost of ignorance (COI) Within the traditional consumer surplus framework welfare change measures are given by areas under the relevant demand curves A paradoxical result may be obtained when new information reveals the potential hazards linked to the consumption of a particular good As a consequence of this informational change the demand curve for the affected good is likely to shift inwards Thus using the area under the curve as a measure of consumer surplus leads to the conclusion that the provision of information makes consumers worse-off In other words ignorance is bliss and there are no consequent costs (Teisl and Roe 1998) To address this paradox we need to bear in mind the timing of the adaptation process triggered by the crisis Figure 1 illustrates the different steps involved in the decision process once the crisis has occurred As information is withheld for some time steps 0 and 1 take place In this case choices are made under ignorance and agents rely only on their prior beliefs that is they assume the food is as safe as it used to be As information about the health threat is released agents update their beliefs and a modified consumption pattern emerges The paradox of blissful ignorance arises because welfare comparison is made under different informational states If the utility function (or alternatively the cost function) depends on the subjective perceptions of the safety level of food then consumption under ignorance would yield higher utility than informed consumption However welfare measures should be undertaken under improved information because only in this state can the different allocations of consumption (under ignorance and informed) be correctly judged Indeed COI is measured by comparing the utility of the informed choice with the utility of the uninformed choice under conditions of improved information This also explains why an ex post measure with respect to information release is needed In addition COI refers
Consumer Welfare and the Loss Induced by Withholding Information The Case of BSE in Italy 43
to a given informational state that impinges on the subjective beliefs about the safety level of food As the distribution is subjective it can evolve in the course of time even if the underlying objective distribution no longer changes This is a well known pattern associated with food scares when extensive media coverage of health threats causes an initial dramatic drop in consumption of the allegedly unsafe food (Burton Young and Cromb 1999 Verbeke and Ward 2001) Initial panic is then followed by a slow (although often incomplete) recovery of the previous level of consumption even after new information is released assuming that the crisis is over or that the actual level of risk is lower than supposed Furthermore such recovery in consumption is usually associated with substantially lower prices for the food concerned (and higher ones for substitutes) so that the shift in demand persists beyond that which emerges from observing crude consumption data (Thompson and Tallard 2003)
Figure 1 Timing
The delay in demand recovery may be explained by the asymmetric impact of good and bad news on consumption as found by Liu et al (1998) This in turn relates to the role of trust in information sources As is widely acknowledged trust is fragile and once it is lost it may take a long time to recover to previous levels There are a number of reasons for this First negative events are generally more visible than positive ones Second negative events have a larger impact than positive ones because of their low frequency-high consequence nature Third sources of bad news tend to be trusted more than sources of good news In addition once distrust has arisen subsequent events tend to be interpreted in a distorted way leading to a reinforcement of prior beliefs (Slovic 1993) All of these factors help to explain the observed evolution of beliefs and consumption behaviour over time As a consequence different COI measures can be obtained by referring the informed status to ensuing dates Following this approach a food safety crisis (as well as other quality changes in goods or the environment) may be represented by a shift in a quality parameterθ concerning a good whose level of consumption (in quantity terms) is x
0 1θ θge (1)
More generally we may refer to θ as a vector of distribution parameters (such as the mean and standard deviation) associated with uncertain quality As illustrated
Step 0 Step 1 Step 2 Step 3 Step 4
Time
Agent has priorbeliefs about safetyof food
Choices are madeunder ignoranceresulting inallocation ofconsumptionacross goods
An informationmessage isreleased
Agent updatesbeliefs via bayesanrule
Informed choicesare made based onupdated beliefs Anew allocation ofconsumption acrossgoods takes place
44 Mario Mazzocchi Gianluca Stefani and Spencer Henson
above it is the subjective estimate of θ rather than the objective value that is relevant since only the former enters the consumerrsquos utility or cost functions As the safety level of food is stochastic consumers solve an expected utility maximisation problem whose solution can be represented by
( )x f p y= (2)
where x is the quantity of the good of interest which maximises the utility function p is the price of the good of interest and y is income while pyg minus= x is the expenditure on all other goods and considered a numeraire Let the cost function or the minimum expenditure attaining the level of utility U be
( ) ( ) ( )[ ] yUgxuEgpxUpe =ge+= min θ (3)
Taking the absence of contamination as a baseline the measure of consumer loss when contamination occurs and consumers are informed without delay is given by the compensating variation (CV)
0 1 0 0 0 0( ) ( )CV e p U e p U= minus (4)
where θ1 now describes posterior beliefs that are the result of updating priors beliefs (θ0) after the release of information about the food safety crisis As information is promptly released consumers are free to adapt their consumption bundles The most likely reaction to the news is a reduction in consumption of the unsafe food so
that 0 0 0( )x f p y= will be greater than
1 0 1( )x f p y= Conversely if
consumers are not informed about the crisis they will maintain the same consumption patterns that they adopted in the safe context However ex post they will realise that a deterioration of the food safety levels has occurred and suffer a greater welfare loss since they had not put in place any countermeasures In this case the measure for the correspondent welfare loss is the compensating surplus (CS)
0 1 0 0 0 0 0( ) ( )CS e p U x x e p U= = minus (5)
The first term on the right hand side of equation (5) is a restricted cost function as consumer choice is restricted to the bundle chosen under the original set of beliefs In other words consumers are forced to consume the same quantities that they would have chosen under ignorance even if they are actually aware of the health threat Thus an excessive quantity of the possibly unsafe food is consumed The second term on the right hand side is a standard cost function measured before the release of information Since CS and CV differ only because of the restricted choice in CS the difference between the two measures provides the COI
0 1 0 0 0 1 0( ) ( )COI CS CV e p U x x e p U= minus = = minus (6)
Noticeably both terms of the COI expression refer to the same subjective distribution of quality parameters (θ1) That is consumer welfare is measured under conditions of improved information by comparing the consequence of informed actions (consumption of quantity x1) with those of uninformed actions
Consumer Welfare and the Loss Induced by Withholding Information The Case of BSE in Italy 45
(consumption of quantity x0) In this situation COI is a measure of the welfare improvement following the adoption of self-protection activities such as avoiding consumption of unhealthy food and self-insurance activities aimed at reducing the prospective severity of any health consequences
Figure 2 The Cost of Ignorance
Since constrained cost functions are difficult to retrieve Foster and Just (1989) suggest an alternative strategy to measure COI
1 1 0 0 1 0 0 1 0( ) ( ) ( )COI e p U e p U p p x= minus + minus (7)
where p1 is defined as the price ldquohellip that would need to be charged to cause the individual to choose x0 given a Hicksian demand curve conditioned on U0 and θ1rdquo (Teisl et al 2001)2 The measure is illustrated in Figure 2 as the difference between the area (p0-p1)x0 and the area under the informed Hicksian demand curve between the two price lines corresponding to p1 and p0 The measure can be adapted to deal with changes in quality of n goods Defining p1 as the 1timesn vector of prices such that the compensated demand with the perceived quality level θ1 is equal to the initial level of consumption represented by the 1timesn vector x0 The quality levels before and after the disclosure of information are now represented by the mn times matrices Θ0 and Θ1 containing the m distribution parameters associated with each good Thus it is straightforward to derive the cost function as ( )p0 0Ue and the COI expression is then given by
2 The proof is given by Foster and Just (1989) and is based on e(p1θ1U0) having the same (xg) solution of the
constrained cost function The unconstrained function then must be corrected to account for the fact that the price of x is actually p0 rather than p1
h(pθ0U0)
p
x x 0 x 1
p 0
p 1
COI
h(pθ1U0)
46 Mario Mazzocchi Gianluca Stefani and Spencer Henson
( ) ( ) ( )0 0 COI e U e U= minus + minus1 0 0 1 0p (8)
It is worth noting that while the adopted framework allows for changes in quality of all goods this need not be the case When strong substitution effects are likely to occur after a quality change for even only one of the goods a multiple good framework is recommended 3 A dynamic empirical model The original work on COI dealt with a milk contamination case in the Hawaiian Isles where information was upheld from consumers for a time (Foster and Just 1989) Subsequently Teisl and Roe (1998) found COI to be a suitable measure to assess the benefit of a labelling policy An empirical application by Teisl et al (2001) assessed the welfare impact of nutritional information in the context of an experimental labelling program All studies used a revealed preference approach based on estimation of a demand function which permits the retrieval of a cost function and the COI measure Foster and Just (1989) obtained the cost function from a single equation Marshallian demand function following the Hausmann method (Hausmann 1981) Conversely Teisl et al (2001) estimated a demand system theoretically derived within a cost-minimisation framework As mentioned above this latter approach is less restrictive as it allows for substitution effects among related goods The retrieval of a cost function and the related welfare measurement raises some important methodological issues First basing welfare measures on cost functions estimated from systems of demand equations is theoretically correct only for complete demand system taking into account all goods consumed by households However due to data limitations most estimated systems are not complete In empirical work weak separability is often invoked to allow estimation of a demand system for a set of goods conditional on the total expenditure on the group Unfortunately cost functions recovered from conditional demand systems do not provide unbiased welfare measures3 Conversely La France and Hanemann (1989) demonstrate that under fairly general conditions welfare measures derived from incomplete demand systems are unbiased In order to define an incomplete demand system let us consider a set of goods whose price vector p is known and a residual set of goods associated with the generally unknown price vector q If the system is integrable as would be the case under fairly general conditions then a cost function exists which is well-behaved with respect to p but not jointly to (pq)
[ ]( ) ( )e U Uε η=p q p q q (9)
where η(qU) is an arbitrary constant of integration that does not depend on p and whose structure is not recoverable Given that
( ) 0jq U pηpart part = (10)
3 It has been demonstrated by La France (1993) and Hanemann and Morey (1992) that CV measures derived
from conditional demand systems correspond to true CV only when consumption of the excluded goods is assumed to be fixed at the initial level Furthermore conditional CV provides only a lower bound for the true welfare change
Consumer Welfare and the Loss Induced by Withholding Information The Case of BSE in Italy 47
the cost function recovered from the incomplete system reveals the welfare effects of changes in p Hence estimation of incomplete demand systems is an interesting option if data are available for x p q and θ and the aim is to derive a CV measure for a change in the subset of the prices in p (Hanemann and Morey 1992) A second methodological issue is raised by the need to account for dynamics due to serially correlated residuals frequently found in demand system models estimated with time series data4 In this work we rely on the flexible cost function provided in the context of the incomplete Almost Ideal Demand System (AIDS) (Deaton and Muellbauer 1980) Several dynamic structures for the AIDS have been proposed (see Ray 1984 Alessie and Kaptein 1991 Attfield 1997 among others) Here we refer to a partial adjustment structure as in Kesavan et al (1993) Rickertsen (1996) and Edgerton (1996) The equations of the incomplete partial adjustment AIDS model for n-1 items and a numeraire good (such as the residual composite item) are specified as follows
1
1
log logn
tit it ij jt i
j t
yw p
Pα γ β
minus
=
= + +
sum i 1hellip n (11)
where wit is the share of total expenditure for item i at time t pjt is the price of item j at time t deflated by the price of the numeraire good pnt and yt is the total per capita expenditure at time t deflated by pnt The price of the numeraire good usually a price index for the composite item enters the system as a deflator for prices and expenditure This deals with the lack of data for the price vector of the goods excluded from the incomplete system (q) (as in LaFrance 1993) Following Deaton and Muellbauer (1980) the nonlinear price index Pt is defined as follows
1 1
0
1 1
1log log log log
2
n n
t it it ij it jti i j
P p p pα α γminus minus
= =
= + +sum sumsum (12)
The intercept for the i-th equation accounting for monthly seasonality information and dynamics is given by the following expression
12 1
1
1 1
(1 log )n
cit is st ij j t i zt z
s j
a w b d tα δ ψminus
minus= =
= + + +sum sum i 1hellipn (13)
The first addendum on the right hand side of (13) represents the seasonal intercept with ast = 1 when the t-th observation falls in month s and ast = 0 otherwise The second addendum allows for dynamic behaviour by entering the vector of lagged expenditure shares Finally the last addendum is a non-linear intercept shift (similar to the one proposed by Foster and Just 1989) that embodies the effects of retained
4 Indeed Deaton and Muellbauer (1980) themselves remarked that serial correlation may arise due to the
imposition of homogeneity constraints when the expenditure on certain items is inflexible in the short run which is quite likely when working with high-frequency (monthly or weekly) data The economic meaning of lagged expenditure shares entering the model has been explained by myopic habit persistence behaviour (as for example in Pashardes 1986)
48 Mario Mazzocchi Gianluca Stefani and Spencer Henson
information5 Such an intervention structure implies that the sign and relevance of the disclosed information on the i-th intercept depends on the item-specific coefficient bi and evolves over time according to a parameter c that is held constant across equations The a priori information about the timing of the disclosure of
information (say time z) enters the system through ztd which equals to 1 if zt ge
and zero otherwise By setting 1+minus=lowast zttz we allow the impact of disclosed information to evolve over time with a direction and a rate which depends on c where 0=c implies a constant effect 0ltc a decreasing effect and 0gtc an increasing effect For 0ltc the intervention tends asymptotically to 0 The evolution over a ten years time span according to a set of values of c is shown in Figure 36 The system in (11) is non-linear due to non-linearities in the price index Pt and in the modified intercept
itα The problem of singularity is not present here since the demand system is incomplete and the numeraire item equation is dropped by construction As the lagged expenditure shares are pre-determined these can be considered as exogenous and (11) is still a seemingly unrelated regression (SUR) system We exploit a two-stage method for obtaining maximum likelihood estimates similar to that of Deaton and Muellbauer (1980) In the first stage the system coefficients are estimated by iterating the Zellner (1962) SUR estimator conditional to the value of the nonlinear price index Pt In the second stage the index Pt is explicitly computed using the coefficient estimates obtained in the first stage This procedure is iterated until convergence which is achieved when the estimates of the system coefficients are stable7 The COI measure can be derived from the coefficient estimates according to (8) The first step involves computing the vector of prices p1t as in (7) for each time period following the crisis As described above the vector p1t represents the price that would need to be charged to cause individuals to purchase at time t the same quantity they would have chosen before the release of information keeping the utility level constant at the level U0 This can be derived by holding the quantities8 and the total expenditure fixed at their value at the time r=z-1 (the last time period before the release of information) and solving numerically system (11) with respect to prices
5 Alternatively if data are available one can define the shift in demand as a function of ldquopositiverdquo and ldquonegativerdquo
information released by the media (as in eg Liu et al 1998 and Verbeke et al 2000) 6 It can be shown analytically that the shift becomes negligible (lt001) in ten years when c lt -262 in five years
when c lt -283 and in three years when c lt -302 7 The final estimates will be maximum likelihood estimates as the Oberhofer-Kmenta conditions are met for the
SUR model (Greene 1997 p 681) 8 Defined as the ratio between expenditure and price for each good
Consumer Welfare and the Loss Induced by Withholding Information The Case of BSE in Italy 49
Figure 3 Value of the Intervention Variable Over 12 years for Different Values of c
Once p1t has been computed it is possible to estimate the COI measure by exploiting the AIDS model cost function For the system in (11) given that the utility level is U0 after inversion of the utility function the cost functions can be written as follows
1 1 1
0 0 1 1 11 1 1
1 1 1 11
01 1 11
1log ( ) log log log
2
1 + log log log log
2
j
n n n
it it ij it jti i j
n n n njt
r it ir ij ir jrjr i i jj
e U p p p
py p p pp
β
α α γ
α α γ
minus minus minus
= = =
minus minus minus minus
= = ==
= + + +
minus minus minus
sum sumsum
sum sumsumprod
1 1p
(14)
1 1 1
0 0 11 1 1
1 1 1
01 1 1
1log ( ) log log log
2
1 log log log log
2
n n n
it ir ij ir jri i j
n n n
r it ir ij ir jri i j
e U p p p
y p p p
α α γ
α α γ
minus minus minus
= = =
minus minus minus
= = =
= + + +
+ minus minus minus
sum sumsum
sum sumsum
0 1p
(15)
where p1it is the i-th element of the vector p1t computed as previously described and pir are the actual prices for the i-th good at the benchmark time r (the last period
00
02
04
06
08
10
20 40 60 80 100 120
c=-302
00
02
04
06
08
10
20 40 60 80 100 120
c=-262
00
02
04
06
08
10
20 40 60 80 100 120
c=-1
04
05
06
07
08
09
10
20 40 60 80 100 120
c=-05
070
075
080
085
090
095
100
20 40 60 80 100 120
c=-02
094
096
098
100
102
104
106
20 40 60 80 100 120
c=0
08
12
16
20
24
28
20 40 60 80 100 120
c=+05
0
1
2
3
4
5
6
20 40 60 80 100 120
c=+1
0
10
20
30
40
20 40 60 80 100 120
c=+2
50 Mario Mazzocchi Gianluca Stefani and Spencer Henson
prior to the information release) From (14) and (15) it is possible to compute a measure of the cost of ignorance
( )1
1 0 0 11
( ) ( )n
t ir it iri
COI e U e U p p qminus
=
= minus + minussum1 r 1p (16)
where ir r
irir
w xq
p= are the quantity indices and
irw are the fitted values for the
expenditure shares at the baseline period r computed through (11) 4 An application to the BSE scare in Italy News about the BSE crisis had a strong impact on Italian consumers Despite the fact that the first Italian case of BSE was only officially identified in 20019 the prevailing uncertainty led to a significant fall in consumption especially in the aftermath of the scare In April 1996 real household beef expenditure fell by 184 compared to April 1995 and by 127 compared to the previous month In December 1996 consumption was still 87 below its 1995 level Indeed markets for beef in Italy were amongst the hardest hit within the European Union According to FAO-AGROSTAT figures10 average per capita beef consumption in 2001 was 103 percent below its 1995 level Only Germany (-425) and Portugal (-119) experienced a larger decline11 On the other hand UK per-capita consumption in 2001 was slightly above its 1995 level (+06) However these figures make little sense if relative price dynamics are not taken into account (Thompson and Tallard 2003) Considering the real beef retail price index between 1995 and 2001 a decrease of 91 was observed in Italy compared to a 14 decline in the UK12 In order to evaluate the costs of withholding information prior to March 1996 the empirical model detailed in the previous section was applied to Italian data provided by the Household Expenditure Survey of the National Institute of Statistics (ISTAT) The event of interest was the release of information about a possible linkage between BSE and the human disease vCJD at the end of March 1996 Total per capita household expenditure and consumer expenditure on the following four food groups was considered beef poultry other meats and fish Aggregate (monthly) data was constructed from individual household data drawn from the nationally representative ISTAT Italian Household Expenditure Survey13 over the
9 Two imported cases were identified in 1994 10 The FAO figures on per-capita consumption is based on the disappearance method and on data provided by the
official national sources 11 These consumption and expenditure data were also influenced by the EC-led introduction of compulsory testing
of cattle starting January 2001 and the subsequent discovery of BSE cases within national territories 12 Considering the number of cases of BSE as a proxy for an objective risk assessment in 2001 Italian authorities
detected 48 cases of BSE against 1113 in the UK The above figures and discrepancies can be explained by assuming that the reaction of the Italian households to the BSE scare has been characterised by a stronger emotional response (probably widened by media coverage) and partly by a lower trust in the concerned authorities and control procedures
13 Istat (2001) Indagine sui consume delle famiglie file standard Users manual Rome Istat wwwistatit
Consumer Welfare and the Loss Induced by Withholding Information The Case of BSE in Italy 51
period 1986-1999 Nominal price data were constructed using the nominal 1996 price data from the ISMEA-Nielsen household budget survey and the time series of the ISTAT price indices The price index for the residual (numeraire) good was the ISTAT Consumer Price Index Summary sample descriptive statistics are provided in Table 1
Table 1 Sample Descriptive Statistics
Average Std Dev Minimum Maximum
Monthly number of households surveyed 252163 50959 168800 347900 Monthly beef expenditure 4052 280 3467 4752 Monthly chicken expenditure 1328 150 987 1669 Monthly other meats expenditure 3215 595 2090 4732 Monthly fish expenditure 2391 525 1459 4026 Total meat and fish expenditure 10986 1330 8085 14142 Total expenditure 144774 30436 88489 193658 Beef price 674 098 511 789 Chicken price 359 051 279 456 Other meats price 530 078 397 625 Fish price 661 099 445 795
NOTE Price and expenditure data are in Model estimates are reported in Table 2 As illustrated in the previous section the non-linear intercept shift which embodies the effects of information depends on both an item specific coefficient bi and a common parameter c acting as an exponent of a function of time elapsed from the release of information14 The item-specific coefficient for the beef equation was significant and had the expected negative sign whereas the shifts on the other equations were insignificant The c parameter shaping the evolution of the effects was -085 corresponding to a decreasing impact of information The estimated pattern for each equation is reported in Figure 4 The impact of the event on beef poultry and other meats had the expected sign and trend whereas fish had a negative shift as in the case of beef However it is worth emphasising that the impact was negligible for all equations except beef These results show that the impact on beef consumption was negative and decreasing in absolute value as expected Once trust in meat safety had been lost it took a long time to recover given the asymmetric impact of alarming and reassuring news 14 Conversely to Foster and Just (1989) in (14) we suggest to use the logarithm of t which involves a more
gradual evolution of the impact
52 Mario Mazzocchi Gianluca Stefani and Spencer Henson
Table 2 Model Estimates and Diagnostics
Beef Poultry Other meats Fish
Intercept (avg) -0103 -0129 0233 0229 (0103) (0032) (0091) (0079) ψ1 0429 0044 0080 -0008 (0075) (0024) (0068) (0059) ψ2 -0267 0001 -0055 -0113 (0278) (0089) (0255) (0222) ψ3 0132 0004 0218 0007 (0091) (0029) (0082) (0071) ψ4 -0065 -0006 0343 0514 (0113) (0036) (0103) (0090) b -0006 0000 0000 0000 (0001) (0000) (0001) (0001) c -0852 -0852 -0852 -0852 (0231) (0231) (0231) (0231) γ1 0000 0001 0000 -0011 (0012) (0004) (0011) (0010) γ2 0014 0003 0018 -0001 (0008) (0002) (0007) (0006) γ3 0005 0010 -0026 -0005 (0020) (0006) (0018) (0016) γ4 0012 0004 -0006 0003 (0004) (0001) (0004) (0003) β -0016 -0003 -0008 -0008 (0002) (0001) (0002) (0002)
R-square 096 091 080 052 NOTE Standard errors in brackets value significant at a 001 confidence level are reported in bold Seasonal shifts in the intercept are not reported here but are available on request from the authors
According to the estimated value of c the impact of the crisis on beef demand was permanent as the BSE impact becomes negligible only asymptotically15 Price and expenditure elasticity estimates computed from the appropriate coefficients are reported in Table 3 Mean values for the period before and after the release of the BSE news are shown In line with the above results little change emerged in price elasticities for the poultry other meats and fish equations In the 15 Indeed at the end of 2000 there was a new and even larger BSE scare due to the detection of BSE cases in Italy
and France (the largest exporter to Italy) so that the asymptotical disappearance of the shock has little meaning
Consumer Welfare and the Loss Induced by Withholding Information The Case of BSE in Italy 53
case of beef demand however there was an increase in the absolute value of the elasticity with respect to both own price and cross prices Expenditure elasticities remained largely unchanged for other meats and fish whereas there was a dramatic decrease in expenditure elasticity for beef and a less prominent decline for poultry Figure 4 Values of the Intervention Variable for Each Food Group (Apr 96-Dec 99)
These results are consistent with other studies of the impact of the BSE crisis on meat demand (see for example Burton and Young 1996) Elasticity values did not show any significant discrepancy with estimates from other studies of Italian meat demand (see for example Dono and Thompson 1994 Fanelli and Mazzocchi 2002) apart from a lower own price elasticity for poultry and expenditure elasticity for beef compared to Fanelli and Mazzocchi (2002) However these discrepancies are explained by differences in model specification and the estimation period Following Foster and Just (1989) the COI for the four meat groups and a numeraire was calculated according to (16) With regard to the BSE crisis COI is a measure of the welfare improvement that could have been obtained if the news about the possible link between BSE and human vCJD had been released earlier In particular an earlier warning would have allowed consumers to reallocate their consumption across the foods of the meat group as they actually did once the BSE crisis was publicised It is worth noting that having included lagged expenditure shares in the cost function the measure obtained also takes account of the cost of adapting to new consumption patterns that differ from habitual ones
-0007
-0006
-0005
-0004
-0003
-0002
-0001
1997 1998 1999
Beef
000005
000010
000015
000020
000025
000030
000035
000040
1997 1998 1999
Poultry
000002
000004
000006
000008
000010
1997 1998 1999
Other meats
-00005
-00004
-00003
-00002
-00001
1997 1998 1999
Fish
54 Mario Mazzocchi Gianluca Stefani and Spencer Henson
Table 3 Price and expenditure elasticities before and after March 1996
Beef Poultry Other meats
Fish Expenditure
Before March 1996
Beef -115 033 006 028 051
(035) (025) (043) (016) (008)
Poultry 009 -068 109 051 069 (039) (027) (063) (015) (007)
Other meats -002 084 -209 -022 063 (042) (029) (093) (022) (011)
Fish -056 010 -015 -064 053 (066) (040) (104) (029) (013)
After March 1996
Beef -122 047 008 040 029
(052) (037) (061) (025) (011)
Poultry 011 -061 134 062 062 (048) (030) (073) (019) (010)
Other meats -002 086 -212 -023 062 (042) (031) (098) (022) (011)
Fish -055 009 -014 -065 054 (067) (040) (104) (029) (013)
NOTE Bootstrap standard errors in brackets based on 1000 replications As a baseline for the COI measure the informational regime of February 1996 was taken which was assumed to represent a state of ignorance Prior to March 1996 the scare about BSE had not started and consumers generally believed consuming beef was safe However some reports indicate that public authorities may have been aware of risks from BSE as early as 1988 when the results of first studies on transmissibility became available16 The actual crisis began on 20 March 1996 and fully developed its effects on consumption in the following month Taking February as a baseline the COI for that month can be measured with respect to different informational statuses as reflected by the beliefs of consumers With reference to Figure 1 February 1996 represents Step 1 (choices under ignorance) March 1996 is the time of information release (Step 2) and the observed purchasing behaviours from April 1996 to the end of the sample reflect informed choices (Steps 3 and 4)
16 In 1990 after evidence of transmission to cats mice pigs and sheep public concern rose consistently Even if
risks for human health could not be excluded all the governmental reactions were aimed to reassure the consumer about the safety of beef until March 1996 (source BSE Inquiry 2000 httpwwwbseinquirygovuk)
Consumer Welfare and the Loss Induced by Withholding Information The Case of BSE in Italy 55
Estimates of the intervention parameters suggest an immediate strong impact of information release on consumption followed by a relatively slow decline Indeed as illustrated in Section 2 subjective beliefs about the safety of beef changed over time for a number of reasons The original over-reaction to bad news probably explains the sharp drop in consumption in the immediate aftermath of the crisis However the slow recovering of consumption may have depended not only on a more rational reassessment of the actual risk but also on the change in objective safety level following the adoption of counter-measures by public authorities
Table 4 Measures of the per capita Cost of Ignorance (April 1996-December 1999)
Month COI ( p-value of per capita expenditure on meat and fish
(Feb 1996)
Apr-96 2276 (1155) 005 5441
Oct-96 809 (493) 010 1934
Apr-97 673 (424) 011 1608
Oct-97 608 (391) 012 1452
Apr-98 569 (371) 013 1359
Oct-98 540 (357) 013 1290
Apr-99 520 (356) 014 1242
Oct-99 502 (337) 014 1201
NOTE Standard errors and p-values are bootstrapped based on 1000 replications Table 4 presents COI estimates based on subjective risk perception in selected reference months A time series of COI estimates is obtainable as the perceived quality level θ1 changes over time because of the updating process in risk perception following flows of information (for example media coverage) (Liu et al 1998) The April 1996 data of 13 13 13 bound of the COI measure17 as we can safely assume that this was when the scare and the affective reaction reach their peak This figure amounts to about 54 percent of the actual expenditure on meat It measures the minimum amount the consumer would have been willing to accept given the level of risk perception in April 1996 as compensation for being kept uninformed in the previous months On the other hand a lower bound can be identified at a level of about
18 which takes into account the sanitary countermeasures put in place to deal with the crisis From a policy perspective it may be necessary to identify a COI value which reflects as closely as possible to the objective risk level and which does not embody emotiveness and rsquoirrationallsquo reactions Smith et al (1988) for example argue that rsquounnecessarylsquo welfare losses can derive from negative media coverage besides those due to the objective food contamination itself19 In order to devise a rule for
17 The measure is calculated at 1995 prices 18 From April 1998 the monthly percentage variation of COI is always below 1 19 Beardsworth and Keil (1996) examine in detail the process of lsquomoral panicrsquo in a food scare situation intended
as the ldquorapid surge of public concern which commonly accompanies intensive media coveragerdquo and observe
56 Mario Mazzocchi Gianluca Stefani and Spencer Henson
selecting a policy-relevant measure we assume that the affective component becomes marginal when the rate of change in the monthly COI estimate slows down As a rule of thumb20 a monthly percentage change of 5 percent in the measure can be adopted as a threshold level This would correspond to October 1996 as the representative reference month for subjective risk perceptions obtaining a COI value of about It is worth noting that basing COI estimates on a demand system rather than a single equation allows for substitution effects In other words converse to the leftward shift of the Hicksian demand curve for beef observed in Figure 2 the demand curve for beef substitutes perceived as safer after the release of information could shift rightwards If informed about the risk of beef consumers could have purchased the same quantities of substitute meats at higher prices Hence the COI measure in (9) also accounts for effects of information acting in the opposite direction and the system based measure is more appropriate than that based on a single equation In all cases the estimates seem plausible Thus Foster and Just (1989) investigate the case of retained information about milk contamination in Ohau (Hawaii) and obtained a COI higher than the value of milk normally consumed 5 Conclusions This paper has applied the COI approach of Foster and Just (1989) for the measurement of consumer welfare losses associated with withheld information about food safety to the BSE scare in Italy The Cost of Ignorance is computed comparing the value of the cost function associated with the informed choice of food in the meat group with the value related to an uninformed choice assuming consumers are aware of the crisis Unlike previous work which has been based on a single equation demand model COI is measured retrieving a cost function from a dynamic Almost Ideal Demand System This allows for reallocation of expenditure among substitute foods behaviour actually observed in the aftermath of the BSE scare The computed COI measure could be of use in determining how much the Government should spend in providing timely information or to quantify the damage attributable to those who did not disclose the information in due time The results of the analysis show that Italian consumers bore a sizeable loss because of the delayed release of information about a possible link between BSE and human vCJD The estimated loss per person per month ranged from 12 to around 50 of total expenditure on the meat group depending on the period assumed to embody correct beliefs about the safety level of beef Further methodological refinements could improve the accuracy of the measure Lack of data has prevented subjective beliefs about the safety of beef from being modelled as a function of the flow of positive and negative information to consumers during the BSE scare Alternative parameterisations of the intervention
that the sensitisation of the audience lead to a ldquospiralling level of anxiety to build uprdquo Such anxiety lsquoamplificationrsquo is described as a self-limiting process as the public and media interest start to decline
20 Foster and Just (1989) simply refer to the first month after the crisis Teisl et al (2001) and Rousu et al (2002) do not incur this problem as the reference period is clearly identified by the design adopted in their field and laboratory experiments
Consumer Welfare and the Loss Induced by Withholding Information The Case of BSE in Italy 57
variable should be explored as well as further checks on the robustness of the results Explicitly taking into account the choice of not purchasing meat as in Burton et al (2000) would also allow a further insight on the effect of the BSE crisis21 By providing an estimate of the welfare losses induced by non-disclosure of information our work allows a first insight into the theoretical and methodological intricacies of the assessment of the economic impacts of food-borne risk communication policies The BSE scare as a case example demonstrates the importance of risk communication in maintaining consumer trust in the food chain Indeed the EU has recognised the importance of this aspect in its White paper on Food Safety22 As a result interest in the value of communication policies is growing and further studies are needed in order to provide a sound economic basis for policy decisions References Alessie R and Kapteyn A (1991) Habit Formation Interdependent Preferences and
Demographic Effects in the Almost Ideal Demand System Economic Journal 101404-419
Attfield CTF (1997) Estimating a Cointegrating Demand System European Economic Review 4161-73
Beardsworth A and Keil T (1996) Sociology on the menu An invitation to the study of food and society London Routledge
Burton M Dorsett Rand Young T (2000) An investigation of the increasing prevalence of nonpurchase of meat by British households Applied Economics 321985-1991
Burton M and Young T (1996) The impact of BSE on the demand for beef and other meats in Great Britain Applied Economics 28687-693
Burton M Young T and Cromb R (1999) Meat consumersrsquo long-term response to perceived risks associated with BSE in Great Britain Cahiers dEacuteconomie et Sociologie Rurales 508-19
Deaton A and Muellbauer J (1980) An Almost Ideal Demand System American Economic Review 70312-326
Dono G and Thompson G (1994) Explaining changes in Italian consumption of meat Parametric and non-parametric analysis European Review of Agricultural Economics 21175-198
Edgerton DL (1996) The Specification and Estimation of Demand Systems in Edgerton Assarsson et al The Econometric of Demand System Norwell MA Kluwer Academic 63-92
Fanelli L and Mazzocchi M (2002) A cointegrated VECM demand system for meat in Italy Applied Economics 341593-1605
Foster W and Just RE (1989) Measuring welfare effects of Product Contamination with Consume Uncertainty Journal of Environmental and Resource Economics and Management 17266-283
Greene WH (1997) Econometric Analysis 3rd edition Upper Saddle River NJ Prentice Hall
21 We are grateful to an anonymous referee for pointing this out 22 COMM(1999) 719 final
58 Mario Mazzocchi Gianluca Stefani and Spencer Henson
Hanemann M and Morey E (1992) Separability Partial Demand Systems and Consumerrsquos Surplus Measures Journal of Environmental Economics and Managemen 22241-258
Hausmann JA (1981) Exact Consumerrsquos surplus and Deadweight Loss American Economic Review 71662-676
Kesavan T Hassan ZA Jensen HH and Johnson SR (1993) Dynamics and Long-Run Structure in US Meat Demand Canadian Journal of Agricultural Economics 41139-153
La France JT (1993) Weak Separability in Applied Welfare Analysis American Journal of Agricultural Economics 75770-775
La France JT and Hanemann M (1989) The Dual Structure of Incomplete Demand Systems American Journal of Agricultural Economics 71262-274
Lewbel A (1985) A Unified Approach to Incorporating Demographic or Other Effects into Demand Systems Review of Economic Studies 521-18
Liu S Huang J and Brown GL (1998) Information and Risk Perception A Dynamic Adjustment Process Risk Analysis 18689-699
Pashardes P (1986) Myopic and Forward Looking Behaviour in a Dynamic Demand System International Economic Review 27387-397
Ray R (1984) A Dynamic Generalisation of the Almost Ideal Demand System Economics Letters 14235-239
Rickertsen K (1996) Structural Change and the Demand for Meat and Fish in Norway European Review of Agricultural Economics 23316-330
Slovic P (1993) Perceived Risk Trust and Democracy Risk Analysis 13675-682 Rousu M Huffman WE Shogren JF and Tegene A (2002) The Value of Verifiable
Information in a Controversial Market Evidence from Lab Auctions of Genetically Modified Foods Department of Economics Working Paper Series 02003 Iowa State University
Smith ME van Ravenswaay EO and Thompson SR (1988) Sales Loss Determination in Food Contamination Incidents An Application to Milk Bans in Hawaii American Journal of Agricultural Economics 70513-520
Teisl MF and Roe B (1998) The Economics of Labeling An Overview of Issues for Health and Environmental Disclosure Agricultural and Resource Economics Review October 28140-150
Teisl MF Bockstael NE and Levy A (2001) Measuring the welfare Effects of Nutrition Information American Journal of Agricultural Economics 83133-149
Thompson Wand Tallard G (2003) Consumption versus Demand Recovery after BSE Eurochoices 2(1)24-25
Verbeke W and Ward RW (2001) A fresh meat almost ideal demand system incorporating negative TV press and advertising impact Agricultural Economics 25359-374
Verbeke W Ward RW and Viaene J (2000) Probit Analysis of Fresh Meat Consumption in Belgium Exploring BSE and Television Communication Impact Agribusiness 16215ndash234
Zellner A (1962) An Efficient Method of Estimating Seemingly Unrelated Regression Equations and Test of Aggregation Bias Journal of the American Statistical Association 57500-509
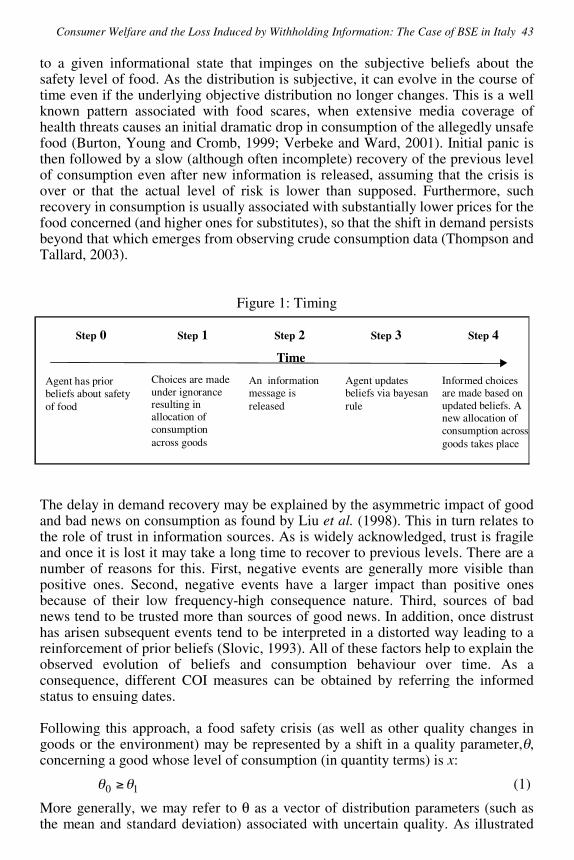
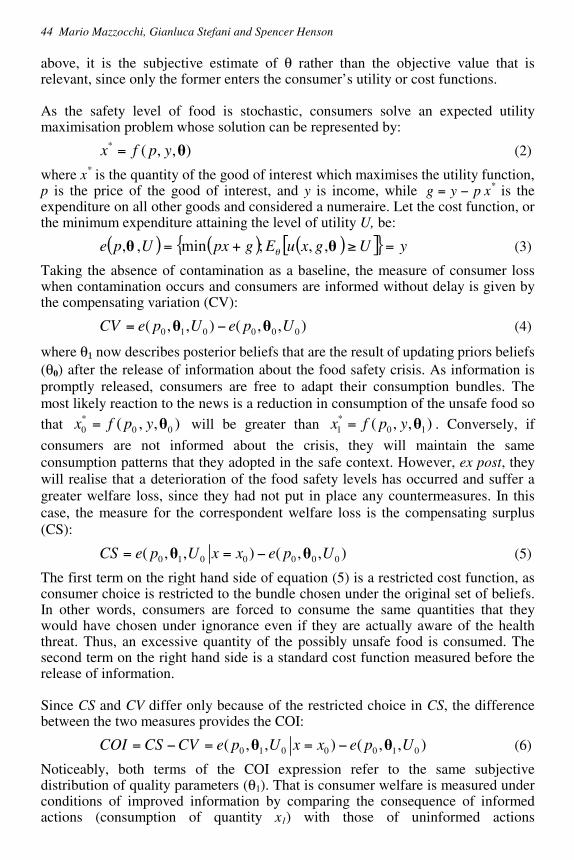
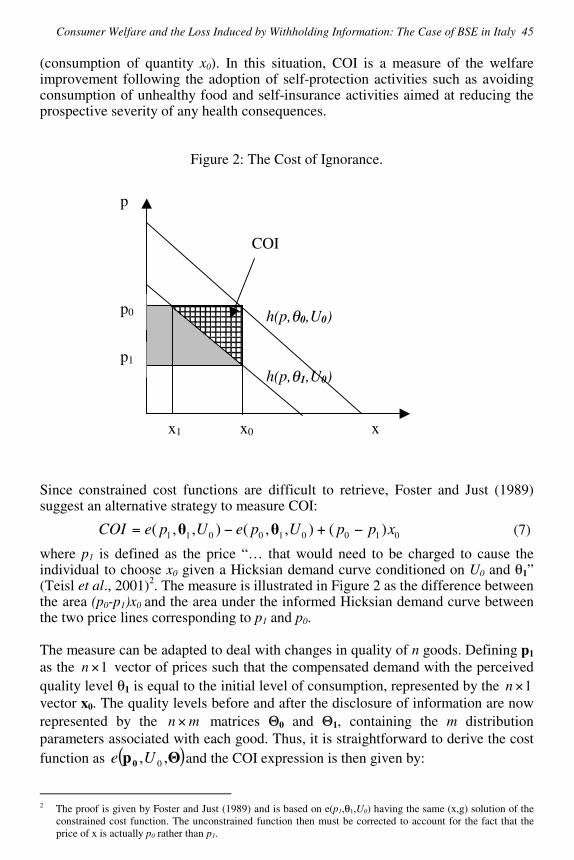
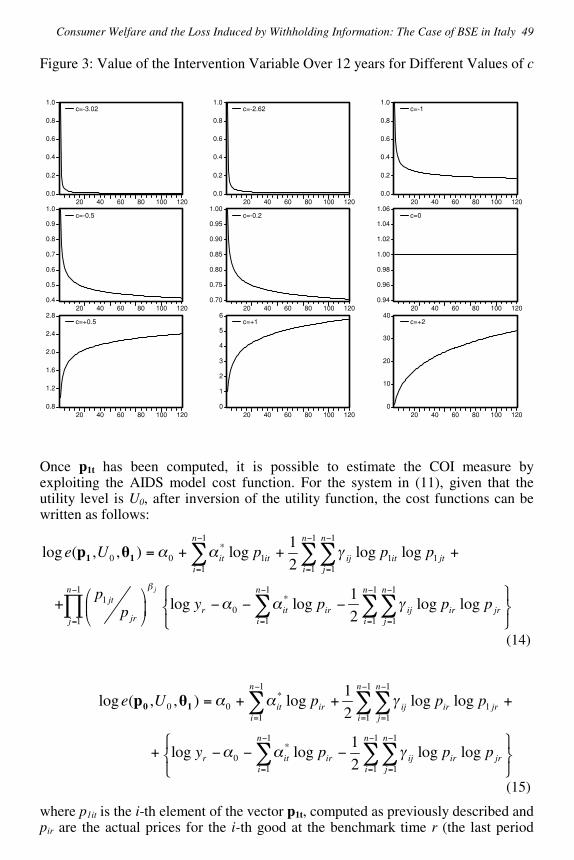
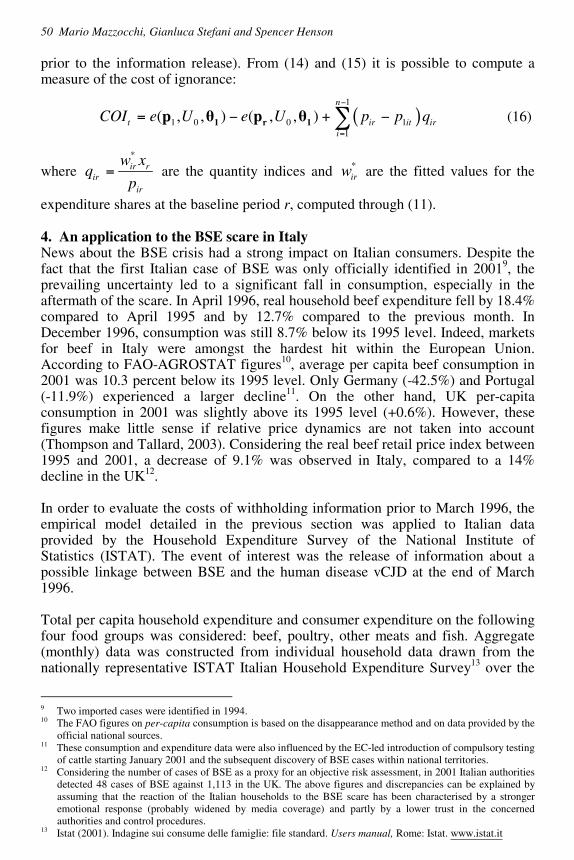
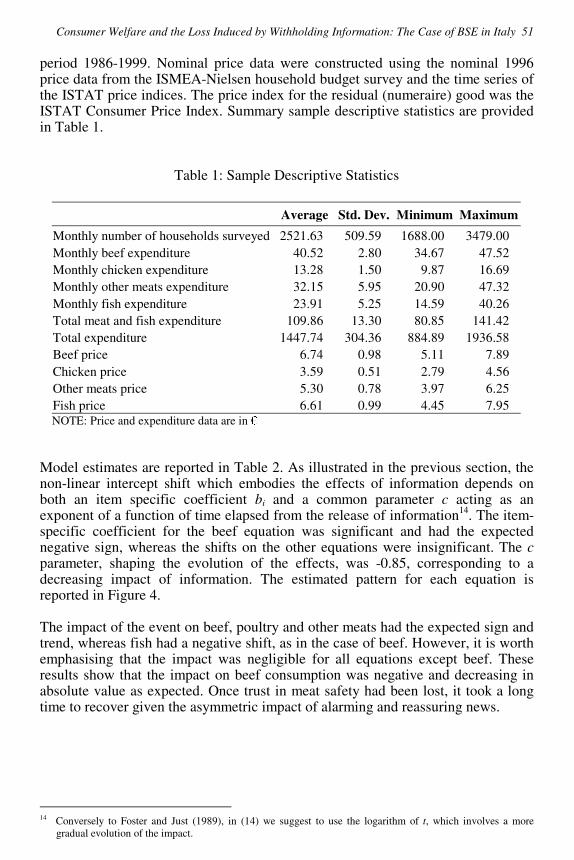
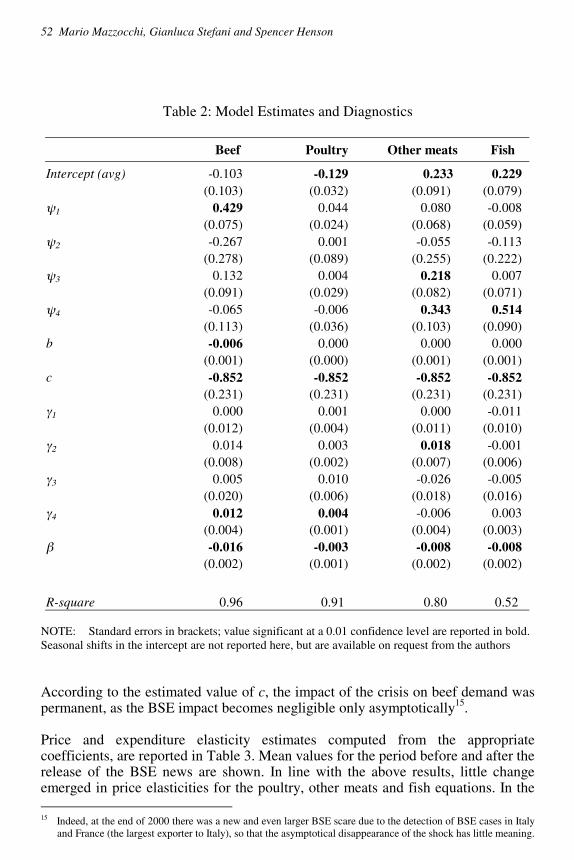
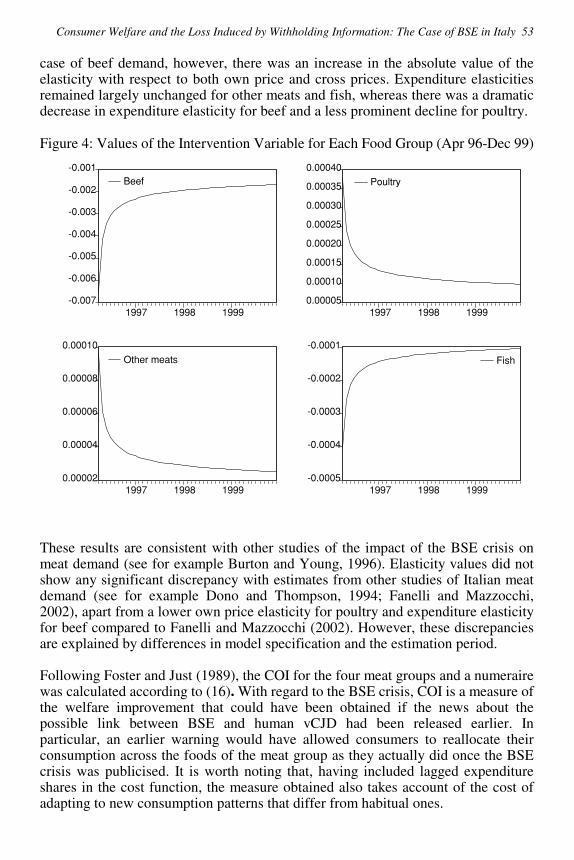
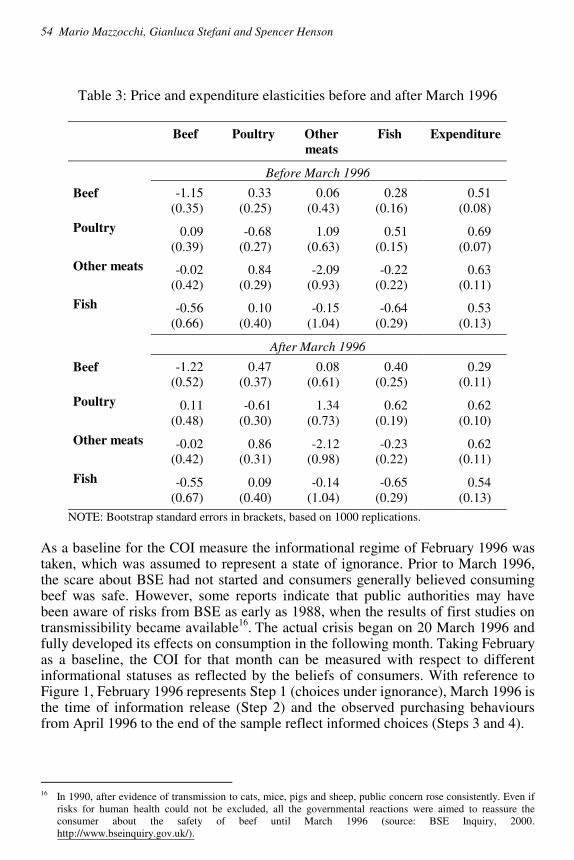
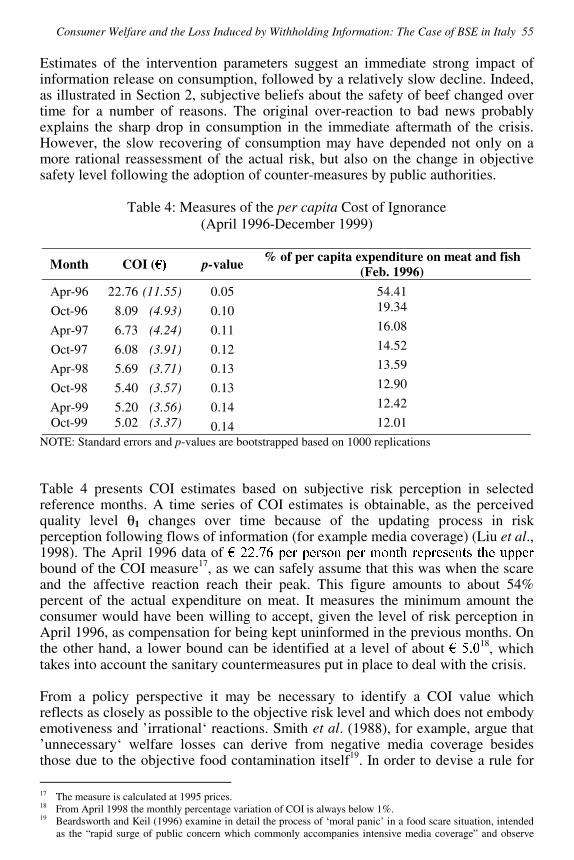
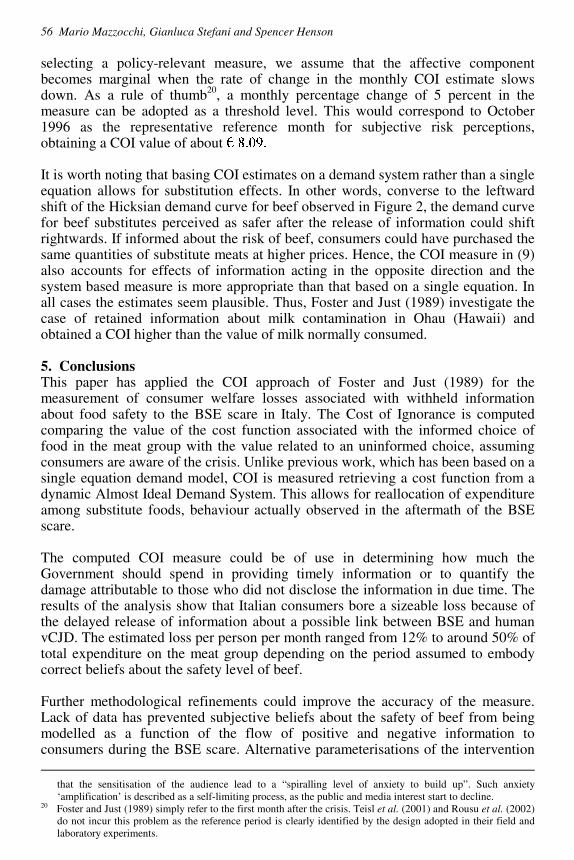
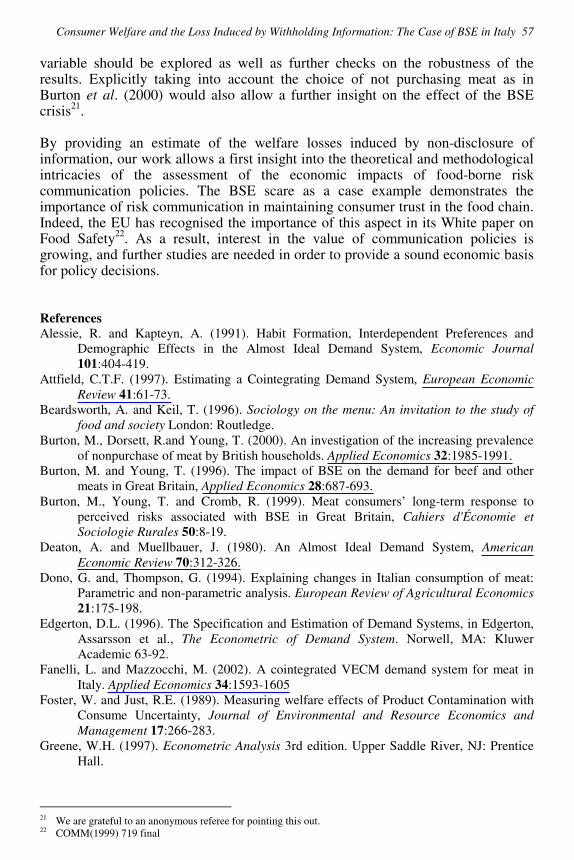
Copyright © 2022 FDOKUMEN

