


Bahasa
Halaman
Hukum


Diagnostics 2021, 11, 906. https://doi.org/10.3390/diagnostics11050906 www.mdpi.com/journal/diagnostics
Article
Comparison of MRI Visualization Following Minimally
Invasive and Open TLIF: A Retrospective Single‐Center Study
Vadim A. Byvaltsev 1,2,*, Andrei A. Kalinin 1,2, Morgan B. Giers 3, Valerii V. Shepelev 1, Yurii Ya. Pestryakov 1
and Mikhail Yu. Biryuchkov 4
1 Department of Neurosurgery, Irkutsk State Medical University, 664003 Irkutsk, Russia;
[email protected] (A.A.K.); [email protected] (V.V.S.); pestryakov‐[email protected] (Y.Y.P.) 2 Department of Neurosurgery, Railway Clinical Hospital, 664005 Irkutsk, Russia 3 School of Chemical, Biological, and Environmental Engineering, Oregon State University,
Corvallis, OR 97331, USA; [email protected] 4 Department of Neurosurgery with the Course of Traumatology, West Kazakhstan Marat Ospanov Medical
University, Aktobe 030012, Kazakhstan; [email protected]
* Correspondence: [email protected]; Tel.: +7‐9025‐1‐040‐20
Abstract: Analysis of magnetic resonance image (MRI) quality after open (Op)‐transforaminal
interbody fusion (TLIF) and minimally invasive (MI)‐TLIF with the implantation of structurally
different systems has not previously been performed. The objective of this study was to conduct a
comparative analysis of the postoperative MRI following MI and Op one‐segment TLIF. Material
and Methods: The nonrandomized retrospective single‐center study included 80 patients (46 men
and 24 women) aged 48 + 14.2 years. In group I (n = 20) Op‐TLIF with open transpedicular screw
fixation (TSF) was performed, in II group (n = 60), the MI‐TLIF technique was used: IIa (n = 20)—
rigid interspinous stabilizer; IIb (n = 20)—unilateral TSF and contralateral facet fixation; IIc (n = 20)—
bilateral TSF. Results: Comparison of the quality of postoperative imaging in IIa and IIb subgroups
showed fewer MRI artifacts and a significantly greater MR deterioration after Op and MI TSF.
Comparison of the multifidus muscle area showed less atrophy after MI‐TLIF and significantly
greater atrophy after Op‐TLIF. Conclusion: MI‐TLIF and Op‐TLIF with TSF have comparable
postoperative MR artifacts at the operative level, with a greater degree of muscle atrophy using the
Op‐TLIF. Rigid interspinous implant and unilateral TSF with contralateral facet fixation have less
artifacts and changes in the multifidus muscle area.
Keywords: lumbar spine; degenerative diseases; transforaminal interbody fusion; open
transpedicular fixation; minimally invasive decompression and stabilization; postoperative
imaging; artifacts; magnetic resonance imaging
1. Introduction
Transforaminal interbody fusion (TLIF) and open (Op) dorsal rigid stabilization are
the most common methods of surgical treatment for most degenerative diseases of the
lumbar spine [1,2]. At the same time, minimally invasive (MI) decompression and
stabilization techniques are actively used in modern spinal surgery and associated with
better clinical outcomes due to less paravertebral tissue damage, minimum postoperative
pain syndrome, and shorter recovery [3,4]. Adverse consequences of such interventions
can be cage migration, instability of the structure, degeneration of the adjacent level, and
postoperative muscle atrophy; for these reasons, complete visualization of the operated
and adjacent levels is a mandatory requirement for medical implants [5,6]. Even in cases
where a patient has complete functional recovery, imaging is necessary following
instrumental fixation to assess the degree of nerve decompression, study the state of
adjacent segments and paravertebral muscles, and assess the interbody fusion formation
Citation: Byvaltsev, V.A.; Kalinin,
A.A.; Giers, M.B.; Shepelev, V.V.;
Pestryakov, Y.Y.; Biryuchkov, M.Y.
Comparison of MRI Visualization
Following Minimal Invasive and
Open TLIF: A Retrospective Single
Center Study. Diagnostics 2021, 11,
906. https://doi.org/10.3390/
diagnostics11050906
Academic Editors: Thomas Baum
and Nico Sollmann
Received: 6 April 2021
Accepted: 17 May 2021
Published: 19 May 2021
Publisher’s Note: MDPI stays
neutral with regard to jurisdictional
claims in published maps and
institutional affiliations.
Copyright: © 2021 by the authors.
Licensee MDPI, Basel, Switzerland.
This article is an open access article
distributed under the terms and
conditions of the Creative Commons
Attribution (CC BY) license
(http://creativecommons.org/licenses
/by/4.0/).

Diagnostics 2021, 11, 906 2 of 16
[7]. In addition to computed tomography (CT), magnetic resonance imaging (MRI) is a
required informative noninvasive method for postoperative examination of neural
structures [8].
Most implants used in spinal surgery have properties that make them susceptible to
artifacts in postoperative images [9]. The use of various additional software options for
MRI improves visualization quality but does not eliminate artifacts [10]. This is one of the
incentives for developing and implementing constructs with potentially less distortion of
postoperative MR images [11].
A comparative analysis of MRI artifacts after Op and MI one‐segment decompression
and stabilization interventions with implantation of structurally different systems has not
been performed before. Here, we assess whether the size and location of artifacts created
by various implants render portions of the postoperative MRI useless and whether there
are comparable procedures that allow for better postoperative imaging assessment of the
patient.
The objective of this study was to conduct a comparative analysis of the postoperative
MRI following minimally invasive and open one‐segment TLIF.
2. Materials and Methods
All surgeries were performed at the Center for Neurosurgery of the Railway Clinical
Hospital, a private healthcare institution in Irkutsk, Russia, between 2009 and 2019; Figure
1 presents the flow chart of the study design. The timeframes of the Op and MI surgeries
were similar. This study was approved by the ethics committee at the Irkutsk State
Medical University.
A random sample of patients was obtained by simple random sampling from the
general database of patients (n = 3989) in Excel. Analysis of the postsurgical imaging was
conducted in January 2021. This comparative, retrospective, single‐center study included
80 patients (46 men and 24 women) aged 48 ± 14.2 years. A comprehensive instrumental
analysis of MRI, CT, and lumbar X‐ray before surgery and within 5 to 8 years following
surgery (average follow‐up history was 6.3 years) was performed in all patients.
Figure 1. Flow chart characterizing the study design.

Diagnostics 2021, 11, 906 3 of 16
2.1. Patient Inclusion Criteria
Eighty patients were nonrandomly selected from 5518 patients having received
spinal decompression and stabilization surgeries at the study institution between 2009
and 2019. Patients were candidates for study inclusion if they met the following criteria:
single‐level degenerative disc disease of L4–L5;
received TLIF and dorsal rigid stabilization performed for degenerative disc disease
with foraminal stenosis or segmental instability;
patient information (MRI data) was available in the follow‐up.
2.2. Patient Exclusion Criteria
Patients were not considered for the study if they had any one of the following
criteria:
• two‐level degenerative disc disease of the lumbar spine;
• operative level was L1–L2/L2–L3/L3–L4/L5–S1;
• anterior or lateral lumbar interbody fusion with dorsal rigid stabilization;
• previously performed operations at the lumbar level;
• inability to conduct MRI in patients in the postoperative period (fear of confined
spaces, the presence of foreign metal objects, etc.);
• competing pathological process in the lumbar spine (traumatic injuries, systemic
diseases of connective tissue, infectious and inflammatory diseases, tumor lesions,
etc.);
• lack of patient consent to participate in the study;
• absence of the patient′s neuroimaging archive in the follow‐up.
2.3. Surgical Technique
All operations had the same surgical team. Patients were placed under intravenous
anesthesia and artificial ventilation of the lungs. The patients were positioned prone with
pads under their shoulders and iliac regions. Surgery was performed using a Pentero 900
operating microscope (Carl Zeiss, Berlin, Germany), Anspach Effort power equipment
(Palm Beach Gardens, Fl, USA), specialized instrumentation, and intraoperative
fluoroscopy with Philips apparatus (Amsterdam, Netherlands).
Patients were allocated into two groups. In the first group (n = 20),
decompression/stabilization was performed using an Op‐TLIF with a median approach
and open transpedicular screw fixation (TSF) using the ʺConmetʺ system (Moscow,
Russia) (Figure 2); in the second group (n = 60), an MI‐TLIF technique was used with an
intermuscular paramedian approach and various minimally invasive dorsal rigid
stabilization techniques. Patients of both groups underwent unilateral facetectomy,
discectomy and foraminotomy for the spinal root, transforaminal installation of a cage
made of PEEK material (ʺPezo‐Tʺ (Ulrich Medical GmbH, Ulm, Germany), ʺT‐palʺ
(Synthes, Solothurn, Switzerland), ʺCapstoneʺ (Medtronic, Minneapolis, MN, USA)).
Depending on the type of MI stabilization, three subgroups of patients were allocated: IIa
(n = 20)—a rigid interspinous stabilizer ʺCoflex‐Fʺ (Paradigm Spine GmbH, Ulm,
Germany) was used (Figure 3); IIb (n = 20)—the system of unilateral TSF ʺViper IIʺ
(Synthes, Solothurn, Switzerland) and titanium facet cage “Facet Wedge” (Synthes,
Solothurn, Switzerland) were implanted from the contralateral side (Figure 4); IIc (n =
20)—bilateral percutaneous TSF ʺU‐centumʺ (Ulm, Ulrich Medical GmbH, Germany) was
performed (Figure 5).

Diagnostics 2021, 11, 906 4 of 16
Figure 2. Postoperative T2w MRI of a 50‐year‐old female from group I with degenerative disc
disease at L4–L5. (a)—sagittal X‐ray; (b)—sagittal MRI; (c)—axial MRI at L3–L4 (overlying
segment); (d)—axial MRI at L4–L5 (operation level); (e)—axial MRI at L5–S1 (underlying
segment). The white arrows indicate regions with visible artifacts.
Figure 3. Postoperative T2w MRI of a 44‐year‐old male from group IIa with degenerative disc
disease at L4–L5. (a)—sagittal X‐ray; (b)—sagittal MRI; (c)—axial MRI at L3–L4 (overlying
segment); (d)—axial MRI at L4–L5 (operation level); (e)—axial MRI at L5–S1 (underlying
segment). The white arrows indicate regions with visible artifacts.

Diagnostics 2021, 11, 906 5 of 16
Figure 4. Postoperative T2w MRI of a 46‐year‐old female from group IIb with degenerative disc
disease at L4–L5. (a)—sagittal X‐ray; (b)—sagittal MRI; (c)—axial MRI at L3–L4 (overlying
segment); (d)—axial MRI at L4–L5 (operation level); (e)—axial MRI at L5–S1 (underlying
segment). The white arrows indicate regions with visible artifacts.
Figure 5. Postoperative T2w MRI of a 43‐year‐old male from group IIc with degenerative disc
disease at L4–L5. (a)—sagittal X‐ray; (b)—sagittal MRI; (c)—axial MRI at L3–L4 (overlying
segment); (d)—axial MRI at L4–L5 (operation level); (e)—axial MRI at L5–S1 (underlying
segment). The white arrows indicate regions with visible artifacts.
2.4. MR Imaging and Analysis
Evaluation of patient MRIs before and after surgery was conducted on sagittal and
axial T2 weighted (T2w) images from a Siemens Magnetom Essenza MRI (1.5 T, Erlangen,
Germany). Images were acquired during a single excitation with an echo time (TE) of 89
ms, a repetition time (TR) of 2500 ms, a matrix size of 320 × 256 with 4 mm slice thickness,
and a field of view of 300 mm for sagittal T2w images. Images were acquired during a
single excitation with a TE of 88 ms, a TR of 5784.8 ms, a matrix size of 320 × 240 with 4

Diagnostics 2021, 11, 906 6 of 16
mm slice thickness, and a field of view of 230 mm for axial T2w images. Analysis of de‐
identified JPEG images was performed independently by two specialists (one
neurosurgeon and one radiologist) according to the Jarvik J. 2000 classification [12] at the
operative level and adjacent segment IVDs: grade 1—marked blurring without definable
margins; grade 2—blurring but definable margins; grade 3—minimal blurring; grade 4—
sharp definition. The analysis included evaluating the central canal, dural sac, interbody
space at the operative level, and left and right foramen. As specified by the Jarvik J. 2000
[12] classification method, three axial MRI slices per disc space were evaluated at the
operative level and at two adjacent levels. Radiological grading [13] (grade 1—no
significant artifact, grade 2—mild artifact measuring 1 mm or less surrounding the
implant; grade 3—moderate artifact measuring greater than 1 mm but less than 3 mm;
grade 4—severe artifact measuring greater than 3 mm surrounding the implant) and
orthopedic grading [13] (grade 1—no reduction in diagnostic quality because of artifact,
grade 2—some artifact with a reduction in diagnostic quality; grade 3—severe artifact
with loss of diagnostic ability) scales were also used to assess the severity of MRI artifacts
for the operative and adjacent segments [13]. As specified by the radiological and
orthopedic grading, three axial MRI slices per disc space were evaluated at the operative
level and at two adjacent ones. Kappa statistics (GraphPad Software, Inc., San Diego, CA,
USA) were used to evaluate the interobserver agreement. The multifidus muscle area was
calculated from anonymized axial T2w MRI images using the MultiVox DICOM Viewer
software (Gamma Multivox, Moscow, Russia). Multifidus muscles were segmented from
preoperative and postoperative MRIs using anatomical landmarks, and the total area for
the right and left sides of each level were recorded (Figure 6a–c). The average muscle area
across all three levels was calculated. The postoperative muscle areas were subtracted
from the preoperative area for each patient, then divided by the preoperative area in order
to assess a percent area change for each individual. Statistical analysis was performed on
the percent area change metric as one indication of muscle atrophy. In this study,
multifidus fat content was not assessed.
Figure 6. Axial MRI scans of the lumbar spine, the right multifidus muscle is outlined in white, the
left multifidus muscle is outlined in purple: (a)—L3–L4; (b)—L4–L5; (c)—L5–S1.
2.5. Statistical Analysis
Statistics were performed using Statistica software version 6.0 (StatSoft Inc., Tulsa,
OK, USA). Descriptive statistics are presented as M ± SD, where M is the mean value and
SD is the standard deviation. Comparison of continuous variables in the groups of
respondents was performed using one‐way ANOVA as amended by Bonferroni.
Comparison of categorical variables in all of the scoring systems was performed using a
Kruskal–Wallis test. A p value of less than 0.05 was considered significant.
3. Results
Patient demographics are shown in Table 1. There were no differences in gender and
age between the studied groups (p > 0.05). The average follow‐up period was 79.5 months
in group I and 78 months in group II.

Diagnostics 2021, 11, 906 7 of 16
Table 1. Patient demographic information.
Criteria Group I (n = 20) Group II (n = 60)
F p Subgroup IIа (n = 20) Subgroup IIb (n = 20) Subgroup IIc (n = 20)
Age, years 46.4 ± 5.7 44.5 ± 3.9 43.4 ± 6.2 47.4 ± 7.3 0.31 0.63
Male/female ratio, n (%) 11 (55)/9 (45) 12 (60)/8 (40) 13 (65)/7 (35) 10 (50)/10 (50) 0.25 0.85
Observation period,
months 79.5 ± 2.54 78.1 ± 1.85 77.0 ± 0.81 78.3 ± 3.23 0.88 0.45
The interobserver agreement was evaluated using Kappa statistics for all Jarvik J.
2000 scores [12] (Table 2). It was found that there was moderate–excellent agreement
between observers for all scores.
Table 2. Interobserver agreement of Jarvik 2000 [12] scores.
Criteria
Group I (n = 20) Group II (n = 60)
Subgroup IIа, n = 20 Subgroup IIb, n = 20 Subgroup IIc, n = 20
Kappa ± SE
95%
Confidence
Interval
Kappa ± SE
95%
Confidence
Interval
Kappa ± SE
95%
Confidence
Interval
Kappa ± SE
95%
Confidence
Interval
Dural sac at operation level 0.86 + 0.15 0.74–0.93 0.95 + 0.04 0.85–1.00 0.75 + 0.13 0.69–0.90 0.85 + 0.14 0.76–0.94
Interbody space at operation
level 0.79 + 0.12 0.66–0.91 0.81 + 0.11 0.68–0.92 0.80 + 0.11 0.77–0.92 0.95 + 0.14 0.87–1.00
Central canal at operation
level 0.80 + 0.12 0.77–0.93 0.85 + 0.10 0.64–0.95 0.74 + 0.14 0.66–0.84 0.95 + 0.04 0.85–1.00
Right foramen 0.95 + 0.04 0.85–1.00 0.80 + 0.09 0.63–0.92 0.85 + 0.14 0.76–0.94 0.75 + 0.10 0.64–0.90
Left foramen 0.85 + 0.10 0.65–0.92 0.80 + 0.10 0.66–0,92 0.77 + 0.15 0.65–0.85 0.80 + 0.11 0.77–0.92
Upper adjacent level 0.72 + 0.12 0.61–0.85 0.75 + 0.10 0.64–0.90 0.85 + 0.13 0.79–0.90 0.81 + 0.11 0.68–0.92
Lower adjacent level 0.85 + 0.14 0.76–0.94 0.85 + 0.10 0.64–0.95 0.95 + 0.14 0.87–.00 0.72 + 0.12 0.61–0.85
When testing hypotheses about the equality of variances using the Levene test, the
equality of the analyzed variances was established (p > 0.05). The parametric univariate
analysis of variance revealed the presence of differences only in the mean values in the
groups in the analysis of postoperative visualization quality according to the Jarvik J. 2000
[12] scores at the operated level (p < 0.05) (Table 3). Pairwise comparison of the quality of
postoperative imaging using the Bonferroni correction in the subgroups of minimally
invasive rigid stabilization (IIa and IIb subgroups) showed fewer MRI artifacts and a
significantly greater deterioration in MR images after Op (group I) and MI bilateral TSF
(group IIc): PI‐PIIa < 0.001, PI–PIIb < 0.001, PI–PIIc < 0.001, PIIa–PIIb = 0.24, PIIa–PIIc = 0.02, PIIb–PIIc
= 0.04. In the groups of patients operated on with transpedicular screw stabilization, a
deterioration in the quality of MR images in the projection of the spinal root canals at the
operative level was revealed.
Table 3. Comparison of the image quality according to the Jarvik 2000 [12] scores.
Criteria
Preoperative Postoperative
Group I
(n = 20)
Group IIa
(n = 20)
Group IIb
(n = 20)
Group IIc
(n = 20) F р
Group I
(n = 20)
Group IIa
(n = 20)
Group IIb
(n = 20)
Group IIc
(n = 20) F р
Operation
level 3.96 ± 0.12 3.96 ± 0.17 3.97 ± 0.17 3.98 ± 0.17 0.20 0.88 2.64 ± 0.29 3.94 ± 0.17 3.11 ± 0.12 2.96 ± 0.26 41.63 <0.001
Adjacent
level 3.98 ± 0.10 3.98 ± 0.15 3.98 ± 0.16 3.97 ± 0.16 0.53 0.66 3.62 ± 0.23 3.89 ± 0.12 3.87 ± 0.27 3.65 ± 0.46 0.34 0.61
Overall
score 3.94 ± 0.36 3.97 ± 0.14 3.97 ± 0.14 3.97 ± 0.15 0.18 0.91 3.17 ± 0.26 3.91 ± 0.12 3.59 ± 0.16 3.34 ± 0.27 0.42 0.74
Note: p‐values were calculated using one‐way ANOVAs and indicate significance between the four groups at their
respective time points; bold for emphasis—the presence of statistically significant intergroup differences.
The Kappa statistics showed moderate–excellent interobserver agreement for both
the radiological and orthopedic scores for MRI artifact evaluation [13] (Table 4). When
testing hypotheses about the equality of variances using the Levene test, the equality of
Diagnostics 2021, 11, 906 8 of 16
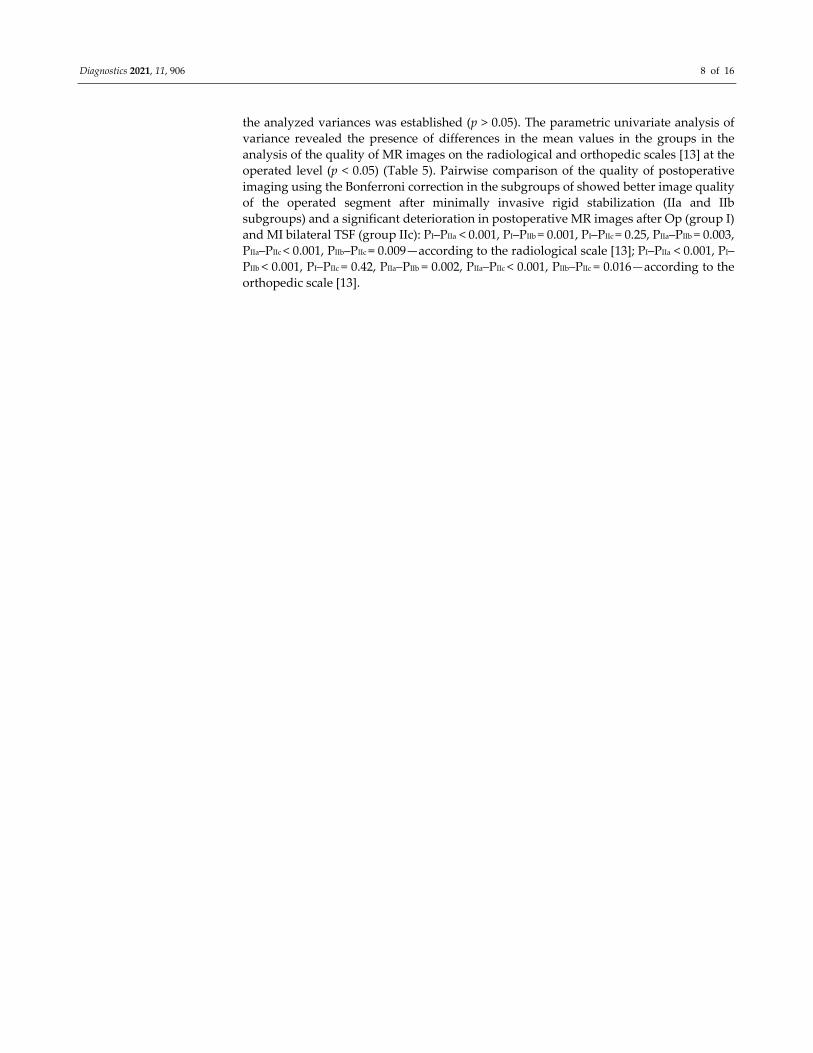
the analyzed variances was established (p > 0.05). The parametric univariate analysis of
variance revealed the presence of differences in the mean values in the groups in the
analysis of the quality of MR images on the radiological and orthopedic scales [13] at the
operated level (p < 0.05) (Table 5). Pairwise comparison of the quality of postoperative
imaging using the Bonferroni correction in the subgroups of showed better image quality
of the operated segment after minimally invasive rigid stabilization (IIa and IIb
subgroups) and a significant deterioration in postoperative MR images after Op (group I)
and MI bilateral TSF (group IIc): PI–PIIa < 0.001, PI–PIIb = 0.001, PI–PIIc = 0.25, PIIa–PIIb = 0.003,
PIIa–PIIc < 0.001, PIIb–PIIc = 0.009—according to the radiological scale [13]; PI–PIIa < 0.001, PI–
PIIb < 0.001, PI–PIIc = 0.42, PIIa–PIIb = 0.002, PIIa–PIIc < 0.001, PIIb–PIIc = 0.016—according to the
orthopedic scale [13].

Diagnostics 2021, 11, 906 9 of 16
Table 4. Interobserver agreement by radiological and orthopedic scales for MRI artifact evaluation [13].
Criteria Group I (n = 20)
Group II (n = 60)
Subgroup IIа, n = 20 Subgroup IIа, n = 20 Subgroup IIа, n = 20
Kappa ± SE 95% Confidence Interval Kappa ± SE 95% Confidence Interval Kappa ± SE 95% Confidence Interval Kappa ± SE95% Confidence Interval
Radiology scale: operation level 0.86 ± 0.07 0.67–1.00 0.95 ± 0.10 0.78–1.00 0.85 ± 0.14 0.81–1.00 0.91 ± 0.12 0.87–1.00
Radiology scale: upper adjacent level 0.90 ± 0.16 0.82–1.00 0.85 ± 0.08 0.68–1.00 0.76 ± 0.10 0.68–0.95 0.84 ± 0.11 0.67–0.93
Radiology scale: lower adjacent level 0.78 ± 0.17 0.70–0.91 0.82 ± 0.10 0.66–0.95 0.73 ± 0.14 0.67–0.82 0.78 ± 0.15 0.69–0.83
Orthopedic scale: operation level 0.82 ± 0.10 0.66–0.92 0.80 ± 0.09 0.71–0.98 0.92 ± 0.15 0.85–1.00 0.90 ± 0.18 0.80–0.99
Orthopedic scale: upper adjacent level 0.81 ± 0.10 0.72–0.94 0.85 ± 0.08 0.68–1.00 0.75 ± 0.10 0.64–0.95 0.72 ± 0.16 0.61–0.92
Orthopedic scale: lower adjacent level 0.75 ± 0.20 0.67–0.92 0.75 ± 0.10 0.64–0.92 0.80 ± 0.14 0.71–0.91 0.79 ± 0.19 0.70–0.90
Table 5. Comparative assessment of the quality of postoperative MRI [13].
Criteria Group I (n = 20) Group II (n = 60)
F р Subgroup IIа (n = 20)Subgroup IIb (n = 20) Subgroup IIc (n = 20)
Radiology scale: operation level 2.83 ± 0.37 1.11 ± 0.30 1.99 ± 0.40 2.95 ± 0.48 37.17<0.001
Radiology scale: upper adjacent level 1.21 ± 0.31 1.04 ± 0.22 1.08 ± 0.24 1.15 ± 0.36 0.76 0.23
Radiology scale: lower adjacent level 1.13 ± 0.34 1.15 ± 0.33 1.16 ± 0.43 1.17 ± 0.47 0.88 0.14
Orthopedic scale: operation level 2.39 ± 0.52 1.13 ± 0.30 2.04 ± 0.30 2.50 ± 0.50 14.49<0.001
Orthopedic scale: upper adjacent level 1.25 ± 0.36 1.05 ± 0.22 1.02 ± 0.24 1.23 ± 0.47 0.63 0.34
Orthopedic scale: lower adjacent level 1.21 ± 0.72 1.03 ± 0.33 1.05 ± 0.41 1.10 ± 0.77 0.51 0.63
Note: p‐values were calculated using one‐way ANOVAs and indicate significance between the four groups within their respective scoring system; bold for emphasis—the
presence of statistically significant intergroup differences.
Diagnostics 2021, 11, 906 10 of 16
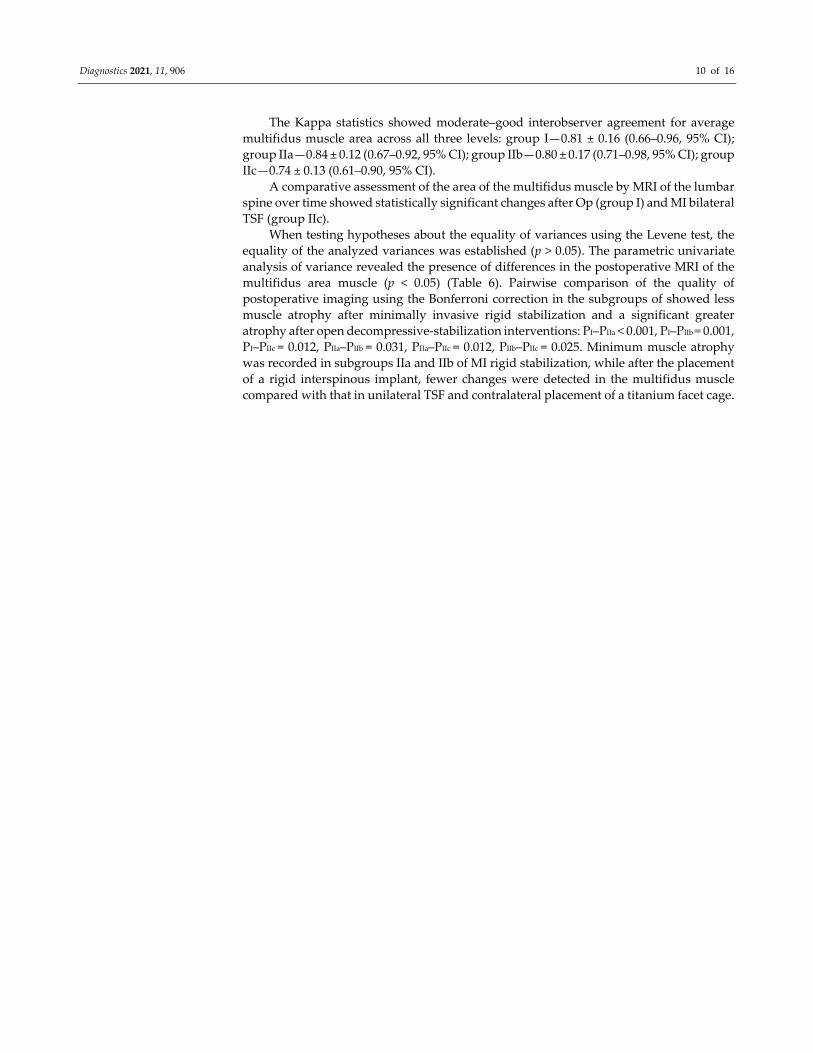
The Kappa statistics showed moderate–good interobserver agreement for average
multifidus muscle area across all three levels: group I—0.81 ± 0.16 (0.66–0.96, 95% CI);
group IIa—0.84 ± 0.12 (0.67–0.92, 95% CI); group IIb—0.80 ± 0.17 (0.71–0.98, 95% CI); group
IIс—0.74 ± 0.13 (0.61–0.90, 95% CI).
A comparative assessment of the area of the multifidus muscle by MRI of the lumbar
spine over time showed statistically significant changes after Op (group I) and MI bilateral
TSF (group IIc).
When testing hypotheses about the equality of variances using the Levene test, the
equality of the analyzed variances was established (p > 0.05). The parametric univariate
analysis of variance revealed the presence of differences in the postoperative MRI of the
multifidus area muscle (p < 0.05) (Table 6). Pairwise comparison of the quality of
postoperative imaging using the Bonferroni correction in the subgroups of showed less
muscle atrophy after minimally invasive rigid stabilization and a significant greater
atrophy after open decompressive‐stabilization interventions: PI–PIIa < 0.001, PI–PIIb = 0.001,
PI–PIIc = 0.012, PIIa–PIIb = 0.031, PIIa–PIIc = 0.012, PIIb–PIIc = 0.025. Minimum muscle atrophy
was recorded in subgroups IIa and IIb of MI rigid stabilization, while after the placement
of a rigid interspinous implant, fewer changes were detected in the multifidus muscle
compared with that in unilateral TSF and contralateral placement of a titanium facet cage.

Diagnostics 2021, 11, 906 11 of 16
Table 6. Changes of the multifidus muscle of the studied group of patients.
Criteria
Group I (n = 20) Group II (n = 60)
F p F p Subgroup IIа, n = 20 Subgroup IIb, n = 20 Subgroup IIc, n = 20
PreoperativePostoperativeMean
Changes, % Preoperative Postoperative
Mean
Changes, % PreoperativePostoperative
Mean
Changes, % PreoperativePostoperative
Mean
Changes, % Preoperative Postoperative
Average multifidus muscle
area, mm2 6.6 ± 1.2 3.0 ± 1.5 * 54.5 6.3 ± 0.7 6.1 ± 1.6 3.2 6.4 ± 1.2 5.8 ± 1.1 9.4 6.4 ± 1.9 5.0 ± 1.4 * 21.9 1.74 0.17 23.82 <0.001
Note: *—shows values that have statistically significant differences, bold for emphasis—the presence of statistically significant intergroup differences. p‐values were
calculated using one‐way ANOVAs and indicate significance between the four groups on the percent changes at their respective time points.

Diagnostics 2021, 11, 906 12 of 16
4. Discussion
Rigid stabilization of the spine leads to significant biomechanical changes and
overload of adjacent segments, accelerating their degeneration [1,5]. In addition, classical
decompression and stabilization interventions are associated with substantial damage
and atrophy of the multifidus muscle, which maintains the dynamic lumbar and spinal
pelvic balance [14]. The use of MI technologies in spinal surgery reduces surgical trauma
to the skin, paravertebral soft tissues, and bone structures [15]. Less‐invasive surgeries
have better long‐term clinical results, primarily associated with preserving the multifidus
muscle’s nerves and causing its minimal postoperative atrophy [16].
Analysis of MR images after rigid stabilization of the spine is necessary to monitor
neural structures, paravertebral tissues, and adjacent segments [7]. Simultaneously, the
type of implanted material significantly affects the postoperative imaging quality from
minimal artifacts in titanium devices to much larger ones in stainless steel devices [17].
Dorsal decompression and stabilization interventions are performed on the anterior
and posterior vertebral column using different fixing devices. For interbody implantation,
cages are made primarily of polyether ether ketone (PEEK) or titanium [3], while stainless
steel, titanium, cobalt–chromium–molybdenum alloy, or PEEK are used for dorsal
stabilization [4]. The size of artifacts for these different materials can be estimated from
their magnetic susceptibility coefficients (Table 7), where negative values indicate
diamagnetic materials, near‐zero values indicate paramagnetic materials, and large values
indicate ferromagnetic materials [11,18].
Titanium interbody cages, having high strength and biocompatibility, are most often
used to stabilize the anterior supporting complex, but they are paramagnetic and can
distort the magnetic field and impede visualization of the anatomy of the operative area
[19,20]. Polymer composites reinforced with carbon fiber or based on PEEK are common
alternative nonmetallic biomaterials for interbody spacers [21,22]. In the first case,
minimal artifacts are recorded on postoperative MRI [23]. The latter are diamagnetic and
lack X‐ray contrast, making it possible to both view them on an MRI and assess bone
formation within the cage using X‐ray [24]. In this study, we did not aim to analyze
interbody implants’ effect on postoperative MRI quality. Therefore, only patients with
PEEK transforaminal cages were included.
Table 7. Comparison of the magnetic susceptibility coefficients of common medical materials.
Material Magnetic Susceptibility (10−6 cm3 g−1)
18Cr–14Ni–2.5Mo 36.1 [11]
Co–18Cr–6Mo 8.37 [18]
Ti–6Al–4V 4.52 [18]
Ti–Gr2 2.43 [11]
Zr–1Mo 1.05 [11]
Op‐TLIFs are often limited to the use of transpedicular screw fixation systems to
stabilize the posterior support complex. In contrast, MI techniques can use a more
comprehensive selection of implants, including interspinous spacers and transfacet
stabilization [5]. Despite the different clinical and instrumental indications for using the
implants mentioned above, the main goal of such techniques is complete decompression
and effective stabilization, reducing the trauma of surgical intervention [2,3].
In the literature, few studies are devoted to analyzing MR image quality after dorsal
decompression and stabilization interventions. Titanium screw and rods have lower
magnetic susceptibility than stainless‐steel and cobalt–chromium [25]. Thus, in the study
of Ahmad et al. [6] a larger artifact size was observed on postoperative MRI in longitudinal
rods made of cobalt–chromium material compared to titanium ones on T1w—11.8 ± 1.8
and 8.5 ± 1.2 mm, respectively, and on T2w—11.0 ± 2.3 and 8.3 ± 1.7 mm, respectively. In

Diagnostics 2021, 11, 906 13 of 16
this case, the interpretation of the state of the operative area was not difficult. Cobalt–
chromium implants are mechanically stronger than titanium ones [26], contributing to the
widespread adoption of titanium–cobalt–chrome longitudinal rods and screw heads of
smaller lengths and diameter for spinal surgery [27]. Trammell et al. [28] confirmed on
cadaver material comparable neuroimaging data in the interpretation of the operated and
adjacent segments when placing (1) 6.5 mm titanium screws with cobalt–chromium–
molybdenum polyaxial heads and cobalt–chromium–molybdenum longitudinal rods
with a diameter of 4.75 mm compared with (2) 6.5 mm titanium polyaxial screws and
titanium longitudinal rods with a diameter of 5.5 mm.
There are several methods aimed at reducing the magnetic susceptibility artifacts of
implants: the use of low‐field [29] or high‐field [30] MRI; control of MR scanning
parameters—slice thickness, throughput, and echo time [31]; slice encoding for metal
artifact correction (SEMAC) [32]; technologies of iterative decomposition of water and fat
with echo asymmetry and least‐squares estimation, IDEAL [33]. The disadvantages of
these techniques are the deterioration of the quality of postoperative MR imaging of soft
tissues, prolongation of the scan time, the need for additional expensive modules in the
MRI apparatus, and radiologists’ training to work with these protocols [29–33].
This study has shown that using various types of implants to stabilize the posterior
support complex during single‐level MI‐TLIF does not impair the quality of postoperative
visualization of the adjacent segments. It was found that MI and Op bilateral TSF have
more significant artifacts on MRI, making it difficult to interpret the spinal root canals’
state at the operative level and objectively assess the multifidus muscle area. It was also
found that implants used in the MI‐TLIF group have lower magnetic susceptibility and
atrophic changes in the multifidus muscle compared to open placement of transpedicular
screw systems. In our opinion, the increase in postoperative MRI quality and a decrease
in atrophic changes in the multifidus muscle can be attributed to both decreased surgical
trauma and less hardware stabilizing the posterior support complex of implants. Thus,
the search for device materials and ways to improve postoperative imaging to diagnose
structural malfunctions, diseases of adjacent segments, and atrophic changes in the
multifidus muscle are currently ongoing.
Analysis of indications for a particular type of surgical intervention, its technical
component, and neurological outcomes are beyond the scope of this study, which aimed
exclusively to compare MR characteristics of various devices for MI single‐segment dorsal
rigid stabilization and Op rigid fusion. However, the study of clinical data after low‐
traumatic placement of these structures in previously published papers did not reveal
significant intergroup differences. Additionally, the best long‐term outcomes were
recorded after MI‐TLIF in terms of pain level assessed using a visual analog scale,
functional status according to ODI and SF‐36 quality of life scale compared with Op‐TLIF.
In our opinion, the results obtained by us on which consumable will cause a greater
artifact in postoperative MRI should not solely influence the choice for a particular
consumable. Other important factors for spinal surgeons in considering different implants
are the possibility of MI placement, wear resistance, speed of integration and formation
of the bone block, as well as the ease of implantation and revision. Nevertheless, we do
not exclude the possibility of choosing, under all equal conditions, the intervention with
implants that reduce the number of artifacts in postoperative MRIs and, thereby, make
the visualized postoperative outcome more obvious.
4.1. Limitations
The limitations of the study, potentially having the ability to influence its results,
should include (1) low number of patients in each group; (2) retrospective study design;
(3) nonrandomized sample of examined patients without using an electronic patient data
management system; (4) the use of multicomponent structurally different implants; (5) the
use of 1.5 T MRI and T2w imaging exclusively without additional software modules; (6)

Diagnostics 2021, 11, 906 14 of 16
lack of analysis of the influence of other factors that can cause the presence of MR artifacts;
(7) the use of percent change of muscle area as the sole factor in assessing muscle atrophy.
4.2. Strengths of the Study
This study has a number of strengths: (1) the constructs used have not been
previously studied for individual and comparative analysis of the quality of postoperative
images; (2) limiting the level of operation of L4–L5 segments ensured homogeneity of
study groups in the interpretation of anatomical changes in the operated area; (3) in each
of the three groups, different parameters of MR images were blindly evaluated by two
experts in all patients (n = 60); (4) the use of a complex of MRI characteristics (classification
by Jarvik J., [12] radiological and orthopedic scales for assessing artifacts [13], calculation
of the area of a multifidus muscle) after minimally invasive single‐level dorsal rigid
stabilization has not previously been used.
5. Conclusions
Postoperative MRI for assessing neural structures, paravertebral tissues, and
segments adjacent to the operation depend on both the surgical intervention and type of
structure used to stabilize the posterior support complex. The techniques of Op and MI
bilateral TSF have a comparable deterioration in visualization of the operated segment
with significantly greater atrophy of the multifidus muscle after performing the Op‐TLIF
technique. Op and MI single‐segment dorsal rigid stabilization does not reduce the
possibility of adequate postoperative MRI assessment of levels adjacent to the operation.
MI‐TLIF has lower magnetic susceptibility artifacts and change in multifidus muscle area,
which gives the ability to study the postoperative volume of decompression and atrophy
of the paravertebral muscles in the follow‐up period. Additionally, a rigid interspinous
implant has minimal postoperative artifacts compared to unilateral TSF with a
contralateral placement of a titanium facet cage and bilateral TSF.
Author Contributions: Conceptualization, V.A.B. and A.A.K.; methodology, V.A.B. and M.B.G.;
software, V.V.S.; validation, A.A.K., M.B.G., and Y.Y.P.; formal analysis, M.Y.B.; investigation,
V.V.S.; resources, Y.Y.P.; data curation, V.A.B.; writing—original draft preparation, V.A.B. and
A.A.K.; writing—review and editing, V.A.B.; visualization, M.B.G.; supervision, V.A.B. All authors
have read and agreed to the published version of the manuscript.
Funding: This research received no external funding.
Institutional Review Board Statement: The study was conducted according to the guidelines of the
Declaration of Helsinki and approved by the Ethics Committee Irkutsk State Medical University
(Protocol No. 3 dated 11 September 2019).
Informed Consent Statement: Informed consent was obtained from all subjects involved in the
study. Written informed consent has been obtained from the patient(s) to publish this paper
Conflicts of Interest: The authors declare no conflict of interest.
References
1. Kim, Y.H.; Ha, K.Y.; Rhyu, K.W.; Park, H.Y.; Cho, C.H.; Kim, H.C.; Lee, H.J.; Kim, S.I. Lumbar Interbody Fusion: Techniques,
Pearls and Pitfalls. Asian Spine J. 2020, 14, 730–741, doi:10.31616/asj.2020.0485.
2. Li, A.; Li, X.; Zhong, Y. Is minimally invasive superior than open transforaminal lumbar interbody fusion for single‐level de‐
generative lumbar diseases: A meta‐analysis. J. Orthop. Surg. Res. 2018, 13, 241.
3. Patel, D.V.; Yoo, J.S.; Karmarkar, S.S.; Lamoutte, E.H.; Singh, K. Interbody options in lumbar fusion. J. Spine Surg. 2019, 5 (Suppl.
1), S19–S24, doi:10.21037/jss.2019.04.04.
4. Mao, J.Z.; Fritz, A.G.; Lucas, J.‐M.P.; Khan, A.; Popoola, D.O.; Becker, A.B.; Adetunji, A.; Levy, B.R.; Agyei, J.O.; O’Connor, T.E.;
et al. Assessment of Rod Material Types in Spine Surgery Outcomes: A Systematic Review. World Neurosurg. 2021, 146, e6–e13,
doi:10.1016/j.wneu.2020.09.075.
5. Byvaltsev, V.A.; Kalinin, A.A.; Aliyev, M.A.; Riew, K.D. Postoperative MRI Visualization of the Cervical Spine Following
Cervical Disc Arthroplasty: A Prospective Single‐Center Comparison of a Titanium and Cobalt‐Chromium Prosthesis. Glob.
Spine J. 2021, in press, doi:10.1177/2192568221991105.

Diagnostics 2021, 11, 906 15 of 16
6. Irmola, T.M.; Häkkinen, A.; Järvenpää, S.; Marttinen, I.; Vihtonen, K.; Neva, M. Reoperation Rates Following Instrumented
Lumbar Spine Fusion. Spine 2018, 43, 295–301, doi:10.1097/brs.0000000000002291.
7. Han, S.; Hyun, S.J.; Kim, K.J.; Jahng, T.A.; Kim, H.J. Comparative Study Between Cobalt Chrome and Titanium Alloy Rods for
Multilevel Spinal Fusion: Proximal Junctional Kyphosis More Frequently Occurred in Patients Having Cobalt Chrome Rods.
World Neurosurg. 2017, 103, 404–409, doi:10.1016/j.wneu.2017.04.031.
8. Brinjikji, W.; Diehn, F.; Jarvik, J.; Carr, C.; Kallmes, D.; Murad, M.; Luetmer, P. MRI Findings of Disc Degeneration are More
Prevalent in Adults with Low Back Pain than in Asymptomatic Controls: A Systematic Review and Meta‐Analysis. AJNR Am.
J. Neuroradiol. 2015, 36, 2394–2399, doi:10.3174/ajnr.a4498.
9. Zou, Y.‐F.; Chu, B.; Wang, C.‐B.; Hu, Z.‐Y. Evaluation of MR issues for the latest standard brands of orthopedic metal implants:
Plates and screws. Eur. J. Radiol. 2015, 84, 450–457, doi:10.1016/j.ejrad.2014.12.001.
10. Rudisch, A.; Kremser, C.; Peer, S.; Kathrein, A.; Judmaier, W.; Daniaux, H. Metallic Artifacts in Magnetic Resonance Imaging of
Patients wWith Spinal Fusion. Spine 1998, 23, 692–699, doi:10.1097/00007632‐199803150‐00009.
11. Suzuki, A.K.; Campo, K.N.; Fonseca, E.B.; Araújo, L.C.; Gandra, F.C.G.; Lopes, É.S.N. Appraising the potential of Zr‐based
biomedical alloys to reduce magnetic resonance imaging artifacts. Sci. Rep. 2020, 10, 2621.
12. Jarvik, J.G.; Robertson, W.D.; Wessbecher, F.; Reger, K.; Solomon, C.; Whitten, R.; Lumley, T.; Deyo, R.A. Variation in the Quality
of Lumbar Spine MR Images in Washington State. Radiology 2000, 215, 483–490, doi:10.1148/radiology.215.2.r00ma35483.
13. Knott, P.T.; Mardjetko, S.M.; Kim, R.H.; Cotter, T.M.; Dunn, M.M.; Patel, S.T.; Spencer, M.J.; Wilson, A.S.; Tager, D.S. A
comparison of magnetic and radiographic imaging artifact after using three types of metal rods: Stainless steel, titanium, and
vitallium. Spine J. 2010, 10, 789–794, doi:10.1016/j.spinee.2010.06.006.
14. Lee, J.H.; Lee, S.‐H. Does lumbar paraspinal muscles improve after corrective fusion surgery in degenerative flat black? Indian
J. Orthop. 2017, 51, 147–154, doi:10.4103/0019‐5413.201713.
15. Xie, Q.; Zhang, J.; Lu, F.; Wu, H.; Chen, Z.; Jian, F. Minimally invasive versus open Transforaminal lumbar Interbody fusion in
obese patients: A meta‐analysis. BMC Musculoskelet. Disord. 2018, 19, 15, doi:10.1186/s12891‐018‐1937‐6.
16. Putzier, M.; Hartwig, T.; Hoff, E.K.; Streitparth, F.; Strube, P. Minimally invasive TLIF leads to increased muscle sparing of the
multifidus muscle but not the longissimus muscle compared with conventional PLIF—A prospective randomized clinical trial.
Spine J. 2016, 16, 811–819, doi:10.1016/j.spinee.2015.07.460.
17. Sutherland‐Smith, J.; Tilley, B. Magnetic resonance imaging metallic artifact of commonly encountered surgical implants and
foreign material. Vet. Radiol. Ultrasound 2012, 53, 312–317.
18. Kajima, Y.; Takaichi, A.; Tsutsumi, Y.; Hanawa, T.; Wakabayashi, N.; Kawasaki, A. Influence of magnetic susceptibility and
volume on MRI artifacts produced by low magnetic susceptibility Zr‐14Nb alloy and dental alloys. Dent. Mater. J. 2020, 39, 256–
261, doi:10.4012/dmj.2018‐426.
19. Rupp, R.; Ebraheim, N.A.; Savolaine, E.R.; Jackson, W.T. Magnetic resonance imaging evaluation of the spine with metal
implants. General safety and superior imaging with titanium. Spine 1993, 18, 379–385.
20. Massaad, E.; Fatima, N.; Kiapour, A.; Hadzipasic, M.; Shankar, G.M.; Shin, J.H. Polyetheretherketone Versus Titanium Cages
for Posterior Lumbar Interbody Fusion: Meta‐Analysis and Review of the Literature. Neurospine 2020, 17, 125–135,
doi:10.14245/ns.2040058.029.
21. Hak, D.J.; Mauffrey, C.; Seligson, D.; Lindeque, B. Use of Carbon‐Fiber‐Reinforced Composite Implants in Orthopedic Surgery.
Orthopedics 2014, 37, 825–830, doi:10.3928/01477447‐20141124‐05.
22. Seaman, S.; Kerezoudis, P.; Bydon, M.; Torner, J.C.; Hitchon, P.W. Titanium vs. polyetheretherketone (PEEK) interbody fusion:
Meta‐analysis and review of the literature. J. Clin. Neurosci. 2017, 44, 23–29, doi:10.1016/j.jocn.2017.06.062.
23. Ernstberger, T.; Buchhorn, G.; Heidrich, G. Artifacts in spine magnetic resonance imaging due to different intervertebral test
spacers: An in vitro evaluation of magnesium versus titanium and carbon‐fiber‐reinforced polymers as biomaterials.
Neuroradiology 2009, 51, 525–529, doi:10.1007/s00234‐009‐0537‐4.
24. Fatima, N.; Massaad, E.; Shankar, G.M.; Shin, J.H. Structural Allograft versus Polyetheretherketone Implants in Patients
Undergoing Spinal Fusion Surgery: A Systematic Review and Meta‐Analysis. World Neurosurg. 2020, 136, 101–109.
25. Tahal, D.; Madhavan, K.; Chieng, L.O.; Ghobrial, G.M.; Wang, M.Y. Metals in Spine. World Neurosurg. 2017, 100, 619–627,
doi:10.1016/j.wneu.2016.12.105.
26. Nguyen, T.‐Q.; Buckley, J.M.; Ames, C.; Deviren, V. The fatigue life of contoured cobalt chrome posterior spinal fusion rods.
Proc Inst Mech Eng H. 2011, 225, 194–198, doi:10.1243/09544119jeim763.
27. Wayer, D.; Kim, N.; Otto, B.; Grayev, A.; Kuner, A. Unintended Consequences: Review of New Artifacts Introduced by Iterative
Reconstruction CT Metal Artifact Reduction in Spine Imaging. AJNR Am. J. Neuroradiol. 2019, 40, 1973–1975,
doi:10.3174/ajnr.a6238.
28. Trammell, T.R.; Flint, K.; Ramsey, C.J. A Comparison of MRI and CT Imaging Clarity of Titanium Alloy and Titanium Alloy
with Cobalt‐Chromium‐Alloy Pedicle Screw and Rod Implants in the Lumbar Spine. J Bone Joint Surg Am. 2012, 94, 1479–1483,
doi:10.2106/jbjs.k.01470.
29. Yang, C.‐W.; Liu, L.; Wang, J.; Dong, A.‐S.; Lu, J.‐P.; He, S.‐S.; Li, M. Magnetic resonance imaging of artificial lumbar disks:
Safety and metal artifacts. Chin. Med J. 2009, 122, 911–916.
30. Farrelly, C.; Davarpanah, A.; Brennan, S.A.; Sampson, M.; Eustace, S.J. Imaging of soft tissues adjacent to orthopedic hard‐ware:
Comparison of 3‐T and 1.5‐T MRI. AJR Am. J. Roentgenol. 2010, 194, W60–W64.

Diagnostics 2021, 11, 906 16 of 16
31. Tohtz, S.W.; Rogalla, P.; Taupitz, M.; Perka, C.; Winkler, T.; Putzier, M. Inter‐ and intraobserver variability in the postoperative
evaluation of transpedicular stabilization: Computed tomography versus magnetic resonance imaging. Spine J. 2010, 10, 285–
290, doi:10.1016/j.spinee.2009.12.020.
32. Lee, Y.H.; Lim, D.; Kim, E.; Kim, S.; Song, H.‐T.; Suh, J.‐S. Usefulness of slice encoding for metal artifact correction (SEMAC) for
reducing metallic artifacts in 3‐T MRI. Magn. Reson. Imaging 2013, 31, 703–706, doi:10.1016/j.mri.2012.11.004.
33. Lee, J.B.; Cha, J.G.; Lee, M.H.; Lee, Y.K.; Lee, E.H.; Jeon, C.H. Usefulness of IDEAL T2‐weighted FSE and SPGR imaging in
reducing metallic artifacts in the postoperative ankles with metallic hardware. Skelet. Radiol. 2013, 42, 239–247.
Top Related
Copyright © 2022 FDOKUMEN

