


Bahasa
Halaman
Hukum


Comparison of ice accumulation on simplex and duplex conductors in parallel overhead transmission lines in Iceland.
Árni Jón Elíasson – Árni Björn Jónasson – Pétur Thor Gunnlaugsson

Measuring site • Located on a ridge between two narrow
valleys
• 65 km from the shore to NNE
• Unshielded against winds from NNE
• Mostly in-cloud icing, but wet snow icing occurs too

OHTL‘s characteristics
• Fljótsdalslína 3 OHTL is fitted with simplex Austria 49.9 mm Spans 205 and 192 m
• Fljótsdalslína 4 OHTL is fitted with duplex AACSR 39.2 mm Spans 175 and 192 m Subspans 30 – 46 m between spacers

Measuring equipment
• Load cells: CAT-1 Transmission Line Monitoring System – The Valley Group, Inc.
• Energized with in-feed from closest substation
• Data transfer to database by fiber optic cable
• Online camera

Data acquired
• Data was collected over 9 year period
• 2½ winters unusable (problems in measurements or communication)
• Temperature and load readings are taken every 5 minutes
• 61 well registered icing events observed
• Up to 242 N/m for simplex and up to 163 N/m for one in duplex were observed (100:67)
Missing Data Missing Data

Wind effect
• Effect of wind on the readings was neglected in the analysis, thus the calculated ice load is a bit too high
• The effect was checked for 12 icing events (18 max-load points)
• 7 readings from the automatic weather station
• 11 readings from Egilsstaðir-airport weather station
• 10 min average wind 0 – 13.7 m/s
• Effect of wind < 1 N/m, (0.14 N/m on average).

Relationship between simplex and duplex
• Maximum ice load during icing event
• The maximum is not always at the same time for the two OHTL‘s
• In general the maximum is lower for one conductor in duplex
• Measurements are quite scattered
• Certain tendencies can be seen
• More observations in the higher load range needed to establish model

Maximum cases
• 13-28 November 2006 – 16 days – before energizing
• Temperature: Begins just below 0°C, gradually lower during 3 days down to –14 °C. Raised a little – remained low –4 °C to –9 °C .
• Duplex: Ice shedding first after about one day, occurred again a few times
• Simplex: Ice shedding did not occur until at the end of the event
• 18-21 March 2010 – 4 days
• Temperature: Begins just below 0°C, gradually lower and remains at -2 °C for a day, then lowering down to -6 °C during the day after
• Duplex: Ice shedding first after a little less than two days, but no shedding until that time
• Simplex: Ice shedding first after approximately half a day
Case 1
Case 2 Form of the accumulation graphs shows that the accumulation is similar for duplex and simplex – just shifted downwards by the ice shedding

Undisturbed ice accumulation
• The icing events where ice accumulation was undisturbed • Up to the first ice shedding in either of
the OHTL‘s
• No obvious wind disturbances during the beginning of the icing process
• Ice accumulation is 7% less for one conductor in duplex

Torsional stiffness
• Theoretical model in: C. Hardy, A. Leblond and D. Gagnon, „Theoretical Assessment of Ice Loading of Cables as a Function of their Torsional Stiffness, IWAIS XI, Montreal, June 2005
• Approximation to relate to the theoretical model:
• Precipitation at 45° angle
• Torsional stiffness for a bundle additionally involves effect of the conductor tension
• Effect of eccentric ice load on simplex and bundle of two
• Rotation of the bundle + rotation of the supspans
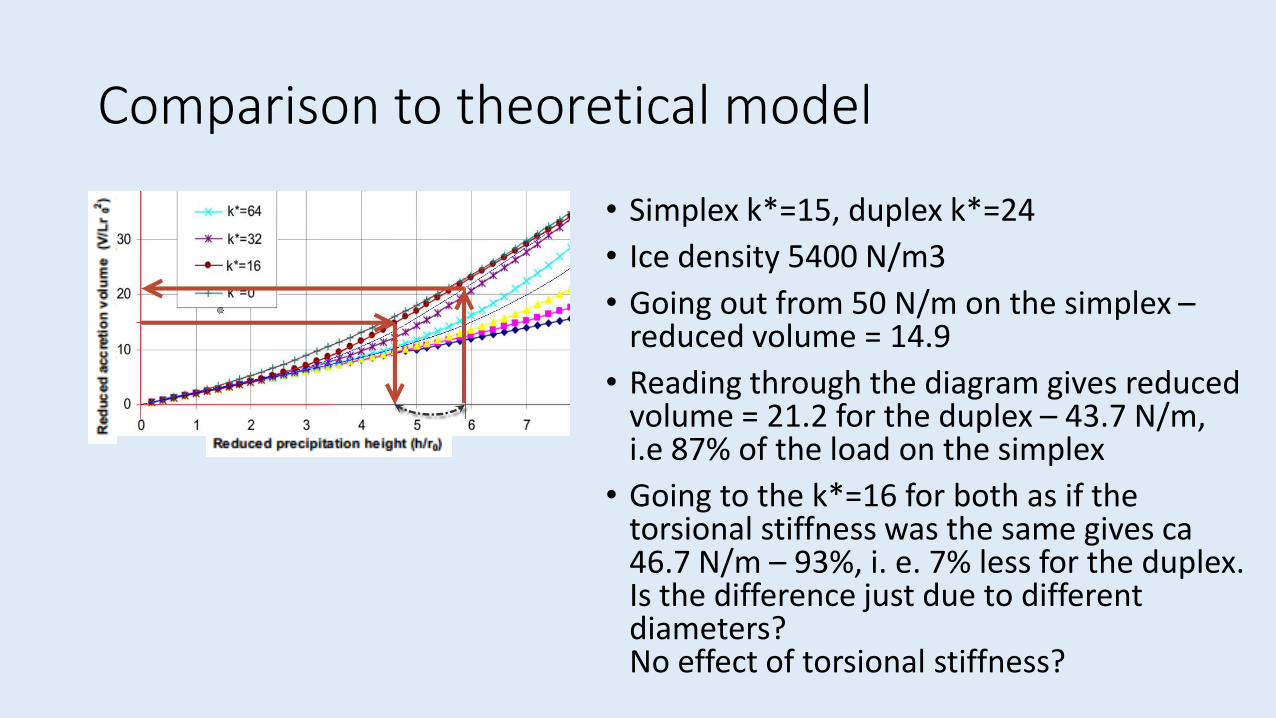
Comparison to theoretical model
• Simplex k*=15, duplex k*=24
• Ice density 5400 N/m3
• Going out from 50 N/m on the simplex – reduced volume = 14.9
• Reading through the diagram gives reduced volume = 21.2 for the duplex – 43.7 N/m, i.e 87% of the load on the simplex
• Going to the k*=16 for both as if the torsional stiffness was the same gives ca 46.7 N/m – 93%, i. e. 7% less for the duplex. Is the difference just due to different diameters? No effect of torsional stiffness?
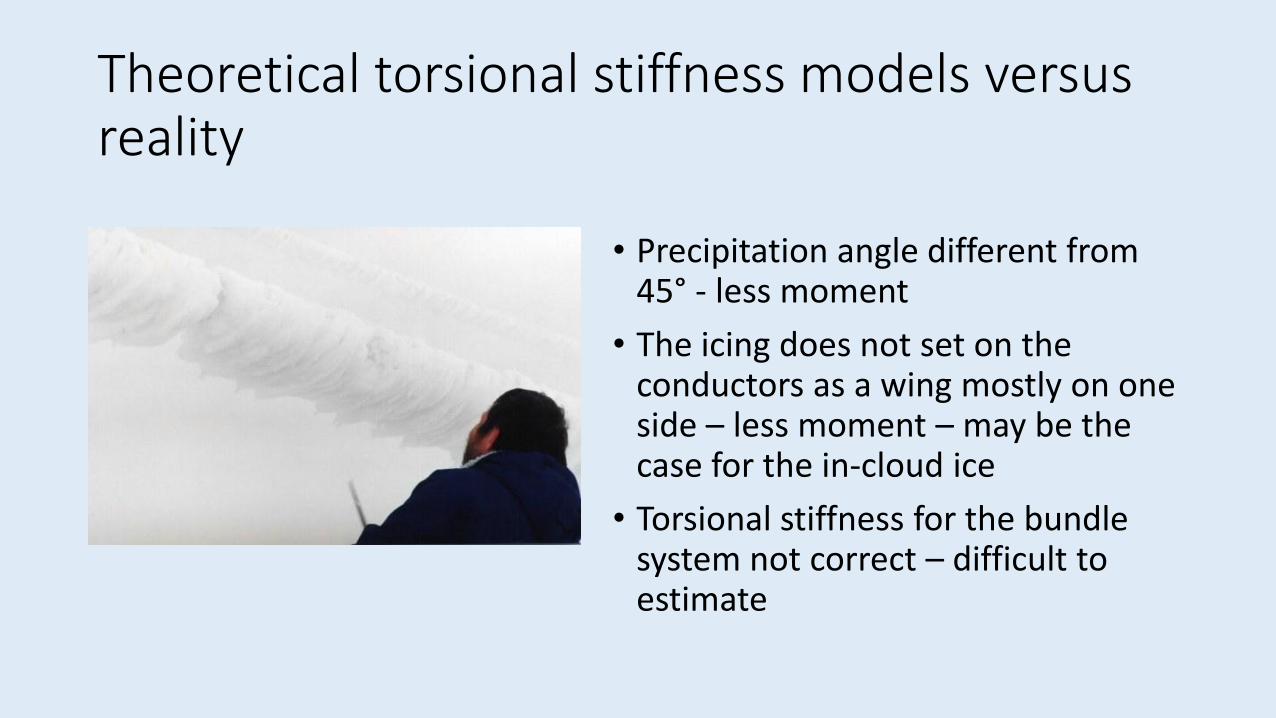
Theoretical torsional stiffness models versus reality
• Precipitation angle different from 45° - less moment
• The icing does not set on the conductors as a wing mostly on one side – less moment – may be the case for the in-cloud ice
• Torsional stiffness for the bundle system not correct – difficult to estimate
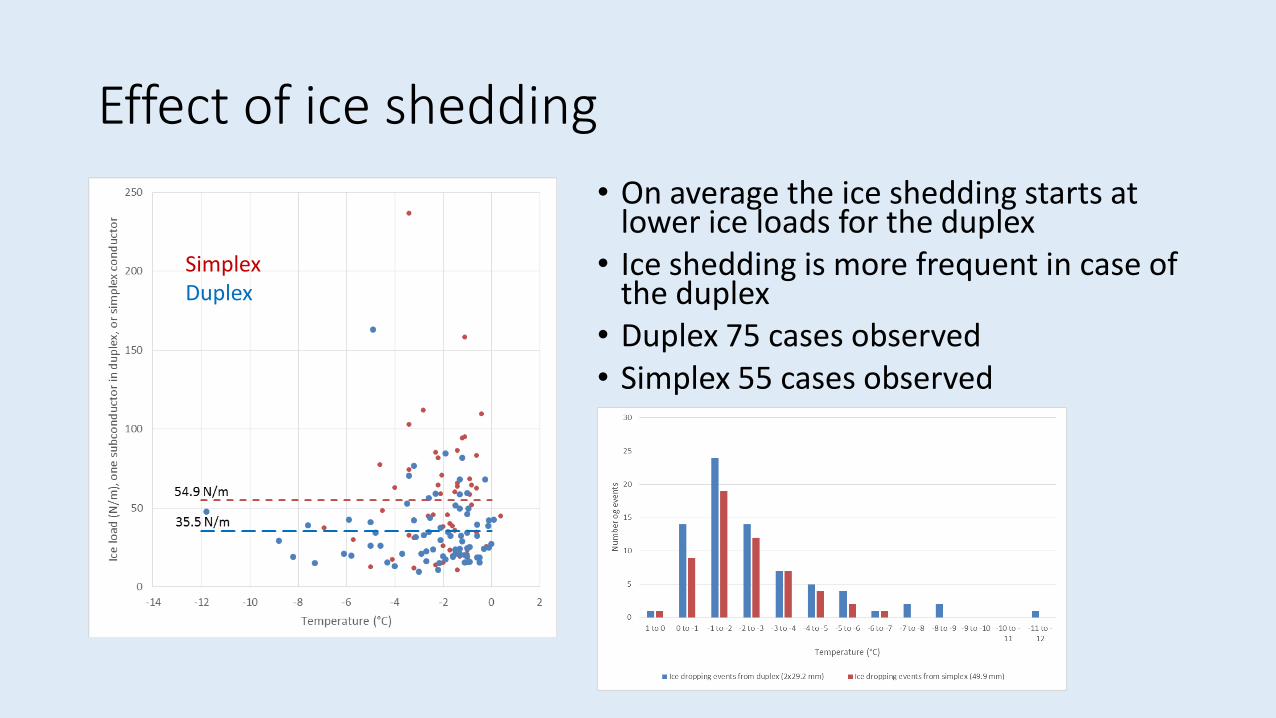
Effect of ice shedding
• On average the ice shedding starts at lower ice loads for the duplex
• Ice shedding is more frequent in case of the duplex
• Duplex 75 cases observed • Simplex 55 cases observed
Simplex Duplex

Reasons for ice shedding
• More wind motions of the duplex, hence dynamic forces
• Irregularities by the spacer may sometimes give weaknesses in the ice
• Relative motions in spacer connections cause ice to break off
• Energy considerations – ambient, solar, energy transfer
• Larger weak areas for duplex due to less rotation during icing – weaker ice coat on the leeward side

Temperature and energy considerations
• The icing event left shows that ice shedding happens when ambient temperature rises above -2.5°C to -2.0°C
• Possible reasons • Ambient temperature • Solar radiation may warn up the conductors, even
through a coat of ice • Energy transfer of the OHTL’s generates heat
(6 W/m in each conductor in duplex, and 13.7 W/m in the simplex)
• If the conductors warm up the ice will at some point start melting and the bonds between ice and conductor become weak

Concluding remarks
• Undisturbed accumulation gave about 7% lower ice load on one in duplex compared with simplex in the Fljótsdalslína 3 and 4 OHTL´s • It could not be verified that this is due to difference in torsional stiffness
• Ice shedding, which lowers maximum loads for both simplex and duplex, has more effect on duplex • Is the main reason for lower loads on the duplex on average
• Ice shedding is a complex unpredictable process affected by various reasons (ambient temperature, solar radiation, heat from energy transfer, wind loads, wind induced dynamic loads, irregularities by spacers or in ice formation)
• One icing event (case 2) where duplex gets much greater ice load than simplex

Thank you for your attention !
Top Related
Copyright © 2022 FDOKUMEN

