


Bahasa
Halaman
Hukum

Collective Mass Spectrometry Approaches Reveal Broad andCombinatorial Modification of High Mobility Group Protein A1a
Nicolas L. Young1,#, Mariana D. Plazas-Mayorca2,#, Peter A. DiMaggio3, Ian Z. Flaniken1,Andrea J. Beltran1, Neeli Mishra1, Gary LeRoy1, Christodoulos A. Floudas3, and BenjaminA. Garcia1,2,*
1Department of Molecular Biology, Princeton University, Princeton NJ 085442Department of Chemistry Princeton University, Princeton NJ 085443Department of Chemical Engineering Princeton University, Princeton NJ 08544
AbstractChromatin transcriptional states are formed and maintained by the interaction and post-translational modification (PTM) of several chromatin proteins, such as histones and high mobilitygroup (HMG) proteins. Among these, HMGA1a, a small heterochromatin-associated nuclearprotein has been shown to be post-translationally modified, and some of these PTMs have beenlinked to apoptosis and cancer. In cancerous cells, HMGA1a PTMs differ between metastatic andnon-metastatic cell lines, suggesting the existence of an HMGA1a PTM code analogous to the“Histone Code.” In this study, we expand on current knowledge by comprehensivelycharacterizing PTMs on HMGA1a purified from human cells using both nanoflow liquidchromatography collision activated dissociation mediated Bottom Up and electron transferdissociation facilitated Middle and Top Down mass spectrometry (MS). We find HMGA1a to bepervasively modified with many types of modifications such as methylation, acetylation andphosphorylation, including finding novel sites. While Bottom Up MS identified lower levelmodification sites, Top and Middle Down MS were utilized to identify the most commonlyoccurring combinatorially modified forms. Remarkably, although we identify several individualmodification sites through our Bottom Up and Middle Down MS analyses, we find relatively fewcombinatorially modified forms dominate the population through Top Down proteomics. Themain combinatorial PTMs we find through the Top Down approach are N-terminal acetylation,Arg25 methylation along with phosphorylation of the three most C-terminal serine residues inprimarily a diphosphorylated form. This report presents one of the most detailed analyses ofHMGA1a to date and illustrates the strength of using a combined MS effort.
IntroductionAlthough the human genome has been sequenced for nearly a decade, the understanding ofthe epigenome, the set of factors superimposed over the DNA sequence that determine geneexpression across cell types and developmental stages, remains incomplete.[1] A majorlocus for epigenetic regulation is the nucleosome, the basic unit of chromatin which consistsof 146bp of DNA wrapped around an octamer of histone proteins.[2] Histones are subject tovarious post-translational modifications (PTMs), including methylation, acetylation,phosphorylation, and ubiquitination, which serve as markers for transcriptionally active orsilent chromatin among other roles.[3] Proteins that recognize specific histone modifications
*To whom correspondence should be addressed, [email protected], phone 609-258-8854; fax 609-258-1035.#These authors contributed equally to this work.
NIH Public AccessAuthor ManuscriptJ Am Soc Mass Spectrom. Author manuscript; available in PMC 2012 April 9.
Published in final edited form as:J Am Soc Mass Spectrom. 2010 June ; 21(6): 960–970. doi:10.1016/j.jasms.2010.01.020.
NIH
-PA Author Manuscript
NIH
-PA Author Manuscript
NIH
-PA Author Manuscript
bind histones to effect changes in chromatin structure. Heterochromatin Protein 1 (HP1), forexample, binds selectively to trimethylated H3 lysine 9 and results in the formation oftranscriptionally inert heterochromatin. [4, 5]
For many chromatin-associated proteins, however, the mechanisms and consequences ofinteractions with nucleosomes are less clear. The high mobility group (HMG) proteins arewell-characterized nuclear proteins termed “architectural transcription factors” because theyassociate with nucleosomes to modify chromatin structure and modulate specific geneexpression.[6] HMG proteins are divided into three families based on their binding domains:HMGA, which contain AT-hooks and bind preferentially to the minor groove of DNA inAT-rich regions; HMGB, which contain HMG box domains that bind to the minor groove ofDNA with no known specificity; and HMGN, which bind directly to nucleosomes.Mammalian HMGA proteins include HMGA1a, HMGA1b and HMGA2.[7] HMGA1a andHMGA1b are simply transcript variants, where HMGA1a is the full length isoform. Amongthese, the role of HMGA1a in chromatin remodeling is especially intriguing because thisprotein is an oncoprotein that is only expressed at high levels in cancer cells [8–10] andduring embryonic development.[11, 12] HMGA1a is a highly mobile protein that is foundthroughout the nucleus, however, it has been shown to be enriched in heterochromatin.[13,14] The three AT-hook binding motifs of HMGA1a enable it to bind to the minor groove ofDNA and alter chromatin structure.[15, 16] HMGA1a modifies chromatin structure byaltering the rotational setting of DNA bound to nucleosomes.[15] Unlike most transcriptionfactors, HMGA1a possesses the remarkable ability to bind DNA recognition sites that arewrapped around nucleosomes and uncover promoters for transcription factor binding.[17]Like histones, HMGA1a is subject to extensive PTMs, including phosphorylation,acetylation, and methylation.[7] Phosphorylation of serine and threonine residues are themost prevalent PTMs observed. [18, 19] Research suggests that PTMs on HMGA1a havefunctional implications on this protein's ability to remodel chromatin. Phosphorylationreduces HMGA1a DNA binding affinity,[20] and specific phosphorylation patterns correlateto higher residence in heterochromatin.[21] HMGA1a has also been found to be modified inhuman cancer cell lines.[22, 23]
Recently, mass spectrometry (MS) based proteomic investigations have advanced ourknowledge of HMGA PTMs. Sgarra et al. used MS coupled to reverse phase HPLC andfound that increased arginine methylation of HMGA1a is associated with apoptosis andpossibly with heterochromatin formation.[24] Studies using matrix-assisted laser desorptionionization (MALDI) with time-of-flight (TOF) MS alone or in combination withelectrospray ionization (ESI) tandem mass spectrometry (MS/MS) identified differences inHMGA1a PTMs patterns in metastatic and non-metastatic cancer cell lines, suggesting theexistence of a PTM code analogous to the histone code.[23, 25] Zou et al. utilized MS/MS tocharacterize sites of phosphorylation on HMGA1a from human prostate cancer cells; inaddition to three distinct phosphorylation sites, Arg25 was found to be mono- and di-methylated.[26] Subsequent LC-MS investigations by this same group identified Arg 57 andArg 59 as in vivo methylation sites as well.[27] MALDI-MS/MS together with LC-ESI-MS/MS was used to examine HMGA1a PTMs in PC-3 human prostate cancer cells that wereeither treated or not treated with a histone deacetylase inhibitor.[28] This study found Ser35, Thr52, Thr77, Ser98, Ser101, and Ser102 to be phosphorylated while Arg25 was foundto be methylated. Lys14 was found to be acetylated in the cells that were not treated withbutyrate.[28] The same instrumentation was used in a different investigation to find novelHMGA1a PTMs including Lys30me1, Lys54me1, Ser43phos and Ser48phos, in addition topreviously reported marks.[29] LC-MS/MS was also used to quantitate HMGA1a lysineacetylation.[30] Zou et al. found arginine methylation sites by the protein argininemethyltransferase family through MALDI-MS.[31] Lastly, LC-MS/MS was used to
Young et al. Page 2
J Am Soc Mass Spectrom. Author manuscript; available in PMC 2012 April 9.
NIH
-PA Author Manuscript
NIH
-PA Author Manuscript
NIH
-PA Author Manuscript
investigate HMGA protein expression and macroscopic PTM differences across differentcell lines.[32]
Nevertheless, while a significant number of studies have detailed a wide array of HMGA1aPTMs, a comprehensive investigation into potential combinatorial PTM patterns on HMGAhas not been reported. In this study, we expand on current knowledge by comprehensivelycharacterizing PTMs on HMGA1a purified from human HeLa S3 cells using Top andMiddle Down as well as Bottom Up proteomic approaches. The Bottom Up approachenzymatically digests HMGA1a into short peptides prior to MS analysis and provided asensitive platform to detect modifications of sub-stoichiometric abundance, [33] while theTop and Middle Down approaches involve the analysis of large polypeptides and intactproteins, and are ideal for probing long-range PTM combinations.[34, 35] Using Bottom UpMS, we find HMGA1a to be extensively modified with all degrees of lysine methylation,lysine acetylation, arginine methylation and phosphorylation of threonine and serineresidues at varying abundance levels. In addition to known modifications, we detected novelHMGA1a modifications including methylation on different residues. Middle and Top Downanalyses revealed the identity of the most abundant combinations of modifications presenton HMGA1a. The most abundant isoforms present in HeLa cells were determined to be N-terminally acetylated and di-phosphorylated at Ser98, Ser101, or Ser102. Only theSer101phSer102ph form was detected by Bottom Up mass spectrometry, suggesting thismay be the prevalent form. Additionally the overwhelmingly most abundant site ofmethylation was found to be Arg25. Un-, mono- and tri- phosphorylated forms were alsoobserved always in combination with N-terminal acetylation and variably with methylation.The amount of methylation observed on each of these forms appeared independent of theother modifications present. Our multifaceted approach proved to produce verycomplementary data on this highly modified chromatin proteins and underscores the needfor multiple approaches in characterization of protein modifications.
ExperimentalCell Culture and Purification of HMGA1a
HeLa S3 cells were grown and harvested as described by Thomas et al.,[36] while nucleiwere isolated as described by Garcia et al..[37] HMG proteins were acid extracted fromHeLa cells as described by Reeves.[38] Briefly, HMG proteins were acid extracted fromnuclei with 5% perchloric acid and precipitated with trichloroacetic acid (TCA) followed bywashes with acetone containing 0.1% HCl and then pure acetone. The resulting pellets wereredissolved in 1mL deionized water and fractionated on a C18 column (4.6 mm i.d. ×250mm, Vydac, Hesperia, CA) using an Beckman Coulter System Gold HPLC (Fullerton, CA)with a linear gradient of 1% B per minute (A = 5% MeCN in 0.2% TFA, B = 90%acetonitrile in 0.188% TFA). Fractions containing HMGA1a proteins were pooled and driedto completion in a SpeedVac concentrator.
Sample Preparation for Bottom Up and Middle Down Mass SpectrometryHMGA1a was digested into short peptides suitable for Bottom up mass spectrometry bydigestion with trypsin. Briefly, purified HMGA1 was resuspended in 100 mM ammoniumbicarbonate (pH = 8.0) and digested for 6 hours at 37°C using trypsin (Promega, Madison,WI) at a protein: enzyme ratio of 20:1. For Middle Down MS, a limited trypsin digestionwasused with the reaction being quenched after 2hrs. Alternatively, HMGA1a was derivatizedby treatment with propionyl anhydride reagent essentially as described before.[39, 40]Briefly, this reagent was created by mixing 75 μL of MeOH with 25 μL of propionicanhydride (Sigma Aldrich, St. Louis, MO). Equal volumes of reagent and HMGA1a proteinwere mixed and allowed to react at 37°C for 15 minutes. Propionylated HMGA1a was then
Young et al. Page 3
J Am Soc Mass Spectrom. Author manuscript; available in PMC 2012 April 9.
NIH
-PA Author Manuscript
NIH
-PA Author Manuscript
NIH
-PA Author Manuscript
digested with trypsin after dilution of the sample with 100 mM ammonium bicarbonatebuffer solution. The reaction was quenched by the addition of concentrated acetic acid andfreezing (−80°C). Following removal of reaction remnants and byproducts through vacuumcentrifugation, a second round of propionylation was then performed to propionylate thenewly created peptide N-termini.
NanoLC-MS/MS for Bottom Up and Middle Down Mass SpectrometryA small aliquot of the resulting peptides from both of the peptide digests were desalted usinghomemade stop and go extraction (STAGE) tips as previously described.[41] Briefly,peptides were twice eluted from STAGE Tips using 20 μL of 75% acetonitrile, 5% aceticacid. The resulting volume was reduced to approximately 5 μL in the SpeedVac. Peptideswere acidified with 1 μL of 0.1% acetic acid. All mass spectrometry experiments wereperformed in the following manner. Peptide samples (2 μL) were loaded by an EksigentAS-2 autosampler (Eksigent Technologies Inc., Dublin, CA) onto a fused silicamicrocapillary (75 μm) column constructed with an integrated ESI tip and packed in-housewith 5um C18 YMC ODS-A resin. Peptides were HPLC separated with an Agilent 1200series binary pump with an in-line flow splitter across a 110 min linear gradient rangingfrom 2% to 35% buffer B (Buffer A= 0.1 M acetic acid, Buffer B= 70% acetonitrile in 0.1M acetic acid) with a constant flow of approximately 100–200 nL/min. Alternatively, a 150min linear gradient from 2% to 35% buffer B was used if higher chromatographic resolutionwas desired. The HPLC system was coupled to an LTQ-Orbitrap mass spectrometer(ThermoFisher Scientific, San Jose, CA) operated with a spray voltage set to 2.7 kV. Surveyfull scan MS spectra (m/z 290–1650) were acquired in the Orbitrap with a resolution of30,000 at m/z 400 after accumulation of approximately 500,000 ions. For collisionallyactivated dissociation (CAD), the ten most intense ions from the preview scan from theOrbitrap were sequenced (normalized collision energy 35%) in the LTQ after accumulationof approximately 10,000 ions concurrently to full scan acquisition in the Orbitrap.Maximum filling time was 500 ms for the full scans. Precursor ion charge state screeningwas enabled and all unassigned charge states as well as singly charged species were rejected.The dynamic exclusion list was restricted to a maximum of 500 entries with a maximumretention period of 120 seconds and a relative mass window of <1 Da. Data was collected incentroid mode.
Top Down Mass Spectrometry of HMGA1aHPLC purified HMGA1A was infused at approximately 0.5 μL/min via nanosprayionization into an LTQ-Orbitrap mass spectrometer equipped with electron transferdissociation (ETD). The analyte automatic gain control (AGC) was set to 7E5 for full MSand 2E5 for tandem MS analysis with an isolation width of 3 m/z. The ETD reagent anionAGC was set to 1E6 and a reaction time of 15 ms was used. A microscan count of 10 wasused for both full MS and tandem MS and approximately 10 minutes of data were acquiredand averaged for each spectrum. All data was acquired in the Orbitrap analyzer set at100,000 resolution.
Data AnalysisFor HMGA1a PTM detection, CAD mass spectra were searched using the SEQUESTalgorithm within the Bioworks Browser (Version 3.3.1 SP1, Thermo Fisher Scientific Inc.,San Jose, CA) against a human protein database derived from sequences obtained from theNational Center for Biotechnology Information (NCBI) database (August 2008). Trypsinand keratin contaminant proteins were also included in this database. Enzyme specificitywas set to trypsin, fully enzymatic, allowing for up to 5 missed cleavage sites (sinceendogenous and chemical modification of lysine residues hinders enzymatic digestion and a2hr limited trypsin digest was performed). Propionylation (+56.026Da) on the N-terminus of
Young et al. Page 4
J Am Soc Mass Spectrom. Author manuscript; available in PMC 2012 April 9.
NIH
-PA Author Manuscript
NIH
-PA Author Manuscript
NIH
-PA Author Manuscript
the proteins and peptides was set as a fixed modification. For HMGA1a PTM searches, Lyspropionylation, Lys acetylation (+42.010Da), monomethyl on Lys residues (+70.042Da) andArg residues (14.010 Da), dimethylation on Arg and Lys (+28.031Da), Lys trimethylation(+42.046Da), and Ser and Thr phosphorylation (+79.966Da) were selected as variablemodifications. HMGA1a monomethylation was searched as the sum of the masses forpropionylation and methylation because monomethylated residues can still be propionylated.Mass tolerances were set to 0.05 m/z for parent ions and fragment ion tolerance was set to0.5 m/z. Resulting peptide lists were filtered using standard criteria (Protein Probability<1E-5, Xcorr = 2.0, 2.5, and 3.0 were used for peptide charges of 2, 3 and 4 respectively) aspreviously used.[42] The false positive rate was estimated to be the 1% level for protein IDby searching a reverse database. All spectra from modified peptides were also manuallyinspected.
For analysis of Top Down mass spectrometry data, both computational and manual datainterpretation was used to interpret the ETD tandem MS data. Ion peaks in the tandem MSwere first identified and converted into their monoisotopic values using a THRASHalgorithm and isotopic fitting.[43] Using a set of post-translational modifications that havebeen reported in the literature or discovered by bottom up mass spectrometry, an in silico listof potential fragment masses was generated by independently starting from the N-terminusfor the c-ion series and the C-terminus for the z.-ion series and then matching thesetheoretical fragments to the monoisotopic peak list. A modified version of the previouslydescribed integer linear optimization model[44] was utilized to discover modified forms thatare (1) consistent with the parent mass within 28 Da and (2) maximize the supportingevidence found in the in silico list. The supporting ions corresponding to the modified formsreported for each spectrum were manually validated before concluding their presence orabsence. Manual spectral interpretation was also used to thoroughly reveal additionalsupporting ions as needed.
Results and DiscussionIn this paper, we describe the intensive characterization of HMGA1a PTMs using acombination of Bottom Up together with Middle and Top Down proteomic approaches.HMGA1a was purified from asynchronously grown HeLa cells using standard perchloricacid extraction followed by reverse phase HPLC separation essentially as previouslydescribed.[38] Our overall goal was to identify potential combinatorial modification patternson HMGA1a. However, before we attempted to resolve any combinatorial PTM patterns byMS, we decided to create a comprehensive PTM inventory of HMGA1a. To accomplishthis, we turned to Bottom Up proteomic analyses performed via nanoflow LC-MS/MS on ahigh resolution Orbitrap mass spectrometer; in our laboratory, we find this approachprovides the most sensitive measurement of protein PTMs. First, HMGA1a was derivatizedby treatment with propionic anhydride reagent followed by trypsin digestion, a procedure wehave previously optimized for histone protein PTM analysis.[39, 40] Propionylation blocksendogenously unmodified and monomethylated lysine residues, and thus this protocolgenerates predictable Arg-C like peptides that are of near optimum length for interrogationby CAD based tandem mass spectrometry. Through this approach, we detected many wellknown HMGA1a modifications. Supplemental Figure 1 displays an MS/MS spectrumobtained of the [M+3H]3+ ion at 916.118 m/z from the 1–23 peptide of propionylatedHMGA1a, and analysis of the fragment ions indicated that both the N-terminus and Lys14were acetylated. This lysine residue has been previously shown to be acetylated byacetyltransferases PCAF (p300/CBP-associated factor) and p300.[28, 30] It is interesting tonote that in our experiments, we never detected non-N-terminally acetylated HMGA1aprotein.
Young et al. Page 5
J Am Soc Mass Spectrom. Author manuscript; available in PMC 2012 April 9.
NIH
-PA Author Manuscript
NIH
-PA Author Manuscript
NIH
-PA Author Manuscript
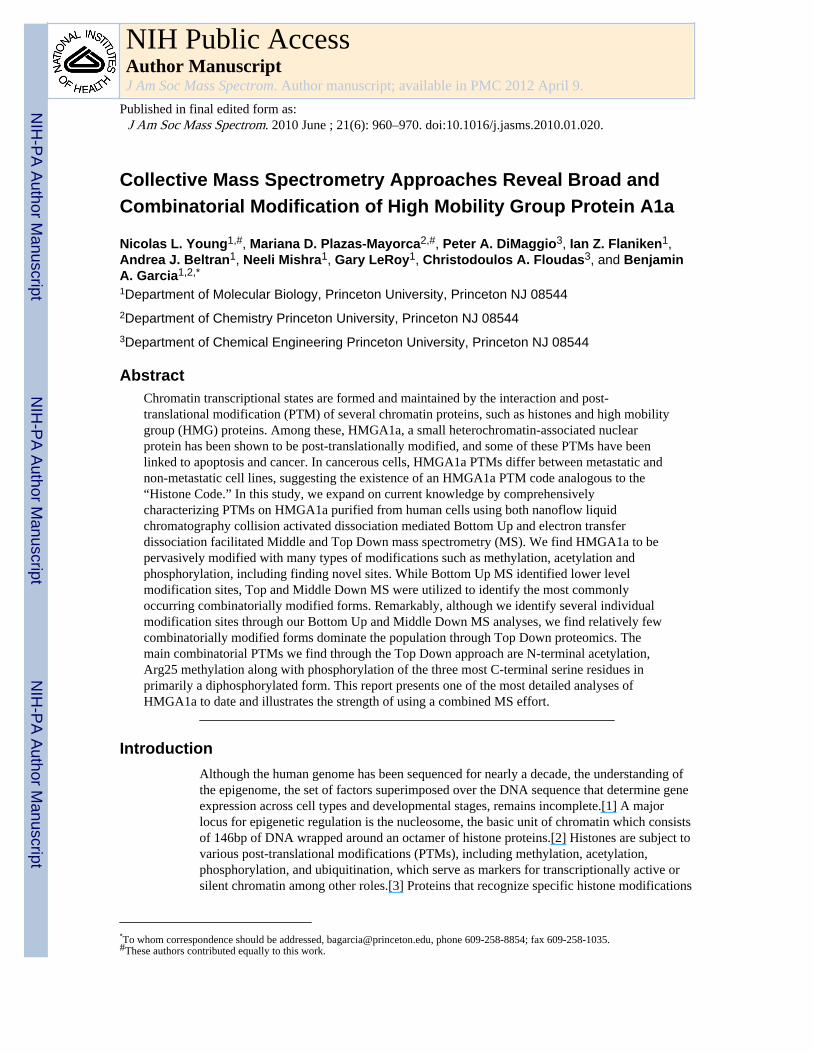
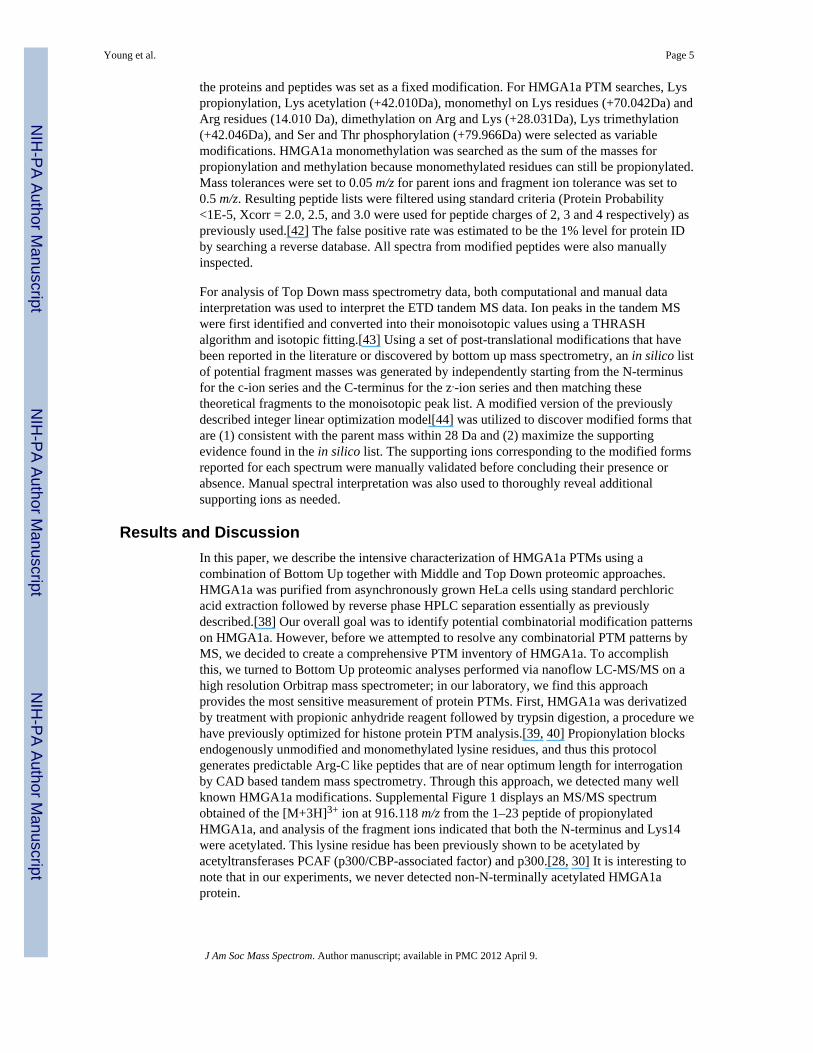
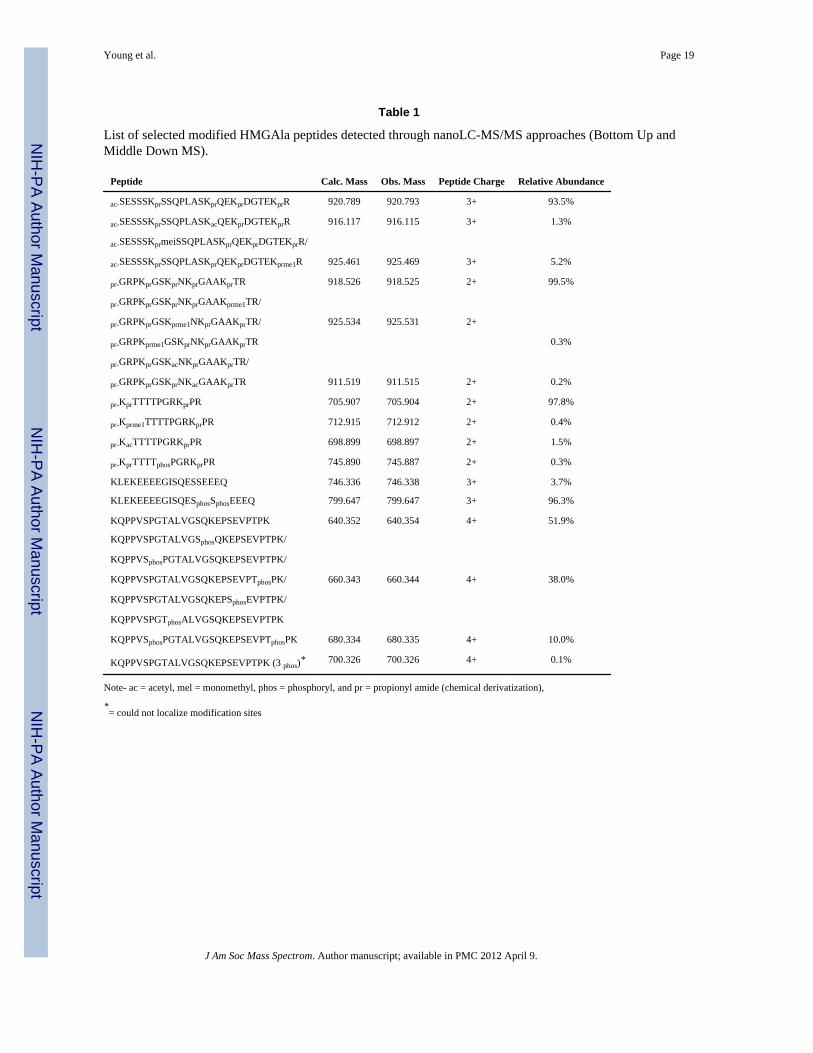
These experiments also revealed the presence of several novel modification sites as well.For instance, we observed monomethylation of HMGA1a on the peptideGRPKGSKNKGAAKTR, and inspection of different MS/MS spectra showed evidence formonomethylation of three distinct internal lysines on that peptide. Figure 1a. displays anMS/MS spectrum of the [M+2H]2+ ion confirming the sequence pr-GRPKprGSKprNKprGAAKprme1TR (Lys70me1). Additionally, we observed other tandemmass spectra of the GRPKGSKNKGAAKTR peptide that also contained monomethylmodification, albeit at different lysine residues. For example, manual inspection of an MS/MS spectrum (Figure 1b) of the doubly charged ion at 925.535 m/z determined that thisspectrum was composed of two positional isomeric species containing monomethyl either atLys61 or Lys64. This is clearly evident as fragment ions separated by 14 Da can be seenthroughout the MS/MS spectrum, such as at 1285 and 1299 m/z (y11 ions), and at 551 and565 m/z (b4 ions), providing support for monomethylation at both sites. Lys64 and Lys70 onHMGA1a have only been previously reported to be acetylated;[7] thus we findmonomethylation of Lys61, Lys64 and Lys70 to be novel HMGA1a modifications.Interestingly, we did not observe higher degrees of methylation at those specific lysineresidues, indicating that if existing, these higher degrees of methylation are present belowour current detection limit. Modified peptides detected through this chemical derivatizationBottom Up MS strategy are listed in Table 1.
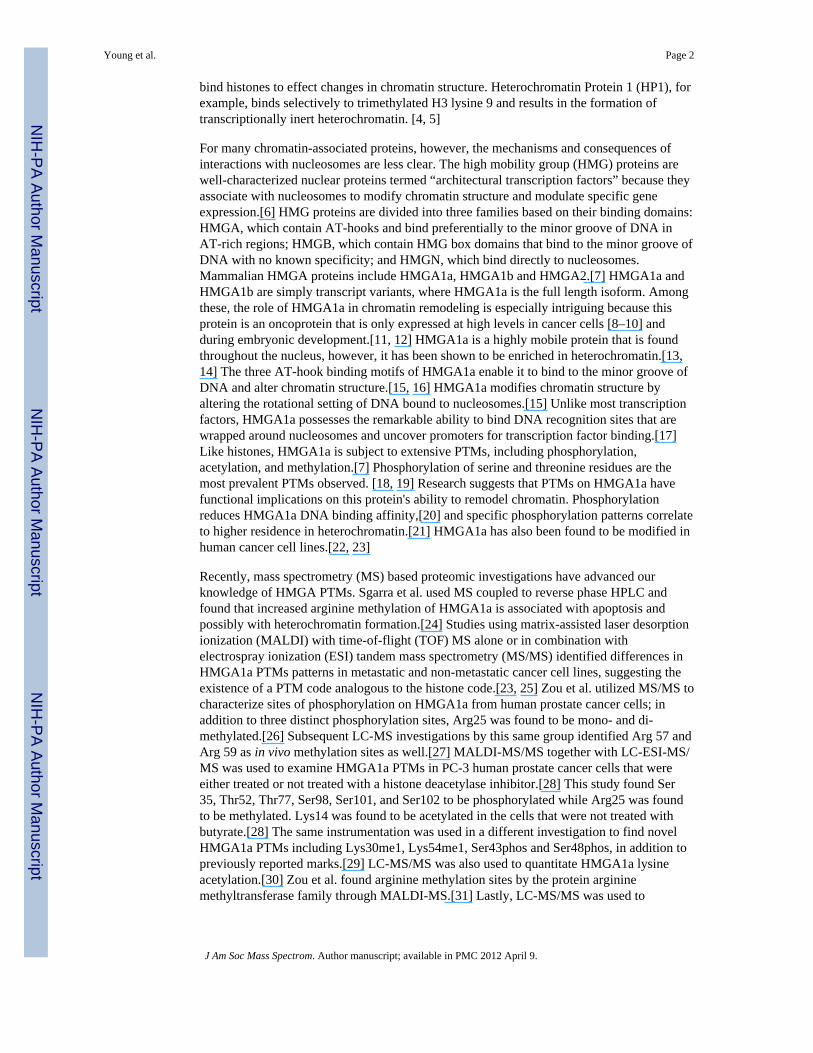
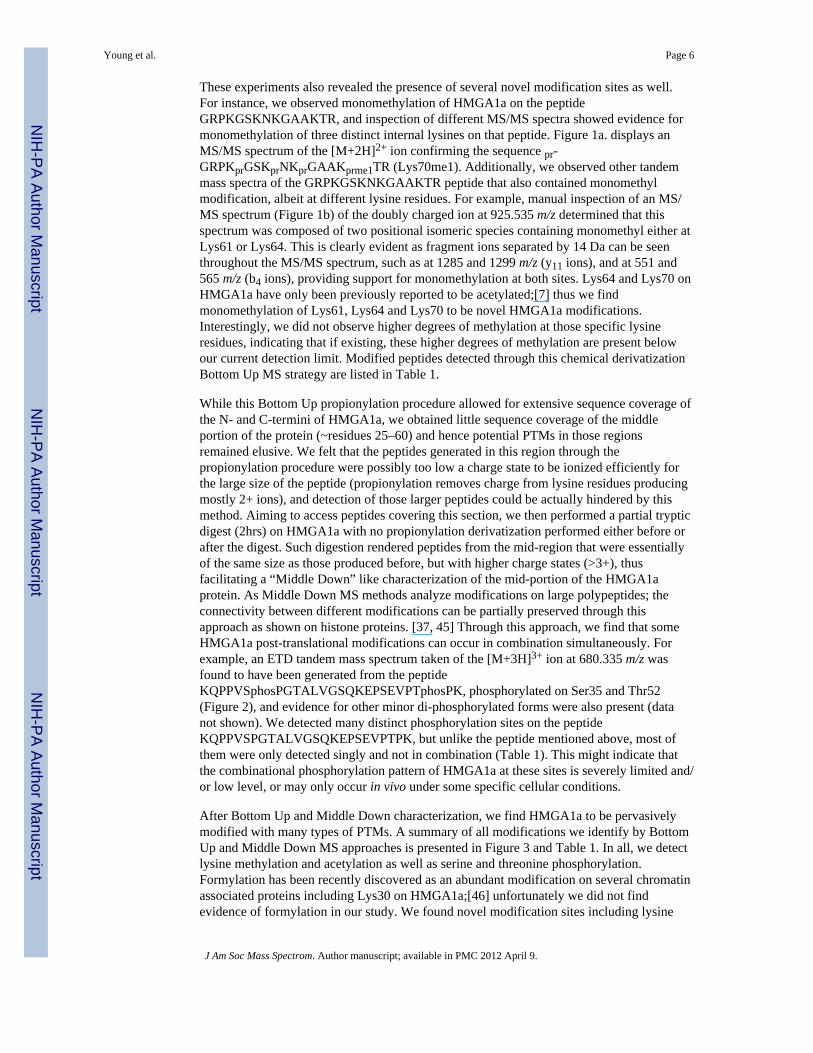
While this Bottom Up propionylation procedure allowed for extensive sequence coverage ofthe N- and C-termini of HMGA1a, we obtained little sequence coverage of the middleportion of the protein (~residues 25–60) and hence potential PTMs in those regionsremained elusive. We felt that the peptides generated in this region through thepropionylation procedure were possibly too low a charge state to be ionized efficiently forthe large size of the peptide (propionylation removes charge from lysine residues producingmostly 2+ ions), and detection of those larger peptides could be actually hindered by thismethod. Aiming to access peptides covering this section, we then performed a partial trypticdigest (2hrs) on HMGA1a with no propionylation derivatization performed either before orafter the digest. Such digestion rendered peptides from the mid-region that were essentiallyof the same size as those produced before, but with higher charge states (>3+), thusfacilitating a “Middle Down” like characterization of the mid-portion of the HMGA1aprotein. As Middle Down MS methods analyze modifications on large polypeptides; theconnectivity between different modifications can be partially preserved through thisapproach as shown on histone proteins. [37, 45] Through this approach, we find that someHMGA1a post-translational modifications can occur in combination simultaneously. Forexample, an ETD tandem mass spectrum taken of the [M+3H]3+ ion at 680.335 m/z wasfound to have been generated from the peptideKQPPVSphosPGTALVGSQKEPSEVPTphosPK, phosphorylated on Ser35 and Thr52(Figure 2), and evidence for other minor di-phosphorylated forms were also present (datanot shown). We detected many distinct phosphorylation sites on the peptideKQPPVSPGTALVGSQKEPSEVPTPK, but unlike the peptide mentioned above, most ofthem were only detected singly and not in combination (Table 1). This might indicate thatthe combinational phosphorylation pattern of HMGA1a at these sites is severely limited and/or low level, or may only occur in vivo under some specific cellular conditions.
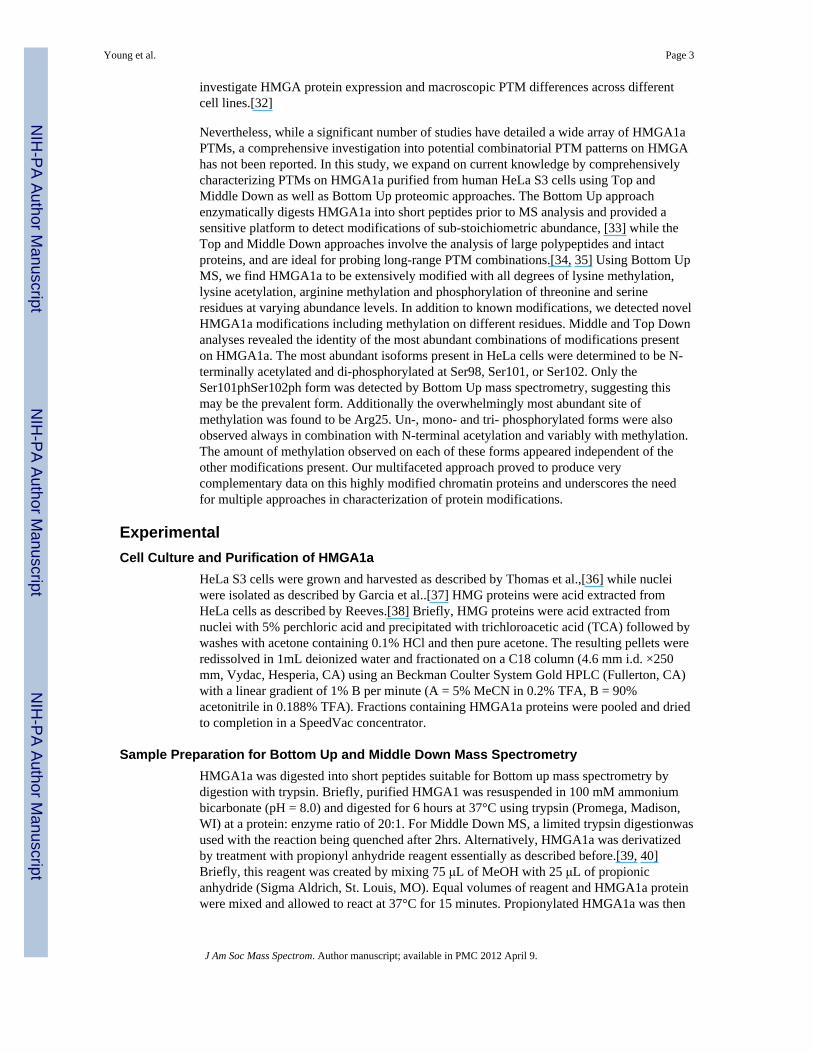
After Bottom Up and Middle Down characterization, we find HMGA1a to be pervasivelymodified with many types of PTMs. A summary of all modifications we identify by BottomUp and Middle Down MS approaches is presented in Figure 3 and Table 1. In all, we detectlysine methylation and acetylation as well as serine and threonine phosphorylation.Formylation has been recently discovered as an abundant modification on several chromatinassociated proteins including Lys30 on HMGA1a;[46] unfortunately we did not findevidence of formylation in our study. We found novel modification sites including lysine
Young et al. Page 6
J Am Soc Mass Spectrom. Author manuscript; available in PMC 2012 April 9.
NIH
-PA Author Manuscript
NIH
-PA Author Manuscript
NIH
-PA Author Manuscript
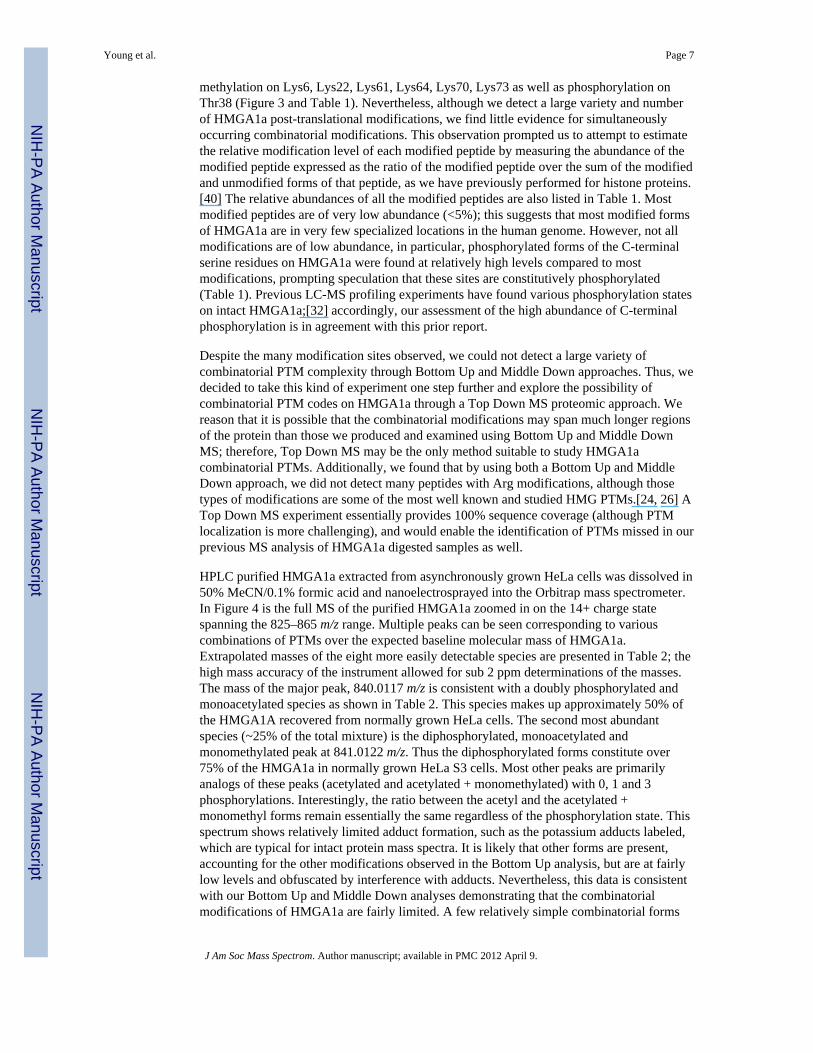
methylation on Lys6, Lys22, Lys61, Lys64, Lys70, Lys73 as well as phosphorylation onThr38 (Figure 3 and Table 1). Nevertheless, although we detect a large variety and numberof HMGA1a post-translational modifications, we find little evidence for simultaneouslyoccurring combinatorial modifications. This observation prompted us to attempt to estimatethe relative modification level of each modified peptide by measuring the abundance of themodified peptide expressed as the ratio of the modified peptide over the sum of the modifiedand unmodified forms of that peptide, as we have previously performed for histone proteins.[40] The relative abundances of all the modified peptides are also listed in Table 1. Mostmodified peptides are of very low abundance (<5%); this suggests that most modified formsof HMGA1a are in very few specialized locations in the human genome. However, not allmodifications are of low abundance, in particular, phosphorylated forms of the C-terminalserine residues on HMGA1a were found at relatively high levels compared to mostmodifications, prompting speculation that these sites are constitutively phosphorylated(Table 1). Previous LC-MS profiling experiments have found various phosphorylation stateson intact HMGA1a;[32] accordingly, our assessment of the high abundance of C-terminalphosphorylation is in agreement with this prior report.
Despite the many modification sites observed, we could not detect a large variety ofcombinatorial PTM complexity through Bottom Up and Middle Down approaches. Thus, wedecided to take this kind of experiment one step further and explore the possibility ofcombinatorial PTM codes on HMGA1a through a Top Down MS proteomic approach. Wereason that it is possible that the combinatorial modifications may span much longer regionsof the protein than those we produced and examined using Bottom Up and Middle DownMS; therefore, Top Down MS may be the only method suitable to study HMGA1acombinatorial PTMs. Additionally, we found that by using both a Bottom Up and MiddleDown approach, we did not detect many peptides with Arg modifications, although thosetypes of modifications are some of the most well known and studied HMG PTMs.[24, 26] ATop Down MS experiment essentially provides 100% sequence coverage (although PTMlocalization is more challenging), and would enable the identification of PTMs missed in ourprevious MS analysis of HMGA1a digested samples as well.
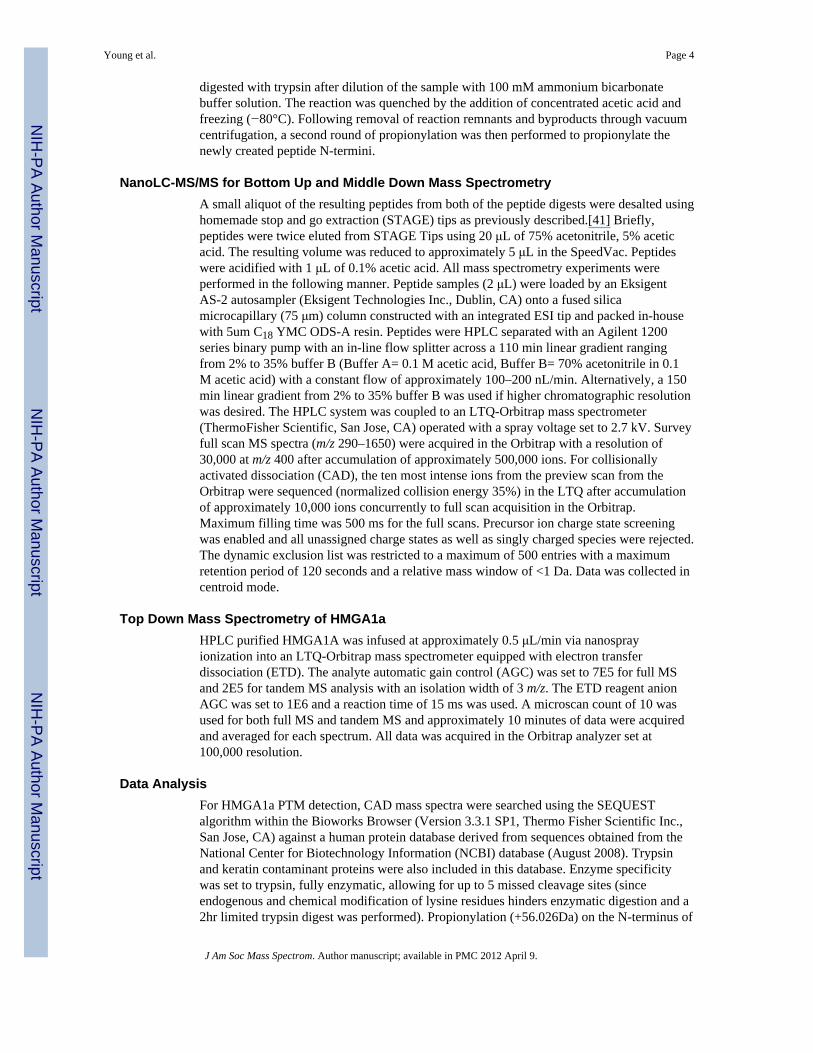
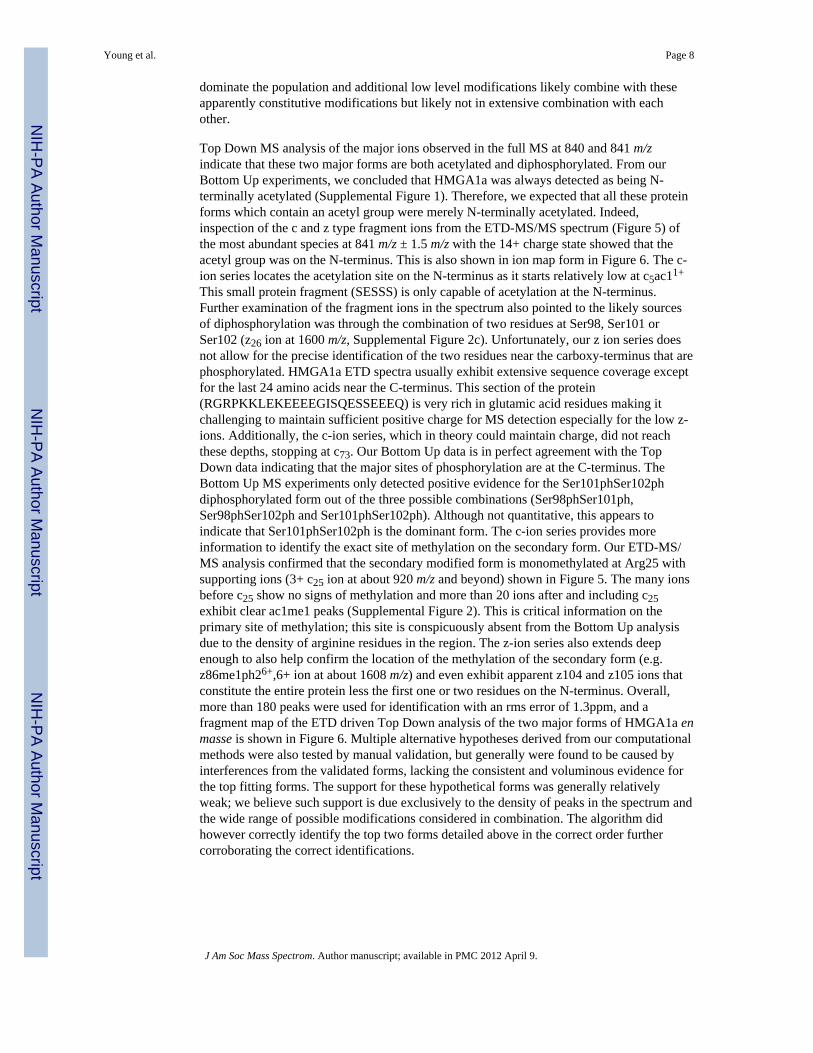
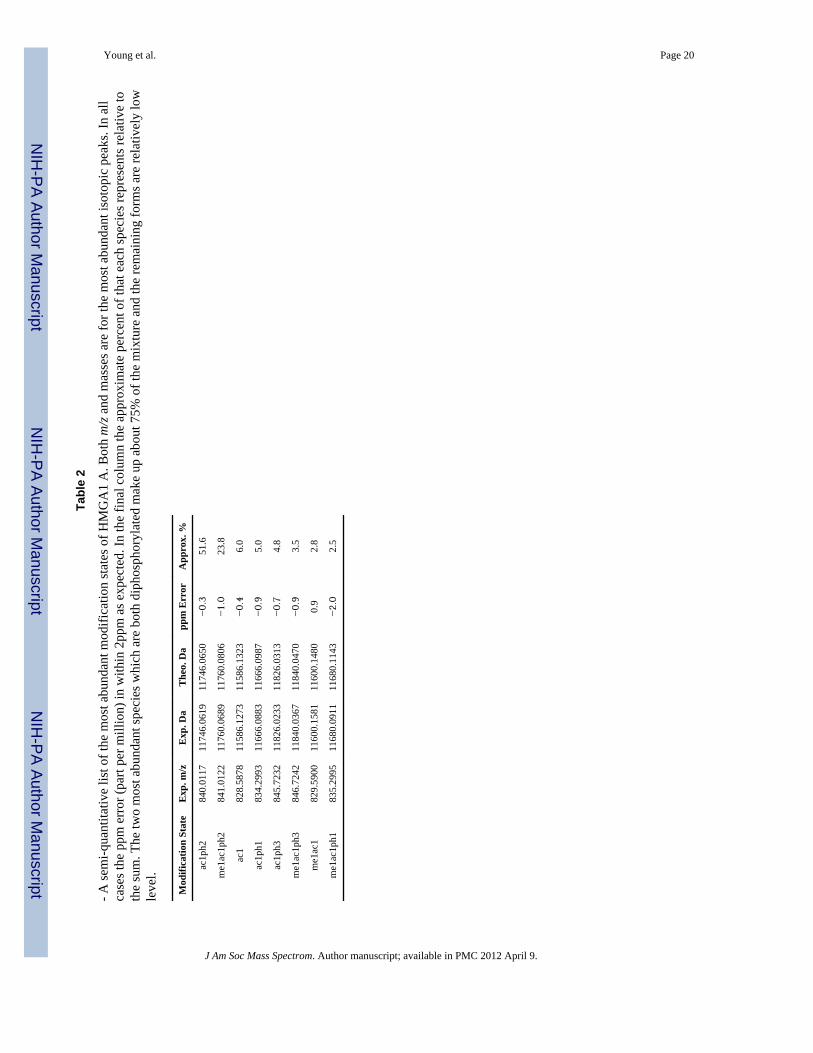
HPLC purified HMGA1a extracted from asynchronously grown HeLa cells was dissolved in50% MeCN/0.1% formic acid and nanoelectrosprayed into the Orbitrap mass spectrometer.In Figure 4 is the full MS of the purified HMGA1a zoomed in on the 14+ charge statespanning the 825–865 m/z range. Multiple peaks can be seen corresponding to variouscombinations of PTMs over the expected baseline molecular mass of HMGA1a.Extrapolated masses of the eight more easily detectable species are presented in Table 2; thehigh mass accuracy of the instrument allowed for sub 2 ppm determinations of the masses.The mass of the major peak, 840.0117 m/z is consistent with a doubly phosphorylated andmonoacetylated species as shown in Table 2. This species makes up approximately 50% ofthe HMGA1A recovered from normally grown HeLa cells. The second most abundantspecies (~25% of the total mixture) is the diphosphorylated, monoacetylated andmonomethylated peak at 841.0122 m/z. Thus the diphosphorylated forms constitute over75% of the HMGA1a in normally grown HeLa S3 cells. Most other peaks are primarilyanalogs of these peaks (acetylated and acetylated + monomethylated) with 0, 1 and 3phosphorylations. Interestingly, the ratio between the acetyl and the acetylated +monomethyl forms remain essentially the same regardless of the phosphorylation state. Thisspectrum shows relatively limited adduct formation, such as the potassium adducts labeled,which are typical for intact protein mass spectra. It is likely that other forms are present,accounting for the other modifications observed in the Bottom Up analysis, but are at fairlylow levels and obfuscated by interference with adducts. Nevertheless, this data is consistentwith our Bottom Up and Middle Down analyses demonstrating that the combinatorialmodifications of HMGA1a are fairly limited. A few relatively simple combinatorial forms
Young et al. Page 7
J Am Soc Mass Spectrom. Author manuscript; available in PMC 2012 April 9.
NIH
-PA Author Manuscript
NIH
-PA Author Manuscript
NIH
-PA Author Manuscript
dominate the population and additional low level modifications likely combine with theseapparently constitutive modifications but likely not in extensive combination with eachother.
Top Down MS analysis of the major ions observed in the full MS at 840 and 841 m/zindicate that these two major forms are both acetylated and diphosphorylated. From ourBottom Up experiments, we concluded that HMGA1a was always detected as being N-terminally acetylated (Supplemental Figure 1). Therefore, we expected that all these proteinforms which contain an acetyl group were merely N-terminally acetylated. Indeed,inspection of the c and z type fragment ions from the ETD-MS/MS spectrum (Figure 5) ofthe most abundant species at 841 m/z ± 1.5 m/z with the 14+ charge state showed that theacetyl group was on the N-terminus. This is also shown in ion map form in Figure 6. The c-ion series locates the acetylation site on the N-terminus as it starts relatively low at c5ac11+
This small protein fragment (SESSS) is only capable of acetylation at the N-terminus.Further examination of the fragment ions in the spectrum also pointed to the likely sourcesof diphosphorylation was through the combination of two residues at Ser98, Ser101 orSer102 (z26 ion at 1600 m/z, Supplemental Figure 2c). Unfortunately, our z ion series doesnot allow for the precise identification of the two residues near the carboxy-terminus that arephosphorylated. HMGA1a ETD spectra usually exhibit extensive sequence coverage exceptfor the last 24 amino acids near the C-terminus. This section of the protein(RGRPKKLEKEEEEGISQESSEEEQ) is very rich in glutamic acid residues making itchallenging to maintain sufficient positive charge for MS detection especially for the low z-ions. Additionally, the c-ion series, which in theory could maintain charge, did not reachthese depths, stopping at c73. Our Bottom Up data is in perfect agreement with the TopDown data indicating that the major sites of phosphorylation are at the C-terminus. TheBottom Up MS experiments only detected positive evidence for the Ser101phSer102phdiphosphorylated form out of the three possible combinations (Ser98phSer101ph,Ser98phSer102ph and Ser101phSer102ph). Although not quantitative, this appears toindicate that Ser101phSer102ph is the dominant form. The c-ion series provides moreinformation to identify the exact site of methylation on the secondary form. Our ETD-MS/MS analysis confirmed that the secondary modified form is monomethylated at Arg25 withsupporting ions (3+ c25 ion at about 920 m/z and beyond) shown in Figure 5. The many ionsbefore c25 show no signs of methylation and more than 20 ions after and including c25exhibit clear ac1me1 peaks (Supplemental Figure 2). This is critical information on theprimary site of methylation; this site is conspicuously absent from the Bottom Up analysisdue to the density of arginine residues in the region. The z-ion series also extends deepenough to also help confirm the location of the methylation of the secondary form (e.g.z86me1ph26+,6+ ion at about 1608 m/z) and even exhibit apparent z104 and z105 ions thatconstitute the entire protein less the first one or two residues on the N-terminus. Overall,more than 180 peaks were used for identification with an rms error of 1.3ppm, and afragment map of the ETD driven Top Down analysis of the two major forms of HMGA1a enmasse is shown in Figure 6. Multiple alternative hypotheses derived from our computationalmethods were also tested by manual validation, but generally were found to be caused byinterferences from the validated forms, lacking the consistent and voluminous evidence forthe top fitting forms. The support for these hypothetical forms was generally relativelyweak; we believe such support is due exclusively to the density of peaks in the spectrum andthe wide range of possible modifications considered in combination. The algorithm didhowever correctly identify the top two forms detailed above in the correct order furthercorroborating the correct identifications.
Young et al. Page 8
J Am Soc Mass Spectrom. Author manuscript; available in PMC 2012 April 9.
NIH
-PA Author Manuscript
NIH
-PA Author Manuscript
NIH
-PA Author Manuscript
ConclusionsIn this study, we extend the current information concerning HMGA1a PTMs from humancells using various methods including Top and Middle Down as well as Bottom Up MSapproaches. Through Bottom Up and Middle Down MS proteomics, we find HMGA1a to behighly modified at numerous sites with many different types of PTMs (some novel), andwith the exception of the C-terminal phosphorylation, the majority of these modificationsare present at low abundance levels (<5%). Middle Down MS analysis allowed us todetermine that some HMGA1a modifications can occur simultaneously, suggesting thepotential of an HMGA1a combinatorial PTM code analogous to the Histone Code; however,this code was found to be much less complex or much lower in abundance than expected.Results obtained through a Top Down MS analysis were also consistent with those resultsobtained through the other MS approaches, indicating that combinatorial modifications ofHMGA1a are not extensive in asynchronously grown HeLa cells, but rather dominated by afew combinations of the most abundant modifications (very limited specific codes). Thisdata represents the first Top Down MS analysis of HMGA1a, and provides a unique look atHMGA1a modifications. Overall, we found that the combined use of the different MStechniques is highly complementary and allowed for a thorough characterization ofHMGA1a modifications that could not be accomplished by any one method alone. It will beinteresting to further probe both the single and combinatorial modifications of HMGA1ausing this multifaceted MS approaches during more specific biological conditions such asduring cancer progression or other disease states.
Supplementary MaterialRefer to Web version on PubMed Central for supplementary material.
AcknowledgmentsThis work was supported by Princeton University and a grant from the National Science Foundation(CBET-0941143) to B.A.G and C.A.F. B.A.G. also acknowledges support from an American Society for MassSpectrometry Research award sponsored by the Waters Corporation. C.A.F. also acknowledges support from theNational Institutes of Health (R01LM009338) and the Environmental Protection Agency, EPA R832721-010.
References1. Bernstein BE, Meissner A, Lander ES. The Mammalian Epigenome. Cell. 2007; 128:669–681.
[PubMed: 17320505]2. Cheung P, Allis CD, Sassone-Corsi P. Signaling to Chromatin through Histone Modifications. Cell.
2000; 103:263–271. [PubMed: 11057899]3. Kouzarides T. Chromatin Modifications and Their Function. Cell. 2007; 128:693–705. [PubMed:
17320507]4. Lachner M, O'Carroll D, Rea S, Mechtler K, Jenuwein T. Methylation of Histone H3 Lysine 9
Creates a Binding Site for Hp1 Proteins. Nature. 2001; 410:116–120. [PubMed: 11242053]5. Bannister AJ, Zegerman P, Partridge JF, Miska EA, Thomas JO, Allshire RC, Kouzarides T.
Selective Recognition of Methylated Lysine 9 on Histone H3 by the Hp1 Chromo Domain. Nature.2001; 410:120–124. [PubMed: 11242054]
6. Grosschedl R, Giese K, Pagel J. Hmg Domain Proteins: Architectural Elements in the Assembly ofNucleoprotein Structures. Trends Genet. 1994; 10:94–100. [PubMed: 8178371]
7. Zhang Q, Wang Y. High Mobility Group Proteins and Their Post-Translational Modifications.Biochim Biophys Acta. 2008; 1784:1159–1166. [PubMed: 18513496]
8. Chiappetta G, Bandiera A, Berlingieri MT, Visconti R, Manfioletti G, Battista S, Martinez-Tello FJ,Santoro M, Giancotti V, Fusco A. The Expression of the High Mobility Group Hmgi (Y) Proteins
Young et al. Page 9
J Am Soc Mass Spectrom. Author manuscript; available in PMC 2012 April 9.
NIH
-PA Author Manuscript
NIH
-PA Author Manuscript
NIH
-PA Author Manuscript
Correlates with the Malignant Phenotype of Human Thyroid Neoplasias. Oncogene. 1995; 10:1307–1314. [PubMed: 7731681]
9. Giancotti V, Berlingieri MT, DiFiore PP, Fusco A, Vecchio G, Crane-Robinson C. Changes inNuclear Proteins on Transformation of Rat Epithelial Thyroid Cells by a Murine SarcomaRetrovirus. Cancer Res. 1985; 45:6051–6057. [PubMed: 2998592]
10. Giancotti V, Buratti E, Perissin L, Zorzet S, Balmain A, Portella G, Fusco A, Goodwin GH.Analysis of the Hmgi Nuclear Proteins in Mouse Neoplastic Cells Induced by DifferentProcedures. Exp Cell Res. 1989; 184:538–545. [PubMed: 2806403]
11. Chiappetta G, Avantaggiato V, Visconti R, Fedele M, Battista S, Trapasso F, Merciai BM, FidanzaV, Giancotti V, Santoro M, Simeone A, Fusco A. High Level Expression of the Hmgi (Y) GeneDuring Embryonic Development. Oncogene. 1996; 13:2439–2446. [PubMed: 8957086]
12. Zhou X, Benson KF, Ashar HR, Chada K. Mutation Responsible for the Mouse Pygmy Phenotypein the Developmentally Regulated Factor Hmgi-C. Nature. 1995; 376:771–774. [PubMed:7651535]
13. Amirand C, Viari A, Ballini JP, Rezaei H, Beaujean N, Jullien D, Kas E, Debey P. Three DistinctSub-Nuclear Populations of Hmg-I Protein of Different Properties Revealed by Co-LocalizationImage Analysis. J Cell Sci. 1998; 111(Pt 23):3551–3561. [PubMed: 9811569]
14. Martelli AM, Riccio M, Bareggi R, Manfioletti G, Tabellini G, Baldini G, Narducci P, Giancotti V.Intranuclear Distribution of Hmgi/Y Proteins. An Immunocytochemical Study. J HistochemCytochem. 1998; 46:863–864. [PubMed: 9632746]
15. Reeves R, Wolffe AP. Substrate Structure Influences Binding of the Non-Histone Protein Hmg-I(Y) to Free Nucleosomal DNA. Biochemistry. 1996; 35:5063–5074. [PubMed: 8664299]
16. Reeves R, Nissen MS. Interaction of High Mobility Group-I (Y) Nonhistone Proteins withNucleosome Core Particles. J Biol Chem. 1993; 268:21137–21146. [PubMed: 8407950]
17. Reeves R, Leonard WJ, Nissen MS. Binding of Hmg-I(Y) Imparts Architectural Specificity to aPositioned Nucleosome on the Promoter of the Human Interleukin-2 Receptor Alpha Gene. MolCell Biol. 2000; 20:4666–4679. [PubMed: 10848593]
18. Elton TS, Reeves R. Purification and Postsynthetic Modifications of Friend Erythroleukemic CellHigh Mobility Group Protein Hmg-I. Anal Biochem. 1986; 157:53–62. [PubMed: 3464222]
19. Lund T, Holtlund J, Laland SG. On the Phosphorylation of Low Molecular Mass Hmg (HighMobility Group) Proteins in Ehrlich Ascites Cells. FEBS Lett. 1985; 180:275–279. [PubMed:3881281]
20. Nissen MS, Langan TA, Reeves R. Phosphorylation by Cdc2 Kinase Modulates DNA BindingActivity of High Mobility Group I Nonhistone Chromatin Protein. J Biol Chem. 1991; 266:19945–19952. [PubMed: 1939057]
21. Harrer M, Luhrs H, Bustin M, Scheer U, Hock R. Dynamic Interaction of Hmga1a Proteins withChromatin. J Cell Sci. 2004; 117:3459–3471. [PubMed: 15213251]
22. Banks GC, Li Y, Reeves R. Differential in Vivo Modifications of the Hmgi(Y) NonhistoneChromatin Proteins Modulate Nucleosome and DNA Interactions. Biochemistry. 2000; 39:8333–8346. [PubMed: 10889043]
23. Edberg DD, Bruce JE, Siems WF, Reeves R. In Vivo Posttranslational Modifications of the HighMobility Group A1a Proteins in Breast Cancer Cells of Differing Metastatic Potential.Biochemistry. 2004; 43:11500–11515. [PubMed: 15350136]
24. Sgarra R, Diana F, Bellarosa C, Dekleva V, Rustighi A, Toller M, Manfioletti G, Giancotti V.During Apoptosis of Tumor Cells Hmga1a Protein Undergoes Methylation: Identification of theModification Site by Mass Spectrometry. Biochemistry. 2003; 42:3575–3585. [PubMed:12653562]
25. Edberg DD, Adkins JN, Springer DL, Reeves R. Dynamic and Differential in Vivo Modificationsof the Isoform Hmga1a and Hmga1b Chromatin Proteins. J Biol Chem. 2005; 280:8961–8973.[PubMed: 15591590]
26. Zou Y, Wang Y. Tandem Mass Spectrometry for the Examination of the PosttranslationalModifications of High-Mobility Group A1 Proteins: Symmetric and Asymmetric Dimethylation ofArg25 in Hmga1a Protein. Biochemistry. 2005; 44:6293–6301. [PubMed: 15835918]
Young et al. Page 10
J Am Soc Mass Spectrom. Author manuscript; available in PMC 2012 April 9.
NIH
-PA Author Manuscript
NIH
-PA Author Manuscript
NIH
-PA Author Manuscript
27. Sgarra R, Lee J, Tessari MA, Altamura S, Spolaore B, Giancotti V, Bedford MT, Manfioletti G.The at-Hook of the Chromatin Architectural Transcription Factor High Mobility Group A1a IsArginine-Methylated by Protein Arginine Methyltransferase 6. J Biol Chem. 2006; 281:3764–3772. [PubMed: 16293633]
28. Jiang X, Wang Y. Acetylation and Phosphorylation of High-Mobility Group A1 Proteins in Pc-3Human Tumor Cells. Biochemistry. 2006; 45:7194–7201. [PubMed: 16752910]
29. Zou Y, Wang Y. Mass Spectrometric Analysis of High-Mobility Group Proteins and Their Post-Translational Modifications in Normal and Cancerous Human Breast Tissues. J Proteome Res.2007; 6:2304–2314. [PubMed: 17455969]
30. Zhang Q, Zhang K, Zou Y, Perna A, Wang Y. A Quantitative Study on the in Vitro and in VivoAcetylation of High Mobility Group A1 Proteins. J Am Soc Mass Spectrom. 2007; 18:1569–1578.[PubMed: 17627840]
31. Zou Y, Webb K, Perna AD, Zhang Q, Clarke S, Wang Y. A Mass Spectrometric Study on the inVitro Methylation of Hmga1a and Hmga1b Proteins by Prmts: Methylation Specificity, the Effectof Binding to at-Rich Duplex DNA, and the Effect of C-Terminal Phosphorylation. Biochemistry.2007; 46:7896–7906. [PubMed: 17550233]
32. Sgarra R, Maurizio E, Zammitti S, Lo Sardo A, Giancotti V, Manfioletti G. MacroscopicDifferences in Hmga Oncoproteins Post-Translational Modifications: C-Terminal Phosphorylationof Hmga2 Affects Its DNA Binding Properties. J Proteome Res. 2009; 8:2978–2989. [PubMed:19317492]
33. Garcia BA, Shabanowitz J, Hunt DF. Characterization of Histones and Their Post-TranslationalModifications by Mass Spectrometry. Curr Opin Chem Biol. 2007; 11:66–73. [PubMed:17157550]
34. Pesavento JJ, Mizzen CA, Kelleher NL. Quantitative Analysis of Modified Proteins and TheirPositional Isomers by Tandem Mass Spectrometry: Human Histone H4. Anal Chem. 2006;78:4271–4280. [PubMed: 16808433]
35. Boyne MT 2nd, Pesavento JJ, Mizzen CA, Kelleher NL. Precise Characterization of HumanHistones in the H2a Gene Family by Top Down Mass Spectrometry. J Proteome Res. 2006;5:248–253. [PubMed: 16457589]
36. Thomas CE, Kelleher NL, Mizzen CA. Mass Spectrometric Characterization of Human HistoneH3: A Bird's Eye View. J Proteome Res. 2006; 5:240–247. [PubMed: 16457588]
37. Garcia BA, Pesavento JJ, Mizzen CA, Kelleher NL. Pervasive Combinatorial Modification ofHistone H3 in Human Cells. Nat Methods. 2007; 4:487–489. [PubMed: 17529979]
38. Reeves R. Hmga Proteins: Isolation, Biochemical Modifications, and Nucleosome Interactions.Methods Enzymol. 2004; 375:297–322. [PubMed: 14870675]
39. Garcia BA, Mollah S, Ueberheide BM, Busby SA, Muratore TL, Shabanowitz J, Hunt DF.Chemical Derivatization of Histones for Facilitated Analysis by Mass Spectrometry. Nat Protoc.2007; 2:933–938. [PubMed: 17446892]
40. Plazas-Mayorca MD, Zee BM, Young NL, Fingerman IM, Leroy G, Briggs SD, Garcia BA. One-Pot Shotgun Quantitative Mass Spectrometry Characterization of Histones. J Proteome Res. 2009
41. Rappsilber J, Ishihama Y, Mann M. Stop and Go Extraction Tips for Matrix-Assisted LaserDesorption/Ionization, Nanoelectrospray, and Lc/Ms Sample Pretreatment in Proteomics. AnalChem. 2003; 75:663–670. [PubMed: 12585499]
42. MacCoss MJ, Wu CC, Yates JR 3rd. Probability-Based Validation of Protein Identifications Usinga Modified Sequest Algorithm. Anal Chem. 2002; 74:5593–5599. [PubMed: 12433093]
43. Horn DM, Zubarev RA, McLafferty FW. Automated Reduction and Interpretation of HighResolution Electrospray Mass Spectra of Large Molecules. J Am Soc Mass Spectrom. 2000;11:320–332. [PubMed: 10757168]
44. Dimaggio PA Jr. Young NL, Baliban RC, Garcia BA, Floudas CA. A Mixed-Integer LinearOptimization Framework for the Identification and Quantification of Targeted Post-TranslationalModifications of Highly Modified Proteins Using Multiplexed Etd Tandem Mass Spectrometry.Mol Cell Proteomics. 2009
45. Phanstiel D, Brumbaugh J, Berggren WT, Conard K, Feng X, Levenstein ME, McAlister GC,Thomson JA, Coon JJ. Mass Spectrometry Identifies and Quantifies 74 Unique Histone H4
Young et al. Page 11
J Am Soc Mass Spectrom. Author manuscript; available in PMC 2012 April 9.
NIH
-PA Author Manuscript
NIH
-PA Author Manuscript
NIH
-PA Author Manuscript
Isoforms in Differentiating Human Embryonic Stem Cells. Proc Natl Acad Sci U S A. 2008;105:4093–4098. [PubMed: 18326628]
46. Wisniewski JR, Zougman A, Mann M. Nepsilon-Formylation of Lysine Is a Widespread Post-Translational Modification of Nuclear Proteins Occurring at Residues Involved in Regulation ofChromatin Function. Nucleic Acids Res. 2008; 36:570–577. [PubMed: 18056081]
Young et al. Page 12
J Am Soc Mass Spectrom. Author manuscript; available in PMC 2012 April 9.
NIH
-PA Author Manuscript
NIH
-PA Author Manuscript
NIH
-PA Author Manuscript
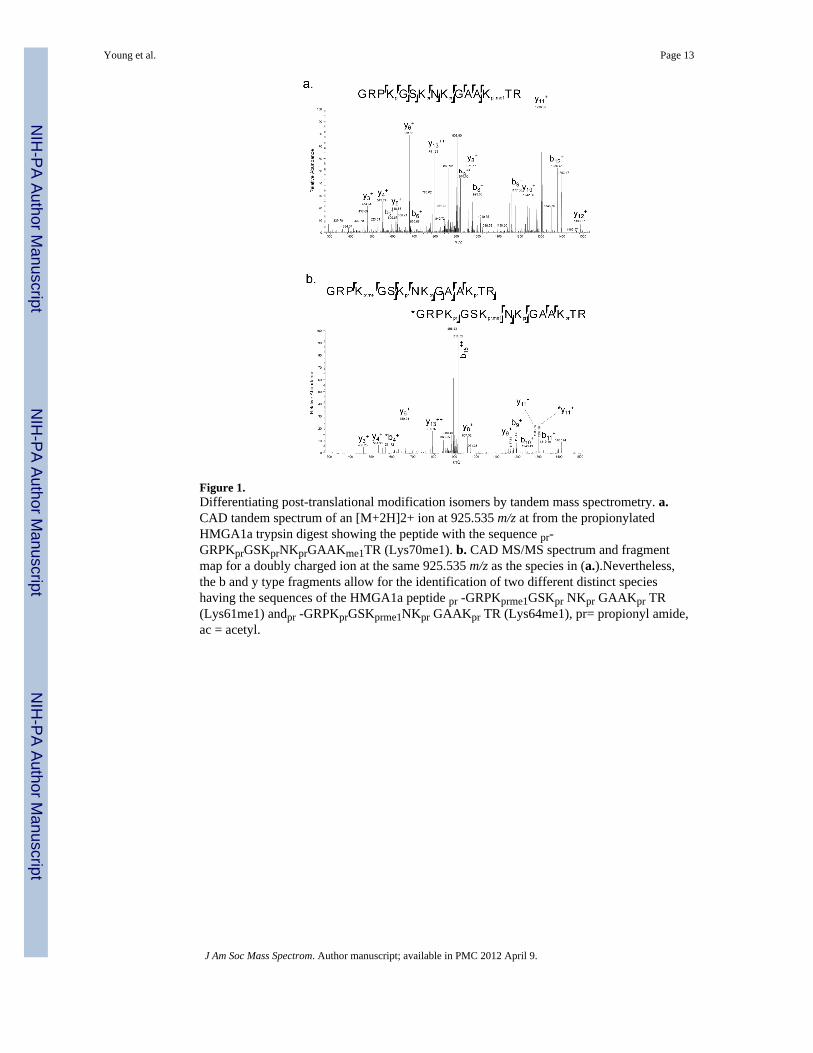
Figure 1.Differentiating post-translational modification isomers by tandem mass spectrometry. a.CAD tandem spectrum of an [M+2H]2+ ion at 925.535 m/z at from the propionylatedHMGA1a trypsin digest showing the peptide with the sequence pr-GRPKprGSKprNKprGAAKme1TR (Lys70me1). b. CAD MS/MS spectrum and fragmentmap for a doubly charged ion at the same 925.535 m/z as the species in (a.).Nevertheless,the b and y type fragments allow for the identification of two different distinct specieshaving the sequences of the HMGA1a peptide pr -GRPKprme1GSKpr NKpr GAAKpr TR(Lys61me1) andpr -GRPKprGSKprme1NKpr GAAKpr TR (Lys64me1), pr= propionyl amide,ac = acetyl.
Young et al. Page 13
J Am Soc Mass Spectrom. Author manuscript; available in PMC 2012 April 9.
NIH
-PA Author Manuscript
NIH
-PA Author Manuscript
NIH
-PA Author Manuscript
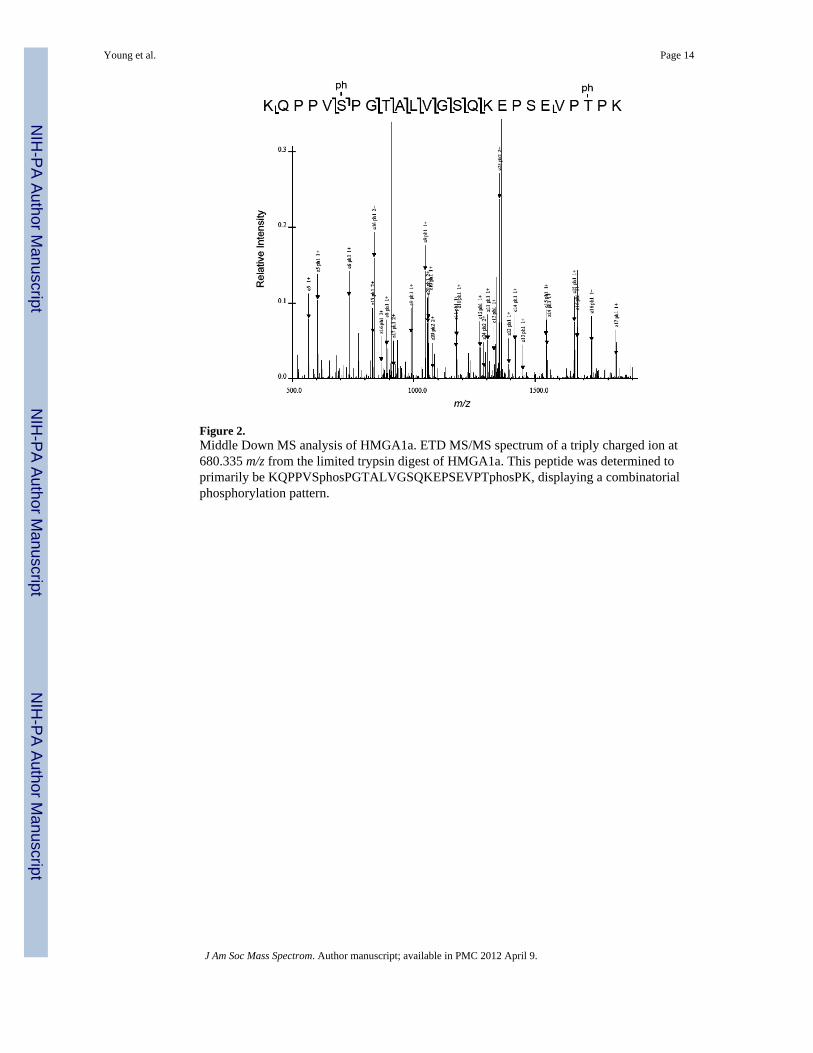
Figure 2.Middle Down MS analysis of HMGA1a. ETD MS/MS spectrum of a triply charged ion at680.335 m/z from the limited trypsin digest of HMGA1a. This peptide was determined toprimarily be KQPPVSphosPGTALVGSQKEPSEVPTphosPK, displaying a combinatorialphosphorylation pattern.
Young et al. Page 14
J Am Soc Mass Spectrom. Author manuscript; available in PMC 2012 April 9.
NIH
-PA Author Manuscript
NIH
-PA Author Manuscript
NIH
-PA Author Manuscript
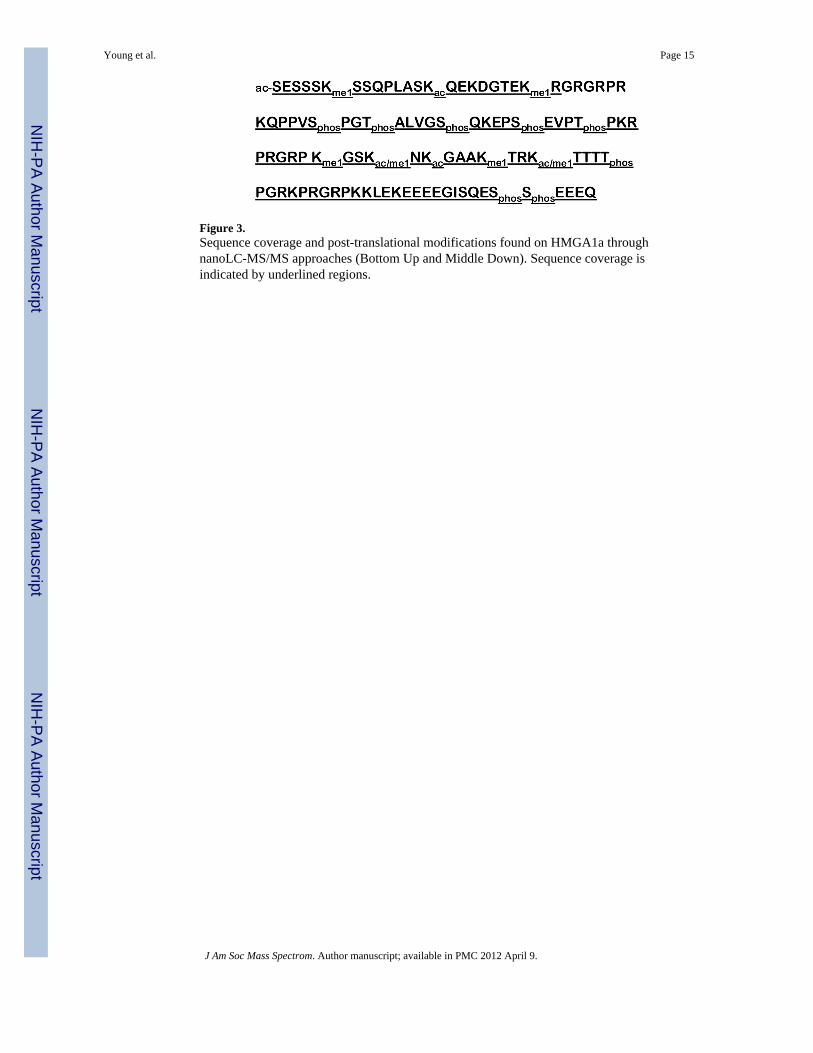
Figure 3.Sequence coverage and post-translational modifications found on HMGA1a throughnanoLC-MS/MS approaches (Bottom Up and Middle Down). Sequence coverage isindicated by underlined regions.
Young et al. Page 15
J Am Soc Mass Spectrom. Author manuscript; available in PMC 2012 April 9.
NIH
-PA Author Manuscript
NIH
-PA Author Manuscript
NIH
-PA Author Manuscript
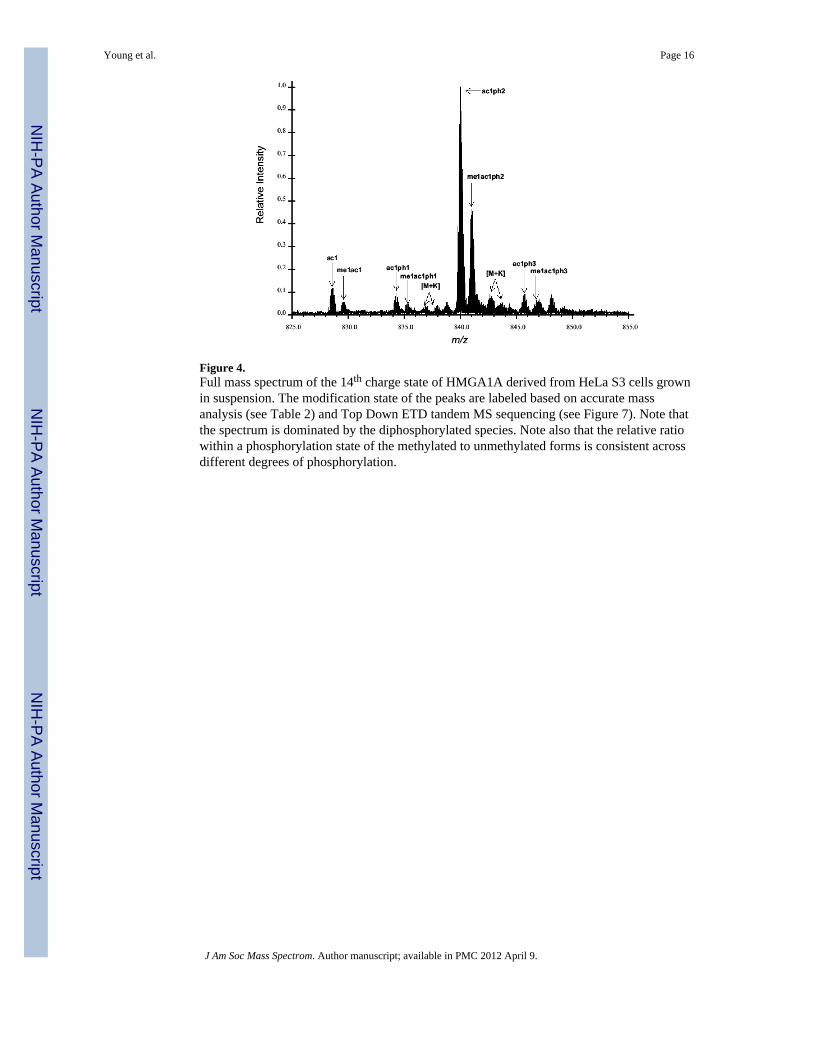
Figure 4.Full mass spectrum of the 14th charge state of HMGA1A derived from HeLa S3 cells grownin suspension. The modification state of the peaks are labeled based on accurate massanalysis (see Table 2) and Top Down ETD tandem MS sequencing (see Figure 7). Note thatthe spectrum is dominated by the diphosphorylated species. Note also that the relative ratiowithin a phosphorylation state of the methylated to unmethylated forms is consistent acrossdifferent degrees of phosphorylation.
Young et al. Page 16
J Am Soc Mass Spectrom. Author manuscript; available in PMC 2012 April 9.
NIH
-PA Author Manuscript
NIH
-PA Author Manuscript
NIH
-PA Author Manuscript
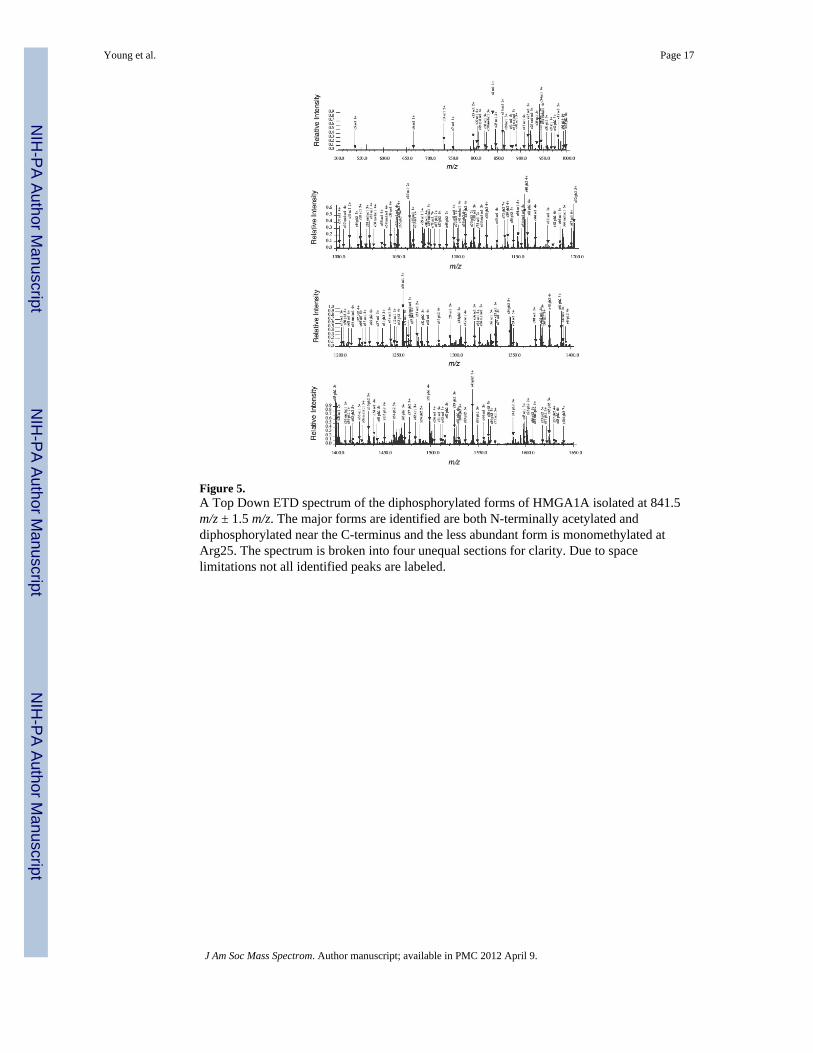
Figure 5.A Top Down ETD spectrum of the diphosphorylated forms of HMGA1A isolated at 841.5m/z ± 1.5 m/z. The major forms are identified are both N-terminally acetylated anddiphosphorylated near the C-terminus and the less abundant form is monomethylated atArg25. The spectrum is broken into four unequal sections for clarity. Due to spacelimitations not all identified peaks are labeled.
Young et al. Page 17
J Am Soc Mass Spectrom. Author manuscript; available in PMC 2012 April 9.
NIH
-PA Author Manuscript
NIH
-PA Author Manuscript
NIH
-PA Author Manuscript
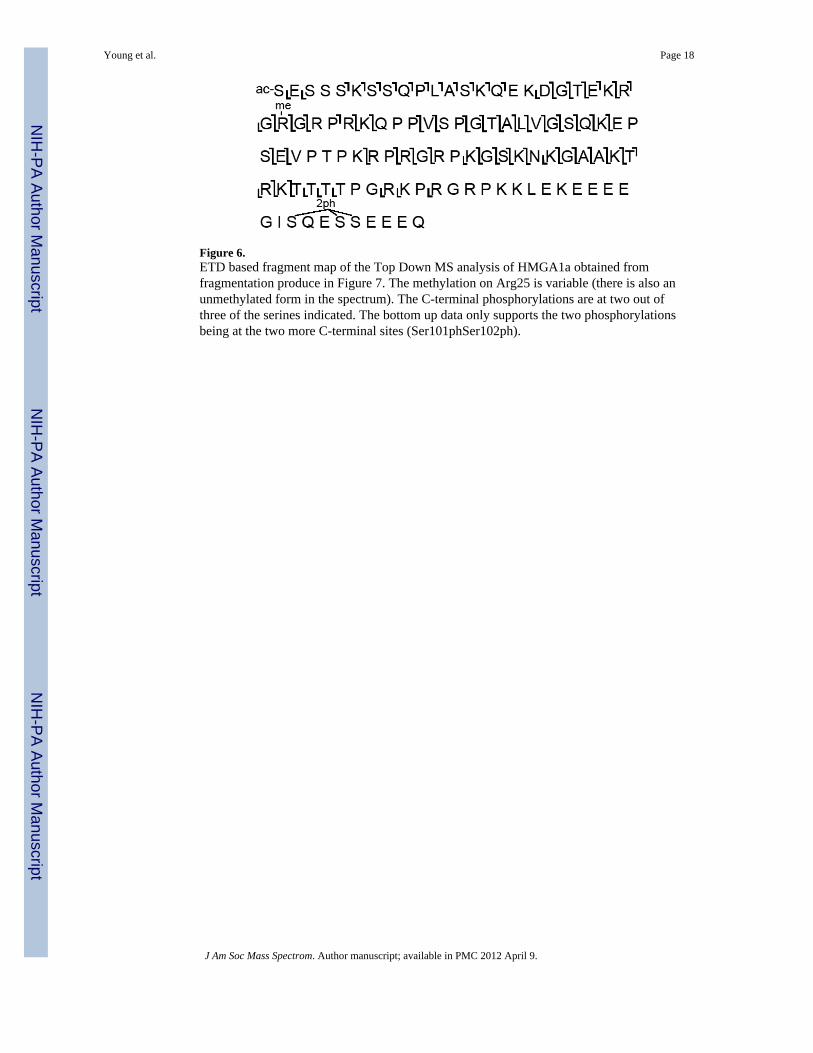
Figure 6.ETD based fragment map of the Top Down MS analysis of HMGA1a obtained fromfragmentation produce in Figure 7. The methylation on Arg25 is variable (there is also anunmethylated form in the spectrum). The C-terminal phosphorylations are at two out ofthree of the serines indicated. The bottom up data only supports the two phosphorylationsbeing at the two more C-terminal sites (Ser101phSer102ph).
Young et al. Page 18
J Am Soc Mass Spectrom. Author manuscript; available in PMC 2012 April 9.
NIH
-PA Author Manuscript
NIH
-PA Author Manuscript
NIH
-PA Author Manuscript
NIH
-PA Author Manuscript
NIH
-PA Author Manuscript
NIH
-PA Author Manuscript
Young et al. Page 19
Table 1
List of selected modified HMGAla peptides detected through nanoLC-MS/MS approaches (Bottom Up andMiddle Down MS).
Peptide Calc. Mass Obs. Mass Peptide Charge Relative Abundance
ac-SESSSKprSSQPLASKprQEKprDGTEKprR 920.789 920.793 3+ 93.5%
ac-SESSSKprSSQPLASKacQEKprDGTEKprR 916.117 916.115 3+ 1.3%
ac-SESSSKprmeiSSQPLASKprQEKprDGTEKprR/
ac-SESSSKprSSQPLASKprQEKprDGTEKprme1R 925.461 925.469 3+ 5.2%
pr-GRPKprGSKprNKprGAAKprTR 918.526 918.525 2+ 99.5%
pr-GRPKprGSKprNKprGAAKprme1TR/
pr-GRPKprGSKprme1NKprGAAKprTR/ 925.534 925.531 2+
pr-GRPKprme1GSKprNKprGAAKprTR 0.3%
pr-GRPKprGSKacNKprGAAKprTR/
pr-GRPKprGSKprNKacGAAKprTR 911.519 911.515 2+ 0.2%
pr-KprTTTTPGRKprPR 705.907 705.904 2+ 97.8%
pr-Kprme1TTTTPGRKprPR 712.915 712.912 2+ 0.4%
pr-KacTTTTPGRKprPR 698.899 698.897 2+ 1.5%
pr-KprTTTTphosPGRKprPR 745.890 745.887 2+ 0.3%
KLEKEEEEGISQESSEEEQ 746.336 746.338 3+ 3.7%
KLEKEEEEGISQESphosSphosEEEQ 799.647 799.647 3+ 96.3%
KQPPVSPGTALVGSQKEPSEVPTPK 640.352 640.354 4+ 51.9%
KQPPVSPGTALVGSphosQKEPSEVPTPK/
KQPPVSphosPGTALVGSQKEPSEVPTPK/
KQPPVSPGTALVGSQKEPSEVPTphosPK/ 660.343 660.344 4+ 38.0%
KQPPVSPGTALVGSQKEPSphosEVPTPK/
KQPPVSPGTphosALVGSQKEPSEVPTPK
KQPPVSphosPGTALVGSQKEPSEVPTphosPK 680.334 680.335 4+ 10.0%
KQPPVSPGTALVGSQKEPSEVPTPK (3 phos)* 700.326 700.326 4+ 0.1%
Note- ac = acetyl, mel = monomethyl, phos = phosphoryl, and pr = propionyl amide (chemical derivatization),
*= could not localize modification sites
J Am Soc Mass Spectrom. Author manuscript; available in PMC 2012 April 9.
NIH
-PA Author Manuscript
NIH
-PA Author Manuscript
NIH
-PA Author Manuscript
Young et al. Page 20
Tabl
e 2
- A se
mi-q
uant
itativ
e lis
t of t
he m
ost a
bund
ant m
odifi
catio
n st
ates
of H
MG
A1
A. B
oth
m/z
and
mas
ses a
re fo
r the
mos
t abu
ndan
t iso
topi
c pe
aks.
In a
llca
ses t
he p
pm e
rror
(par
t per
mill
ion)
in w
ithin
2pp
m a
s exp
ecte
d. In
the
final
col
umn
the
appr
oxim
ate
perc
ent o
f tha
t eac
h sp
ecie
s rep
rese
nts r
elat
ive
toth
e su
m. T
he tw
o m
ost a
bund
ant s
peci
es w
hich
are
bot
h di
phos
phor
ylat
ed m
ake
up a
bout
75%
of t
he m
ixtu
re a
nd th
e re
mai
ning
form
s are
rela
tivel
y lo
wle
vel.
Mod
ifica
tion
Stat
eE
xp. m
/zE
xp. D
aT
heo.
Da
ppm
Err
orA
ppro
x. %
ac1p
h284
0.01
1711
746.
0619
1174
6.06
50−0.3
51.6
me1
ac1p
h284
1.01
2211
760.
0689
1176
0.08
06−1.0
23.8
ac1
828.
5878
1158
6.12
7311
586.
1323
−0.4
6.0
ac1p
h183
4.29
9311
666.
0883
1166
6.09
87−0.9
5.0
ac1p
h384
5.72
3211
826.
0233
1182
6.03
13−0.7
4.8
me1
ac1p
h384
6.72
4211
840.
0367
1184
0.04
70−0.9
3.5
me1
ac1
829.
5900
1160
0.15
8111
600.
1480
0.9
2.8
me1
ac1p
h183
5.29
9511
680.
0911
1168
0.11
43−2.0
2.5
J Am Soc Mass Spectrom. Author manuscript; available in PMC 2012 April 9.
Top Related
Copyright © 2022 FDOKUMEN

