


Bahasa
Halaman
Hukum

arX
iv:0
906.
3701
v1 [
astr
o-ph
.CO
] 19
Jun
200
9Astronomy & Astrophysicsmanuscript no. Chemheavy c© ESO 2009June 19, 2009
Chemistry of heavy elements in the Dark AgesP. Vonlanthen1, T. Rauscher2, C. Winteler2, D. Puy1, M. Signore3, and V. Dubrovich4
1 Universite Montpellier II - GRAAL, CNRS - UMR 5024, place Eugene Bataillon, 34095 Montpellier, France2 Department of Physics, University of Basel, 4056 Basel, Switzerland3 LERMA, Observatoire de Paris, 75014 Paris, France4 SPb Branch of Special Astrophysical Observatory, RAS, St Petersburg, Russia
e-mail:[email protected]
Received/ Accepted
ABSTRACT
Context. Primordial molecules were formed during the Dark Ages, i.e.the time between recombination and reionization in the earlyUniverse. They were the constitutents of the first proto-stellar clouds. Standard Big Bang nucleosynthesis predicts the abundances ofhydrogen, helium, lithium, beryllium, and their isotopes in the early Universe. Heavier nuclei such as carbon, nitrogen, or oxygen areformed in trace amounts only. In non-standard Big Bang nucleosynthesis models, it is possible to synthesize larger quantities of theseheavier elements. The latter are interesting because they can form molecules with a high electric dipole moment which can increasethe cooling in collapsing protostellar structures.Aims. The purpose of this article is to analyze the formation of primordial molecules based on heavy elements during the Dark Ages,with elemental abundances taken from different nucleosynthesis models.Methods. We present calculations of the full non-linear equation setgoverning the primordial chemistry. We consider the evolutionof 45 chemical species and use an implicit multistep method of variable order of precision with an adaptive stepsize control.Results. For the first time the cosmological recombination of heavy elements is presented. We find that the most abundant DarkAges molecules based on heavy elements are CH and OH. When considering initial conditions given by the standard Big Bangnucleosynthesis model, we obtain relative abundances [CH]= nCH/nb = 6.2 × 10⁻²¹ and [OH] = nOH/nb = 1.2 × 10⁻²³ at z = 10,wherenb is the total number density. But non-standard nucleosynthesis can lead to higher heavy element abundances while stillsatisfying the observed primordial light abundances. In that case, we show that the abundances of molecular species based on C, N,O and F can be enhanced by two orders of magnitude, leading to aCH relative abundance higher than that of HD+ or H2D+.
Key words. Astrochemistry - Early Universe - Cosmology: theory
1. Introduction
The formation of light elements is a central problem of moderncosmology. Big Bang nucleosynthesis (BBN) provides an im-portant testing ground for the physics of the primordial Universe.The proceedings of nucleosynthesis are relatively well under-stood. Nucleosynthesis is connected with two important cosmo-logical events. The first one is the freeze-out, at T≈ 0.8 MeV,of the weak interactions which interconvert neutrons and pro-tons and thus setting the initial proton-to-neutron ratio for nu-cleosynthesis. The second event is the annihilation of thermale−-e+ pairs in the temperature range 1 MeV - 20 keV, delay-ing the onset of nucleosynthesis by releasing additional heat buteliminating the possibility of positron captures.
Thereafter, thermal fusion reactions in the plasma first pro-duce deuterium nuclei:
p+ n→ D + γ, (1)
and then helium (3He, 4He), lithium (7Li) and beryllium (7Be).Cosmological expansion plays a crucial role during the wholeprocess and determines the timescale for the nucleosynthesisduring the cooling of the Universe. Observations agree wellwiththe predicted abundances of the standard BBN model. See forexample Burles et al. (2001), but see also Steigman (2007) forthe latest observations (and in particular his Fig. 13).
Due to the proton-rich freeze-out from high temperature,standard BBN predicts the highest abundance for the nu-
cleus with the largest binding energy, which is4He. Beyond4He, charged particle reactions are inefficient due to the ris-ing Coulomb barrier and the small density. Therefore, only tinyamounts of heavier nuclei are produced in standard BBN, if any.However, a large number of extensions to the standard BBNhave been suggested, among which we find Non-Standard BigBang Nucleosynthesis (hereafter NSBBN) scenarios consider-ing density fluctuations in the early Universe. Some of thesemodels show increased abundances of heavy elements (see e.g.Dolgov & Silk 1993; Jedamzik et al. 1994; Rauscher et al. 1994;Khlopov & Kouvaris 2008 and references therein). The originalmotivation for such studies was to obtain an average baryon den-sity equal to the critical density for a flat universe and to si-multaneously satisfy the constraints given by primordial abun-dance observations. While this was shown to be unfeasible (andunnecessary), density fluctuations are present in the cosmic mi-crowave background. The density fluctuations affecting BBN areof different magnitude, though, but many different mechanismshave been suggested, acting during the inflationary phase, duringbaryogenesis or later. Thus, NSBBN with density fluctuationsremains an interesting model for obtaining primordial heavy el-ements.
During the recombination period the nuclei became progres-sively neutralized, which led to molecular formation. However,at early epochs, where a total absence of dust grains appearsjustified, the chemistry is different from the typical interstellarmedium astrochemistry.
2 P. Vonlanthen et al.: Chemistry of heavy elements in the Dark Ages
Several groups proposed an assembled, comprehensive set ofreactions for the early Universe (Lepp & Shull 1984; Puy et al.1993; Galli & Palla 1998; Stancil et al. 1998b; Signore & Puy1999; Lepp et al. 2002; Pfenniger & Puy 2003; Puy & Signore2007; Glover & Abel 2008; Glover & Savin 2009). The chemi-cal network is coupled with the matter and radiation tempera-tures and with the matter density. Primordial chemistry of heavynuclei has been poorly studied, although Lipovka et al. (2007)analyzed the possibility to detect rotational lines of primor-dial CH, and Puy et al. (2007) analyzed the possibility to formmolecular fluorine HF in the early Universe.
In this paper we will discuss the chemistry of eight elements(hydrogen, deuterium, helium, lithium, carbon, nitrogen,oxy-gen and fluorine) in the early Universe, for two different con-texts: the standard Big Bang nucleosynthesis model and non-standard nucleosynthesis based on baryon density fluctuations.Heavier elements are particularly interesting because they canform molecules with a high electric dipole moment. Even if theirabundances are proven to be quite low, they could still furnish aninteresting cooling agent in the gravitational collapse ofproto-structures, as molecular abundances are prone to drastic varia-tions in such environments. In Sect. 2, we summarize the stan-dard and non-standard BBN models we used and the predictedabundances. We describe and calculate, in Sect. 3, the mecha-nisms of recombination and primordial chemistry which act forthe eight elements H, D, He, Li, C, N, O and F. In Sect. 4 wediscuss our results.
2. Big Bang nucleosynthesis
2.1. Standard model of primordial nucleosynthesis
Standard BBN assumes a homogeneous baryon density through-out the expanding and cooling Universe. The abundance ratioofprotons and neutrons is set by the freeze-out of the weak in-teraction and subsequent decay of the neutrons until the onsetof nucleosynthesis. At initially high temperature a nuclear sta-tistical equilibrium is established, favoring the formation of thestrongly bound4He as soon as the photodisintegrations cease.All neutrons are consumed but a large fraction of protons re-mains because of the higher initial proton abundance. Due tothehigh entropy, i.e. low density, the triple-α reaction is inefficientand the formation of elements beyond He is suppressed. For thisreason, there are few accounts of standard BBN heavy elementabundances in literature.
Here, we will consider BBN results by Winteler (2007), ob-tained with a code based on a modified version of the Baselnetwork code. Modifications include a consistent evolutionoftemperature and density in the early universe, including weakfreeze-out, based on methods by Kawano (1992), and an im-proved reaction network with updated reaction rates, for de-tails see Winteler (2007). The abundances were calculated forη = 6.22 × 10⁻¹⁰, in accordance with the latest result of theWilkinson Microwave Anisotropy Probe (WMAP) experiment(Ωbh2 = 0.02273± 0.00062, givingη10 = 6.225± 0.170, seeDunkley et al. 2009). The weak freeze-out process was carefullyfollowed until the nucleosynthesis phase, thus setting theinitialneutron and proton abundances consistently. The first column ofTable 1 gives the relative abundances for this SBBN case. Hereand throughout this paper, we consider relative abundancesforspeciesξ such as:
[ξ] = nξ/nb, (2)
wherenξ is the number density of speciesξ andnb the total num-ber density. These values are the initial conditions for ourcalcu-lations of the Standard Big Bang Chemistry (hereafter SBBC).The relative abundances for the light nuclei H, D and He are inaccordance with the observational constraints (see Burleset al.2001; Cyburt et al. 2003; Steigman 2007), while lithium seemsto be more abundant than deduced from observations. Indeed,Steigman (2007) adopts the following primordial abundances1:(D/H)P = 2.68+0.27
−0.25×10⁻⁵, YP = 0.240±0.006 (< 0.251±0.002)and 12+ log(Li/H)P = 2.1 ± 0.1 (2.5 ± 0.1), while the valuesof first column of Table 1 give, after a straightforward calcula-tion: (D/H)P = 2.35× 10⁻⁵, YP = 0.246 and 12+ log(Li/H)P =
3.3. Let us note that lithium has been observed only in the ab-sorption spectra of very old, very metal-poor stars (PopulationII stars); they are considered as ideal for probing the primordialabundance of lithium. But lithium is a fragile nucleus whichiseasily destroyed in the interiors of stars. Therefore, if one ad-mits a large primordial value for lithium, one must also assumea large and uniforme depletion in stars, over a range of stellarmasses.
In Table 1 we also quote the amounts of the elements C to Fproduced in this standard BBN, as they are included in the SBBCcalculations.
Table 1. Relative abundances[
ξ]
= nξ/nb of the elements at theend of Big Bang nucleosynthesis for the SBBN and for two non-standard BBN scenarios.
SBBN NSBBN( fv = 0.8; R = 10)
(
fv = 10−5; R = 1000)
[H] 0.889 0.889 0.888[D] 2.092× 10⁻⁵ 2.45× 10⁻⁵ 2.13× 10⁻⁵
[He] 0.111 0.111 0.112[Li] 1 .77× 10−9 1.97× 10⁻⁹ 2.30× 10⁻⁹
[C] 2.51× 10⁻¹⁵ 4.00× 10⁻¹⁵ 8.45× 10⁻¹⁴
[N] 2.32× 10⁻¹⁶ 2.46× 10⁻¹⁶ 3.44× 10⁻¹⁴
[O] 3.22× 10⁻¹⁹ 3.37× 10⁻¹⁹ 8.20× 10⁻¹⁷
[F] 3.28× 10⁻²⁷ 3.61× 10⁻²⁷ 1.63× 10⁻²⁴
2.2. Non-Standard Big Bang Nucleosynthesis
While heavy elements are not produced at high levels inSBBN, BBN models assuming density fluctuations allow fordifferent baryon densitiesρ1,2,... in different zones, leading toaltered nucleosynthesis. A large number of possibilities forcreating small scale density perturbations in the very earlyUniverse have been suggested in literature (Affleck & Dine1985; Applegate & Hogan 1985; Malaney & Fowler 1988;Dolgov & Silk 1993; Matsuura et al. 2004; Khlopov & Kouvaris2008). Here, we are not focussing on a specific origin but justassume the occurrence of such fluctuations and use the geom-etry as open parameter. As customary, we apply a two-zonemodel where the densitiesρ1 andρ2 of the zones are given bythe density ratioR = ρ1/ρ2 = η
(1)/η(2), the volume fraction0 ≤ fv ≤ 1 of zone 1, and the additional constraint that theaveraged density has to reproduce the WMAP value (as in theSBBN): ηWMAP
10 = 6.22 = η(1) fv + η(2)(1 − fv). This leaves twoopen parameters,R and fv, but we are further limited by the ob-served primordial light abundances. Assuming that the Li abun-dance is only a weak constraint because of the complicated stel-
1 Alternative abundances for4He and7Li are written in parentheses.
P. Vonlanthen et al.: Chemistry of heavy elements in the DarkAges 3
lar depletion of Li, several regions in theR, fv-space remain al-lowed.
To study the impact of elevated levels of heavy nuclei, weused the same code by Winteler (2007) as for the SBBN butfollowed nucleosynthesis in zones promising for synthesizingheavy elements. Table 1 shows the results for two models, rep-resentative for two extreme cases. The abundances shown in thetable are already the final abundances, mixed from the two zonesin each model:
[
ξ]
=fvη(1) [ξ
](1)+ (1− fv)η(2) [ξ
](2)
ηWMAP10
. (3)
The first case (fv = 0.8, R = 10) is similar to the scenariostudied in Rauscher et al. (1994). The density ofρ1 has to stayclose to the globalηWMAP
10 , whileρ2 is ten times lower. FollowingRauscher et al. (1994), to maximize the production of heavy nu-clei we assume complete diffusion of the uncharged neutrons outof the high-density region. The electrically charged protons re-main trapped in that region because of their much shorter meanfree path. Therefore, baryon density inhomogeneities become lo-cal variations of the neutron-to-proton ratio, with free neutronsleft over in the low-density zone after the initial formation of4He. Neutron captures can then produce neutron-rich isotopes,allowing to bypass the slow triple-α reaction and leading toheavy elements. Our results are consistent with previous resultsfrom literature. When obtaining H, D,4He abundances close tothe observed ones, the7Li abundance becomes even higher thanin the standard model. At the same time, the heavy element abun-dances remain at low levels, only very slightly higher than for theSBBN. This was already pointed out in Rauscher et al. (1994),where it was also found that the light element constraints preventconsiderable formation of heavy nuclei.
The second case investigated here (fv = 10−5, R = 1000)comprises the other end of the allowed spectrum, tiny pocketsof extremely high density embedded in a background with al-most standard density. This is similar to the scenario originallyintroduced by Jedamzik et al. (1994) and later also discussed byMatsuura et al. (2004, 2005, 2007). In the high density pocketthe path to heavy elements is opened by an efficient triple-α re-action. At the same time, increased destruction of7Li keeps itsabundance low. This simultaneously allows to achieve lightel-ement abundances compatible with those of the SBBN and toincrease the heavy element production considerably. However,due to the small volume fraction of the high density zone (whichis necessary to obtain the proper global baryon density) thefinalheavy element abundances after complete mixing remain small,although two orders of magnitude higher than for the standardcase.
In the following, we will use the abundance values from bothNSBBN scenarios as initial conditions for our calculationsofthe Non-Standard Big Bang Chemistry (hereafter NSBBC1 andNSBBC2 respectively).
3. Dark Ages chemistry
3.1. Equations of evolution
The primordial gas is a mixture of hydrogen, deuterium, helium,lithium, . . . so there are many possibilities of reactions. Changein the number density of a given chemical species due to chem-ical reactions depends on the densities of the species involvedin these reactions and on the reaction rates, which themselvesdepend on the matter and radiation temperatures. But of course
cosmic expansion also plays a crucial role. Thus, it is necessaryto take into account the following set of differential equations(see for example Puy et al. 1993) in the context of the expandingUniverse, characterized by the scale factora:
dTr
dt= −
1a
dadt
Tr (4)
dTm
dt= −2
1a
dadt
Tm +83σTar
mecT 4
r (Tr − Tm)ne
nb− Tm
1nb
dnb
dt(5)
dnb
dt= −3
1a
dadt
nb −∑
ξ
(
dnξdt
)
chem
(6)
dnξdt= −3
1a
dadt
nξ +
(
dnξdt
)
chem
(7)
In these equations,Tr is the radiation temperature,Tm the gastemperature,nb the total number density andnξ the number den-sity of speciesξ. The right side of equation (4) and the firstterm of the right side of equation (5) represent the decreaseofTr andTm due to the expansion. The second term of the righthand side of (5) is the energy transfer from radiation to thegas via Compton diffusion of the CMB photons on the elec-trons (Kompaneets 1957; Peebles 1968). In this term,σT is theThomson cross section,ar the radiation constant,me the elec-tronic mass,c the speed of light andne the electron number den-sity. Note that we do not consider the energy transfer betweengas and radiation via molecular heating and cooling functions,since it has been shown that this contribution to the evolution ofthe gas temperature is negligible (Puy & Signore 1996, 1997). Inequations (6) and (7), the first term of the right hand side char-acterizes again the density decrease due to cosmic expansion,while the second term is the contribution of chemical reactions:(
dnξdt
)
chem
=∑
ξ1ξ2
kξ1ξ2nξ1nξ2 −∑
ξ′
kξξ′nξnξ′ . (8)
kξ1ξ2 is the rate of the reaction with reactantsξ1 andξ2.This system of ordinary differential equations governing
the chemical abundances is stiff. We use an implicit multi-step method of variable order of precision with an adaptivestepsize control. This method has excellent stability proper-ties and is widely used for solving chemical kinetic problems(Hindmarsh & Petzold 1995). We solve the set of equation (4)to (7) from the initial redshiftzinit = 104, when the Universewas still totally ionized, to the final redshiftzend= 10 (about theepoch of reionization).
Moreover, we consider the standardΛCDM model, withHubble parameterH0 = 71 km s−1 Mpc−1, total matter den-sityΩm = 0.27 (including dark matter densityΩDM = 0.226 andbaryon densityΩb = 0.044) and dark energy densityΩΛ = 0.73(Komatsu et al. 2009).
3.2. Cosmological recombination
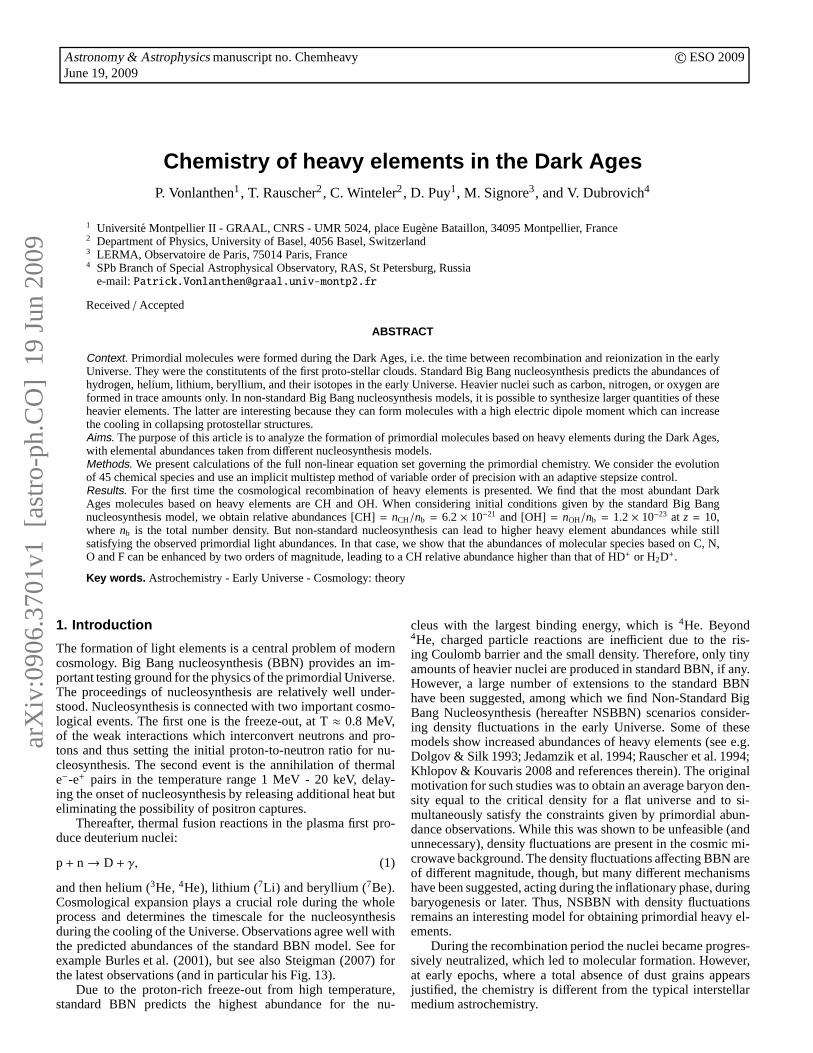
Primordial chemistry begins with the appearance of the firstneu-tral species. Once a neutral species is formed, charge transferswith ions become efficient and lead to the formation of otherneutral species and then molecular ions. Figure 1 shows the evo-lution of the chemical abundances during the successive peri-ods of recombination for the light elements H, D, He and Liin the standard model. Helium nuclei are the first to recombinebecause of their high electronic binding energy2. The recom-
2 New results on the complex helium and hydrogen recombinationsare given in Fendt et al. (2009) (see also references therein).
4 P. Vonlanthen et al.: Chemistry of heavy elements in the Dark Ages
100010000z
10-4
10-3
10-2
0.1
1
10
Rel
ativ
e ab
unda
nces
101001000 10000z
10-18
10-17
10-16
10-15
10-14
10-13
10-12
10-11
10-10
10-9
10-8
10-7
10-6
10-5
10-4
Rel
ativ
e ab
unda
nces
HH
+
HeHe+
He2+
DD+
Li
Li+
Li2+
Li3+
Fig. 1. Successive cosmological recombination for hydrogen,deuterium, helium and lithium in the standard model of primor-dial chemistry.
bination and photoionization rates for H and D are taken fromAbel et al. (1997). We use the rates of Galli & Palla (1998) forHe and for the reactions Li+ + e− ↔ Li + γ. Higher lithium re-combinations and photoionisations are treated with the recombi-nation rates of Verner et al. (1996) and the photoionisationcrosssections of Verner & Ferland (1996). The recombination patternfor the two non-standard cases NSBBC1 and NSBBC2 are verysimilar, since the initial abundances of H, D, He and Li are al-most identical to the SBBC model. We define the recombina-tion redshiftzrec as the redshift when the abundance of a givenspecies equals the one of its corresponding ion. Table 2 summa-rizes the different recombination redshifts for the standard cal-culation. Due to its low ionization energy and to the fact thatcharge transfer reactions between lithium and hydrogen remainactive, lithium does not recombine totally, and both neutral andionized Li tend to match their abundances (see Fig. 1).
Table 2. Recombination redshifts for hydrogen, deuterium andhelium.
SBBCzrec (He+) 6102zrec (He) 2604zrec (H) = zrec (D) 1425
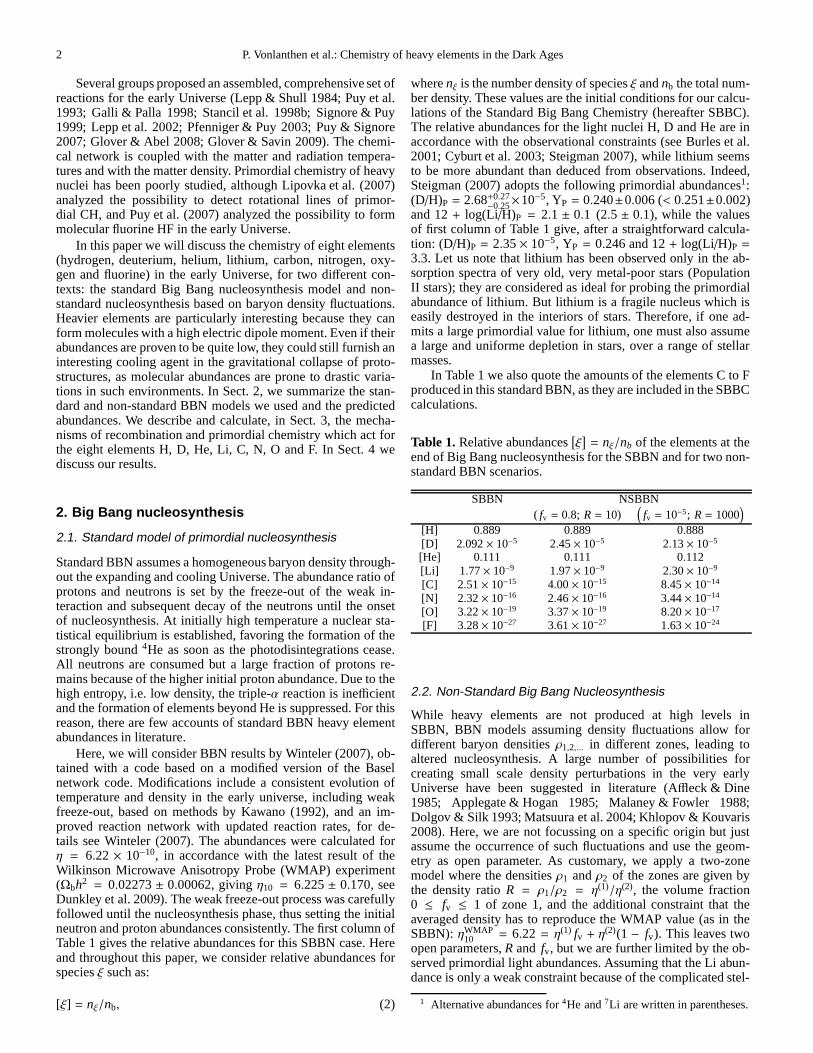
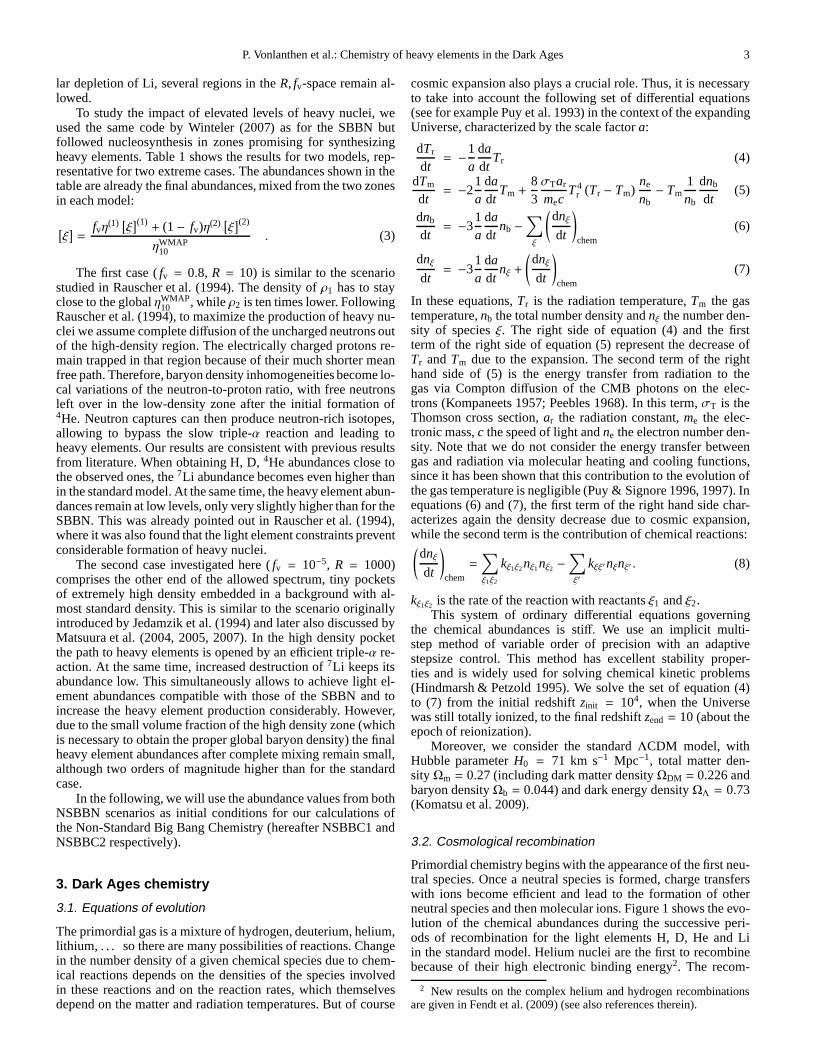
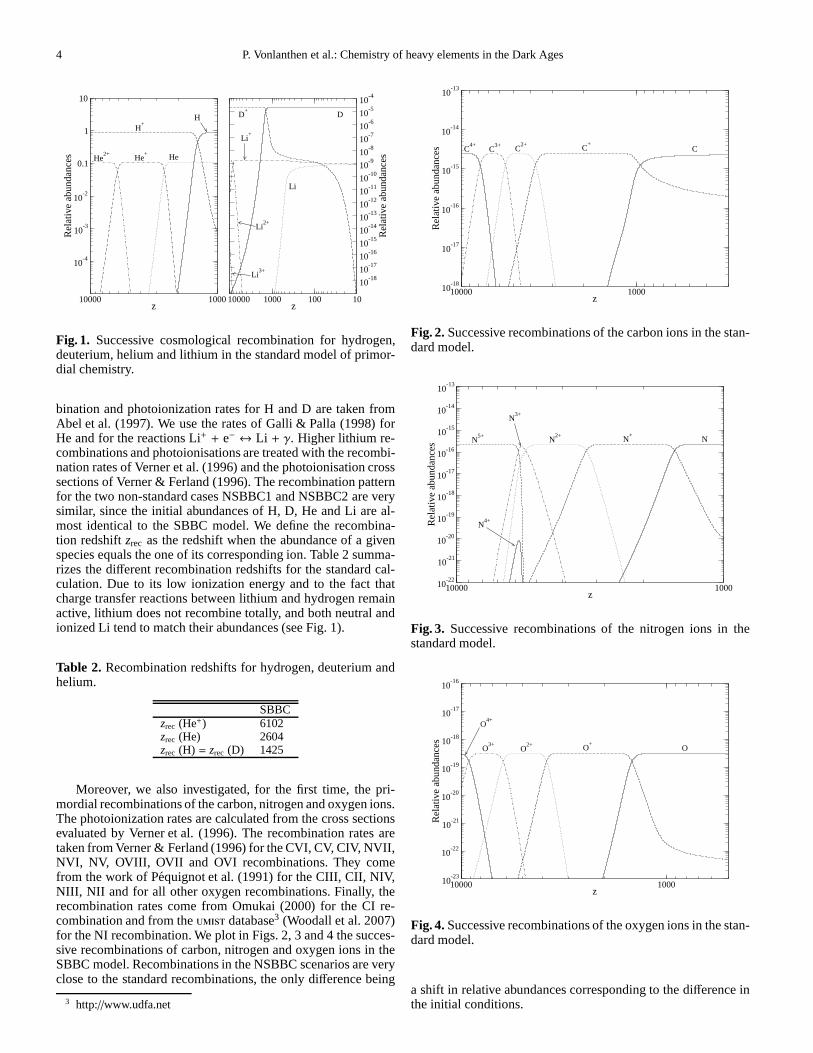
Moreover, we also investigated, for the first time, the pri-mordial recombinations of the carbon, nitrogen and oxygen ions.The photoionization rates are calculated from the cross sectionsevaluated by Verner et al. (1996). The recombination rates aretaken from Verner & Ferland (1996) for the CVI, CV, CIV, NVII,NVI, NV, OVIII, OVII and OVI recombinations. They comefrom the work of Pequignot et al. (1991) for the CIII, CII, NIV,NIII, NII and for all other oxygen recombinations. Finally,therecombination rates come from Omukai (2000) for the CI re-combination and from theumist database3 (Woodall et al. 2007)for the NI recombination. We plot in Figs. 2, 3 and 4 the succes-sive recombinations of carbon, nitrogen and oxygen ions in theSBBC model. Recombinations in the NSBBC scenarios are veryclose to the standard recombinations, the only difference being
3 http://www.udfa.net
100010000z
10-18
10-17
10-16
10-15
10-14
10-13
Rel
ativ
e ab
unda
nces
CC+
C2+
C3+C
4+
Fig. 2. Successive recombinations of the carbon ions in the stan-dard model.
100010000z
10-22
10-21
10-20
10-19
10-18
10-17
10-16
10-15
10-14
10-13
Rel
ativ
e ab
unda
nces NN
+N
2+
N3+
N4+
N5+
Fig. 3. Successive recombinations of the nitrogen ions in thestandard model.
100010000z
10-23
10-22
10-21
10-20
10-19
10-18
10-17
10-16
Rel
ativ
e ab
unda
nces
OO+
O2+O
3+
O4+
Fig. 4. Successive recombinations of the oxygen ions in the stan-dard model.
a shift in relative abundances corresponding to the difference inthe initial conditions.

P. Vonlanthen et al.: Chemistry of heavy elements in the DarkAges 5
Since the ionization potential of carbon (IC = 11.26 eV) issmaller than that of hydrogen (IH=13.6 eV), C+ recombinationoccurs later than H+ recombination. Figure 2 shows that carbonis singly ionized at the beginning of the primordial chemistry.We conclude that it is not necessary to compute all the succes-sive recombinations when calculating the evolution of the car-bon species. Thus, we will consider that all the carbon ions arepresent as C+ at zinit = 104. For similar arguments drawn fromFigs. 3 and 4, we will start our calculations of the primordialchemistry of nitrogen and oxygen with the singly ionized nitro-gen and oxygen ions atzinit .
3.3. Molecular formation
After hydrogen recombination, the decrease of the electrondensity leads to the inefficiency of thermal coupling betweenmatter and radiation. The chemical processes occuring duringthis post-recombination period are essentially collisional (ion-izations, radiative recombinations, attachments, etc.) and ra-diative, due to the active presence of the CMB photons. Thechemical network leads gradually to the formation of the firstmolecules in the Universe (Lepp & Shull 1984; Puy et al. 1993;Stancil et al. 1998b; Galli & Palla 1998; Signore & Puy 1999;Lepp et al. 2002; Pfenniger & Puy 2003; Puy & Signore 2007;Glover & Abel 2008; Glover & Savin 2009).
In this section, we will consider the primordial chemistry ofhydrogen, deuterium, helium, lithium, carbon, nitrogen, oxygenand fluorine in the SBBN and NSBBN contexts. We list in theAppendix the sets of reactions that we consider.
3.3.1. Hydrogen
The cosmological production of H2 molecules proceeds mainlythrough two mechanisms which are catalyzed by H− and H+2(Saslaw & Zipoy 1967; Peebles & Dicke 1968). It is generallyconsidered that the H+2 mechanism produces molecular hydro-gen atz ∼ 300, while the H− mechanism is responsible for theH2 peak atz ∼ 100.
The reaction rates we consider for hydrogen are taken fromGalli & Palla (1998), except for the recombination and pho-toionization rates H1 and H2 (Abel et al. 1997), and for the re-action H4 (H− + γ→ H + e−). For that reaction, we consider theimportant correction described in Hirata & Padmanabhan (2006)that takes into account the effects of the non-thermal radiationemitted during hydrogen recombination.
Figure 5 shows the evolution of the hydrogen chemistry inthe standard model. The amount of H2 molecules created duringthe Dark Ages is important and converge to the following val-ues atz = 10: [H2]SBBC = nH2/nb = 2.7×10⁻⁷. The effect of thecorrection of Hirata & Padmanabhan (2006) is shown on Fig. 5.The enhancement of the rate H4 is responsible for the efficientdestruction of H− via photodetachment. As a consequence, thecontribution of the H− channel to the final amount of molecularhydrogen is strongly reduced atz ≈ 100 and the value of thestandard final abundance is lower than the values usually seen inthe literature (about a factor 4). Table 3 gives the abundances atredshiftsz = 1000,z = 100 andz = 10. The initial relative abun-dance of hydrogen is very close in our three chemistry modelsSBBC, NSBBC1 and NSBBC2 (see Table 1), as is the case fordeuterium, helium and to some extent lithium. For that reasonwe only show the results of the standard chemistry calculationfor these four light elements.
10100100010000z
10-20
10-19
10-18
10-17
10-16
10-15
10-14
10-13
10-12
10-11
10-10
10-9
10-8
10-7
10-6
10-5
10-4
10-3
10-2
0.11
10
Rel
ativ
e ab
unda
nces
HH+
H- H
2
H2
+
H3
+
Fig. 5. Standard primordial chemistry of hydrogen species. Thedotted lines for H2, H− and H+3 show the abundances we wouldobtain without the correction of Hirata & Padmanabhan (2006)relative to the radiation emitted during the hydrogen recombina-tion.
Table 3. Relative abundancesnξ/nb of hydrogen species at red-shiftsz = 1000,z = 100 andz = 10 in the SBBC model.
SBBCSpecies z = 1000 z = 100 z = 10[H] 0.888 0.889 0.889[H+] 8.5× 10⁻⁴ 7.6× 10⁻⁵ 5.8× 10⁻⁵
[H−] 5.7× 10⁻²¹ 2.5× 10⁻¹⁵ 7.2× 10⁻¹⁴
[H2] 1.2× 10⁻¹³ 1.7× 10⁻⁷ 2.7× 10⁻⁷
[H2+] 7.7×10⁻²⁰ 2.7× 10⁻¹⁴ 6.7× 10⁻¹⁴
[H3+] 3.0×10⁻²² 8.7× 10⁻¹⁷ 8.4× 10⁻¹⁸
3.3.2. Deuterium
We take the reaction rates for deuterium chemistry fromGalli & Palla (1998), except for the recombination and pho-toionization rates D1 and D2 (Abel et al. 1997), which are thesame as H1 and H2 (see Appendix A). Figure 6 and Table 4 showthe evolution of the deuterium chemistry. The fact that the abun-dance of molecular hydrogen is reduced compared to the usualvalue of the literature has a direct implication on the HD quan-tity. Indeed, reactions D6 and D8 are the most important for-mation channels of HD. These reactions are collisions betweenneutral or charged D with H2. As a consequence, the standardfinal amount of HD molecules is also lower (by a factor of 2)than the canonical value and we get [HD]SBBC= 1.3× 10⁻¹⁰.
Table 4. Relative abundancesnξ/nb of deuterium species at red-shiftsz = 1000,z = 100 andz = 10 in the SBBC model.
SBBCSpecies z = 1000 z = 100 z = 10[D] 2.1× 10⁻⁵ 2.1× 10⁻⁵ 2.1× 10⁻⁵
[D+] 2.0× 10⁻⁸ 1.3× 10⁻⁹ 2.0× 10⁻²¹
[HD] 7.4× 10⁻¹⁸ 7.7× 10⁻¹¹ 1.3× 10⁻¹⁰
[HD+] 1.8× 10⁻²⁴ 6.9× 10⁻¹⁹ 4.6× 10⁻²⁰
[H2D+] 2.1× 10⁻²⁷ 3.8× 10⁻²⁰ 4.7× 10⁻²⁰
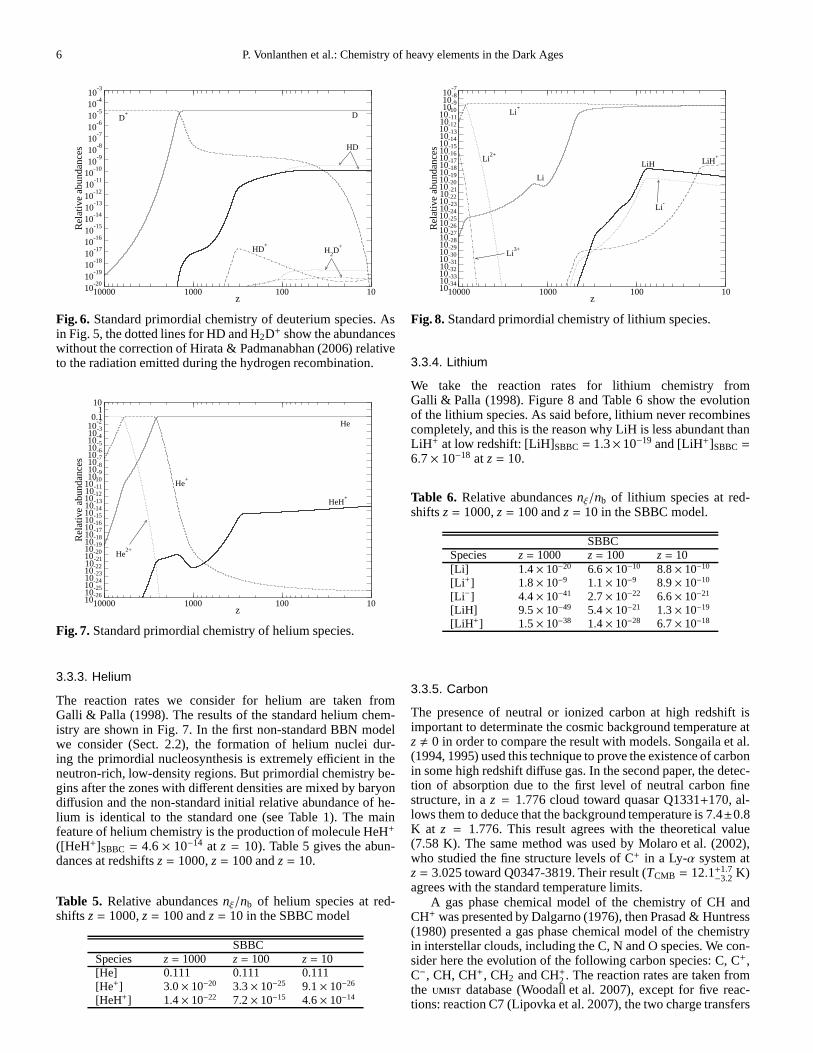
6 P. Vonlanthen et al.: Chemistry of heavy elements in the Dark Ages
10100100010000z
10-20
10-19
10-18
10-17
10-16
10-15
10-14
10-13
10-12
10-11
10-10
10-9
10-8
10-7
10-6
10-5
10-4
10-3
Rel
ativ
e ab
unda
nces
DD+
HD
HD+
H2D
+
Fig. 6. Standard primordial chemistry of deuterium species. Asin Fig. 5, the dotted lines for HD and H2D+ show the abundanceswithout the correction of Hirata & Padmanabhan (2006) relativeto the radiation emitted during the hydrogen recombination.
10100100010000z
10-2610-2510-2410-2310-2210-2110-2010-1910-1810-1710-1610-1510-1410-1310-1210-1110-1010-910-810-710-610-510-410-310-2
0.11
10
Rel
ativ
e ab
unda
nces
He
He+
He2+
HeH+
Fig. 7. Standard primordial chemistry of helium species.
3.3.3. Helium
The reaction rates we consider for helium are taken fromGalli & Palla (1998). The results of the standard helium chem-istry are shown in Fig. 7. In the first non-standard BBN modelwe consider (Sect. 2.2), the formation of helium nuclei dur-ing the primordial nucleosynthesis is extremely efficient in theneutron-rich, low-density regions. But primordial chemistry be-gins after the zones with different densities are mixed by baryondiffusion and the non-standard initial relative abundance of he-lium is identical to the standard one (see Table 1). The mainfeature of helium chemistry is the production of molecule HeH+
([HeH+]SBBC = 4.6 × 10⁻¹⁴ at z = 10). Table 5 gives the abun-dances at redshiftsz = 1000,z = 100 andz = 10.
Table 5. Relative abundancesnξ/nb of helium species at red-shiftsz = 1000,z = 100 andz = 10 in the SBBC model
SBBCSpecies z = 1000 z = 100 z = 10[He] 0.111 0.111 0.111[He+] 3.0× 10⁻²⁰ 3.3× 10⁻²⁵ 9.1× 10⁻²⁶
[HeH+] 1.4× 10⁻²² 7.2× 10⁻¹⁵ 4.6× 10⁻¹⁴
10100100010000z
10-3410-3310-3210-3110-3010-2910-2810-2710-2610-2510-2410-2310-2210-2110-2010-1910-1810-1710-1610-1510-1410-1310-1210-1110-1010-910-810-7
Rel
ativ
e ab
unda
nces
Li
Li+
Li-
LiH LiH+Li
2+
Li3+
Fig. 8. Standard primordial chemistry of lithium species.
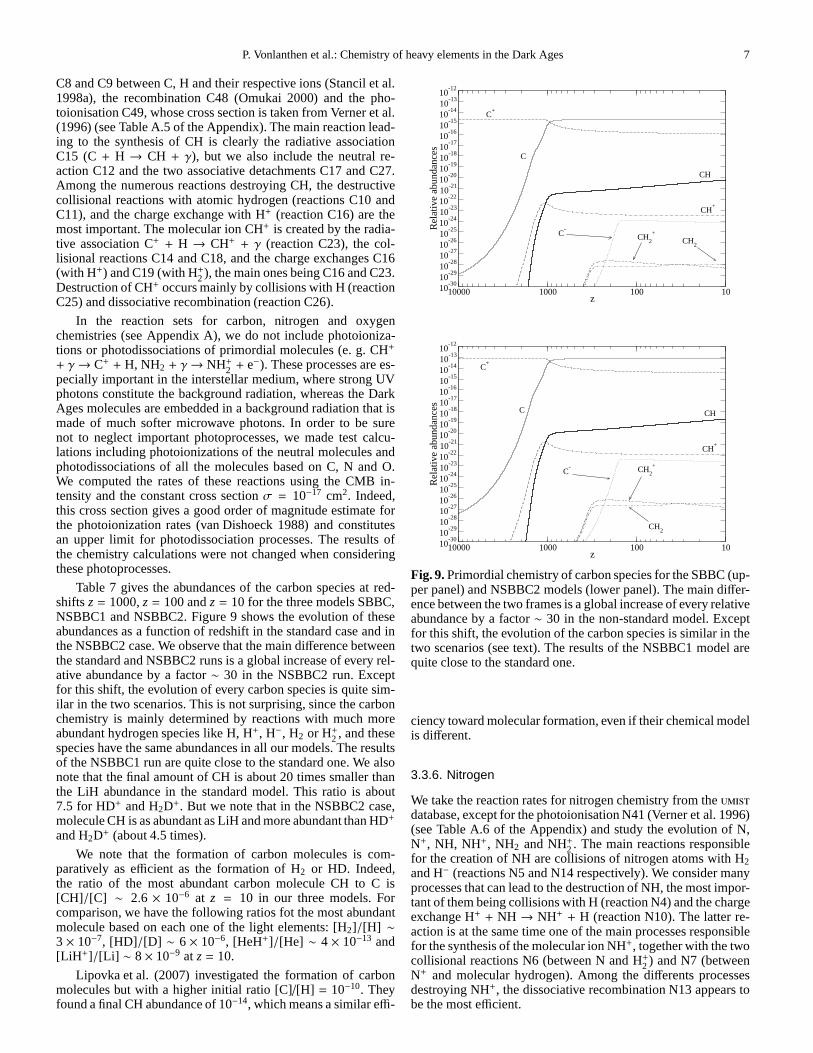
3.3.4. Lithium
We take the reaction rates for lithium chemistry fromGalli & Palla (1998). Figure 8 and Table 6 show the evolutionof the lithium species. As said before, lithium never recombinescompletely, and this is the reason why LiH is less abundant thanLiH+ at low redshift: [LiH]SBBC= 1.3×10⁻¹⁹ and [LiH+]SBBC=
6.7× 10⁻¹⁸ at z = 10.
Table 6. Relative abundancesnξ/nb of lithium species at red-shiftsz = 1000,z = 100 andz = 10 in the SBBC model.
SBBCSpecies z = 1000 z = 100 z = 10[Li] 1 .4× 10−20 6.6× 10⁻¹⁰ 8.8× 10⁻¹⁰
[Li +] 1.8× 10⁻⁹ 1.1× 10⁻⁹ 8.9× 10⁻¹⁰
[Li −] 4.4× 10−41 2.7× 10⁻²² 6.6× 10⁻²¹
[LiH] 9 .5× 10−49 5.4× 10⁻²¹ 1.3× 10⁻¹⁹
[LiH +] 1.5× 10−38 1.4× 10⁻²⁸ 6.7× 10⁻¹⁸
3.3.5. Carbon
The presence of neutral or ionized carbon at high redshift isimportant to determinate the cosmic background temperature atz , 0 in order to compare the result with models. Songaila et al.(1994, 1995) used this technique to prove the existence of carbonin some high redshift diffuse gas. In the second paper, the detec-tion of absorption due to the first level of neutral carbon finestructure, in az = 1.776 cloud toward quasar Q1331+170, al-lows them to deduce that the background temperature is 7.4±0.8K at z = 1.776. This result agrees with the theoretical value(7.58 K). The same method was used by Molaro et al. (2002),who studied the fine structure levels of C+ in a Ly-α system atz = 3.025 toward Q0347-3819. Their result (TCMB = 12.1+1.7
−3.2 K)agrees with the standard temperature limits.
A gas phase chemical model of the chemistry of CH andCH+ was presented by Dalgarno (1976), then Prasad & Huntress(1980) presented a gas phase chemical model of the chemistryin interstellar clouds, including the C, N and O species. We con-sider here the evolution of the following carbon species: C,C+,C−, CH, CH+, CH2 and CH+2 . The reaction rates are taken fromthe umist database (Woodall et al. 2007), except for five reac-tions: reaction C7 (Lipovka et al. 2007), the two charge transfers
P. Vonlanthen et al.: Chemistry of heavy elements in the DarkAges 7
C8 and C9 between C, H and their respective ions (Stancil et al.1998a), the recombination C48 (Omukai 2000) and the pho-toionisation C49, whose cross section is taken from Verner et al.(1996) (see Table A.5 of the Appendix). The main reaction lead-ing to the synthesis of CH is clearly the radiative associationC15 (C+ H → CH + γ), but we also include the neutral re-action C12 and the two associative detachments C17 and C27.Among the numerous reactions destroying CH, the destructivecollisional reactions with atomic hydrogen (reactions C10andC11), and the charge exchange with H+ (reaction C16) are themost important. The molecular ion CH+ is created by the radia-tive association C+ + H → CH+ + γ (reaction C23), the col-lisional reactions C14 and C18, and the charge exchanges C16(with H+) and C19 (with H+2 ), the main ones being C16 and C23.Destruction of CH+ occurs mainly by collisions with H (reactionC25) and dissociative recombination (reaction C26).
In the reaction sets for carbon, nitrogen and oxygenchemistries (see Appendix A), we do not include photoioniza-tions or photodissociations of primordial molecules (e. g.CH+
+ γ→ C+ + H, NH2 + γ→ NH+2 + e−). These processes are es-pecially important in the interstellar medium, where strong UVphotons constitute the background radiation, whereas the DarkAges molecules are embedded in a background radiation that ismade of much softer microwave photons. In order to be surenot to neglect important photoprocesses, we made test calcu-lations including photoionizations of the neutral molecules andphotodissociations of all the molecules based on C, N and O.We computed the rates of these reactions using the CMB in-tensity and the constant cross sectionσ = 10−17 cm2. Indeed,this cross section gives a good order of magnitude estimate forthe photoionization rates (van Dishoeck 1988) and constitutesan upper limit for photodissociation processes. The results ofthe chemistry calculations were not changed when consideringthese photoprocesses.
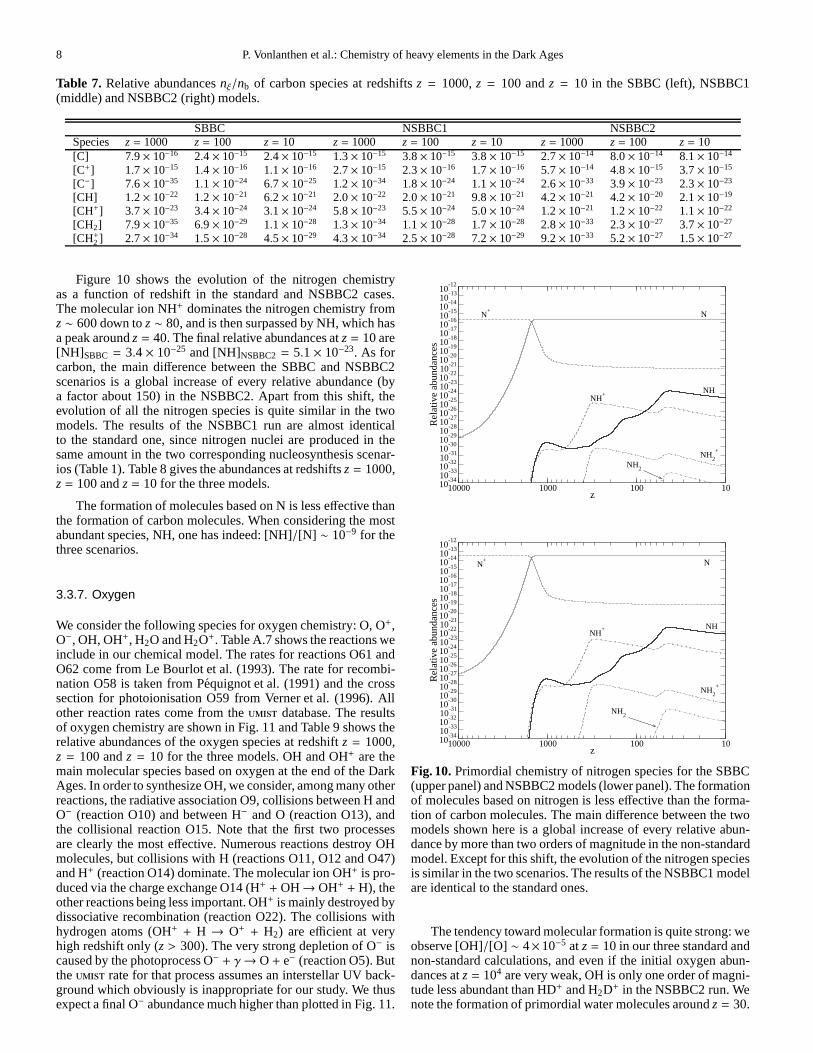
Table 7 gives the abundances of the carbon species at red-shiftsz = 1000,z = 100 andz = 10 for the three models SBBC,NSBBC1 and NSBBC2. Figure 9 shows the evolution of theseabundances as a function of redshift in the standard case andinthe NSBBC2 case. We observe that the main difference betweenthe standard and NSBBC2 runs is a global increase of every rel-ative abundance by a factor∼ 30 in the NSBBC2 run. Exceptfor this shift, the evolution of every carbon species is quite sim-ilar in the two scenarios. This is not surprising, since the carbonchemistry is mainly determined by reactions with much moreabundant hydrogen species like H, H+, H−, H2 or H+2 , and thesespecies have the same abundances in all our models. The resultsof the NSBBC1 run are quite close to the standard one. We alsonote that the final amount of CH is about 20 times smaller thanthe LiH abundance in the standard model. This ratio is about7.5 for HD+ and H2D+. But we note that in the NSBBC2 case,molecule CH is as abundant as LiH and more abundant than HD+
and H2D+ (about 4.5 times).
We note that the formation of carbon molecules is com-paratively as efficient as the formation of H2 or HD. Indeed,the ratio of the most abundant carbon molecule CH to C is[CH]/[C] ∼ 2.6 × 10⁻⁶ at z = 10 in our three models. Forcomparison, we have the following ratios fot the most abundantmolecule based on each one of the light elements: [H2]/[H] ∼3× 10⁻⁷, [HD]/[D] ∼ 6× 10⁻⁶, [HeH+]/[He] ∼ 4× 10⁻¹³ and[LiH +]/[Li] ∼ 8× 10⁻⁹ at z = 10.
Lipovka et al. (2007) investigated the formation of carbonmolecules but with a higher initial ratio [C]/[H] = 10−10. Theyfound a final CH abundance of 10−14, which means a similar effi-
10100100010000z
10-30
10-29
10-28
10-27
10-26
10-25
10-24
10-23
10-22
10-21
10-20
10-19
10-18
10-17
10-16
10-15
10-14
10-13
10-12
Rel
ativ
e ab
unda
nces
C
C+
C-
CH
CH+
CH2
CH2
+
10100100010000z
10-30
10-29
10-28
10-27
10-26
10-25
10-24
10-23
10-22
10-21
10-20
10-19
10-18
10-17
10-16
10-15
10-14
10-13
10-12
Rel
ativ
e ab
unda
nces
C
C+
C-
CH
CH+
CH2
CH2
+
Fig. 9. Primordial chemistry of carbon species for the SBBC (up-per panel) and NSBBC2 models (lower panel). The main differ-ence between the two frames is a global increase of every relativeabundance by a factor∼ 30 in the non-standard model. Exceptfor this shift, the evolution of the carbon species is similar in thetwo scenarios (see text). The results of the NSBBC1 model arequite close to the standard one.
ciency toward molecular formation, even if their chemical modelis different.
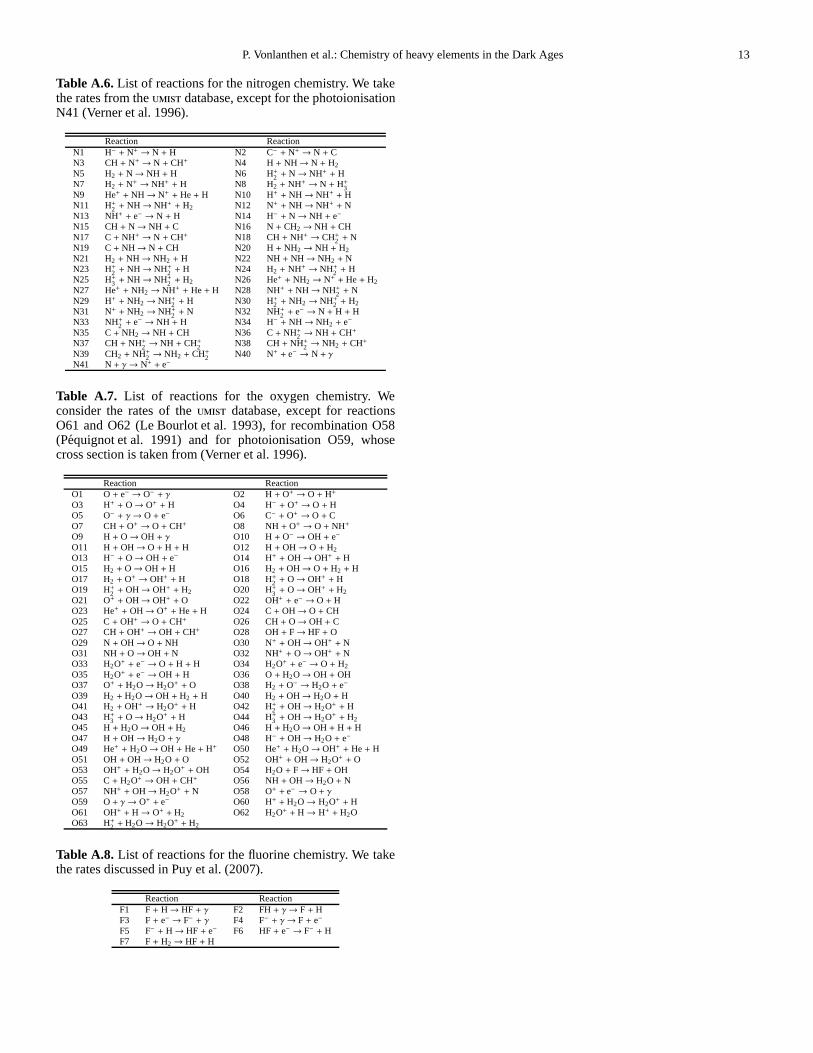
3.3.6. Nitrogen
We take the reaction rates for nitrogen chemistry from theumistdatabase, except for the photoionisation N41 (Verner et al.1996)(see Table A.6 of the Appendix) and study the evolution of N,N+, NH, NH+, NH2 and NH+2 . The main reactions responsiblefor the creation of NH are collisions of nitrogen atoms with H2and H− (reactions N5 and N14 respectively). We consider manyprocesses that can lead to the destruction of NH, the most impor-tant of them being collisions with H (reaction N4) and the chargeexchange H+ + NH → NH+ + H (reaction N10). The latter re-action is at the same time one of the main processes responsiblefor the synthesis of the molecular ion NH+, together with the twocollisional reactions N6 (between N and H+2 ) and N7 (betweenN+ and molecular hydrogen). Among the differents processesdestroying NH+, the dissociative recombination N13 appears tobe the most efficient.
8 P. Vonlanthen et al.: Chemistry of heavy elements in the Dark Ages
Table 7. Relative abundancesnξ/nb of carbon species at redshiftsz = 1000,z = 100 andz = 10 in the SBBC (left), NSBBC1(middle) and NSBBC2 (right) models.
SBBC NSBBC1 NSBBC2Species z = 1000 z = 100 z = 10 z = 1000 z = 100 z = 10 z = 1000 z = 100 z = 10[C] 7.9× 10⁻¹⁶ 2.4× 10⁻¹⁵ 2.4× 10⁻¹⁵ 1.3× 10⁻¹⁵ 3.8× 10⁻¹⁵ 3.8× 10⁻¹⁵ 2.7× 10⁻¹⁴ 8.0× 10⁻¹⁴ 8.1× 10⁻¹⁴
[C+] 1.7× 10⁻¹⁵ 1.4× 10⁻¹⁶ 1.1× 10⁻¹⁶ 2.7× 10⁻¹⁵ 2.3× 10⁻¹⁶ 1.7× 10⁻¹⁶ 5.7× 10⁻¹⁴ 4.8× 10⁻¹⁵ 3.7× 10⁻¹⁵
[C−] 7.6× 10⁻³⁵ 1.1× 10⁻²⁴ 6.7× 10⁻²⁵ 1.2× 10⁻³⁴ 1.8× 10⁻²⁴ 1.1× 10⁻²⁴ 2.6× 10⁻³³ 3.9× 10⁻²³ 2.3× 10⁻²³
[CH] 1.2× 10⁻²² 1.2× 10⁻²¹ 6.2× 10⁻²¹ 2.0× 10⁻²² 2.0× 10⁻²¹ 9.8× 10⁻²¹ 4.2× 10⁻²¹ 4.2× 10⁻²⁰ 2.1× 10⁻¹⁹
[CH+] 3.7× 10⁻²³ 3.4× 10⁻²⁴ 3.1× 10⁻²⁴ 5.8× 10⁻²³ 5.5× 10⁻²⁴ 5.0× 10⁻²⁴ 1.2× 10⁻²¹ 1.2× 10⁻²² 1.1× 10⁻²²
[CH2] 7.9× 10⁻³⁵ 6.9× 10⁻²⁹ 1.1× 10⁻²⁸ 1.3× 10⁻³⁴ 1.1× 10⁻²⁸ 1.7× 10⁻²⁸ 2.8× 10⁻³³ 2.3× 10⁻²⁷ 3.7× 10⁻²⁷
[CH+2 ] 2.7× 10⁻³⁴ 1.5× 10⁻²⁸ 4.5× 10⁻²⁹ 4.3× 10⁻³⁴ 2.5× 10⁻²⁸ 7.2× 10⁻²⁹ 9.2× 10⁻³³ 5.2× 10⁻²⁷ 1.5× 10⁻²⁷
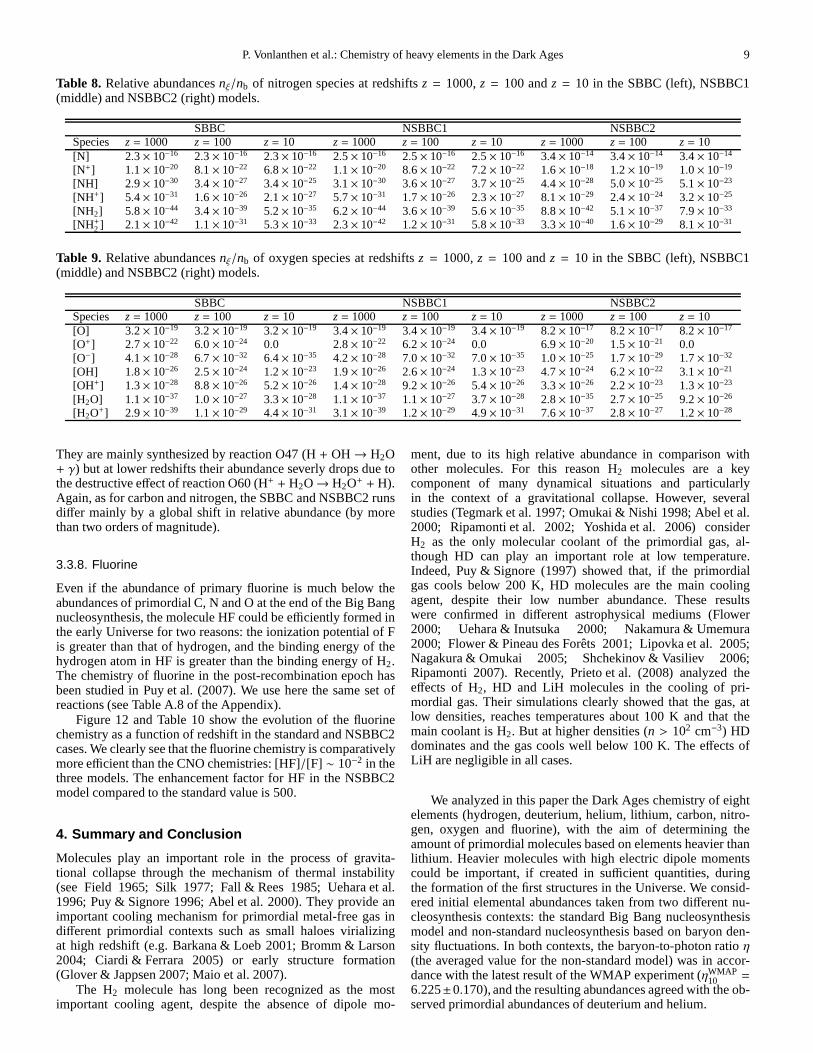
Figure 10 shows the evolution of the nitrogen chemistryas a function of redshift in the standard and NSBBC2 cases.The molecular ion NH+ dominates the nitrogen chemistry fromz ∼ 600 down toz ∼ 80, and is then surpassed by NH, which hasa peak aroundz = 40. The final relative abundances atz = 10 are[NH]SBBC = 3.4× 10⁻²⁵ and [NH]NSBBC2 = 5.1× 10⁻²³. As forcarbon, the main difference between the SBBC and NSBBC2scenarios is a global increase of every relative abundance (bya factor about 150) in the NSBBC2. Apart from this shift, theevolution of all the nitrogen species is quite similar in thetwomodels. The results of the NSBBC1 run are almost identicalto the standard one, since nitrogen nuclei are produced in thesame amount in the two corresponding nucleosynthesis scenar-ios (Table 1). Table 8 gives the abundances at redshiftsz = 1000,z = 100 andz = 10 for the three models.
The formation of molecules based on N is less effective thanthe formation of carbon molecules. When considering the mostabundant species, NH, one has indeed: [NH]/[N] ∼ 10−9 for thethree scenarios.
3.3.7. Oxygen
We consider the following species for oxygen chemistry: O, O+,O−, OH, OH+, H2O and H2O+. Table A.7 shows the reactions weinclude in our chemical model. The rates for reactions O61 andO62 come from Le Bourlot et al. (1993). The rate for recombi-nation O58 is taken from Pequignot et al. (1991) and the crosssection for photoionisation O59 from Verner et al. (1996). Allother reaction rates come from theumist database. The resultsof oxygen chemistry are shown in Fig. 11 and Table 9 shows therelative abundances of the oxygen species at redshiftz = 1000,z = 100 andz = 10 for the three models. OH and OH+ are themain molecular species based on oxygen at the end of the DarkAges. In order to synthesize OH, we consider, among many otherreactions, the radiative association O9, collisions between H andO− (reaction O10) and between H− and O (reaction O13), andthe collisional reaction O15. Note that the first two processesare clearly the most effective. Numerous reactions destroy OHmolecules, but collisions with H (reactions O11, O12 and O47)and H+ (reaction O14) dominate. The molecular ion OH+ is pro-duced via the charge exchange O14 (H+ +OH→OH+ + H), theother reactions being less important. OH+ is mainly destroyed bydissociative recombination (reaction O22). The collisions withhydrogen atoms (OH+ + H → O+ + H2) are efficient at veryhigh redshift only (z > 300). The very strong depletion of O− iscaused by the photoprocess O− + γ→O+ e− (reaction O5). Buttheumist rate for that process assumes an interstellar UV back-ground which obviously is inappropriate for our study. We thusexpect a final O− abundance much higher than plotted in Fig. 11.
10100100010000z
10-34
10-33
10-32
10-31
10-30
10-29
10-28
10-27
10-26
10-25
10-24
10-23
10-22
10-21
10-20
10-19
10-18
10-1710-16
10-15
10-14
10-13
10-12
Rel
ativ
e ab
unda
nces
NN+
NHNH
+
NH2
NH2
+
10100100010000z
10-34
10-33
10-32
10-31
10-30
10-29
10-28
10-27
10-26
10-25
10-24
10-23
10-22
10-21
10-20
10-19
10-18
10-1710-16
10-15
10-14
10-13
10-12
Rel
ativ
e ab
unda
nces
NN+
NHNH
+
NH2
NH2
+
Fig. 10. Primordial chemistry of nitrogen species for the SBBC(upper panel) and NSBBC2 models (lower panel). The formationof molecules based on nitrogen is less effective than the forma-tion of carbon molecules. The main difference between the twomodels shown here is a global increase of every relative abun-dance by more than two orders of magnitude in the non-standardmodel. Except for this shift, the evolution of the nitrogen speciesis similar in the two scenarios. The results of the NSBBC1 modelare identical to the standard ones.
The tendency toward molecular formation is quite strong: weobserve [OH]/[O] ∼ 4×10⁻⁵ atz = 10 in our three standard andnon-standard calculations, and even if the initial oxygen abun-dances atz = 104 are very weak, OH is only one order of magni-tude less abundant than HD+ and H2D+ in the NSBBC2 run. Wenote the formation of primordial water molecules aroundz = 30.
P. Vonlanthen et al.: Chemistry of heavy elements in the DarkAges 9
Table 8. Relative abundancesnξ/nb of nitrogen species at redshiftsz = 1000,z = 100 andz = 10 in the SBBC (left), NSBBC1(middle) and NSBBC2 (right) models.
SBBC NSBBC1 NSBBC2Species z = 1000 z = 100 z = 10 z = 1000 z = 100 z = 10 z = 1000 z = 100 z = 10[N] 2.3× 10⁻¹⁶ 2.3× 10⁻¹⁶ 2.3× 10⁻¹⁶ 2.5× 10⁻¹⁶ 2.5× 10⁻¹⁶ 2.5× 10⁻¹⁶ 3.4× 10⁻¹⁴ 3.4× 10⁻¹⁴ 3.4× 10⁻¹⁴
[N+] 1.1× 10⁻²⁰ 8.1× 10⁻²² 6.8× 10⁻²² 1.1× 10⁻²⁰ 8.6× 10⁻²² 7.2× 10⁻²² 1.6× 10⁻¹⁸ 1.2× 10⁻¹⁹ 1.0× 10⁻¹⁹
[NH] 2.9× 10⁻³⁰ 3.4× 10⁻²⁷ 3.4× 10⁻²⁵ 3.1× 10⁻³⁰ 3.6× 10⁻²⁷ 3.7× 10⁻²⁵ 4.4× 10⁻²⁸ 5.0× 10⁻²⁵ 5.1× 10⁻²³
[NH+] 5.4× 10⁻³¹ 1.6× 10⁻²⁶ 2.1× 10⁻²⁷ 5.7× 10⁻³¹ 1.7× 10⁻²⁶ 2.3× 10⁻²⁷ 8.1× 10⁻²⁹ 2.4× 10⁻²⁴ 3.2× 10⁻²⁵
[NH2] 5.8× 10−44 3.4× 10−39 5.2× 10⁻³⁵ 6.2× 10−44 3.6× 10−39 5.6× 10⁻³⁵ 8.8× 10−42 5.1× 10−37 7.9× 10⁻³³
[NH+2 ] 2.1× 10−42 1.1× 10⁻³¹ 5.3× 10⁻³³ 2.3× 10−42 1.2× 10⁻³¹ 5.8× 10⁻³³ 3.3× 10−40 1.6× 10⁻²⁹ 8.1× 10⁻³¹
Table 9. Relative abundancesnξ/nb of oxygen species at redshiftsz = 1000,z = 100 andz = 10 in the SBBC (left), NSBBC1(middle) and NSBBC2 (right) models.
SBBC NSBBC1 NSBBC2Species z = 1000 z = 100 z = 10 z = 1000 z = 100 z = 10 z = 1000 z = 100 z = 10[O] 3.2× 10⁻¹⁹ 3.2× 10⁻¹⁹ 3.2× 10⁻¹⁹ 3.4× 10⁻¹⁹ 3.4× 10⁻¹⁹ 3.4× 10⁻¹⁹ 8.2× 10⁻¹⁷ 8.2× 10⁻¹⁷ 8.2× 10⁻¹⁷
[O+] 2.7× 10⁻²² 6.0× 10⁻²⁴ 0.0 2.8× 10⁻²² 6.2× 10⁻²⁴ 0.0 6.9× 10⁻²⁰ 1.5× 10⁻²¹ 0.0[O−] 4.1× 10⁻²⁸ 6.7× 10⁻³² 6.4× 10⁻³⁵ 4.2× 10⁻²⁸ 7.0× 10⁻³² 7.0× 10⁻³⁵ 1.0× 10⁻²⁵ 1.7× 10⁻²⁹ 1.7× 10⁻³²
[OH] 1.8× 10⁻²⁶ 2.5× 10⁻²⁴ 1.2× 10⁻²³ 1.9× 10⁻²⁶ 2.6× 10⁻²⁴ 1.3× 10⁻²³ 4.7× 10⁻²⁴ 6.2× 10⁻²² 3.1× 10⁻²¹
[OH+] 1.3× 10⁻²⁸ 8.8× 10⁻²⁶ 5.2× 10⁻²⁶ 1.4× 10⁻²⁸ 9.2× 10⁻²⁶ 5.4× 10⁻²⁶ 3.3× 10⁻²⁶ 2.2× 10⁻²³ 1.3× 10⁻²³
[H2O] 1.1× 10−37 1.0× 10⁻²⁷ 3.3× 10⁻²⁸ 1.1× 10−37 1.1× 10⁻²⁷ 3.7× 10⁻²⁸ 2.8× 10⁻³⁵ 2.7× 10⁻²⁵ 9.2× 10⁻²⁶
[H2O+] 2.9× 10−39 1.1× 10⁻²⁹ 4.4× 10⁻³¹ 3.1× 10−39 1.2× 10⁻²⁹ 4.9× 10⁻³¹ 7.6× 10−37 2.8× 10⁻²⁷ 1.2× 10⁻²⁸
They are mainly synthesized by reaction O47 (H+ OH→ H2O+ γ) but at lower redshifts their abundance severly drops due tothe destructive effect of reaction O60 (H+ + H2O→ H2O+ + H).Again, as for carbon and nitrogen, the SBBC and NSBBC2 runsdiffer mainly by a global shift in relative abundance (by morethan two orders of magnitude).
3.3.8. Fluorine
Even if the abundance of primary fluorine is much below theabundances of primordial C, N and O at the end of the Big Bangnucleosynthesis, the molecule HF could be efficiently formed inthe early Universe for two reasons: the ionization potential of Fis greater than that of hydrogen, and the binding energy of thehydrogen atom in HF is greater than the binding energy of H2.The chemistry of fluorine in the post-recombination epoch hasbeen studied in Puy et al. (2007). We use here the same set ofreactions (see Table A.8 of the Appendix).
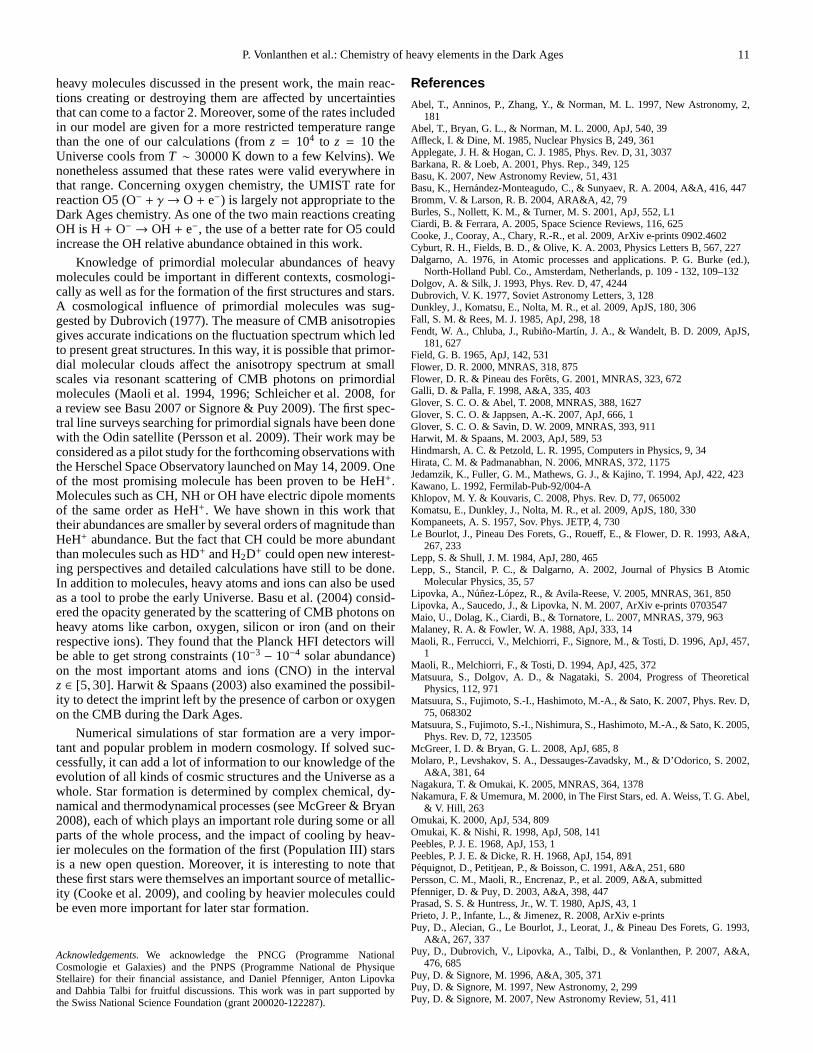
Figure 12 and Table 10 show the evolution of the fluorinechemistry as a function of redshift in the standard and NSBBC2cases. We clearly see that the fluorine chemistry is comparativelymore efficient than the CNO chemistries: [HF]/[F] ∼ 10−2 in thethree models. The enhancement factor for HF in the NSBBC2model compared to the standard value is 500.
4. Summary and Conclusion
Molecules play an important role in the process of gravita-tional collapse through the mechanism of thermal instability(see Field 1965; Silk 1977; Fall & Rees 1985; Uehara et al.1996; Puy & Signore 1996; Abel et al. 2000). They provide animportant cooling mechanism for primordial metal-free gasindifferent primordial contexts such as small haloes virializingat high redshift (e.g. Barkana & Loeb 2001; Bromm & Larson2004; Ciardi & Ferrara 2005) or early structure formation(Glover & Jappsen 2007; Maio et al. 2007).
The H2 molecule has long been recognized as the mostimportant cooling agent, despite the absence of dipole mo-
ment, due to its high relative abundance in comparison withother molecules. For this reason H2 molecules are a keycomponent of many dynamical situations and particularlyin the context of a gravitational collapse. However, severalstudies (Tegmark et al. 1997; Omukai & Nishi 1998; Abel et al.2000; Ripamonti et al. 2002; Yoshida et al. 2006) considerH2 as the only molecular coolant of the primordial gas, al-though HD can play an important role at low temperature.Indeed, Puy & Signore (1997) showed that, if the primordialgas cools below 200 K, HD molecules are the main coolingagent, despite their low number abundance. These resultswere confirmed in different astrophysical mediums (Flower2000; Uehara & Inutsuka 2000; Nakamura & Umemura2000; Flower & Pineau des Forets 2001; Lipovka et al. 2005;Nagakura & Omukai 2005; Shchekinov & Vasiliev 2006;Ripamonti 2007). Recently, Prieto et al. (2008) analyzed theeffects of H2, HD and LiH molecules in the cooling of pri-mordial gas. Their simulations clearly showed that the gas,atlow densities, reaches temperatures about 100 K and that themain coolant is H2. But at higher densities (n > 102 cm−3) HDdominates and the gas cools well below 100 K. The effects ofLiH are negligible in all cases.
We analyzed in this paper the Dark Ages chemistry of eightelements (hydrogen, deuterium, helium, lithium, carbon, nitro-gen, oxygen and fluorine), with the aim of determining theamount of primordial molecules based on elements heavier thanlithium. Heavier molecules with high electric dipole momentscould be important, if created in sufficient quantities, duringthe formation of the first structures in the Universe. We consid-ered initial elemental abundances taken from two different nu-cleosynthesis contexts: the standard Big Bang nucleosynthesismodel and non-standard nucleosynthesis based on baryon den-sity fluctuations. In both contexts, the baryon-to-photon ratio η(the averaged value for the non-standard model) was in accor-dance with the latest result of the WMAP experiment (ηWMAP
10 =
6.225±0.170), and the resulting abundances agreed with the ob-served primordial abundances of deuterium and helium.
10 P. Vonlanthen et al.: Chemistry of heavy elements in the Dark Ages
Table 10. Relative abundancesnξ/nb of fluorine species at redshiftsz = 1000,z = 100 andz = 10 in the SBBC (left), NSBBC1(middle) and NSBBC2 (right) models.
SBBC NSBBC1 NSBBC2Species z = 1000 z = 100 z = 10 z = 1000 z = 100 z = 10 z = 1000 z = 100 z = 10[F] 3.3× 10⁻²⁷ 3.2× 10⁻²⁷ 3.2× 10⁻²⁷ 3.6× 10⁻²⁷ 3.6× 10⁻²⁷ 3.6× 10⁻²⁷ 1.6× 10⁻²⁴ 1.6× 10⁻²⁴ 1.6× 10⁻²⁴
[F−] 2.6× 10−44 1.7× 10−36 1.3× 10−36 2.9× 10−44 1.9× 10−36 1.5× 10−36 1.3× 10−41 8.6× 10⁻³⁴ 6.6× 10⁻³⁴
[HF] 7.8× 10⁻³² 3.2× 10⁻²⁹ 3.5× 10⁻²⁹ 9.1× 10⁻³² 3.5× 10⁻²⁹ 3.8× 10⁻²⁹ 4.1× 10⁻²⁹ 1.6× 10⁻²⁶ 1.7× 10⁻²⁶
10100100010000z
10-34
10-33
10-32
10-31
10-30
10-29
10-28
10-27
10-26
10-25
10-24
10-23
10-22
10-21
10-20
10-19
10-18
10-17
10-16
10-15
Rel
ativ
e ab
unda
nces
OO+
O-
OHOH
+
H2O
H2O
+
10100100010000z
10-34
10-33
10-32
10-31
10-30
10-29
10-28
10-27
10-26
10-25
10-24
10-23
10-22
10-21
10-20
10-19
10-18
10-17
10-16
10-15
Rel
ativ
e ab
unda
nces
OO+
O-
OHOH
+
H2O
H2O
+
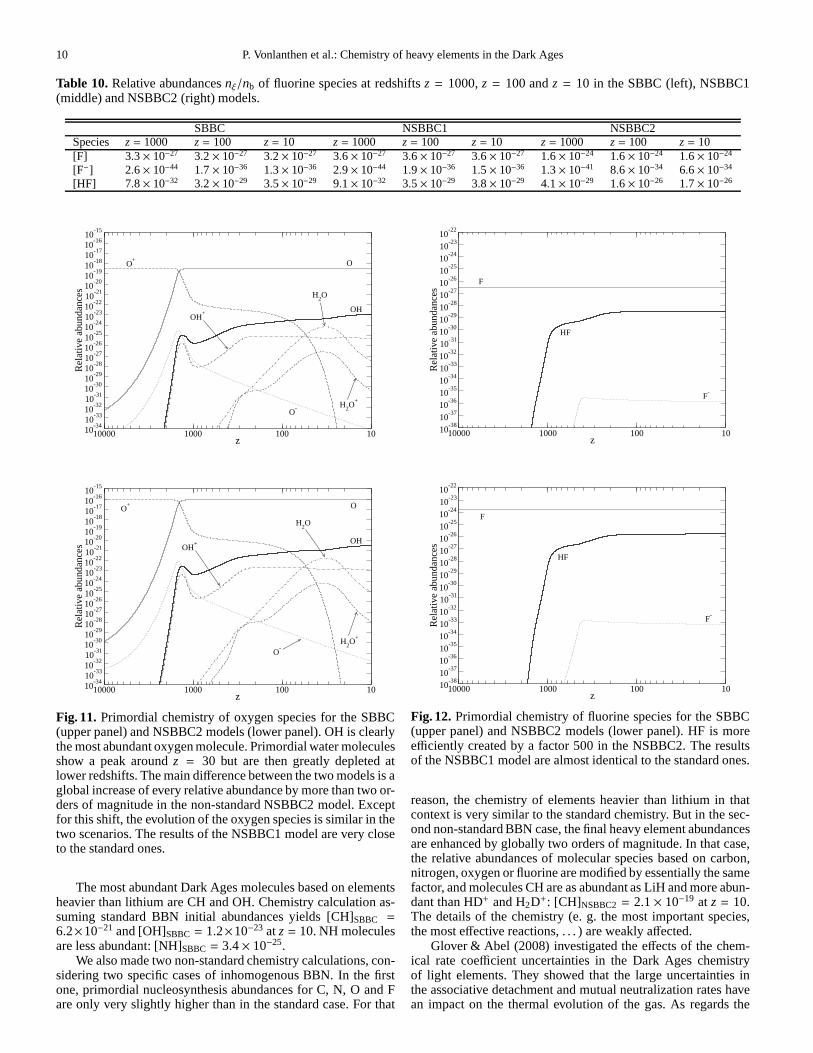
Fig. 11. Primordial chemistry of oxygen species for the SBBC(upper panel) and NSBBC2 models (lower panel). OH is clearlythe most abundant oxygen molecule. Primordial water moleculesshow a peak aroundz = 30 but are then greatly depleted atlower redshifts. The main difference between the two models is aglobal increase of every relative abundance by more than twoor-ders of magnitude in the non-standard NSBBC2 model. Exceptfor this shift, the evolution of the oxygen species is similar in thetwo scenarios. The results of the NSBBC1 model are very closeto the standard ones.
The most abundant Dark Ages molecules based on elementsheavier than lithium are CH and OH. Chemistry calculation as-suming standard BBN initial abundances yields [CH]SBBC =
6.2×10⁻²¹ and [OH]SBBC = 1.2×10⁻²³ atz = 10. NH moleculesare less abundant: [NH]SBBC = 3.4× 10⁻²⁵.
We also made two non-standard chemistry calculations, con-sidering two specific cases of inhomogenous BBN. In the firstone, primordial nucleosynthesis abundances for C, N, O and Fare only very slightly higher than in the standard case. For that
10100100010000z
10-38
10-37
10-36
10-35
10-34
10-33
10-32
10-31
10-30
10-29
10-28
10-27
10-26
10-25
10-24
10-23
10-22
Rel
ativ
e ab
unda
nces F
F-
HF
10100100010000z
10-38
10-37
10-36
10-35
10-34
10-33
10-32
10-31
10-30
10-29
10-28
10-27
10-26
10-25
10-24
10-23
10-22
Rel
ativ
e ab
unda
nces
F
F-
HF
Fig. 12. Primordial chemistry of fluorine species for the SBBC(upper panel) and NSBBC2 models (lower panel). HF is moreefficiently created by a factor 500 in the NSBBC2. The resultsof the NSBBC1 model are almost identical to the standard ones.
reason, the chemistry of elements heavier than lithium in thatcontext is very similar to the standard chemistry. But in thesec-ond non-standard BBN case, the final heavy element abundancesare enhanced by globally two orders of magnitude. In that case,the relative abundances of molecular species based on carbon,nitrogen, oxygen or fluorine are modified by essentially the samefactor, and molecules CH are as abundant as LiH and more abun-dant than HD+ and H2D+: [CH]NSBBC2 = 2.1× 10⁻¹⁹ at z = 10.The details of the chemistry (e. g. the most important species,the most effective reactions, . . . ) are weakly affected.
Glover & Abel (2008) investigated the effects of the chem-ical rate coefficient uncertainties in the Dark Ages chemistryof light elements. They showed that the large uncertaintiesinthe associative detachment and mutual neutralization rates havean impact on the thermal evolution of the gas. As regards the
P. Vonlanthen et al.: Chemistry of heavy elements in the DarkAges 11
heavy molecules discussed in the present work, the main reac-tions creating or destroying them are affected by uncertaintiesthat can come to a factor 2. Moreover, some of the rates includedin our model are given for a more restricted temperature rangethan the one of our calculations (fromz = 104 to z = 10 theUniverse cools fromT ∼ 30000 K down to a few Kelvins). Wenonetheless assumed that these rates were valid everywhereinthat range. Concerning oxygen chemistry, the UMIST rate forreaction O5 (O− + γ→ O + e−) is largely not appropriate to theDark Ages chemistry. As one of the two main reactions creatingOH is H+ O− → OH + e−, the use of a better rate for O5 couldincrease the OH relative abundance obtained in this work.
Knowledge of primordial molecular abundances of heavymolecules could be important in different contexts, cosmologi-cally as well as for the formation of the first structures and stars.A cosmological influence of primordial molecules was sug-gested by Dubrovich (1977). The measure of CMB anisotropiesgives accurate indications on the fluctuation spectrum which ledto present great structures. In this way, it is possible thatprimor-dial molecular clouds affect the anisotropy spectrum at smallscales via resonant scattering of CMB photons on primordialmolecules (Maoli et al. 1994, 1996; Schleicher et al. 2008, fora review see Basu 2007 or Signore & Puy 2009). The first spec-tral line surveys searching for primordial signals have been donewith the Odin satellite (Persson et al. 2009). Their work maybeconsidered as a pilot study for the forthcoming observations withthe Herschel Space Observatory launched on May 14, 2009. Oneof the most promising molecule has been proven to be HeH+.Molecules such as CH, NH or OH have electric dipole momentsof the same order as HeH+. We have shown in this work thattheir abundances are smaller by several orders of magnitudethanHeH+ abundance. But the fact that CH could be more abundantthan molecules such as HD+ and H2D+ could open new interest-ing perspectives and detailed calculations have still to bedone.In addition to molecules, heavy atoms and ions can also be usedas a tool to probe the early Universe. Basu et al. (2004) consid-ered the opacity generated by the scattering of CMB photons onheavy atoms like carbon, oxygen, silicon or iron (and on theirrespective ions). They found that the Planck HFI detectors willbe able to get strong constraints (10−3 − 10−4 solar abundance)on the most important atoms and ions (CNO) in the intervalz ∈ [5, 30]. Harwit & Spaans (2003) also examined the possibil-ity to detect the imprint left by the presence of carbon or oxygenon the CMB during the Dark Ages.
Numerical simulations of star formation are a very impor-tant and popular problem in modern cosmology. If solved suc-cessfully, it can add a lot of information to our knowledge oftheevolution of all kinds of cosmic structures and the Universeas awhole. Star formation is determined by complex chemical, dy-namical and thermodynamical processes (see McGreer & Bryan2008), each of which plays an important role during some or allparts of the whole process, and the impact of cooling by heav-ier molecules on the formation of the first (Population III) starsis a new open question. Moreover, it is interesting to note thatthese first stars were themselves an important source of metallic-ity (Cooke et al. 2009), and cooling by heavier molecules couldbe even more important for later star formation.
Acknowledgements. We acknowledge the PNCG (Programme NationalCosmologie et Galaxies) and the PNPS (Programme National dePhysiqueStellaire) for their financial assistance, and Daniel Pfenniger, Anton Lipovkaand Dahbia Talbi for fruitful discussions. This work was in part supported bythe Swiss National Science Foundation (grant 200020-122287).
ReferencesAbel, T., Anninos, P., Zhang, Y., & Norman, M. L. 1997, New Astronomy, 2,
181Abel, T., Bryan, G. L., & Norman, M. L. 2000, ApJ, 540, 39Affleck, I. & Dine, M. 1985, Nuclear Physics B, 249, 361Applegate, J. H. & Hogan, C. J. 1985, Phys. Rev. D, 31, 3037Barkana, R. & Loeb, A. 2001, Phys. Rep., 349, 125Basu, K. 2007, New Astronomy Review, 51, 431Basu, K., Hernandez-Monteagudo, C., & Sunyaev, R. A. 2004,A&A, 416, 447Bromm, V. & Larson, R. B. 2004, ARA&A, 42, 79Burles, S., Nollett, K. M., & Turner, M. S. 2001, ApJ, 552, L1Ciardi, B. & Ferrara, A. 2005, Space Science Reviews, 116, 625Cooke, J., Cooray, A., Chary, R.-R., et al. 2009, ArXiv e-prints 0902.4602Cyburt, R. H., Fields, B. D., & Olive, K. A. 2003, Physics Letters B, 567, 227Dalgarno, A. 1976, in Atomic processes and applications. P.G. Burke (ed.),
North-Holland Publ. Co., Amsterdam, Netherlands, p. 109 - 132, 109–132Dolgov, A. & Silk, J. 1993, Phys. Rev. D, 47, 4244Dubrovich, V. K. 1977, Soviet Astronomy Letters, 3, 128Dunkley, J., Komatsu, E., Nolta, M. R., et al. 2009, ApJS, 180, 306Fall, S. M. & Rees, M. J. 1985, ApJ, 298, 18Fendt, W. A., Chluba, J., Rubino-Martın, J. A., & Wandelt,B. D. 2009, ApJS,
181, 627Field, G. B. 1965, ApJ, 142, 531Flower, D. R. 2000, MNRAS, 318, 875Flower, D. R. & Pineau des Forets, G. 2001, MNRAS, 323, 672Galli, D. & Palla, F. 1998, A&A, 335, 403Glover, S. C. O. & Abel, T. 2008, MNRAS, 388, 1627Glover, S. C. O. & Jappsen, A.-K. 2007, ApJ, 666, 1Glover, S. C. O. & Savin, D. W. 2009, MNRAS, 393, 911Harwit, M. & Spaans, M. 2003, ApJ, 589, 53Hindmarsh, A. C. & Petzold, L. R. 1995, Computers in Physics,9, 34Hirata, C. M. & Padmanabhan, N. 2006, MNRAS, 372, 1175Jedamzik, K., Fuller, G. M., Mathews, G. J., & Kajino, T. 1994, ApJ, 422, 423Kawano, L. 1992, Fermilab-Pub-92/004-AKhlopov, M. Y. & Kouvaris, C. 2008, Phys. Rev. D, 77, 065002Komatsu, E., Dunkley, J., Nolta, M. R., et al. 2009, ApJS, 180, 330Kompaneets, A. S. 1957, Sov. Phys. JETP, 4, 730Le Bourlot, J., Pineau Des Forets, G., Roueff, E., & Flower, D. R. 1993, A&A,
267, 233Lepp, S. & Shull, J. M. 1984, ApJ, 280, 465Lepp, S., Stancil, P. C., & Dalgarno, A. 2002, Journal of Physics B Atomic
Molecular Physics, 35, 57Lipovka, A., Nunez-Lopez, R., & Avila-Reese, V. 2005, MNRAS, 361, 850Lipovka, A., Saucedo, J., & Lipovka, N. M. 2007, ArXiv e-prints 0703547Maio, U., Dolag, K., Ciardi, B., & Tornatore, L. 2007, MNRAS,379, 963Malaney, R. A. & Fowler, W. A. 1988, ApJ, 333, 14Maoli, R., Ferrucci, V., Melchiorri, F., Signore, M., & Tosti, D. 1996, ApJ, 457,
1Maoli, R., Melchiorri, F., & Tosti, D. 1994, ApJ, 425, 372Matsuura, S., Dolgov, A. D., & Nagataki, S. 2004, Progress ofTheoretical
Physics, 112, 971Matsuura, S., Fujimoto, S.-I., Hashimoto, M.-A., & Sato, K.2007, Phys. Rev. D,
75, 068302Matsuura, S., Fujimoto, S.-I., Nishimura, S., Hashimoto, M.-A., & Sato, K. 2005,
Phys. Rev. D, 72, 123505McGreer, I. D. & Bryan, G. L. 2008, ApJ, 685, 8Molaro, P., Levshakov, S. A., Dessauges-Zavadsky, M., & D’Odorico, S. 2002,
A&A, 381, 64Nagakura, T. & Omukai, K. 2005, MNRAS, 364, 1378Nakamura, F. & Umemura, M. 2000, in The First Stars, ed. A. Weiss, T. G. Abel,
& V. Hill, 263Omukai, K. 2000, ApJ, 534, 809Omukai, K. & Nishi, R. 1998, ApJ, 508, 141Peebles, P. J. E. 1968, ApJ, 153, 1Peebles, P. J. E. & Dicke, R. H. 1968, ApJ, 154, 891Pequignot, D., Petitjean, P., & Boisson, C. 1991, A&A, 251,680Persson, C. M., Maoli, R., Encrenaz, P., et al. 2009, A&A, submittedPfenniger, D. & Puy, D. 2003, A&A, 398, 447Prasad, S. S. & Huntress, Jr., W. T. 1980, ApJS, 43, 1Prieto, J. P., Infante, L., & Jimenez, R. 2008, ArXiv e-printsPuy, D., Alecian, G., Le Bourlot, J., Leorat, J., & Pineau DesForets, G. 1993,
A&A, 267, 337Puy, D., Dubrovich, V., Lipovka, A., Talbi, D., & Vonlanthen, P. 2007, A&A,
476, 685Puy, D. & Signore, M. 1996, A&A, 305, 371Puy, D. & Signore, M. 1997, New Astronomy, 2, 299Puy, D. & Signore, M. 2007, New Astronomy Review, 51, 411

12 P. Vonlanthen et al.: Chemistry of heavy elements in the Dark Ages
Rauscher, T., Applegate, J. H., Cowan, J. J., Thielemann, F.-K., & Wiescher, M.1994, ApJ, 429, 499
Ripamonti, E. 2007, MNRAS, 376, 709Ripamonti, E., Haardt, F., Ferrara, A., & Colpi, M. 2002, MNRAS, 334, 401Saslaw, W. C. & Zipoy, D. 1967, Nature, 216, 976Schleicher, D. R. G., Galli, D., Palla, F., et al. 2008, A&A, 490, 521Shchekinov, Y. A. & Vasiliev, E. O. 2006, MNRAS, 368, 454Signore, M. & Puy, D. 1999, New Astronomy Review, 43, 185Signore, M. & Puy, D. 2009, European Physical Journal C, 59, 117Silk, J. 1977, ApJ, 211, 638Songaila, A., Cowie, L. L., Vogt, S., et al. 1994, Nature, 371, 43Songaila, A., Hu, E. M., & Cowie, L. L. 1995, Nature, 375, 124Stancil, P. C., Havener, C. C., Krstic, P. S., et al. 1998a, ApJ, 502, 1006Stancil, P. C., Lepp, S., & Dalgarno, A. 1998b, ApJ, 509, 1Steigman, G. 2007, Annual Review of Nuclear and Particle Science, 57, 463Tegmark, M., Silk, J., Rees, M. J., et al. 1997, ApJ, 474, 1Uehara, H. & Inutsuka, S.-i. 2000, ApJ, 531, L91Uehara, H., Susa, H., Nishi, R., Yamada, M., & Nakamura, T. 1996, ApJ, 473,
L95van Dishoeck, E. F. 1988, in Rate coefficients in astrochemistry, ed. Dordrecht
and Norwell, MA, Kluwer Academic Publishers, 49–72Verner, D. A. & Ferland, G. J. 1996, ApJS, 103, 467Verner, D. A., Ferland, G. J., Korista, K. T., & Yakovlev, D. G. 1996, ApJ, 465,
487Winteler, C. 2007, Master thesis, University of Basel, SwitzerlandWoodall, J., Agundez, M., Markwick-Kemper, A. J., & Millar, T. J. 2007, A&A,
466, 1197Yoshida, N., Omukai, K., Hernquist, L., & Abel, T. 2006, ApJ,652, 6
Appendix A: Reaction rates for thepost-recombination chemistry
We list in Tables A.1 to A.8 the chemical reactions consideredin our calculations.
Table A.1. List of reactions for the hydrogen chemistry. Therates are taken from Galli & Palla (1998), except for the recom-bination and photoionization rates H1 and H2 (Abel et al. 1997),and for reaction H4 (Hirata & Padmanabhan 2006).
Reaction ReactionH1 H+ + e− → H + γ H2 H+ γ → H+ + e−
H3 H+ e− → H− + γ H4 H− + γ → H + e−
H5 H− + H→ H2 + e− H6 H− + H+ → H+2 + e−
H7 H− + H+ → H + H H8 H+ H+ → H+2 + γH9 H+2 + γ → H +H+ H10 H+2 + H→ H2 + H+
H11 H+2 + e− → H + H H12 H+2 + γ → H+ + H+ + e−
H13 H+2 + H2 → H+3 + H H15 H2 + H+ → H+2 + HH16 H2 + e− → H + H− H17 H2 + e− → H +H + e−
H18 H2 + γ → H+2 + e− H19 H+3 + H→ H+2 + H2
H20 H+3 + e− → H2 + H H21 H2 + H+ → H+3 + γ
Table A.2. List of reactions for the deuterium chemistry. We takethe rates from Galli & Palla (1998), except for the recombinationand photoionization rates D1 and D2, which are the same as H1and H2 (Abel et al. 1997).
Reaction ReactionD1 D+ + e− → D + γ D2 D+ γ → D+ + e−
D3 D+ H+ → D+ + H D4 D+ + H→ D + H+
D5 D+ H→ HD + γ D6 D+ H2 → H + HDD7 HD+ + H→ H+ + HD D8 D+ + H2 → H+ + HDD9 HD+ H→ H2 + D D10 HD+ H+ → H2 +D+
D11 HD+ H+3 → H2 + H2D+ D12 D+ H+ → HD+ + γD13 D+ + H→ HD+ + γ D14 HD+ + γ → H +D+
D15 HD+ + γ → H+ + D D16 HD+ + e− → H + DD17 HD+ + H2 → H2D+ + H D18 HD+ + H2 → H+3 + DD19 D+ H+3 → H2D+ + H D20 H2D+ + e− → H + H + DD21 H2D+ + e− → H2 + D D22 H2D+ + e− → HD + HD23 H2D+ + H2 → H+3 + HD D24 H2D+ +H → H+3 + D
Table A.3. List of reactions for the helium chemistry. The ratesare taken from Galli & Palla (1998).
Reaction ReactionHe1 He++ + e− → He+ + γ He2 He+ + γ → He++ + e−
He3 He+ + e− → He+ γ He4 He+ γ → He+ + e−
He5 He+ H+ → He+ + H He6 He+ + H→ He+ H+
He7 He+ H+ → HeH+ + γ He8 He+ H+2 → HeH+ +HHe9 He+ + H→ HeH+ + γ He10 HeH+ + H→ He+ H+2He11 HeH+ + e− → He+ H He12 HeH+ + H2 → H+3 + HeHe13 HeH+ + γ → He+ H+ He14 HeH+ + γ → He+ + H
Table A.4. List of reactions for the lithium chemistry. We con-sider the rates discussed in Galli & Palla (1998), except fortherecombinations Li23 and Li25 (Verner et al. 1996), and for thephotoionisations Li24 and Li26 (Verner & Ferland 1996).
Reaction ReactionLi1 Li + + e− → Li + γ Li2 Li + γ → Li+ + e−
Li3 Li + + H− → Li + H Li4 Li − + H+ → Li + HLi5 Li + e− → Li− + γ Li6 Li − + γ → Li + e−
Li7 Li + H+ → Li+ + H Li8 Li +H+ → Li+ + H + γLi9 Li + H− → LiH + e− Li10 Li− + H→ LiH + e−
Li11 LiH+ + H→ LiH +H+ Li12 LiH +H+ → LiH+ + HLi13 LiH + H→ Li + H2 Li14 Li+ + H→ LiH+ + γLi15 Li + H+ → LiH+ + γ Li16 LiH +H+ → LiH+ + HLi17 LiH + H+ → Li+ + H2 Li18 LiH+ + e− → Li + HLi19 LiH+ + H→ Li + H+2 Li20 LiH+ + H→ Li+ + H2Li21 LiH+ + γ → Li+ + H Li22 LiH+ + γ → Li + H+
Li23 Li2+ + e− → Li+ + γ Li24 Li+ + γ → Li2+ + e−
Li25 Li3+ + e− → Li2+ + γ Li26 Li2+ + γ → Li3+ + e−
Table A.5. List of reactions for the carbon chemistry. The ratescome from theumist database, except for five reactions: reactionC7 (Lipovka et al. 2007), the two charge transfers C8 and C9between C, H and their respective ions (Stancil et al. 1998a), therecombination C48 (Omukai 2000) and the photoionisation C49,whose cross section is taken from Verner et al. (1996).
Reaction ReactionC1 C+ + H− → H + C C2 He+ + C→ C+ + HeC3 H+ + C− → C+ H C4 He+ + C− → C+ HeC5 C+ + C− → C+ C C6 C+ e− → C− + γC7 C− + γ → C+ e− C8 C+ + H→ C+H+
C9 C+ H+ → C+ + H C10 H+ CH→ C+ H2
C11 H+ CH→ C+ H + H C12 C+ H2 → CH+ HC13 H2 +CH→ C+ H + H2 C14 C+ + H2 → CH+ + HC15 C+ H→ CH+ γ C16 H+ + CH→ CH+ + HC17 H− + C→ CH+ e− C18 H+2 + C→ CH+ + HC19 H+2 + CH→ CH+ + H2 C20 H+3 + C→ CH+ + H2
C21 He+ + CH→ C+ + H + He C22 He+ + CH→ CH+ + HeC23 C+ + H→ CH+ + γ C24 C+ + CH→ CH+ + CC25 CH+ + H→ C+ + H2 C26 CH+ + e− → C+ HC27 H+ C− → CH+ e− C28 H+ CH2 → CH+ H2
C29 H2 + CH→ CH2 + H C30 H+ + CH2 → CH+ + H2C31 H+ CH+2 → CH+ + H2 C32 H+2 + CH→ CH+2 + HC33 H2 +CH+ → CH+2 + H C34 H+3 + CH→ CH+2 + H2
C35 He+ + CH2 → C+ + He+H2 C36 He+ + CH2 → CH+ + He+ HC37 H+ + CH2 → CH+2 + H C38 C+ CH2 → CH+CHC39 H+2 + CH2 → CH+2 + H2 C40 C+ + CH2 → CH+2 + CC41 CH+2 + e− → CH+ H C42 CH+2 + e− → C+ H + HC43 CH+2 + e− → C+ H2 C44 H− + CH→ CH2 + e−
C45 H2 +C− → CH2 + e− C46 H2 + C→ CH2 + γ
C47 H2 +C+ → CH+2 + γ C48 C+ + e− → C+ γC49 C+ γ → C+ + e−
P. Vonlanthen et al.: Chemistry of heavy elements in the DarkAges 13
Table A.6. List of reactions for the nitrogen chemistry. We takethe rates from theumist database, except for the photoionisationN41 (Verner et al. 1996).
Reaction ReactionN1 H− + N+ → N + H N2 C− + N+ → N + CN3 CH+ N+ → N + CH+ N4 H+ NH→ N + H2
N5 H2 + N→ NH + H N6 H+2 + N→ NH+ + HN7 H2 + N+ → NH+ + H N8 H2 + NH+ → N + H+3N9 He+ + NH→ N+ + He+ H N10 H+ + NH→ NH+ + HN11 H+2 + NH→ NH+ + H2 N12 N+ + NH→ NH+ + NN13 NH+ + e− → N + H N14 H− + N→ NH + e−
N15 CH+ N→ NH + C N16 N+ CH2→ NH + CHN17 C+ NH+ → N + CH+ N18 CH+ NH+ → CH+2 + NN19 C+ NH→ N + CH N20 H+ NH2→ NH + H2
N21 H2 + NH→ NH2 + H N22 NH+ NH→ NH2 + NN23 H+2 + NH→ NH+2 + H N24 H2 + NH+ → NH+2 + HN25 H+3 + NH→ NH+2 + H2 N26 He+ + NH2→ N+ + He+ H2
N27 He+ + NH2 → NH+ + He+ H N28 NH+ + NH→ NH+2 + NN29 H+ + NH2 → NH+2 + H N30 H+2 + NH2 → NH+2 + H2N31 N+ + NH2 → NH+2 + N N32 NH+2 + e− → N + H + HN33 NH+2 + e− → NH + H N34 H− + NH→ NH2 + e−
N35 C+ NH2→ NH + CH N36 C+ NH+2 → NH + CH+
N37 CH+ NH+2 → NH + CH+2 N38 CH+ NH+2 → NH2 + CH+
N39 CH2 + NH+2 → NH2 + CH+2 N40 N+ + e− → N + γN41 N+ γ → N+ + e−
Table A.7. List of reactions for the oxygen chemistry. Weconsider the rates of theumist database, except for reactionsO61 and O62 (Le Bourlot et al. 1993), for recombination O58(Pequignot et al. 1991) and for photoionisation O59, whosecross section is taken from (Verner et al. 1996).
Reaction ReactionO1 O+ e− → O− + γ O2 H+ O+ → O+ H+
O3 H+ + O→ O+ + H O4 H− + O+ → O + HO5 O− + γ→ O+ e− O6 C− + O+ → O + CO7 CH+ O+ → O+ CH+ O8 NH+ O+ → O+ NH+
O9 H+ O→ OH + γ O10 H+ O− → OH+ e−
O11 H+ OH→ O + H + H O12 H+ OH→ O + H2O13 H− + O→ OH+ e− O14 H+ + OH→ OH+ + HO15 H2 + O→ OH + H O16 H2 + OH→ O + H2 + HO17 H2 + O+ → OH+ + H O18 H+2 + O→ OH+ + HO19 H+2 + OH→ OH+ + H2 O20 H+3 + O→ OH+ + H2
O21 O+ + OH→ OH+ + O O22 OH+ + e− → O + HO23 He+ + OH→ O+ + He+ H O24 C+ OH→ O+ CHO25 C+ OH+ → O+ CH+ O26 CH+ O→ OH+ CO27 CH+ OH+ → OH+ CH+ O28 OH+ F→ HF + OO29 N+ OH→ O + NH O30 N+ + OH→ OH+ + NO31 NH+ O→ OH + N O32 NH+ + O→ OH+ + NO33 H2O+ + e− → O + H + H O34 H2O+ + e− → O+ H2
O35 H2O+ + e− → OH + H O36 O+ H2O→ OH+ OHO37 O+ + H2O→ H2O+ + O O38 H2 + O− → H2O + e−
O39 H2 + H2O→ OH + H2 + H O40 H2 + OH→ H2O+ HO41 H2 + OH+ → H2O+ + H O42 H+2 + OH→ H2O+ + HO43 H+3 + O→ H2O+ + H O44 H+3 + OH→ H2O+ + H2O45 H+ H2O→ OH + H2 O46 H+ H2O→ OH+ H + HO47 H+ OH→ H2O + γ O48 H− + OH→ H2O+ e−
O49 He+ + H2O→ OH+ He+ H+ O50 He+ + H2O→ OH+ + He+ HO51 OH+ OH→ H2O + O O52 OH+ + OH→ H2O+ + OO53 OH+ + H2O→ H2O+ + OH O54 H2O + F→ HF + OHO55 C+ H2O+ → OH+ CH+ O56 NH+ OH→ H2O+ NO57 NH+ + OH→ H2O+ + N O58 O+ + e− → O+ γO59 O+ γ → O+ + e− O60 H+ +H2O→ H2O+ + HO61 OH+ + H→ O+ + H2 O62 H2O+ + H→ H+ + H2OO63 H+2 + H2O→ H2O+ + H2
Table A.8. List of reactions for the fluorine chemistry. We takethe rates discussed in Puy et al. (2007).
Reaction ReactionF1 F+ H→ HF+ γ F2 FH+ γ→ F + HF3 F+ e− → F− + γ F4 F− + γ→ F + e−
F5 F− + H→ HF + e− F6 HF+ e− → F− + HF7 F+ H2→ HF+ H
Copyright © 2022 FDOKUMEN

