


Bahasa
Halaman
Hukum

Charcoal Ash as an Adsorbent for Ni(II) Adsorptionand Its Application for Wastewater TreatmentReza Katal,† Ehsan Hasani,‡ Maysam Farnam,‡ Mazyar Sharifzadeh Baei,*,§
and Mohammad Ali Ghayyem∥
†Faculty of Chemical Engineering, Tarbiat Modares University, Tehran, Iran‡Department of Engineering, Shahrood Branch, Islamic Azad University, Shahrood, Iran§Department of Chemical Engineering, Islamic Azad University, Ayatollah Amoli Branch, Amol, Iran∥Petroleum University of Technology, Ahwaz, Iran
ABSTRACT: The aim of present research is to investigatesorption characteristic of nanoadsobent charcoal ash (ash) forthe removal of Ni(II) from aqueous solutions and wastewater.The sorption of Ni(II) is carried out by batch method. Theoptimum conditions of sorption were found to be as follows: asorbent amount of 3 g in 100 mL of aqueous solutions, contacttime of 120 min, and pH 4. In optimum conditions, removalefficiency was 94.2 % for the Ni(II). Three equations, i.e.,Morris−Weber, Lagergren, and pseudo second order, have been tested to track the kinetics of the removal process. TheLangmuir, Freundlich, and D-R are subjected to sorption data to estimate sorption capacity. It can be concluded that ash has thepotential to remove Ni(II) ions from aqueous solutions at different concentrations. Desorption efficiency had been tested bywater saturated with CO2 and by aqueous solution of NaOH, and the results were not considerable. The effect of temperaturehas been studied; it was found that increasing temperature has a positive effect on the adsorption, and the thermodynamicparameters ΔH, ΔS, and ΔG are evaluated. Thermodynamic parameters showed that the adsorption of Ni(II) onto ash wasfeasible, spontaneous, and endothermic under the studied conditions. At the end, ash was used for plating wastewater treatmentso that the results were considerable. The removal efficiency of COD, Cr, Ni(II), Zn(II), and color were 68.3, 75.4, 91.5, 92.8,and 63.5 %, respectively. In this paper, different parameter such as pH, temperature, etc. were studied for Ni(II) adsorption ontoash, meanwhile this adsorbent is used for real wastewater (plating wastewater) treatment.
■ INTRODUCTIONHeavy metal ions have become an ecotoxicological hazard ofprime interest and increasing significance, because of theiraccumulation in living organisms.1 Ni(II) is present in effluentsof a large number of industries. People often suffer from allergydue to exposure to nickel-containing materials, and the carcino-genic effects of nickel have also been well documented.2 Nickelis a toxic heavy metal widely used in silver refineries, electro-plating, zinc base casting, and storage battery industries.3
Current treatment processes for Ni(II) removal from waste-water include precipitation, coagulation, ion exchange, mem-brane separation, lime softening, and adsorption. Comparedwith other methods, adsorption technology has received muchmore attention because it is convenient and economical forreducing trace quantities of heavy metals.4,5 Though the use ofcommercial activated carbon is a well-known adsorbent for theremoval of heavy metals from water and wastewater, the highcost of activated carbon limits its use as an adsorbent in developingcountries. Hence, several research workers used different low-cost adsorbents such as coconut coir pith,6 sawdust,7 sludgeash,8 banana pith,9 activated phosphate rock,10 vermiculite,11
and montmorillonite.12 In spite of several researchers adoptingvarious low-cost adsorbents, there is still a need to develop
suitable adsorbents for the removal of heavy metal from aqueoussolutions. Adsorption of trace heavy metals onto solid phases andassociated surface coatings is considered very important in con-trolling heavy metal activity. In recent years considerableattention has been paid to the investigation of different types oflow-cost sorbents especially using metal-oxide modifiedadsorbents, such as sand,13−15 zeolite,16,17 and diatomite.18
Fly ash is a waste material originating in great amounts incombustion processes. Although it may contain some hazard-ous substances, such as heavy metals, it is widely utilized inindustry in many countries. For example, in 1994, approx-imately 6.74 million metric tons of coal fly ash was used inthe United States in cement and concrete products.19 Althoughfly ash utilization in construction and other civil engineeringapplications is expected to increase, it is unlikely that this willever use all the fly ash generated. Research is therefore neededto develop new alternative environmental friendly applicationsthat can further exploit fly ash. Potential environmental impactsof fly ash utilization have been extensively studied and are well
Received: September 2, 2011Accepted: December 14, 2011Published: January 6, 2012
Article
pubs.acs.org/jced
© 2012 American Chemical Society 374 dx.doi.org/10.1021/je200953h | J. Chem. Eng.Data 2012, 57, 374−383
understood. Leachability of heavy metals from ashes is relativelylow20 and thus the risks associated with the heavy metals libera-tion into the environment do not exceed an acceptable level.When used for acidity control in mining and sulfide ore treat-ment, the lignite fly ash reduced concentrations of dissolvedmetals in waters to values that meet the European regulatorylimits for potable water.21Various kinds of ashes have been used aslow-cost sorbents for the removal of heavy metals,20,22organics,23,24
as well as dyes23,25−27 from waters. The applicability of the flyashes for water treatment depends strongly on their origin. Flyashes from waste incinerators seem to be unsuitable because oftheir nonstable composition and properties. It was shown thatboth total contents of heavy metals as well as there leased(leached) amounts of these pollutants are higher in the case ofthe incinerator fly ashes in comparison with coal fly ashes.28
Ash generated in sugar industry probably does not contain largeamounts of toxic metals and has been widely used foradsorption of pollutants from waters.24,26
The present research was devoted to the application of ashfor the removal of Ni(II) in batch mode. The effects of pH,temperature, contact time, and initial Ni(II) concentration wereinvestigated. Isothermal models and kinetics of adsorption werestudied, and thermodynamic parameters were determined. Alsodesorption efficiency had been tested by water saturated withCO2 and by aqueous solution of NaOH. In the end, theadsorbent has been used for plating wastewater treatment.
■ EXPERIMENTAL SECTIONAsh Preparation and Characterizations. For preparation
of ash, charcoal was used; the procedure was putting it in an ovenfor 24 h after burning charcoal. For determining the initialcomposition of fly ash, 750 mg of dried ash sample was treated for2 days with 20 mL of 200 g/L HF. Then 80 mL of 50 g/L H3BO3was added to dissolve a possible precipitate of CaF2. Thedetermination of SiO2 was performed according to the ASTM D27956 molybdosilicate method and the SO3 according to theASTM D1757 gravimetric method. For all experiments, the mea-surements were carried out as triplicate runs. The physicochemicalcharacterization of ash was performed using standard procedures.Characterization of the ash was carried out by surface area analysis,bulk density, particle size distribution analysis, and scanningelectron microscopy (SEM). The surface area of the ash wasmeasured by BET (Brunauer−Emmett−Teller nitrogenadsorption technique). The density of ash was determined byspecific gravity bottle. The moisture content determination ofadsorbent was carried out with a digital microprocessor-basedmoisture analyzer (Mettler-LP16). The particle size distributionanalysis was carried out using a Particle Size Distributionanalyzer (model 117.08, Malvern instruments, U.S.A.). Theresults of particle size distribution are shown in Table 1. To
understand the morphology of adsorption of Ni(II) on the ash,the samples were gold sputter coated and SEM micrographswere taken using SEM (model S3400, Hitachi, Japan). Table 2
shows the chemical composition of ash. Bulk density andsurface area are reported in Table 3. The zero-point charge ofthe ash was determined by the solid addition method.29 Thestructure of ash was studied using X-ray diffractograms (XRDs)obtained from an X-ray diffracto-meter (model No. XRD3000P, Seifert, Germany). Nickel concentrations in supernatantswere analyzed by flame atomic absorption spectrophotometry,Perkin-Elmer model 2100 (Perkin-Elmer, Uberlingen, Germany).The wavelength was 323 nm that allowed the measuring of Niconcentrations in the range 0−200 ppm without diluting thesolutions. Flow rates were 3.03 min−1 for air and 1.0 for acetylene.
Preparation of Ni (II) Solutions. A solution of Ni wasprepared using analytical grade NiCl2 provided by MerckCompany and stored at room temperature. Before using of thispowder, it was dried for 1 h at 120 °C.
Batch Adsorption Experiments. Adsorption experimentswere carried out in 150 mL flasks, and the total volume of thereaction solution was kept at 100 mL. The flasks were shaken at400 rpm for the required time in a water bath shaker. The effectof solution pH on the removal of ash was investigated over thepH range from 2 to 10. The initial solution pH was adjustedusing 0.5 mol·L−1 HCl or 0.5 mol·L−1 NaOH. After equilibra-tion, the suspension of the adsorbent was separated fromsolution by filtration using Whatman No. 42 filter paper. Blankexperiments were conducted to ensure that no adsorption wastaking place on the walls of the apparatus used. All experimentswere conducted in duplicate and mean values were used. Theresults of these studies were used to obtain the optimum con-ditions for maximum heavy metal removal from aqueoussolution. The experimental error was below 3%, the averagedata were reported. The removal efficiency of Ni(II), % removal,was calculated as
= − ×C C C% removal ( )/ 100i f i (1)
where Ci is the initial concentration (mg·L−1) and Cf is the finalconcentration (mg·L−1). q is the amount of metal adsorbed perspecific amount of adsorbent (mg/g). The sorption capacity attime t, qt (mg·g
−1), was obtained as follows
= −q C C V m( ) /t i t (2)
where Ci and Ct (mg·L−1) were the liquid-phase concentrations of
solutes at initial and a given time t, V was the solution volume, and
Table 1. Particle Size Distribution of the Ash (400−500 μm)
adsorbent (μm) ash (%)
400−420 24.2420−440 23.4440−460 27.1460−480 20.3480−500 10.2
Table 2. Bulk Chemical Composition of Fly Ash
oxide g/kg
SiO2 247.9Fe2O3 44.1Al2O3 128.8TiO2 2.4CaO 483.8MgO 42.6SO3 44.3Na2O 3.1K2O 6.4
Table 3. Characteristics of Ash
adsorbent ash
surface area (m2·g−1) 62.1bulk density (g·cm−3) 1.15zero-point charge, pH 8mean diameter (m) 2.4 × 10 −4
Journal of Chemical & Engineering Data Article
dx.doi.org/10.1021/je200953h | J. Chem. Eng.Data 2012, 57, 374−383375
m was the mass ash (g). The amount of adsorption at equilibrium,qe, was given by
= −q C C V m( ) /e i e (3)
where Ce (mg·L−1) was the ion concentration at equilibrium.
Desorption Experiments. Leaching tests by watersaturated with CO2 and aqueous solution of acetic acid werecarried out. Exhaust ash samples, resulting from multielementsorption experiments, were used.Test by Water Saturated with CO2. Desorption experi-
ments were carried out using pure water saturated with CO2with an initial pH value of 9. A 3 g sample of exhaust ash wasplaced into 0.2 L of leaching solution. After shaking for 24 h at20 °C, the mixture was filtered by 0.45 mm Millipore filter andthe eluate analyzed for metal ion concentration.Test by Aqueous Solution of NaOH. These experiments
were carried out using different concentration of NaOH aqueoussolution. A 3 g sample of exhaust ash was placed into 0.2 L ofleaching NaOH solution. The pH was adjusted to 9 during theexperiments by small additions of NaOH aqueous solution.After shaking for 24 h at 20 °C, the mixture was filtered by0.45-mm Millipore filter; the metal ion content in the eluatewas determined by atomic absorption.
■ RESULTS AND DISCUSSION
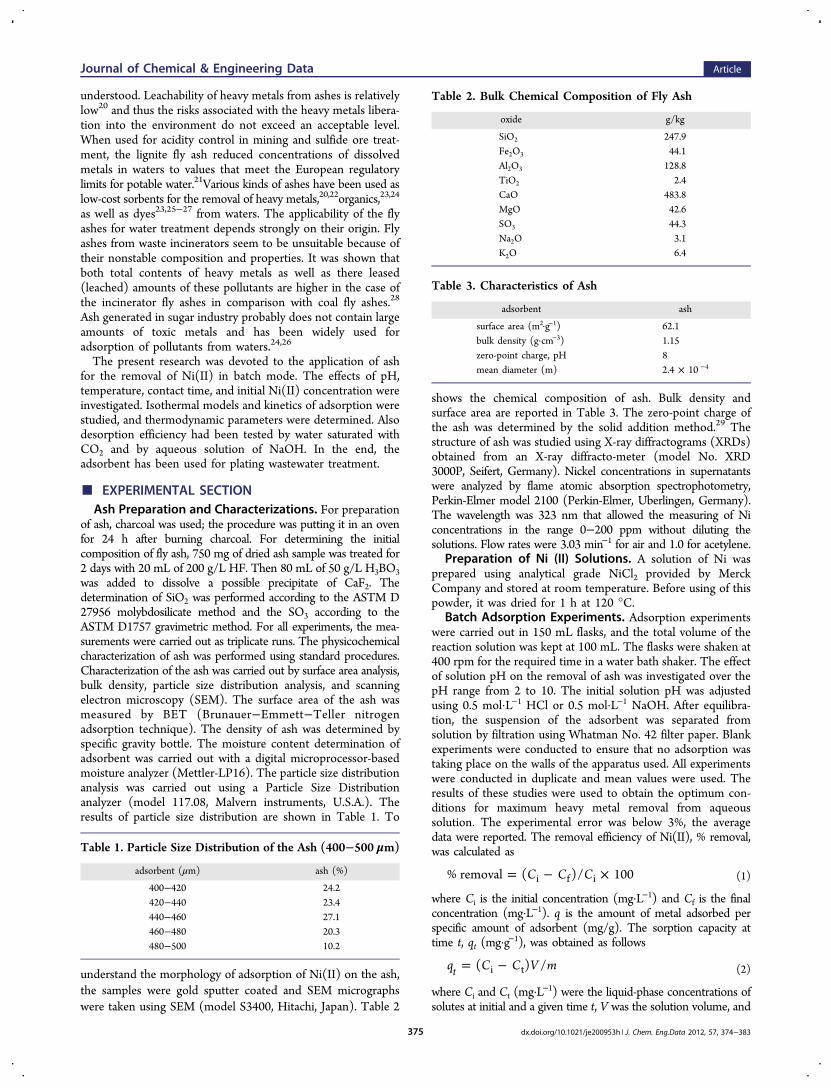
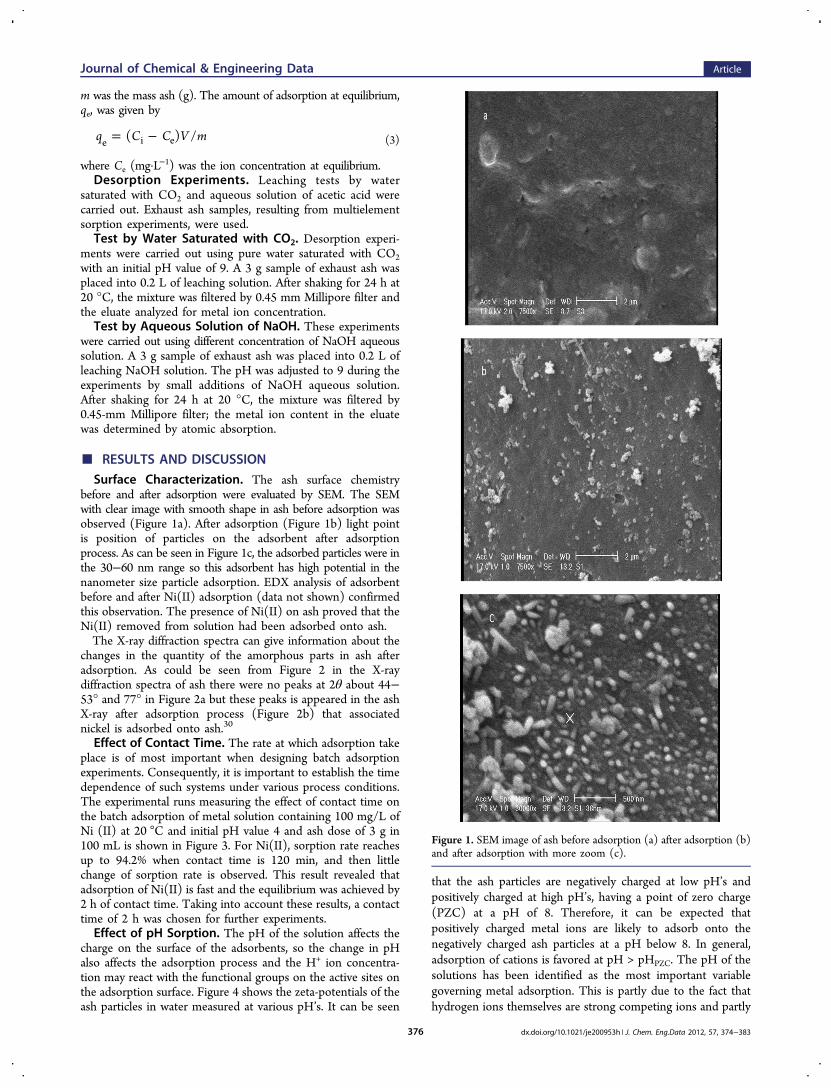
Surface Characterization. The ash surface chemistrybefore and after adsorption were evaluated by SEM. The SEMwith clear image with smooth shape in ash before adsorption wasobserved (Figure 1a). After adsorption (Figure 1b) light pointis position of particles on the adsorbent after adsorptionprocess. As can be seen in Figure 1c, the adsorbed particles were inthe 30−60 nm range so this adsorbent has high potential in thenanometer size particle adsorption. EDX analysis of adsorbentbefore and after Ni(II) adsorption (data not shown) confirmedthis observation. The presence of Ni(II) on ash proved that theNi(II) removed from solution had been adsorbed onto ash.The X-ray diffraction spectra can give information about the
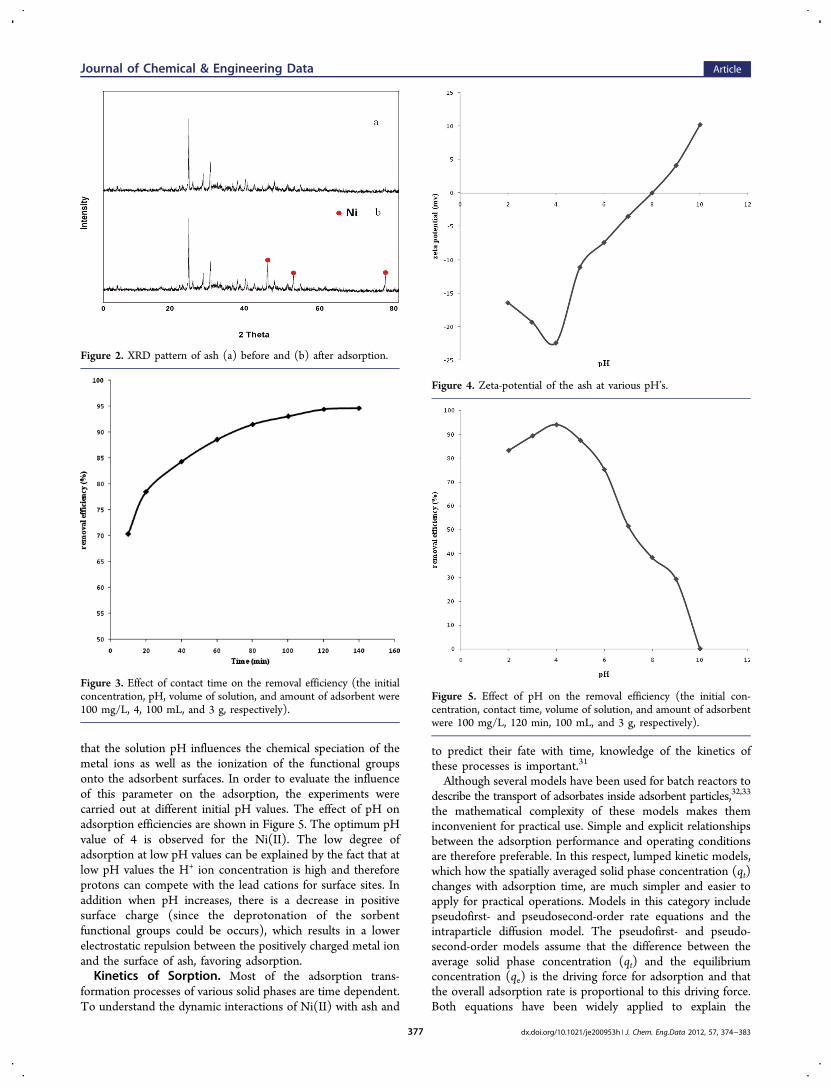
changes in the quantity of the amorphous parts in ash afteradsorption. As could be seen from Figure 2 in the X-raydiffraction spectra of ash there were no peaks at 2θ about 44−53° and 77° in Figure 2a but these peaks is appeared in the ashX-ray after adsorption process (Figure 2b) that associatednickel is adsorbed onto ash.30
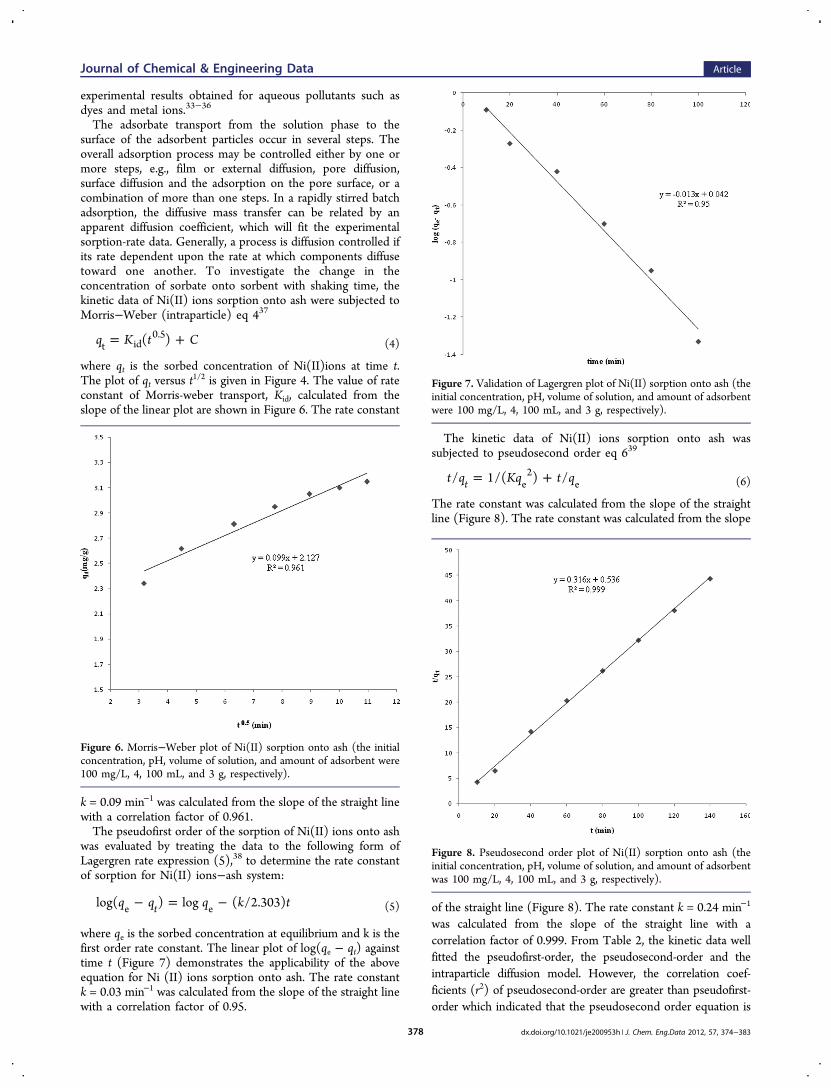
Effect of Contact Time. The rate at which adsorption takeplace is of most important when designing batch adsorptionexperiments. Consequently, it is important to establish the timedependence of such systems under various process conditions.The experimental runs measuring the effect of contact time onthe batch adsorption of metal solution containing 100 mg/L ofNi (II) at 20 ◦C and initial pH value 4 and ash dose of 3 g in100 mL is shown in Figure 3. For Ni(II), sorption rate reachesup to 94.2% when contact time is 120 min, and then littlechange of sorption rate is observed. This result revealed thatadsorption of Ni(II) is fast and the equilibrium was achieved by2 h of contact time. Taking into account these results, a contacttime of 2 h was chosen for further experiments.Effect of pH Sorption. The pH of the solution affects the
charge on the surface of the adsorbents, so the change in pHalso affects the adsorption process and the H+ ion concentra-tion may react with the functional groups on the active sites onthe adsorption surface. Figure 4 shows the zeta-potentials of theash particles in water measured at various pH’s. It can be seen
that the ash particles are negatively charged at low pH’s andpositively charged at high pH’s, having a point of zero charge(PZC) at a pH of 8. Therefore, it can be expected thatpositively charged metal ions are likely to adsorb onto thenegatively charged ash particles at a pH below 8. In general,adsorption of cations is favored at pH > pHPZC. The pH of thesolutions has been identified as the most important variablegoverning metal adsorption. This is partly due to the fact thathydrogen ions themselves are strong competing ions and partly
Figure 1. SEM image of ash before adsorption (a) after adsorption (b)and after adsorption with more zoom (c).
Journal of Chemical & Engineering Data Article
dx.doi.org/10.1021/je200953h | J. Chem. Eng.Data 2012, 57, 374−383376
that the solution pH influences the chemical speciation of themetal ions as well as the ionization of the functional groupsonto the adsorbent surfaces. In order to evaluate the influenceof this parameter on the adsorption, the experiments werecarried out at different initial pH values. The effect of pH onadsorption efficiencies are shown in Figure 5. The optimum pHvalue of 4 is observed for the Ni(II). The low degree ofadsorption at low pH values can be explained by the fact that atlow pH values the H+ ion concentration is high and thereforeprotons can compete with the lead cations for surface sites. Inaddition when pH increases, there is a decrease in positivesurface charge (since the deprotonation of the sorbentfunctional groups could be occurs), which results in a lowerelectrostatic repulsion between the positively charged metal ionand the surface of ash, favoring adsorption.Kinetics of Sorption. Most of the adsorption trans-
formation processes of various solid phases are time dependent.To understand the dynamic interactions of Ni(II) with ash and
to predict their fate with time, knowledge of the kinetics ofthese processes is important.31
Although several models have been used for batch reactors todescribe the transport of adsorbates inside adsorbent particles,32,33
the mathematical complexity of these models makes theminconvenient for practical use. Simple and explicit relationshipsbetween the adsorption performance and operating conditionsare therefore preferable. In this respect, lumped kinetic models,which how the spatially averaged solid phase concentration (qt)changes with adsorption time, are much simpler and easier toapply for practical operations. Models in this category includepseudofirst- and pseudosecond-order rate equations and theintraparticle diffusion model. The pseudofirst- and pseudo-second-order models assume that the difference between theaverage solid phase concentration (qt) and the equilibriumconcentration (qe) is the driving force for adsorption and thatthe overall adsorption rate is proportional to this driving force.Both equations have been widely applied to explain the
Figure 2. XRD pattern of ash (a) before and (b) after adsorption.
Figure 3. Effect of contact time on the removal efficiency (the initialconcentration, pH, volume of solution, and amount of adsorbent were100 mg/L, 4, 100 mL, and 3 g, respectively).
Figure 4. Zeta-potential of the ash at various pH’s.
Figure 5. Effect of pH on the removal efficiency (the initial con-centration, contact time, volume of solution, and amount of adsorbentwere 100 mg/L, 120 min, 100 mL, and 3 g, respectively).
Journal of Chemical & Engineering Data Article
dx.doi.org/10.1021/je200953h | J. Chem. Eng.Data 2012, 57, 374−383377
experimental results obtained for aqueous pollutants such asdyes and metal ions.33−36
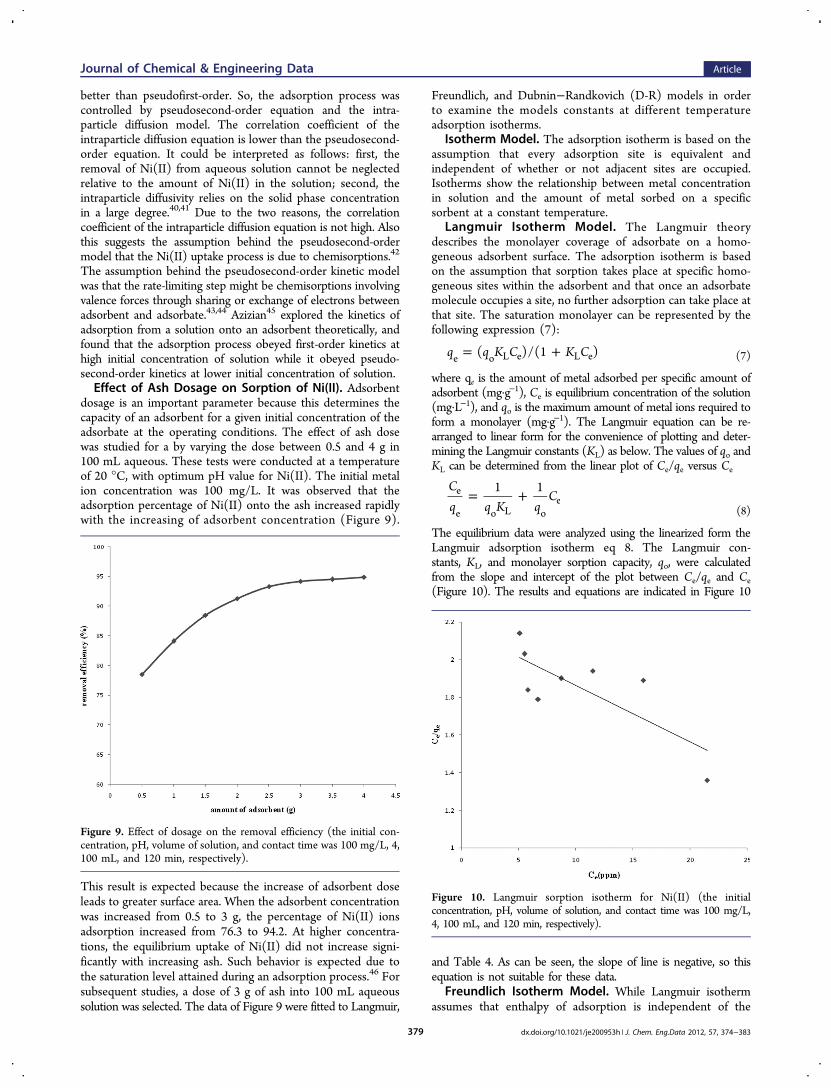
The adsorbate transport from the solution phase to thesurface of the adsorbent particles occur in several steps. Theoverall adsorption process may be controlled either by one ormore steps, e.g., film or external diffusion, pore diffusion,surface diffusion and the adsorption on the pore surface, or acombination of more than one steps. In a rapidly stirred batchadsorption, the diffusive mass transfer can be related by anapparent diffusion coefficient, which will fit the experimentalsorption-rate data. Generally, a process is diffusion controlled ifits rate dependent upon the rate at which components diffusetoward one another. To investigate the change in theconcentration of sorbate onto sorbent with shaking time, thekinetic data of Ni(II) ions sorption onto ash were subjected toMorris−Weber (intraparticle) eq 437
= +q K t C( )t id0.5
(4)
where qt is the sorbed concentration of Ni(II)ions at time t.The plot of qt versus t
1/2 is given in Figure 4. The value of rateconstant of Morris-weber transport, Kid, calculated from theslope of the linear plot are shown in Figure 6. The rate constant
k = 0.09 min−1 was calculated from the slope of the straight linewith a correlation factor of 0.961.The pseudofirst order of the sorption of Ni(II) ions onto ash
was evaluated by treating the data to the following form ofLagergren rate expression (5),38 to determine the rate constantof sorption for Ni(II) ions−ash system:
− = −q q q k tlog( ) log ( /2.303)te e (5)
where qe is the sorbed concentration at equilibrium and k is thefirst order rate constant. The linear plot of log(qe − qt) againsttime t (Figure 7) demonstrates the applicability of the aboveequation for Ni (II) ions sorption onto ash. The rate constantk = 0.03 min−1 was calculated from the slope of the straight linewith a correlation factor of 0.95.
The kinetic data of Ni(II) ions sorption onto ash wassubjected to pseudosecond order eq 639
= +t q Kq t q/ 1/( ) /t e2
e (6)
The rate constant was calculated from the slope of the straightline (Figure 8). The rate constant was calculated from the slope
of the straight line (Figure 8). The rate constant k = 0.24 min−1
was calculated from the slope of the straight line with acorrelation factor of 0.999. From Table 2, the kinetic data wellfitted the pseudofirst-order, the pseudosecond-order and theintraparticle diffusion model. However, the correlation coef-ficients (r2) of pseudosecond-order are greater than pseudofirst-order which indicated that the pseudosecond order equation is
Figure 6. Morris−Weber plot of Ni(II) sorption onto ash (the initialconcentration, pH, volume of solution, and amount of adsorbent were100 mg/L, 4, 100 mL, and 3 g, respectively).
Figure 7. Validation of Lagergren plot of Ni(II) sorption onto ash (theinitial concentration, pH, volume of solution, and amount of adsorbentwere 100 mg/L, 4, 100 mL, and 3 g, respectively).
Figure 8. Pseudosecond order plot of Ni(II) sorption onto ash (theinitial concentration, pH, volume of solution, and amount of adsorbentwas 100 mg/L, 4, 100 mL, and 3 g, respectively).
Journal of Chemical & Engineering Data Article
dx.doi.org/10.1021/je200953h | J. Chem. Eng.Data 2012, 57, 374−383378
better than pseudofirst-order. So, the adsorption process wascontrolled by pseudosecond-order equation and the intra-particle diffusion model. The correlation coefficient of theintraparticle diffusion equation is lower than the pseudosecond-order equation. It could be interpreted as follows: first, theremoval of Ni(II) from aqueous solution cannot be neglectedrelative to the amount of Ni(II) in the solution; second, theintraparticle diffusivity relies on the solid phase concentrationin a large degree.40,41 Due to the two reasons, the correlationcoefficient of the intraparticle diffusion equation is not high. Alsothis suggests the assumption behind the pseudosecond-ordermodel that the Ni(II) uptake process is due to chemisorptions.42
The assumption behind the pseudosecond-order kinetic modelwas that the rate-limiting step might be chemisorptions involvingvalence forces through sharing or exchange of electrons betweenadsorbent and adsorbate.43,44 Azizian45 explored the kinetics ofadsorption from a solution onto an adsorbent theoretically, andfound that the adsorption process obeyed first-order kinetics athigh initial concentration of solution while it obeyed pseudo-second-order kinetics at lower initial concentration of solution.Effect of Ash Dosage on Sorption of Ni(II). Adsorbent
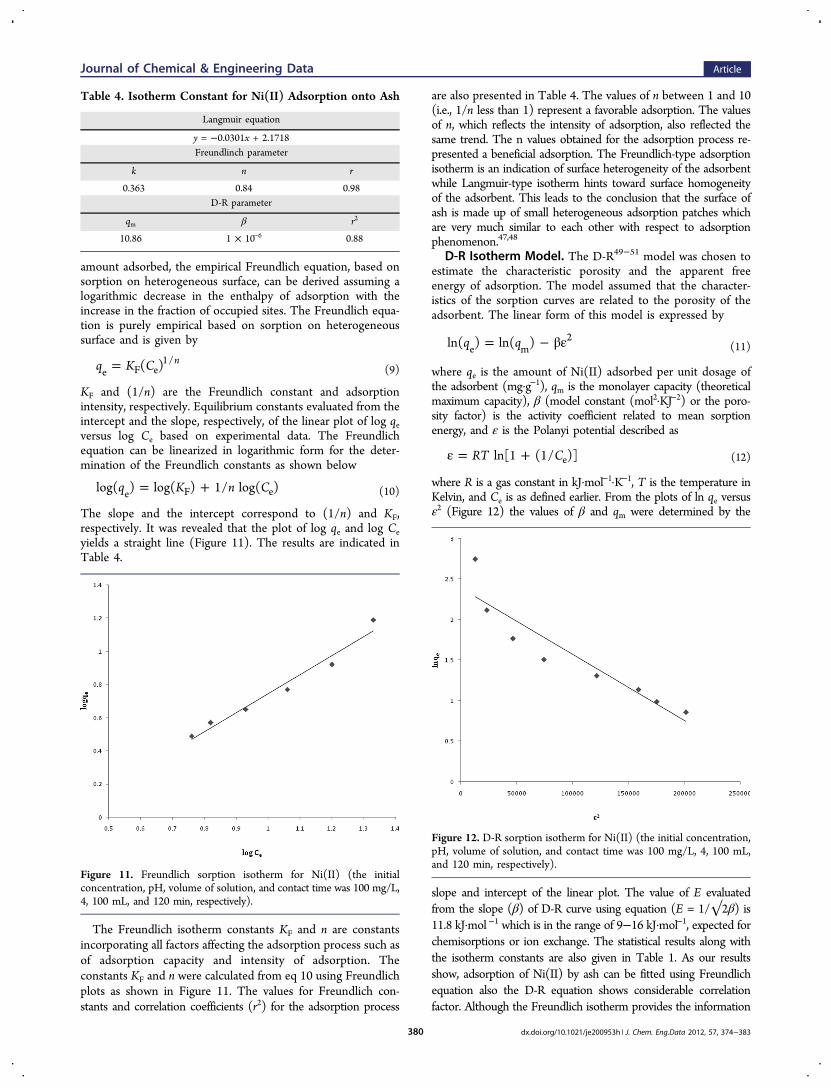
dosage is an important parameter because this determines thecapacity of an adsorbent for a given initial concentration of theadsorbate at the operating conditions. The effect of ash dosewas studied for a by varying the dose between 0.5 and 4 g in100 mL aqueous. These tests were conducted at a temperatureof 20 °C, with optimum pH value for Ni(II). The initial metalion concentration was 100 mg/L. It was observed that theadsorption percentage of Ni(II) onto the ash increased rapidlywith the increasing of adsorbent concentration (Figure 9).
This result is expected because the increase of adsorbent doseleads to greater surface area. When the adsorbent concentrationwas increased from 0.5 to 3 g, the percentage of Ni(II) ionsadsorption increased from 76.3 to 94.2. At higher concentra-tions, the equilibrium uptake of Ni(II) did not increase signi-ficantly with increasing ash. Such behavior is expected due tothe saturation level attained during an adsorption process.46 Forsubsequent studies, a dose of 3 g of ash into 100 mL aqueoussolution was selected. The data of Figure 9 were fitted to Langmuir,
Freundlich, and Dubnin−Randkovich (D-R) models in orderto examine the models constants at different temperatureadsorption isotherms.
Isotherm Model. The adsorption isotherm is based on theassumption that every adsorption site is equivalent andindependent of whether or not adjacent sites are occupied.Isotherms show the relationship between metal concentrationin solution and the amount of metal sorbed on a specificsorbent at a constant temperature.
Langmuir Isotherm Model. The Langmuir theorydescribes the monolayer coverage of adsorbate on a homo-geneous adsorbent surface. The adsorption isotherm is basedon the assumption that sorption takes place at specific homo-geneous sites within the adsorbent and that once an adsorbatemolecule occupies a site, no further adsorption can take place atthat site. The saturation monolayer can be represented by thefollowing expression (7):
= +q q K C K C( )/(1 )e o L e L e (7)
where qe is the amount of metal adsorbed per specific amount ofadsorbent (mg·g−1), Ce is equilibrium concentration of the solution(mg·L−1), and qo is the maximum amount of metal ions required toform a monolayer (mg·g−1). The Langmuir equation can be re-arranged to linear form for the convenience of plotting and deter-mining the Langmuir constants (KL) as below. The values of qo andKL can be determined from the linear plot of Ce/qe versus Ce
= +Cq q K q
C1 1e
e o L oe
(8)
The equilibrium data were analyzed using the linearized form theLangmuir adsorption isotherm eq 8. The Langmuir con-stants, KL, and monolayer sorption capacity, qo, were calculatedfrom the slope and intercept of the plot between Ce/qe and Ce(Figure 10). The results and equations are indicated in Figure 10
and Table 4. As can be seen, the slope of line is negative, so thisequation is not suitable for these data.
Freundlich Isotherm Model. While Langmuir isothermassumes that enthalpy of adsorption is independent of the
Figure 9. Effect of dosage on the removal efficiency (the initial con-centration, pH, volume of solution, and contact time was 100 mg/L, 4,100 mL, and 120 min, respectively).
Figure 10. Langmuir sorption isotherm for Ni(II) (the initialconcentration, pH, volume of solution, and contact time was 100 mg/L,4, 100 mL, and 120 min, respectively).
Journal of Chemical & Engineering Data Article
dx.doi.org/10.1021/je200953h | J. Chem. Eng.Data 2012, 57, 374−383379
amount adsorbed, the empirical Freundlich equation, based onsorption on heterogeneous surface, can be derived assuming alogarithmic decrease in the enthalpy of adsorption with theincrease in the fraction of occupied sites. The Freundlich equa-tion is purely empirical based on sorption on heterogeneoussurface and is given by
=q K C( ) ne F e
1/(9)
KF and (1/n) are the Freundlich constant and adsorptionintensity, respectively. Equilibrium constants evaluated from theintercept and the slope, respectively, of the linear plot of log qeversus log Ce based on experimental data. The Freundlichequation can be linearized in logarithmic form for the deter-mination of the Freundlich constants as shown below
= +q K n Clog( ) log( ) 1/ log( )e F e (10)
The slope and the intercept correspond to (1/n) and KF,respectively. It was revealed that the plot of log qe and log Ceyields a straight line (Figure 11). The results are indicated inTable 4.
The Freundlich isotherm constants KF and n are constantsincorporating all factors affecting the adsorption process such asof adsorption capacity and intensity of adsorption. Theconstants KF and n were calculated from eq 10 using Freundlichplots as shown in Figure 11. The values for Freundlich con-stants and correlation coefficients (r2) for the adsorption process
are also presented in Table 4. The values of n between 1 and 10(i.e., 1/n less than 1) represent a favorable adsorption. The valuesof n, which reflects the intensity of adsorption, also reflected thesame trend. The n values obtained for the adsorption process re-presented a beneficial adsorption. The Freundlich-type adsorptionisotherm is an indication of surface heterogeneity of the adsorbentwhile Langmuir-type isotherm hints toward surface homogeneityof the adsorbent. This leads to the conclusion that the surface ofash is made up of small heterogeneous adsorption patches whichare very much similar to each other with respect to adsorptionphenomenon.47,48
D-R Isotherm Model. The D-R49−51 model was chosen toestimate the characteristic porosity and the apparent freeenergy of adsorption. The model assumed that the character-istics of the sorption curves are related to the porosity of theadsorbent. The linear form of this model is expressed by
= − βεq qln( ) ln( )e m2
(11)
where qe is the amount of Ni(II) adsorbed per unit dosage ofthe adsorbent (mg·g−1), qm is the monolayer capacity (theoreticalmaximum capacity), β (model constant (mol2·KJ−2) or the poro-sity factor) is the activity coefficient related to mean sorptionenergy, and ε is the Polanyi potential described as
ε = +RT Cln[1 (1/ )]e (12)
where R is a gas constant in kJ·mol−1·K−1, T is the temperature inKelvin, and Ce is as defined earlier. From the plots of ln qe versusε2 (Figure 12) the values of β and qm were determined by the
slope and intercept of the linear plot. The value of E evaluatedfrom the slope (β) of D-R curve using equation (E = 1/√2β) is11.8 kJ·mol −1 which is in the range of 9−16 kJ·mol−1, expected forchemisorptions or ion exchange. The statistical results along withthe isotherm constants are also given in Table 1. As our resultsshow, adsorption of Ni(II) by ash can be fitted using Freundlichequation also the D-R equation shows considerable correlationfactor. Although the Freundlich isotherm provides the information
Table 4. Isotherm Constant for Ni(II) Adsorption onto Ash
Langmuir equation
y = −0.0301x + 2.1718Freundlinch parameter
k n r
0.363 0.84 0.98D-R parameter
qm β r2
10.86 1 × 10⁻⁶ 0.88
Figure 11. Freundlich sorption isotherm for Ni(II) (the initialconcentration, pH, volume of solution, and contact time was 100 mg/L,4, 100 mL, and 120 min, respectively).
Figure 12. D-R sorption isotherm for Ni(II) (the initial concentration,pH, volume of solution, and contact time was 100 mg/L, 4, 100 mL,and 120 min, respectively).
Journal of Chemical & Engineering Data Article
dx.doi.org/10.1021/je200953h | J. Chem. Eng.Data 2012, 57, 374−383380
about the surface heterogeneity and the exponential distribution ofthe active sites and their energies, it does not predict any saturationof the surface of the adsorbent by the adsorbate. Hence, infinitesurface coverage could be predicted mathematically. In contrast, D-R isotherm relates the heterogeneity of energies close to theadsorbent surface. If a very small subregion of the sorption surfaceis chosen and assumed to be approximately by the Langmuirisotherm, the quantity can be related to the mean sorption energy,E, which is the free energy for the transfer of 1 mol of metal ionsfrom the infinity to the surface of the adsorbent.40,41
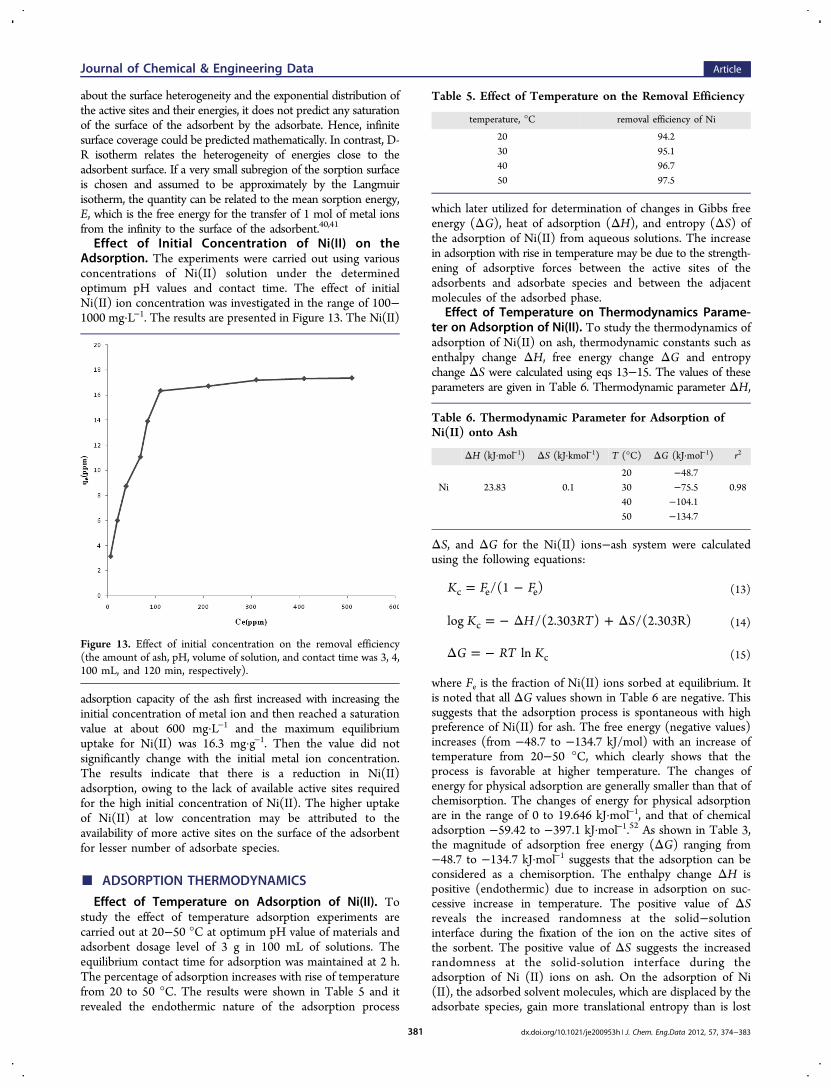
Effect of Initial Concentration of Ni(II) on theAdsorption. The experiments were carried out using variousconcentrations of Ni(II) solution under the determinedoptimum pH values and contact time. The effect of initialNi(II) ion concentration was investigated in the range of 100−1000 mg·L−1. The results are presented in Figure 13. The Ni(II)
adsorption capacity of the ash first increased with increasing theinitial concentration of metal ion and then reached a saturationvalue at about 600 mg·L−1 and the maximum equilibriumuptake for Ni(II) was 16.3 mg·g−1. Then the value did notsignificantly change with the initial metal ion concentration.The results indicate that there is a reduction in Ni(II)adsorption, owing to the lack of available active sites requiredfor the high initial concentration of Ni(II). The higher uptakeof Ni(II) at low concentration may be attributed to theavailability of more active sites on the surface of the adsorbentfor lesser number of adsorbate species.
■ ADSORPTION THERMODYNAMICS
Effect of Temperature on Adsorption of Ni(II). Tostudy the effect of temperature adsorption experiments arecarried out at 20−50 °C at optimum pH value of materials andadsorbent dosage level of 3 g in 100 mL of solutions. Theequilibrium contact time for adsorption was maintained at 2 h.The percentage of adsorption increases with rise of temperaturefrom 20 to 50 °C. The results were shown in Table 5 and itrevealed the endothermic nature of the adsorption process
which later utilized for determination of changes in Gibbs freeenergy (ΔG), heat of adsorption (ΔH), and entropy (ΔS) ofthe adsorption of Ni(II) from aqueous solutions. The increasein adsorption with rise in temperature may be due to the strength-ening of adsorptive forces between the active sites of theadsorbents and adsorbate species and between the adjacentmolecules of the adsorbed phase.
Effect of Temperature on Thermodynamics Parame-ter on Adsorption of Ni(II). To study the thermodynamics ofadsorption of Ni(II) on ash, thermodynamic constants such asenthalpy change ΔH, free energy change ΔG and entropychange ΔS were calculated using eqs 13−15. The values of theseparameters are given in Table 6. Thermodynamic parameter ΔH,
ΔS, and ΔG for the Ni(II) ions−ash system were calculatedusing the following equations:
= −K F F/(1 )c e e (13)
= − Δ + ΔK H RT S 3log /(2.303 ) /(2.30 R)c (14)
Δ = −G RT Kln c (15)
where Fe is the fraction of Ni(II) ions sorbed at equilibrium. Itis noted that all ΔG values shown in Table 6 are negative. Thissuggests that the adsorption process is spontaneous with highpreference of Ni(II) for ash. The free energy (negative values)increases (from −48.7 to −134.7 kJ/mol) with an increase oftemperature from 20−50 °C, which clearly shows that theprocess is favorable at higher temperature. The changes ofenergy for physical adsorption are generally smaller than that ofchemisorption. The changes of energy for physical adsorptionare in the range of 0 to 19.646 kJ·mol−1, and that of chemicaladsorption −59.42 to −397.1 kJ·mol−1.52 As shown in Table 3,the magnitude of adsorption free energy (ΔG) ranging from−48.7 to −134.7 kJ·mol−1 suggests that the adsorption can beconsidered as a chemisorption. The enthalpy change ΔH ispositive (endothermic) due to increase in adsorption on suc-cessive increase in temperature. The positive value of ΔSreveals the increased randomness at the solid−solutioninterface during the fixation of the ion on the active sites ofthe sorbent. The positive value of ΔS suggests the increasedrandomness at the solid-solution interface during theadsorption of Ni (II) ions on ash. On the adsorption of Ni(II), the adsorbed solvent molecules, which are displaced by theadsorbate species, gain more translational entropy than is lost
Figure 13. Effect of initial concentration on the removal efficiency(the amount of ash, pH, volume of solution, and contact time was 3, 4,100 mL, and 120 min, respectively).
Table 5. Effect of Temperature on the Removal Efficiency
temperature, °C removal efficiency of Ni
20 94.230 95.140 96.750 97.5
Table 6. Thermodynamic Parameter for Adsorption ofNi(II) onto Ash
ΔH (kJ·mol−1) ΔS (kJ·kmol−1) T (°C) ΔG (kJ·mol−1) r2
20 −48.7Ni 23.83 0.1 30 −75.5 0.98
40 −104.150 −134.7
Journal of Chemical & Engineering Data Article
dx.doi.org/10.1021/je200953h | J. Chem. Eng.Data 2012, 57, 374−383381
by the adsorbate ions, thus allowing for the prevalence ofrandomness in the system.53
Desorption Experiments. To check whether metal ion canbe desorbed from the exhaust ash, two tests were carried out tosimulate the leaching as well by rainwater (test by watersaturated with carbon dioxide) as by NaOH percolates. Table 7
reports that the desorption efficiency is not considerable. Ascan be seen, NaOH concentration increase has positive effecton the desorption process but after 0.5 M, the NaOH con-centration has not significant effect on the desorptionefficiency. Findings indicate the low reversibility of the sorptionprocess at the pH values of both tests. Leaching by NaOH ismore effective than by CO2-saturated water.Application of Ash for Removal of the Heavy Metals
and COD from Plating Wastewater. Upon completion ofbasic adsorption experiments, the efficacy of ash in the removalof Cr(VI), Zn(II), Ni, and COD from industrial wastewater wasevaluated. To this end, a bulk wastewater sample was obtainedfrom a local plating wastewater (Shahi, Iran). The pH, color,and material concentration of collected wastewater wasdetermined at the beginning of adsorption experiments, areshown in Table 8. The pH of wastewater was 3.4. Adsorption
was performed on 100 mL of wastewater with an ash dose of3 g. The suspensions were stirred at room temperature (20 °C)and 200 rpm. Table 8 shows Cr(VI), Zn(II), Ni, and CODremoval from wastewater in terms of percent removal. As canbe seen, ash is an efficient and cost-effective adsorbent for theremoval of Cr(VI), Zn(II), Ni, and COD from industrial waste-waters. The main advantages of ash for the removal of Cr(VI),Zn(II), Ni, and COD from water and wastewater include a highadsorption rate, capacity, and efficacy, as well as a short equili-bration time. Furthermore, ash is available as a no-cost wasteand can be used without modifications. Thus, ash adsorption isenvironmentally friendly and achieves treatment goals in asimple and low-cost manner.
■ CONCLUSIONSAdsorption studies on ash have been shown to be highlyeffective in removing of Ni(II) from aqueous solution. Thisadsorbent is widely available as a waste material, is mechanicallystable, and most importantly is environmentally appealing. Inaddition, this adsorbent does not mix with water, and it can beseparated very easily from water. The maximum Ni(II) ionsadsorption capacity of ash is very close to other adsorbents.Therefore, it may be used as an alternative adsorbent, replacingcostly materials, such as activated carbon, resins, etc. Themaximum Ni(II) ions is 94.2 %. The optimum conditions ofsorption were found to be: a sorbent dose of 3 g in 100 mL ofNi(II) contact time of 120 min, pH 4 for the Ni(II). The resultsgained from this study were well described by the theoreticalFreundlich. The kinetic data indicated that the adsorptionprocess was controlled by pseudosecond-order equation.Desorption of Ni(II) from ash have been studied using 0.5 MNaOH and by water saturated with CO2, maximum desorptionefficiency was 35%. The effect of temperature has been studied;it was found that increasing temperature has positive effect onthe adsorption, the thermodynamic parameters ΔH, ΔS, and ΔGare evaluated. Thermodynamic parameters showed that theadsorption of Ni(II) onto ash was feasible, spontaneous andendothermic under studied conditions also ash was used inplating wastewater treatment that the results is considerable.
■ AUTHOR INFORMATIONCorresponding Author*E-mail: [email protected]. Fax:+982182883381.
FundingThis research was supported by a grant from Pars Gas & OilCo. and Islamic Azad University.
■ ACKNOWLEDGMENTSHooman Taher Rahmati at Tarbiat Modares University isacknowledged for his assistance with experimental design andanalysis.
■ REFERENCES(1) Boudrahem, F.; Soualah, A.; Aissani-Benissad, F. Pb(II) andCd(II) Removal from Aqueous Solutions Using Activated CarbonDeveloped from Coffee Residue Activated with Phosphoric Acid andZinc Chloride. J. Chem. Eng. Data 2011, 56 (5), 1946−1955.(2) Sharma, Y. C.; Srivastava, V. Comparative Studies of Removal ofCr(VI) and Ni(II) from Aqueous Solutions by Magnetic Nano-particles. J. Chem. Eng. Data 2011, 56 (4), 819−825.(3) Kadirvelu, K.; Thamaraiselvi, K.; Namasivayam, C. Adsorption ofnickel(II) fromaqueous solution onto activated carbon prepared fromcoirpith. Sep. Purif. Technol. 2001, 24, 497−505.(4) Danish, M.; Hashim, R.; Ibrahim, M. N. M.; Rafatullah, M.;Sulaiman, O.; Ahmad, T.; Shamsuzzoha, M.; Ahmad, A.; Sorption ofCopper(II) and Nickel(II) Ions from Aqueous Solutions UsingCalcium Oxide Activated Date (Phoenix dactylifera) Stone Carbon:Equilibrium, Kinetic, and Thermodynamic Studies, J. Chem. Eng. Data,2011, DOI: 10.1021/je200460n(5) Babel, S.; Kurniawan, T. A. Low-cost adsorbents for heavy metalsuptake from contaminated water: a review. J. Hazard. Mater. 2003, 97,219−243.(6) Kadirvelu, K.; Namasivayam, C. Activated carbon from coconutcoir pith as metal adsorbent: adsorption of Cd(II) from aqueoussolution. Adv. Environ. Res. 2003, 7, 471−478.(7) Wilson, A. R.; Lion, L. W.; Nelson, Y. M. Pb scavenging from afreshwater lake by Mn oxides in heterogeneous surface coating materials.Environ. Sci. Technol. 2001, 35, 3182−3189.
Table 7. Desorption Efficiency Test by CO2 or NaOHAqueous Solution
elementNaOH
concentration (M)desorption usingNaOH (%)
desorption usingCO2 (%)
0.1 7.120.2 14.830.3 23.32
Ni 0.4 26.71 25.50.5 31.420.6 31.760.7 32.25
Table 8. Characteristics of Plating Wastewater and RemovalEfficiency after Treatment by Ash
compoundconcentration in
wastewaterremoval efficiency of
ash (%)
COD (mg/L) 143 68.3Cr (mg/L) 328 75.4Ni (mg/L) 32.5 91.5Zn (mg/L) 15.2 92.8color (absorbance at600 nm)
0.35 63.5
Journal of Chemical & Engineering Data Article
dx.doi.org/10.1021/je200953h | J. Chem. Eng.Data 2012, 57, 374−383382
(8) Pan, S. C.; Lin, C. C.; Tseng, D. H. Reusing sewage sludge ash asadsorbent for copperremoval from wastewater. Resour. Conserv. Recycl.2003, 39, 79−90.(9) Low, K. S.; Lee, C. K.; Leo, A. C. Removal of metals fromelectroplating wastes usingbanana pith. Bioresour. Technol. 1995, 51,227−231.(10) Sarioglu, M.; Atay, U. A.; Cebeci, Y. Removal of copper fromaqueous solutions by phosphate rock. Desalination 2005, 181, 303−311.(11) Malandrino, M.; Abollino, O.; Giacomino, A.; Aceto, M.;Mentasti, E. Adsorption of heavy metals on vermiculite: influence ofpH and organic ligands. J. Colloid Interface Sci. 2006, 299, 537−546.(12) Boonfueng, T.; Axe, L.; Xu, Y.; Tyson, T. A. Nickel and leadsequestration in manganese oxide-coated montmorillonite. J. ColloidInterface Sci. 2006, 303, 87−98.(13) Gupta, V. K.; Saini, V. K.; Jain, N. Adsorption of As(III) fromaqueous solutions by iron oxide-coated sand. J. Colloid Interface Sci.2005, 288 (1), 55−60.(14) Boujelben, N.; Bouzid, J.; Elouear, Z.; Feki, M.; Jamoussi, F.;Montiel, A. Phosphorus removal from aqueous solution using ironcoated natural and engineer adsorbents. J. Hazard. Mater 2008, 151(1), 103−110.(15) Han, R. H.; Zou, W.; Zhang, Z. P.; Shi, J.; Yang, J. J. Removal ofcopper(II) and lead(II) from aqueous solution by manganese oxidecoated sand: I. Characterization and kinetic study. J. Hazard. Mater.2006, 137 (1), 384−395.(16) Han, R. H.; Zou, W.; Li, H.; Li, Y.; Shi, J. Copper(II) andlead(II) removal from aqueous solution in fixed-bed columns bymanganese oxide coated zeolite. J. Hazard. Mater. 2006, 137 (2),934−942.(17) Han, R. H.; Zou, W.; Zhang, Z. P.; Shi, J.; Yang, J. J. Kineticstudy of adsorption of Cu(II) and Pb(II) from aqueous solutions usingmanganese oxide coated zeolite in batch mode. Colloid Surf. A: Phys.Eng. Asp. 2006, 279 (1−3), 238−246.(18) KhraishehMajeda, A. M.; Al-degsYahya, S.; Wendy, A. M. M.Remediation of wastewater containing heavy metals using raw andmodified diatomite. Chem. Eng. J. 2004, 99 (2), 177−184.(19) Manz, O. E. Coal fly ash: a retrospective and future look. Fuel1999, 78, 133−136.(20) Toscano, G.; Caristi, C.; Cimino, G. Sorption of heavy metalfrom aqueous solution by volcanic ash. C. R. Chimie 2008, 11,765−771.(21) Xenidis, A.; Mylona, E.; Pospaliaris, I. Potential use of lignite flyash for the control of acid generation from sulphidic wastes. WasteManage. 2002, 22, 631−41.(22) Rio, S.; Delebarre, A. Removal of mercury in aqueous solutionby fluidized bed plant fly ash. Fuel 2003, 82, 153−9.(23) Viraraghavan, T.; Dronamraju, M. M. Utilization of coal ash inwater pollution control. Int. J. Environ. Stud. 1992, 40, 79−85.(24) Gupta, V. K.; Sharma, S.; Yadav, I. S.; Mohan, D. Utilization ofbagasse fly ash generated in the sugar industry for the removal andrecovery of phenol and p-nitrophenol from wastewaters. Technol.Biotechnol. 1998, 71, 180−6.(25) Janos, P.; Buchtov, H.; Ryznarova, M. Sorption of dyes fromaqueous solutions onto fly ash. Water Res. 2003, 37, 4938−4944.(26) Gupta, V. K.; Mohan, D.; Sharma, S.; Sharma, M. Removal ofbasic dye (Rhodamine B and Methylene Blue) from aqueous solutionsusing bagasse fly ash. Sep. Sci. Technol. 2000, 35, 2097−2113.(27) Mohan, D.; Singh, K. P.; Singh, G.; Kumar, K. Removal of dyesfrom wastewater using fly ash, a low-cost adsorbent. Ind. Eng. Chem.Res. 2002, 41, 3688−3695.(28) Brunori, C.; Balzamo, S.; Morabito, R. Comparison betweendifferent leaching tests for the evaluation of metal release from fly ashFresenius. J. Anal. Chem. 2001, 371, 843−8.(29) Srivastava, V. C.; Mall, I. D.; Mishra, I. M. Characterization ofmesoporous rice husk ash (RHA) and adsorption kinetics of metalions from aqueous solution onto RHA. J. Hazard. Mater. 2006, 134,257−267.
(30) Lee, K. M. Interface Properties of Nickel-silicide Films Depositedby Using Plasma-assisted Atomic Layer Deposition. J. Korean Phys. Soc.2009, 55 (3), 1153−1157.(31) Karakus, M.; Alpoguz, H. K.; Kaya, A.; Acar, N.; Gorgulu, A. O.;Arslan, M. A kinetic study of mercury(II) transport through amembrane assisted by new transport reagent. Chem. Cent. J. 2011, 5,43−49.(32) Do, D. D. Adsorption Analysis: Equilibria and Kinetics; ImperialCollege Press: London, 1998.(33) Ho, Y. S.; McKay, G. Pseudo-second order model for sorptionprocesses. Process Biochem. 1999, 34, 451−465.(34) Ho, Y. S.; McKay, G. Sorption of dyes and copper ions ontobiosorbents. Process Biochem. 2003, 38, 1047−1061.(35) Liu, Y.; Shen, L. From Langmuir kinetics to first- and second-order rate equations for adsorption. Langmuir 2008, 24, 11625−11630.(36) Azizian, S.; Haerifar, M.; Bashiri, H. Adsorption of methyl violetonto granular activated carbon: equilibrium, kinetics andmodeling.Chem. Eng. J. 2009, 146, 36−41.(37) Morris, W. J.; Weber, C. I. Kinetics of adsorption on carbonfrom solution. J. Saint. Eng. Div., ASCE. 1963, 89, 31−62.(38) Lagergren, S. Z. Sogeuanten Adsorption Gelosterstoffe Handlingar1898, 24.(39) Bhattacharya, A. K.; Naiya, T. K.; Mandal, S. N.; Das, S. K.Adsorption, kinetics and equilibrium studies on removal of Cr(VI)from aqueous solutions using different low-cost adsorbents. Chem. Eng.J. 2008, 137, 529−541.(40) Yang, X. Y.; Otto, S. R.; Bushra, A. D. Concentration-dependentsurface diffusivity model (CDSDM): numerical development andapplication. J. Chem. Eng. 2003, 94, 199−209.(41) Yang, X. Y.; Bushra, A. D. Application of branched porediffusion model in the adsorption of reactive dyes on activated carbon.J. Chem. Eng. 2001, 83, 15−23.(42) Seleem, H. S.; El-Inany, G. A.; El-Shetary, B. A.; Mousa, M. A.;Hanafy, F. I. The ligational behavior of an isatinic quinolyl hydrazonetowards copper(II)-ions. Chem. Cent. J. 2011, 5, 20−29.(43) Ho, Y. S.; McKay, G. The kinetics of sorption of divalent metalions onto sphagnum moss peat. Water Res. 2000, 34 (30), 735−742.(44) Calero, M.; Blazquez, G.; MartiLara, M. A. Kinetic Modeling ofthe Biosorption of Lead(II) from Aqueous Solutions by Solid WasteResulting from the Olive Oil Production. J. Chem. Eng. Data 2011, 56(7), 3053−3060.(45) Azizian, S. Kinetic models of sorption: a theoretical analysis.J. Colloid Interface Sci. 2004, 276, 47−52.(46) Mahramanlioglu, M.; Kizilcikli, I.; Bicer, I. O. Adsorption offluoride from aqueous solution by acid treated spent bleaching earth.J. Fluorine Chem. 2002, 115, 41−47.(47) Katal, R. pahlavanzadeh, H. Zn(II) ion removal from aqueoussolution by using a polyaniline composite. J. Vinyl Addit. Technol. 2011,17 (2), 138−145.(48) Basha, S.; Jha, B. Estimation of Isotherm Parameters forBiosorption of Cd(II) and Pb(II) onto Brown Seaweed, Lobophoravariegata. J. Chem. Eng. Data 2008, 53 (2), 449−455.(49) Dubinin, M. M.; Radushkevich, L. V. Equation of thecharacteristic curve of activated charcoal. Proc. Acad. Sci. U.S.S.R.Phys. Chem. Sect. 1947, 55, 331.(50) Omraei, M.; Esfandian, H.; Katal, R.; Ghorbani, M. Study of theremoval of Zn(II) from aqueous solution using polypyrrole nano-composite. Desalination 2011, 271, 248−256.(51) Katal, R.; Ghiass, M.; Esfandian, H. Application of NanometerSize of Polypyrrole as a Suitable Adsorbent for Removal of Cr(VI).J. Vinyl Addit. Technol. 2011, 17 (3), 222−230.(52) Jaycok, M. J.; Parfitt, G. D. Chemistry of interfaces; Ellis HorwoodLimited: New York, 1981.(53) Gupta, V. K.; Jain, R.; Siddiqui, M. N.; Saleh, T. A.; Agarwal, S.;Malati, S.; Pathak, D. Equilibrium and Thermodynamic Studies on theAdsorption of the Dye Rhodamine-B onto Mustard Cake andActivated Carbon. J. Chem. Eng. Data 2010, 55 (11), 5225−5229.
Journal of Chemical & Engineering Data Article
dx.doi.org/10.1021/je200953h | J. Chem. Eng.Data 2012, 57, 374−383383
Top Related
Copyright © 2022 FDOKUMEN

