


Bahasa
Halaman
Hukum

Catalogue no. 88F0006X, no. 3ISSN 1921-300XISBN 978-1-100-15339-1
..Working paper........................................................................
Business Special Surveys and Technology StatisticsDivision Working Papers
Characteristics of CanadianManufacturing Firms ThatUndertake Design Activities: AnEmpirical Analysis of Resultsof the Survey of AdvancedTechnology, 2007
by Horatio Sam-Aggrey
Business Special Surveys and Technology Statistics Division7-N, R.H. Coats, Ottawa, K1A 0T6
Telephone: 1-800-263-1136
How to obtain more information
For information about this product or the wide range of services and data available from Statistics Canada, visit our website atwww.statcan.gc.ca, e-mail us at [email protected], or telephone us, Monday to Friday from 8:30 a.m. to 4:30 p.m., at thefollowing numbers:
Statistics Canada’s National Contact Centre
Toll-free telephone (Canada and the United States):Inquiries line 1-800-263-1136National telecommunications device for the hearing impaired 1-800-363-7629Fax line 1-877-287-4369
Local or international calls:Inquiries line 1-613-951-8116Fax line 1-613-951-0581
Depository Services ProgramInquiries line 1-800-635-7943Fax line 1-800-565-7757
To access this product
This product, Catalogue no. 88F0006X, is available free in electronic format. To obtain a single issue, visit our website atwww.statcan.gc.ca and browse by “Key resource” > “Publications.”
Standards of service to the public
Statistics Canada is committed to serving its clients in a prompt, reliable and courteous manner. To this end, Statistics Canadahas developed standards of service that its employees observe. To obtain a copy of these service standards, please contactStatistics Canada toll-free at 1-800-263-1136. The service standards are also published on www.statcan.gc.ca under “About us”> “Providing services to Canadians.”
Statistics CanadaBusiness Special Surveys and Technology Statistics Division
Characteristics of Canadian Manufacturing FirmsThat Undertake Design Activities: An EmpiricalAnalysis of Results of the Survey of AdvancedTechnology, 2007
Published by authority of the Minister responsible for Statistics Canada
© Minister of Industry, 2010
All rights reserved. The content of this electronic publication may be reproduced, inwhole or in part, and by any means, without further permission from Statistics Canada,subject to the following conditions: that it be done solely for the purposes of privatestudy, research, criticism, review or newspaper summary, and/or for non-commercialpurposes; and that Statistics Canada be fully acknowledged as follows: Source (or“Adapted from”, if appropriate): Statistics Canada, year of publication, name ofproduct, catalogue number, volume and issue numbers, reference period and page(s).Otherwise, no part of this publication may be reproduced, stored in a retrieval systemor transmitted in any form, by any means—electronic, mechanical or photocopy—orfor any purposes without prior written permission of Licensing Services, ClientServices Division, Statistics Canada, Ottawa, Ontario, Canada K1A 0T6.
May 2010
Catalogue no. 88F0006X, no. 3
ISSN 1921-300XISBN 978-1-100-15339-1
Frequency: Occasional
Ottawa
Cette publication est également disponible en français.
Note of appreciation
Canada owes the success of its statistical system to a long-standing partnership betweenStatistics Canada, the citizens of Canada, its businesses, governments and otherinstitutions. Accurate and timely statistical information could not be produced withouttheir continued cooperation and goodwill.
User information
Symbols
The following standard symbols are used in Statistics Canada publications:
. not available for any reference period
.. not available for a specific reference period
... not applicable
0 true zero or a value rounded to zero
0s value rounded to 0 (zero) where there is a meaningful distinction between true zero and the value that wasrounded
p preliminary
r revised
x suppressed to meet the confidentiality requirements of the Statistics Act
E use with caution
F too unreliable to be published
2 Statistics Canada – Catalogue no. 88F0006X, no. 3
Table of contents
Abstract 4
Acknowledgments 5
Characteristics of Canadian Manufacturing Firms That Undertake Design Activities: An EmpiricalAnalysis of Results of the Survey of Advanced Technology, 2007
1 Introduction 62 Methodology 73 Characteristics of manufacturing firms that carry out design activities 74 Characteristics of firms with high intensity design 145 In-house design and externally acquired design expenditures 156 Summary and next steps 207 References 20
Statistics Canada – Catalogue no. 88F0006X, no. 3 3
AbstractDesign activities are central to firm competitiveness and delivering value-added products. Research has shownthat rapidly growing companies attach greater weight to design activities. Through design, firms may improve theuser interface and create characteristics that allow them to distinguish their products from those of their competitors.Using the results of the Survey of Advanced Technology 2007, this paper examines the extent of use of designactivities among Canadian firms, with a view to explaining factors fostering firms’ engagement in design activities. Itexplores whether design activities are more likely to be carried out in some manufacturing industries than in others.The average size of firms undertaking design activities will also be explored. Characteristics of firms that are likelyto spend a greater proportion of their expenditures on in-house design activities versus those who outsource largerpercentage of their design work to other firms outside their organizational boundaries will be discussed. This paperwill also explore whether firms that have high design intensity are more likely to be innovators. Another area ofinterest of this paper is the question of whether firms that undertake design activities are more likely to be exporters.Common success factors reported by those firms with high design intensity will also be discussed.
4 Statistics Canada – Catalogue no. 88F0006X, no. 3

AcknowledgmentsI wish to thank Susan Schaan, Frances Anderson, Iddi Alhassan, Eric Turgeon and Heather Berrea for the immensehelp they offered to me. This paper was first presented at the Statistics Canada Socio-economic Conference inMay 2009, with support from Paula Thomson, Director, Business Special Surveys and Technology Statistics Division,Statistics Canada.
Statistics Canada – Catalogue no. 88F0006X, no. 3 5
Characteristics of Canadian Manufacturing Firms That Undertake DesignActivities: An Empirical Analysis of Results of the Survey of AdvancedTechnology, 2007
1 IntroductionA number of landmark studies of the benefits accruing to firms emanating from investments in design have resultedin a growing consensus in the literature that design has become central to firm competitiveness, customer loyaltyand delivering value-added products (Power, 2004; New Zealand Design Taskforce, 2003; Lash and Urry, 1994).Design has been shown to have a positive influence on ‘time to market’,1 new product success rate, percentageof revenue from new products, innovation and export levels (Power, 2004; New Zealand Design Taskforce, 2003;United Kingdom (UK) Design Council, 2005). The increasing productivity gap between the United States (US) andCanada is an area of policy interest in Canada and design has been identified as a critical element in achievingbetter productivity in Canadian firms (Industry Canada, 2010).
In the secondary literature, there is no generally agreed upon definition of design. According to Lawson (2006)design is difficult to define because it can be applied to a wide range of activities including activities that couldbe called ‘engineering’ and others that could be called ‘art’. Design can be broadly defined as “the purposefulor inventive arrangement of parts or details” (The American Heritage Dictionary, 2000). Design activities mayencompass graphical design; industrial design; fashion and textile design, interior design, furniture design; webdesign; technical design, design planning and management; and experience design (Danish Design Centre, 2003;UK Design Council, 2005). Design within the firm can be implemented during various phases of production. Forexample, design can be implemented during the research and development phase, the manufacturing phase,during the creation of retail environments phase and in the branding, packaging and marketing of goods (Gertlerand Vinodrai, 2006: 6).
Despite the growing importance of design to firm competitiveness, few studies have been conducted on the useof design among Canadian manufacturing firms. Recent studies on design in Canada have concentrated on thecharacteristics of design professionals and professional design firms (Gertler and Vinodrai, 2004, Gertler andVinodrai, 2006, Vinodrai, 2006, Design Industry Advisory Committee, 2004). In addition, much of the evidence onthe effects of design on firm performance is derived from European data. There is a gap in the literature relating tothe use of design by Canadian firms.
Using the results of Statistics Canada’s Survey of Advanced Technology (SAT) 2007, this paper outlines thecharacteristics of Canadian manufacturing firms that carry out design with a view to explaining factors fosteringfirms’ engagement in design activities. The remainder of the paper is organized as follows. The methodologyused to collect and process the data that was used in this paper is outlined in section two. In section three, thecharacteristics of firms that carry out design activities including industrial and size distribution of firms, percentageof full-time employees engaged in research and development (R&D), adoption of advanced technologies,expenditures on design activities, and exporter status are presented. The relationship between the performanceof design and innovation status are explored.
1. Time to market is defined as the time it takes from the conceptualization of a product idea to the time it is ready to be distributed. A faster time to market reflectsa better integration of the design, manufacturing and managing processes in a firm (Industry Canada, ND).
6 Statistics Canada – Catalogue no. 88F0006X, no. 3
Business Special Surveys and Technology Statistics Division Working Papers
The fourth section of the paper focuses on the characteristics of firms that spend a high percentage of their totalexpenditure on design. Common success factors of high importance reported by high intensity design firms are alsodiscussed.
The fifth section compares the characteristics of firms that spend a large proportion of their expenditures on in-housedesign activities to those who spend a high percentage of their expenditure on design externally.
The paper concludes with a summary of key findings.
2 MethodologyThis paper uses data from the Survey of Advanced Technology (SAT) 2007,2 a survey that was sent to a stratifiedrandom sample of 9,441 manufacturing statistical establishments operating in Canada. Although the collection entityfor the survey was the statistical establishment, this paper uses the more familiar term of “firm”. The survey usedStatistics Canada’s Business Register as its frame. In order to be considered for sample selection, the firm had tohave at least 20 employees and have at least $250,000 in revenues.
The overall response rate for the SAT 2007 was 72.5% (for manufacturing) for a total of 6,733 completedquestionnaires. Response rate is calculated as the total number of completed questionnaires as a percentageof the number of total active, in-scope sample units. This paper will analyse data from the manufacturing sectorat the national level or 6,034 completed questionnaires.
The quality of estimates used in this analysis has been assessed based on standard error and imputation rates.Only estimates of publishable quality have been used in this analysis. All comparisons of estimates made within thispaper have been evaluated for statistically significant differences. The value of the standard error of each estimateprovides a confidence interval of the estimate, the likelihood that the estimate falls within the given range 95 times outof 100. Where confidence intervals for individual estimates overlap, these estimates are said to not be statisticallysignificantly different from each other.
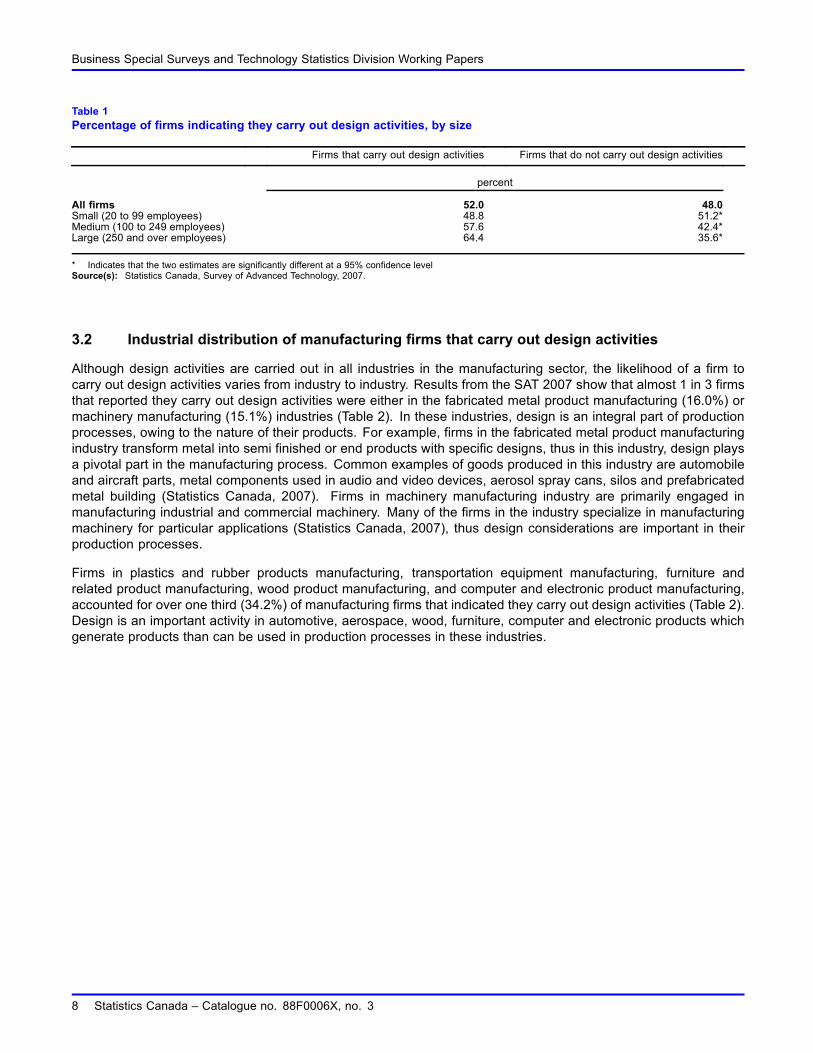
3 Characteristics of manufacturing firms that carry out design activitiesThe SAT 2007 asked manufacturing firms whether they carried out design activities. The questionnaire specifiedthat design activities may include creative problem solving in the development, engineering, testing and/orcommunication of designs for products, structures, and/or systems. According to the SAT 2007, Canadianmanufacturing firms are more likely than not to carry out design activities. Half (52.0%) of Canadian manufacturingfirms indicated they carry out design activities (Table 1).
3.1 Size of manufacturing firms that carry out design activities
Almost half (48.8%) of small firms (20 to 99 employees) indicated they carry out design activities. The probabilityof a firm carrying out design increases with firm size, from over half (57.6%) among medium-sized firms(100 to 249 employees) to almost two-thirds (64.4%) for large-sized firms (250 and over employees).
2. For detailed information on the methodology of the SAT 2007, please consult http://www.statcan.gc.ca/cgi-bin/imdb/p2SV.pl?Function=getSurvey&SurvId=4223&SurvVer=2&InstaId=14681&InstaVer=4&SDDS=4223&lang=en&db=imdb&adm=8&dis=2.
Statistics Canada – Catalogue no. 88F0006X, no. 3 7
Business Special Surveys and Technology Statistics Division Working Papers
Table 1Percentage of firms indicating they carry out design activities, by size
Firms that carry out design activities Firms that do not carry out design activities
percent
All firms 52.0 48.0Small (20 to 99 employees) 48.8 51.2*Medium (100 to 249 employees) 57.6 42.4*Large (250 and over employees) 64.4 35.6*
* Indicates that the two estimates are significantly different at a 95% confidence levelSource(s): Statistics Canada, Survey of Advanced Technology, 2007.
3.2 Industrial distribution of manufacturing firms that carry out design activities
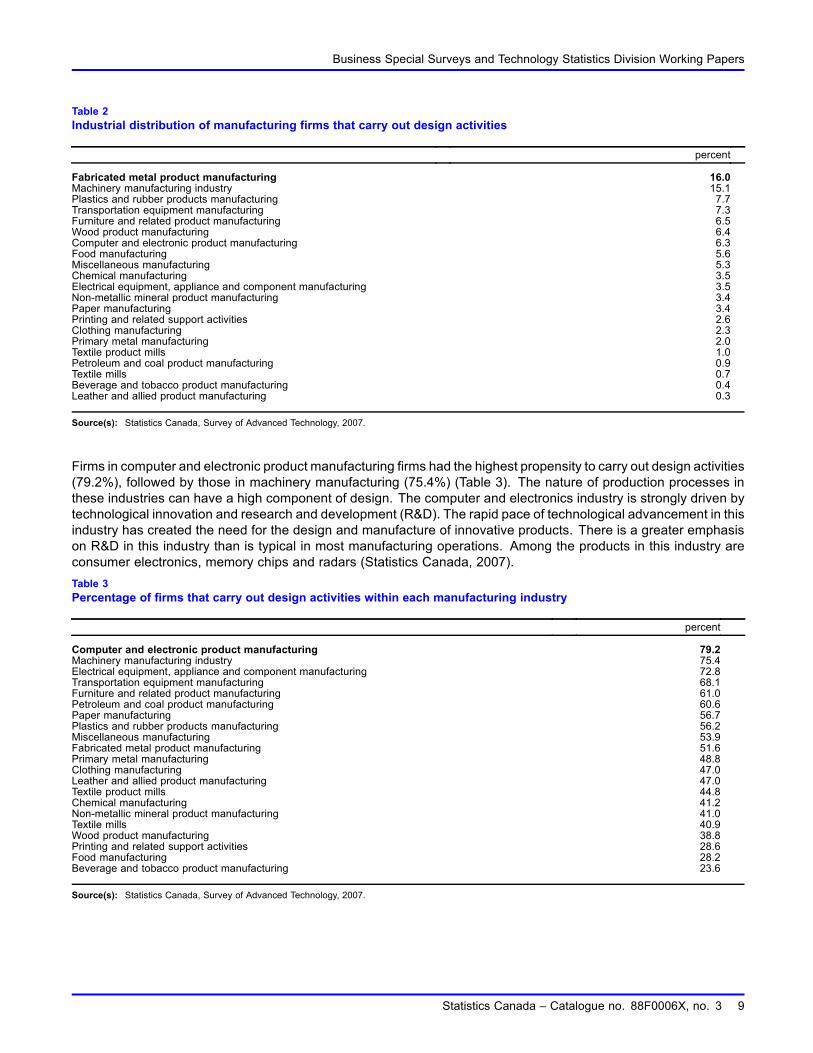
Although design activities are carried out in all industries in the manufacturing sector, the likelihood of a firm tocarry out design activities varies from industry to industry. Results from the SAT 2007 show that almost 1 in 3 firmsthat reported they carry out design activities were either in the fabricated metal product manufacturing (16.0%) ormachinery manufacturing (15.1%) industries (Table 2). In these industries, design is an integral part of productionprocesses, owing to the nature of their products. For example, firms in the fabricated metal product manufacturingindustry transform metal into semi finished or end products with specific designs, thus in this industry, design playsa pivotal part in the manufacturing process. Common examples of goods produced in this industry are automobileand aircraft parts, metal components used in audio and video devices, aerosol spray cans, silos and prefabricatedmetal building (Statistics Canada, 2007). Firms in machinery manufacturing industry are primarily engaged inmanufacturing industrial and commercial machinery. Many of the firms in the industry specialize in manufacturingmachinery for particular applications (Statistics Canada, 2007), thus design considerations are important in theirproduction processes.
Firms in plastics and rubber products manufacturing, transportation equipment manufacturing, furniture andrelated product manufacturing, wood product manufacturing, and computer and electronic product manufacturing,accounted for over one third (34.2%) of manufacturing firms that indicated they carry out design activities (Table 2).Design is an important activity in automotive, aerospace, wood, furniture, computer and electronic products whichgenerate products than can be used in production processes in these industries.
8 Statistics Canada – Catalogue no. 88F0006X, no. 3
Business Special Surveys and Technology Statistics Division Working Papers
Table 2Industrial distribution of manufacturing firms that carry out design activities
percent
Fabricated metal product manufacturing 16.0Machinery manufacturing industry 15.1Plastics and rubber products manufacturing 7.7Transportation equipment manufacturing 7.3Furniture and related product manufacturing 6.5Wood product manufacturing 6.4Computer and electronic product manufacturing 6.3Food manufacturing 5.6Miscellaneous manufacturing 5.3Chemical manufacturing 3.5Electrical equipment, appliance and component manufacturing 3.5Non-metallic mineral product manufacturing 3.4Paper manufacturing 3.4Printing and related support activities 2.6Clothing manufacturing 2.3Primary metal manufacturing 2.0Textile product mills 1.0Petroleum and coal product manufacturing 0.9Textile mills 0.7Beverage and tobacco product manufacturing 0.4Leather and allied product manufacturing 0.3
Source(s): Statistics Canada, Survey of Advanced Technology, 2007.
Firms in computer and electronic product manufacturing firms had the highest propensity to carry out design activities(79.2%), followed by those in machinery manufacturing (75.4%) (Table 3). The nature of production processes inthese industries can have a high component of design. The computer and electronics industry is strongly driven bytechnological innovation and research and development (R&D). The rapid pace of technological advancement in thisindustry has created the need for the design and manufacture of innovative products. There is a greater emphasison R&D in this industry than is typical in most manufacturing operations. Among the products in this industry areconsumer electronics, memory chips and radars (Statistics Canada, 2007).Table 3Percentage of firms that carry out design activities within each manufacturing industry
percent
Computer and electronic product manufacturing 79.2Machinery manufacturing industry 75.4Electrical equipment, appliance and component manufacturing 72.8Transportation equipment manufacturing 68.1Furniture and related product manufacturing 61.0Petroleum and coal product manufacturing 60.6Paper manufacturing 56.7Plastics and rubber products manufacturing 56.2Miscellaneous manufacturing 53.9Fabricated metal product manufacturing 51.6Primary metal manufacturing 48.8Clothing manufacturing 47.0Leather and allied product manufacturing 47.0Textile product mills 44.8Chemical manufacturing 41.2Non-metallic mineral product manufacturing 41.0Textile mills 40.9Wood product manufacturing 38.8Printing and related support activities 28.6Food manufacturing 28.2Beverage and tobacco product manufacturing 23.6
Source(s): Statistics Canada, Survey of Advanced Technology, 2007.
Statistics Canada – Catalogue no. 88F0006X, no. 3 9
Business Special Surveys and Technology Statistics Division Working Papers
3.3 R&D activities
The SAT 2007 asked firms to report the percentage of their full-time employees in 2007 that were involved in researchand development (R&D). Over three-quarters (77.0%) of Canadian manufacturing firms had from 1% to 10% of theiremployees engaged in R&D activities in 2007. Based on this distribution, firms can be classified into two groups:low R&D employee intensive firms (firms that had from 1% to 10% of their employees involved in R&D) and highR&D employee intensive firms (firms with more than 10% of their employees involved in R&D).
Manufacturing firms that indicated they carry out design activities were more likely than not to indicate they had someemployees involved in R&D in 2007 (78.3% versus 39.0%). Further, 22.9% of manufacturing firms that indicatedthey carry out design activities were high R&D employee intensive firms in 2007.
3.4 Advanced technology use
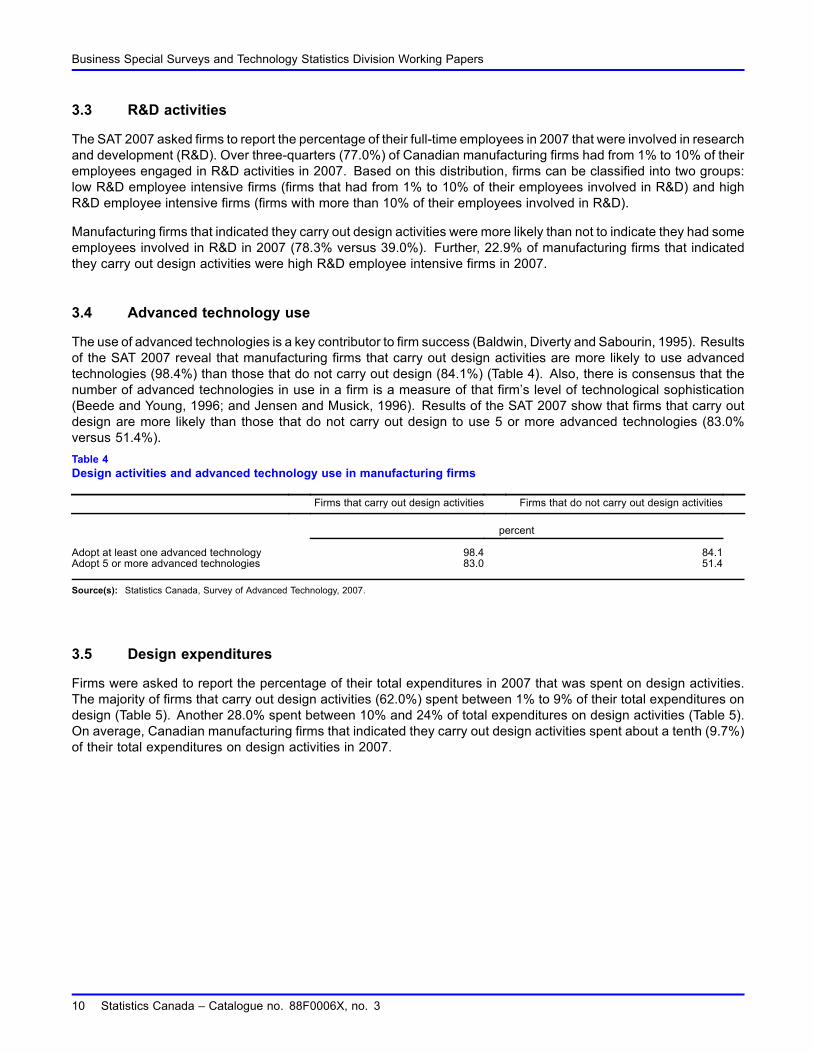
The use of advanced technologies is a key contributor to firm success (Baldwin, Diverty and Sabourin, 1995). Resultsof the SAT 2007 reveal that manufacturing firms that carry out design activities are more likely to use advancedtechnologies (98.4%) than those that do not carry out design (84.1%) (Table 4). Also, there is consensus that thenumber of advanced technologies in use in a firm is a measure of that firm’s level of technological sophistication(Beede and Young, 1996; and Jensen and Musick, 1996). Results of the SAT 2007 show that firms that carry outdesign are more likely than those that do not carry out design to use 5 or more advanced technologies (83.0%versus 51.4%).Table 4Design activities and advanced technology use in manufacturing firms
Firms that carry out design activities Firms that do not carry out design activities
percent
Adopt at least one advanced technology 98.4 84.1Adopt 5 or more advanced technologies 83.0 51.4
Source(s): Statistics Canada, Survey of Advanced Technology, 2007.
3.5 Design expenditures
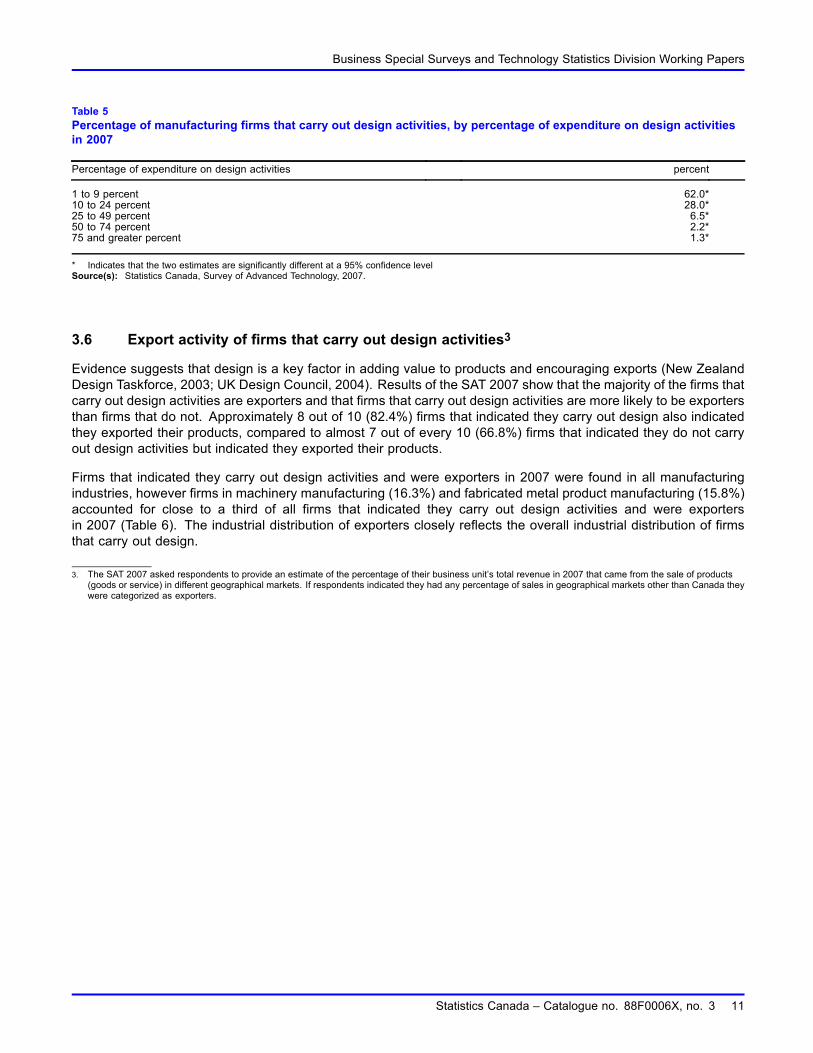
Firms were asked to report the percentage of their total expenditures in 2007 that was spent on design activities.The majority of firms that carry out design activities (62.0%) spent between 1% to 9% of their total expenditures ondesign (Table 5). Another 28.0% spent between 10% and 24% of total expenditures on design activities (Table 5).On average, Canadian manufacturing firms that indicated they carry out design activities spent about a tenth (9.7%)of their total expenditures on design activities in 2007.
10 Statistics Canada – Catalogue no. 88F0006X, no. 3
Business Special Surveys and Technology Statistics Division Working Papers
Table 5Percentage of manufacturing firms that carry out design activities, by percentage of expenditure on design activitiesin 2007
Percentage of expenditure on design activities percent
1 to 9 percent 62.0*10 to 24 percent 28.0*25 to 49 percent 6.5*50 to 74 percent 2.2*75 and greater percent 1.3*
* Indicates that the two estimates are significantly different at a 95% confidence levelSource(s): Statistics Canada, Survey of Advanced Technology, 2007.
3.6 Export activity of firms that carry out design activities3
Evidence suggests that design is a key factor in adding value to products and encouraging exports (New ZealandDesign Taskforce, 2003; UK Design Council, 2004). Results of the SAT 2007 show that the majority of the firms thatcarry out design activities are exporters and that firms that carry out design activities are more likely to be exportersthan firms that do not. Approximately 8 out of 10 (82.4%) firms that indicated they carry out design also indicatedthey exported their products, compared to almost 7 out of every 10 (66.8%) firms that indicated they do not carryout design activities but indicated they exported their products.
Firms that indicated they carry out design activities and were exporters in 2007 were found in all manufacturingindustries, however firms in machinery manufacturing (16.3%) and fabricated metal product manufacturing (15.8%)accounted for close to a third of all firms that indicated they carry out design activities and were exportersin 2007 (Table 6). The industrial distribution of exporters closely reflects the overall industrial distribution of firmsthat carry out design.
3. The SAT 2007 asked respondents to provide an estimate of the percentage of their business unit’s total revenue in 2007 that came from the sale of products(goods or service) in different geographical markets. If respondents indicated they had any percentage of sales in geographical markets other than Canada theywere categorized as exporters.
Statistics Canada – Catalogue no. 88F0006X, no. 3 11

Business Special Surveys and Technology Statistics Division Working Papers
Table 6Industrial distribution of firms that carry out design and export their products in 2007
percent
Machinery manufacturing industry 16.3Fabricated metal product manufacturing 15.8Plastics and rubber products manufacturing 8.4Transportation equipment manufacturing 7.8Computer and electronic product manufacturing 7.4Wood product manufacturing 5.6Furniture and related product manufacturing 5.5Miscellaneous manufacturing 4.9Food manufacturing 4.7Electrical equipment, appliance and component manufacturing 3.9Chemical manufacturing 3.7Paper manufacturing 3.6Non-metallic mineral product manufacturing 2.7Primary metal manufacturing 2.4Printing and related support activities 2.2Clothing manufacturing 2.2Textile product mills 0.9Textile mills 0.8Petroleum and coal product manufacturing 0.7Leather and allied product manufacturing 0.4Beverage and tobacco product manufacturing 0.3
Source(s): Statistics Canada, Survey of Advanced Technology, 2007.
Firms in the textile mills (96.3%), computer and electronic product manufacturing (94.6%), leather and allied productmanufacturing (94.2%) and primary metal manufacturing (94.1%) industries that indicated they carry out designactivities have the highest propensities to export their products (Table 7).Table 7Percentage of manufacturing firms that carry out design activities that indicated they exported their products in 2007,by industry
percent
Textile Mills 96.3Computer and electronic product manufacturing 94.6Leather and allied product manufacturing 94.2Primary metal manufacturing 94.1Electrical equipment, appliance and component manufacturing 88.0Plastics and rubber products manufacturing 86.4Machinery manufacturing industry 85.8Transportation equipment manufacturing 85.4Chemical manufacturing 85.4Paper manufacturing 85.0Fabricated metal product manufacturing 79.0Clothing manufacturing 77.4Miscellaneous manufacturing 74.6Wood product manufacturing 70.3Textile product mills 70.2Printing and related support activities 67.7Furniture and related product manufacturing 67.4Food manufacturing 66.7Non-metallic mineral product manufacturing 64.5Beverage and tobacco product manufacturing 60.7Petroleum and coal product manufacturing 60.0
Source(s): Statistics Canada, Survey of Advanced Technology, 2007.
12 Statistics Canada – Catalogue no. 88F0006X, no. 3
Business Special Surveys and Technology Statistics Division Working Papers
3.7 Innovation and design
Innovation status is an important factor influencing export decision (Danish Design Centre, 2003; UK DesignCouncil, 2004). Product (goods or service) design and innovation,4 are increasingly seen as interdependent onone another (Gertler and Vinodrai, 2006). Firms worldwide are responding to changes in market forces and rapidtechnological changes by trying to introduce new products into the market as quickly as possible.
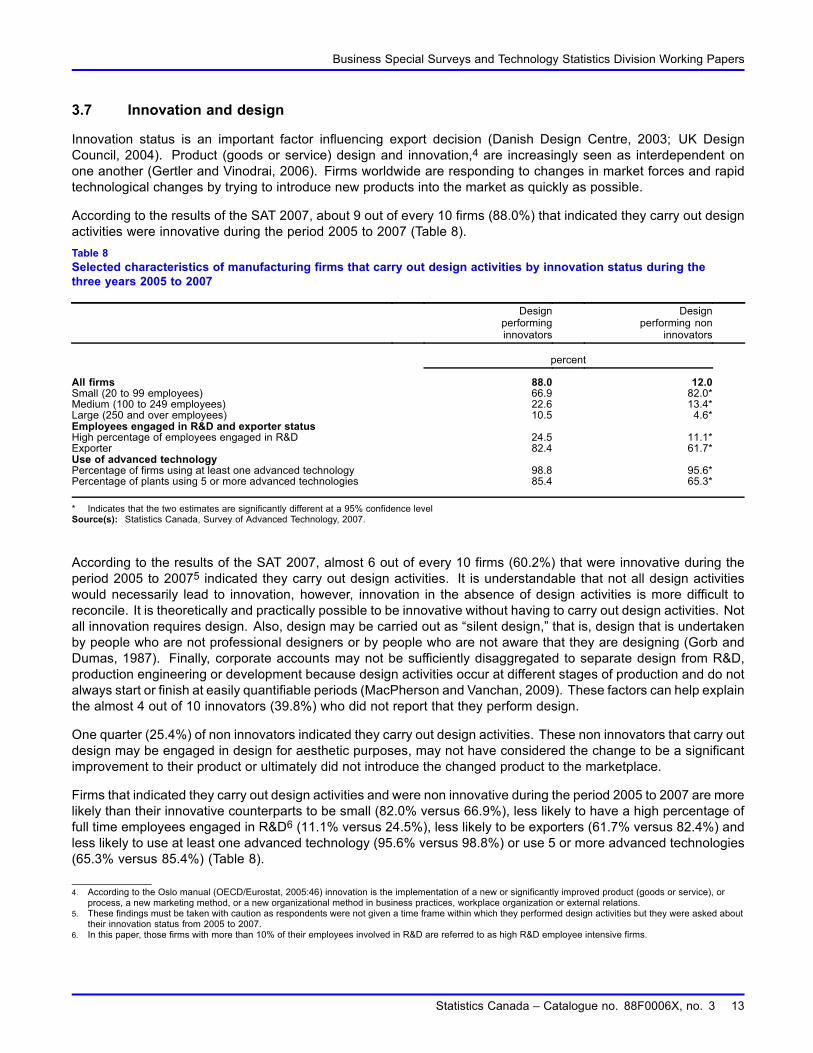
According to the results of the SAT 2007, about 9 out of every 10 firms (88.0%) that indicated they carry out designactivities were innovative during the period 2005 to 2007 (Table 8).Table 8Selected characteristics of manufacturing firms that carry out design activities by innovation status during thethree years 2005 to 2007
Designperforminginnovators
Designperforming non
innovators
percent
All firms 88.0 12.0Small (20 to 99 employees) 66.9 82.0*Medium (100 to 249 employees) 22.6 13.4*Large (250 and over employees) 10.5 4.6*Employees engaged in R&D and exporter statusHigh percentage of employees engaged in R&D 24.5 11.1*Exporter 82.4 61.7*Use of advanced technologyPercentage of firms using at least one advanced technology 98.8 95.6*Percentage of plants using 5 or more advanced technologies 85.4 65.3*
* Indicates that the two estimates are significantly different at a 95% confidence levelSource(s): Statistics Canada, Survey of Advanced Technology, 2007.
According to the results of the SAT 2007, almost 6 out of every 10 firms (60.2%) that were innovative during theperiod 2005 to 20075 indicated they carry out design activities. It is understandable that not all design activitieswould necessarily lead to innovation, however, innovation in the absence of design activities is more difficult toreconcile. It is theoretically and practically possible to be innovative without having to carry out design activities. Notall innovation requires design. Also, design may be carried out as “silent design,” that is, design that is undertakenby people who are not professional designers or by people who are not aware that they are designing (Gorb andDumas, 1987). Finally, corporate accounts may not be sufficiently disaggregated to separate design from R&D,production engineering or development because design activities occur at different stages of production and do notalways start or finish at easily quantifiable periods (MacPherson and Vanchan, 2009). These factors can help explainthe almost 4 out of 10 innovators (39.8%) who did not report that they perform design.
One quarter (25.4%) of non innovators indicated they carry out design activities. These non innovators that carry outdesign may be engaged in design for aesthetic purposes, may not have considered the change to be a significantimprovement to their product or ultimately did not introduce the changed product to the marketplace.
Firms that indicated they carry out design activities and were non innovative during the period 2005 to 2007 are morelikely than their innovative counterparts to be small (82.0% versus 66.9%), less likely to have a high percentage offull time employees engaged in R&D6 (11.1% versus 24.5%), less likely to be exporters (61.7% versus 82.4%) andless likely to use at least one advanced technology (95.6% versus 98.8%) or use 5 or more advanced technologies(65.3% versus 85.4%) (Table 8).
4. According to the Oslo manual (OECD/Eurostat, 2005:46) innovation is the implementation of a new or significantly improved product (goods or service), orprocess, a new marketing method, or a new organizational method in business practices, workplace organization or external relations.
5. These findings must be taken with caution as respondents were not given a time frame within which they performed design activities but they were asked abouttheir innovation status from 2005 to 2007.
6. In this paper, those firms with more than 10% of their employees involved in R&D are referred to as high R&D employee intensive firms.
Statistics Canada – Catalogue no. 88F0006X, no. 3 13
Business Special Surveys and Technology Statistics Division Working Papers
4 Characteristics of firms with high intensity designDesign activities of firms differ with respect to their intensity, orientation, and use of external knowledge. In thispaper, firms spending more than 20% of their total expenditures in 2007 on design are described as firms with highintensity design while those spending between 1% to 20% of their expenditures are considered as firms with lowintensity design. According to results of the SAT 2007, only 10.2% of manufacturing firms can be described as firmswith high intensity design.
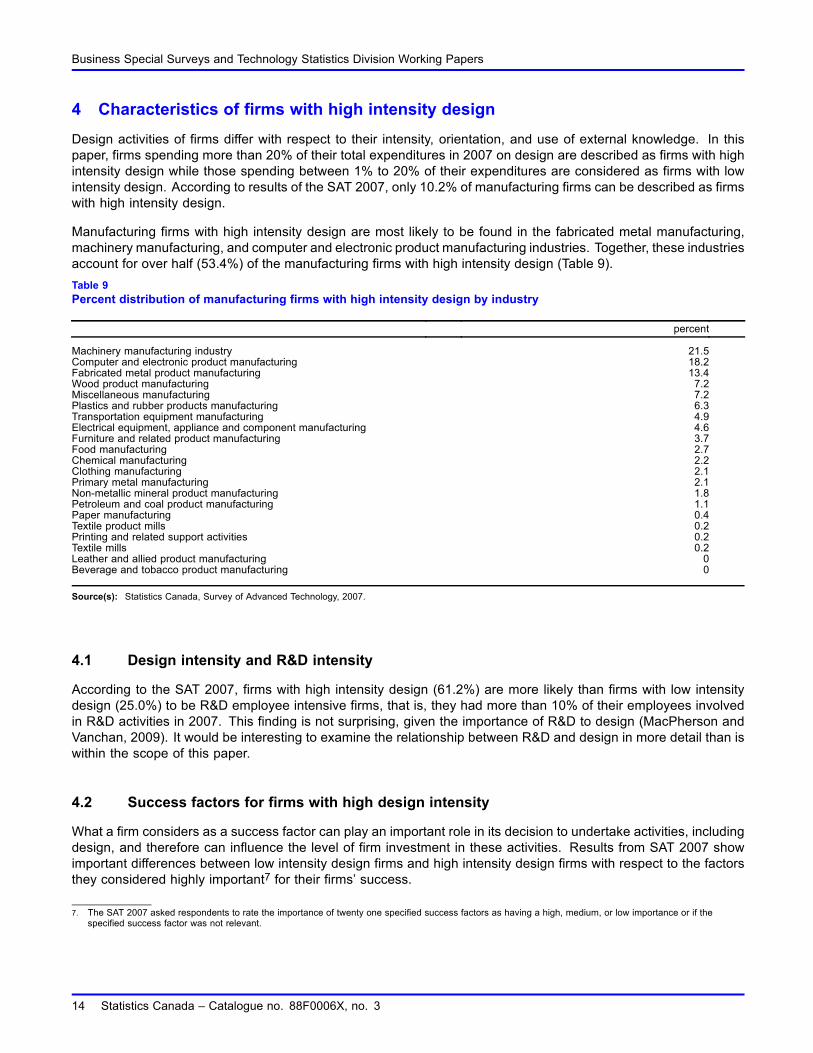
Manufacturing firms with high intensity design are most likely to be found in the fabricated metal manufacturing,machinery manufacturing, and computer and electronic product manufacturing industries. Together, these industriesaccount for over half (53.4%) of the manufacturing firms with high intensity design (Table 9).Table 9Percent distribution of manufacturing firms with high intensity design by industry
percent
Machinery manufacturing industry 21.5Computer and electronic product manufacturing 18.2Fabricated metal product manufacturing 13.4Wood product manufacturing 7.2Miscellaneous manufacturing 7.2Plastics and rubber products manufacturing 6.3Transportation equipment manufacturing 4.9Electrical equipment, appliance and component manufacturing 4.6Furniture and related product manufacturing 3.7Food manufacturing 2.7Chemical manufacturing 2.2Clothing manufacturing 2.1Primary metal manufacturing 2.1Non-metallic mineral product manufacturing 1.8Petroleum and coal product manufacturing 1.1Paper manufacturing 0.4Textile product mills 0.2Printing and related support activities 0.2Textile mills 0.2Leather and allied product manufacturing 0Beverage and tobacco product manufacturing 0
Source(s): Statistics Canada, Survey of Advanced Technology, 2007.
4.1 Design intensity and R&D intensity
According to the SAT 2007, firms with high intensity design (61.2%) are more likely than firms with low intensitydesign (25.0%) to be R&D employee intensive firms, that is, they had more than 10% of their employees involvedin R&D activities in 2007. This finding is not surprising, given the importance of R&D to design (MacPherson andVanchan, 2009). It would be interesting to examine the relationship between R&D and design in more detail than iswithin the scope of this paper.
4.2 Success factors for firms with high design intensity
What a firm considers as a success factor can play an important role in its decision to undertake activities, includingdesign, and therefore can influence the level of firm investment in these activities. Results from SAT 2007 showimportant differences between low intensity design firms and high intensity design firms with respect to the factorsthey considered highly important7 for their firms’ success.
7. The SAT 2007 asked respondents to rate the importance of twenty one specified success factors as having a high, medium, or low importance or if thespecified success factor was not relevant.
14 Statistics Canada – Catalogue no. 88F0006X, no. 3
Business Special Surveys and Technology Statistics Division Working Papers
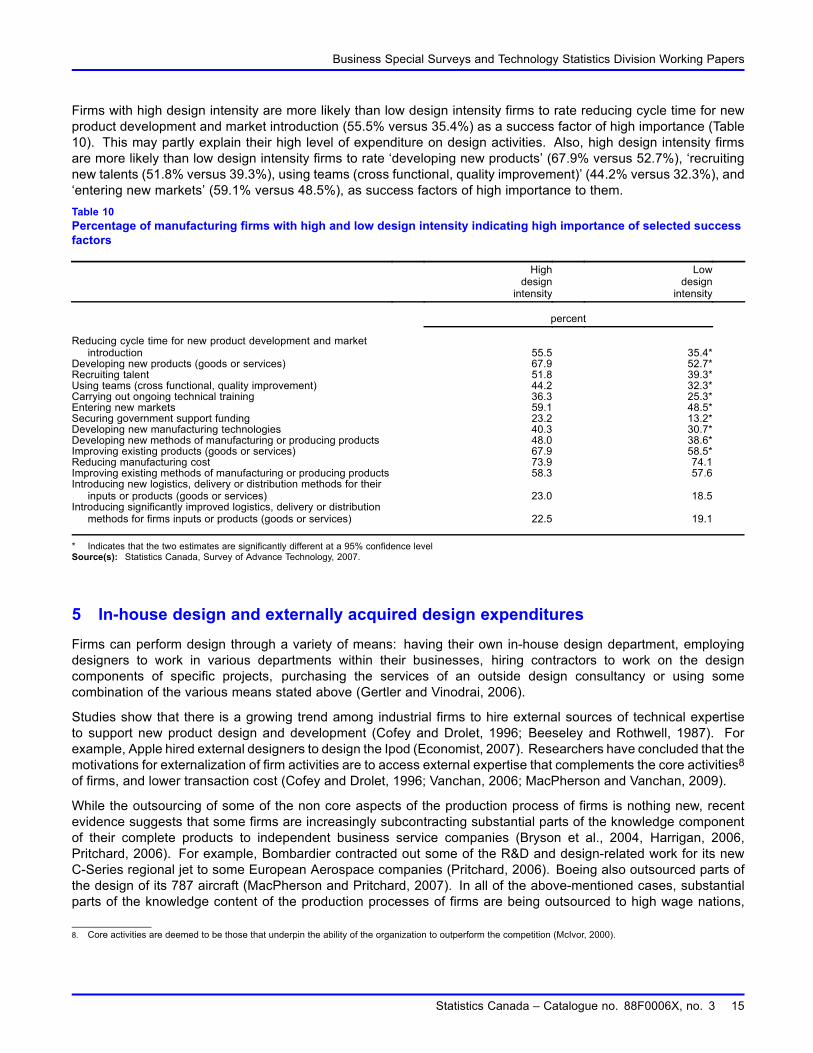
Firms with high design intensity are more likely than low design intensity firms to rate reducing cycle time for newproduct development and market introduction (55.5% versus 35.4%) as a success factor of high importance (Table10). This may partly explain their high level of expenditure on design activities. Also, high design intensity firmsare more likely than low design intensity firms to rate ‘developing new products’ (67.9% versus 52.7%), ‘recruitingnew talents (51.8% versus 39.3%), using teams (cross functional, quality improvement)’ (44.2% versus 32.3%), and‘entering new markets’ (59.1% versus 48.5%), as success factors of high importance to them.Table 10Percentage of manufacturing firms with high and low design intensity indicating high importance of selected successfactors
Highdesignintensity
Lowdesignintensity
percent
Reducing cycle time for new product development and marketintroduction 55.5 35.4*
Developing new products (goods or services) 67.9 52.7*Recruiting talent 51.8 39.3*Using teams (cross functional, quality improvement) 44.2 32.3*Carrying out ongoing technical training 36.3 25.3*Entering new markets 59.1 48.5*Securing government support funding 23.2 13.2*Developing new manufacturing technologies 40.3 30.7*Developing new methods of manufacturing or producing products 48.0 38.6*Improving existing products (goods or services) 67.9 58.5*Reducing manufacturing cost 73.9 74.1Improving existing methods of manufacturing or producing products 58.3 57.6Introducing new logistics, delivery or distribution methods for their
inputs or products (goods or services) 23.0 18.5Introducing significantly improved logistics, delivery or distribution
methods for firms inputs or products (goods or services) 22.5 19.1
* Indicates that the two estimates are significantly different at a 95% confidence levelSource(s): Statistics Canada, Survey of Advance Technology, 2007.
5 In-house design and externally acquired design expendituresFirms can perform design through a variety of means: having their own in-house design department, employingdesigners to work in various departments within their businesses, hiring contractors to work on the designcomponents of specific projects, purchasing the services of an outside design consultancy or using somecombination of the various means stated above (Gertler and Vinodrai, 2006).
Studies show that there is a growing trend among industrial firms to hire external sources of technical expertiseto support new product design and development (Cofey and Drolet, 1996; Beeseley and Rothwell, 1987). Forexample, Apple hired external designers to design the Ipod (Economist, 2007). Researchers have concluded that themotivations for externalization of firm activities are to access external expertise that complements the core activities8of firms, and lower transaction cost (Cofey and Drolet, 1996; Vanchan, 2006; MacPherson and Vanchan, 2009).
While the outsourcing of some of the non core aspects of the production process of firms is nothing new, recentevidence suggests that some firms are increasingly subcontracting substantial parts of the knowledge componentof their complete products to independent business service companies (Bryson et al., 2004, Harrigan, 2006,Pritchard, 2006). For example, Bombardier contracted out some of the R&D and design-related work for its newC-Series regional jet to some European Aerospace companies (Pritchard, 2006). Boeing also outsourced parts ofthe design of its 787 aircraft (MacPherson and Pritchard, 2007). In all of the above-mentioned cases, substantialparts of the knowledge content of the production processes of firms are being outsourced to high wage nations,
8. Core activities are deemed to be those that underpin the ability of the organization to outperform the competition (McIvor, 2000).
Statistics Canada – Catalogue no. 88F0006X, no. 3 15
Business Special Surveys and Technology Statistics Division Working Papers
thus the resource-based perspective which states that firms outsource some services in order to access expertiseoutside of their organizational boundaries offers a more potent explanation for this practice (Harrigan, 2006,Pritchard, 2006), however, for other firms, the decision to outsource design could reflect a mix of cost and resourceavailability factors.
Results from SAT 2007 reveal that 62.1% of manufacturing firms that carry out design activities carry out theseactivities inhouse only. On the other hand, only 2% of manufacturing firms that carry out design activities reportedthat they outsource all of their design activities. The results from this survey also show that 9 out of every 10 (90.2%)Canadian manufacturing firms that carry out design activities spent a greater proportion of their expenditures ondesign in-house.9 The remaining 9.8% spent an equal or larger percentage of their design expenditures on externallyacquired design services (outsourced). Some firms may not consider some of their design activities sacrosanct andmay decide to outsource all or a significant proportion of their design activities.
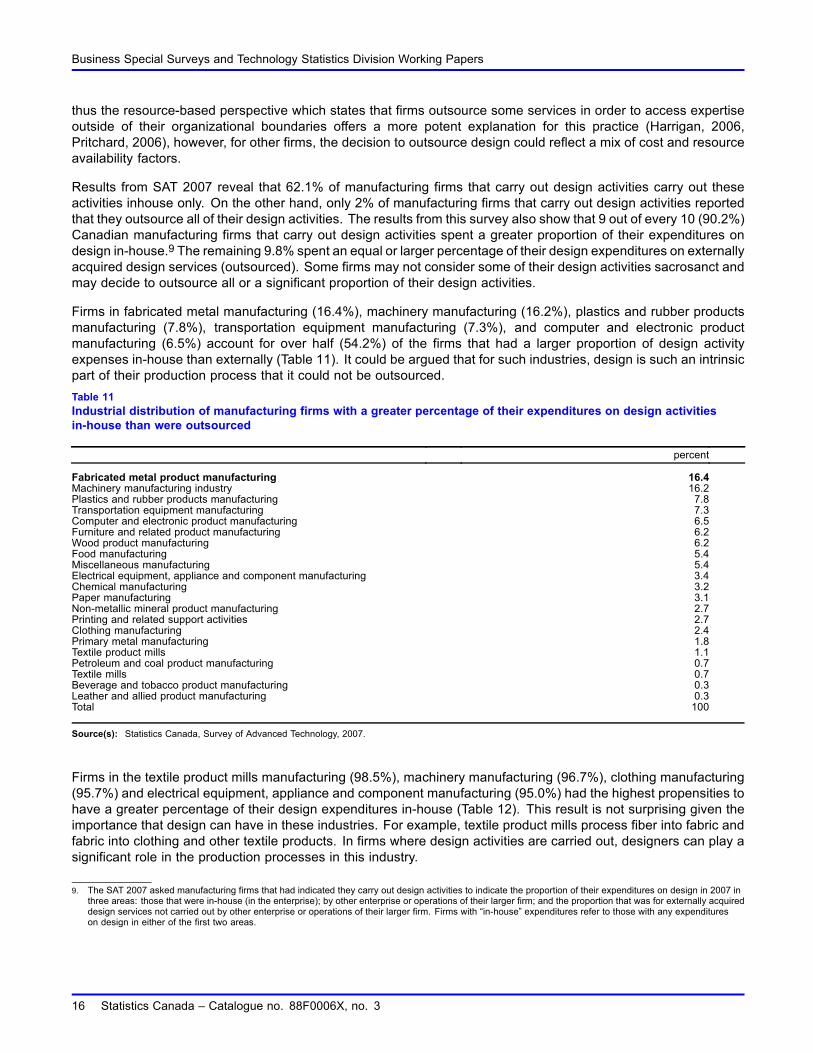
Firms in fabricated metal manufacturing (16.4%), machinery manufacturing (16.2%), plastics and rubber productsmanufacturing (7.8%), transportation equipment manufacturing (7.3%), and computer and electronic productmanufacturing (6.5%) account for over half (54.2%) of the firms that had a larger proportion of design activityexpenses in-house than externally (Table 11). It could be argued that for such industries, design is such an intrinsicpart of their production process that it could not be outsourced.Table 11Industrial distribution of manufacturing firms with a greater percentage of their expenditures on design activitiesin-house than were outsourced
percent
Fabricated metal product manufacturing 16.4Machinery manufacturing industry 16.2Plastics and rubber products manufacturing 7.8Transportation equipment manufacturing 7.3Computer and electronic product manufacturing 6.5Furniture and related product manufacturing 6.2Wood product manufacturing 6.2Food manufacturing 5.4Miscellaneous manufacturing 5.4Electrical equipment, appliance and component manufacturing 3.4Chemical manufacturing 3.2Paper manufacturing 3.1Non-metallic mineral product manufacturing 2.7Printing and related support activities 2.7Clothing manufacturing 2.4Primary metal manufacturing 1.8Textile product mills 1.1Petroleum and coal product manufacturing 0.7Textile mills 0.7Beverage and tobacco product manufacturing 0.3Leather and allied product manufacturing 0.3Total 100
Source(s): Statistics Canada, Survey of Advanced Technology, 2007.
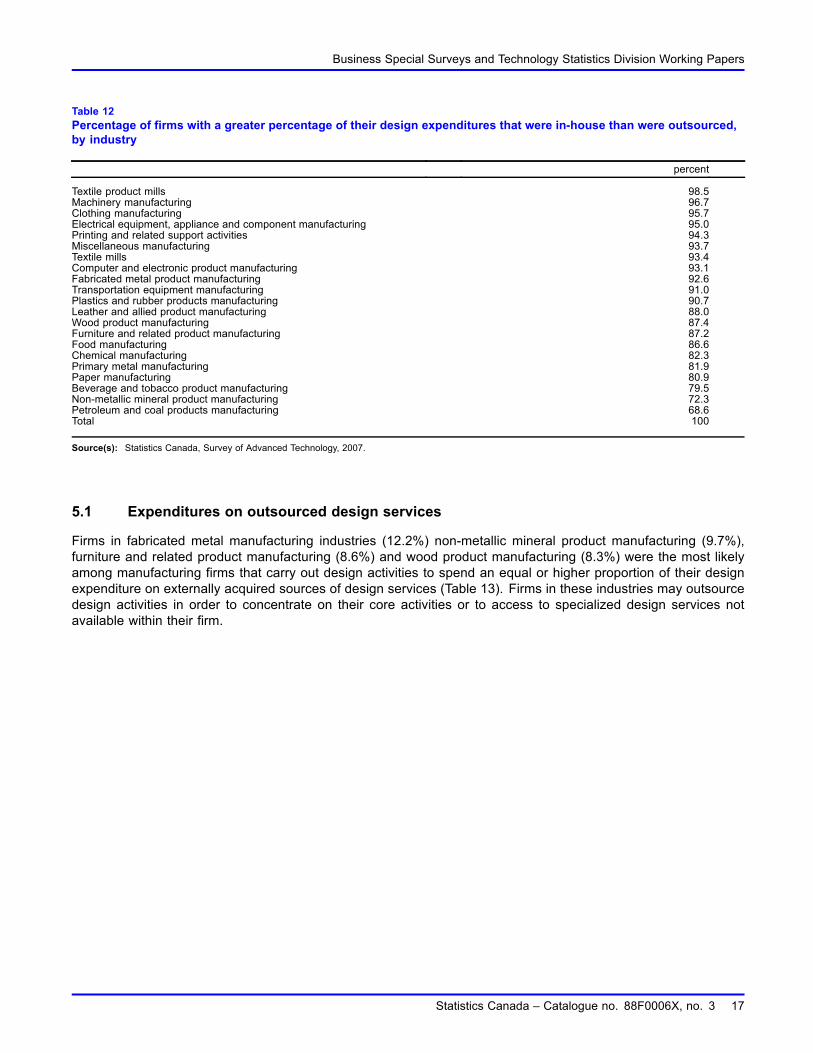
Firms in the textile product mills manufacturing (98.5%), machinery manufacturing (96.7%), clothing manufacturing(95.7%) and electrical equipment, appliance and component manufacturing (95.0%) had the highest propensities tohave a greater percentage of their design expenditures in-house (Table 12). This result is not surprising given theimportance that design can have in these industries. For example, textile product mills process fiber into fabric andfabric into clothing and other textile products. In firms where design activities are carried out, designers can play asignificant role in the production processes in this industry.
9. The SAT 2007 asked manufacturing firms that had indicated they carry out design activities to indicate the proportion of their expenditures on design in 2007 inthree areas: those that were in-house (in the enterprise); by other enterprise or operations of their larger firm; and the proportion that was for externally acquireddesign services not carried out by other enterprise or operations of their larger firm. Firms with “in-house” expenditures refer to those with any expenditureson design in either of the first two areas.
16 Statistics Canada – Catalogue no. 88F0006X, no. 3
Business Special Surveys and Technology Statistics Division Working Papers
Table 12Percentage of firms with a greater percentage of their design expenditures that were in-house than were outsourced,by industry
percent
Textile product mills 98.5Machinery manufacturing 96.7Clothing manufacturing 95.7Electrical equipment, appliance and component manufacturing 95.0Printing and related support activities 94.3Miscellaneous manufacturing 93.7Textile mills 93.4Computer and electronic product manufacturing 93.1Fabricated metal product manufacturing 92.6Transportation equipment manufacturing 91.0Plastics and rubber products manufacturing 90.7Leather and allied product manufacturing 88.0Wood product manufacturing 87.4Furniture and related product manufacturing 87.2Food manufacturing 86.6Chemical manufacturing 82.3Primary metal manufacturing 81.9Paper manufacturing 80.9Beverage and tobacco product manufacturing 79.5Non-metallic mineral product manufacturing 72.3Petroleum and coal products manufacturing 68.6Total 100
Source(s): Statistics Canada, Survey of Advanced Technology, 2007.
5.1 Expenditures on outsourced design services
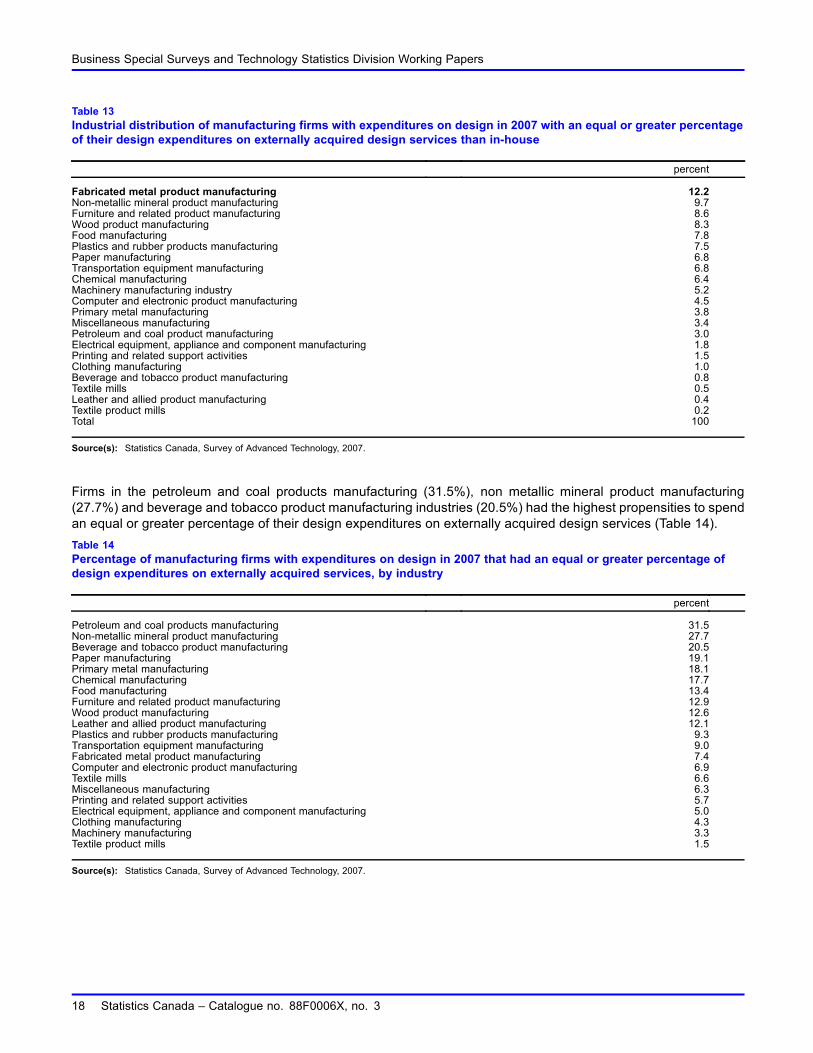
Firms in fabricated metal manufacturing industries (12.2%) non-metallic mineral product manufacturing (9.7%),furniture and related product manufacturing (8.6%) and wood product manufacturing (8.3%) were the most likelyamong manufacturing firms that carry out design activities to spend an equal or higher proportion of their designexpenditure on externally acquired sources of design services (Table 13). Firms in these industries may outsourcedesign activities in order to concentrate on their core activities or to access to specialized design services notavailable within their firm.
Statistics Canada – Catalogue no. 88F0006X, no. 3 17
Business Special Surveys and Technology Statistics Division Working Papers
Table 13Industrial distribution of manufacturing firms with expenditures on design in 2007 with an equal or greater percentageof their design expenditures on externally acquired design services than in-house
percent
Fabricated metal product manufacturing 12.2Non-metallic mineral product manufacturing 9.7Furniture and related product manufacturing 8.6Wood product manufacturing 8.3Food manufacturing 7.8Plastics and rubber products manufacturing 7.5Paper manufacturing 6.8Transportation equipment manufacturing 6.8Chemical manufacturing 6.4Machinery manufacturing industry 5.2Computer and electronic product manufacturing 4.5Primary metal manufacturing 3.8Miscellaneous manufacturing 3.4Petroleum and coal product manufacturing 3.0Electrical equipment, appliance and component manufacturing 1.8Printing and related support activities 1.5Clothing manufacturing 1.0Beverage and tobacco product manufacturing 0.8Textile mills 0.5Leather and allied product manufacturing 0.4Textile product mills 0.2Total 100
Source(s): Statistics Canada, Survey of Advanced Technology, 2007.
Firms in the petroleum and coal products manufacturing (31.5%), non metallic mineral product manufacturing(27.7%) and beverage and tobacco product manufacturing industries (20.5%) had the highest propensities to spendan equal or greater percentage of their design expenditures on externally acquired design services (Table 14).Table 14Percentage of manufacturing firms with expenditures on design in 2007 that had an equal or greater percentage ofdesign expenditures on externally acquired services, by industry
percent
Petroleum and coal products manufacturing 31.5Non-metallic mineral product manufacturing 27.7Beverage and tobacco product manufacturing 20.5Paper manufacturing 19.1Primary metal manufacturing 18.1Chemical manufacturing 17.7Food manufacturing 13.4Furniture and related product manufacturing 12.9Wood product manufacturing 12.6Leather and allied product manufacturing 12.1Plastics and rubber products manufacturing 9.3Transportation equipment manufacturing 9.0Fabricated metal product manufacturing 7.4Computer and electronic product manufacturing 6.9Textile mills 6.6Miscellaneous manufacturing 6.3Printing and related support activities 5.7Electrical equipment, appliance and component manufacturing 5.0Clothing manufacturing 4.3Machinery manufacturing 3.3Textile product mills 1.5
Source(s): Statistics Canada, Survey of Advanced Technology, 2007.
18 Statistics Canada – Catalogue no. 88F0006X, no. 3
Business Special Surveys and Technology Statistics Division Working Papers
5.2 Firm size and location of design activities
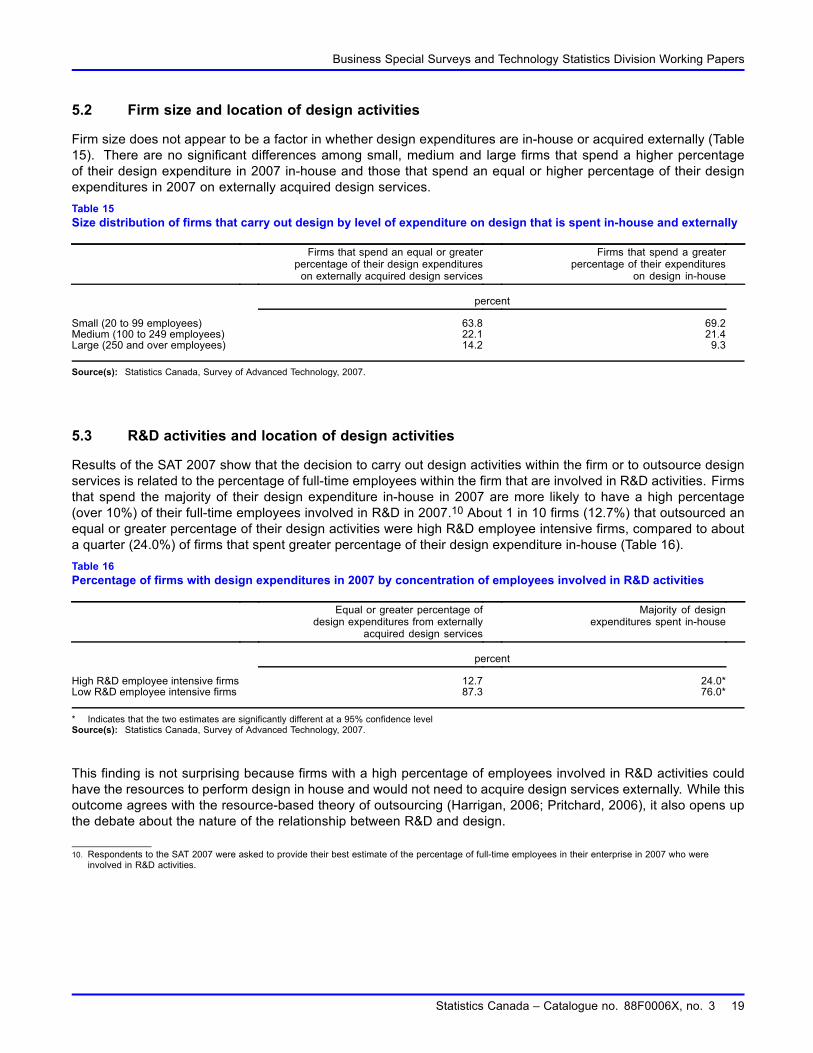
Firm size does not appear to be a factor in whether design expenditures are in-house or acquired externally (Table15). There are no significant differences among small, medium and large firms that spend a higher percentageof their design expenditure in 2007 in-house and those that spend an equal or higher percentage of their designexpenditures in 2007 on externally acquired design services.Table 15Size distribution of firms that carry out design by level of expenditure on design that is spent in-house and externally
Firms that spend an equal or greaterpercentage of their design expenditureson externally acquired design services
Firms that spend a greaterpercentage of their expenditures
on design in-house
percent
Small (20 to 99 employees) 63.8 69.2Medium (100 to 249 employees) 22.1 21.4Large (250 and over employees) 14.2 9.3
Source(s): Statistics Canada, Survey of Advanced Technology, 2007.
5.3 R&D activities and location of design activities
Results of the SAT 2007 show that the decision to carry out design activities within the firm or to outsource designservices is related to the percentage of full-time employees within the firm that are involved in R&D activities. Firmsthat spend the majority of their design expenditure in-house in 2007 are more likely to have a high percentage(over 10%) of their full-time employees involved in R&D in 2007.10 About 1 in 10 firms (12.7%) that outsourced anequal or greater percentage of their design activities were high R&D employee intensive firms, compared to abouta quarter (24.0%) of firms that spent greater percentage of their design expenditure in-house (Table 16).Table 16Percentage of firms with design expenditures in 2007 by concentration of employees involved in R&D activities
Equal or greater percentage ofdesign expenditures from externally
acquired design services
Majority of designexpenditures spent in-house
percent
High R&D employee intensive firms 12.7 24.0*Low R&D employee intensive firms 87.3 76.0*
* Indicates that the two estimates are significantly different at a 95% confidence levelSource(s): Statistics Canada, Survey of Advanced Technology, 2007.
This finding is not surprising because firms with a high percentage of employees involved in R&D activities couldhave the resources to perform design in house and would not need to acquire design services externally. While thisoutcome agrees with the resource-based theory of outsourcing (Harrigan, 2006; Pritchard, 2006), it also opens upthe debate about the nature of the relationship between R&D and design.
10. Respondents to the SAT 2007 were asked to provide their best estimate of the percentage of full-time employees in their enterprise in 2007 who wereinvolved in R&D activities.
Statistics Canada – Catalogue no. 88F0006X, no. 3 19
Business Special Surveys and Technology Statistics Division Working Papers
6 Summary and next stepsThe results of the SAT 2007 show that Canadian manufacturing firms are more likely than not to carry out designactivities. It also shows that about a third of firms that carry out design activities are in the fabricated metal productmanufacturing and machinery manufacturing industries.
Among industries, firms engaged in computer and electronic product manufacturing and those in machinerymanufacturing had the highest propensities to perform design. It could be argued that these are industries whosupply technologically sophisticated goods, which require considerable design intensity.
Firms that carry out design activities were found to be more likely to be exporters than firms that do not carry outdesign activities.
Size is an important factor in the likelihood of a firm performing design activities. Larger firms are more likely thansmaller ones to engage in design activities.
The results of the survey also show that firms that carry out design activities are more likely to be innovators duringthe period 2005 to 2007 than those that do not carry out design. About 9 out of every 10 firms that perform designwere found to be innovators during the period 2005 to 2007. The main differences between design performingfirms that are innovators compared to the non innovators are that the firms in the latter group are more likely to besmall firms, less likely to be exporters, less likely to be using advanced technologies and less likely to have a highpercentage of their employees involved in R&D activities.
Not all innovators carry out design activities. Results of the survey have found that about 6 out of every 10 innovatorscarry out design. This is an interesting finding as it would be expected that innovation involves some element ofdesign. Is it the case that those firms who are innovators but do not perform design are process, organizationalor marketing innovators and not product innovators? On the other hand, is it a case that firms do not necessarilyrecognize the role of “silent design”? It would be interesting to explore the relationship between innovation anddesign further.
Firms with high design intensity aremore likely than firms with low design intensity to emphasize success factors suchas reducing cycle time for new product development and market introduction, developing new products, recruitingnew talents, entering new markets, and developing new manufacturing technologies.
The results of the survey also show that firms that spent an equal or greater percentage of their design expenditureson externally acquired design services are likely to be firms that do not have a high percentage of their full-timeemployees involved in R&D activities.
This paper has presented some findings on the relationship between design and innovation, firm size, industrialdistribution, exporter status. It has confirmed some previous findings on the relationship between outsourcing ofwork and availability of in-house expertise; however, it has also provided opportunities for further research onthe relationship between design and R&D, and design and innovation. Another area of interest is the financialperformance of high design intensity firms. Do these firms show better results than low design intensity firms? Dofirms that carry out design activities perform better than those that do not? These questions could be explored bylinking survey results to financial data.
7 ReferencesBaldwin, J., B. Diverty and D. Sabourin. 1995. Technology Use and Industrial transformation: EmpiricalPerspectives. Analytical Studies Research paper no. 75. Ottawa: Statistics Canada.
Beede D.N. and K.H. Young. 1996. Patterns of Advanced Technology Adoption and Manufacturing Performance:Employment Growth, Labor Productivity, and Employee Earnings. Economics and Statistics Administration, ESAOPD, 96-1, February 1996.
Beesley, N. and R. Rothwell. 1987. Small firm linkages in the United Kingdom. In Rothwell, R. and Bessant, J. (ed).Innovation, Adaptation and Growth (Elsevier, Amsterdam).
20 Statistics Canada – Catalogue no. 88F0006X, no. 3
Business Special Surveys and Technology Statistics Division Working Papers
Bryson, J.R., P.W. Daniels and G. Rusten. 2004. Design workshops of the world: the production and integrationof industrial design expertise into the product development and manufacturing process in Norway and the UnitedKingdom. Working Paper no. 53/04. Design Norwegian Competitiveness, Institute for Research in Economics andBusiness Administration.
Coffey, W.J. and R. Drolet. 1996. Make or Buy: internalization and externalization of producer service inputs in theMontreal metropolitan area. Canadian Journal of Regional Science 19 (1): 25-48.
Danish Design Centre. 2003. ‘The economic effects of design. Published by the National Agency for Enterprise andHousing, Denmark, September, 2003. Available at: www.ebst.dk/file/1924/the_economic_effects_of_design.pdf.
Design Industry Advisory Committee. 2004. What can 40,000 designers do for Ontario? Design matters. Toronto:Design Industry Advisory Committee.
Gertler, M.S. and T. Vinodrai. 2005. “Anchors of Creativity: how do public universities create competitive andcohesive communities?” In taking public universities seriously. Frank Iacobucci and Carolyn Tuohy. Toronto:University of Toronto Press.
Gertler, M.S. and T. Vinodrai. 2006. Better by Design? Capturing the Role of Design in Innovation, in OECD (2006a).
Gertler, M.S. and T. Vinodrai. 2004. ‘Designing the Economy: A profile of Ontario’s Design Workforce’, Prepared forthe Design Industry Advisory Committee, University of Toronto.
Gorb, P. and A. Dumas. 1987. Silent Design. Design Studies, 8, pp. 150-156.
Harrigan, F. 2006. Integrating theories of boundary choice: a case of the global aircraft industry. UCD Schoolof Business, University College Dublin: http://www.eaa2006.com/pdf/EAA2006_0794_paper.pdf (last accessedFebruary 10, 2009).
Industry Canada. State of design: The Canadian Report 2010. Industry Canada Publications: Ottawa.
Jensen B.J. and N. Musick. 1996. Trade, Technology, and Plant Performance. Working Papers on Industrial andEconomic Performance, Office of Policy Development, Economics and Statistics Administration, US Department ofCommerce.
Lash S. and J. Urry. 1994. The Economies of Signs and Space. Sage.
Lawson, B. 2006. How Designers Think. Boston: Elsevier.
MacPherson, A. and V. Vanchan. 2009. The Outsourcing of Industrial Design Services by Large US ManufacturingCompanies. International Regional Science Review.
MacPherson, A. and D. Pritchard. 2006. Outsourcing innovation: the case of the Boeing 787. In press, Journal ofLabor Research.
McIvor, R. 2000. A Practical Framework for Understanding the Outsourcing process (2000), Supply ChainManagement, Vol 5, number 1, pp. 22-36.
New Zealand Design Taskforce. 2003. Success in design. A report and strategic plan from the design taskforce, inpartnership with the New Zealand government in support of the growth and innovation framework. New Zealand.
New Zealand Design Taskforce. 2003. Success by design: A report and Strategic Plan. A reportprepared in collaboration with the New Zealand government. (accessed on 11th march 2009). Available athttp://www.nzte.govt.nz/common/files/design-strategy.pdf.
Organisation for Economic Co-operation and Development (OECD)/EUROSTAT. 2005. Oslo Manual: Guidelinesfor Collecting and Interpreting Innovation Data, 3rd edition, OECD, Paris.
OECD. 1992. Technology and the Economy: The key relationships, OECD Publications, Paris.
Power, D. 2004. The future in design: The Competitiveness and industrial dynamics of the Nordic design industry.Uppsala Sweden: Centre for research into innovation and industrial dynamics.
Statistics Canada – Catalogue no. 88F0006X, no. 3 21
Business Special Surveys and Technology Statistics Division Working Papers
Pritchard, D.J. 2006. The launch process for the Bombardier C-Series regional jet: Implications for Canadian Tradeand Employment. Canada-United States Trade Center Department of Geography State University of New YorkBuffalo, New York.
Saxenian, A. 1994. Regional Advantage, Culture and Competition in Silicon Valley and Route 128, HarvardUniversity Press, Cambridge, Massachusetts.
Statistics Canada. 2007. North American Industry Classification System (NAICS) Canada Catalogue no. 12-501-XIEStatistics Canada Publications: Ottawa.
The American Heritage Dictionary. 2000. The American Heritage Dictionary of the English Language, Fourth Edition,Houghton Mifflin Company, United States.
The Economist. 2007. Lessons from Apple. June 7 [http://www.economist.com], Quoted from MacPherson, A.and V. Vanchan. 2009. The Outsourcing of Industrial Design Services by Large US Manufacturing Companies.International Regional Science Review, 2009.
UK Design Council. 2004. Design in Britain 2004-2005. Available at http:www.design council.org.uk.
Vanchan, V. 2006. Communication and relationships between industrial design companies and their customers. TheIndustrial Geographer, Volume 4, issue 2, p. 28-46.
Vinodrai, T. 2006. Reproducing Toronto’s design ecology: Career paths, intermediaries, and local labour markets.Economic Geography 82(3): 237-263.
22 Statistics Canada – Catalogue no. 88F0006X, no. 3
Top Related
Copyright © 2022 FDOKUMEN

