


Bahasa
Halaman
Hukum


57
Chapter 3 – Academic Programs and Services
Introduction
This chapter provides recommendations to improve the management and efficiency of Clark County
School District’s (CCSD) academic programs and services.
As discussed in Chapter 2 – Student Performance Analysis, there are other large school systems similar
to CCSD that achieve higher levels of academic achievement. CCSD has made progress over the past
several years, but still remains far below its own targets, particularly with certain student sub-groups,
and 44 percent of its schools have the lowest rating for Adequate Yearly Progress based on No Child Left
Behind.
Some of the challenges facing CCSD are due to size: the district includes over three hundred schools in
Clark County, which encompasses over 8,000 square miles. While the district experienced rapid growth
for many years and is expected to experience an increase in population again in 2013-14, the last school
year saw a nearly flat level of enrollment. Other pressures on the district are financial. To offset a
decrease in state funding and property and property tax revenues, the district dipped into its fund
balance, changed its organizational structure, increased class sizes, and reduced staffing across all areas
in the district.
Despite these challenges, CCSD’s new leadership has articulated a vision for its students that includes an
education that will prepare them for success in life. In the language of CCSD’s superintendent, students
should be “ready by exit,”12 educated and able to succeed as post-secondary citizens of their
community. Recommendations that should assist the district in achieving its goals are presented in this
chapter, and summarized in Table 3.1.
Table 3.1. Summary of recommendations
Recommendation Priority Timeframe Five-Year Fiscal
Impact
Major
Investment
Required
Major Policy
Changed
Required
Curriculum and Instruction
3-1.1. Develop cross-functional
teams to better coordinate
programs and services.
High 2013-14 $0 No No
3-1.2 Use outside assistance for
curriculum development essential
for implementation of Common
Core State Standards.
High 2012-13 ($1,125,000) No No
12
A Look Ahead: Phase 1 Preliminary Reforms Report – Improving Achievement in the Clark County School District
Superintendent of Schools Dwight D. Jones (May 2011)

58
Recommendation Priority Timeframe Five-Year Fiscal
Impact
Major
Investment
Required
Major Policy
Changed
Required
3-1.3 Limit the number of core and
supplementary instructional
programs.
High 2012-13 $0 No Yes
Student Assessment
3-2.1. Reduce the number of
assessments and agree on common
district wide interim and early
diagnostic assessments.
High 2012-13 $0 No No
3-2.2. Develop and implement
short-cycle formative assessments High 2012-13 $0 No No
3-2.3. Fully utilize the capabilities of
INFORM and require district-wide
use.
High 2012-13 $0 No No
Professional Development
3-3.1. Coordinate professional
development services to improve
focus at the school level, reduce
duplication of effort, and more
effectively integrate funding
streams to address district
priorities.
High 2012-13 $7,500,000 Yes No
3-3.2. Adopt practices to increase
the effectiveness of professional
development in improving teacher
skills and practices.
High 2013-14 $0 No No
Response to Intervention
3-4.1. Mandate implementation of
the district’s Response to
Instruction (Response to
Intervention; RTI) system in all
schools.
High 2012-13 $0 No No
School Operations
3-5.1. Convert low enrollment
Advanced Placement courses to
CCSD's virtual learning model.
Med 2012-13 $14,640,000 No No
3-5.2. Eliminate both the theme
coordinator and recruiting
counselor positions at the district’s
magnet schools.
Low 2012-13 $9,032,345 No No

59
Recommendation Priority Timeframe Five-Year Fiscal
Impact
Major
Investment
Required
Major Policy
Changed
Required
3-5.3. Evaluate CCSD’s behavior and
continuation schools, the referral
and exit procedures, and the
impact on student performance
and other outcomes.
Med 2012-13 $0 No No
Evaluation of Academic Programs
3-6.1. Enhance program evaluation
capacity to support calculation of
Return on Investment in academic
programs and interventions.
High 2012-13 ($12,500,000) Yes No
Total $17,547,345
The reminder of this chapter is organized into the following sections:
� Section 1 – Curriculum and Instruction
� Section 2 – Student Assessment
� Section 3 – Teacher Professional Development
� Section 4 – Response to Intervention
� Section 5 – School Operations
� Section 6 – Evaluation of Academic Programs

60
Section 1 – Curriculum and Instruction
CCSD’s curriculum and instruction function resides in the Division of Curriculum and Professional
Development (CPD). This division has the responsibility to provide leadership, service, and support for
the implementation of the state’s academic standards and to ensure that all learners achieve at high
levels. A district’s curriculum and instructional programs serve as a foundation for the academic success
of any district. Curriculum is both the process and content by which learners gain knowledge and
understanding. Instruction is the creation and implementation of plans for teaching curriculum content.
Therefore, the two must be compatible in order to maximize student learning.
The district has set an ambitious goal to have all students reading at or above grade level at three
specific points along the academic continuum, grades 1, 3, and 5. The Superintendent describes literacy
as the linchpin for the district’s academic improvement efforts and has charged the Deputy
Superintendent of Instruction with establishing a new literacy plan for the district.13 The Deputy
Superintendent of Instruction has established a leadership team that has been working to develop a
plan that will revise how the district addresses literacy.
Impact of Common Core State Standards
Along with 43 other states, Nevada has adopted the national Common Core State Standards adopted by
the National Governors Association and the Council of Chief State School Officers. The state is also
participating in a multi-state consortium called SMARTER Balanced Assessment Consortium which is
working to develop assessments that are aligned to the Common Core State Standards and intended to
accurately measure student progress toward college and career readiness.
As a result of these state-level initiatives, CCSD is in the process of transitioning existing curriculum
documents in reading/ELA and mathematics to prepare for related new statewide assessments that will
come online during the 2014-15 school year. The district has developed a rollout plan that involves
implementation of new curriculum in reading and mathematics for elementary and middle schools
during 2011-12 and high schools during 2012-13. The district has also been participating in the activities
supported by the Nevada Department of Education to identify gaps in existing state standards and the
Common Core State Standards and subsequently revising curriculum and assessments at the district
level.
Teachers and administrators have been participating in professional development to understand the
new standards and to review the revisions in the district’s curriculum. This significant level of change
could be particularly stressful for the elementary and middle schools, given the short implementation
time frame. High schools have an additional year to transition from existing course syllabi to courses
aligned to the Common Core State Standards. The district must complete the shift to new standards and
the revised curriculum work in a timely manner due to the significant changes between the current state
13
A Look Ahead: Phase 1 Preliminary Reforms Report – Improving Achievement in the Clark County School District
Superintendent of Schools Dwight D. Jones (May 2011)

61
assessments and the new common.
The curriculum development process is currently internally driven and relies on compensating teachers
for analyzing and revising curriculum documents. While this approach appears to be working for the
elementary and middle school reading/ELA and mathematics standards, CPD senior staff have expressed
concerns regarding the amount of work to be completed for the high schools as the district uses a
course syllabus-based system for curriculum at the high school level. CPD staff stated that a large
number of high school courses will need to be redeveloped, reviewed or retired, in order to meet the
Common Core State Standards.
District Curriculum
Until recently, curriculum materials, beyond pacing guides at the elementary level and course syllabi at
the secondary level, were not widely used at the school level. The elementary literacy curricula and
materials were available in 3-ring binders and secondary curricula and materials were in the form of
course syllabi. A staff member in CPD has created the Curriculum Engine, a web-based curriculum
management system to house the district’s curriculum documents that are under revision to align with
the Common Core State Standards. District administrators and principals are enthusiastic about the
potential of Curriculum Engine and believe it will promote access to and use of curriculum documents at
the school site. Principals interviewed during this study shared great enthusiasm for the quality of the
curriculum and support materials that are being added to Curriculum Engine. They feature “unwrapped
standards” and a level of specificity not provided in previous curriculum documents.
CCSD’s instructional programs and support services are important elements of converting curriculum to
student learning. Based on in-district interviews and analysis of district documents, several findings
emerged related to instructional programs and related services:
� Lack of collaboration/coordination – The district’s approach to academic programs (and
professional development, which is discussed later in this chapter) has been fragmented and has
lacked cohesion. Organizational “silos” based on program areas, which are often determined by
funding source, are a factor in this lack of cohesion. This creates problems at the school level
when schools are either left with too few resources or are required to implement programs
mandated by the CPD that conflict with other programs. On the other hand, the district recently
instituted a promising program called the School Collaborative. In this program a school is
selected to present their challenges to a cross-functional team of representatives from all of the
areas across the district that supports instruction. The principal presents the issue and the team
problem-solves and collaboratively offers resources to address the problem at hand. This
practice, though in its infancy (60 schools during 2010-11), shows great promise as a way to
break down barriers and better coordinate services across schools.
� Multiple educational programs –The district has an excessive number of educational programs
– resulting largely from decentralized and uncoordinated decisions that may or may not be
contributing to improved student achievement. Some purchases are duplicated, some programs

62
are purchased and not used, and some programs overlap resulting in higher costs to the district.
Many additional programs selected and purchased by the schools are not centrally tracked. The
district’s supplemental reading programs used in the schools provide an example of the
duplicative programming. Table 3-1.1 lists some of the programs used in the district to support
literacy.
Table 3-1.1 – Examples of district instructional reading programs – literacy support
Program and Grade Levels Elementary School Middle School High School
Tier I Core Programs (Adopted Textbooks)
Harcourt Trophies •
McMillan McGraw-Hill •
Scott Foresman •
Tier I Supplemental Programs
Compass Learning • • •
Classworks • •
Earobics Step 1-2 •
Study Island • •
Fast ForWord • •
Achieve 3000 • •
Tier II Intervention
Burst •
Fast ForWord • •
Harcourt Trophies Intervention •
Read 180 Enterprise Ed. • • •
Time Warp Plus •
Voyager Passport •
Language • •
Corrective Reading • •
Voyager Journeys • •
Tier III Intensive Intervention
Fast ForWord • •
Language! • • •
Voyager Passport •
Voyager Journeys • •
Read 180 Enterprise Edition • •
Corrective Reading • •
System 44 • •
Source: Response to Instruction. A K-12 Multi-Tiered System of Support. A General Education Initiative.,
CCSD
Schools use their Title 1 funds to purchase instructional programs and as long as these programs
are deemed “scientifically evidence based” there are no restrictions on purchasing. Additionally,
the district’s Title 1 program, as well as the English Language Learner (ELL) and Special Education

63
programs, purchases instructional programs for the schools, often without collaboration with
CPD. All of this serves to fragment the district’s instructional improvement initiatives and create
challenges for students as they move from school to school and for the CCSD staff in the system
trying to deliver professional development aligned to the district’s instructional programs.
� Fragmented approach to school support and coaching – Multiple funding streams are funding
instructional coaches, project facilitators, and school improvement specialists. Literacy
specialists “purchased” with Title 1 funds are hired by and report to the school administrator.
They may or may not be “allowed,” based on the principal’s decision, to engage in ongoing
professional development with the literacy department in CPD, and may or may not be
endorsing the same coaching strategies as the district’s literacy department. It is important in
literacy instruction that a consistent approach, based on scientific research, be used with fidelity
throughout the district. Addressing this issue will be instrumental to the success of the district’s
literacy initiative. The professional development section of this chapter (Section 3) presents a
more detailed analysis of this issue.
In general, there is an opportunity to better focus and leverage existing funding sources and personnel
to better support the district’s efforts to improve student achievement. Administrators consistently
expressed a desire to have fewer choices in order to promote a more common focus across the district.
With the presence of a new administration, a new district organization (performance zones), and the
implementation of the Common Core State Standards, there is an opportunity to better focus and
coordinate the district’s limited resources toward achievement of its academic improvement goals.
This section provides three recommendations with a number of associated implementation strategies.
Recommendation 3-1.1: Develop cross functional teams to better coordinate programs and services.
A number of organizational barriers are affecting CCSD’s ability to collaborate effectively, mostly as a
result of units and divisions that have been built around, and are focused on, the requirements of a
particular funding source. This organizational insulation requires tremendous energy and effort on the
part of staff to overcome as they try to integrate these various services at the school level. An example is
the implementation of a Title 1 funded summer school program during 2010-11 that involved the
purchase of a Tier II reading program. The literacy department in CPD was not consulted about the
appropriateness of the program, and another program was added to the list of the district’s instructional
programs. In another example, both Title 1 and IDEA purchased reading programs and offered literacy
related professional development, in addition to that provided by CPD’s literacy department.
Pilot blended funding with the district’s literacy initiative.
A cross-functional literacy planning team should look at all of the district resources directed toward
literacy and look for opportunities to combine multiple funding streams toward the same goal. The
district may want to consider investigating and visiting other districts that have successfully moved in
this direction. The district’s literacy initiative, under the leadership of the Deputy Superintendent of
Instruction, offers an opportunity to integrate and coordinate the use of multiple funding streams (Title

64
1, IDEA/ Early Intervening Services, ELLP and General Funds) toward the goal of ensuring all students are
reading on or above grade level in the target grades outlined in the district’s improvement plan.
Reorganize to support the Performance Zone Structure.
Nationally, a number of school districts are reorganizing their central offices into cross-functional teams
that support clusters of schools. The most cutting edge efforts include establishing performance
measures that hold the team accountable for increases in student achievement in the schools they serve
and include this measurement as a component of the individuals’ own annual performance evaluation.
The new performance zone structure implemented by CCSD provides an opportunity to reallocate a
number of central office personnel into teams aligned to the performance zones, reporting to the
academic managers.
Coordinate school support through the use of cross-functional teams that report directly to
the academic managers.
Rather than tying program specialists to a single school where they may not be fully utilized (or may be
assigned other non-specialized duties) the district should consider creating cross functional teams of
specialists that serve the various performance zones and report directly to the academic managers. This
would allow a performance zone to better coordinate school support, create collaborative professional
development events, ensure that support providers speak with a common voice, and increase the
efficiency and impact of these personnel. Academic managers could work with CPD and Student Support
Services Division (SSSD) to ensure that these program specialists meet the requirements associated with
their funding.
Continue to support and expand the School Collaborative initiative.
The School Collaborative Initiative discussed earlier in this section is an example of the type of cross-
functional collaboration the district should encourage. The lessons learned from the School
Collaborative initiative should be adapted and extended to other schools in the district during the
transition to performance zones.
Fiscal Impact
This recommendation can be accomplished with existing resources.
Recommendation 3-1.2: Use outside assistance for curriculum development essential for
implementation of Common Core State Standards.
CCSD’s access to quality and timely curriculum and curriculum documents is essential to the district’s
success in improving classroom instruction. CPD staff have a large challenge ahead in revising existing
curriculum and developing new curriculum and curriculum support materials to meet the deadlines of
the Common Core State Standards. These same personnel are also being pressed to serve as
professional developers, representatives on state level planning committees, and curriculum experts.
The district should consider utilizing contracted curriculum development experts to perform some of the

65
curriculum development work so that CPD personnel can focus on the professional development and
support necessary at the school level to ensure successful implementation.
Fiscal Impact
Assuming the district contracts with two consultants for each of the content areas of ELA and
mathematics for 75 days of service at a rate of $1,500/day the fiscal impact to the district would be
$225,000 per year ($1,125,000 over the next five years).
Recommendation 3-1.2
One-Time
(Costs)/
Reductions
2012-13 2013-14 2014-15 2015-16 2016-17
Use outside assistance for
curriculum development
essential for implementation
of Common Core State
Standards
$0 ($225,000) ($225,000) ($225,000) ($225,000) ($225,000)
Total $0 ($225,000) ($225,000) ($225,000) ($225,000) ($225,000)
Recommendation 3-1.3: Limit the number of core and supplementary instructional programs.
If CCSD is to improve the academic achievement of the students it serves, processes need to be put in
place and decisions need to be made to limit the number of core reading and mathematics programs as
well as the supplemental programs used across the district. The current proliferation of programs has
not had a positive impact on CCSD’s academic achievement. Many CCSD professionals interviewed for
this study feel that an excessive number of programs has, in fact, contributed to the district’s lack of
progress, and are supportive of greater focus and fewer choices.
The district should have no more than two or three core reading and math programs available to schools
and a process should be implemented to control when and how supplemental programs can be added.
Principals would continue to have the flexibility to select (from a list of options) which one would work
best for their schools. The Assistant Superintendent of CPD should monitor which programs have been
selected by which schools, and periodically evaluate each program’s impact on student achievement.
Fiscal Impact
The fiscal impact of this recommendation should be negligible. Eliminating some programs will reduce
costs, but increasing use of programs the district keeps will increase licensing costs. The district should
attempt to achieve a cost neutral solution, and could experience modest, volume-related net reductions
in the future.

66
Section 2 – Student Assessment
A school district’s student assessment system is an important tool for improving student learning. An
effective assessment system provides information that can be used to improve instruction, monitor
student performance, report results to parents and stakeholders, and inform the district of its progress
toward the goal of ensuring all students are ready by exit. Assessments can also serve as early warning
systems, providing teachers and school administrators with real-time information that can be acted on
immediately.
Effective assessment systems include thee major components to assess student learning:
1. Formative Assessments – Used to provide ongoing feedback to teachers and students
throughout the instructional process. Formative assessments provide ongoing feedback about
the teaching and learning process and help teachers improve learning while there is still time to
act.
2. Benchmark or Interim Assessments – Used to determine how well students are progressing
through the district’s curriculum. The use of benchmark assessments allows the district to assess
how well additional supports or services are working before too much time passes.
3. Summative Assessments – Used to determine how students in schools and the district as a
whole are progressing. Summative assessments also inform curriculum and instruction and
determine the designation of each school and the district in the state accountability system.
Figure 3-2.1 provides a summary of the purpose and focus of each of these three types of assessments.
Figure 3-2.1. Purpose and focus of district assessments
Source: Wisconsin Department of Education, 2009
Formative Assessments
Daily Onging Evaluation Strategies:
Student-Centered
Immediate Feedback
Typically Teacher Developed
Benchmark Assessments
Periodic/Progress Assessments:
Classroom-/School-Centered
Multiple Data Points Across Time
Summative Assessments
Large-Scale Standardized Assessments:
School-/District-/State-Centered
Annual Snapshot

67
A comprehensive and well-functioning student assessment system is crucial to accomplishing the
Superintendent’s vision for CCSD. The Superintendent describes his vision for a performance
management system with the following key pathway checkpoints:14
� Grade 12: Graduation of Students with no need for remediation
� Grade 11: AP Participation and Performance, ACT and SAT Performance
� Grade 9: On track to graduation plan
� Grade 8: Algebra Participation and Performance
� Grade 5: Grade Level/Advanced Reading Performance
� Grade 3: Grade Level/Advanced Reading Performance
� Grade 1: Grade Level/Advanced Reading Performance
CCSD’s district-wide assessment information is inadequate to make well-informed decisions relative to
how effectively teachers are teaching, programs are working, schools are performing or how prepared
students are for end-of-year summative assessments. The April 2011 Study of Barriers to Improved
Student Achievement15 describes the CCSD assessment system as an area of particular concern. The
study’s authors noted that there is confusion at school sites about assessment versus testing, and that
teachers lacked an understanding of the intent and use of formative assessments to support student
learning. The study also noted that building-level administrators lacked a fundamental understanding of
the appropriate use of formative assessments. The report summed up this section by stating “A system
void of the use of a systematic, formative assessment cripples the instructional process and robs
students and teachers of critical improvement opportunities.”
Description of Current Assessment System
A number of conditions have contributed to the current condition of the student assessment system.
� The previous regional and area structure allowed regions/areas to adopt their own assessment
practices.
� The ability of schools to purchase assessment tools and programs without a centralized approval
process has contributed to a proliferation of such tools and programs across the district.
� Individual programs, including Title 1, Special Education, and the English Language Learners
program, also purchase assessment programs. Even when these programs show promise, the
fact that they are introduced as optional results in inconsistent implementation across the
district.
14
A Look Ahead: Phase 1 Preliminary Reforms Report – Improving Achievement in the Clark County School District
Superintendent of Schools Dwight D. Jones (May 2011)
15 Study of Barriers to Improved Student Achievement, Quality Leadership Resources, Inc. (April 2011)

68
� The review team, through interviews and data review, could find no evidence of a centralized
evaluation and approval process for assessments. Nor was there evidence that when
assessment programs are purchased, procedures to ensure technology support from
Assessment, Accountability, Research, and School Improvement (AARSI) is pre-authorized and
scheduled.
CCSD has one common assessment used across the district. This is the district’s “benchmark
assessment” that is administered three times per year and utilizes an item bank purchased from the
Educational Testing Service (ETS). The purpose of these interim benchmark assessments is to inform the
school and district as to the extent to which all students are progressing in the district’s curriculum and
to identify students in need of additional supports or services prior to the end of year state assessments.
During the course this study, a number of issues were raised related to this assessment. For example,
some teachers and administrators reportedly lack a complete understanding of the assessment,
considering it a “test” and assigning a grade.16 Senior CPD staff members noted that variations in the
pacing of instruction across schools have resulted in students being assessed on content that has not
been taught.
In addition to the assessments themselves, the district’s data warehouse and reporting tools are an
integral part of the district’s assessment system. During 2009-10 the district used American Recovery
and Reinvestment Act (ARRA) funds to purchase INFORM (a data management and reporting system).
INFORM should allow users to produce more user friendly reports, provide faster turnaround of
assessment results, develop data dashboards, and provide school and teacher level access to
assessment information. The system shows great promise, but district personnel need to complete
training to understand how best to utilize the capabilities of the system.
Given CCSD’s ambitious goals for academic achievement, the district needs to redesign its approach to
student assessment. This section contains four recommendations to improve student assessments.
Recommendation 3-2.1: Reduce the number of assessments and agree on common district wide
interim and early diagnostic assessments.
Table 3-2.1 illustrates the most commonly used assessments at the elementary level. This is not a
comprehensive list.
16
Study of Barriers to Improved Student Achievement, Quality Leadership Resources, Inc. (April 2011)

69
Table 3-2.1. Examples of elementary assessments for reading and mathematics
Elementary Assessments
Screening/Benchmark Assessments
� AIMSweb (six assessments of reading and
mathematics)
� DIBELS
� Scholastic Reading Inventory
� Vital Indicators of Progress
Diagnostic Assessments (to determine skill deficit)
� CORE Phonics Survey
� Developmental Reading Assessment
� Qualitative Spelling Inventory
� MClass
� Scholastic Phonics Inventory
Progress Monitoring Assessments
� AIMSweb (six assessments of reading and
mathematics)
� DIBELS
� Vital Indicators of Progress
� STAR Math
Source: Response to Instruction. A K-12 Multi-Tiered System of Support. A General Education Initiative., CCSD
Senior staff members in both AARSI and CPD stated that it is not currently possible to know all of the
assessments that are in use across the district. The district cannot successfully implement a performance
management system with this number of assessments. Given the district’s 30+ percent in-district
student mobility rate, students are adversely affected when the assessments vary from school to school
and teachers do not have the information they need, in a format they are accustomed to working with,
that describes a student’s learning progress or learning problems. The proliferation of district
assessments also fragments the support systems in professional development. Whether the professional
development is coming from ARRSI or CPD, it is unrealistic to think that these divisions have the capacity
to effectively provide professional development to support the understanding and effective use of this
many assessments.
Ensure Consistency and Alignment of Assessments
The district has a cross-functional literacy team working directly under the direction of the Deputy
Superintendent of Instruction. This team should be tasked to make recommendations about the most
effective literacy assessments, and these assessments should be made mandatory across the district.
Input from principals and academic managers should be a part of this decision-making process. The
team should consider sharing stories and results from similar districts such as Broward County Public
Schools who attribute their success in improving student performance to a number of factors including
consistency and alignment of the district’s reading and mathematics curriculum and a core intervention
structure for all schools. A similar cross functional team should be organized to identify and deploy the
most effective mathematics assessments.

70
District-Wide Benchmark Assessments
The Study of Barriers to Improved Student Achievement17 recommended that the district abandon the
current system of benchmark assessments and select a new assessment aligned with district learning
expectations. However, the district has a substantial investment in the current system. As part of the
move to the Common Core State Standards, Nevada is a member of the SMARTER Balanced Assessment
Consortium, a multi-state initiative to develop a student assessment system aligned with the Common
Core State Standards. This consortium is developing computer-adaptive interim and summative
assessments and a suite of formative tools and resources. Once the district has access to these
resources, they should be used to replace the current benchmark assessments.
Fiscal Impact
Reducing the number of assessment products is expected to have a cost neutral fiscal impact, as cost
reductions from the elimination of some programs will be offset by increased licensing fees for others.
Recommendation 3-2.2: Develop and implement short-cycle formative assessments.
There is often confusion between the term formative assessments and benchmark or interim
assessments. For an assessment to be formative, teachers (and students) need to have the results in
sufficient time to adjust, or form, ongoing instruction and learning. While benchmark assessments are
useful for looking at district-wide patterns and trends that may enable teachers to make useful longer-
term changes in instruction and curriculum, they do not occur frequently enough and are not reported
quickly enough to spur timely and beneficial adjustments in teachers' instruction.
Research has shown that the biggest instructional payoffs occur when teachers use “short-cycle”
assessments, in which test results are available quickly enough to enable teachers to adjust how they
are teaching and students to alter how they are trying to learn. Short-cycle assessments yield results
during a class period or in the midst of a multi-week instructional unit. Examples include exit slips, “I
can” statements, and checklists, among others.18 The key is to get the results get back to teachers in
time for them to adjust instruction. The proper use of frequent short-cycle assessments can save the
“surprise knowledge” that after weeks of study, an exam reveals that many students have not learned
the material.
Teachers and administrators will need support in understanding and constructing short-cycle formative
assessments. In order to implement short-cycle assessments so that they impact student achievement,
teachers must understand what quality assessment questions look like and what constitutes good
teaching practices. Teachers also need clear knowledge of what it means to analyze the resulting data –
and most importantly how to adjust instruction based on those data.
17
17
Study of Barriers to Improved Student Achievement, Quality Leadership Resources, Inc. (April 2011)
18 http://ohiorc.org/adlit/inperspective/issue/2005-03/Article/vignette2.aspx

71
Fiscal Impact
This recommendation can be accomplished with existing resources.
Recommendation 3-2.3: Fully utilize the capabilities of INFORM and require district-wide use.
The district has made a substantial investment in the INFORM system in order to provide enhanced
analysis and reporting of CCSD’s student assessment data. The system appears to have extensive
capabilities to create reports, provide customized data dashboards, and perform analyses that could
support the district’s performance management goals. However, many of the features and functions are
not being fully utilized by the district because, like many other initiatives, its use is “optional.” The
Assistant Superintendent for Assessment, Accountability, Research, and School Improvement should
work with the Deputy Superintendent of Instruction and the Superintendent of Schools to determine
what capabilities of the INFORM system can best support performance management.
The Division of AARSI offered professional development sessions during the summer months to help
district educators learn how to use INFORM. District administrators who have started using the system
were enthusiastic about its potential. Academic Managers were particularly enthusiastic about
INFORM’s potential to support their work under the new performance zone structure. The use of
INFORM should be required across the district and professional development should continue to be
offered with a special emphasis on building the capacity of school administrators to fully utilize the tools
and analyses options offered by this system.
Fiscal Impact
This recommendation can be accomplished with existing resources.

72
Section 3 – Teacher Professional Development
Professional development is the primary vehicle for improving the instructional practice of teachers and
school administrators. As such, professional development programs and services should be based on
district priorities, information about staff needs, student achievement data, and assessments of
instructional practices and programs at each school. The district has multiple professional development
providers. However, the current approach to planning and delivering district professional development
is fragmented because it is based primarily on individual department and program goals, and is largely
driven by funding streams. These funds often come with restrictive or specific goals and activities.
CCSD needs to move away from organizing activities around funding sources and combine funding
streams, where possible, to support integrated efforts aimed at school needs and district priorities. Key
findings from interviews, focus group sessions, and data analysis resulted in the following findings
related to professional development:
� It is difficult to provide program-specific professional development because of the large number
and variety of programs in schools.
� There is no district-wide coordination function for the many sources of professional
development offered by the district and/or area. School administrators describe the district’s
professional development efforts as lacking focus and coherence. Professional development for
the most part is planned and delivered independently by individual program areas without
coordination across programs.
� Given the demands of the daily work of the district, the collaborative planning to coordinate
professional development is sporadic at best. The different district-level professional
development providers report that at times schools are being presented with conflicting
information and philosophies. This was validated by the school administrators interviewed.
� As a result of the lack of an integrated approach to providing professional development in the
core areas, teachers sometimes miss instruction in their classrooms to attend professional
development courses covering the same information that has been provided in other courses.
For example, separate literacy training is provided for special education, for ELL and general
education. If the literacy professional development were jointly prepared and presented, at
least some of the same content could address the needs of all learners in a more integrated
fashion that more closely mirrors the reality of the teacher’s classroom. While there are some
instances of this level of collaborative work at CCSD, it is the exception rather than the rule.
� School principals report they are unable to access relevant, job-embedded, site-specific
professional development that actually improves a teacher’s ability to provide quality
instruction unless they are a Title 1 school receiving additional funding or a very low-performing
school targeted for turnaround.

73
Recommendation 3-3.1. Coordinate professional development services to improve focus at the school
level, reduce duplication of effort, and more effectively integrate funding streams to address district
priorities.
Funding Sources for Professional Development
The following CCSD organizational units provide professional development for teachers and site based
administrators:
� Curriculum and Professional Development
� Human Resources
� Student Support Services Division
- Title 1
- Special Education
� Title 3/English Language Learner Program
� Regional Professional Development Program
� Assessment, Accountability, Research and School Improvement
� Equity/Diversity
� Area Offices
School-based administrators also use school funds to procure their own site-based professional
development.
The District’s 2011 summer professional development catalog illustrates the need for a coordination
function for district sponsored professional development. The catalog indicated a total of 524 training
sessions with 8,795 participation slots, offered by 11 areas of the district organization.
The top four district professional development providers in this catalog were:
1. Curriculum and Professional Development Division – 192 sessions
2. Student Support Services Division – 109 sessions
3. Human Resources Division – 66 sessions
4. Regional Professional Development Program – 22 sessions
As an example, educators attempting to locate literacy/ELA related professional development sessions
would find nine different departments or programs offering a total of 210 professional development
sessions targeting literacy/ELA. Table 3-3.1 provides a duplicative count of summer offerings related to
literacy/ELA.

74
Table 3-3.1. District sponsored summer professional development – Literacy19
Division / Department Number of District Level
Summer Sessions
CPD – Literacy 62
CPD – Professional Development Education 4
Human Resources – Leadership Development 10
Human Resources – Teacher Induction & Mentoring 10
Regional Professional Development Program 9
SSSD– English Language Learner Program 3
SSSD– Professional Development Department 2
SSSD- Student Support Services Division 22
SSSD– Title 1 4
Source: CCSD Pathlore
Examples of overlap in summer literacy offerings include:
� Harcourt Trophies offered by both ELL and CPD
� CORE Reading Academies offered by both SSSD and CPD
� Differentiated Instruction offered by SSSD and CPD
� Common Core PD offered by HR Administrative Leadership, CPD, and RPDP
The fragmentation and lack of coordination indicated by the varied sources and types of literacy training
likely impacts teachers’ skills and students’ learning and should be changed. The nine divisions and/or
programs do not generate a consistent professional development message as it relates to literacy.
Interviews with district and school administrators, including academic managers, indicate that teachers
often receive conflicting information and recommendations based upon the division or program
providing the professional development. Moreover, the numerous and varied professional development
offerings competing for the same audience are creating “forced choice” decisions that may prevent
access to important information. Based on interviews with district and school administrators this was
acknowledged as an ongoing problem.
The district’s Deputy Superintendent of Instruction is leading a team effort to create a comprehensive
professional development framework that is multi-tiered and cross-functional. In order to provide a
more collaborative and inclusive professional development model, the programs and departments
19
http://opd.ccsd.net/pathlore.html

75
mentioned above should co-fund professional development and encourage teams of general education,
special education, and ELL teachers and staff to collaborate. This will allow for shared experiences and a
team approach to instruction, especially in the critical area of literacy.
In order to implement this recommendation, two strategies are suggested:
1. Conduct an inventory of professional development resources.
The cross-functional team should conduct an inventory and analysis of existing professional
development resources. This will serve to create a shared understanding of available resources
and the effort required to accomplish the goal of a more cohesive and aligned professional
development strategy. The following questions should guide the work of the team:
� How much is the district spending on professional development overall?
� What key initiatives are going to be counted as part of the inventory and analysis of
professional development spending?
� Who currently manages or controls the professional development resources?
� What does current spending buy (stipends, substitutes, travel, registration, tuition,
teacher time, expert consulting support, staff, materials)?
� How are current expenditures funded (federal, state, local, or private sources)?
� How is professional development delivered (professional development academy,
external whole school model, school-based coaching, lead teachers, course-work,
mentors, summer institute, etc.)?
� Who is targeted to receive which professional development program (individuals, teams
of subject-area or grade-level teachers, or entire schools)?
� What is the purpose of the professional development (for individuals-induction,
continuing education, remediation, or leadership) (for teams or schools – school
restructuring, content support, support for special populations, etc.)?
� What is the topic of the program (literacy, math, science, etc.)?
� What strategy or focus does the current professional development programs imply?
Once the team has this information they can align the professional development resources with
district priorities.
2. Align professional development resources with district priorities and coordinate funding and
professional development services through a cross-functional team with senior level
leadership.
The district’s professional development goals should be focused on district priorities for student
learning as identified in the school and district learning goals, district/school student data, and

76
the learning needs of educators in CCSD. The leadership of the cross-functional teams should
have authority over professional development funds regardless of the program/funding stream.
Fiscal Impact
This recommendation can be accomplished by reallocating and reprioritizing existing staff and financial
resources. However, some special education funding can be used to support certain elements of the
professional development program. The CCSD special education budget for fiscal year 2012 includes
approximately $4.5 million for Early Intervening Services (EIS). This is approximately 10.3 percent of the
district’s federal award. If the district were to increase its EIS funding to the allowed 15 percent, which
would total approximately $6 million, $1.5 million in additional allowable expenditures for general
education students could be supported from special education.
Recommendation 3-3.1
One-Time
(Costs)/
Reductions
2012-13 2013-14 2014-15 2015-16 2016-17
Coordinate professional
development services to
improve focus at the school
level, reduce duplication of
effort, and more effectively
integrate funding streams
to address district priorities.
$0 $1,500,000 $1,500,000 $1,500,000 $1,500,000 $1,500,000
Total $0 $1,500,000 $1,500,000 $1,500,000 $1,500,000 $1,500,000
Recommendation 3-3.2: Adopt practices to increase the effectiveness of professional development in
improving teacher skills and practices.
A recent study published by the National Center for Education Evaluation and Regional Assistance
(NCEE) Middle School Mathematics Professional Development Impact Study: Findings After the Second
Year of Implementation20
examined the impact of a professional development program on the
knowledge and teaching skills of 7th grade mathematics teachers. The study found that two years after
implementation, there was no evidence that the professional development resulted in improved teacher
knowledge, or improved student achievement.
The study confirms that to improve student achievement, professional development must be intensive
enough to significantly increase teachers' knowledge and skills. A principle of effective professional
development is that it is focused, intensive, and sustained enough to affect what teachers know and can
do in their classrooms. While most professional development programs impact teacher knowledge, they
rarely impact teacher skill, or pedagogical practice. There are a number of reasons for this, not the least
of which is a lack of follow-up training and support. In the referenced study, even though the program
20
http://ies.ed.gov/ncee/pubs/20114024/index.asp

77
provided some intermittent coaching to the teachers, it is questionable whether it was intensive enough
to ensure teachers' effective and consistent application of their new knowledge. Districts should provide
staff development that is sufficiently intensive to effect change.
Another professional development issue is the lack of mandated training for literacy. The K-12 Literacy
Services Department offers literacy training for principals, literacy specialists, and teachers. The courses
provided include:
� Adolescent Reading Academy
� Adolescent Reading Leader
� Coaching Academy
� Elementary Reading Academy
� Reading Leader Institute
� Writing Academy
The SSSD also offers its own Reading Academy for Special Education Teachers.
None of these core literacy professional development opportunities are mandatory. Neither principals,
nor literacy specialists, nor teachers are required to take the literacy courses offered. The literacy
specialists, whose ranks were cut during the recent budget reduction process, number approximately
155. Approximately 75 percent of them have taken the five day academy training and 25 percent of
them have taken the Coaching Academy course. The district should mandate professional development
in the core skills considered essential for student success.
The proposed model supported by the Deputy Superintendent of Instruction will allow professional
development to be tailored to the needs and performance of each individual school. For example, a
review of one of the draft professional development plans describes levels of intensity, which will
provide universal, targeted, or intensive resources and support specifically linked to performance
indicators. This will allow the district to customize the professional development based on individual
needs of schools. Specific requirements for each school will vary, and those schools who are struggling
to achieve a satisfactory level of academic achievement should receive more intensive, frequent, and
prescriptive support.
The district’s INFORM software, which will allow teachers and others to post and review assessment
results, can also be used to support the evaluation of the effectiveness of professional development
programs in improving teacher skills and practices.
Fiscal Impact
This recommendation can be accomplished with existing resources.

78
Section 4 – Response to Intervention
Two statutes, No Child Left Behind (NCLB) [68 FR 68698] 21 and the IDEA 2004 (IDEA), [20 U.S.C 1401 (c)
(5) (F)]22 have provisions that direct or encourage school districts to educate students with disabilities in
general education environments and to limit the number of students who are exempted from state
mandated assessments. In the re-authorization of IDEA, the federal government affirmed in its Findings
section that the education of children with disabilities can be made more effective in part by
establishing pre-referral interventions. IDEA is clear that by using more effective interventions the need
to label children as disabled in order to address their learning needs should be reduced.
In its discussion of NCLB, the U.S. Department of Education articulated a rationale for including all
students in testing: “… Students with disabilities accrue positive benefits when they are included in
school accountability systems. Educators realize that these students also count, just like all other
students; they understand that they need to make sure that these students learn at high levels, just like
other students. When students with disabilities are part of the accountability system, educators’
expectations for these students are more likely to increase.” [68 FR 68698]23
Taken together, these statements from the IDEA and NCLB strongly support the inclusion of students
with disabilities into general education classrooms and general education accountability systems. The
provision of NCLB that requires states to include all student groups in state assessment systems is a
requirement that states demonstrate their students’ AYP. The AYP requirement of NCLB has a specific
participation rate and a specific performance rate. The participation rate requires that districts meet a
standard participation rate in state mandated tests that address the state mandated goals and
objectives. The performance rate sets specific goals for passing rates on grade level tests in each subject
area that is currently tested. Because few students are exempted from the participation requirement,
the inclusion of students with disabilities into general education environments has become increasingly
important.
Specific requirements of NCLB state that public schools must test students in math and reading annually
in third through eighth grades and once in high school. Each state determines what percentage of
students must pass the exams annually, raising the bar over time until 2014, when 100 percent of
students must be proficient. States can exclude only a small percentage of special education students.
Schools must meet the overall pass rate, but also must ensure that subgroups of students—broken
down by race, second language, and income status—meet the target. Schools that do not meet any
target face escalating sanctions, from busing students to better schools to dismissal of staff.
21
http://www2.ed.gov/nclb/landing.jhtml
22 http://www2.ed.gov/policy/speced/guid/idea/idea2004.html
23 http://www2.ed.gov/nclb/landing.jhtml

79
Approximately 40 percent24 of CCSD schools did not meet their state's annual goals in 2010, according to
the U.S. Department of Education.
Implementing Tiered Interventions
The reauthorization of IDEA in 2004 also focused attention on Response to Intervention (RTI) as a tool
for assessing and working with struggling learners. This interest is a result of major changes made in the
law:
The law changes how students are identified with specific learning disabilities. Local
educational agencies are no longer “… required to take into consideration whether a
child has a severe discrepancy between achievement and intellectual ability…(P.L. 108-
446, §614(b)(6)(A)). Rather, local educational agencies may use a process that
determines how a student responds to research-based interventions.
Response to Intervention (called Response to Instruction in CCSD) requires that high quality
instruction/intervention be matched to student need. Interventions must have proven their
effectiveness to produce high rates of student learning and be supported by scientific research. RTI
models use assessments that are directly related to instruction and proponents believe that services for
struggling students must focus on intervention, not eligibility. RTI models propose a three-tiered process
of student intervention:
� Tier One: Primary intervention is high quality, research-based whole-group instruction and some
small group differentiated instruction combined with general screening processes.
� Tier Two: Secondary intervention includes research-based small group or individual instruction
in specific areas of weakness.
� Tier Three: Tertiary intervention is more intensive instruction and support through
individualized planning and programming.
The RTI model typically places the responsibility for Tiers 1 and 2, and some options for Tier 3 in general
education. A student who is not responding to tier one intervention should be referred to the
intervention team whose responsibility is to assist a referring teacher in developing targeted
interventions that should be provided in addition to the quality instruction already received in Tier 1. An
effective, productive, positive intervention team dedicated to supporting students and teachers is a
universally helpful tool for helping meet the diverse learning and behavior needs of students.
24
http://online.wsj.com/article/SB10001424052702303661904576454152759335650.html.

80
Recommendation 3-4.1: Mandate implementation of the district’s Response to Instruction (Response
to Intervention; RTI) system in all schools.
Implementing the District’s Model
Over the past few years, a cross functional team including both special education and general education
personnel have worked together to develop the district’s RTI process. This group has produced a manual
on RTI called Response to Instruction. A K-12 Multi-Tiered System of Support. A General Education
Initiative. The manual contains a thorough description of the model as well as examples, forms, lists of
instructional programs, and other useful information. In addition, the team, under the leadership of the
Psychological Services Department and the K-12 Literacy CPD, has produced online forms that school
personnel can use to complete the steps required in the RTI process.
Unfortunately, the RTI system developed by this team has not been implemented universally or
consistently, and has, therefore, not been as effective as it could be. While definitive data are
unavailable, estimates from interviewees are that most elementary schools, some junior high schools,
and an unknown number of high school schools have actually implemented the RTI model with fidelity
and consistency.
In a previous recommendation provided in this section, the lack of consistency in implementation of
supplementary supports and programs was discussed, many of which would be Tier 2 and/or Tier 3
interventions. To further support the lack of consistent RTI implementation, a report examining the pilot
project on AIMSweb screening also examined the use of standard treatment protocols by schools,
indicating which supplementary supports and programs were used by schools in the AIMSweb pilot
project. There was a notable lack of consistency in the interventions used throughout the district. For
example, about 10 percent of pilot schools used Read 180 and 38 percent used Voyager. The majority,
55 percent, used other protocols. These data show that the district is not implementing its RTI program
consistently and that schools are not committed to the core instructional programs in reading identified
by the K-12 Literacy CPD Division.
Using Data for Screening and Progress Monitoring
Screening is the most general and broad type of educational assessment. In screening, data are collected
and analyzed and the information is used to predict which students are most likely to experience
difficulty. Through systematic screening, RTI teams can intervene early with students who are struggling,
either academically or behaviorally. Without the widespread adoption and use of screening, students
often fail first and then receive supports and interventions later. The systematic use of screening
procedures can prevent failure by identifying struggling students earlier. Screening procedures should
be in place at each level of an RTI process, so that students’ responses to universal, small group, and
individual interventions can be evaluated. The design of instruction should be flexible, fluid, and
responsive to students’ needs at each step along the educational path they follow. The screening
process inherent in RTI should be focused on repeated, consistent progress monitoring to provide the
information that is the basis for good instructional decisions.

81
In addition to screening, ongoing progress monitoring, especially through the use of formative
assessments, will reveal what each student needs within the core program, which in turn helps inform a
differentiated curriculum. Well written common formative assessments reviewed by educators in a
timely manner for the purpose of informing and changing instruction are powerful instructional tools. If
teachers have a data monitoring process that allows them to review data for individual and groups of
students during weekly or bi/weekly instructional planning, they can also review of trends by skill or
subject. Reviewing student data should not be a static process done once or twice per year, but a
practice that is embedded into all instructional planning. RTI models that use assessments that are
directly related to instruction focus more on intervention and less on students’ eligibility for special
programs.
Monitoring and evaluation tools used by educators are growing increasingly more sophisticated, both in
terms of content and in the information systems designed to make their use more practical and
effective. As students progress through all tiers of the RTI system, large group, small group, and
individual student progress monitoring are all appropriate, but it is individual progress that will allow for
individualized approaches to instruction. School-based instructional teams must do the work necessary
to help each student succeed in school by measuring progress at each tier of intervention.
The district has purchased and begun the use of AIMSweb software for its core screening process. The
psychological services department in SSSD has taken the lead in the AIMSweb pilot project, intended to
increase the number of schools and individual users. The department has produced a report on the
project, which shows a steady increase in the number of AIMSweb licenses, from approximately 22,000
in 2008-09 to an anticipated 97,000 for the 2010-11 school year. According to interviews with several
directors in at least three divisions, the use of AIMSweb for screening has not been mandated by the
district leadership. Consequently, many schools have attended training on how to use AIMSweb and
some use it regularly, but other schools use other measures or do not systematically screen students to
identify those who are struggling either academically, behaviorally, or both. The staff development
calendar for summer 2011 indicates that training on AIMSweb is being offered by the SSSD. In addition,
the AARSI Division offered AIMSweb training on approximately 300 schools during the 2010-11 school
year.
Linking RTI to Effective Instruction
The RTI process should be considered part of the district’s overall approach to high quality, effective
instruction. If a sound instructional framework is in place, then the RTI process should extend it through
early identification and intervention. RTI should not add to a school’s instructional responsibilities, it
should enhance them by providing the vehicle for determining whether the core instruction and
behavioral supports are working for individual students and, if they are not, helping the school design
and implement more effective interventions. The RTI team, along with the principal, should become the
instructional leaders on the school and should support teachers and students. When the RTI model is in
place on all schools and functioning as intended, students can be targeted for early, effective
intervention before they are struggling, failing, or dropping out.

82
Because the district’s RTI team has already done a great deal of work developing its RTI model, the steps
for implementation relate primarily to the expansion and effectiveness of the model. The district should:
1. Mandate implementation of the RTI process at all schools.
2. Require monthly reports from schools related to their implementation of the RTI process,
including number of students considered by teams, number of students at each tier of
intervention, use of AIMSweb screening by teachers, and the progress in implementing core
and supplementary math and literacy curricula and programs at each school.
3. Examine data to evaluate academic progress at each school and determine if a relationship
exists between each school’s RTI progress and its achievement. Differentiate additional
support based on this data examination.
4. Continue to provide professional development on screening, progress monitoring, core
instruction, and supplementary supports and programs. CCSD should also provide
professional development on the RTI process for schools whose implementation is
incomplete or ineffective.
Fiscal Impact
While additional effort of CCSD will need to be devoted or reallocated to implement this
recommendation, there should be no additional costs of implementing the RTI system throughout the
district. All of the development work for the RTI model has been completed, the referral and tracking
forms have been developed and are available online, the screening software (AIMSweb) has been
purchased and training is being provided, and the curricula and materials for each tier are included in
the district’s curriculum selection and adoption process. While there are no immediate cost reductions
related to the implementation for RTI, it is possible that over time there will be fewer referrals to and
placements into special education.

83
Section 5 – School Operations
Elementary and secondary education is a labor-intensive undertaking – personnel costs typically
consume approximately 80 percent (or more) of the average school district budget. Most district
employees are housed in schools, as school administrators, teachers, and support staff. Consequently,
effective school districts place a major emphasis on effective human resources management in schools.
To be effective districts must consider such questions as:
� How do teacher workloads vary from school to school within the district based on grade level,
subject, and school scheduling? Is the variation in teacher workload acceptable and in students’
best interests?
� How are typically low enrollment subject areas staffed?
� How is technology deployed to extend the reach of the existing teacher workforce?
� How are non-teaching positions allocated in schools? Are they allocated in students’ best
interests?
As CCSD has grown rapidly over the past decade, few staff resources have been devoted to analyzing
school operations with an eye to staffing efficiency and effectiveness. Rather, most school operations
management has been focused on the filling of the many new positions necessitated by the annual
opening of many new schools.
Two areas of school operations which merit attention are low student enrollments in many Advanced
Placement (AP) classes, and the staffing levels of non-teaching positions in CCSD’s magnet schools.
Low Enrollment Advanced Placement Courses
A review of the actual course enrollments for 2010-11 for all CCSD high schools reveals a number of
areas in which class sizes are less than 20. Some high schools offer multi-year sequences of study with
very low enrollments in the third and fourth year classes. To address this issue, some high schools make
an effort to continue to offer course breadth by having the same teacher teach several low enrollment
courses during the same period. For example, one art teacher taught Painting I (9 students), AP Studio
Art: 2-D (6 students), and AP Studio Art: 3-D (1 student) in the same period, for a total “class”
enrollment of 16.
Cutting costs by reducing the number of low enrollment high school courses can be controversial if
stakeholders perceive that the course offerings are being reduced. However, one area in which CCSD
can reduce the number of low enrollment courses without affecting either the breadth or depth of
academic offerings is AP courses.

84
Recommendation 3-5.1: Convert low enrollment Advanced Placement courses to CCSD's virtual
learning model.
Table 3-5.1 provides the enrollments for 12 different AP classes in CCSD high schools. The district
provided this advanced content to 14,835 students in a traditional face-to-face classroom. However, in
many cases, the classes had low enrollments, including a Spanish Language class of two students
(Canyon Springs High School), a Chemistry class of 10 (Desert Oasis High School), and a Statistics class of
seven (Western High School). The figures highlighted in red were classes provided to less than 25
students in one section. The figures highlighted in yellow were classes where a number of sections were
offered so that the average class size was less than 25 students. Considering both the red and yellow
highlights, the district offered 233 sections of AP courses in classes of less than 25 students. This
provided just over 4,100 students a very small class environment. Considering the district’s financial
situation, an alternative approach to these small class sizes is needed.

85
Table 3-5.1. Total enrollments in advance placement classes at CCSD high schools
School Biology Calculus
AB Chem.
English
Lang.
English
Lit. Physics Psych.
Spanish
Lang. Statistics
U.S.
Govt.
U.S.
History
World
History Total
Adv. Technologies Academy 30 49 66 60 32 28 37 51 68 48 469
Arbor View HS 25 39 97 65 55 29 28 104 117 95 654
Basic HS 51 38 13 79 80 27 28 6 31 72 72 46 543
Bonanza HS 18 47 45 59 70 239
Boulder City HS 18 10 36 28 19 19 130
Canyon Springs HS 17 57 75 28 2 67 101 117 81 545
Centennial HS 59 25 93 89 16 14 153 102 33 584
Chaparral HS 20 13 16 8 14 13 27 29 19 18 177
Cheyenne HS 16 24 26 63 11 12 20 21 18 211
Cimarron-Memorial HS 16 21 28 36 20 25 12 22 45 68 293
Clark HS 141 24 191 206 18 51 13 33 207 171 238 1293
Coronado HS 39 27 48 117 57 146 37 40 46 94 140 791
Del Sol HS 20 21 15 27 19 28 23 153
Desert Oasis HS 12 36 10 36 22 68 36 38 33 50 341
Desert Pines HS 9 37 57 48 84 72 307
Durango HS 20 27 69 29 17 46 29 23 38 298
East Career & Tech Academy 15 68 152 51 73 88 300 747
Eldorado HS 12 23 49 42 126
Foothill HS 18 37 11 68 58 10 15 24 38 47 326
Green Valley HS 7 85 25 104 71 84 18 61 59 109 118 741
Las Vegas Academy 12 20 64 17 18 61 50 34 276
Las Vegas HS 32 23 89 50 45 28 52 42 81 442
Legacy HS 28 26 39 52 14 51 18 53 21 27 329
Liberty HS 29 21 19 84 30 14 21 73 45 79 415
Moapa Valley HS 16 16
Mojave HS 8 13 3 14 41 18 9 12 80 30 58 286
NW Career & Tech Academy 38 25 96 19 54 16 27 33 28 56 392

86
School Biology Calculus
AB Chem.
English
Lang.
English
Lit. Physics Psych.
Spanish
Lang. Statistics
U.S.
Govt.
U.S.
History
World
History Total
Palo Verde HS 25 73 17 84 23 8 21 16 24 59 100 64 514
Peterson Behavior JR/SR HS 10 10
Rancho HS 8 47 13 48 41 15 16 21 84 45 57 395
Sandy Valley JR/SR HS 57 57
SE Career & Tech Academy 31 26 28 15 11 22 25 158
Shadow Ridge HS 23 18 39 24 26 7 28 30 195
Sierra Vista HS 50 69 22 15 35 6 51 34 28 39 349
Silverado HS 55 26 46 46 19 68 13 16 48 33 62 432
Southwest Career & Tech 13 45 4 106 70 238
Spring Valley HS 39 40 74 50 20 89 57 73 53 495
Sunrise Mountain HS 7 14 21 15 31 17 15 32 24 176
Valley HS 18 2 27 22 4 48 54 175
Veterans Tribute CTA 13 13
Virgin Valley HS 19 14 26 21 26 106
West CTA 196 196
West Prep Jr/Sr HS 8 21 26 21 76
Western HS 8 17 18 14 7 17 22 23 126
Total 748 985 439 2086 1784 139 884 409 819 2049 2179 2314 14835
Sections <25 Students 19 29 22 23 21 7 10 30 12 16 23 21 233
# of Students in <25 classes 301 510 322 431 412 112 169 383 204 452 429 411 4136
Source: CCSD Student Data Services.

87
The CCSD Virtual High School (VHS) offers courses online. It has a full time enrollment of 150 students,
and a part time enrollment of 8,800 students taking one or more online courses. These students are
enrolled from all parts of the school district and are not concentrated in any one area. Part-time
students typically enroll at VHS because their home school does not offer the course or because there is
a schedule conflict that prevents them from taking the course at their home school.
The Virtual High School currently offers 12 Advanced Placement courses, all taught by highly qualified
CCSD teachers25:
� English Language and Composition AP-4670
� English Literature and Composition AP-4680
� Spanish Language AP-3361
� Calculus AB AP-4880
� Statistics AP-4730
� Biology II AP -6770
� Chemistry II AP-6860
� Physics II AP-6910
� Psychology II AP-7230
� U.S. History AP-7030
� U.S. Government AP-7050
� World History AP-7010
The calculus and statistics classes are offered in alternating years. For 2011-12, statistics is being
offered. VHS is not offering the AP Psychology course in 2011-12. Depending on interest, not all three of
the science courses are offered every year.
VHS AP classes are offered in an asynchronous model that also includes synchronous elements. Some
teachers hold online Wimba26 sessions that are synchronous; others hold in-person tutoring sessions to
supplement available asynchronous and synchronous online tutoring.
VHS has not yet established a ceiling on enrollment in its AP classes, but school administrators estimate
that 45 students would likely be the appropriate limit. Expanding AP enrollment (and possibly course
offering) might require an increase in the number of VHS teachers, but this increase would be more than
offset by a district-wide reduction in teaching costs associated with low attendance AP courses.
Fiscal Impact
25
According to VHS principal
26 An online classroom environment. Students and teachers meet there synchronously.

88
The district should establish a policy of requiring schools to provide low enrollment AP courses online
through the Virtual High School. Based on 2010-11 data, moving the 4,136 students served in the 233
low enrollment AP sections from the face-to-face courses to VHS, would free-up teaching time
equivalents of 46.6 full-time teachers (233 / five periods of teaching per day). At approximately $80,000
in salary and benefits, this could reduce costs by up to $3,728,000 annually. Assuming these AP courses
were all offered at VHS, an estimated 10 additional teachers would need to be hired, at a total annual
cost of $800,000.
The district could apply a similar approach to many other low enrollment offerings at the secondary
schools and reap additional fiscal benefits. This will likely require a longer lead time, as VHS may have to
hire teachers in new subject areas and develop new online content. However, the cost reductions could
be even more substantial than that possible with the AP courses.
Recommendation 3-5.1
One-Time
(Costs)/
Reductions
2012-13 2013-14 2014-15 2015-16 2016-17
Convert low enrollment
Advanced Placement
courses to CCSD's virtual
learning model.
$0 $2,928,000 $2,928,000 $2,928,000 $2,928,000 $2,928,000
Total $0 $2,928,000 $2,928,000 $2,928,000 $2,928,000 $2,928,000
Magnet Schools
CCSD operates 17 magnet schools with a combined 2011 enrollment of 25,790 students. Not all 17
schools are whole school magnets; some are magnet programs within a regular school setting. Thus, not
all of the nearly 26,000 students in these schools are afforded magnet opportunities. In some district
documentation, magnet and career/technical academies are considered together. This analysis reviews
just magnet schools.
Beyond the regular per student and per school allocations, the magnet schools receive additional
staffing allocations and funding allocations that may be used for other additional staffing.
Recommendation 3-5.2: Eliminate both the theme coordinator and recruiting counselor positions at
the district’s magnet schools.
Theme Coordinators
Theme coordinators are school-based teaching staff responsible for coordinating aspects of each
school’s magnet program. These duties include providing positive youth development activities, working
with community partners and advisory board leaders, career planning, internships/job shadowing, and
project-based learning instruction, among others. At specific sites, these positions may involve other
functions designated by the principal, such as co-teaching.

89
While coordinators are licensed teachers, they do not carry a regular teaching load, and their positions
are not counted as teacher positions when class size ratios are applied to establish teacher allocations.
In 2011-12, there were 15 theme coordinators, paid a combined salary of $830,741. Including benefits,
these positions require $1.11 million per year.
Based on case studies, guidance from the U.S. Department of Education notes that having someone at
the school level to coordinate magnet activities is important to success.27 While the guidance
emphasizes that the coordinator should not be the school principal (due to the many competing
demands on a principal’s time), it does not require that the coordinator be a full-time position. Instead,
it may be “a lead teacher who does part-time coordination work” (p. 12). The guidance further notes the
importance of marketing magnet programs, but give examples of where the marketing/recruiting is
done through district-level activities.
CCSD should eliminate the theme coordinator position and assign duties currently performed by theme
coordinators to existing classroom teaching staff and/or performance managers in the new Performance
Zones.
Recruiting Counselors
In addition to the theme coordinators, secondary magnet schools receive additional counseling staff, but
they do not function primarily as counselors. The additional counselors are called “recruiting
counselors” whose primary responsibilities are marketing their magnet program, recruiting students
into the program, and managing the magnet application and enrollment process.
According to central office staff, the student recruiting season runs from October 1 through February for
daily recruitment. From March through September, recruiting counselors are involved with student
applications, appeals, the lottery selection process and other counseling duties. Some of the recruiting
counselors also share in a portion of the student caseload for typical counselor activities. However, this
is a school-based decision, determined by each magnet principal. Available district staff were unable to
provide estimates regarding the time the average recruiting counselor spends on non-recruiting, typical
counseling duties.
The recruiting counselors are not identified in the district’s FTE data, so the allocation of all counselors
at magnet schools is considered here. In 2011-12, there were 62 counselors at CCSD secondary magnet
schools, with an average salary of $59,749 (see Table 3-5.2).
Table 3-5.2. Allocation of Counselors at secondary magnet schools
Name of School 2011
Enrollment
Grades
Served
Counselor
FTE
Average
Salary
Bridger Academy 1325 6-8 3 $63,226
Hyde Park Academy 1729 6-8 3 $60,398
27
U.S. Department of Education, Office of Innovation and Improvement, Innovations in education: Creating
successful magnet schools programs. Washington, D.C. 2004.

90
Name of School 2011
Enrollment
Grades
Served
Counselor
FTE
Average
Salary
Cashman Academy 1454 6-8 3 $57,122
Knudson Academy 1284 6-8 4 $62,894
Gibson Academy 1035 6-8 2 $50,432
Martin IB 1363 6-8 3 $57,004
Canyon Springs High School 2561 9-12 7 $67,916
Clark High School 2671 9-12 8 $57,976
Desert Pines High School 2277 9-12 7 $64,939
Las Vegas Academy 1614 9-12 5 $58,748
Rancho High School 2979 9-12 9 $56,966
Valley High School 2962 9-12 8 $59,363
Source: CCSD 2010-11 Count Day Enrollment, CCSD Finance and Operations Division Full-Time Equivalents file.
The CCSD staffing guidelines for counselors, as published in the 2011-12 CCSD Budget and Statistical
Report28, notes this staffing formula for counselors:
� At the elementary level, a goal of one counselor per 500 students, but a recognition that budget
constraints will not allow this to be realized.
� At the middle schools, an allocation of one counselor per 500 students or major fraction thereof
based on fall enrollment.
� At the high schools, an allocation of one counselor per 400 students or major fraction thereof
based on fall enrollment.
The American School Counselor Association (ASCA) recommends a student to counselor ratio of 250 to
one29. However, as of 2008-09, the national average was 457 to one, with only five states (Louisiana,
Mississippi, New Hampshire, Vermont, and Wyoming) achieving the ASCA recommend ratio or better. In
Nevada, the 2008-09 ratio was 511 to one.30
Comparing the 2010-11 counselor staffing at the secondary magnet schools with the 500 or 400 to one
published CCSD ratio and the Nevada average of 511 to one reveals that magnet schools have from eight
to 16 more counselors than those allocation formula would provide (Table 3-5.3.)
28
http://ccsd.net/directory/budget-finance/publications/10-11_Budget/Budget_10-11_Complete.pdf
29 www.schoolcounselor.org
30 http://www.schoolcounselor.org/files/ratios%202008-2009.pdf

91
Table 3-5.3 Comparison of Counselor allocation at magnet schools to staffing guidelines31
Name of School Counselor
FTE
Counselor
Allocation
per CCSD
Ratio
Counselor
Overage
per CCSD
Ratio
Counselor
Allocation
at NV Avg.
Counselor
Overage
per NV Avg.
Bridger Academy 3 3 0 3 0
Hyde Park Academy 3 3 0 3 0
Cashman Academy 3 3 0 3 0
Knudson Academy 4 3 1 3 1
Gibson Academy 2 2 0 2 0
Martin IB 3 3 0 3 0
Canyon Springs High School 7 6 1 5 2
Clark High School 8 7 1 5 3
Desert Pines High School 7 6 1 4 3
Las Vegas Academy 5 4 1 3 2
Rancho High School 9 7 2 6 3
Valley High School 8 7 1 6 2
Source: CCSD Finance and Operations Division Full-Time Equivalents file, American School Counselor Association
Using the average salary of $59,749, eliminating eight (non-counseling) recruiting counselor positions
would save $691,000 per year in salary and benefits. These duties should be reallocated to central office
or performance zone staff.
Fiscal Impact
Eliminating the 15 theme coordinator and eight recruiting counselor positions would save the district
approximately $1.81 million in salary and benefits per year ($9,032,345 over the next five years). These
are non-teaching positions in the case of the theme coordinators and largely non-counseling positions in
the case of the recruiting counselors.
31
Two elementary magnet schools have counselor staffing above the CCSD staffing guidelines: Gilbert and
Hoggard. As these do not appear to be recruiting counselor allocations, they have not been considered here.

92
Recommendation 3-5.2
One-Time
(Costs)/
Reductions
2012-13 2013-14 2014-15 2015-16 2016-17
Eliminate both the theme
coordinator and recruiting
counselor positions at the
district’s magnet schools.
$0 $1,806,469 $1,806,469 $1,806,469 $1,806,469 $1,806,469
Total $0 $1,806,469 $1,806,469 $1,806,469 $1,806,469 $1,806,469
CCSD Behavior and Continuation Schools
The district provides a variety of education alternatives for its students. One of the more significant
alternative education programs is provided in five behavior schools and three continuation schools. The
behavior schools serve students with disciplinary problems and expelled students. The continuation
schools’ enrollment is limited exclusively to students who have been expelled from their home school
via a Board of Trustee-ratified expulsion. In 2009-10, the behavior schools enrolled 4,841 students and
the continuation schools enrolled 1,355 students for at least a portion of the school year. Direct salary
and benefit costs of these alternative schools total over $12 million annually.
School administrators submitted 4,544 recommendations for expulsion in 2009-10. Of these, only 22
(0.48 percent) were rejected by the Education Services Division (ESD), which oversees the program.
Expulsions decreased from 2008-09 levels, when 5,295 expulsion recommendations were made, 61
were denied by ESD (1.15 percent) and 1,069 expulsions were ratified by the Board of Trustees.
Expulsion rates vary among the schools from zero to nine percent of the student enrollment. Eight
schools had expulsion rates of five percent or higher.
Students enrolled in the behavior schools were either recommended for expulsion or were directly
placed in the behavior school by their home school principal without a recommendation for expulsion.
Surprisingly, ESD staff does not maintain central statistics on the number of students directly placed into
behavior schools by principals without expulsion recommendations, but principals of these schools
estimate the proportion to be approximately 35 percent.
None of the regular school principals in focus groups conducted during this study supported the existing
behavior/continuation school program models. Their concerns included:
� Students placed in behavior schools do not have access to adequate counseling while there, so
the root causes of behavior are not addressed.
� Some students request to stay in the behavior schools after their assignment term has ended
because they perceive that grading is easier in the behavior schools. Principals of regular schools
also questioned the quality of academics in the behavior schools.

93
� When expelled former students of Career/Technical Education (CTE) schools complete their
expulsion term, the CTE refuses to accept them back. This means that the comprehensive high
schools must accept them.
� There appears to be great variation of practice in the length of assignment at the behavior
schools, despite stated guidelines. Again, there is no central data to support an analysis of this
thesis.
As noted above, data are not available to assess completely the validity of these perceptions.
Academic Managers in a focus group noted that current Board of Trustee regulations concerning
expulsion and principal-directed transfers are too broad and subject to varied interpretations among the
school principals. They noted that the district’s discipline policy is generally one of “zero tolerance”, and
they also observed that wide variations in the application of the discipline code among the schools.
Principals in a focus group noted that they have modified past versions of discipline codes provided by
their respective area superintendents and continue to use them.
Data on weekly enrollments in the behavior and continuation schools show a general increase
throughout the school year, with spikes shortly after the annual official enrollment count day
(September 24th in 2010-11) and around the winter break (Figure 3-5.1). There are variations in the
patterns of weekly enrollment among the individual behavior and continuation schools.
Figure 3-5.1. Overall weekly enrollment in Behavior and Continuation Schools
Source: CCSD Student Data Services, July 2011.
The district does not have adequate performance measures in place to evaluate whether the behavior
and continuation schools are producing improved student behavior. District staff estimates that only 20
percent of the students placed in behavior/continuation schools later return, but this estimated figure
0
200
400
600
800
1000
1200
1400
1600
1800

94
could not be confirmed with readily available data. Moreover, ESD staff does not track the outcomes for
students who have been assigned to a behavior/continuation schools and then returned to normal
classes. One important measure of success would be whether students leaving behavior/continuation
schools ultimately graduate, but the district does not track the dropout rate for these students
separately.
A similar concern regarding behavior schools and continuation schools was expressed in a prior
consultant study. The 2006 MGT of America report32 noted:
During on-site visits, it was reported that the behavior schools and Continuation Schools
were not consistently effective in improving the behavior or performance of students
who attended the program. The behavior program was often referred to as an
opportunity for time-out for the student and the student’s school. In addition,
instructional content is lacking. Students who attend the behavior program are on
multiple academic levels, which makes it a challenge to plan and delivery of appropriate
instruction for individual students. Given the short duration of the program, there are
limited data to support that students are actually improving self-control and social
interaction and acquiring new life skills.
CCSD staff, including principals in both comprehensive high schools and behavior schools, indicated that
little has changed since this recommendation was made in 2006.
Recommendation 3-5.3: Evaluate CCSD’s behavior and continuation schools, the referral and exit
procedures, and the impact on student performance and other outcomes.
CCSD should track performance and discipline information on students before, during and after their
enrollment in a behavior or continuation school to determine their effectiveness. Referral and exist
procedures should also be evaluated and tested to ensure that consistent application is occurring across
the district. This evaluation work should contribute to more effective behavior and continuation schools
and more effective practices for addressing discipline issues in the referring schools.
Fiscal Impact
This recommendation can be implemented with existing resources. (See related recommendation in the
following section to expand the district’s program evaluation capacity.)
32
Clark County School District Financial Management Review, MGT of America, October 2006.

95
Section 6 – Evaluation of Academic Programs
Two of the questions in the scope of work for this project related to the evaluation of specific CCSD
academic programs.
1. What existing educational programs yield the greatest return on investment and could be
expanded (within the constraints of existing resources) to increase student achievement?
2. What, if any, educational programs should be abandoned, with resources being redirected to an
existing program(s) and/or a new program(s) to increase student achievement?
To make appropriate recommendations regarding which programs should be expanded and which
should be abandoned, the review team requested student achievement data and program participation
data that would enable statistical analyses examining the relative impact of various programming on
student outcomes. Because of the limitation of program participation data, judgments about specific
programs could not be made. This section presents the results of some analysis conducted with the
available data, and provides a recommendation for CCSD to collect this data going forward to support
the evaluation of specific programs and the determination of the district’s Return on Investment (ROI).
While student-level data were available on test scores and demographic variables of interest, the district
does not maintain critical data elements necessary for conducting appropriate outcome analyses. For
example, there was no data regarding levels of implementation of particular programs, the students
that are served by particular programs (e.g., participation indicators), or the amount of instruction
received (e.g., a dosage variable). As a result, it was not possible to examine the influence of any given
program on school-level or student-level outcomes. To do so, data will be needed on both the inputs
(which students participated in which programs, what were their levels of participation, and what were
the levels of implementation) and the outcomes (student-level results among those participants, and
among non-participants.)
The district did provide student-level demographic and test score data, along with a data set indicating
which programs were being “implemented” at which of the district’s schools. The only program
participation data available at the school level related to programs targeting ELLs and nine other specific
interventions relating to various subject areas.
The following major assumptions were required to examine the data provided. Since school was not in
session during the course of this study, classroom observations and interviews with teachers about
specific programs could not be performed. The assumptions made are listed below:
� A school that is potentially implementing a given program is actually implementing the program
� That implementation of a given program is occurring with high fidelity to program design
� That limited English proficiency (LEP) students in a given school are participating in ELL programs
at that school

96
� That students across all grades served in a given school are participating in a given program
� That programs should have an observable impact on both reading and math passing rates
With these assumptions made, data on students’ passing rates on the reading and math assessments
were used to compute a change score from 2009 to 2010 for each school. For all schools, the number of
students meeting or exceeding standards (scoring a 3 or a 4) on the Criterion Reference Test (CRT) were
summed to derive a total number/percentage of students on each school passing in 2009 and 2010.
Next, a change score was computed such that the passing percentage among students in 2009 at a given
school was subtracted from the passing percentage among students in 2010 for that school. If a school’s
passing rate increased from one year to the next, the result would be a positive change score; if a
school’s passing rate decreased from one year to the next, the result would be a negative change score.
Programs Targeting English Language Learners
To examine programs targeted to English Language Learners, the process described above was followed
to create change scores at the school-level, but the analysis was developed using only students
designated as LEP, making the assumption that LEP students are actually participating in ELL programs at
these schools. It is important to note that the total number of LEP students in a given school varies
widely, thus a 50 percent passing rate in one school may mean that two of four LEP students met or
exceeded standards, whereas in another school a 50 percent passing rate might mean that 120 of 240
LEP students earned a passing score. Though this is a weakness to this approach, without student-level
data indicating which students participated in which programs, there is no other method appropriate for
examining change in passing percentages.
Four programs targeted toward ELL students were utilized in this analysis: (1) Imagine Learning, (2)
Rosetta Stone, (3) LeapFrog, and (4) Trophies reading Series. These programs were chosen only by the
number of CCSD schools utilizing the programs in 2009-10.
The first program examined was the Imagine Learning program. Figure 3-6.1 and Figure 3-6.2 illustrate
the change in passing rates among all LEP students at each school for all schools in the district from 2009
to 2010 on the CRT. Each school is represented by a change score (along the y-axis, with zero change
indicating that the passing percent among LEP students was the same in 2010 as it was in 2009). Points
below the 0 line represent schools among which passing rates went down from 2009 to 2010. Points
above the 0 line represent schools among which passing rates went up from 2009 to 2010. Schools with
the Imagine program are designated by a blue circle. As can be seen, passing rates from 2009 to 2010
decreased among LEP students among the majority of all schools in both reading and math.

97
Figure 3-6.1. Change in passing rates in reading (Imagine program implemented at 88 schools)
Source: Student CRT scores provided by CCSD, 2011; school-level program data provided by CCSD, 2011
Figure 3-6.2. Change in passing rates in math (Imagine program implemented at 88 schools)
Source: Student CRT scores provided by CCSD, 2011; school-level program data provided by CCSD, 2011

98
From 2009 to 2010, 87.7 percent of schools demonstrated a decrease in the percentage of LEP students
who met passing standards on the CRT in reading. Among schools with the Imagine program, this
decrease was evident among 89.2 percent of the schools. In math, the story was similar, with 77.8
percent of all schools decreasing in their passing percentage among LEP students, and 74.3 percent of
schools with the Imagine program showing a decrease in the passing percentage of LEP students on the
math tests.
These graphs and statistics must be interpreted carefully as there are many limitations to the data being
reported, as described earlier in this section. The resulting scatter diagrams, which fail to show any sort
of pattern among program-schools, or any systematic differences between program schools and non-
program schools, do not suggest that the program is not working, nor do they provide any evidence or
promise that the program is working. Rather, the random-ness of the data points (the distribution of
program schools both above and below the zero-change line) highlights the extent to which the “noise”
in the data could be obscuring any potential patterns that may exist. Without having more detailed
information about which students participated in the program, more granular analyses of program
impacts are not possible.
A similar lack of pattern emerges when examining change in passing percentages among LEP students
for three other ELL programs: LeapFrog, Rosetta Stone, and Trophies Reading Series. Figure 3-6.3 and
Figure 3-6.4 displays change in passing percentage among LEP students in reading and math for all
schools, with schools providing the Leapfrog Program indicated with blue circles. Again, there are an
equal number of program and non-program schools above and below the zero-change line, and no
observable pattern of change among program schools (e.g., program schools are not clustered near the
top of the change scores, or more heavily clustered around positive changes scores). Eighty-nine percent
of schools implementing the Leapfrog Program showed a decrease in passing percentage of LEP
students from 2009 to 2010 in reading (compared to 87.7 percent district-wide), and 75.6 percent
decreased in math (compared to 77.8 percent district-wide).

99
Figure 3-6.3. Change in passing rates in reading (Leapfrog program implemented at 98 schools)
Source: Student CRT scores provided by CCSD, 2011; school-level program data provided by CCSD, 2011
Figure 3-6.4. Change in passing rates in math (Leapfrog program implemented at 98 schools)
Source: Student CRT scores provided by CCSD, 2011; school-level program data provided by CCSD, 2011

100
The Rosetta Stone program was implemented in 61 schools that had data for both 2009 and 2010. As
can be seen in 3-6.5 and Figure 3-6.6, there is no observable pattern to the change scores among those
program-schools, based on passing percentages among LEP students. While the majority of schools’
passing rates decreased from 2009 to 2010, the number of Rosetta Stone program schools above the
zero change line is not disproportionate in any systematic way from the number of schools above the
zero line that did not implement the program. 83.3 percent of schools implementing the Rosetta Stone
program demonstrated decreasing passing rates among LEP students in reading (compared to 87.7
percent district-wide), and 77.1 percent decreased in math (compared to 77.8 percent district-wide).
Figure 3-6.5. Change in passing rates in reading (Rosetta Stone program implemented at 61 schools)
Source: Student CRT scores provided by CCSD, 2011; school-level program data provided by CCSD, 2011

101
Figure 3-6.6. Change in passing rates in math (Rosetta Stone program implemented at 61 schools)
Source: Student CRT scores provided by CCSD, 2011; school-level program data provided by CCSD, 2011
For schools implementing the Harcourt Trophies Reading Series, there was no particular pattern to the
change in scores among LEP students that is observable without knowing which students were impacted
by the program. When looking at whole-school passing rates among LEP students, 89.5 percent of
schools decreased in reading CRT scores (compared to 87.7 percent district-wide), and 60.5 percent
decreased in math CRT scores (compared to 77.8 percent district-wide). (See Figures 3-6.7 and 3-6.8 and
Table 3-6.1) More detailed information about program participation at the student-level is required to
begin to analyze whether or not program-participation impacted student performance.

102
Figure 3-6.7. Change in passing rates in reading (Trophies program implemented at 41 schools)
Source: Student CRT scores provided by CCSD, 2011; school-level program data provided by CCSD, 2011
Figure 3-6.8. Change in passing rates in math (Trophies program implemented at 41 schools)
Source: Student CRT scores provided by CCSD, 2011; school-level program data provided by CCSD, 2011

103
Table 3-6.1 Summary of findings for each of the four ELL programs
Percent of schools showing a decrease in passing percentage
from 2009 - 2010 Reading Math
Overall, district-wide 87.7% 77.8%
Among schools with the Imagine Learning ELL Program 89.2% 74.3%
Among schools with the Leapfrog Program 88.4% 75.6%
Among schools with the Rosetta Stone Program 83.3% 77.1%
Among schools with the Harcourt Trophies Reading Series 89.5% 60.5%
Source: Student CRT scores provided by CCSD, 2011; school-level program data provided by CCSD, 2011
Intervention Programs and Measurement Systems
Three intervention programs and one student performance measurement system not targeted
specifically to ELL students, were also examined: the AIMSweb program, the Compass Learning program,
the Imagine Learning English program, and the Read 180 program. Of the 25 intervention programs
currently implemented at schools within CCSD, these four were targeted for analysis as they were
implemented in the greatest number of schools. For these programs, changes in passing percentages
were examined for all students in a school. Unlike passing percentages among LEP students, which
mostly decreased from 2009 to 2010, when examining passing rates among all students in a school, the
majority of schools showed an increase in passing percentages from 2009-2010. School-level reading
and math scores were examined, looking at all schools in the district and identifying those schools
implementing the program. It is important to note that all four programs do not necessarily target both
reading and math subject areas. It is common, however, to examine outcomes in both areas, as
programs that impact changes in one often have carryover impacts on the other subject area.
Additionally, schools that improve performance in one area often are implementing major efforts (i.e.,
organizationally, structurally, academically, etc.) that will have impacts in both reading and math test
performance.
Figure 3-6.9 and Figure 3-6.10 display change in passing percentage from 2009 to 2010 for all schools in
the district, when examining scores for all students on the school. Schools implementing the AIMSweb
measurement system are indicated by blue circles. A zero score on the y-axis represents schools with no
change in passing percentage from 2009 to 2010. Schools above the 0 line showed an increase in passing
percentage, and schools below the 0 line showed a decrease in passing percentage. This scatterplot
clearly shows that the majority of schools increased in reading and math passing percentages from 2009
to 2010 when all students’ scores are examined. However, the schools implementing the AIMSweb
program are not systematically more or less likely to have a positive change score than the others. 70.4
percent of program schools increased in reading passing percentages, compared to 69.3 percent district-
wide, and 74.8 percent of program schools increased in math passing percentages, compared to 68.6
percent district wide. Any differences observed cannot be attributed to the presence of the program, as

104
analytic models controlling for various influences and contextual factors cannot be conducted due to
unavailability of necessary data.
Figure 3-6.9. Change in passing rates in reading (AIMSweb program implemented at 164 schools)
Source: Student CRT scores provided by CCSD, 2011; school-level program data provided by CCSD, 2011

105
Figure 3-6.10. Change in passing rates in math (AIMSweb program implemented at 164 schools)
Source: Student CRT scores provided by CCSD, 2011; school-level program data provided by CCSD, 2011
Figure 3-6.11 and Figure 3-6.12 display the same information for schools implementing the Compass
Learning program. For these schools, passing percentages on the reading tests improved among 77.5
percent of schools (compared to 69.3 percent district-wide), and 66.7 percent demonstrated increased
passing percentages in math, compared to 68.6 percent district-wide. Again, these figures demonstrate
random-ness in the distribution of program schools above and below the zero change line (in other
words, the distribution of change is proportionate to the distribution of change among all schools in the
district).

106
Figure 3-6.11. Change in passing rates in reading (Compass Learning program implemented at 105
schools)
Source: Student CRT scores provided by CCSD, 2011; school-level program data provided by CCSD, 2011
Figure 3-6.12. Change in passing rates in math (Compass Learning program implemented at 105
schools)
Source: Student CRT scores provided by CCSD, 2011; school-level program data provided by CCSD, 2011

107
Figure 3-6.13 and Figure 3-6.14 displays the scatterplot organized by schools implementing the Imagine
Learning English program. Among all students at the school, passing percentages increased among 71.9
percent of schools in reading, and among 82.3 percent of schools in math. No causal statistical models
are being conducted, therefore it is not possible to attribute any observed differences to influences of
the program.
Figure 3-6.13. Change in passing rates in reading (Imagine Learning English program implemented at
98 schools)
Source: Student CRT scores provided by CCSD, 2011; school-level program data provided by CCSD, 2011
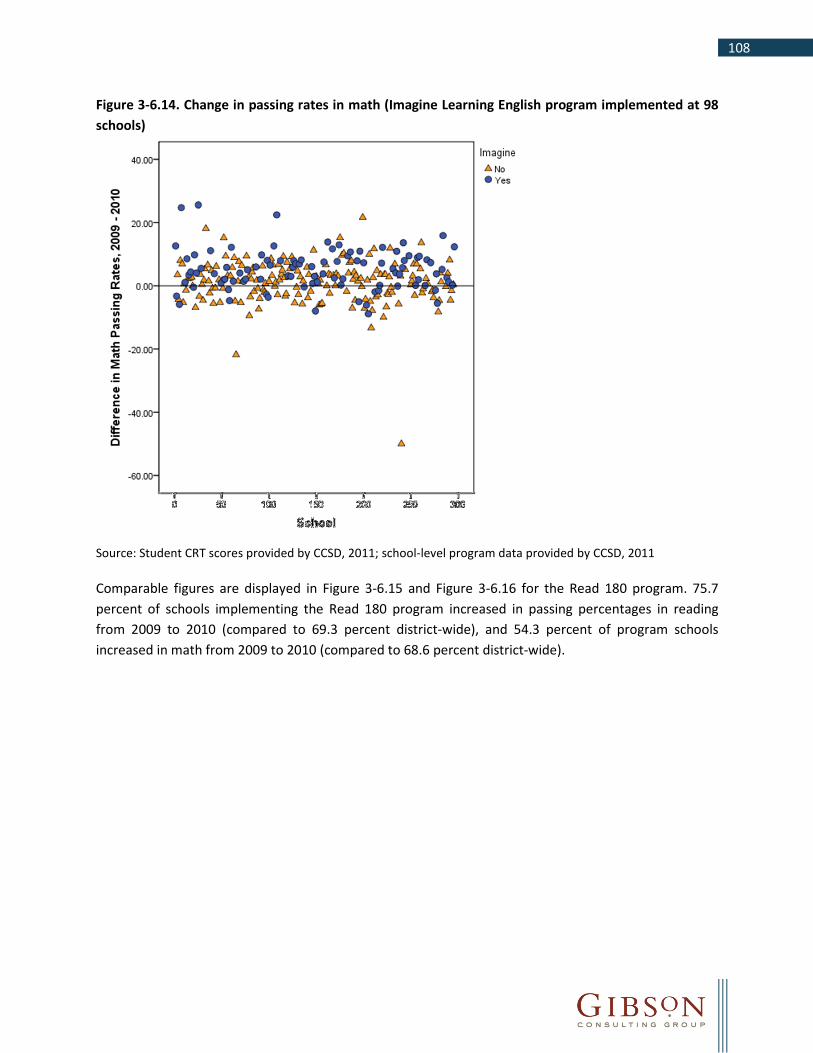
108
Figure 3-6.14. Change in passing rates in math (Imagine Learning English program implemented at 98
schools)
Source: Student CRT scores provided by CCSD, 2011; school-level program data provided by CCSD, 2011
Comparable figures are displayed in Figure 3-6.15 and Figure 3-6.16 for the Read 180 program. 75.7
percent of schools implementing the Read 180 program increased in passing percentages in reading
from 2009 to 2010 (compared to 69.3 percent district-wide), and 54.3 percent of program schools
increased in math from 2009 to 2010 (compared to 68.6 percent district-wide).

109
Figure 3-6.15. Change in passing rates in reading (Read 180 program implemented at 70 schools)
Source: Student CRT scores provided by CCSD, 2011; school-level program data provided by CCSD, 2011
Figure 3-6.16. Change in passing rates math (Read 180 program implemented at 70 schools)
Source: Student CRT scores provided by CCSD, 2011; school-level program data provided by CCSD, 2011

110
Table 3-6.2 summarizes the percentage of schools implementing each program that showed an increase
in overall passing rates from 2009 to 2010, for both math and reading.
Table 3-6.2. Percent of schools showing an increase in passing percentage from 2009 - 2010
Reading Math
Overall, district-wide 69.3% 68.6%
Among schools with the AIMSweb Program 70.4% 74.8%
Among schools with the Compass Learning Program 77.5% 66.7%
Among schools with the Imagine Learning English Program 71.9% 82.3%
Among schools with the Read 180 Program 75.7% 54.3%
Source: Student CRT scores provided by CCSD, 2011; school-level program data provided by CCSD, 2011
It is important to note that none of the findings reported above should be used to suggest any causal
relationship between program implementation and findings. It is quite possible that schools with lower
passing percentages were more likely to implement particular programs, or that schools with lower test
scores were more likely to implement drastic improvement efforts in addition to the programs
examined here. Therefore, any results that may appear to suggest improved performance (or decreased
performance) among program schools, cannot be attributed to the presence or absence of any
particular program.
In order to do so, it would be necessary to run statistical models that account for various influences on
student outcomes, to approximate causality, and enable interpretations that suggest an “effect” or an
“impact”. An example of such a model would be a hierarchical linear model (HLM). To conduct an HLM
model, student-level historical data, combined with program participation data, is used to statistically
determine whether students who participated in a given program outperformed students who did not
participate in that program. An HLM model partitions the variance in the data that is due to individual
student-level influences or differences (such as pre-existing academic aptitude, demographic
influences), and that which is attributable to shared school-level influences (such as differences between
particular schools), and error variance, or variance attributable to unmeasured variables, or noise. The
result of an HLM model can suggest whether observed scores on assessment tests between participating
and non-participating students are different above and beyond the extent to which they differ because
of these other influences. In order to conduct such a test, more granular programmatic data are needed,
most importantly data that indicates participants versus non-participants.
Recommendation 3-6.1: Enhance program evaluation capacity to support calculation of Return on
Investment in academic programs and interventions.
In order to effectively gauge the impact of various instructional programs on student outcomes (and
beyond that, to be able to assess the program cost effectiveness, or ROI of different programs), CCSD
must put into place much better student-level data collection and data management processes. The

111
implementation strategies below provided below are designed to provide CCSD with strategies that
would provide the district with the data necessary to actually determine which programs should be
expanded, and which should be abandoned. A separate but related recommendation to track program
and intervention expenditures to support an ROI calculation is presented in the Chapter 4 – Budget
Process and Transparency of this report.
Implementation of this recommendation should consider the following implementation strategies:
Create Program-Level Inventory Across Schools. The district should create an inventory of all
instructional programs being used in each CCSD school that tracks which programs are being
implemented on which schools, and within which grades. This inventory should be updated annually to
track which programs are no longer in use, and to add additional new programs each year.
Track Program Participation at the Student Level. For programs that the district wants to evaluate,
CCSD should maintain student-level records that track which students are participating in which
instructional programs. For instance, an ELL program will only serve a sub-set of students. A database
must be maintained that tracks participation patterns for those students. This database must track
student information using the same unique identifier (e.g., student ID) that enables linking back to other
data systems in the district containing pertinent student information, such as demographic or test score
data.
Create Evaluation Plans for Key Programs of Interest
When implementing new instructional programs on CCSD schools, the CCSD district office should
develop an evaluation plan which can measure the impact of various instructional programs or
initiatives on student achievement and determine the return on investment for those programs.
Evaluation plans should include, at a minimum:
� The use of quantitative and qualitative research methods to determine implementation fidelity,
program outcomes, and return on investment.
� The use of experimental or quasi-experimental research designs, which include groups of
students provided with the instructional intervention and comparable students at the same
school or peer schools in CCSD who were not provided with the instructional intervention under
review.
� Analyses which include program effects and program expenditures to assess the cost
effectiveness of the instructional program.
Pilot New Programs. CCSD should consider piloting new programs (in the formal sense of the word, with
appropriate research design guiding the pilot) such that the potential impacts of the program can be
determined in a smaller, more controlled environment prior to determining whether full-scale
implementation is desired. True pilots are useful ways of testing impacts, as measurement is more

112
controlled, data management is not as difficult, and results are less likely to be confounded by
error/noise).
Consider Outsourcing. CCSD should consider the benefits of outsourcing the program evaluation
function versus increasing in-house staff to expand the capacity of program evaluations. Outside
contractor cost may be more expensive per hour, but would represent a variable cost that could be
adjusted annually. Outside contractors will also be likely to have a higher degree of objectivity, or
perceived objectivity, related to evaluation findings.
Fiscal Impact
Academic program evaluation capacity needs to be increased to support ROI calculations for selected
programs and interventions, including those that are not grant funded. Additional funds will be needed
to support the tracking of student participation in various programs and interventions. Based on an
additional 10 FTEs at an average pay and benefit level of $100,000 each, it is estimated that the staff
investment should be $1 million per year for these efforts. An additional $1.5 million is needed for
contracted program evaluation services in specialized areas and for licensing fees ($300,000 annually
from 2014-15 to 2016-17) for the district’s data analysis tools.
Recommendation 3-6.1
One-Time
(Costs)/
Reductions
2012-13 2013-14 2014-15 2015-16 2016-17
Additional program
evaluation staff (10
FTEs at $100,000 each)
$0 ($1,000,000) ($1,000,000) ($1,000,000) ($1,000,000) ($1,000,000)
Contracted services for
specialized areas and
licensing fees for data
analysis tools
$0 $1,500,000 $1,500,000 $1,500,000 $1,500,000 $1,500,000
Total $0 ($2,500,000) ($2,500,000) ($2,500,000) ($2,500,000) ($2,500,000)
After formal program evaluations are completed, and ROI is calculated, the district should be able to
focus its scarce resources on a smaller number of programs and interventions that contribute to higher
student achievement through cost-effective delivery models. In addition to costs reductions resulting
from being able to effectively evaluate initiatives and save on obsolete or ineffective programs, an
added revenue benefit of a unit of this nature is the ability to craft more effective grant applications for
state and federal funding.
Top Related
Copyright © 2022 FDOKUMEN

