


Bahasa
Halaman
Hukum

432
ISSN 2286-4822
www.euacademic.org
EUROPEAN ACADEMIC RESEARCH
Vol. II, Issue 1/ April 2014
Impact Factor: 3.1 (UIF)
DRJI Value: 5.9 (B+)
Change Detection in Land Use and Land Cover
Using Remote Sensing Data and GIS in Renuka
Forest Division
JAGDISH CHAND Department of Geography
Govt. PG College, Nahan
India
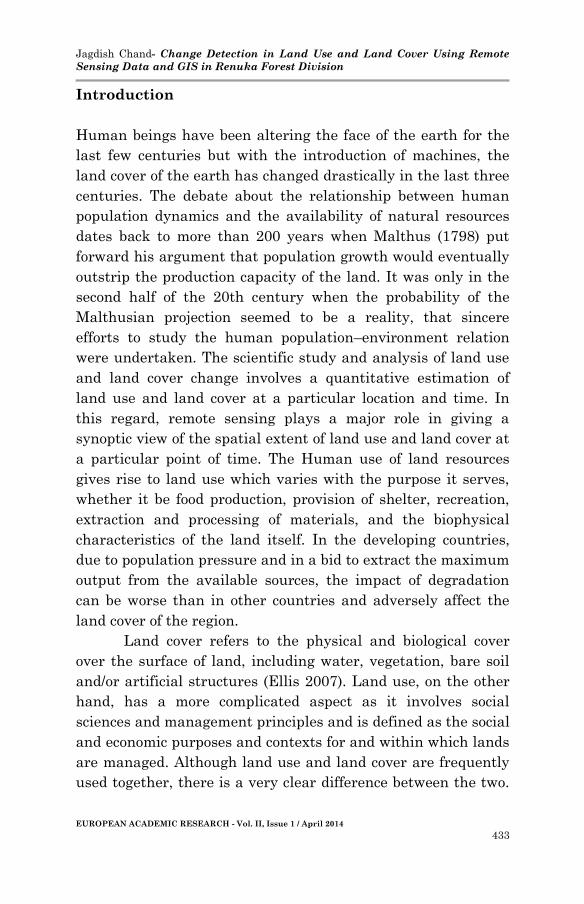
Abstract:
Land use and land cover change have been among the most
important perceptible changes taking place around us. Although
perceptible, the magnitude, variety and the spatial variability of the
changes taking place has made the quantification and assessment of
land use and land cover changes a challenge to geographers.
Furthermore, since most of the land use and land cover changes are
directly influenced by human activities. The Remote Sensing and
Geographic Information System has proved to be very important in
assessing and analyzing land use and land cover changes. Satellite-
based Remote Sensing, by virtue of its ability to provide synoptic
information of land use and land cover at a particular time and
location, has revolutionized the study of land use and land cover
change. The temporal information on land use and land cover helps
identify the areas of change in a region. The use of Geoinformatics has
enabled us to assign spatial connotations to land use land cover
changes, namely, population pressure, climate, terrain, etc. which
drive these changes. This has helped geographers to quantify these
tools and to predict various scenarios. This article gives an overview of
the current trends in land use and land cover changes of Renuka forest
division in Sirmour district.
Key words: Land use; Land cover; Remote sensing; Geographic
information system; Geoinformatics.
Jagdish Chand- Change Detection in Land Use and Land Cover Using Remote
Sensing Data and GIS in Renuka Forest Division
EUROPEAN ACADEMIC RESEARCH - Vol. II, Issue 1 / April 2014
433
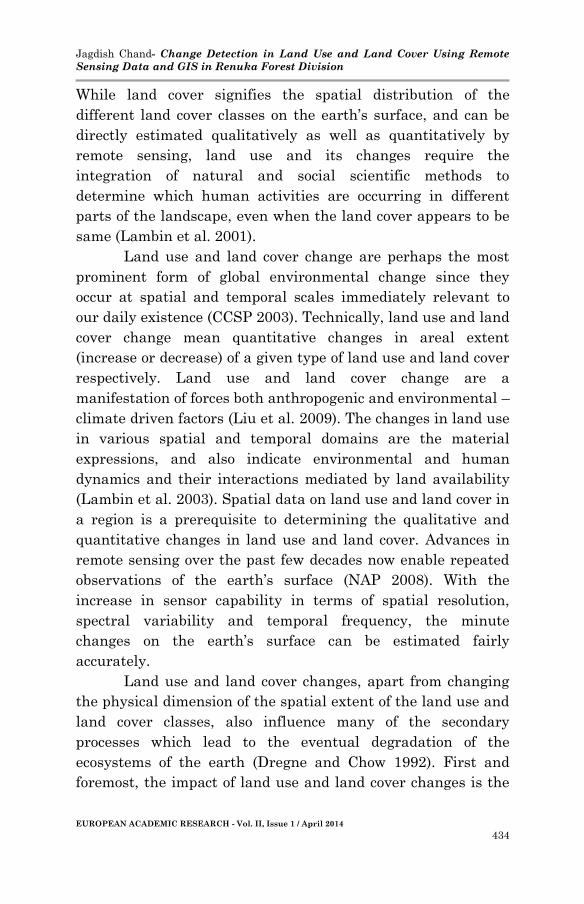
Introduction
Human beings have been altering the face of the earth for the
last few centuries but with the introduction of machines, the
land cover of the earth has changed drastically in the last three
centuries. The debate about the relationship between human
population dynamics and the availability of natural resources
dates back to more than 200 years when Malthus (1798) put
forward his argument that population growth would eventually
outstrip the production capacity of the land. It was only in the
second half of the 20th century when the probability of the
Malthusian projection seemed to be a reality, that sincere
efforts to study the human population–environment relation
were undertaken. The scientific study and analysis of land use
and land cover change involves a quantitative estimation of
land use and land cover at a particular location and time. In
this regard, remote sensing plays a major role in giving a
synoptic view of the spatial extent of land use and land cover at
a particular point of time. The Human use of land resources
gives rise to land use which varies with the purpose it serves,
whether it be food production, provision of shelter, recreation,
extraction and processing of materials, and the biophysical
characteristics of the land itself. In the developing countries,
due to population pressure and in a bid to extract the maximum
output from the available sources, the impact of degradation
can be worse than in other countries and adversely affect the
land cover of the region.
Land cover refers to the physical and biological cover
over the surface of land, including water, vegetation, bare soil
and/or artificial structures (Ellis 2007). Land use, on the other
hand, has a more complicated aspect as it involves social
sciences and management principles and is defined as the social
and economic purposes and contexts for and within which lands
are managed. Although land use and land cover are frequently
used together, there is a very clear difference between the two.
Jagdish Chand- Change Detection in Land Use and Land Cover Using Remote
Sensing Data and GIS in Renuka Forest Division
EUROPEAN ACADEMIC RESEARCH - Vol. II, Issue 1 / April 2014
434
While land cover signifies the spatial distribution of the
different land cover classes on the earth’s surface, and can be
directly estimated qualitatively as well as quantitatively by
remote sensing, land use and its changes require the
integration of natural and social scientific methods to
determine which human activities are occurring in different
parts of the landscape, even when the land cover appears to be
same (Lambin et al. 2001).
Land use and land cover change are perhaps the most
prominent form of global environmental change since they
occur at spatial and temporal scales immediately relevant to
our daily existence (CCSP 2003). Technically, land use and land
cover change mean quantitative changes in areal extent
(increase or decrease) of a given type of land use and land cover
respectively. Land use and land cover change are a
manifestation of forces both anthropogenic and environmental –
climate driven factors (Liu et al. 2009). The changes in land use
in various spatial and temporal domains are the material
expressions, and also indicate environmental and human
dynamics and their interactions mediated by land availability
(Lambin et al. 2003). Spatial data on land use and land cover in
a region is a prerequisite to determining the qualitative and
quantitative changes in land use and land cover. Advances in
remote sensing over the past few decades now enable repeated
observations of the earth’s surface (NAP 2008). With the
increase in sensor capability in terms of spatial resolution,
spectral variability and temporal frequency, the minute
changes on the earth’s surface can be estimated fairly
accurately.
Land use and land cover changes, apart from changing
the physical dimension of the spatial extent of the land use and
land cover classes, also influence many of the secondary
processes which lead to the eventual degradation of the
ecosystems of the earth (Dregne and Chow 1992). First and
foremost, the impact of land use and land cover changes is the
Jagdish Chand- Change Detection in Land Use and Land Cover Using Remote
Sensing Data and GIS in Renuka Forest Division
EUROPEAN ACADEMIC RESEARCH - Vol. II, Issue 1 / April 2014
435
reduction of vegetation cover. The loss of a vegetation cover, in
turn, leads to many other deleterious effects on the
environment, namely, loss of biodiversity, climate change,
pollution of other natural ecosystems with a reduction in their
quality, changes in hydrological regimes, and the list continues
(Niyogi et al. 2009). The secondary impact of land use and land
cover changes initiates a cascade of effects on the environment
and this works in a loop to further influence land use and land
cover changes.
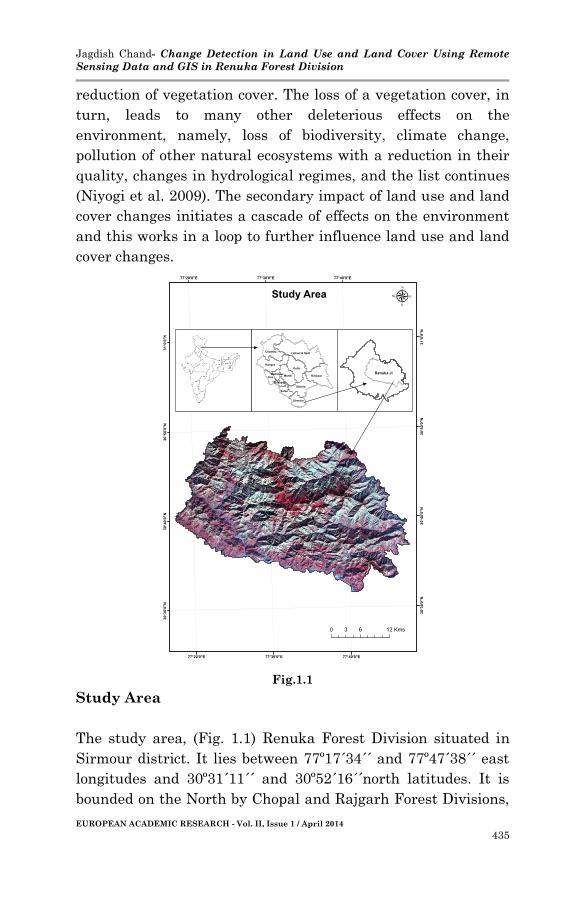
Fig.1.1
Study Area
The study area, (Fig. 1.1) Renuka Forest Division situated in
Sirmour district. It lies between 77º17´34´´ and 77º47´38´´ east
longitudes and 30º31´11´´ and 30º52´16´´north latitudes. It is
bounded on the North by Chopal and Rajgarh Forest Divisions,
Jagdish Chand- Change Detection in Land Use and Land Cover Using Remote
Sensing Data and GIS in Renuka Forest Division
EUROPEAN ACADEMIC RESEARCH - Vol. II, Issue 1 / April 2014
436
on the East by Chakrata Forest Division of Uttarakhand, on
the South by Nahan Forest Division and on the West by Paonta
Sahib Forest Division. The geographical area of the division is
987 sq. km. and forest area of 273.65 sq. km. There are five
forest ranges in Renuka division namely Renuka, Sangrah,
Nohra, Shillai and Kafota. The entire tract is mountainous and
varies in elevation from 620 M msl to 3647 M msl. The slopes
are generally steep to precipitous with deep khalas and springs.
The entire region of Renuka Forest Division falls within the
catchments of Giri, Sainj and Tons rivers. The Jalal Khad and
Nait ka Khala are two important khalas, which drains into Giri
at Sieun and Khairi respectively.
Methodology
In the present study, for assessing the temporal changes in the
land use and land cover, the Lansat TM, landsat ETM+ and
Indian Remote Sensing Satellites (IRS) Resource Sat’s
imageries were used. Digital image processing software Erdas
imagine 9.3 and ArcGIS 9.3 were used for the processing,
analysis and integration of spatial data to reach the objectives
of the study. The final maps which represent the land use and
land cover change during 1972, 1989, 2001 and 2010 (both area
and percentage) were also generated.
Land use and land cover changes
For the land-use classification, Landsat TM, Landsat ETM+
and Resource Sat images were used. Supervised classification
was used to prepare land use map because it has higher
accuracy over unsupervised classification. The result shows
that forest is major land use, which is followed by agricultural
land, open land/grass land/shrub and other water. The land use
status of different dated images is given below.
Jagdish Chand- Change Detection in Land Use and Land Cover Using Remote
Sensing Data and GIS in Renuka Forest Division
EUROPEAN ACADEMIC RESEARCH - Vol. II, Issue 1 / April 2014
437
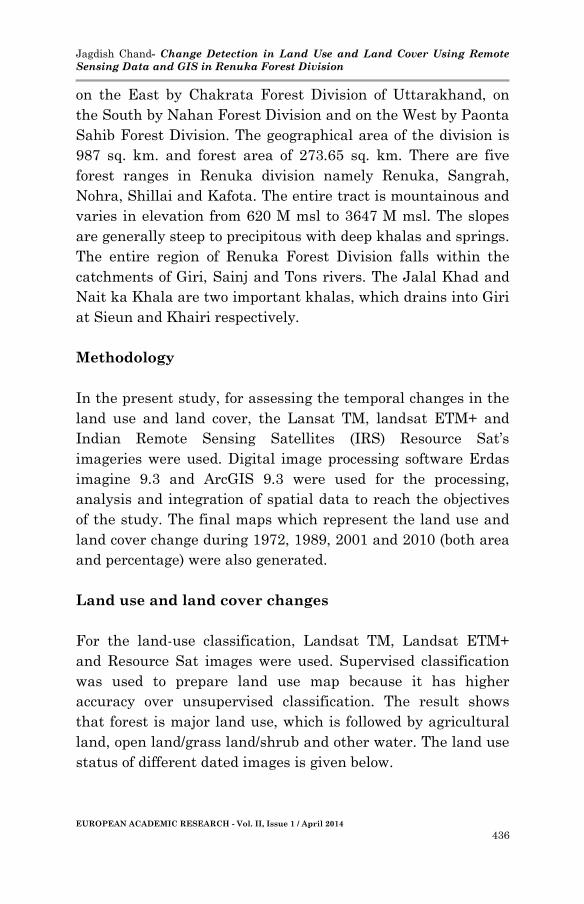
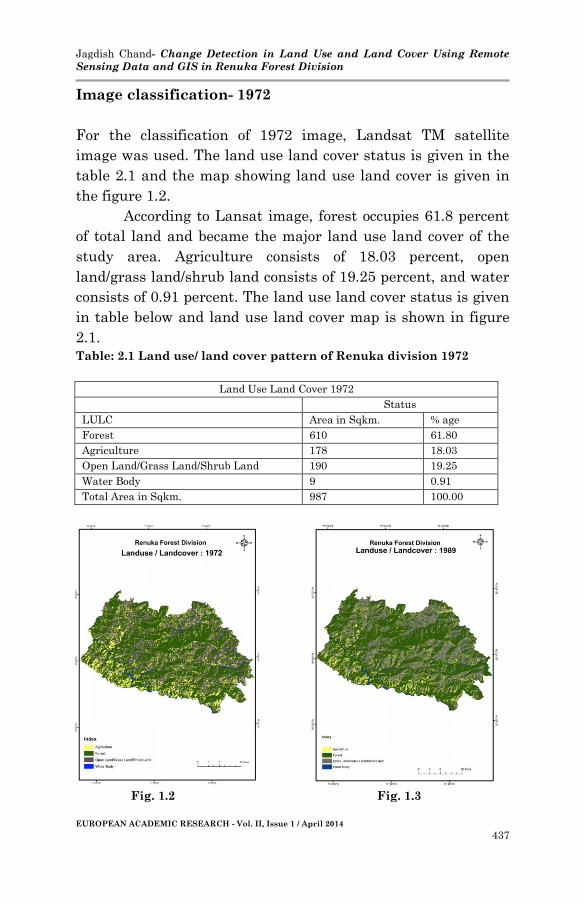
Image classification- 1972
For the classification of 1972 image, Landsat TM satellite
image was used. The land use land cover status is given in the
table 2.1 and the map showing land use land cover is given in
the figure 1.2.
According to Lansat image, forest occupies 61.8 percent
of total land and became the major land use land cover of the
study area. Agriculture consists of 18.03 percent, open
land/grass land/shrub land consists of 19.25 percent, and water
consists of 0.91 percent. The land use land cover status is given
in table below and land use land cover map is shown in figure
2.1.
Table: 2.1 Land use/ land cover pattern of Renuka division 1972
Land Use Land Cover 1972
Status
LULC Area in Sqkm. % age
Forest 610 61.80
Agriculture 178 18.03
Open Land/Grass Land/Shrub Land 190 19.25
Water Body 9 0.91
Total Area in Sqkm. 987 100.00
Fig. 1.2 Fig. 1.3
Jagdish Chand- Change Detection in Land Use and Land Cover Using Remote
Sensing Data and GIS in Renuka Forest Division
EUROPEAN ACADEMIC RESEARCH - Vol. II, Issue 1 / April 2014
438
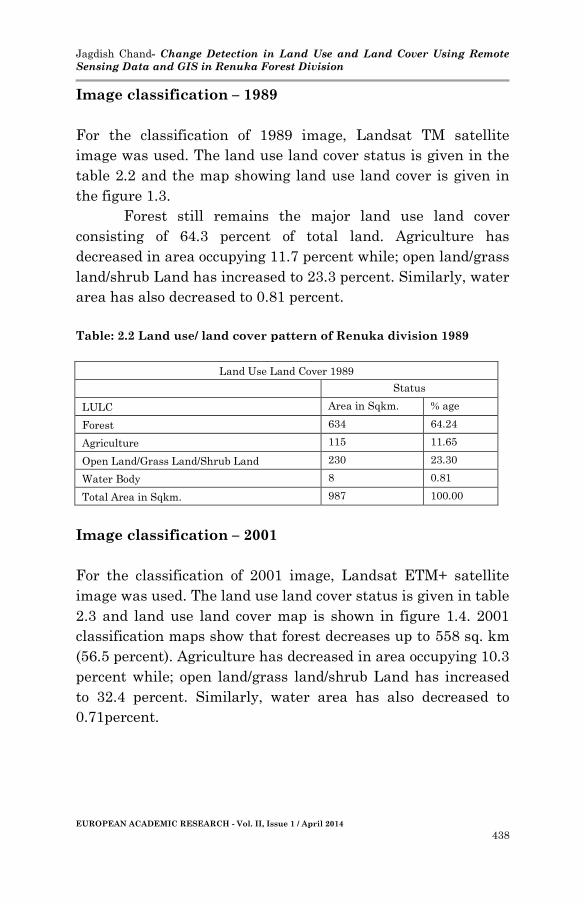
Image classification – 1989
For the classification of 1989 image, Landsat TM satellite
image was used. The land use land cover status is given in the
table 2.2 and the map showing land use land cover is given in
the figure 1.3.
Forest still remains the major land use land cover
consisting of 64.3 percent of total land. Agriculture has
decreased in area occupying 11.7 percent while; open land/grass
land/shrub Land has increased to 23.3 percent. Similarly, water
area has also decreased to 0.81 percent.
Table: 2.2 Land use/ land cover pattern of Renuka division 1989
Land Use Land Cover 1989
Status
LULC Area in Sqkm. % age
Forest 634 64.24
Agriculture 115 11.65
Open Land/Grass Land/Shrub Land 230 23.30
Water Body 8 0.81
Total Area in Sqkm. 987 100.00
Image classification – 2001
For the classification of 2001 image, Landsat ETM+ satellite
image was used. The land use land cover status is given in table
2.3 and land use land cover map is shown in figure 1.4. 2001
classification maps show that forest decreases up to 558 sq. km
(56.5 percent). Agriculture has decreased in area occupying 10.3
percent while; open land/grass land/shrub Land has increased
to 32.4 percent. Similarly, water area has also decreased to
0.71percent.

Jagdish Chand- Change Detection in Land Use and Land Cover Using Remote
Sensing Data and GIS in Renuka Forest Division
EUROPEAN ACADEMIC RESEARCH - Vol. II, Issue 1 / April 2014
439
Fig. 1.4 Fig. 1.5
Table: 2.3 Land use/ land cover pattern of Renuka division 2001
Land Use Land Cover 2001
Status
LULC Area in Sqkm. % age
Forest 558 56.53
Agriculture 102 10.33
Open Land/Grass Land/Shrub Land 320 32.42
Water Body 7 0.71
Total Area in Sqkm. 987 100.00
Image classification – 2010
For the classification of 2010 image, Resource Sat-II satellite
image was used. The land use land cover status is given in table
2.4 and land use land cover map is shown in figure 1.5.
According to Resource Sat image, forest decreases from
56.5 percent to 55.6 percent of the study area. Agriculture
increases of 19.3 percent, while open land/grass land/shrub land
decreases of 19.25 percent, and water also decreases of 0.61
percent.
Jagdish Chand- Change Detection in Land Use and Land Cover Using Remote
Sensing Data and GIS in Renuka Forest Division
EUROPEAN ACADEMIC RESEARCH - Vol. II, Issue 1 / April 2014
440
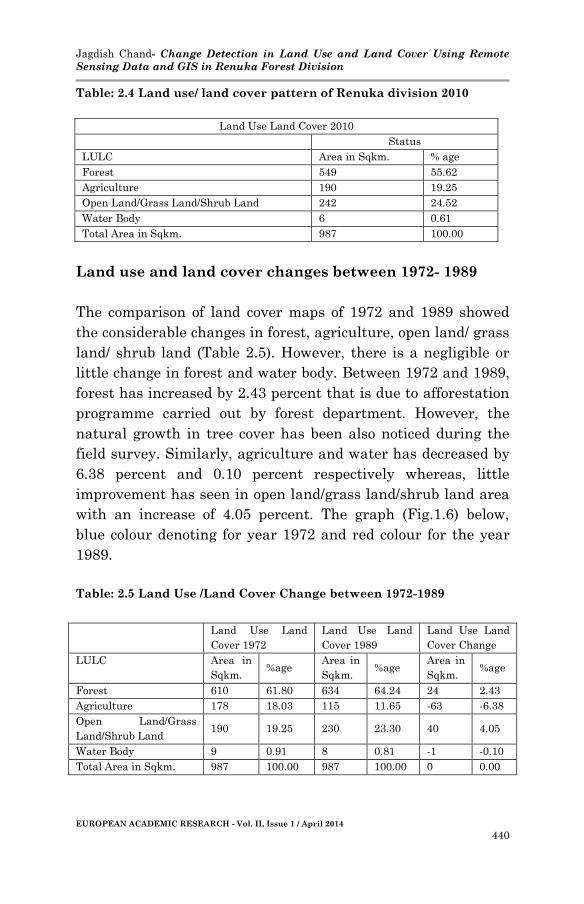
Table: 2.4 Land use/ land cover pattern of Renuka division 2010
Land Use Land Cover 2010
Status
LULC Area in Sqkm. % age
Forest 549 55.62
Agriculture 190 19.25
Open Land/Grass Land/Shrub Land 242 24.52
Water Body 6 0.61
Total Area in Sqkm. 987 100.00
Land use and land cover changes between 1972- 1989
The comparison of land cover maps of 1972 and 1989 showed
the considerable changes in forest, agriculture, open land/ grass
land/ shrub land (Table 2.5). However, there is a negligible or
little change in forest and water body. Between 1972 and 1989,
forest has increased by 2.43 percent that is due to afforestation
programme carried out by forest department. However, the
natural growth in tree cover has been also noticed during the
field survey. Similarly, agriculture and water has decreased by
6.38 percent and 0.10 percent respectively whereas, little
improvement has seen in open land/grass land/shrub land area
with an increase of 4.05 percent. The graph (Fig.1.6) below,
blue colour denoting for year 1972 and red colour for the year
1989.
Table: 2.5 Land Use /Land Cover Change between 1972-1989
Land Use Land
Cover 1972
Land Use Land
Cover 1989
Land Use Land
Cover Change
LULC Area in
Sqkm. %age
Area in
Sqkm. %age
Area in
Sqkm. %age
Forest 610 61.80 634 64.24 24 2.43
Agriculture 178 18.03 115 11.65 -63 -6.38
Open Land/Grass
Land/Shrub Land 190 19.25 230 23.30 40 4.05
Water Body 9 0.91 8 0.81 -1 -0.10
Total Area in Sqkm. 987 100.00 987 100.00 0 0.00
Jagdish Chand- Change Detection in Land Use and Land Cover Using Remote
Sensing Data and GIS in Renuka Forest Division
EUROPEAN ACADEMIC RESEARCH - Vol. II, Issue 1 / April 2014
441
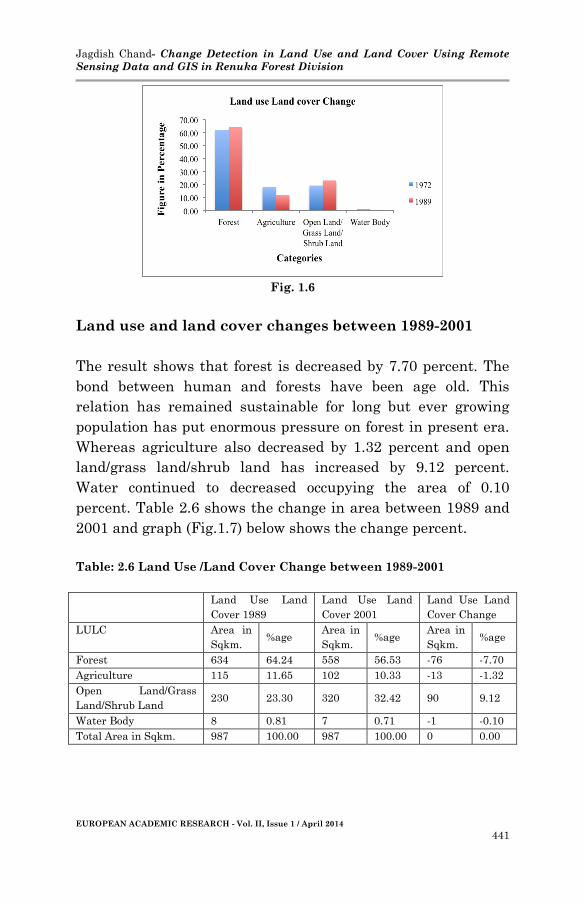
Fig. 1.6
Land use and land cover changes between 1989-2001
The result shows that forest is decreased by 7.70 percent. The
bond between human and forests have been age old. This
relation has remained sustainable for long but ever growing
population has put enormous pressure on forest in present era.
Whereas agriculture also decreased by 1.32 percent and open
land/grass land/shrub land has increased by 9.12 percent.
Water continued to decreased occupying the area of 0.10
percent. Table 2.6 shows the change in area between 1989 and
2001 and graph (Fig.1.7) below shows the change percent.
Table: 2.6 Land Use /Land Cover Change between 1989-2001
Land Use Land
Cover 1989
Land Use Land
Cover 2001
Land Use Land
Cover Change
LULC Area in
Sqkm. %age
Area in
Sqkm. %age
Area in
Sqkm. %age
Forest 634 64.24 558 56.53 -76 -7.70
Agriculture 115 11.65 102 10.33 -13 -1.32
Open Land/Grass
Land/Shrub Land 230 23.30 320 32.42 90 9.12
Water Body 8 0.81 7 0.71 -1 -0.10
Total Area in Sqkm. 987 100.00 987 100.00 0 0.00
Jagdish Chand- Change Detection in Land Use and Land Cover Using Remote
Sensing Data and GIS in Renuka Forest Division
EUROPEAN ACADEMIC RESEARCH - Vol. II, Issue 1 / April 2014
442
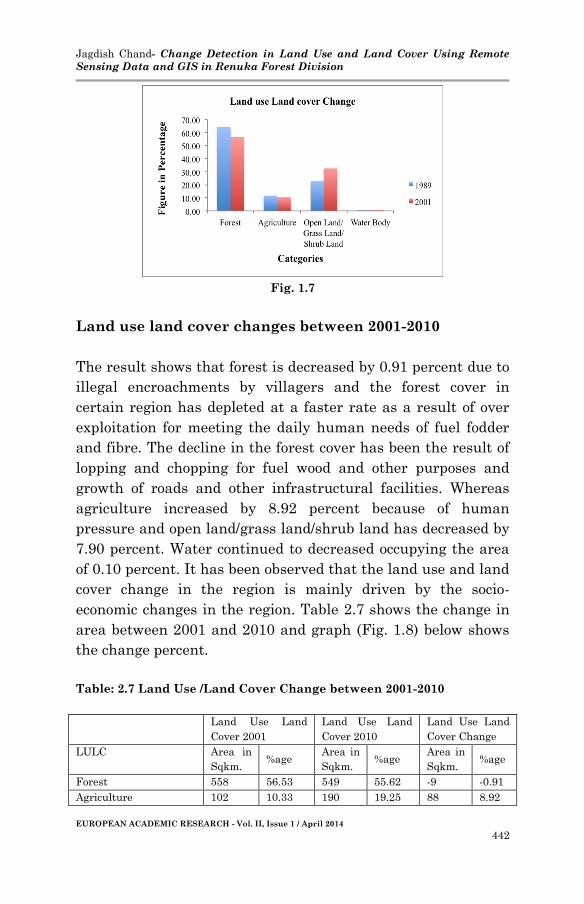
Fig. 1.7
Land use land cover changes between 2001-2010
The result shows that forest is decreased by 0.91 percent due to
illegal encroachments by villagers and the forest cover in
certain region has depleted at a faster rate as a result of over
exploitation for meeting the daily human needs of fuel fodder
and fibre. The decline in the forest cover has been the result of
lopping and chopping for fuel wood and other purposes and
growth of roads and other infrastructural facilities. Whereas
agriculture increased by 8.92 percent because of human
pressure and open land/grass land/shrub land has decreased by
7.90 percent. Water continued to decreased occupying the area
of 0.10 percent. It has been observed that the land use and land
cover change in the region is mainly driven by the socio-
economic changes in the region. Table 2.7 shows the change in
area between 2001 and 2010 and graph (Fig. 1.8) below shows
the change percent.
Table: 2.7 Land Use /Land Cover Change between 2001-2010
Land Use Land
Cover 2001
Land Use Land
Cover 2010
Land Use Land
Cover Change
LULC Area in
Sqkm. %age
Area in
Sqkm. %age
Area in
Sqkm. %age
Forest 558 56.53 549 55.62 -9 -0.91
Agriculture 102 10.33 190 19.25 88 8.92

Jagdish Chand- Change Detection in Land Use and Land Cover Using Remote
Sensing Data and GIS in Renuka Forest Division
EUROPEAN ACADEMIC RESEARCH - Vol. II, Issue 1 / April 2014
443
Open Land/Grass
Land/Shrub Land 320 32.42 242 24.52 -78 -7.90
Water Body 7 0.71 6 0.61 -1 -0.10
Total Area in Sqkm. 987 100.00 987 100.00 0 0.00
Fig. 1.8
Conclusion
Spatial land use and land cover change is a reflection of the
impact of biotic drivers as well as abiotic drivers on the
prevalent land use and land cover of the region. The force of the
drivers as well as the changes in driver composition leads to
changes in the prevalent land use and land cover of a region.
GIS- based analysis of the RS derived temporal data of the land
use and land cover of a region can identify the potentially
vulnerable areas to change as a result of the different driving
forces. A Geographic understanding of land use change
processes can be achieved by analyzing a temporal database for
spatial patterns, rates of change and trends. The analysis
requires understanding a region’s land use history involving
population data, timelines of historical events and related
information. Spatio- temporal analysis of past historical events
aid in understanding and subsequently modeling the issues
that influence the development in a region in association with
topography and adequate supply of water and other natural

Jagdish Chand- Change Detection in Land Use and Land Cover Using Remote
Sensing Data and GIS in Renuka Forest Division
EUROPEAN ACADEMIC RESEARCH - Vol. II, Issue 1 / April 2014
444
resources. Furthermore, the various drivers of land use and
land cover change until now date have been mostly qualitative.
There is a need to quantify the drivers of land use and land
cover change for estimating and quantifying their
consequences. Numerical modeling of land use and land cover
change gives us a tool to understand and quantify the processes
involved in this alteration and will enable us to take the
necessary steps to arrest the various land use and land cover
changes taking place.
BIBLIOGRAPHY:
Agarwal, C., Green, G. M., Grove, J. M., Evans, T. P., and
Schweik, C. M. 2002. “A Review and Assessment of
Land- Use Change Models: Dynamics of Space, Time,
and Human Choice.” General Technical Report NE-297.
Newtown Square, Pennsylvania: U.S. Department of
Agriculture, Forest Service, Northeastern Research
Station. 61 pp.
Benedick, R.E. 1999. “Tomorrow’s environment is global.”
Futures 31(9-10): 937–947.
CCSP. 2003. “Strategic Plan for the U.S. Climate Change
Science Program.” Final report.
Dietz, T., Rosa, E.A. and York, R. 2007. “Driving the human
ecological footprint. Frontiers in Ecology and
Environment.” Front Ecol Environ 5(1): 13–18.
Dregne, H.E. and Chou, N.T. 1992. “Global desertification
dimensions and costs.” In Degradation and restoration of
arid lands. Lubbock: Texas Tech. University.
Earth Trend. 2003. “http://earthtrends.wri.org”
Ellis, E. 2007. “Land use and land cover change.” Encyclopedia
of Earth.
Jones, R. 2005. “A Review of Land Use/Land Cover and
Agricultural Change Models.” Stratus Consulting Inc.
Jagdish Chand- Change Detection in Land Use and Land Cover Using Remote
Sensing Data and GIS in Renuka Forest Division
EUROPEAN ACADEMIC RESEARCH - Vol. II, Issue 1 / April 2014
445
for the California Energy Commission, PIER Energy-
Related Environmental Research. CEC-500-2005-056.
Lambin, E.F., Turner II, B.L., Geist, H., Agbola, S., Angelsen,
A., Bruce, J.W., Coomes, O., Dirzo, R., Fischer, G., Folke,
C., George, P.S., Homewood, K., Imbernon, J., Leemans,
R., Li, X., Moran, E.F., Mortimore, M., Ramakrishnan,
P.S., Richards, J.F., Skanes, H., Steffen, W., Stone, G.D.,
Svedin, U., Veldkamp, T., Vogel, C. and Xu, J., 2001.
“Our emerging understanding of the causes of land-use
and land-cover change.” Global Environment Change 11:
261–269.
Lambin, E.F., Geist, H., Lepers, E. 2003. “Dynamics of land use
and cover change in tropical regions.” Annual Review of
Environment and Resources 28: 205–241.
Lillesand, T.M. and Kiefer, R. 1993. Remote Sensing and Image
Interpretation. Fifth Edition. New York: John Willey.
Liu, M., Hu, Y., Chang, Y., He, X., and Zhang, W. 2009. “Land
Use and Land Cover Change Analysis and Prediction in
the Upper Reaches of the Minjiang River, China.”
Environmental Management 43(5): 899–907.
Navalgund, R.R. 2001. “Remote Sensing.” Resonance 6(12): 51–
60.
NAP. 2008. “Earth Observation from Space.” www.nap.edu.
Niyogi, D., Mahmood, R., and Adegoke, J.O. 2009. “Land-
Use/Land-Cover Change and Its Impacts on Weather
and Climate.” Boundary Layer Meterology 133(3): 297-
298.
Pontius, R.G., Cornell, J., and Hall, C.H. 2001. “Modeling the
spatial pattern of land-use change with GEOMOD2:
application and validation for Costa Rica.” Agriculture,
Ecosystems & Environment 85(1–3): 191–203.
Ramakrishna, P.S. 1998. “Sustainable Development, Climate
Change and Tropical Rain Forest Landscape.” Climatic
Change 39(2–3): 583–600.
Ramankutty, N. and Foley, J.A. 1999. “Estimating historical
Jagdish Chand- Change Detection in Land Use and Land Cover Using Remote
Sensing Data and GIS in Renuka Forest Division
EUROPEAN ACADEMIC RESEARCH - Vol. II, Issue 1 / April 2014
446
changes in global land cover: croplands from 1700 to
1992.” Global Biogeochemical Cycles. 13(4): 997–1028.
Rao, S.S. 2008. “Social development in Indian rural
communities: Adoption of telecentres.” International
Journal of Information Management 28(6): 474–482.
Reddy, C.S., Roy, P.S. and Arijit. 2007. “Assessment of three
decades of vegetation dynamics in mangroves of
Godavari delta, India using multitemporal satellite data
and GIS.” Research Journal of Environmental Science
2(2): 108–115.
Robbins, J. 2001. The food revolution: how your diet can save
your life and our world. Berkley, California: Barnes and
Noble, 450.
Roy, P.S. and Murthy, M.S.R. 2009. “Efficient Land Use
Planning and Policies Using Geospatial Inputs: An
Indian Experience.” In Land Use Policy, edited by A.C.
Denman, O.M. Penrod. Nova Science Publishers, Inc.
Roy, P.S., Srivastava, V.K., Roy A., Mehtab, A., Sampath, K.,
Suresh, J.R., Sharma, A., and Dwivedi, R.S. 2010.
“Agent Based Land use and land cover change
modeling.” Unpublished.
Roy, P.S. and Tomar, S. 2001. “Landscape cover dynamics
pattern in Meghalaya.” International Journal of Remote
of Remote Sensing 22(18): 3813–3825.
Singh, S., Porwal, M.C., Jeganathan, C., Talukdar, G. and Roy,
P.S. 2001. “Vegetation Cover Mapping using Hybrid
Approach in Digital Classification.” Asian Journal of
Geoinformatics 2(2): 37–45.
TERI. 1996. “The economic impact of one meter sea level rises
on Indian coastline-Methods and case studies.” Report
submitted to the Ford Foundation.
TOI. 2007. “11 Indian Cities among worlds fastest growing.”
Times of India. http://timesofindia.indiatimes.
com/articleshow/2481744.cms.
Vitousek, P.M., Mooney, H.A., Lubchenco, J. and Melillo, J.M.
Jagdish Chand- Change Detection in Land Use and Land Cover Using Remote
Sensing Data and GIS in Renuka Forest Division
EUROPEAN ACADEMIC RESEARCH - Vol. II, Issue 1 / April 2014
447
1997. “Human domination of Earth’s ecosystems.”
Science 277: 494–499.
Wackernagel, M. and Rees, W.E. 1996. Our Ecological
Footprint: Reducing Human Impact on the Earth. New
Society Publishers, 160 p.
Wackernagel, M., Schulz, N.B., Deumling, D., Linares, A.C.,
Jenkins, M., Kapos, V., Monfreda, C., Loh J., Myers, N.,
Norgaard, R., and Randers, J. 2002. “Tracking the
ecological overshoot of the human economy.” Proceedings
of National Academy of Sciences USA 99(14): 9266–9271.
Top Related
Copyright © 2022 FDOKUMEN

