


Bahasa
Halaman
Hukum

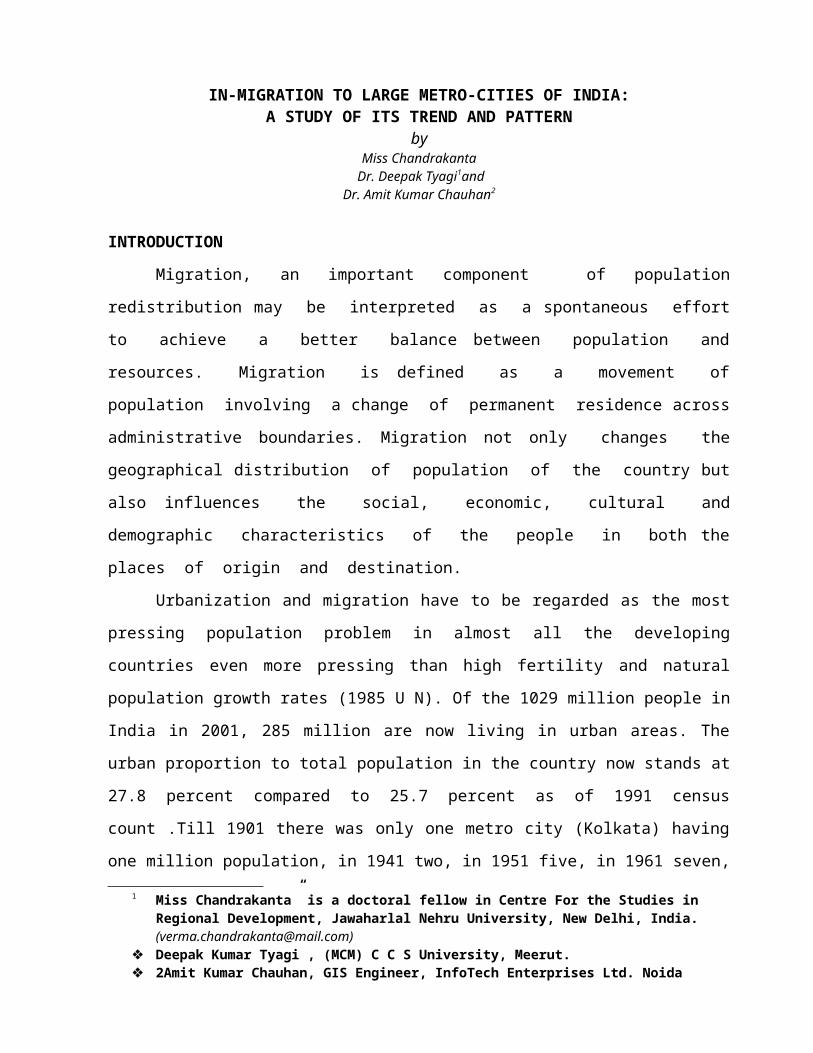
IN-MIGRATION TO LARGE METRO-CITIES OF INDIA: A STUDY OF ITS TREND AND PATTERN
byMiss Chandrakanta
Dr. Deepak Tyagi1and Dr. Amit Kumar Chauhan2
INTRODUCTION
Migration, an important component of population
redistribution may be interpreted as a spontaneous effort
to achieve a better balance between population and
resources. Migration is defined as a movement of
population involving a change of permanent residence across
administrative boundaries. Migration not only changes the
geographical distribution of population of the country but
also influences the social, economic, cultural and
demographic characteristics of the people in both the
places of origin and destination.
Urbanization and migration have to be regarded as the most
pressing population problem in almost all the developing
countries even more pressing than high fertility and natural
population growth rates (1985 U N). Of the 1029 million people in
India in 2001, 285 million are now living in urban areas. The
urban proportion to total population in the country now stands at
27.8 percent compared to 25.7 percent as of 1991 census
count .Till 1901 there was only one metro city (Kolkata) having
one million population, in 1941 two, in 1951 five, in 1961 seven,
1 Miss Chandrakanta” is a doctoral fellow in Centre For the Studies in Regional Development, Jawaharlal Nehru University, New Delhi, India. ([email protected])
Deepak Kumar Tyagi , (MCM) C C S University, Meerut. 2Amit Kumar Chauhan, GIS Engineer, InfoTech Enterprises Ltd. Noida
in 1971 nine, in 1981 twelve, in 1991 twenty three, and in 2001
there were 35 cities having more than one million population.
OBJECTIVES
(a) To assess the growth and patterns of in-migration in
large metro cities of India.
HYPOTHESES
Based on the review of some existing literature and research
studies on the migration phenomena of several places, the
following hypotheses have been drawn:
(a) In migration towards metropolitan cities is increasing
over time.
(b) States adjacent to metropolises will have higher out-
migrants towards the large nearby cities (distance decay
law).
STUDY AREA
The number of mega cities in 2001 with population of 5
million and above increased to six from four in 1991. These six
mega cities are Mumbai, Kolkata, Delhi, Chennai, Hyderabad and
Bangalore which collectively contain 60 million people and cover
55.6 percent of the population of metropolitan cities or 21
percent of the country’s urban population. The present research
paper is the study of these above mentioned mega cities of India.
DATA ANALYSIS AND DISCUSION
It has been found that percentage of in-migrants in each
city is fluctuating. In case of Mumbai, in-migrants contribute

more than 1/5th of the total population and bulk comes from Uttar
Pradesh, Gujarat, Karnataka, Rajasthan and Tamil Nadu. In Mumbai
percentage change for total population is -66 and for in-migrants
it is -64. In both the cases it is declining. Sex ratio for in-
migrants is very low in both the cases (777 for total population
and 553 for in-migrants in Mumbai).
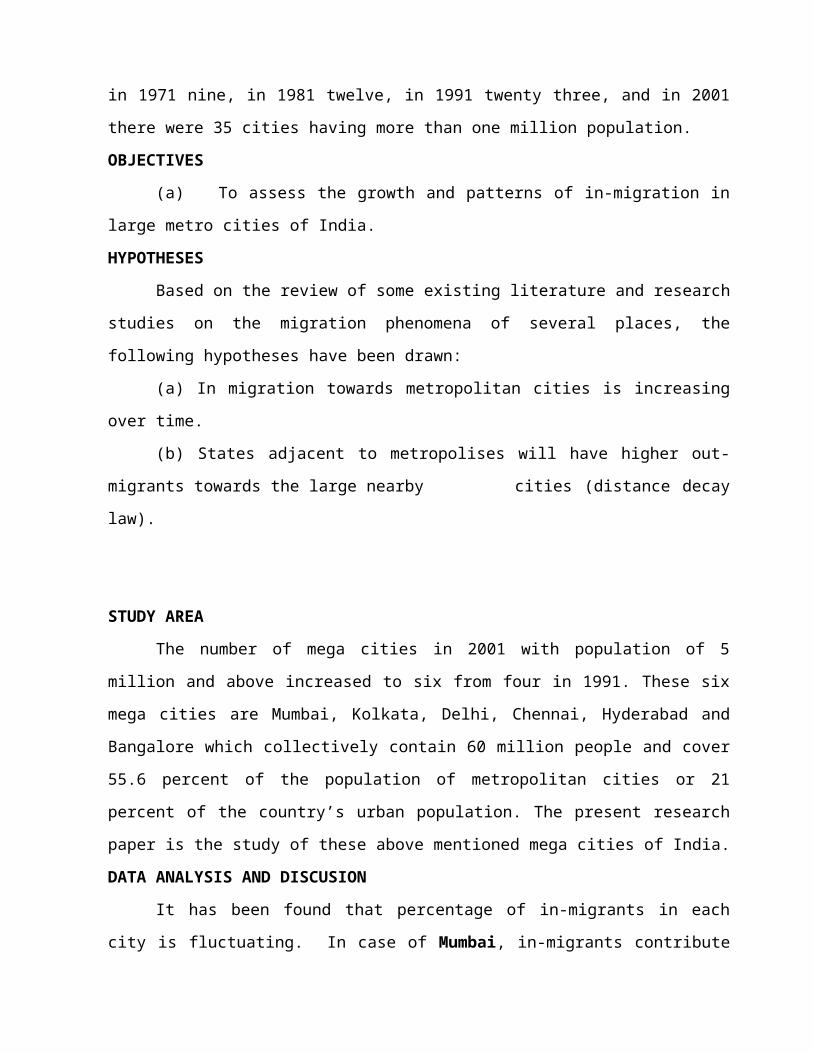
TABLE 1: TRENDS OF IN-MIGRATION BY SEX, MUMBAI, 1961-2001Year Total Males Females Sex ratio % change % of in-migrants in total
population1961 1415508 937839 477669 509 - 34.11971 1057315 719460 337855 470 -25.3 17.71981 4636310 2850610 1785700 626 338.5 56.21991 2095697 1228610 867087 706 -54.7 21.12001 762326 490830 271496 553 -63.7 22.8SOURCE: CENSUS OF INDIA, MIGRATION TABLE D 1, (MIGRANTS CLASSIFIED BY P O B AND SEX) - 1961, 1971, 1981, 1991, 2001.
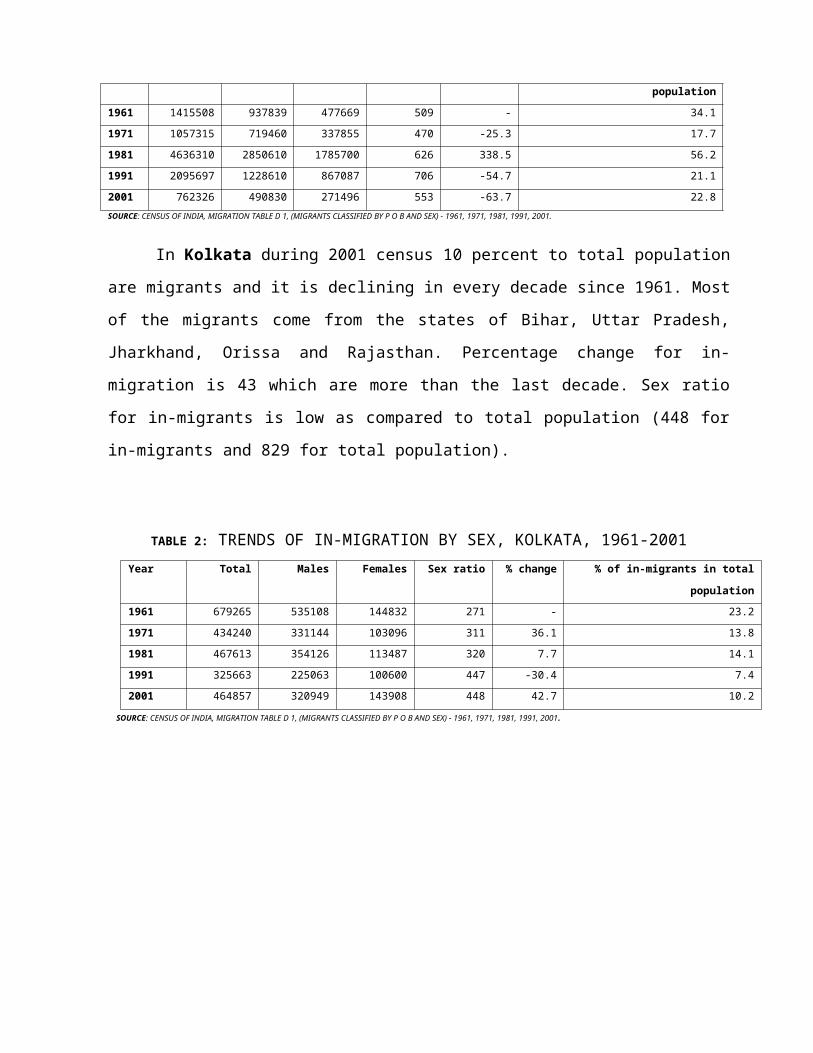
In Kolkata during 2001 census 10 percent to total population
are migrants and it is declining in every decade since 1961. Most
of the migrants come from the states of Bihar, Uttar Pradesh,
Jharkhand, Orissa and Rajasthan. Percentage change for in-
migration is 43 which are more than the last decade. Sex ratio
for in-migrants is low as compared to total population (448 for
in-migrants and 829 for total population).
TABLE 2: TRENDS OF IN-MIGRATION BY SEX, KOLKATA, 1961-2001Year Total Males Females Sex ratio % change % of in-migrants in total
population1961 679265 535108 144832 271 - 23.21971 434240 331144 103096 311 36.1 13.81981 467613 354126 113487 320 7.7 14.11991 325663 225063 100600 447 -30.4 7.42001 464857 320949 143908 448 42.7 10.2
SOURCE: CENSUS OF INDIA, MIGRATION TABLE D 1, (MIGRANTS CLASSIFIED BY P O B AND SEX) - 1961, 1971, 1981, 1991, 2001.
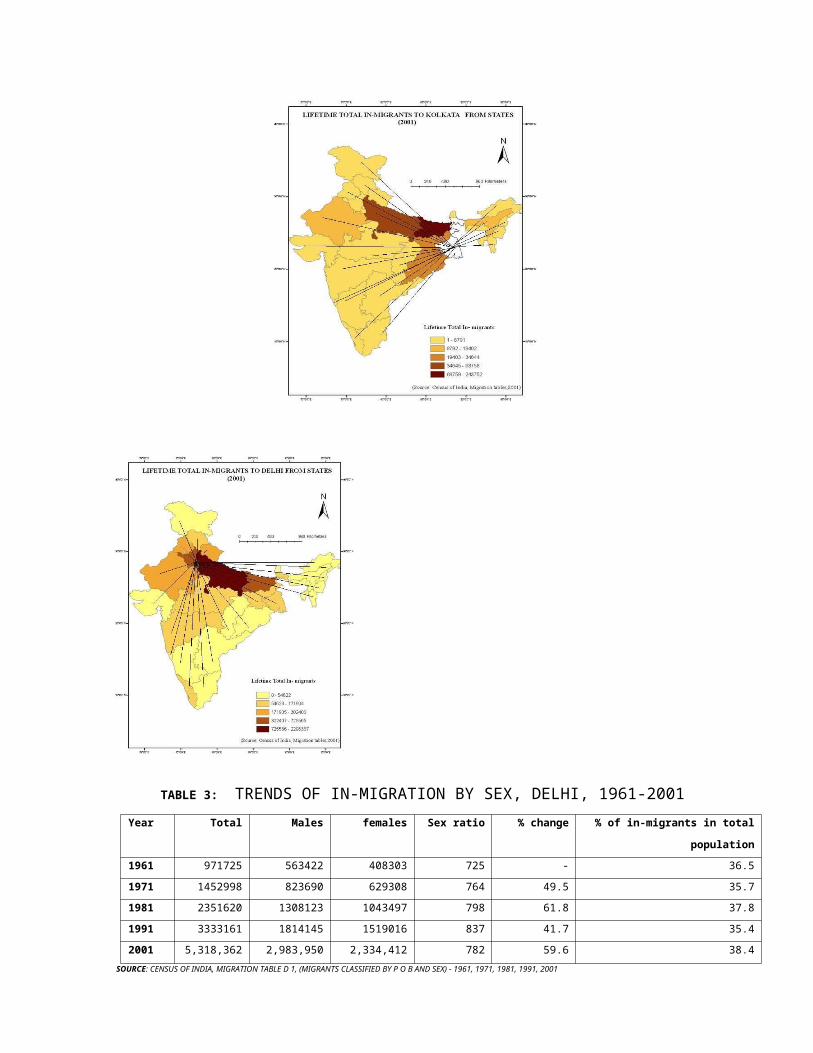
TABLE 3: TRENDS OF IN-MIGRATION BY SEX, DELHI, 1961-2001Year Total Males females Sex ratio % change % of in-migrants in total
population1961 971725 563422 408303 725 - 36.51971 1452998 823690 629308 764 49.5 35.71981 2351620 1308123 1043497 798 61.8 37.81991 3333161 1814145 1519016 837 41.7 35.42001 5,318,362 2,983,950 2,334,412 782 59.6 38.4
SOURCE: CENSUS OF INDIA, MIGRATION TABLE D 1, (MIGRANTS CLASSIFIED BY P O B AND SEX) - 1961, 1971, 1981, 1991, 2001
In case of Delhi percentage of in-migrants is increasing
since 1961 and at present it is 38 percent. The decadal growth
rate of Delhi is 47, which is quite alarming. The growth rate of
in-migrants is 60, which shows that Delhi is attracting more and
more people. Sex ratio is slightly less than the total
population. Like the other cities Delhi union territory receives
migrants from the neighboring states of Uttar Pradesh, Bihar,
Haryana, Rajasthan and Punjab.
TABLE 4: TRENDS OF IN-MIGRATION BY SEX, CHENNAI, 1961-2001Year Total Males Females Sex ratio % change % of in-migrants in total
population1961 171265 98229 73036 744 - 9.91971 199865 111810 88055 788 16.7 8.11981 504513 255805 248708 972 152.4 15.41991 237706 119866 117840 983 -52.9 6.22001 241305 125571 115734 922 -0.2 5.6
SOURCE: CENSUS OF INDIA, MIGRATION TABLE D 1, (MIGRANTS CLASSIFIED BY P O B AND SEX) - 1961, 1971, 1981, 1991, 2001.
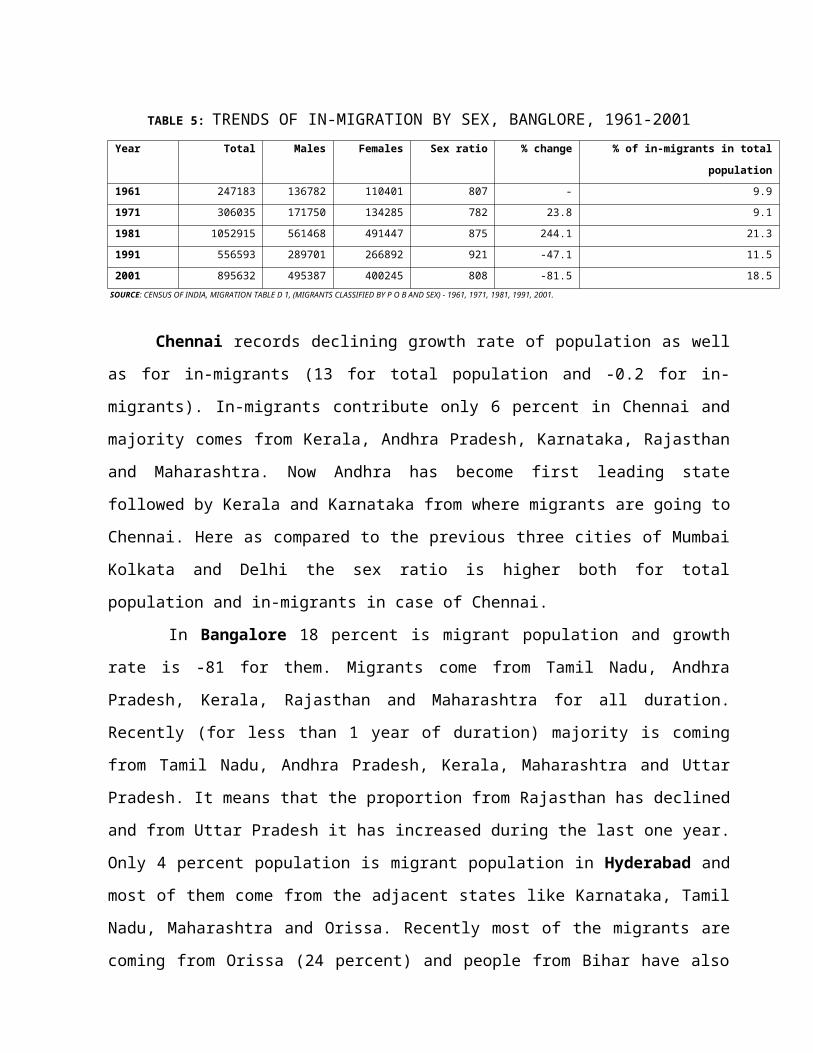
TABLE 5: TRENDS OF IN-MIGRATION BY SEX, BANGLORE, 1961-2001Year Total Males Females Sex ratio % change % of in-migrants in total
population1961 247183 136782 110401 807 - 9.91971 306035 171750 134285 782 23.8 9.11981 1052915 561468 491447 875 244.1 21.31991 556593 289701 266892 921 -47.1 11.52001 895632 495387 400245 808 -81.5 18.5
SOURCE: CENSUS OF INDIA, MIGRATION TABLE D 1, (MIGRANTS CLASSIFIED BY P O B AND SEX) - 1961, 1971, 1981, 1991, 2001.
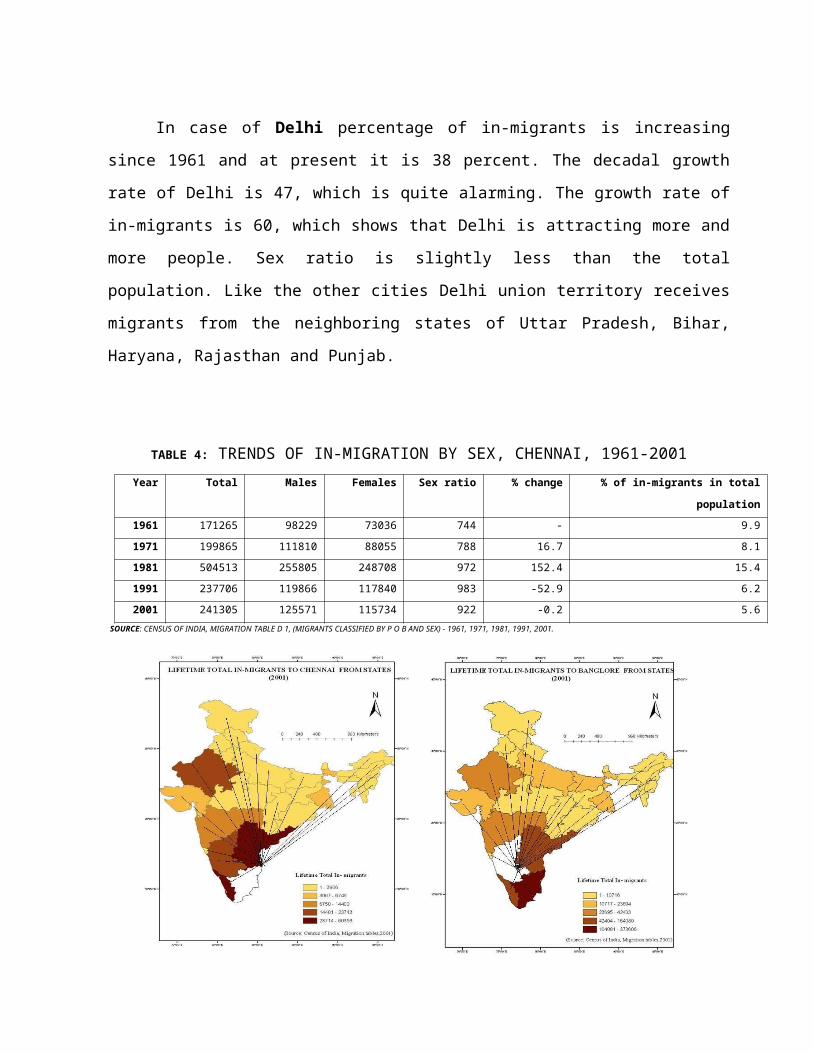
Chennai records declining growth rate of population as well
as for in-migrants (13 for total population and -0.2 for in-
migrants). In-migrants contribute only 6 percent in Chennai and
majority comes from Kerala, Andhra Pradesh, Karnataka, Rajasthan
and Maharashtra. Now Andhra has become first leading state
followed by Kerala and Karnataka from where migrants are going to
Chennai. Here as compared to the previous three cities of Mumbai
Kolkata and Delhi the sex ratio is higher both for total
population and in-migrants in case of Chennai.
In Bangalore 18 percent is migrant population and growth
rate is -81 for them. Migrants come from Tamil Nadu, Andhra
Pradesh, Kerala, Rajasthan and Maharashtra for all duration.
Recently (for less than 1 year of duration) majority is coming
from Tamil Nadu, Andhra Pradesh, Kerala, Maharashtra and Uttar
Pradesh. It means that the proportion from Rajasthan has declined
and from Uttar Pradesh it has increased during the last one year.
Only 4 percent population is migrant population in Hyderabad and
most of them come from the adjacent states like Karnataka, Tamil
Nadu, Maharashtra and Orissa. Recently most of the migrants are
coming from Orissa (24 percent) and people from Bihar have also
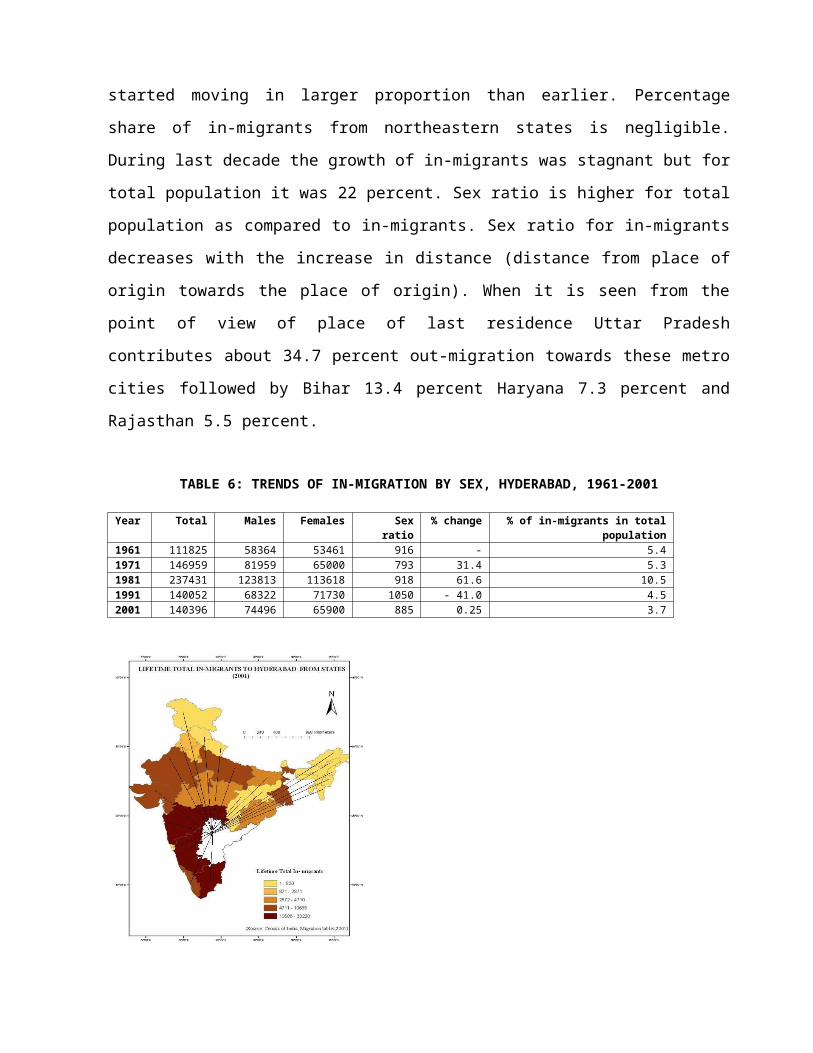
started moving in larger proportion than earlier. Percentage
share of in-migrants from northeastern states is negligible.
During last decade the growth of in-migrants was stagnant but for
total population it was 22 percent. Sex ratio is higher for total
population as compared to in-migrants. Sex ratio for in-migrants
decreases with the increase in distance (distance from place of
origin towards the place of origin). When it is seen from the
point of view of place of last residence Uttar Pradesh
contributes about 34.7 percent out-migration towards these metro
cities followed by Bihar 13.4 percent Haryana 7.3 percent and
Rajasthan 5.5 percent.
TABLE 6: TRENDS OF IN-MIGRATION BY SEX, HYDERABAD, 1961-2001
Year Total Males Females Sexratio
% change % of in-migrants in totalpopulation
1961 111825 58364 53461 916 - 5.41971 146959 81959 65000 793 31.4 5.31981 237431 123813 113618 918 61.6 10.51991 140052 68322 71730 1050 - 41.0 4.52001 140396 74496 65900 885 0.25 3.7
So it can be said that growth in the total number of in-migrants
is not increasing in all the cities. In case of Mumbai it is
decreasing, in case of Kolkata, Chennai, Bangalore and Hyderabad
it is fluctuating over the decades. This is only Delhi where the
total number of in-migrants is found increasing since 1961 to
2001. The growth rate of in-migrants during the last decade is
negative for all the cities except Delhi. The relationship
between the magnitude of in-migration and distance (distance of
the place of origin and place of destination) has been examined
here and it is found that it’s very true in all the cases except
migrants from few states. (Example can be drawn from Mumbai
district where about half of in-migrants are from Uttar Pradesh,
Bihar and West Bengal while it’s very low from some of the
neighboring states like Madhya Pradesh and Chhattisgarh). Over
all it is found that distance play a vital role in deciding the
place of destination. This is also simplified with the help of
map showing spatial distribution of lifetime migrants towards the
large metropolitan cities in India.
Present study leaves enough scope for further analysis of
the 2001 data on in-migration to large metro cities of India.
Here the basic approach has been a spatial & temporal one.
Sufficient data are presented in this regard, but an economic-
cum-statistical analysis of migration in relation to various
socio-economic factors should be taken up for formulation of a
proper population redistribution policy.
BibliographyBhagat R. B., (2005), ”Conceptual issues in measurement of internal migration
in India”, paper presented in 25th I U S S P international conference,France.
Census of India, 2001, “Migration tables”, registrar general and censuscommissioner, India.
Dutta, P., (2007), “Urbanisation in india”, Indian journal of regional science, vol39.
Koshambi, M., (1994), “Urbanization and urban development in India”, Indiancouncil of social science research, New Delhi.
Kundu A., (1992), “Urban development and urban research in India”, Niceprinted press Khurja, Delhi.
Madan M., (1989), ”Processes of urbanization and economic development inMaharashtra 1961-81”, M. Phil- dissertation, centre for regionaldevelopment, J N U, New Delhi.
Oberai, A.S., Prasad, P.H. and Sarana, M.G., (1989), “Determinants andconsequences of internal migration in India; Studies in Bihar, Kerala andUttar Pradesh”, Oxford university press, New Delhi.
Premi, M. K., (1983), “Internal migration in India; population policyperspective in developing countries (ed. Narayain, V. and Prahasan, C.P.),Himalaya publishing house, Bomobay.
Premi, M. K., (2006), ” Population of India in the new millennium: census2001, national book trust, India.
Visaria, P. and Gumber, A., (1991), “Internal migration in India”, Journal ofIndian school of political economy, Vol. 3, No. 2, pp. 238-269.
Copyright © 2022 FDOKUMEN

