


Bahasa
Halaman
Hukum

Research article
CD4 trajectory adjusting for dropout among HIV-positive patients
receiving combination antiretroviral therapy in an East African HIV
care centre
Agnes N Kiragga1, Judith J Lok2, Beverly S Musick3, Ronald J Bosch4, Ann Mwangi5, Kara K Wools-Kaloustian6 and
Constantin T Yiannoutsos§,7 for the East Africa IeDEA Regional Consortium§Corresponding author: Constantin T Yiannoutsos, 410 W. 10th Street, Suite 3000, Indianapolis, IN 46202, USA. Tel: +1317 278 3045. Fax: +1317 274 2678.
Abstract
Objective: Estimates of CD4 response to antiretroviral therapy (ART) obtained by averaging data from patients in care,
overestimate population CD4 response and treatment program effectiveness because they do not consider data from patients
who are deceased or not in care.We use mathematical methods to assess and adjust for this bias based on patient characteristics.
Design: We examined data from 25,261 HIV-positive patients from the East Africa IeDEA Consortium.
Methods: We used inverse probability of censoring weighting (IPCW) to represent patients not in care by patients in care with
similar characteristics. We address two questions: What would the median CD4 be ‘‘had everyone starting ART remained on
observation?’’ and ‘‘were everyone starting ART maintained on treatment?’’
Results: Routine CD4 count estimates were higher than adjusted estimates even under the best-case scenario of maintaining all
patients on treatment. Two years after starting ART, differences between estimates diverged from 30 cells/mL, assuming similar
mortality and treatment access among dropouts as patients in care, to over 100 cells/mL assuming 20% lower survival and 50%
lower treatment access among dropouts. When considering only patients in care, the proportion of patients with CD4 above
350 cells/mL was 50% adjusted to below 30% when accounting for patients not in care. One-year mortality diverged 6�14% from
the naı̈ve estimates depending on assumptions about access to care among lost patients.
Conclusions: Ignoring mortality and loss to care results in over-estimation of ART response for patients starting treatment and
exaggerates the efficacy of treatment programs administering it.
Keywords: HIV/AIDS; IPCW; Resource-limited setting; CD4 count; Mathematical modeling; sub-Saharan Africa.
To access the supplementary material to this article please see Supplementary Files under Article Tools online.
Received 11 November 2013; Revised 9 May 2014; Accepted 11 June 2014; Published 14 August 2014
Copyright: – 2014 Kiragga AN et al; licensee International AIDS Society. This is an Open Access article distributed under the terms of the Creative Commons
Attribution 3.0 Unported (CC BY 3.0) License (http://creativecommons.org/licenses/by/3.0/), which permits unrestricted use, distribution, and reproduction in any
medium, provided the original work is properly cited.
IntroductionCD4�T-cell (CD4) count is a marker for disease progression
in HIV-positive patients [1,2]. For patients on combination
antiretroviral therapy (ART) in resource-limited settings, who
do not have access to routine viral load testing, changes in CD4
counts constitute an important component in patient mon-
itoring and evaluation of treatment response [3]. With rapid
increases in the availability of treatment, including second-line
therapies, plus new guidelines advocating the initiation of ART
at higher CD4 counts [4], it is important to derive accurate
estimates of the immunological impact of ART among HIV-
positive patients at the program level. Decisions about the
effectiveness of therapy or the success of a program, as well as
policies about the optimal use of ART, are directly influenced
by assessments of the immunologic response of the treated
population.
Previous studies have reported robust immunological
response among patients initiating ART in low- and middle-
income settings [5�7]. However, these studies invariably basetheir findings on averaged CD4 counts among patients who
are alive and still in care. Given that a low CD4 count is a
predictor of both adverse clinical outcome [5,8,9] and loss
from follow-up [9�11], patients with lower CD4 counts will bedisproportionately more likely to discontinue from care or die.
Patients discontinue care for a number of reasons, including
illness and lack of adherence, which are strongly associated
with lower CD4 counts and discontinuation from care [12].
Thus, any estimate which excludes these individuals is
expected to overestimate, perhaps substantially, the response
to therapy, leading to erroneous conclusions about treatment
efficacy and program effectiveness [12]. In addition, exclusion
of deaths from the estimation fails to incorporate patient
Kiragga AN et al. Journal of the International AIDS Society 2014, 17:18957
http://www.jiasociety.org/index.php/jias/article/view/18957 | http://dx.doi.org/10.7448/IAS.17.1.18957
1

survival, clearly the ultimate measure of program effective-
ness. This likely adversely affects policy and decision-making.
For these reasons, it would be desirable to carry out an
analysis of CD4 response to ART, which would encompass all
patients who started therapy, similar to an intent-to-treat
analysis in clinical trials. Such an analysis would be helpful
when, for example, we compare the effectiveness of two or
more care and treatment programs or programmatic inter-
ventions. This is because comparisons based on traditional
estimates of CD4 response to ART may favour programs or
interventions with high dropout and death rates among their
sickest patients compared to those which manage to maintain
a higher proportion of their clients in care and under treat-
ment. In the current paper, we use a CD4measure adjusted for
mortality, where we assign a CD4 count of �1 (lower than any
conceivable CD4 count) to patients who have died up to their
expected follow-up duration and estimate the median CD4
count (which is not affected by the actual value of this penalty
factor). The interpretation of the median thus defined is the
CD4 threshold such that 50% of the patients were alive with a
CD4 count above this CD4 threshold.
Another analysis, which would be helpful for decision
makers, involves questions of the response to therapy under
some hypothetical intervention such as, for example, if it
were possible to maintain on therapy, a higher percentage
of patients starting ART. Such hypothetical scenarios have
been routinely addressed through mathematical modelling
but these procedures and results are frequently not trans-
parent or well understood and are heavily influenced by
unverified assumptions or hypotheses based on historical
data external to the population under study. As we show in
this paper, all these analyses can be approached through
adjustments calculated from available data on actual rather
than potential patients as well as strong but plausible
assumptions on the outcome of patients who discontinue
participation in care.
Obviously, a major obstacle in obtaining reasonable adjust-
ments to address the bias generated by the anticipated infor-
mative dropout of the sickest among HIV-positive patients
is the fact that it is very difficult to physically measure CD4
counts among patients who have discontinued care and
impossible to do so among those who have died. To overcome
this obvious limitation we can use methods such as inverse
probability of censoring weighting (IPCW) [13]. The crux of
the IPCW methodology is to use data from patients under
observation to represent patients who have been lost to clinic
with similar characteristics obtained up to their last visit. IPCW
has been applied successfully to numerous situations. More
relevant to our objectives, IPCW has been applied to the
estimation of longitudinal CD4 counts and HIV RNA levels
(viral load) in HIV-1 infected patients in the United States [14].
In that paper, CD4 counts and viral load measurements, which
were unavailable on patients who discontinued participation
in the study, were represented by their counterparts mea-
sured on similar patients still on observation.
One of the advantages of the IPCW approach is that it can
be customized to address specific questions, some contrary to
fact or ‘‘counterfactual,’’ which may not be directly measur-
able. Two examples of such questions relevant to our problem
in the resource-limited setting are the following: ‘‘What
would the long-term median CD4 count be if all patients
starting therapy had remained under observation (but not
necessarily continued to receive treatment)?’’ and ‘‘What
would be the long-term median CD4 count had all patients
starting therapy remained both in care and on treatment?’’
In this article we address these two questions in the context
of a large HIV care and treatment program in sub-Saharan
Africa. The former question is relevant because it measures
patient outcomes on all patients starting therapy (a kind of
‘‘intent to treat’’ analysis). The latter question measures the
benefit of policies which increase patient retention in care and
on treatment. The answers to these questions are therefore of
substantial clinical and public health interest. If, in the process
of addressing the first question, it is established that CD4
response to treatment is overestimated when not considering
patients who dropped out or died, the estimated median
CD4 counts after ART has been initiated will be adjusted
downward and so will the effectiveness of programs with
higher dropout and death rates among their clients. Similarly
if, when addressing the second question, the adjustment
of estimated median CD4 counts after ART is positive, the
implication would be that there is a significant benefit
resulting from interventions increasing patient retention in
care and treatment. Such a conclusion (that CD4 response is
significantly better were all patients retained in care and on
treatment) would inform decision-making about, for example,
the comparative effectiveness of efforts aimed at increasing
patient retention in care and treatment versus focusing all
program resources in initiating therapy on a higher number of
patients.
MethodsPatients and visits
We included adult HIV-positive patients aged ]15 years,
receiving routine HIV care and initiating ART after 1st
February 2004 in the United States Agency for International
Development and the Academic Model Providing Access to
Healthcare (USAID-AMPATH) partnership in Eldoret, Kenya
[15], a member of the East Africa International Epidemiologic
Databases to Evaluate AIDS (IeDEA) Consortium. Patients
who initiated ART within nine months of database closure
(14th March 2008) were excluded.
Most patients had monthly visits after the clinic visit when
treatment was initiated. Data were summarized in six-month
intervals centred at 0, 6, 12, 18 and 24 months post ART
initiation9 3 months.With the exception of the first interval,
which included visits from ART start up to three months post
treatment initiation, all subsequent intervals spanned six
months of clinic visits (i.e. interval 2 spanned visits three and
nine months after ART initiation, interval 3 between 9 and
15 months, etc.). All patients with at least one visit in each
interval had a data record in the interval. The maximumWorld
Health Organization (WHO) stage was selected from among all
reported within an interval. The CD4 count and body weight
closest to the midpoint of the interval were used in the
analysis.
Kiragga AN et al. Journal of the International AIDS Society 2014, 17:18957
http://www.jiasociety.org/index.php/jias/article/view/18957 | http://dx.doi.org/10.7448/IAS.17.1.18957
2
Statistical methods
We estimated the CD4 count trajectory by the median CD4
count after ART initiation at six-month intervals. CD4 counts
missing between consecutive intervals were interpolated by
fitting linear segments between available measurements. CD4
counts missing continuously from after an interval until the
end of follow-up were imputed by carrying forward the most
recently available observation. CD4 counts missing at ART
initiation were imputed as the mean estimate based on a
normal model with predictors including WHO stage, gender
and age at ART initiation. Other missing longitudinal mea-
sures, including weight and WHO stage were imputed in the
same manner. Only single imputations were carried out, as it
is not clear from the literature how multiple imputations are
to be combined in the case of IPCW analyses. ART treatment
status was only missing between visits so linear interpolation
was used and interpolated values were rounded off to 0 or 1
(respectively no treatment and treatment). Thus, interpola-
tion between an interval where treatment was being admin-
istered and one with no treatment, resulted in an imputed
treatment cessation date about half way between two
visits with observed treatment status. Similarly, a treatment
initiation date was imputed about half way between an
interval with no treatment and one with treatment.
We followed the methodology described by Lok and
colleagues [14], so that for all time intervals after death,
CD4 counts of patients who died were replaced by -1, a count
below the lowest possible CD4 count of zero. This was done in
order to provide a combined measure of program effective-
ness which includes both CD4 response and mortality. The
interpretation of this survival-adjusted median CD4 count is
the CD4 threshold such that 50% of the patients were alive
with a CD4 count above this CD4 threshold. In the Discussion
section, we provide an alternative analysis where mortality is
not included in the estimation of CD4 response to treatment.
We used IPCWmethodology [13,16] to address the problem
of selective dropout, identical to methods applied in Lok et al.
[14]. The interpretation of IPCW is that subjects who remained
in care with the same measured characteristics represent
subjects who were lost to clinic with the same characteristics
as of their last clinic visit by increasing the weight of the
observed subjects (who thus represent themselves plus a part
of the lost patients who are similar to them based on factors
observed prior to disengagement from care). IPCW, as de-
scribed in Robins et al. [13,16], requires that the probability of
censoring only depends on patient characteristics measured
while a patient is still in follow-up (that is, the data on patients
who are lost are ‘‘Missing At Random’’ (MAR) [17]). IPCW is
modelling the probability of remaining in care (i.e. coming to
return clinic visits) or, as the question may be, both in care and
on treatment. IPCWaccomplishes this by using information on
lost patients measured while the patient was still on observa-
tion. We used a pooled logistic regression model [18] to
estimate the probability of remaining in care at each six-
monthly interval. Factors included in the model were age,
sex, year of ART initiation, WHO stage and CD4 count at ART
initiation, defined as the closest available observation ob-
tained within six months before and up to two weeks after
treatment start, time-updated WHO stage and CD4 cell count
and binary indicators of whether the patient was receiving
therapy during the previous time interval. The time factor was
included as a cubic spline in the pooled logistic-regression
model. To estimate dropout rates, we assumed that all
patients were present at the beginning of each interval while,
when estimating mortality rates, we removed all dropouts
from the denominator and, when estimating treatment dis-
continuation rates we removed all dropouts and deceased
patients from the denominator (in effect assuming that, to
discontinue treatment, a patient needed to be both alive and
under observation).We used two distinct models of censoring:
one model to predict remaining on observation in the first
interval (visits between zero and three months from ART
initiation), using baseline measurements only (that is, mea-
surements available at the time of treatment initiation), and a
second model to predict remaining on observation after three
months from the start of therapy using both baseline and
time-updated measurements. Baseline and time-varying CD4
counts, WHO stage and weight measurements as well as the
type of clinic and demographic characteristics such as age
and gender were used in the modelling of the probability of
discontinuing from observation. Lagged longitudinal measure-
ments (i.e. CD4 counts or weights measured in the previous
interval) summarized the history of these measures up to
the present interval. The need for a distinct model during the
period immediately following ART initiation was due to the
observed higher mortality and dropout rate during the first
three months after initiation of antiretroviral treatment
[19]. From a modelling perspective, a separate analysis is
also necessary since, after the start of ART, the models
calculate the probability of censoring given the entire history
of past patient characteristics and treatment status while, for
the first interval, the past extends only up to the point of the
start of ART.
It is expected that a substantial proportion of patients lost
to follow-up will have died and/or have discontinued treat-
ment in proportions much higher than those seen among
patients still on observation (not MAR). For this reason, we
performed a sensitivity analysis considering varying mortality
and treatment access rates among dropouts. In these ana-
lyses, treatment access rates among dropouts were estimated
by multiplying the corresponding treatment access rates
among patients under observation with similar characteristics
by a factor of 0.2, 0.5 and 0.8. Similarly, the probability of
being alive after discontinuation from care was estimated
by multiplying the corresponding survival probability among
patients under observation with similar characteristics by
0.2 and 0.5. These factors are consistent with reported
mortality and treatment access patterns among dropouts in
a variety of settings [11,20�22] (see Discussion for more
details). We then applied these factors in our estimate of the
weights. Sensitivity analysis which assumes differential mor-
tality and treatment access rates among patients lost to
clinic contravenes accepted assumptions of data (MAR),
inherent in the IPCW methodology. In other words, we
acknowledge the possibility that patients lost to clinic may
not be adequately represented by patients on observation
based on measures available at the time of dropout. We have
developed extensive theory about how to incorporate such
Kiragga AN et al. Journal of the International AIDS Society 2014, 17:18957
http://www.jiasociety.org/index.php/jias/article/view/18957 | http://dx.doi.org/10.7448/IAS.17.1.18957
3

assumptions into the IPCW setting (in effect dealing with a
situation of data missing not at random � MNAR). An outline
of the procedure used to carry out the sensitivity analysis
has been included in Appendix 1. Details are described in a
forthcoming methodological publication.
The previous analyses (minus the sensitivity analyses just
described) address the counterfactual question ‘‘What would
be the median CD4 count had everyone remained under
observation and in care?’’ The implicit assumption is that
patients who discontinue from observation continue or
discontinue treatment and survive or die in the same rates
as those observed among patients remaining in care. When
access to care among the dropouts is considered through the
sensitivity analyses, a slightly different counterfactual scenar-
io is actually being tested. This scenario is expressed as
follows: ‘‘What would be the median CD4 count had everyone
remained on observation (but not necessarily in care or
treatment)?’’ In other words, what would be the median CD4
count were we to have access to the CD4 counts and vital
status on all patients who started therapy (but not necessarily
assume that they are in care)? We delineate these nuances in
the research questions in great detail in the Discussion.
To estimate the median CD4 count trajectory under the
second counterfactual scenario, that is, ‘‘What would the
median CD4 count be had everyone remained in care and on
treatment?’’ we censored patients when they either discon-
tinued follow-up or remained under observation but dis-
continued treatment (ART). We then applied the IPCW
methodology. To estimate the weights, we fit a separate
pooled logistic-regression model where discontinuation from
care and treatment was the censoring event (as opposed to
discontinuation from care/observation in Scenario 1). Again,
two distinct models were fitted in the same manner as
described above: one for the period between zero and three
months from the start of therapy and a second model for the
subsequent time intervals.
We generated 95% confidence intervals by sampling with
replacement from the patient population and then per-
forming the analysis on the sampled pseudo-population
(bootstrap confidence intervals). One thousand such repeti-
tions were generated and the 95% confidence interval
corresponds to the 2.5th and 97.5th percentile of the
generated medians or, in the case of the proportion of
patients with CD4 counts�350 cells/mL, the corresponding
quantiles of the estimated proportion.
All analyses were performed with STATA version 13 (Stata
Corporation, College Station, TX). All figures were generated
using R 3.1.0 [23]
ResultsA total of 25,261 patients were included in the analysis; 9190
(36.4%) were male, the median age at ART initiation was
38 years (inter-quartile range [IQR] 32�44), the median CD4
cell count at the start of treatment was 116 cells/mL (53�180)(Table 1). Within the first three months after ART start, 2929
(11.6%) patients dropped out of follow-up and 1015 (4.5%)
died while on follow-up. After the first interval, another 707
patients died while on follow-up and 3716 dropped out in
subsequent intervals through 24 months after starting ART.
Rates of discontinuation from follow-up (loss to follow-up),
treatment discontinuation and observed mortality (among
patients on observation) are presented in Table 2. Of note
is the small percentage of patients in care who are off treat-
ment, which remained between 1.5 and 2.1%. This is the
motivating factor for carrying out a sensitivity analysis (see
below).
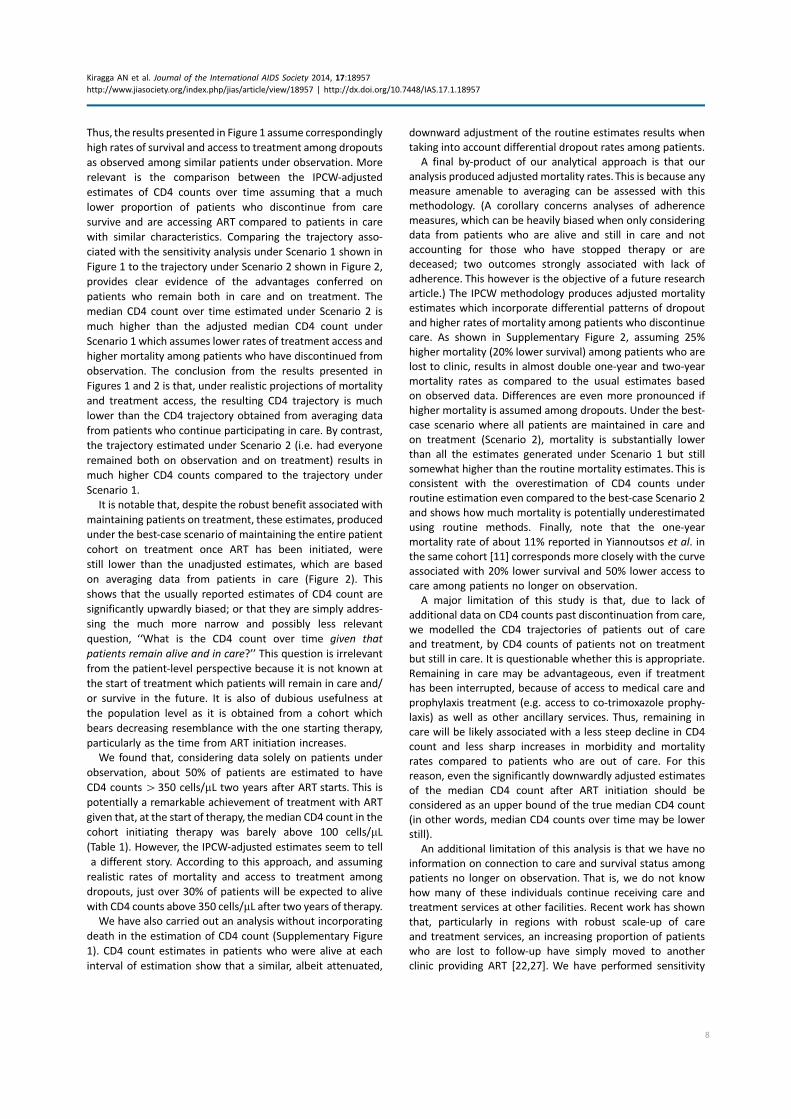
Scenario 1: Had all patients remained on observation
(and possibly on treatment)
Table 3 and Figure 1 show the non-weighted and IPCW-
adjusted median CD4 cell counts over time. The IPCW-
adjusted median CD4 count is up to 30 cells/mL lower than
the estimate based on available data up to two years after
the start of therapy (Figure 1). It should be noted that these
analyses assume that mortality and treatment access patterns
are identical among patients who remain in care and those
who discontinue follow-up with the same observed measured
characteristics (MAR).
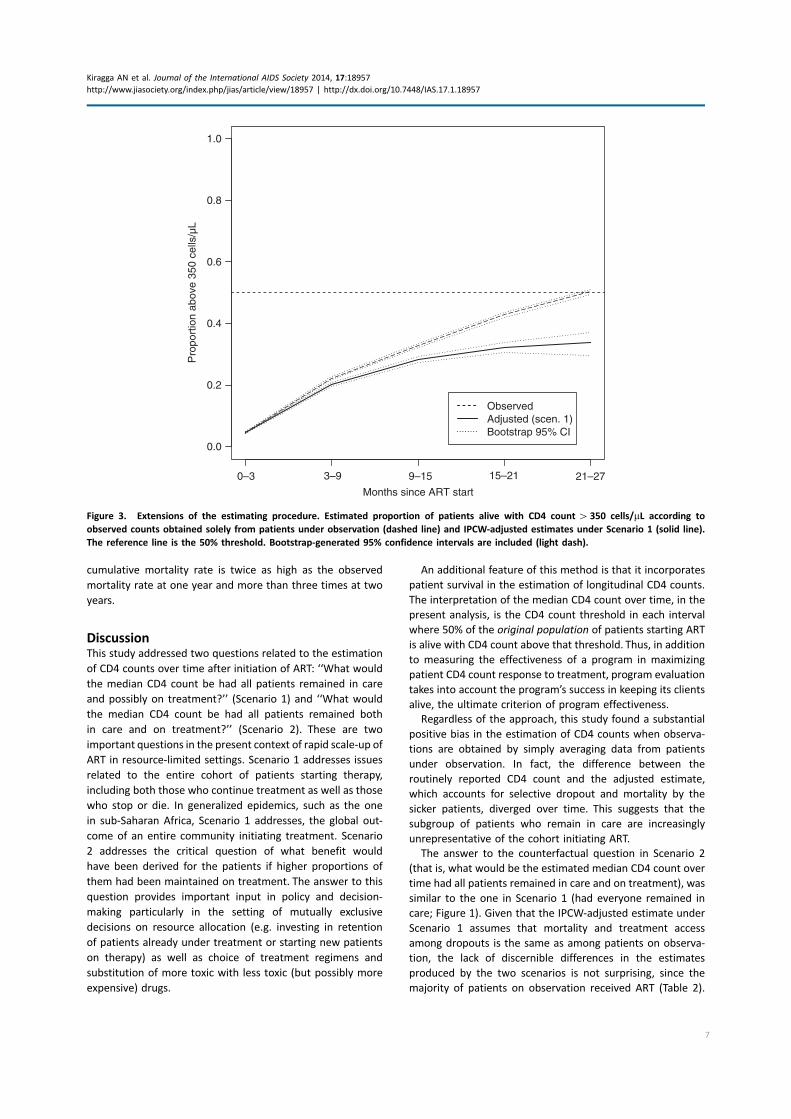
Scenario 2: Had all patients remained on observation and
on treatment
The second question in this manuscript considers the median
CD4 count over time had all patients remained on observa-
tion and continued treatment. The IPCW analysis showed
that the estimated median CD4 count under Scenario 2 was
Table 1. Demographic characteristics of patient population at
ART initiation
Patient characteristic at ART initiation Descriptive statistic
Males, n (%) 9190 (36.4%)
Age in years, median (IQR) 38 (32�44)
CD4 cell count (cells/mL)a, median (IQR) 116 (53�180)
Year of ART initiation, n (%)
2004 2141 (8.5)
2005 5725 (22.7)
2006 8650 (34.2)
2007 8458 (33.5)
2008 287 (1.1)
aCD4 count obtained within six months prior and up to 2 weeks after
ART initiation.
Table 2. Loss to follow-up, observed mortality, and treatment
access over time
Months after
ART start
Loss to
follow-up,*
N (%)
Observed
mortality,*
N (%)
Off
treatment,*
N (%)
Baseline (0�3) 2929 (11.6) 1015 (4.0) 0 (0.0)
(3�9) 1502 (7.0) 403 (2.0) 417 (2.1)
(9�15) 1040 (5.4) 159 (0.9) 384 (2.1)
(15�21) 701 (3.8) 106 (0.6) 331 (1.9)
(21�27) 473 (2.7) 39 (0.2) 252 (1.5)
*Out of all patients under study at each time interval.
Kiragga AN et al. Journal of the International AIDS Society 2014, 17:18957
http://www.jiasociety.org/index.php/jias/article/view/18957 | http://dx.doi.org/10.7448/IAS.17.1.18957
4

slightly higher than the estimated median CD4 count under
Scenario 1 during later periods, but this difference was not
particularly pronounced (Figure 2).
Sensitivity analyses
In the sensitivity analysis, we varied the survival and
treatment access rates among the dropouts in order to
investigate their effect on IPCW-adjusted CD4 counts. We
assumed that survival and access to treatment would be
lower among dropouts compared to patients in care with
similar characteristics. The proportions were varied by multi-
plying the probability of remaining on treatment, as esti-
mated among patients under observation, by a factor of
20, 50 and 80% and, similarly, the proportion of patients
surviving, estimated among patients under observation, by a
factor of 50 and 80%. In the case of treatment access, these
factors represent published reports involving interviews
among patients who discontinue from care and are subse-
quently found alive in the community [20], while the higher
probability of death in patients who discontinue care has
Table 3. Non-adjusted and IPCW-adjusted median CD4 cell counts over time according to two counterfactual scenarios
Median CD4 count (cells/mL)
Unadjusted IPCW-adjusted
Months after ART start Median (IQR)
Scenario 1
Median (IQR)
Scenario 2
Median (IQR)
Baseline (0�3) 116 (53, 180) 118 (56, 180) 118 (56, 180)
(3�9) 224 (140, 333) 217 (131, 326) 217 (131, 326)
(9�15) 272 (177, 394) 258 (156, 381) 259 (158, 382)
(15�21) 318 (210, 452) 294 (179, 426) 297 (182, 329)
(21�27) 351 (238, 490) 322 (196, 459) 326 (202, 463)
100
0–3 3–9 9–15 15–21 21–27
150
200
250
300
350
Months since ART start
Med
ian
CD
4 co
unt (
cells
/µL)
ObservedAdjusted (scen. 1)Adjusted (sens.analysis)Bootstrap 95% CI
Figure 1. Overall non-weighted (dashed line) and IPCW-adjusted median CD4 count had all patients remained in care assuming equal
survival and access to care (Scenario 1 solid line) and assuming 50% lower access to treatment and 80% survival compared to patients
remaining in care (sensitivity analysis; heavy dash). Bootstrap-generated 95% confidence intervals are included (light dash).
Note that, under the sensitivity analysis, this is a slightly modified Scenario 1, where the question centres simply on the patient being on
observation (i.e. on solely knowing the outcome of the patients but not assuming that they have remained in care, as it is the case when no
sensitivity analysis is performed).
Kiragga AN et al. Journal of the International AIDS Society 2014, 17:18957
http://www.jiasociety.org/index.php/jias/article/view/18957 | http://dx.doi.org/10.7448/IAS.17.1.18957
5

been extensively documented [9,11,24�26]. For brevity, wepresent here the sensitivity analysis under Scenario 1
corresponding to 50% treatment access and 80% survival
among the dropouts, compared to similar patients under
observation (Figure 1). Of note is the higher variability of
the sensitivity-derived estimates reflected by the wider 95%
bootstrap intervals. This increased variability reflects the
underlying variability of the higher mortality rate and the
lower access to ART among patients lost to clinic (binomial
probabilities with higher variability) compared to patients
on observation who experience very low mortality rates and
extremely high access to care (binomial probabilities with very
low variability).
CD4 count estimates without incorporating mortality
We also analyzed longitudinal CD4 counts without adjusting
for death (i.e. by not including any CD4 count values of �1
after death in the calculation of median CD4 counts at each
interval). Supplementary Figure 1 shows longitudinal CD4
count estimates excluding data on patients who have died.
These analyses used the sensitivity analytical procedures
described earlier where it was assumed that, patients out
of care have 50% lower rates of access to treatment com-
pared to patients in care. Two estimates were produced: One
assumed that survival was identical among patients under
care (albeit accessing treatment at lower levels compared to
patients in care) and one assumed that survival rates among
patients who have discontinued from care at the original
clinic were 20% lower than those continuing in care.
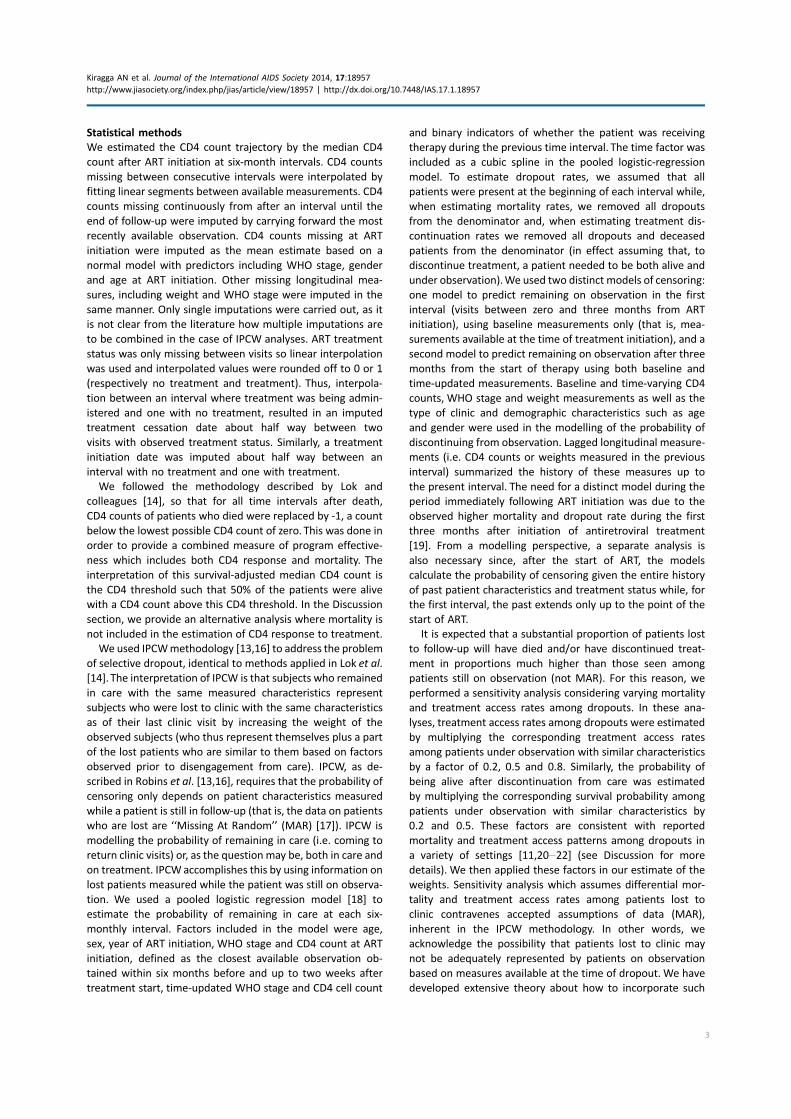
Extensions
An additional summary measure involving longitudinal CD4
counts estimated under Scenario 1 is the proportion over
time of patients with CD4 counts above 350 cells/mL. Definedin the same manner as the survival-adjusted median de-
scribed above, this analysis addresses the question of what
proportion of patients from the original cohort are alive with
CD4 above 350 cells/mL after starting ART. Figure 3 presents
the results of these analyses. Of note, we used the same
estimates of treatment access and mortality among dropouts
as presented in the sensitivity analysis section above (i.e. 80%
survival and 50% rate of treatment access among dropouts
compared to similar patients under observation), because we
consider these as the most likely state of affairs. It is clear
from the figure that, simply averaging data from patients who
are alive and on observation, just over 50% will have CD4
counts above 350 cells/mL at two years from the start of
therapy. The IPCW-adjusted estimate is 29%. The interpreta-
tion is that less than 30% of patients starting treatment will be
alive with CD4 counts above 350 cells/mL two years later.
A final by-product of this analysis is a revised estimate of
the mortality rates adjusting for differential dropout and
higher mortality and lower treatment access rates among
patients no longer in follow-up. Supplementary Figure 2
shows the routine cumulative mortality estimates produced
by considering only observed deaths versus the adjusted
estimates which consider both the characteristics of lost
patients as well as an estimate of the mortality rate among
patients no longer on observation. Assuming 20% lower
survival among patients no longer in follow-up, the adjusted
100
150
200
250
300
350
Months since ART start
Med
ian
CD
4 co
unt (
cells
/µL)
ObservedAdjusted (scenario 2)Bootstrap 95% CI
0–3 3–9 9–15 15–21 21–27
Figure 2. Overall non-weighted (dashed line) and IPCW-adjusted median CD4 count had all patients remained in care and on treatment
assuming equal survival and access to care (Scenario 2 solid line).
Kiragga AN et al. Journal of the International AIDS Society 2014, 17:18957
http://www.jiasociety.org/index.php/jias/article/view/18957 | http://dx.doi.org/10.7448/IAS.17.1.18957
6
cumulative mortality rate is twice as high as the observed
mortality rate at one year and more than three times at two
years.
DiscussionThis study addressed two questions related to the estimation
of CD4 counts over time after initiation of ART: ‘‘What would
the median CD4 count be had all patients remained in care
and possibly on treatment?’’ (Scenario 1) and ‘‘What would
the median CD4 count be had all patients remained both
in care and on treatment?’’ (Scenario 2). These are two
important questions in the present context of rapid scale-up of
ART in resource-limited settings. Scenario 1 addresses issues
related to the entire cohort of patients starting therapy,
including both those who continue treatment as well as those
who stop or die. In generalized epidemics, such as the one
in sub-Saharan Africa, Scenario 1 addresses, the global out-
come of an entire community initiating treatment. Scenario
2 addresses the critical question of what benefit would
have been derived for the patients if higher proportions of
them had been maintained on treatment. The answer to this
question provides important input in policy and decision-
making particularly in the setting of mutually exclusive
decisions on resource allocation (e.g. investing in retention
of patients already under treatment or starting new patients
on therapy) as well as choice of treatment regimens and
substitution of more toxic with less toxic (but possibly more
expensive) drugs.
An additional feature of this method is that it incorporates
patient survival in the estimation of longitudinal CD4 counts.
The interpretation of the median CD4 count over time, in the
present analysis, is the CD4 count threshold in each interval
where 50% of the original population of patients starting ART
is alive with CD4 count above that threshold. Thus, in addition
to measuring the effectiveness of a program in maximizing
patient CD4 count response to treatment, program evaluation
takes into account the program’s success in keeping its clients
alive, the ultimate criterion of program effectiveness.
Regardless of the approach, this study found a substantial
positive bias in the estimation of CD4 counts when observa-
tions are obtained by simply averaging data from patients
under observation. In fact, the difference between the
routinely reported CD4 count and the adjusted estimate,
which accounts for selective dropout and mortality by the
sicker patients, diverged over time. This suggests that the
subgroup of patients who remain in care are increasingly
unrepresentative of the cohort initiating ART.
The answer to the counterfactual question in Scenario 2
(that is, what would be the estimated median CD4 count over
time had all patients remained in care and on treatment), was
similar to the one in Scenario 1 (had everyone remained in
care; Figure 1). Given that the IPCW-adjusted estimate under
Scenario 1 assumes that mortality and treatment access
among dropouts is the same as among patients on observa-
tion, the lack of discernible differences in the estimates
produced by the two scenarios is not surprising, since the
majority of patients on observation received ART (Table 2).
0.0
0.2
0.4
0.6
0.8
1.0
Months since ART start
Pro
port
ion
abov
e 35
0 ce
lls/µ
L
ObservedAdjusted (scen. 1)Bootstrap 95% CI
0–3 3–9 9–15 15–21 21–27
Figure 3. Extensions of the estimating procedure. Estimated proportion of patients alive with CD4 count�350 cells/mL according to
observed counts obtained solely from patients under observation (dashed line) and IPCW-adjusted estimates under Scenario 1 (solid line).
The reference line is the 50% threshold. Bootstrap-generated 95% confidence intervals are included (light dash).
Kiragga AN et al. Journal of the International AIDS Society 2014, 17:18957
http://www.jiasociety.org/index.php/jias/article/view/18957 | http://dx.doi.org/10.7448/IAS.17.1.18957
7
Thus, the results presented in Figure 1 assume correspondingly
high rates of survival and access to treatment among dropouts
as observed among similar patients under observation. More
relevant is the comparison between the IPCW-adjusted
estimates of CD4 counts over time assuming that a much
lower proportion of patients who discontinue from care
survive and are accessing ART compared to patients in care
with similar characteristics. Comparing the trajectory asso-
ciated with the sensitivity analysis under Scenario 1 shown in
Figure 1 to the trajectory under Scenario 2 shown in Figure 2,
provides clear evidence of the advantages conferred on
patients who remain both in care and on treatment. The
median CD4 count over time estimated under Scenario 2 is
much higher than the adjusted median CD4 count under
Scenario 1 which assumes lower rates of treatment access and
higher mortality among patients who have discontinued from
observation. The conclusion from the results presented in
Figures 1 and 2 is that, under realistic projections of mortality
and treatment access, the resulting CD4 trajectory is much
lower than the CD4 trajectory obtained from averaging data
from patients who continue participating in care. By contrast,
the trajectory estimated under Scenario 2 (i.e. had everyone
remained both on observation and on treatment) results in
much higher CD4 counts compared to the trajectory under
Scenario 1.
It is notable that, despite the robust benefit associated with
maintaining patients on treatment, these estimates, produced
under the best-case scenario of maintaining the entire patient
cohort on treatment once ART has been initiated, were
still lower than the unadjusted estimates, which are based
on averaging data from patients in care (Figure 2). This
shows that the usually reported estimates of CD4 count are
significantly upwardly biased; or that they are simply addres-
sing the much more narrow and possibly less relevant
question, ‘‘What is the CD4 count over time given that
patients remain alive and in care?’’ This question is irrelevant
from the patient-level perspective because it is not known at
the start of treatment which patients will remain in care and/
or survive in the future. It is also of dubious usefulness at
the population level as it is obtained from a cohort which
bears decreasing resemblance with the one starting therapy,
particularly as the time from ART initiation increases.
We found that, considering data solely on patients under
observation, about 50% of patients are estimated to have
CD4 counts�350 cells/mL two years after ART starts. This is
potentially a remarkable achievement of treatment with ART
given that, at the start of therapy, the median CD4 count in the
cohort initiating therapy was barely above 100 cells/mL(Table 1). However, the IPCW-adjusted estimates seem to tell
a different story. According to this approach, and assuming
realistic rates of mortality and access to treatment among
dropouts, just over 30% of patients will be expected to alive
with CD4 counts above 350 cells/mL after two years of therapy.We have also carried out an analysis without incorporating
death in the estimation of CD4 count (Supplementary Figure
1). CD4 count estimates in patients who were alive at each
interval of estimation show that a similar, albeit attenuated,
downward adjustment of the routine estimates results when
taking into account differential dropout rates among patients.
A final by-product of our analytical approach is that our
analysis produced adjusted mortality rates. This is because any
measure amenable to averaging can be assessed with this
methodology. (A corollary concerns analyses of adherence
measures, which can be heavily biased when only considering
data from patients who are alive and still in care and not
accounting for those who have stopped therapy or are
deceased; two outcomes strongly associated with lack of
adherence. This however is the objective of a future research
article.) The IPCW methodology produces adjusted mortality
estimates which incorporate differential patterns of dropout
and higher rates of mortality among patients who discontinue
care. As shown in Supplementary Figure 2, assuming 25%
higher mortality (20% lower survival) among patients who are
lost to clinic, results in almost double one-year and two-year
mortality rates as compared to the usual estimates based
on observed data. Differences are even more pronounced if
higher mortality is assumed among dropouts. Under the best-
case scenario where all patients are maintained in care and
on treatment (Scenario 2), mortality is substantially lower
than all the estimates generated under Scenario 1 but still
somewhat higher than the routine mortality estimates. This is
consistent with the overestimation of CD4 counts under
routine estimation even compared to the best-case Scenario 2
and shows how much mortality is potentially underestimated
using routine methods. Finally, note that the one-year
mortality rate of about 11% reported in Yiannoutsos et al. in
the same cohort [11] corresponds more closely with the curve
associated with 20% lower survival and 50% lower access to
care among patients no longer on observation.
A major limitation of this study is that, due to lack of
additional data on CD4 counts past discontinuation from care,
we modelled the CD4 trajectories of patients out of care
and treatment, by CD4 counts of patients not on treatment
but still in care. It is questionable whether this is appropriate.
Remaining in care may be advantageous, even if treatment
has been interrupted, because of access to medical care and
prophylaxis treatment (e.g. access to co-trimoxazole prophy-
laxis) as well as other ancillary services. Thus, remaining in
care will be likely associated with a less steep decline in CD4
count and less sharp increases in morbidity and mortality
rates compared to patients who are out of care. For this
reason, even the significantly downwardly adjusted estimates
of the median CD4 count after ART initiation should be
considered as an upper bound of the true median CD4 count
(in other words, median CD4 counts over time may be lower
still).
An additional limitation of this analysis is that we have no
information on connection to care and survival status among
patients no longer on observation. That is, we do not know
how many of these individuals continue receiving care and
treatment services at other facilities. Recent work has shown
that, particularly in regions with robust scale-up of care
and treatment services, an increasing proportion of patients
who are lost to follow-up have simply moved to another
clinic providing ART [22,27]. We have performed sensitivity
Kiragga AN et al. Journal of the International AIDS Society 2014, 17:18957
http://www.jiasociety.org/index.php/jias/article/view/18957 | http://dx.doi.org/10.7448/IAS.17.1.18957
8

analyses to assess the impact of various levels of self-referral
on our estimates. The results are consistent with expectation.
That is, the downward adjustment is more pronounced under
scenarios where increasingly higher fractions of patients lost
to clinic are not connected with another care and treat-
ment program (analysis not shown). This suggests that this
information should be collected as part of routine program
evaluation at least in a subset of the dropout population
[20,27]. Similarly, sensitivity analyses assuming increasingly
high mortality rates among dropouts followed predictable
trends particularly when combined with increasing rates
of disengagement from care. Additional information on the
outcome of patients after loss to program (i.e. mortality
under treatment and/or treatment access elsewhere) as well
as the theory addressing the use of these auxiliary data is the
objective of a future publication.
This study indicates that there is significant overestimation
of the CD4 response to treatment for a cohort starting ART
when available data are simply averaged to estimate long-
term CD4 response to therapy. At the same time, retention
of patients to treatment results in a salutary effect which
manifests in much higher median CD4 counts over time.
Policies, programs and ART regimens which improve patient
retention into care and treatment are desirable and will
significantly improve patient outcomes. IPCW is an elegant
and intuitive methodology, which can be generalized to other
settings and longitudinal measures (e.g. treatment adherence
levels, HIV RNA�viral load measurements) and can be im-
plemented using existing statistical software to address a
number of critical clinical and public-health questions. With
these methods rational decisions of the likely outcome of
a number of interventions can be made based on more
accurate quantification of the likely impact of patient behav-
iour, access to treatment and patient retention efforts.
Authors’ affiliations1Infectious Diseases Institute, Kampala, Uganda; 2Department of Biostatistics,
Harvard School of Public Health Boston, MA, USA; 3Department of Biostatistics,
Indiana University School of Medicine Indianapolis, IN, USA; 4Center for
Biostatistics in AIDS Research, Harvard School of Public Health Boston, MA,
USA; 5School of Medicine, Moi University, Eldoret, Kenya; 6Division of
Infectious Diseases, Indiana University School of Medicine Indianapolis, IN,
USA; 7Department of Biostatistics, Fairbanks School of Public Health, Indiana
University Indianapolis, IN, USA
Competing interest
We have no competing interests.
Authors’ contributions
AK performed the statistical analyess; JJL and RJB developed much of the
underlying statistical theory and reviewed the manuscript; BSM conceptualized
and constructed the database and reviewed the manuscript; AM contributed
to the design of the study, the collection of data, and reviewed the manuscript;
KKW-K lent clinical insight to the implications of the results; CTY performed
statistical analyses and wrote the manuscript.
Acknowledgements
This work was partially supported by a Welcome Trust scholarship (AK), and
NIH grants U01AI069911 (CTY, KWK, BSM, AM) and R01AI100762 (JJL). The
opinions expressed herein are solely those of the authors and do not
necessarily represent those of their respective institutions or the agencies
that have funded AMPATH.
References
1. Hughes MD. Evaluating surrogate endpoints. Control Clin Trials.
2002;23:703�7.2. Hughes MD, Daniels MJ, Fischl MA, Kim S, Schooley RT. CD4 cell count as a
surrogate endpoint in HIV clinical trials: a meta-analysis of studies of the AIDS
Clinical Trials Group. AIDS. 1998;12:1823�32.3. World Health Organization. Antiretroviral therapy for HIV infection in
adults and adolescents. 2010 revision. Geneva: World Health Organization;
2010.
4. World Health Organization. Consolidated guidelines on the use of
antiretroviral drugs for treating and preventing HIV infection: recommenda-
tions for a public health approach. Geneva: World Health Organization;
2013.
5. Wools-Kaloustian K, Kimaiyo S, Diero L, Siika A, Sidle J, Yiannoutsos CT, et al.
Viability and effectiveness of large-scale HIV treatment initiatives in sub-
Saharan Africa: experience from western Kenya. AIDS. 2006;20:41�8.6. Stringer JS, Mwango AJ, Giganti MJ, Mulenga L, Levy JW, Stringer EM, et al.
Effectiveness of generic and proprietary first-line anti-retroviral regimens in a
primary health care setting in Lusaka, Zambia: a cohort study. Int J Epidemiol.
2012;41:448�59.7. Koethe JR, Limbada MI, Giganti MJ, Nyirenda CK, Mulenga L, Wester CW,
et al. Early immunologic response and subsequent survival among malnour-
ished adults receiving antiretroviral therapy in Urban Zambia. AIDS. 2010;
24:2117�21.8. Chi BH, Giganti M, Mulenga PL, Limbada M, Reid SE, Mutale W, et al. CD4�response and subsequent risk of death among patients on antiretroviral
therapy in Lusaka, Zambia. J Acquir Immune Defic Syndr. 2009;52:125�31.9. Gabillard D, Lewden C, Ndoye I, Moh R, Segeral O, Tonwe-Gold B, et al.
Mortality, AIDS-morbidity, and loss to follow-up by current CD4 cell count
among HIV-1-infected adults receiving antiretroviral therapy in Africa and Asia:
data from the ANRS 12222 collaboration. J Acquir Immune Defic Syndr. 2013;
62:555�61.10. An MW, Frangakis CE, Musick BS, Yiannoutsos CT. The need for double-
sampling designs in survival studies: an application to monitor PEPFAR.
Biometrics. 2009;65:301�6.11. Yiannoutsos CT, An MW, Frangakis CE, Musick BS, Braitstein P,
Wools-Kaloustian K, et al. Sampling-based approaches to improve estimation
of mortality among patient dropouts: experience from a large PEPFAR-funded
program in Western Kenya. PLoS One. 2008;3:e3843.
12. Fox M, McCarthy O, Over M. A novel approach to accounting for loss
to follow-up when estimating the relationship between CD4 count at ART
initiation and mortality. PLoS One. 2013;8:e69300.
13. Robins JM, Rotnitzky A, Zhao LP. Estimation of regression coefficients
when some regressors are not always observed. J Am Stat Assoc. 1994;89:
846�66.14. Lok JJ, Bosch RJ, Benson CA, Collier AC, Robbins GK, Shafer RW, et al. Long-
term increase in CD4� T-cell counts during combination antiretroviral therapy
for HIV-1 infection. AIDS. 2010;24:1867�76.15. UNAIDS. UNAIDS World AIDS Day report, Geneva: Joint United Nations
Programme on HIV/AIDS (UNAIDS); 2011.
16. Robins JM, Rotnitzky A, Zhao LP. Analysis of semiparametric regression
models for repeated outcomes under the presence of missing data. J Am Stat
Assoc. 1995;90:106�21.17. Rubin DB. Inference and missing data. Biometrika. 1976;63:581�92.18. D’Agostino RB, Lee ML, Belanger AJ, Cupples LA, Anderson K, Kannel WB.
Relation of pooled logistic regression to time dependent Cox regression
analysis: the Framingham Heart Study. Stat Med. 1990;9:1501�15.19. Yiannoutsos CT. Modeling AIDS survival after initiation of antiretroviral
treatment by Weibull models with changepoints. J Int AIDS Soc. 2009;12:9.
20. Geng EH, Bangsberg DR, Musinguzi N, Emenyonu N, Bwana MB,
Yiannoutsos CT, et al. Understanding reasons for and outcomes of patients
lost to follow-up in antiretroviral therapy programs in Africa through a
sampling-based approach. J Acquir Immune Defic Syndr. 2010;53:405�11.21. Henriques J, Pujades-Rodriguez M, McGuire M, Szumilin E, Iwaz J,
Etard JF, et al. Comparison of methods to correct survival estimates and
survival regression analysis on a large HIV African cohort. PLoS One. 2012;
7:e31706.
22. Egger M, Spycher BD, Sidle J, Weigel R, Geng EH, Fox MP, et al. Correcting
mortality for loss to follow-up: a nomogram applied to antiretroviral treatment
programmes in sub-Saharan Africa. PLoS Med. 2011;8:e1000390.
Kiragga AN et al. Journal of the International AIDS Society 2014, 17:18957
http://www.jiasociety.org/index.php/jias/article/view/18957 | http://dx.doi.org/10.7448/IAS.17.1.18957
9

23. R Core Team. R: A language and environment for statistical compu-
ting. R Foundation for Statistical Computing. Vienna, Austria: R Core Team;
2013.
24. Geng EH, Emenyonu N, Bwana MB, Glidden DV, Martin JN. Sampling-
based approach to determining outcomes of patients lost to follow-up in
antiretroviral therapy scale-up programs in Africa. JAMA. 2008;300:506�7.25. Geng EH, Glidden DV, Bwana MB, Musinguzi N, Emenyonu N, Muyindike
W, et al. Retention in care and connection to care among HIV-infected patients
on antiretroviral therapy in Africa: estimation via a sampling-based approach.
PLoS One. 2011;6:e21797.
26. Stringer JS, Zulu I, Levy J, Stringer EM, Mwango A, Chi BH, et al. Rapid
scale-up of antiretroviral therapy at primary care sites in Zambia: feasibility and
early outcomes. JAMA. 2006;296:782�93.27. Hamers RL, Oyomopito R, Kityo C, Phanuphak P, Siwale M, Sungkanuparph
S, et al. Cohort profile: the PharmAccess African (PASER-M) and the
TREAT Asia (TASER-M) monitoring studies to evaluate resistance � HIV drug
resistance in sub-Saharan Africa and the Asia-Pacific. Int J Epidemiol. 2012;
41:43�54.
Kiragga AN et al. Journal of the International AIDS Society 2014, 17:18957
http://www.jiasociety.org/index.php/jias/article/view/18957 | http://dx.doi.org/10.7448/IAS.17.1.18957
10

Appendix 1We present here an outline of the statistical procedures
involved in the sensitivity analyses. These involve relaxing
the reliance on the missing-at-random (MAR) assumption to
calculate the inverse probability of not being censored
by the last visit k given the complete covariate LK and
treatment history AK up to K, that is, P CK ¼ 0jLK ;AK
� �
involved in the IPCW weights. Under MAR, this prob-
ability can be analyzed into products of probabilities,
based on data up to each visit k�1, . . . ,K that is,
PðCK ¼ 0 LK
�� ;AK Þ ¼QK
k¼1
PðCk ¼ 0 Lk�1
�� ;Ak�1;Ck�1 ¼ 0ÞScenario 1
Depending on the type of scenario these probabilities can
be further simplified. For example, in patients who have died
between visits k-1and k, we can relax the MAR assumption by
considering that
P ðCk ¼ 0 Lk�1
�� ;Ak�1;Ck�1 ¼ 0Þ
¼PðCk ¼ 0;Dk ¼ 1 Lk�1
�� ;Ak�1;Ck�1 ¼ 0ÞPðDk ¼ 1; Lk�1
�� ;Ak�1;Ck�1 ¼ 0Þ
The numerator can be estimated through the usual means
(routine application of the Bayes theorem) but the denomi-
nator cannot be estimated without reliance on MAR, in other
words, relying on the assumption that the probability of
mortality is the same in patients lost to clinic at visit k
(i.e.Ck�1), as those on observation (Ck�0). More specifi-
cally, the MAR assumption guarantees that
P ðDk ¼ 1 Ck ¼ 1;Lk;Ak;Ck�1 ¼ 0Þ��
¼ PðDk ¼ 1 Lk�1;Ak�1
�� ;Ck ¼ 0Þ
If vital status data are available on a sample of patients
lost to clinic [11,24] the probability PðDk ¼ 1 Ck ¼ 1;jLk�1;Ak�1;Ck�1 ¼ 0Þ: can be modelled explicitly. In the
current analysis we have assumed that
1� P ðDk ¼ 1 Ck ¼ 1;Lk�1;Ak�1;Ck�1 ¼ 0Þ��
¼ 0:8 � ð1� PðDk ¼ 1 Lk�1;Ak�1;Ck ¼ 0ÞÞ��
Or, in other words, that the survival rates of patients lost
to clinic are, on average, 80% of those still in care.
Also, for patients alive and on ART at k the above
probability involves factors such as
PðCk ¼ 0 Lk;Ak;Ck�1 ¼ 0Þ��
¼PðCk ¼ 0;Dk ¼ 0;Ak ¼ 1 Lk�1;Ak�1;Ck�1 ¼ 0Þ
��
PðDk ¼ 0;Ak ¼ 1 Lk�1;Ak�1;Ck�1 ¼ 0Þ��
The MAR assumption specifies that access to ART among
patients who are alive is the same among those lost to clinic
as among those who remain under observation with the
same characteristics at the time of dropout, that is
PðDk ¼ 0;Ak ¼ 1 Ck ¼ 1;Lk�1;Ak�1;Ck�1 ¼ 0Þ��
¼ PðDk ¼ 0;Ak ¼ 1 Ck ¼ 0;Lk�1;Ak�1Þ��
In the forthcoming methodological publication we use
data from a sample of the dropouts to model the probability
PðDk ¼ 0;Ak ¼ 1 Ck ¼ 1;Lk�1;Ak�1;Ck�1 ¼ 0Þ�� , but in the
current publication we used sensitivity analyses, where we
assumed that
PðAk ¼ 1 Dk ¼ 0;Ck ¼ 1;Lk�1;Ak�1;Ck�1 ¼ 0Þ��
¼ 0:5PðAk ¼ 1 Dk ¼ 0;Ckj ¼ 0;Lk�1;Ak�1Þ
(i.e. that the access to care among live patients lost to
clinic is half of that among patients still on observation. Note
that the opposite scenario, of alive patients off treatment,
we set
PðAk ¼ 0 Dk ¼ 0;Ck ¼ 1;Lk�1;Ak�1;Ck�1 ¼ 0Þ��
¼ 1� PðAk ¼ 1 Dk ¼ 0;Ckj ¼ 1;Lk�1;Ak�1;Ck�1 ¼ 0Þ
Scenario 2
For scenario 2, matters are simpler, as patients who stop
treatment are censored. Thus, only the probability of death
among patients lost to care is relevant (with the additional
requirement that a patient remained on ART up to the
moment of loss to clinic). We have made the same
assumptions in the sensitivity analysis as before (i.e. that
the survival among patients lost to clinic is 80% of the
respective survival of those still on observation).
Kiragga AN et al. Journal of the International AIDS Society 2014, 17:18957
http://www.jiasociety.org/index.php/jias/article/view/18957 | http://dx.doi.org/10.7448/IAS.17.1.18957
11
Top Related
Copyright © 2022 FDOKUMEN

