


Bahasa
Halaman
Hukum

Canalization of Gene Expression and Domain Shifts inthe Drosophila Blastoderm by Dynamical AttractorsManu1., Svetlana Surkova2., Alexander V. Spirov1, Vitaly V. Gursky3, Hilde Janssens4, Ah-Ram Kim1,
Ovidiu Radulescu5, Carlos E. Vanario-Alonso1, David H. Sharp6, Maria Samsonova2, John Reinitz1*
1 Department of Applied Mathematics and Statistics, and Center for Developmental Genetics, Stony Brook University, Stony Brook, New York, United States of America,
2 Department of Computational Biology, Center for Advanced Studies, St. Petersburg State Polytechnical University, St. Petersburg, Russia, 3 Theoretical Department, The
Ioffe Physico-Technical Institute of the Russian Academy of Sciences, St. Petersburg, Russia, 4 EMBL/CRG Research Unit in Systems Biology, CRG – Centre de Regulacio
Genomica, Barcelona, Spain, 5 Institute of Mathematical Research of Rennes, University of Rennes, Rennes, France, 6 Theoretical Division, Los Alamos National Laboratory,
Los Alamos, New Mexico, United States of America
Abstract
The variation in the expression patterns of the gap genes in the blastoderm of the fruit fly Drosophila melanogaster reducesover time as a result of cross regulation between these genes, a fact that we have demonstrated in an accompanying articlein PLoS Biology (see Manu et al., doi:10.1371/journal.pbio.1000049). This biologically essential process is an example of thephenomenon known as canalization. It has been suggested that the developmental trajectory of a wild-type organism isinherently stable, and that canalization is a manifestation of this property. Although the role of gap genes in the canalizationprocess was established by correctly predicting the response of the system to particular perturbations, the stability of thedevelopmental trajectory remains to be investigated. For many years, it has been speculated that stability againstperturbations during development can be described by dynamical systems having attracting sets that drive reductions ofvolume in phase space. In this paper, we show that both the reduction in variability of gap gene expression as well as shiftsin the position of posterior gap gene domains are the result of the actions of attractors in the gap gene dynamical system.Two biologically distinct dynamical regions exist in the early embryo, separated by a bifurcation at 53% egg length. In theanterior region, reduction in variation occurs because of stability induced by point attractors, while in the posterior, thestability of the developmental trajectory arises from a one-dimensional attracting manifold. This manifold also controls apreviously characterized anterior shift of posterior region gap domains. Our analysis shows that the complex phenomena ofcanalization and pattern formation in the Drosophila blastoderm can be understood in terms of the qualitative features ofthe dynamical system. The result confirms the idea that attractors are important for developmental stability and shows aricher variety of dynamical attractors in developmental systems than has been previously recognized.
Citation: Manu, Surkova S, Spirov AV, Gursky VV, Janssens H, et al. (2009) Canalization of Gene Expression and Domain Shifts in the Drosophila Blastoderm byDynamical Attractors. PLoS Comput Biol 5(3): e1000303. doi:10.1371/journal.pcbi.1000303
Editor: Stanislav Shvartsman, Princeton University, United States of America
Received October 30, 2008; Accepted January 23, 2009; Published March 13, 2009
Copyright: � 2009 Manu et al. This is an open-access article distributed under the terms of the Creative Commons Attribution License, which permitsunrestricted use, distribution, and reproduction in any medium, provided the original author and source are credited.
Funding: This work was supported by grant RR07801 from the US NIH, GM072022 jointly from the US NIH and NSF, CRDF GAP Awards RBO-1286 and RUB1-1578,contract 02.467.11.1005 from the FASI of the RF, project 047.011.2004.013 of the NWO-RBFR, and grants 08-01-00315a and 08-04-00712a of the RBFR.
Competing Interests: The authors have declared that no competing interests exist.
* E-mail: [email protected]
. These authors contributed equally to this work.
Introduction
Canalization refers to the constancy of the wild type phenotype
under varying developmental conditions [1–4]. In order to explain
canalization, C. H. Waddington hypothesized that there must only
be a finite number of distinct developmental trajectories possible,
since cells make discrete fate decisions, and that each such
trajectory, called a chreod, must be stable against small perturbations
[5]. One aspect of canalization, the buffering of phenotypic
variability against genotypic variability in wild type, has received
considerable experimental [2,6–10] and theoretical [11–13]
attention. The phenomenon of canalization of genotypic and
environmental variation was seen by Waddington as a consequence
of the underlying stability of developmental trajectories, an idea
supported by theoretical analysis [13]. But this central idea of
Waddington’s has heretofore received little attention in real
developmental systems because of a lack of relevant quantitative
molecular data. The further investigation of Waddington’s
hypothesis is of great importance because it provides a scientific
connection between the reliability and invariance of the formation
of cell types and tissues in the face of underlying molecular
variability, as we now explain.
Quantitative molecular data permitting the study of develop-
mental canalization are now available for the segment determi-
nation process in Drosophila [14]. The segmented body plan of the
fruit fly Drosophila melanogaster is determined when the embryo is a
blastoderm [15] by the segmentation genes [16]. Quantitative
spatiotemporal gene expression data show that the maternal
protein gradients and the early expression patterns of the zygotic
gap and pair-rule genes vary a great deal from embryo to embryo
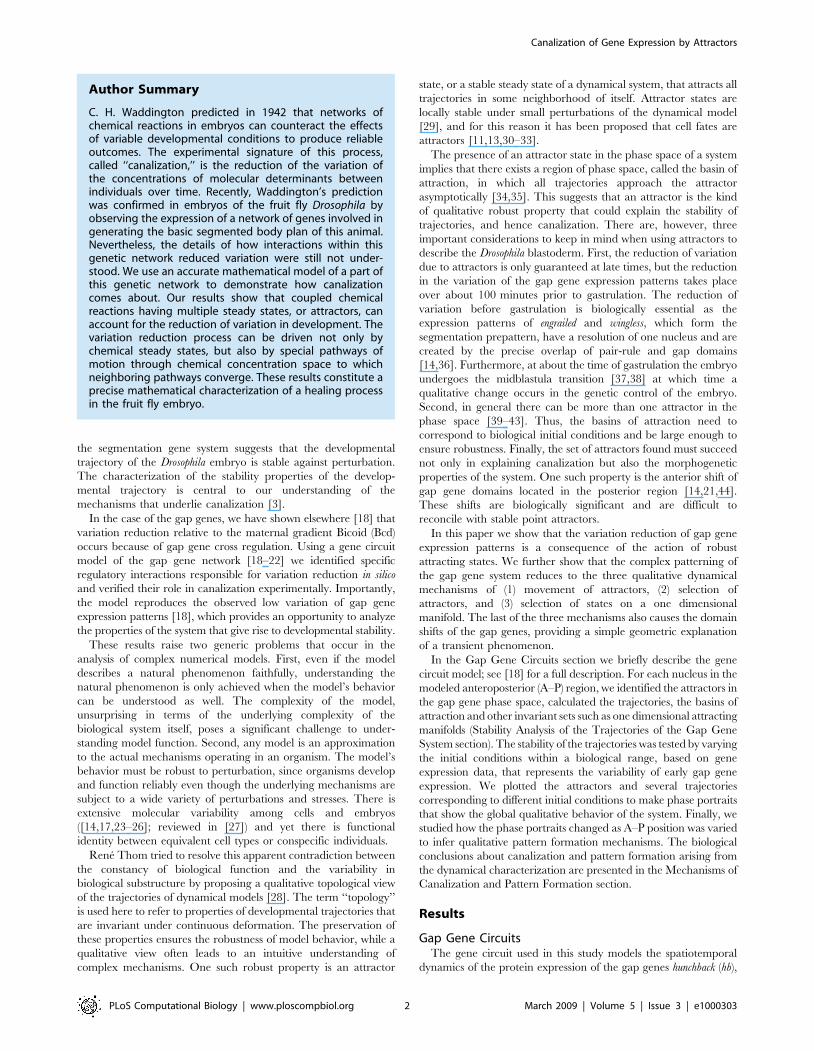
[14,17]. The variation of the expression patterns of the gap and
pair-rule genes decreases over time so that it is significantly
lowered by the onset of gastrulation at the end of cellularization
([14], Fig. 1). The observed reduction of variability over time in
PLoS Computational Biology | www.ploscompbiol.org 1 March 2009 | Volume 5 | Issue 3 | e1000303
the segmentation gene system suggests that the developmental
trajectory of the Drosophila embryo is stable against perturbation.
The characterization of the stability properties of the develop-
mental trajectory is central to our understanding of the
mechanisms that underlie canalization [3].
In the case of the gap genes, we have shown elsewhere [18] that
variation reduction relative to the maternal gradient Bicoid (Bcd)
occurs because of gap gene cross regulation. Using a gene circuit
model of the gap gene network [18–22] we identified specific
regulatory interactions responsible for variation reduction in silico
and verified their role in canalization experimentally. Importantly,
the model reproduces the observed low variation of gap gene
expression patterns [18], which provides an opportunity to analyze
the properties of the system that give rise to developmental stability.
These results raise two generic problems that occur in the
analysis of complex numerical models. First, even if the model
describes a natural phenomenon faithfully, understanding the
natural phenomenon is only achieved when the model’s behavior
can be understood as well. The complexity of the model,
unsurprising in terms of the underlying complexity of the
biological system itself, poses a significant challenge to under-
standing model function. Second, any model is an approximation
to the actual mechanisms operating in an organism. The model’s
behavior must be robust to perturbation, since organisms develop
and function reliably even though the underlying mechanisms are
subject to a wide variety of perturbations and stresses. There is
extensive molecular variability among cells and embryos
([14,17,23–26]; reviewed in [27]) and yet there is functional
identity between equivalent cell types or conspecific individuals.
Rene Thom tried to resolve this apparent contradiction between
the constancy of biological function and the variability in
biological substructure by proposing a qualitative topological view
of the trajectories of dynamical models [28]. The term ‘‘topology’’
is used here to refer to properties of developmental trajectories that
are invariant under continuous deformation. The preservation of
these properties ensures the robustness of model behavior, while a
qualitative view often leads to an intuitive understanding of
complex mechanisms. One such robust property is an attractor
state, or a stable steady state of a dynamical system, that attracts all
trajectories in some neighborhood of itself. Attractor states are
locally stable under small perturbations of the dynamical model
[29], and for this reason it has been proposed that cell fates are
attractors [11,13,30–33].
The presence of an attractor state in the phase space of a system
implies that there exists a region of phase space, called the basin of
attraction, in which all trajectories approach the attractor
asymptotically [34,35]. This suggests that an attractor is the kind
of qualitative robust property that could explain the stability of
trajectories, and hence canalization. There are, however, three
important considerations to keep in mind when using attractors to
describe the Drosophila blastoderm. First, the reduction of variation
due to attractors is only guaranteed at late times, but the reduction
in the variation of the gap gene expression patterns takes place
over about 100 minutes prior to gastrulation. The reduction of
variation before gastrulation is biologically essential as the
expression patterns of engrailed and wingless, which form the
segmentation prepattern, have a resolution of one nucleus and are
created by the precise overlap of pair-rule and gap domains
[14,36]. Furthermore, at about the time of gastrulation the embryo
undergoes the midblastula transition [37,38] at which time a
qualitative change occurs in the genetic control of the embryo.
Second, in general there can be more than one attractor in the
phase space [39–43]. Thus, the basins of attraction need to
correspond to biological initial conditions and be large enough to
ensure robustness. Finally, the set of attractors found must succeed
not only in explaining canalization but also the morphogenetic
properties of the system. One such property is the anterior shift of
gap gene domains located in the posterior region [14,21,44].
These shifts are biologically significant and are difficult to
reconcile with stable point attractors.
In this paper we show that the variation reduction of gap gene
expression patterns is a consequence of the action of robust
attracting states. We further show that the complex patterning of
the gap gene system reduces to the three qualitative dynamical
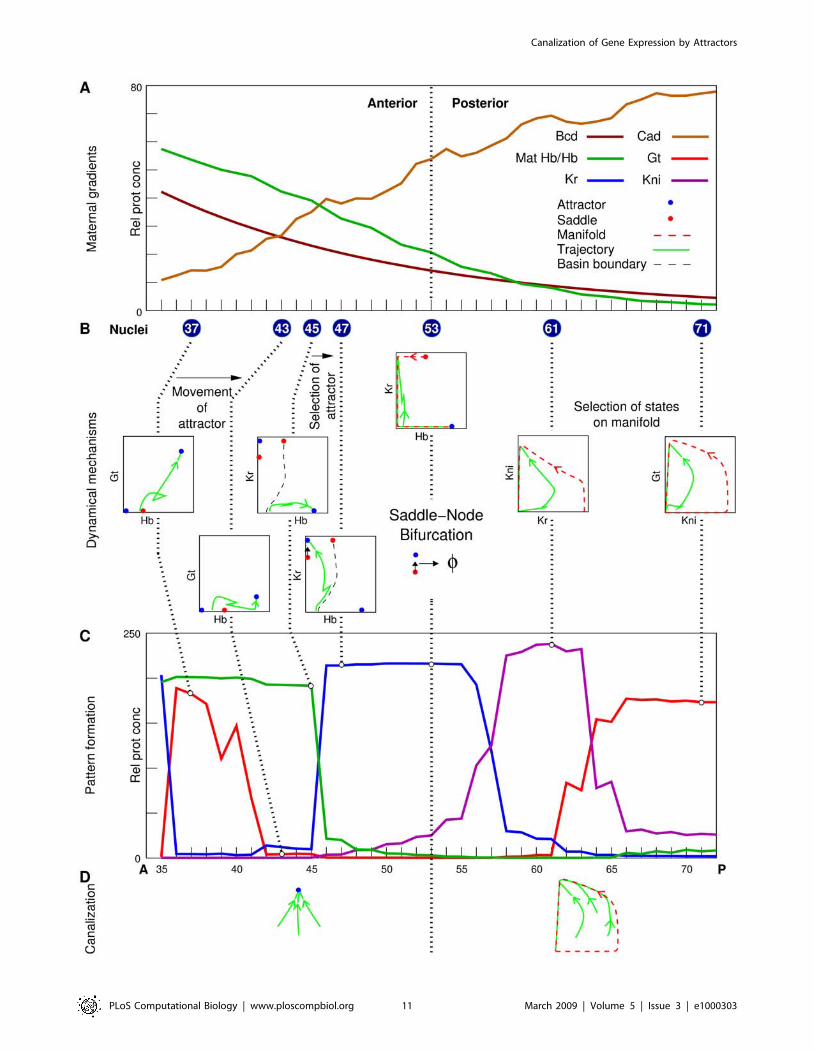
mechanisms of (1) movement of attractors, (2) selection of
attractors, and (3) selection of states on a one dimensional
manifold. The last of the three mechanisms also causes the domain
shifts of the gap genes, providing a simple geometric explanation
of a transient phenomenon.
In the Gap Gene Circuits section we briefly describe the gene
circuit model; see [18] for a full description. For each nucleus in the
modeled anteroposterior (A–P) region, we identified the attractors in
the gap gene phase space, calculated the trajectories, the basins of
attraction and other invariant sets such as one dimensional attracting
manifolds (Stability Analysis of the Trajectories of the Gap Gene
System section). The stability of the trajectories was tested by varying
the initial conditions within a biological range, based on gene
expression data, that represents the variability of early gap gene
expression. We plotted the attractors and several trajectories
corresponding to different initial conditions to make phase portraits
that show the global qualitative behavior of the system. Finally, we
studied how the phase portraits changed as A–P position was varied
to infer qualitative pattern formation mechanisms. The biological
conclusions about canalization and pattern formation arising from
the dynamical characterization are presented in the Mechanisms of
Canalization and Pattern Formation section.
Results
Gap Gene CircuitsThe gene circuit used in this study models the spatiotemporal
dynamics of the protein expression of the gap genes hunchback (hb),
Author Summary
C. H. Waddington predicted in 1942 that networks ofchemical reactions in embryos can counteract the effectsof variable developmental conditions to produce reliableoutcomes. The experimental signature of this process,called ‘‘canalization,’’ is the reduction of the variation ofthe concentrations of molecular determinants betweenindividuals over time. Recently, Waddington’s predictionwas confirmed in embryos of the fruit fly Drosophila byobserving the expression of a network of genes involved ingenerating the basic segmented body plan of this animal.Nevertheless, the details of how interactions within thisgenetic network reduced variation were still not under-stood. We use an accurate mathematical model of a part ofthis genetic network to demonstrate how canalizationcomes about. Our results show that coupled chemicalreactions having multiple steady states, or attractors, canaccount for the reduction of variation in development. Thevariation reduction process can be driven not only bychemical steady states, but also by special pathways ofmotion through chemical concentration space to whichneighboring pathways converge. These results constitute aprecise mathematical characterization of a healing processin the fruit fly embryo.
Canalization of Gene Expression by Attractors
PLoS Computational Biology | www.ploscompbiol.org 2 March 2009 | Volume 5 | Issue 3 | e1000303
Kruppel (Kr), giant (gt), and knirps (kni) during the last two cleavage
cycles (13 and 14A) before gastrulation [37] in the Drosophila
blastoderm. The protein products of these genes localize to nuclei
[45–48] so that the state variables are the concentrations of the
proteins in a one dimensional row of nuclei along the A–P axis of
the blastoderm. The concentration of the ath protein in the ith
nucleus at time t is denoted by vai tð Þ. In the model we considered a
region, from 35% to 92% egg lenth (EL) along the A–P axis, which
corresponds approximately to the region of the blastoderm fated to
form the segmented part of the adult body [49,50].
The gap genes are expressed in broad domains (Fig. 2A,B; [14])
under the control of maternal cues. The anterior maternal system
acts primarily through the protein gradient Bcd [51–53] which is
essentially stationary and has an exponential profile (Fig. 2C;
[14,51,54]) during the modeled time period. The posterior
maternal system is represented by the maternal Hb gradient
(Fig. 2C; [55–57]). The terminal system regulates gap gene
expression by activating tailless (tll) and huckebein (hkb) [58–61]. The
terminal system is represented in the model by the Tll gradient,
which is expressed posterior to 80% EL in the modeled region
during cycles 13 and 14 ([14] and Fig. S1B). tll is considered
upstream of the gap genes since its expression pattern is
unchanged in gap gene mutants [62]. The concentration of Bcd
in nucleus i is denoted by vBcdi and was determined using Bcd data
from a representative cycle 13 embryo by an exponential fit, so
that vBcdi ~A exp {lið Þ (see [18] for details). The concentrations
of Tll and another upstream regulator, Caudal (Cad) [63,64], were
determined by interpolating average data in time [18]. The
concentrations of Tll and Cad are denoted by vTlli tð Þ and vCad
i tð Þrespectively, with an explicit dependence on time, since these
gradients are not stationary (Fig. S1).
The dynamical equations governing vai are given by
dvai
dt~Rag
XN
b~1
Tabvbi zmavBcd
i zXNe
b~1
Eabvbi tð Þzha
!
zDa vai{1{va
i
� �z va
iz1{vai
� �� �{lava
i ,
ð1Þ
where a[1, . . . ,N and i[1, . . . ,M in a gene circuit with N genes
Figure 1. Reduction of variation in segmentation gene expression patterns over time. Kr and gt expression patterns 47 min (A, early) and3 min (B, late) before gastrulation. ftz expression patterns 34 min (C, early) and 3 min (D, late) before gastrulation. The expression patterns shownhere and subsequently are from the middle 10% of dorsoventral positional values; 0% egg length (EL) is the anterior pole. The standard deviation (s)of expression level at the peak of the central Kr domain is 33.0 early (N~15 embryos), and reduces to 17.4 late (N~24). The position of the domainpeak has s~1:9 early and s~1:0 late. The expression level at the peak of the gt posterior domain has s~24:5 early (N~19), and s~15:4 late(N~21). The position of the domain peak has s~2:5 early and s~1:2 late. The expression pattern of ftz has extensive qualitative variation early(panel C, N~7), but is very reproducible just before gastrulation (panel D, N~17). Embryos with the most diverse patterns of ftz were chosen forpanel C, while they were randomly chosen for all other panels.doi:10.1371/journal.pcbi.1000303.g001
Canalization of Gene Expression by Attractors
PLoS Computational Biology | www.ploscompbiol.org 3 March 2009 | Volume 5 | Issue 3 | e1000303
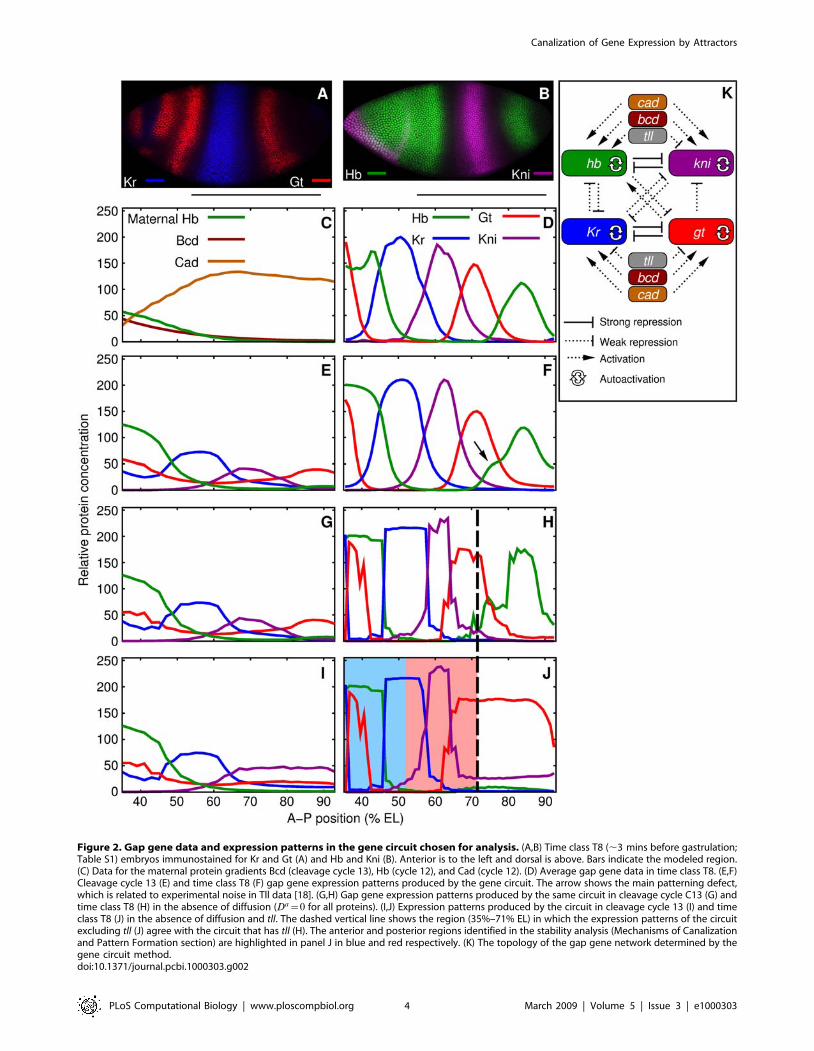
Figure 2. Gap gene data and expression patterns in the gene circuit chosen for analysis. (A,B) Time class T8 (,3 mins before gastrulation;Table S1) embryos immunostained for Kr and Gt (A) and Hb and Kni (B). Anterior is to the left and dorsal is above. Bars indicate the modeled region.(C) Data for the maternal protein gradients Bcd (cleavage cycle 13), Hb (cycle 12), and Cad (cycle 12). (D) Average gap gene data in time class T8. (E,F)Cleavage cycle 13 (E) and time class T8 (F) gap gene expression patterns produced by the gene circuit. The arrow shows the main patterning defect,which is related to experimental noise in Tll data [18]. (G,H) Gap gene expression patterns produced by the same circuit in cleavage cycle C13 (G) andtime class T8 (H) in the absence of diffusion (Da~0 for all proteins). (I,J) Expression patterns produced by the circuit in cleavage cycle 13 (I) and timeclass T8 (J) in the absence of diffusion and tll. The dashed vertical line shows the region (35%–71% EL) in which the expression patterns of the circuitexcluding tll (J) agree with the circuit that has tll (H). The anterior and posterior regions identified in the stability analysis (Mechanisms of Canalizationand Pattern Formation section) are highlighted in panel J in blue and red respectively. (K) The topology of the gap gene network determined by thegene circuit method.doi:10.1371/journal.pcbi.1000303.g002
Canalization of Gene Expression by Attractors
PLoS Computational Biology | www.ploscompbiol.org 4 March 2009 | Volume 5 | Issue 3 | e1000303
and M nuclei. The first term on the right hand side of Eq. (1)
represents protein synthesis, the second one represents protein
transport through Fickian diffusion and the last term represents
first-order protein degradation. The diffusion constant, Da varies
inversely with squared internuclear distance, and la is the
degradation rate. The synthesis term is set to zero during the
mitosis preceding the thirteenth nuclear division as synthesis
shuts down [65]. Following this mitosis, the nuclei are divided and
daughter nuclei are given the same state as the mother nucleus.
Ra is the maximum synthesis rate, and
g uð Þ~ 12
u. ffiffiffiffiffiffiffiffiffiffiffiffi
u2z1p� �
z1h i
is a sigmoidal regulation-expression
function. The first term in the argument of g represents the
transcriptional cross regulation between the gap genes and the
genetic interconnectivity is specified by the matrix T . Positive
elements of T imply activation while negative ones imply
repression. The regulation of the gap genes by Bcd is represented
in the second term and ma is the regulatory strength. The
regulation of the gap genes by upstream time-varying inputs is
represented in the third term and Ne is the number of such inputs.
There are two such inputs in this model, Cad and Tll, and the
elements of the matrix E have the same meaning as those of T .
The last term, ha, represents the effect of ubiquitous transcription
factors and sets the threshold of activation.
The initial conditions for Hb are specified using cleavage cycle
12 data. Cycle 12 data are a good approximation to the maternal
Hb gradient since the zygotic expression of hb appears to begin in
cleavage cycle 13 [17]. The initial conditions for Kr, Gt, and Kni
are taken to be zero, since their protein expression is first detected
in cycle 13 [14,61,66–68].
The gene circuit’s parameters were determined by performing a
least-squares fit to a time series of averaged gap gene data [14]
using the Parallel Lam Simulated Annealing algorithm (see
Methods). This time series has nine points (time classes; see Table
S1), one in cycle 13 and the rest in cycle 14A. The output of the
gene circuit (Fig. 2E,F) fits the data (Fig. 2D) well and its network
topology (Fig. 2K) is consistent with previous results (see [18] for
discussion and parameters).
Stability Analysis of the Trajectories of the Gap GeneSystem
In order to characterize the stability of the trajectories of the gap
gene system in terms of qualitatively robust features like attractors,
we apply the tools of dynamical systems theory [34,69]. Since the
gene circuit has M|N variables (Gap Gene Circuits section) its
state is represented as a point in an M|N-dimensional
concentration space, or phase space. In general the concentrations
of gap proteins change with time, and hence, a solution of the gene
circuit is a curve in this phase space. The gene circuit can also
have solutions which do not change with time. Such a solution,
called an equilibrium or steady state solution, is represented as a
single point in phase space. The positions of the equilibrium
solutions in phase space and their stability properties determine
the stability of a general time varying solution of the gene circuit.
The reader not familiar with linear analysis near an equilibrium
point should see Protocol S2 for a pedagogical description of
equilibria and their stability in two dimensions.
Diffusionless approximation. In the gap gene circuit used
in this study (Gap Gene Circuits section), there are 58 nuclei and 4
gap genes, giving rise to a dynamical system having 232
dimensions. Such a large number of dimensions pose a
significant challenge to visualizing the results of the phase space
analysis. In order to make the analysis tractable, we made the
approximation that there is no diffusion, Da~0 in Eq. (1), while
keeping all other parameters in Eq. (1) at their original values [18].
This uncouples the nuclei and the system of M|N coupled ODEs
reduces to a set of M independent systems of N ODEs. Eq. (1)
thus becomes
dva x,tð Þdt
~RagXN
b~1
Tabvb x,tð ÞzmavBcd xð Þ
zXNe
b~1
Eabvb x,tð Þzha
!{lava x,tð Þ,
ð2Þ
where the dependence of the concentrations of gap gene proteins,
Bcd and time varying external inputs on the location of nucleus i
along the A–P axis is denoted by x.
In the absence of diffusion, the model still gives the correct
sequence of gap gene domains (Fig. 2G,H); and the border
positions are close to their values in the presence of diffusion
(Table S2). In contrast to the circuit with diffusion however, the
domains have sharp boundaries and have little or no overlap
(Fig. 2H). The general agreement between the circuits with and
without diffusion allows the analysis of the reduced system and
supports the result from earlier work [21] that diffusion is not
required for making gap gene expression patterns.
In Eq. (2), the terms vBcd xð Þ, vCad x,tð Þ, and vTll x,tð Þ represent
the anterior and terminal maternal systems. They parametrize the
set of solutions possible in each nucleus as a function of A–P
position. From the set of solutions specified by the concentrations
of Bcd, Cad, and Tll, a particular solution is chosen by the initial
conditions specified by the concentration of maternal Hb (Gap
Gene Circuits section; Fig. 2C). Therefore the posterior maternal
system specifies position in a manner distinct from the anterior and
terminal systems. We further simplified the analysis by neglecting
the effects of Tll in Eq. (2), giving
dva
dt~Rag
XN
b~1
TabvbzmavBcd xð Þ
zEa/CadvCad x,tð Þzha
!{lava:
ð3Þ
The gap gene expression patterns (Fig. 2I,J) produced by Eq. (3)
agree with a model that includes tll (Eq. 2) until 71% EL, therefore
the simplified analysis is valid in the region from 35% EL to 71%
EL.
Equilibria, stability, and bifurcations. We considered
each nucleus in cleavage cycle 13 and its posterior daughter in
cycle 14A since the anterior daughter differs only slightly from the
posterior one in the concentrations of Bcd and Cad. For simplicity
we refer to mother-daughter pairs by the daughter nuclei, which
are located at odd numbered positions from 35% to 71% EL. For
each nucleus we determined the equilibria and, based on maternal
Hb data (Fig. 2C), the family of solutions corresponding to the
observed range of initial conditions. The concentration of Cad
(vCad x,tð Þ) varies with time (Fig. S1A), implying that the equilibria
in the phase space of a nucleus also change with time. We are
interested in studying the properties of the solutions during late
cycle 14A, since the variation in gap gene expression levels is least
in that time period (Fig. 1). Also, the stationary approximation for
Bcd is valid until time class T6 (,16 mins before gastrulation;
Table S1) as Bcd concentration decreases two-fold afterward [14].
For these reasons, we calculated equilibria at time class T6
Canalization of Gene Expression by Attractors
PLoS Computational Biology | www.ploscompbiol.org 5 March 2009 | Volume 5 | Issue 3 | e1000303
(Protocol S1: Eq. S3). The trajectories were calculated using time
varying Cad data until time class T6 and with T6 Cad data
thereafter (Protocol S1: Eq. S1) so that their late time behavior
corresponded to the calculated equilibria.
The equilibria were calculated using the Newton-Raphson
method [70,71] and classified according to their stability (Protocol
S3). We calculated several trajectories with different initial
conditions to test variation reduction and stability, and continued
the integration of Eq. (S1) (Protocol S1) to very late times in order
to visualize asymptotic behavior. Since the segments are
determined by the time of gastrulation, significant variation
reduction must occur beforehand for the precise specification of
position. Hence, we distinguish the biological behavior from
asymptotic behavior graphically. We found that each nucleus has
multiple attractors and that its trajectory can potentially approach
any one depending on the initial condition. It was necessary,
therefore, to characterize the basins of attraction [34,69] of the
attractors. We exploited the fact that only Hb has non-zero initial
conditions (Gap Gene Circuits section) to characterize the basins
as intervals on the Hb axis (see Protocol S3 for details of
calculation). We also calculated one dimensional unstable
manifolds [72] of saddle points to better understand the transient
behavior of solutions (Protocol S3).
The analysis of the phase space for different nuclei revealed
several A–P positions at which the set of equilibria changes. This
suggests that the dynamical system is undergoing bifurcations
resulting from the changing values of its parameters, the
concentrations of Bcd and Cad, as A–P position is varied. Since
we used Cad data in Eq. (3), it is also possible that these
bifurcations are artifacts caused by fluctuations in the data. We
verified that the changes observed in the analysis at discrete odd
numbered positions were actual bifurcations by varying the
concentrations of Bcd and Cad, parametrized by the A–P position,
continuously (Protocol S4). This was done by interpolating the
Cad data with a cubic polynomial (Fig. S3). Note that the Bcd
concentration profile has already been parametrized as a function
of position (vBcd xð Þ~A exp {lxð Þ; Gap Gene Circuits section),
and can be varied continuously. The continuous analysis validated
all the bifurcations at discrete locations (Fig. 3A and Fig. S4;
circles) save for two. These two bifurcations (Fig. 3A; boxes) could
not be observed in the analysis at discrete locations as they occur
consecutively between two nuclei and leave the set of equilibria
unchanged. Although the bifurcations occur at particular values of
the concentrations of Bcd and Cad, subsequently we will refer to
them by A–P position for simplicity.
We further characterized the type of bifurcations (Protocol S4).
Though many types of bifurcations are possible only one type, the
saddle-node (see Fig. S2 for illustration in two dimensions), occurs
in the gap gene system. In the four-dimensional gap gene system
any creation or annihilation of a pair of equilibria that differ in the
sign of one eigenvalue is a saddle-node bifurcation (Fig. 3A and
Fig. S4).
Mechanisms of Canalization and Pattern FormationBased on the analysis in the previous section the region of
interest, from 35% EL to 71% EL, can be divided into an anterior
and a posterior region (Fig. 2J) having distinct modes of
canalization and pattern formation. The two regions are separated
by a saddle-node bifurcation that occurs at 53% EL (Fig. 3A), that
is, at the peak of the central Kr domain.
We next demonstrate that in the anterior region (Fig. 2J), which
extends from the peak of the third anterior gt domain to the peak
of the central Kr domain, the state of a nucleus at gastrulation is
close to a point attractor. The trajectories are stable by virtue of
being in the basin of attraction of the nucleus’s attractor state and
hence canalize. Pattern formation occurs by the selection of one
state from many in a multistable phase space. The concentrations
of the Bcd and Cad gradients control pattern formation in the
anterior by determining the sizes of the basins and the positions of
the attractors, while maternal Hb concentration selects a
particular attractor by setting the starting point in its basin.
Previous experimental [73] and theoretical [19] work suggested
that Bcd and maternal Hb patterned the anterior of the embryo
synergistically; our results identify specific roles for Bcd and Hb in
anterior patterning.
The posterior region extends from the peak of the central Kr
domain to the peak of the posterior gt domain (Fig. 2J) and its
nuclei have phase spaces with very different properties. In this
region, the state of the nucleus is far from any attractor state at
gastrulation. Instead the state of a nucleus is close to a one-
dimensional manifold and canalization is achieved due to
attraction by this manifold. Even though the phase space is
multistable, the biological range of maternal Hb concentrations
in the posterior region place all nuclear trajectories in one basin
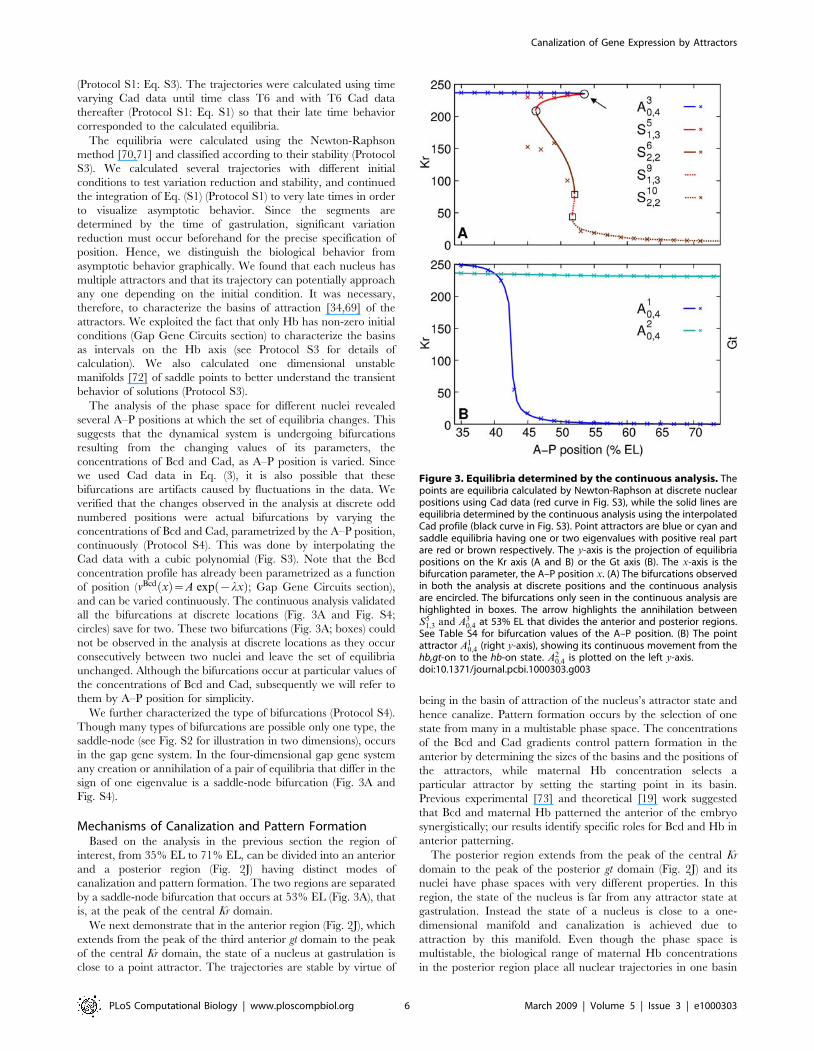
Figure 3. Equilibria determined by the continuous analysis. Thepoints are equilibria calculated by Newton-Raphson at discrete nuclearpositions using Cad data (red curve in Fig. S3), while the solid lines areequilibria determined by the continuous analysis using the interpolatedCad profile (black curve in Fig. S3). Point attractors are blue or cyan andsaddle equilibria having one or two eigenvalues with positive real partare red or brown respectively. The y-axis is the projection of equilibriapositions on the Kr axis (A and B) or the Gt axis (B). The x-axis is thebifurcation parameter, the A–P position x. (A) The bifurcations observedin both the analysis at discrete positions and the continuous analysisare encircled. The bifurcations only seen in the continuous analysis arehighlighted in boxes. The arrow highlights the annihilation betweenS5
1,3 and A30,4 at 53% EL that divides the anterior and posterior regions.
See Table S4 for bifurcation values of the A–P position. (B) The pointattractor A1
0,4 (right y-axis), showing its continuous movement from thehb,gt-on to the hb-on state. A2
0,4 is plotted on the left y-axis.doi:10.1371/journal.pcbi.1000303.g003
Canalization of Gene Expression by Attractors
PLoS Computational Biology | www.ploscompbiol.org 6 March 2009 | Volume 5 | Issue 3 | e1000303
of attraction. As a consequence, the modes of pattern formation
operative in the anterior cannot function in the posterior.
Maternal Hb patterns the posterior by determining the position
on the attracting manifold which a particular trajectory reaches
by the time of gastrulation. These results reveal the mechanism
by which maternal Hb acts as a morphogen in the posterior
[73–75] and also explain the dynamical shifts of gap gene
domains [14,21], a significant biological property of the
posterior region.
We begin the presentation of detailed results by describing the
phase spaces of typical nuclei in the two regions, highlighting
mechanisms for canalization and pattern formation. An equilib-
rium is labeled by either A (point attractor) or S (saddle
equilibrium), denoted by a superscript, with subscripts denoting
the number of eigenvalues having positive or negative real parts.
For example S21,3 denotes the second saddle equilibrium in the
modeled region which has one eigenvalue with positive real part
and three with negative real parts. Equilibria are also given
descriptive names based on which proteins are at high levels (on)
ignoring the proteins that are at low levels. For example, if a point
attractor is at hb-on, Kr-off, gt-on, and kni-off, it is referred to as the
‘‘hb,gt-on’’ attractor.
The anterior region. Fig. 4A shows the phase portrait of the
nucleus at 37% EL from the anterior region. Since the phase space
is four-dimensional, a three-dimensional projection onto the Hb-
Kr-Gt axes is shown (see Fig. S6 for other projections). There are
three attractors, A10,4 (hb,gt-on), A2
0,4 (hb,Kr-on), and A30,4 (Kr-on)
shown in blue. Two saddle equilibria, S11,3 and S2
1,3, are shown in
red. Saddle equilibria that are unimportant for the dynamics are
not shown (see Protocol S5 and Table S4). In order to show the
family of trajectories allowed by the values of Bcd and Cad
concentrations in this nucleus, trajectories are plotted with starting
points distributed uniformly on the Hb axis between 0–100,
corresponding to the observed range of maternal Hb in the
modeled region [14]. Time is represented as a color gradient along
the trajectories, with the start of cycle 13 green, and gastrulation
red. Trajectories are blue after gastrulation to indicate their
asymptotic behavior.
The red-to-blue transition on the trajectories occurs very close
to the attractors (Fig. 4A) implying that the nucleus is close to
equilibrium at gastrulation. It is apparent by visual inspection that
the initial variation of the trajectories is reduced dramatically by
the onset of gastrulation, that is, trajectories are stable due to the
point attractor. To verify this property numerically, we construct-
ed a four-dimensional box such that its dimensions corresponded
to the range of gap protein concentrations observed in cycle 13
and its volume represented initial variation. We then calculated
the time evolution of the volume of this box using the model
(Fig. 4C; see Protocol S8 for details of calculation). Variation in the
concentration of each protein shrinks by a factor of ,20 on
average by gastrulation, confirming the stability of the develop-
mental trajectory.
The concentration of maternal Hb, depending on which basin
of attraction it lies in, selects a particular attractor state. The
boundaries between the basins of attraction of the three attractors
are indicated by arrows in Fig. 4A (see Protocol S5 for details). The
concentration of maternal Hb in the nucleus at 37% EL puts it in
the basin of the hb,gt-on (A10,4) attractor (Table 1). This analysis
correctly accounts for the observed gap gene expression in the
nucleus, which lies at the peak of the third anterior gt domain and
in the anterior hb domain (Fig. 2F,H). Posterior to this nucleus and
up to 45% EL, all nuclei remain in the basin of the A10,4 attractor
(Table 1). A10,4 changes its position in the phase space from hb,gt-on
at 37% EL to hb-on at 43% EL (Table 1 and Fig. 3B). The
posterior border of the third anterior gt domain therefore forms by
the movement of A10,4 in the phase space. Since the Bcd and Cad
concentrations are the only parameters being varied, the
movement of an attractor is one mechanism by which Bcd
patterns the anterior.
The nucleus at 47% EL is in the basin of the Kr-on (A30,4)
attractor, unlike the nuclei to its anterior, which are in the basin of
hb-on (Table 1). The switch from hb-on to Kr-on causes the
formation of the posterior border of the anterior hb domain and
the anterior border of the central Kr domain between 45% EL and
47% EL (Fig. 2F,H). This happens due to 1) an increase in the size
of the basin of the Kr-on attractor and 2) a decrease in the
concentration of maternal Hb (second and fifth columns of
Table 1). As is the case with the movement of the A10,4 attractor,
the first effect is due to the changing value of Bcd concentration.
Hence, Bcd and maternal Hb pattern the anterior region in
tandem [19,73]; Bcd has the role of setting attractor positions and
the extent of basins and maternal Hb selects a particular basin.
A bifurcation separating the anterior from the
posterior. The nuclei remain in the basin of the Kr-on
attractor up to 53% EL, where a saddle-node bifurcation
annihilates Kr-on (Fig. 3A). Although there are other bifurcations
in the A–P region considered (Table S3), only this bifurcation
affects the dynamics of the gap gene system in a significant way.
Posterior to this bifurcation the remaining two attractors hb-on
(A10,4) and hb,Kr-on (A2
0,4) persist to the end of the region being
analysed. No new attractors that might correspond to gap gene
expression domains of the posterior appear, suggesting that the
mechanisms of canalization and pattern formation are different
from the anterior.
The posterior region. Fig. 4B shows the Hb-Kr-Kni
projection (see Fig. S8 for others) of the phase portrait of the
nucleus at 57% EL in the posterior region. There are two
attractors A10,4 (hb-on) and A2
0,4 (hb,Kr-on). Two saddle equilibria,
S11,3 and S2
1,3, are shown, see Protocol S6, Fig. S7, and Table S4
for others. The basin of attraction of A20,4 is very small ((43.99,
44.04)) and is shown with an arrow. The basin of attraction of A10,4
is divided into two intervals by the basin of A20,4. Trajectories right
of the arrow (‘‘direct interval’’) reach close to A10,4 by gastrulation.
Trajectories from the ‘‘indirect interval’’ to the left of the arrow are
not close to the attractor at gastrulation as can be seen from the
red-to-blue transitions. The direct trajectories are nonbiological
since the concentration of maternal Hb (Fig. 2C) in the posterior
region nuclei places all biological trajectories in the indirect
interval.
Although the biological indirect trajectories are not in the
vicinity of an attractor at gastrulation, they appear to be
converging to a single trajectory in the phase space. This
trajectory can be visualized by following the blue (post-gastrula-
tion) segments of the trajectories in Fig. 4B. Therefore the
trajectories are demonstrating stability, which we verified
numerically by calculating the time evolution of a volume
representing initial variation (Fig. 4D). The average variation in
the concentration of each protein reduces by a factor of ,10 by
gastrulation. In order to understand this puzzling stability further,
we calculated the one-dimensional unstable manifolds of the
saddle equilibria S11,3 and S2
1,3. The unstable manifold of S21,3, U2,
is shown as a translucent magenta tube in Fig. 4B. This manifold is
precisely the trajectory to which all indirect trajectories are
converging. Furthermore, the trajectories are close to this manifold
by gastrulation (red-to-blue transitions). Hence this attracting
manifold plays the same role in the posterior as attractors do in the
anterior, and is responsible for the stability of trajectories and
canalization (see also Protocol S7).
Canalization of Gene Expression by Attractors
PLoS Computational Biology | www.ploscompbiol.org 7 March 2009 | Volume 5 | Issue 3 | e1000303
Canalization of Gene Expression by Attractors
PLoS Computational Biology | www.ploscompbiol.org 8 March 2009 | Volume 5 | Issue 3 | e1000303
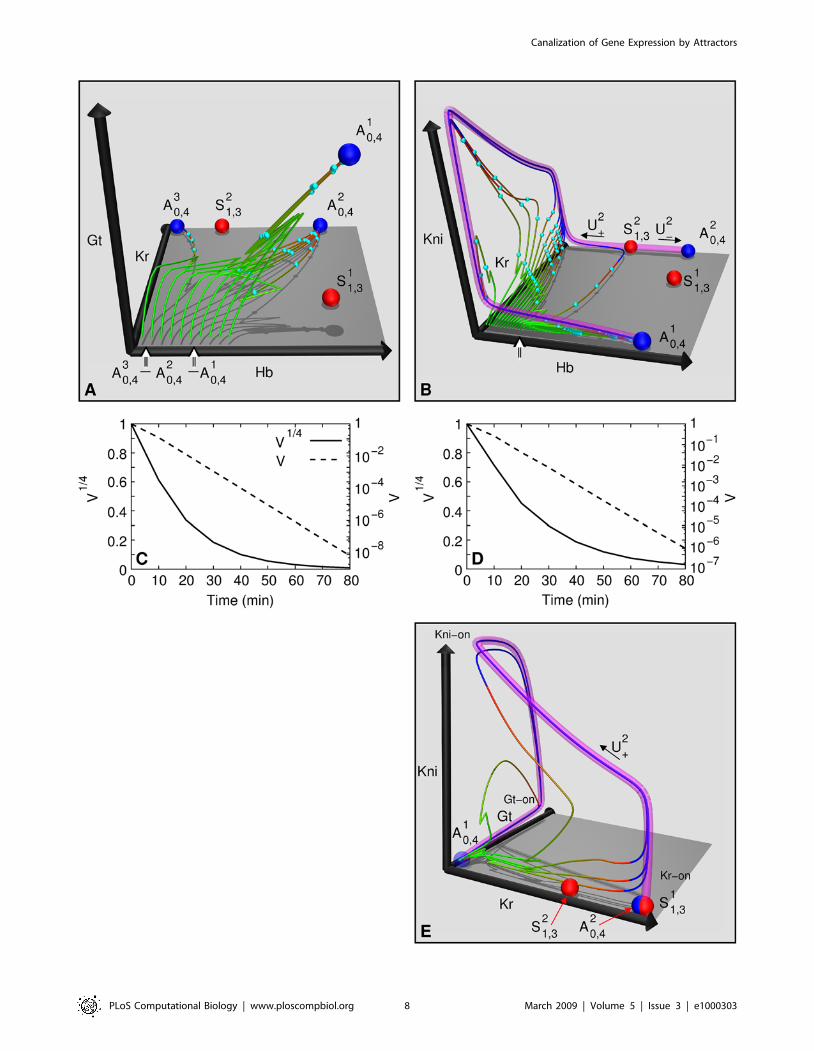
The attracting manifold U2 is also important for pattern
formation in the posterior region. The positions and stability of
equilibria in the phase space are qualitatively the same in all nuclei
of the posterior region. This is a reflection of the relative constancy
of Bcd, which is shallow due to exponential decay with position,
and Cad, which has almost uniform expression in the posterior
region (Fig. 2C; [14]). The invariance of the qualitative properties
of the phase space implies that Bcd does not provide positional
information in the posterior, a result arrived at by different means
in other work [18,21].
In order to understand how pattern formation occurs in the
posterior, it is important to note two properties of the phase space
(Fig. 4B). First, the attracting manifold U2z traverses all the
posterior region states (Kr-on, kni-on, gt-on, and intermediate
values; see Fig. 4E), before reaching A10,4. Second, the state
achieved by an indirect trajectory at gastrulation has a continuous
dependence on initial Hb value. High values of maternal Hb (20–
40) in a nucleus lead to a Kr-on state, intermediate levels (12–20)
lead to a kni-on state and lower values (4–8) lead to a gt-on state.
Since maternal Hb decreases monotonically with A–P position
(Fig. 2C), these two properties lead to the formation of gap gene
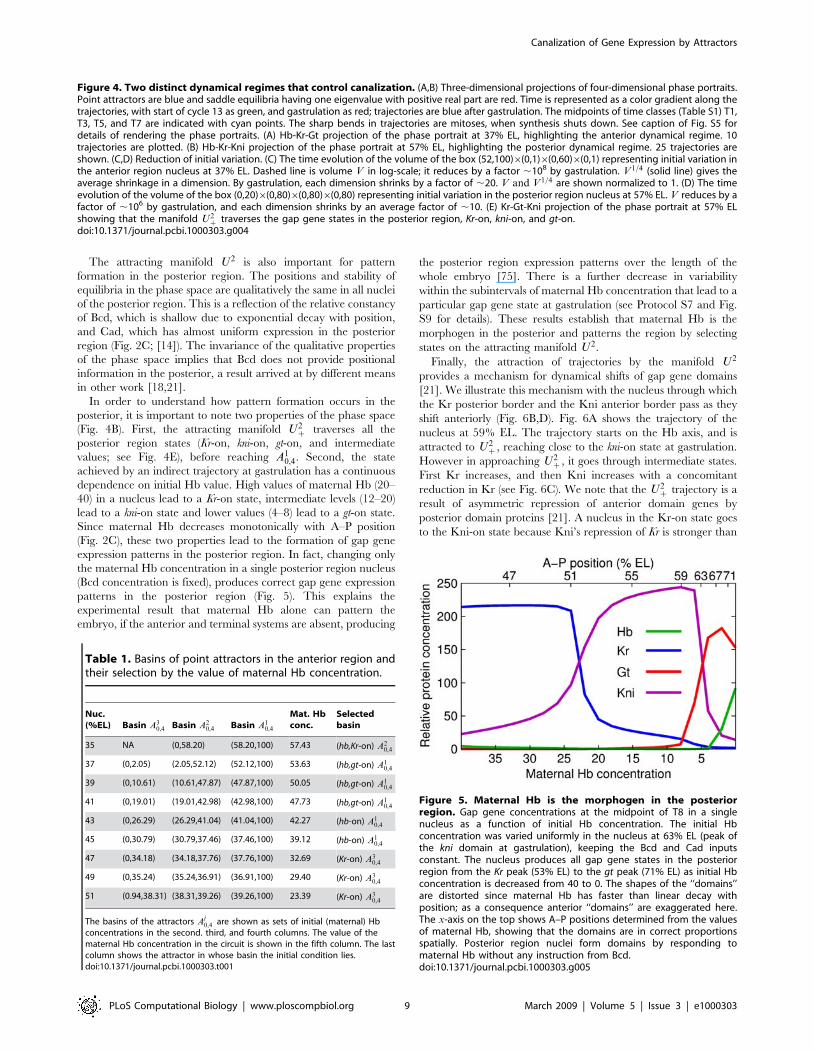
expression patterns in the posterior region. In fact, changing only
the maternal Hb concentration in a single posterior region nucleus
(Bcd concentration is fixed), produces correct gap gene expression
patterns in the posterior region (Fig. 5). This explains the
experimental result that maternal Hb alone can pattern the
embryo, if the anterior and terminal systems are absent, producing
the posterior region expression patterns over the length of the
whole embryo [75]. There is a further decrease in variability
within the subintervals of maternal Hb concentration that lead to a
particular gap gene state at gastrulation (see Protocol S7 and Fig.
S9 for details). These results establish that maternal Hb is the
morphogen in the posterior and patterns the region by selecting
states on the attracting manifold U2.
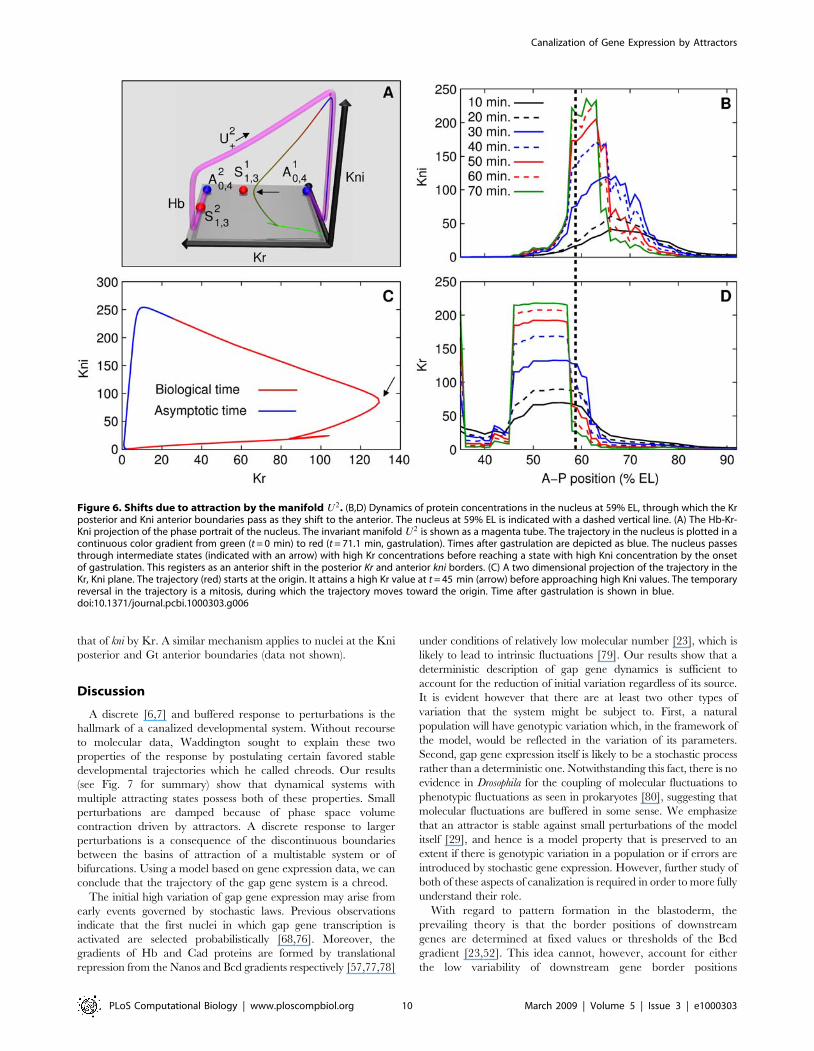
Finally, the attraction of trajectories by the manifold U2
provides a mechanism for dynamical shifts of gap gene domains
[21]. We illustrate this mechanism with the nucleus through which
the Kr posterior border and the Kni anterior border pass as they
shift anteriorly (Fig. 6B,D). Fig. 6A shows the trajectory of the
nucleus at 59% EL. The trajectory starts on the Hb axis, and is
attracted to U2z, reaching close to the kni-on state at gastrulation.
However in approaching U2z, it goes through intermediate states.
First Kr increases, and then Kni increases with a concomitant
reduction in Kr (see Fig. 6C). We note that the U2z trajectory is a
result of asymmetric repression of anterior domain genes by
posterior domain proteins [21]. A nucleus in the Kr-on state goes
to the Kni-on state because Kni’s repression of Kr is stronger than
Table 1. Basins of point attractors in the anterior region andtheir selection by the value of maternal Hb concentration.
Nuc.(%EL) Basin A3
0,4 Basin A20,4 Basin A1
0,4
Mat. Hbconc.
Selectedbasin
35 NA (0,58.20) (58.20,100) 57.43 (hb,Kr-on) A20,4
37 (0,2.05) (2.05,52.12) (52.12,100) 53.63 (hb,gt-on) A10,4
39 (0,10.61) (10.61,47.87) (47.87,100) 50.05 (hb,gt-on) A10,4
41 (0,19.01) (19.01,42.98) (42.98,100) 47.73 (hb,gt-on) A10,4
43 (0,26.29) (26.29,41.04) (41.04,100) 42.27 (hb-on) A10,4
45 (0,30.79) (30.79,37.46) (37.46,100) 39.12 (hb-on) A10,4
47 (0,34.18) (34.18,37.76) (37.76,100) 32.69 (Kr-on) A30,4
49 (0,35.24) (35.24,36.91) (36.91,100) 29.40 (Kr-on) A30,4
51 (0.94,38.31) (38.31,39.26) (39.26,100) 23.39 (Kr-on) A30,4
The basins of the attractors Aj0,4 are shown as sets of initial (maternal) Hb
concentrations in the second. third, and fourth columns. The value of thematernal Hb concentration in the circuit is shown in the fifth column. The lastcolumn shows the attractor in whose basin the initial condition lies.doi:10.1371/journal.pcbi.1000303.t001
Figure 5. Maternal Hb is the morphogen in the posteriorregion. Gap gene concentrations at the midpoint of T8 in a singlenucleus as a function of initial Hb concentration. The initial Hbconcentration was varied uniformly in the nucleus at 63% EL (peak ofthe kni domain at gastrulation), keeping the Bcd and Cad inputsconstant. The nucleus produces all gap gene states in the posteriorregion from the Kr peak (53% EL) to the gt peak (71% EL) as initial Hbconcentration is decreased from 40 to 0. The shapes of the ‘‘domains’’are distorted since maternal Hb has faster than linear decay withposition; as a consequence anterior ‘‘domains’’ are exaggerated here.The x-axis on the top shows A–P positions determined from the valuesof maternal Hb, showing that the domains are in correct proportionsspatially. Posterior region nuclei form domains by responding tomaternal Hb without any instruction from Bcd.doi:10.1371/journal.pcbi.1000303.g005
Figure 4. Two distinct dynamical regimes that control canalization. (A,B) Three-dimensional projections of four-dimensional phase portraits.Point attractors are blue and saddle equilibria having one eigenvalue with positive real part are red. Time is represented as a color gradient along thetrajectories, with start of cycle 13 as green, and gastrulation as red; trajectories are blue after gastrulation. The midpoints of time classes (Table S1) T1,T3, T5, and T7 are indicated with cyan points. The sharp bends in trajectories are mitoses, when synthesis shuts down. See caption of Fig. S5 fordetails of rendering the phase portraits. (A) Hb-Kr-Gt projection of the phase portrait at 37% EL, highlighting the anterior dynamical regime. 10trajectories are plotted. (B) Hb-Kr-Kni projection of the phase portrait at 57% EL, highlighting the posterior dynamical regime. 25 trajectories areshown. (C,D) Reduction of initial variation. (C) The time evolution of the volume of the box (52,100)6(0,1)6(0,60)6(0,1) representing initial variation inthe anterior region nucleus at 37% EL. Dashed line is volume V in log-scale; it reduces by a factor ,108 by gastrulation. V 1=4 (solid line) gives theaverage shrinkage in a dimension. By gastrulation, each dimension shrinks by a factor of ,20. V and V1=4 are shown normalized to 1. (D) The timeevolution of the volume of the box (0,20)6(0,80)6(0,80)6(0,80) representing initial variation in the posterior region nucleus at 57% EL. V reduces by afactor of ,106 by gastrulation, and each dimension shrinks by an average factor of ,10. (E) Kr-Gt-Kni projection of the phase portrait at 57% ELshowing that the manifold U2
z traverses the gap gene states in the posterior region, Kr-on, kni-on, and gt-on.doi:10.1371/journal.pcbi.1000303.g004
Canalization of Gene Expression by Attractors
PLoS Computational Biology | www.ploscompbiol.org 9 March 2009 | Volume 5 | Issue 3 | e1000303
that of kni by Kr. A similar mechanism applies to nuclei at the Kni
posterior and Gt anterior boundaries (data not shown).
Discussion
A discrete [6,7] and buffered response to perturbations is the
hallmark of a canalized developmental system. Without recourse
to molecular data, Waddington sought to explain these two
properties of the response by postulating certain favored stable
developmental trajectories which he called chreods. Our results
(see Fig. 7 for summary) show that dynamical systems with
multiple attracting states possess both of these properties. Small
perturbations are damped because of phase space volume
contraction driven by attractors. A discrete response to larger
perturbations is a consequence of the discontinuous boundaries
between the basins of attraction of a multistable system or of
bifurcations. Using a model based on gene expression data, we can
conclude that the trajectory of the gap gene system is a chreod.
The initial high variation of gap gene expression may arise from
early events governed by stochastic laws. Previous observations
indicate that the first nuclei in which gap gene transcription is
activated are selected probabilistically [68,76]. Moreover, the
gradients of Hb and Cad proteins are formed by translational
repression from the Nanos and Bcd gradients respectively [57,77,78]
under conditions of relatively low molecular number [23], which is
likely to lead to intrinsic fluctuations [79]. Our results show that a
deterministic description of gap gene dynamics is sufficient to
account for the reduction of initial variation regardless of its source.
It is evident however that there are at least two other types of
variation that the system might be subject to. First, a natural
population will have genotypic variation which, in the framework of
the model, would be reflected in the variation of its parameters.
Second, gap gene expression itself is likely to be a stochastic process
rather than a deterministic one. Notwithstanding this fact, there is no
evidence in Drosophila for the coupling of molecular fluctuations to
phenotypic fluctuations as seen in prokaryotes [80], suggesting that
molecular fluctuations are buffered in some sense. We emphasize
that an attractor is stable against small perturbations of the model
itself [29], and hence is a model property that is preserved to an
extent if there is genotypic variation in a population or if errors are
introduced by stochastic gene expression. However, further study of
both of these aspects of canalization is required in order to more fully
understand their role.
With regard to pattern formation in the blastoderm, the
prevailing theory is that the border positions of downstream
genes are determined at fixed values or thresholds of the Bcd
gradient [23,52]. This idea cannot, however, account for either
the low variability of downstream gene border positions
Figure 6. Shifts due to attraction by the manifold U2. (B,D) Dynamics of protein concentrations in the nucleus at 59% EL, through which the Krposterior and Kni anterior boundaries pass as they shift to the anterior. The nucleus at 59% EL is indicated with a dashed vertical line. (A) The Hb-Kr-Kni projection of the phase portrait of the nucleus. The invariant manifold U2 is shown as a magenta tube. The trajectory in the nucleus is plotted in acontinuous color gradient from green (t = 0 min) to red (t = 71.1 min, gastrulation). Times after gastrulation are depicted as blue. The nucleus passesthrough intermediate states (indicated with an arrow) with high Kr concentrations before reaching a state with high Kni concentration by the onsetof gastrulation. This registers as an anterior shift in the posterior Kr and anterior kni borders. (C) A two dimensional projection of the trajectory in theKr, Kni plane. The trajectory (red) starts at the origin. It attains a high Kr value at t = 45 min (arrow) before approaching high Kni values. The temporaryreversal in the trajectory is a mitosis, during which the trajectory moves toward the origin. Time after gastrulation is shown in blue.doi:10.1371/journal.pcbi.1000303.g006
Canalization of Gene Expression by Attractors
PLoS Computational Biology | www.ploscompbiol.org 10 March 2009 | Volume 5 | Issue 3 | e1000303
Canalization of Gene Expression by Attractors
PLoS Computational Biology | www.ploscompbiol.org 11 March 2009 | Volume 5 | Issue 3 | e1000303
[14,17,18], or the dynamical shifts of domains in the posterior
[14,21]. Fixed threshold specification also cannot explain precise
placement of the borders in the posterior since the low
molecular number of Bcd in the nuclei implies a high level of
molecular noise [23,81]. In the dynamical picture (Fig. 7),
contrary to the threshold view, Bcd ceases to have a role in
positional specification posterior to the peak of the Kr domain
since, posterior to this position, the geometry of the phase space
does not change qualitatively with A–P position. Instead,
maternal Hb acts as a morphogen, obviating the problems
arising from a low molecular number of Bcd. Maternal Hb has
long been recognized as a morphogen [74,75] for the posterior
region but the mechanism with which it specifies the posterior
region pattern was not clear. As is the case with Bcd, a
threshold-based theory for positional specification by Hb [82] is
incomplete and requires the postulation of thresholds that can
be modified by their targets. The qualitative dynamics provides
a viable mechanism for posterior patterning. The attracting
manifold U2 is the geometric manifestation of asymmetric
repression between the gap genes in reverse order of gap gene
domains, Kr ‘ kni ‘ gt. The initial Hb concentration deter-
mines which neighborhood of the manifold the trajectory
traverses as it is reaches the manifold: Kr-on, kni-on, or gt-on.
In other words, posterior patterning works by triggering
particular feedback loops in the gap gene network based on
maternal Hb concentration. This mechanism also accounts for
domain shifts, a property particular to the posterior region, since
the trajectories mimic the geometry of the manifold as they
approach it.
The dynamical analysis of the gap gene system provides a
simple and integrative view of pattern formation in the blastoderm
(Fig. 7). The existence of distinct anterior and posterior patterning
systems was inferred from the effect of maternal mutations on
larval cuticle phenotype and was subsequently characterized in
terms of the effects of the Bcd [52,73,83,84] and maternal Hb
gradients [56,57,77]. But where and how is the control of
patterning transferred from Bcd to maternal Hb? Our analysis
shows that the hand-off occurs at the A–P position where the Kr-on
attractor is annihilated through a saddle-node bifurcation,
implying a sharp rather than gradual transfer. With knowledge
of the two dynamical regimes, the complex spatiotemporal
dynamics of the gap gene system can be understood in the simple
terms of three mechanisms: movement of attractors through phase
space, selection of attractors by initial conditions, and the selection
of states on an attracting manifold (Fig. 7).
Finally, we mention the advantage of having the unexpected
mechanism of a one dimensional manifold for canalization and
patterning. The Bcd concentration is a bifurcation parameter of
the dynamical equations. If there were specific attractors
corresponding to each gap gene state, with bifurcations creating
and annihilating them successively as the Bcd concentration is
varied, the molecular noise in Bcd [23] would give rise to ‘‘jitter’’
or rapid switching between attractors. The manifold with its
smooth dependence on maternal Hb is qualitatively robust to such
fluctuations. In a connectionist model of cognition [85], one
dimensional unstable manifolds connecting a sequence of saddle
points have been proposed as a means of representing transient
brain dynamics. The gap gene phase space is a low dimensional
projection of the high dimensional phase space of all the molecular
determinants in the blastoderm. It may well be that the attractors
found in our analysis are actually saddle points in the high
dimensional phase space and are way points, with manifolds
connecting them, rather than final end points.
Methods
The methods used to obtain and characterize the quantitative
data are as described in earlier work [14]. All gene expression
levels are on a scale of 0–255 chosen to maximize dynamic range
without saturation. The numerical implementation of the gene
circuit equations is as described [18,21]. The gap gene circuit was
fit to integrated gap gene data [14] using Parallel Lam Simulated
Annealing (PLSA) [86,87]. PLSA minimizes the root mean
squared (RMS) difference between model output and data. For
each nucleus, data were available at nine time points (Table S1).
Search spaces, penalty function, and other annealing parameters
were as described [22,88]. The circuit analyzed in detail had an
RMS score of 10.76, corresponding to a proportional error in
expression residuals of about 4–5%.
Equilibria were determined by the Newton-Raphson method as
described in Protocol S3. One-dimensional unstable manifolds of
hyperbolic equilibria were calculated by solving the ODEs using the
Bulirsch-Stoer [71] method with starting points in the unstable
eigenspace of the equilibria [72]. The basin boundaries on the Hb axis
were calculated by finding starting points for trajectories that reach
saddle points with one positive eigenvalue (Protocol S3). The time
evolution of volume phase space was calculated as described (Protocol
S8). The methods used to calculate the equilibria branches and to
determine the type of bifurcations are described in Protocol S4.
Supporting Information
Protocol S1 Hybrid nonautonomous and autonomous equa-
tions.
Found at: doi:10.1371/journal.pcbi.1000303.s001 (0.03 MB PDF)
Protocol S2 Equilibria and bifurcations in two dimensions.
Found at: doi:10.1371/journal.pcbi.1000303.s002 (0.02 MB PDF)
Protocol S3 Equilibria, stability, one-dimensional manifolds,
and basins of attraction.
Found at: doi:10.1371/journal.pcbi.1000303.s003 (0.04 MB PDF)
Protocol S4 Continuous analysis and bifurcations.
Found at: doi:10.1371/journal.pcbi.1000303.s004 (0.03 MB PDF)
Protocol S5 Saddle equilibria, bifurcations, and basins in the
anterior region.
Found at: doi:10.1371/journal.pcbi.1000303.s005 (0.02 MB PDF)
Protocol S6 Saddle equilibria, bifurcations, and basins in the
posterior region.
Found at: doi:10.1371/journal.pcbi.1000303.s006 (0.02 MB PDF)
Protocol S7 Reduction of variation in maternal Hb.
Found at: doi:10.1371/journal.pcbi.1000303.s007 (0.02 MB PDF)
Protocol S8 The calculation of volume changes over time.
Found at: doi:10.1371/journal.pcbi.1000303.s008 (0.03 MB PDF)
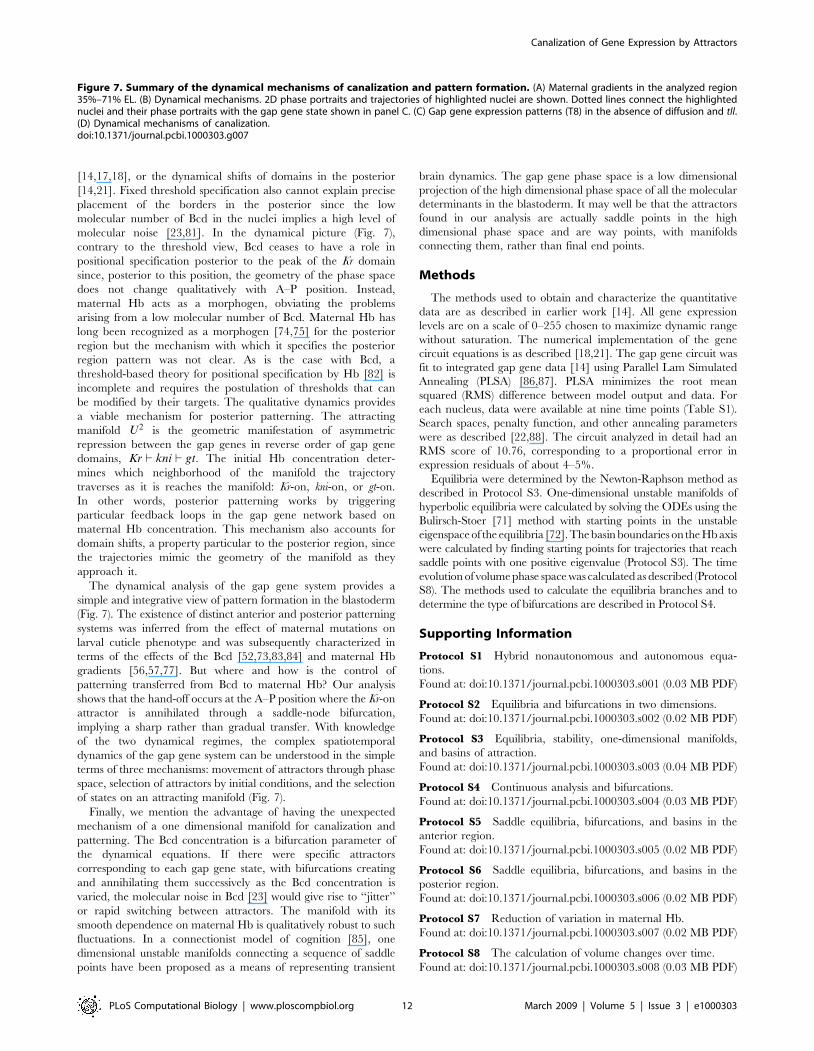
Figure 7. Summary of the dynamical mechanisms of canalization and pattern formation. (A) Maternal gradients in the analyzed region35%–71% EL. (B) Dynamical mechanisms. 2D phase portraits and trajectories of highlighted nuclei are shown. Dotted lines connect the highlightednuclei and their phase portraits with the gap gene state shown in panel C. (C) Gap gene expression patterns (T8) in the absence of diffusion and tll.(D) Dynamical mechanisms of canalization.doi:10.1371/journal.pcbi.1000303.g007
Canalization of Gene Expression by Attractors
PLoS Computational Biology | www.ploscompbiol.org 12 March 2009 | Volume 5 | Issue 3 | e1000303
Figure S1 Integrated data for time-varying inputs. The data are
from cleavage cycles 12 (C12), 13 (C13), and 14 (T1–T8). (A) Cad.
(B) Tll; T4 and T5 curves are underneath the T6 curve at the peak
of the posterior domain. Shaded area shows modeled region.
Found at: doi:10.1371/journal.pcbi.1000303.s009 (0.21 MB TIF)
Figure S2 Equilibria and bifurcations in two dimensions.
Found at: doi:10.1371/journal.pcbi.1000303.s010 (0.06 MB TIF)
Figure S3 Interpolation of time class T6 Cad profile for
continuation analysis. The interpolant (black curve) is the cubic
polynomial 20.0075x3+0.2264x2+2.3611x+9.8004.
Found at: doi:10.1371/journal.pcbi.1000303.s011 (0.15 MB TIF)
Figure S4 Other equilibria branches determined by the
continuous analysis. Saddle equilibria having one or two
eigenvalues with positive real part are red or brown respectively.
The y-axis is the projection of equilibria positions on the Kr axis.
The x-axis is the bifurcation parameter, the A–P position x. (A)
The equilibria S31,3 and S4
2,2, showing their bifurcation at 36.96%
EL. (B) S71,3 and S8
2,2 are created at 53.32% EL, and there are no
further bifurcations at more posterior positions.
Found at: doi:10.1371/journal.pcbi.1000303.s012 (0.14 MB TIF)
Figure S5 Bifurcations in the anterior region. Hb-Kr-Gt
projection of equilibria diagrams at (A) 35% EL, (B) 37% EL,
(C) 43% EL, and (D) 45% EL. The axes originate from
(210,210,210), and have length 250 in relative concentration
units. The xy-plane is shown in gray. To aid perception of depth,
shadows from a light source directly above the xy-plane are
rendered as dark gray traces on the xy-plane. Equilibria are
represented by spheres of radius 10. Point attractors are blue and
saddle equilibria having one or two eigenvalues with positive real
part are red or brown respectively. Red arrows in panel A point to
saddles, S31,3 and S4
2,2, that disappear through a saddle-node
bifurcation between 35% EL and 37% EL. In panels B and C, the
A10,4 attractor goes from hb,gt-on state to hb-on state. Red arrows in
panel D point to two saddles, S51,3 and S6
2,2 created by a saddle
node bifurcation between 43% EL and 45% EL. S51,3 and A3
0,4
disappear through a saddle node bifurcation at 53% EL that
separates the anterior and posterior regimes.
Found at: doi:10.1371/journal.pcbi.1000303.s013 (1.80 MB TIF)
Figure S6 All four three-dimensional projections of the phase
portrait at 37% EL. (A) Hb-Kr-Gt projection; red arrows are basin
boundaries. (B) Hb-Kr-Kni projection. (C) Hb-Gt-Kni projection.
(D) Kr-Gt-Kni projection. The axes, xy-plane, and equilibria are as
in Fig. S5. 10 trajectories are shown with starting points equally
distributed on the Hb axis between 0–100. Time is represented as
a color gradient along the trajectories, with start of cycle 13 as
green, and gastrulation as red; trajectories are blue after
gastrulation. The temporary reversals in trajectories are mitoses,
during which the trajectories move toward the origin.
Found at: doi:10.1371/journal.pcbi.1000303.s014 (2.22 MB TIF)
Figure S7 Bifurcations in the posterior region. Hb-Kr-Kni
projection of phase portraits at (A) 53% EL and (B) 55% EL. The
axes, xy-plane, and equilibria are as in Fig. S5. See Table S3 for
bifurcation parameter values determined by the continuous
analysis. Black arrows point to saddles, S71,3 and S8
2,2, that are
created via a saddle-node bifurcation between 53% EL and 55%
EL.
Found at: doi:10.1371/journal.pcbi.1000303.s015 (0.93 MB TIF)
Figure S8 All four three-dimensional projections of the phase
portrait at 57% EL. Axes, xy-plane, and equilibria are as in Fig.
S5. All saddle equilibria are not shown (see Fig. S7). The unstable
manifold of saddle S21,3, U2 is shown as a translucent magenta tube
of radius 5. 10 trajectories are shown in panels A, C, and D, while
25 are shown in panel B. (A) Hb-Kr-Gt projection. Red arrow
shows the separation of the indirect route trajectories from direct
route ones. (B) Hb-Kr-Kni projection. Red arrow shows the
separation of the indirect route trajectories from direct route ones.
(C) Hb-Gt-Kni projection. (D) Kr-Gt-Kni projection. U2+
traverses the anteroposterior progression of gap gene states in
the posterior region—Kr-on to kni-on to gt-on.
Found at: doi:10.1371/journal.pcbi.1000303.s016 (2.69 MB TIF)
Figure S9 Tolerance to variation in maternal Hb. The range of
initial conditions (B, error bars) for which modeled gap gene
expression patterns have the same expression level variation as gap
gene data in T8 (A). Error bars are ranges of concentrations, and
percentage variation is the ratio of range to mean. (A) The
variation in expression levels at the Kr peak is 30% (yellow bar), at
the Kni peak is 35% (red bar), and at the Gt peak is 50% (black
bar). (B) The tolerance range for maternal Hb is shown at three A–
P positions (Kr, kni, and gt peaks). Maternal Hb profile is shown in
red. The tolerance to initial variation is 150% at Kr peak, 85% at
kni peak and 100% at gt peak.
Found at: doi:10.1371/journal.pcbi.1000303.s017 (0.46 MB TIF)
Table S1 Time classes
Found at: doi:10.1371/journal.pcbi.1000303.s018 (0.02 MB PDF)
Table S2 Position of gap gene boundaries in the circuits with
and without diffusion.
Found at: doi:10.1371/journal.pcbi.1000303.s019 (0.01 MB PDF)
Table S3 Comparison of bifurcation parameter values deter-
mined in the discrete analysis with the values determined in the
continuous analysis.
Found at: doi:10.1371/journal.pcbi.1000303.s020 (0.02 MB PDF)
Table S4 Summary of all equilibria, the A–P region they exist
in, and their function.
Found at: doi:10.1371/journal.pcbi.1000303.s021 (0.02 MB PDF)
Acknowledgments
We thank R. K. Lewis, J. P. Gergen, J. Jaeger, K. Krishan, C. Martinez,
and A. M. Samsonov for valuable discussions and several anonymous
reviewers for helpful comments on the manuscript.
Author Contributions
Conceived and designed the experiments: M AVS DHS MS JR. Performed
the experiments: M VVG HJ ARK OR CEVA. Analyzed the data: SS.
Wrote the paper: M OR DHS MS JR.
References
1. Waddington CH (1942) Canalization of development and the inheritance of
acquired characters. Nature 150: 563–565.
2. Waddington CH (1959) Canalization of development and genetic assimilation ofacquired characters. Nature 183: 1654–1655.
3. Gibson G, Wagner G (2000) Canalization in evolutionary genetics: a stabilizing
theory? BioEssays 22: 372–380.
4. Debat V, David P (2001) Mapping phenotypes: canalization, plasticity and
developmental stability. Trends in Ecology and Evolution 16: 555–561.
5. Waddington CH (1962) New Patterns in Genetics and Development. New York:
Columbia University Press.
6. Waddington CH (1953) Genetic assimilation of an acquired character. Evolution7: 118–126.
7. Rendel JM (1959) The canalization of the scute phenotype of Drosophila.
Evolution 13: 425–439.
8. Rutherford SL, Lindquist S (1998) Hsp90 as a capacitor for morphological
evolution. Nature 396: 336–342.
Canalization of Gene Expression by Attractors
PLoS Computational Biology | www.ploscompbiol.org 13 March 2009 | Volume 5 | Issue 3 | e1000303
9. Sollars V, Lu X, Xiao L, Wang X, Garfinkel MD, et al. (2002) Evidence for an
epigenetic mechanism by which Hsp90 acts as a capacitor for morphological
evolution. Nature Genetics 33: 70–74.
10. Lott S, Kreitman M, Palsson A, Alekseeva E, Ludwig M (2007) Canalization of
segmentation and its evolution in Drosophila. Proceedings of the National
Academy of Sciences USA 104: 10926–10931.
11. Wagner A (1996) Does evolutionary plasticity evolve? Evolution 50: 1008–1023.
12. Wagner G, Booth G, Bagheri-Chaichian H (1997) A population genetic theory
of canalization. Evolution 51: 329–347.
13. Siegal ML, Bergman A (2002) Waddington’s canalization revisited: Develop-
mental stability and evolution. Proceedings of the National Academy of Sciences
USA 99: 10528–10532.
14. Surkova S, Kosman D, Kozlov K, Manu, Myasnikova E, et al. (2008)
Characterization of the Drosophila segment determination morphome. Develop-
mental Biology 313: 844–862.
15. Simcox AA, Sang JH (1983) When does determination occur in Drosophila
embryos? Developmental Biology 97: 212–221.
16. Nusslein-Volhard C, Wieschaus E (1980) Mutations affecting segment number
and polarity in Drosophila. Nature 287: 795–801.
17. Houchmandzadeh B, Wieschaus E, Leibler S (2002) Establishment of
developmental precision and proportions in the early Drosophila embryo. Nature
415: 798–802.
18. Manu, Surkova S, Spirov AV, Gursky V, Janssens H, et al. (2008) Canalization
of gene expression in the Drosophila blastoderm by gap gene cross regulation.
PLoS Biology. In press.
19. Reinitz J, Mjolsness E, Sharp DH (1995) Cooperative control of positional
information in Drosophila by bicoid and maternal hunchback. The Journal of
Experimental Zoology 271: 47–56.
20. Reinitz J, Kosman D, Vanario-Alonso CE, Sharp DH (1998) Stripe forming
architecture of the gap gene system. Developmental Genetics 23: 11–27.
21. Jaeger J, Surkova S, Blagov M, Janssens H, Kosman D, et al. (2004) Dynamic control
of positional information in the early Drosophila embryo. Nature 430: 368–371.
22. Jaeger J, Blagov M, Kosman D, Kozlov KN, Manu, et al. (2004) Dynamical
analysis of regulatory interactions in the gap gene system of Drosophila
melanogaster. Genetics 167: 1721–1737.
23. Gregor T, Tank DW, Wieschaus EF, Bialek W (2007) Probing the limits to
positional information. Cell 130: 153–164.
24. Elowitz MB, Levine AJ, Siggia ED, Swain PS (2002) Stochastic gene expression
in a single cell. Science 297: 1183–1186.
25. Blake WJ, Kaern M, Cantor CR, Collins JJ (2003) Noise in eukaryotic gene
expression. Nature 422: 633–637.
26. Rosenfeld N, Young JW, Alon U, Swain PS, Elowitz MB (2005) Gene regulation
at the singlecell level. Science 307: 1962–1965.
27. Arias AM, Hayward P (2006) Filtering transcriptional noise during development:
concepts and mechanisms. Nature Reviews Genetics 7: 34–44.
28. Thom R (1969) Topological models in biology. Topology 8: 313–335.
29. Thom R (1983) Mathematical Models of Morphogenesis. West Sussex, England:
Ellis Horwood Limited.
30. Kauffman SA (1969) Metabolic stability and epigenesis in randomly constructed
genetic nets. The Journal of Theoretical Biology 22: 437–467.
31. Kappler K, Edwards R, Glass L (2003) Dynamics in high-dimensional model
gene networks. Signal Processing 83: 789–798.
32. Huang S, Eichler G, Bar-Yam Y, Ingber DE (2005) Cell fates as high-
dimensional attractor states of a complex gene regulatory network. Physical
Review Letters 94. Art. No. 128701.
33. Huang S, Guo Y, May G, Enver T (2007) Bifurcation dynamics in lineage-
commitment in bipotent progenitor cells. Developmental Biology 305: 695–713.
34. Hirsch M, Smale S, Devaney R (2004) Differential Equations, Dynamical
Systems, and an Introduction to Chaos. Boston: Academic Press.
35. Perkins TJ, Jaeger J, Reinitz J, Glass L (2006) Reverse engineering the gap
gene network of Drosophila melanogaster. PLoS Computational Biology 2: e51.
Epub 2006 May 19. http://compbiol.plosjournals.org/perlserv/?request =
getdocument&doi = 10.1371/journal.pcbi.0020051.
36. Ingham PW, Baker NE, Martinez-Arias A (1988) Regulation of segment polarity
genes in the Drosophila blastoderm by fushi tarazu and even skipped. Nature 331: 73–75.
37. Foe VE, Alberts BM (1983) Studies of nuclear and cytoplasmic behaviour during
the five mitotic cycles that precede gastrulation in Drosophila embryogenesis. The
Journal of Cell Science 61: 31–70.
38. Renzis S, Elemento O, Tavazoie S, Wieschaus E (2007) Unmasking activation of
the zygotic genome using chromosomal deletions in the Drosophila embryo. PLoS
Biology 5: e117. doi:10.1371/journal.pbio.0050117.
39. Reinitz J, Vaisnys JR (1990) Theoretical and experimental analysis of the phage
lambda genetic switch implies missing levels of cooperativity. The Journal of
Theoretical Biology 145: 295–318.
40. Gardner TS, Cantor CR, Collins JJ (2000) Construction of a genetic toggle
switch in Escherichia coli. Nature 403: 339–342.
41. Ozbudak EM, Thattai M, Lim HN, Shraiman BI, van Oudenaarden A (2004)
Multistability in the lactose utilization network of Escherichia coli. Nature 427:
737–740.
42. Umulis DM, Serpe M, O’Connor MB, Othmer HG (2006) Robust, bistable
patterning of the dorsal surface of the Drosophila embryo. Proceedings of the
National Academy of Sciences USA 103: 11613–11618.
43. Lopes FJP, Vieira FMC, Holloway DM, Bisch PM, Spirov AV (2008) Spatialbistability generates hunchback expression sharpness in the Drosophila embryo.
PLoS Computational Biology 4: e1000184. doi:10.1371/journal.pcbi.1000184.
44. Keranen SVE, Fowlkes C, Luengo C, Sudar D, Knowles DK, et al. (2006) 3D
morphology and gene expression in the Drosophila blastoderm at cellularresolution II: Dynamics. Genome Biology 7: R124.
45. Tautz D, Lehmann R, Schnurch H, Schuh R, Seifert E, et al. (1987) Finger
protein of novel structure encoded by hunchback, a second member of the gapclass of Drosophila segmentation genes. Nature 327: 383–389.
46. Redemann N, Gaul U, Jackle H (1988) Disruption of a putative Cys-zinc
interaction eliminates the biological activity of the Kruppel finger protein. Nature332: 90–92.
47. Nauber U, Pankratz MJ, Kienlin A, Seifert E, Klemm U, et al. (1988)
Abdominal segmentation of the Drosophila embryo requires a hormone receptor-like protein encoded by the gap gene knirps. Nature 336: 489–492.
48. Mohler J, Eldon ED, Pirrotta V (1989) A novel spatial transcription pattern
associated with the segmentation gene, giant, of Drosophila. The EMBO Journal 8:1539–1548.
49. Akam M (1987) The molecular basis for metameric pattern in the Drosophila
embryo. Development 101: 1–22.
50. Nusslein-Volhard C, Frohnhofer HG, Lehmann R (1987) Determination of
anteroposterior polarity in Drosophila. Science 238: 1675–1687.
51. Driever W, Nusslein-Volhard C (1988) A gradient of Bicoid protein in Drosophila
embryos. Cell 54: 83–93.
52. Driever W, Nusslein-Volhard C (1988) The Bicoid protein determines position
in the Drosophila embryo in a concentration-dependent manner. Cell 54: 95–
104.
53. Driever W, Siegel V, Nusslein-Volhard C (1990) Autonomous determination of
anterior structures in the early Drosophila embryo by the Bicoid morphogen.
Development 109: 811–820.
54. Gregor T, Wieschaus EF, McGregor AP, Bialek W, Tank DW (2007) Stability
and nuclear dynamics of the Bicoid morphogen gradient. Cell 130: 141–
152.
55. Tautz D (1988) Regulation of the Drosophila segmentation gene hunchback by two
maternal morphogenetic centres. Nature 332: 281–284.
56. Hulskamp M, Schroder C, Pfeifle C, Jackle H, Tautz D (1989) Posteriorsegmentation of the Drosophila embryo in the absence of a maternal posterior
organizer gene. Nature 338: 629–632.
57. Irish V, Lehmann R, Akam M (1989) The Drosophila posterior-group gene nanos
functions by repressing hunchback activity. Nature 338: 646–648.
58. Weigel D, Jurgens G, Klingler M, Jackle H (1990) Two gap genes mediate
maternal terminal pattern information in Drosophila. Science 248: 495–498.
59. Casanova J (1990) Pattern formation under the control of the terminal system in
the Drosophila embryo. Development 110: 621–628.
60. Pankratz MJ, Hoch M, Seifert E, Jackle H (1989) Kruppel requirement for knirps
enhancement reflects overlapping gap gene activities in the Drosophila embryo.
Nature 341: 337–340.
61. Kraut R, Levine M (1991) Spatial regulation of the gap gene giant duringDrosophila development. Development 111: 601–609.
62. Bronner G, Jackle H (1991) Control and function of terminal gap gene activity in
the posterior pole region of the Drosophila embryo. Mechanisms of Development35: 205–211.
63. Mlodzik M, Fjose A, Gehring WJ (1985) Isolation of caudal, a Drosophila homeo
boxcontaining gene with maternal expression, whose transcripts form a
concentration gradient at pre-blastoderm stage. The EMBO Journal 4:2961–2969.
64. Mlodzik M, Gehring WJ (1987) Hierarchy of the genetic interactions that specify
the anteroposterior segmentation pattern of the Drosophila embryo as monitoredby caudal protein expression. Development 101: 421–435.
65. Shermoen AW, O’Farrell PH (1991) Progression of the cell cycle through mitosis
leads to abortion of nascent transcripts. Cell 97: 303–310.
66. Gaul U, Jackle H (1987) Pole region-dependent repression of the Drosophila gap
gene Kruppel by maternal gene products. Cell 51: 549–555.
67. Eldon ED, Pirrotta V (1991) Interactions of the Drosophila gap gene giant withmaternal and zygotic pattern-forming genes. Development 111: 367–378.
68. Jaeger J, Sharp DH, Reinitz J (2007) Known maternal gradients are not
sufficient for the establishment of gap domains in Drosophila melanogaster.Mechanisms of Development 124: 108–128.
69. Perko L (1996) Differential Equations and Dynamical Systems. New York:
Springer-Verlag.
70. Conte SD, de Boor C (1980) Elementary Numerical Analysis. New York, New
York: McGraw-Hill Book Company.
71. Press WH, Teukolsky SA, Vetterling WT, Flannery BP (1992) NumericalRecipes in C. Cambridge, U.K.: Cambridge University Press, second edition.
72. Guckenheimer J, Vladimirsky A (2004) A fast method for approximating
invariant manifolds. SIAM Journal of Applied Dynamical Systems 3: 232–260.
73. Simpson-Brose M, Treisman J, Desplan C (1994) Synergy between the
Hunchback and Bicoid morphogens is required for anterior patterning inDrosophila. Cell 78: 855–865.
74. Hulskamp M, Pfeifle C, Tautz D (1990) A morphogenetic gradient of
Hunchback protein organizes the expression of the gap genes Kruppel and knirps
in the early Drosophila embryo. Nature 346: 577–580.
Canalization of Gene Expression by Attractors
PLoS Computational Biology | www.ploscompbiol.org 14 March 2009 | Volume 5 | Issue 3 | e1000303
75. Struhl G, Johnston P, Lawrence PA (1992) Control of Drosophila body pattern by
the Hunchback morphogen gradient. Cell 69: 237–249.76. Pritchard DK, Schubiger G (1996) Activation of transcription in Drosophila
embryos is a gradual process mediated by the nucleocytoplasmic ratio. Genes
and Development 10: 1131–1142.77. Wharton RP, Struhl G (1991) RNA regulatory elements mediate control of
Drosophila body pattern by the posterior morphogen Nanos. Cell 67: 955–967.78. Dubnau J, Struhl G (1996) RNA recognition and translational regulation by a
homeodomain protein. Nature 379: 694–649.
79. MacAdams HH, Arkin A (1997) Stochastic mechanisms in gene expression.Proceedings of the National Academy of Sciences, USA 94: 814–819.
80. Arkin A, Ross J, MacAdams HH (1998) Stochastic kinetic analysis ofdevelopmental pathway bifurcation in phage -infected Escherichia coli cells.
Genetics 149: 1633–1648.81. Tostevin F, ten Wolde PR, Howard M (2007) Fundamental limits to position
determination by concentration gradients. PLoS Computational Biology 3: e78.
doi:10.1371/journal.pcbi.0030078.
82. Yu D, Small S (2008) Precise registration of gene expression boundaries by a
repressive morphogen in Drosophila. Current Biology 18: 868–876.83. Driever W, Nusslein-Volhard C (1989) The Bicoid protein is a positive regulator
of hunchback transcription in the early Drosophila embryo. Nature 337: 138–143.
84. Driever W, Thoma G, Nusslein-Volhard C (1989) Determination of spatialdomains of zygotic gene expression in the Drosophila embryo by the affinity of
binding sites for the Bicoid morphogen. Nature 340: 363–367.85. Rabinovich MI, Huerta R, Varona P, Afraimovich VS (2008) Transient
cognitive dynamics, metastability, and decision making. PLoS Computational
Biology 4: e1000072. doi:10.1371/journal.pcbi.1000072.86. Chu KW, Deng Y, Reinitz J (1999) Parallel simulated annealing by mixing of
states. The Journal of Computational Physics 148: 646–662.87. Chu KW (2001) Optimal Parallelization of Simulated Annealing by State
Mixing. PhD Thesis, Department of Applied Mathematics and Statistics, StonyBrook University.
88. Reinitz J, Sharp DH (1995) Mechanism of eve stripe formation. Mechanisms of
Development 49: 133–158.
Canalization of Gene Expression by Attractors
PLoS Computational Biology | www.ploscompbiol.org 15 March 2009 | Volume 5 | Issue 3 | e1000303
Top Related
Copyright © 2022 FDOKUMEN

