


Bahasa
Halaman
Hukum


ETAILED PROJECT REPORT
ON
ENERGY COST REDUCTION WITH ENERGY
EFFI.IENT MR
(ALWAR OIL MILL CLUSTER)
Bureau of Energy Efficiency (BEE)
Prepared By Reviewed By
DETAILED PROJECT REPORT ON
POWER FACTOR IMPROVEMENT BY INSTALLATION OF CAPACITOR BANKS
(BATALA, JALANDHAR, LUDHIANA FOUNDRY CLUSTER)

POWER FACTOR IMPROVEMENT BY INSTALLATION OF CAPACITOR BANKS
BATALA, JALANDHAR, LUDHIANA FOUNDRY CLUSTER

BEE, 2011 Detailed Project Report on Power Factor Improvement with Installation of Capacitor Banks Foundry SME Cluster, Batala, Jalandhar , Ludhiana (Punjab) (India) New Delhi: Bureau of Energy Efficiency Detail Project Report No.: BJL/CAP/PF/01
For more information please contact
Bureau of Energy Efficiency (BEE) Telephone +91-11-26179699
(Ministry of Power, Government of India) Fax +91-11-26178352
4th Floor, Sewa Bhawan Websites: www.bee-india.nic.in
R. K. Puram, New Delhi – 110066 Email:

Acknowledgement
We are sincerely thankful to the Bureau of Energy Efficiency, Ministry of Power, for
giving us the opportunity to implement the „BEE SME project in “BJL Foundry Cluster,
Batala, Jalandhar & Ludhiana”. We express our sincere gratitude to all concerned
officials for their support and guidance during the conduct of this exercise.
Dr. Ajay Mathur, Director General, BEE
Smt. Abha Shukla, Secretary, BEE
Shri Jitendra Sood, Energy Economist, BEE
Shri Pawan Kumar Tiwari, Advisor (SME), BEE
Shri Rajeev Yadav, Project Economist, BEE
CII – AVANTHA Centre for Competitiveness for SMEs, Confederation of Indian Industry
(CII) is also thankful to Industry Associations for their valuable inputs, cooperation,
support and facilitating the implementation of BEE SME program in BJL Foundry
Cluster.
We take this opportunity to express our appreciation for the excellent support provided
by Foundry Unit Owners, Local Service Providers, and Equipment Suppliers for their
active involvement and their valuable inputs in making the program successful and in
completion of the Detailed Project Report (DPR).
CII – AVANTHA Centre for Competitiveness for SMEs, Confederation of Indian Industry
(CII) is also thankful to all the SME owners, plant in charges and all workers of the SME
units for their support during the energy use and technology audit studies and in
implementation of the project objectives.
CII – AVANTHA Centre for Competitiveness for SMEs Confederation of Indian Industry
Chandigarh

Contents
List of Annexure vii List of Tables vii List of Figures vii List of Abbreviation viii Executive summary ix About BEE’S SME program xi
1 INTRODUCTION ..................................................................................................... 1
1.1 Brief Introduction about the Cluster ...................................................................... 1
1.2 Energy performance in existing situation ............................................................. 3
1.2.1 Average Production ..................................................................................... 4
1.2.2 Energy Consumption ......................................................................................... 4
1.2.3 Specific Energy Consumption ............................................................................ 5
1.3 Proposed Technology/Equipment ........................................................................ 5
1.3.1 Description about the existing technology .......................................................... 5
1.4 Establishing the Baseline for the Proposed Technology ...................................... 5
1.5 Barriers in adoption of propose technology .......................................................... 6
1.5.1 Technological Barrier ................................................................................... 6
1.5.2 Financial Barrier ................................................................................................ 6
1.5.3 Skilled Manpower .............................................................................................. 6
2 PROPOSED TECHNOLOGY .................................................................................. 7
2.1 Detailed Description of Technology ..................................................................... 7
2.1.1 Description of Technology ................................................................................. 7
2.1.2 Technology Specification ................................................................................... 9
2.1.3 Suitability or Integration with Existing Process and Reasons for Selection......... 9
2.1.4 Availability of Technology .................................................................................. 9
2.1.5 Source of Technology ........................................................................................ 9
2.1.6 Terms and Conditions after Sale ....................................................................... 9
2.1.7 Process down Time during Implementation ....................................................... 9

2.2 Life Cycle Assessment ...................................................................................... 10
2.3 Suitable Unit for Implementation of the Identified Technology ............................ 10
3 ECONOMIC BENEFITS FROM PROPOSED TECHNOLOGY .............................. 11
3.1 Technical Benefits ............................................................................................. 11
3.1.1 Electricity savings per year ................................................................................. 11
3.1.2 Improvement in product quality ........................................................................ 11
3.1.3 Increase in production ..................................................................................... 11
3.1.4 Reduction in raw material consumption ........................................................... 11
3.1.5 Reduction in other losses ................................................................................ 11
3.2 Monetary Benefits per year ................................................................................ 11
3.3 Social Benefits ................................................................................................... 12
3.3.1 Improvement in Working Environment in the Plant .......................................... 12
3.3.2 Improvement in Skill Set of Workers ................................................................ 12
3.4 Environmental Benefits ...................................................................................... 12
4 INSTALLATION OF THE PROPOSED TECHNOLOGY ....................................... 13
4.1 Cost of Technology Implementation ................................................................... 13
4.1.1 Technology Cost.............................................................................................. 13
4.1.2 Other Cost ....................................................................................................... 13
4.2 Arrangements of Funds ..................................................................................... 13
4.2.1 Entrepreneur‟s Contribution ............................................................................. 13
4.2.2 Loan Amount ................................................................................................... 13
4.2.3 Terms & Conditions of Loan ............................................................................ 13
4.3 Financial Indicators ............................................................................................ 13
4.3.1 Cash Flow Analysis ......................................................................................... 13
4.3.2 Simple Payback Period.................................................................................... 14
4.3.3 Net Present Value (NPV) ................................................................................. 14
4.3.4 Internal Rate of Return (IRR) ........................................................................... 14

4.3.5 Return on Investment (ROI) ............................................................................. 14
4.4 Sensitivity analysis in realistic, pessimistic and optimistic scenarios .................. 14
4.5 Procurement and Implementation Schedule ...................................................... 15
vii
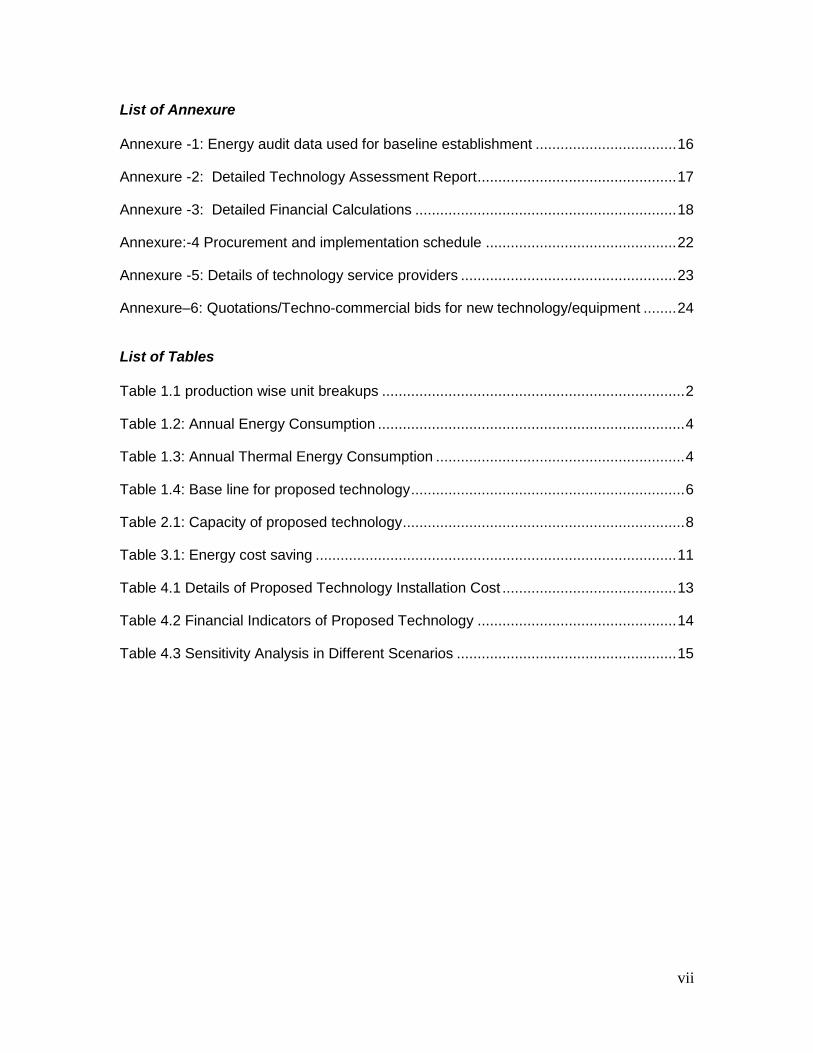
List of Annexure
Annexure -1: Energy audit data used for baseline establishment .................................. 16
Annexure -2: Detailed Technology Assessment Report ................................................ 17
Annexure -3: Detailed Financial Calculations ............................................................... 18
Annexure:-4 Procurement and implementation schedule .............................................. 22
Annexure -5: Details of technology service providers .................................................... 23
Annexure–6: Quotations/Techno-commercial bids for new technology/equipment ........ 24
List of Tables
Table 1.1 production wise unit breakups ......................................................................... 2
Table 1.2: Annual Energy Consumption .......................................................................... 4
Table 1.3: Annual Thermal Energy Consumption ............................................................ 4
Table 1.4: Base line for proposed technology .................................................................. 6
Table 2.1: Capacity of proposed technology .................................................................... 8
Table 3.1: Energy cost saving ....................................................................................... 11
Table 4.1 Details of Proposed Technology Installation Cost .......................................... 13
Table 4.2 Financial Indicators of Proposed Technology ................................................ 14
Table 4.3 Sensitivity Analysis in Different Scenarios ..................................................... 15

viii
List of Figures
Figure 1.1: Process Flow diagram of a Foundry Cluster ................................................. 2
Figure 1.2: Production Capacity BJL Foundry cluster ..................................................... 4
List of Abbreviations
BEE Bureau of Energy Efficiency
SME Small and Medium Enterprises
DPR Detailed Project Report
GHG Green House Gases
PF Power Factor
DSCR Debt Service Coverage Ratio
NPV Net Present Value
IRR Internal Rate of Return
ROI Return on Investment
ROI - Return on Investment
MoP - Ministry of Power
MSME - Micro Small and Medium Enterprises
MoMSME - Ministry of Micro Small and Medium Enterprises
SIDBI - Small Industrial Development Bank of India

ix
EXECUTIVE SUMMARY
Confederation of Indian Industry is executing BEE-SME program in Batala, Jalandhar
and Ludhiana Foundry Cluster, supported by Bureau of Energy Efficiency (BEE) with an
overall objective of improving the energy efficiency in cluster units.
Batala, Jalandhar and Ludhiana Foundry cluster, is one of the largest Foundry clusters
in India; accordingly this cluster was chosen for energy efficiency improvements by
implementing energy efficient measures / technologies, so as to facilitate maximum
replication in other Foundry clusters in India. The main energy forms used in the cluster
units are grid electricity.
Most of the Industrial installations in the country have large electrical loads which are
severely inductive in nature, such as motors, large machines etc which results in a
severely lagging power factor. This means loss and wastage of energy and due to which
heavy penalties imposed by state electricity boards. Control of power factor would be
possible by installation of some additional capacitor and automatic power factor control
(APFC) in the unit.
Improvement in power factor near to unity with the installation of some additional
capacitors helps in reducing the electricity bill amount by availing the benefit of incentive
on improving the power factor from the Punjab State Electricity Board.
Project implementation will lead to reduction in electricity bill by ` 0.39 Lakh per year
however; this intervention will not have any effect on the existing consumption pattern of
electricity.
This DPR highlights the details of the study conducted for assessing the potential for
installation of capacitor, possible rebate in electricity bill, and its monetary benefit,
availability of the technologies/design, local service providers, technical features &
proposed equipment specifications, various barriers in implementation, environmental
aspects, estimated GHG reductions, capital cost, financial analysis, sensitivity analysis
for three different scenarios and schedule of Project Implementation.
This bankable DPR also found eligible for subsidy scheme of MoMSME for “Technology
and Quality Upgradation Support to Micro, Small and Medium Enterprises” under
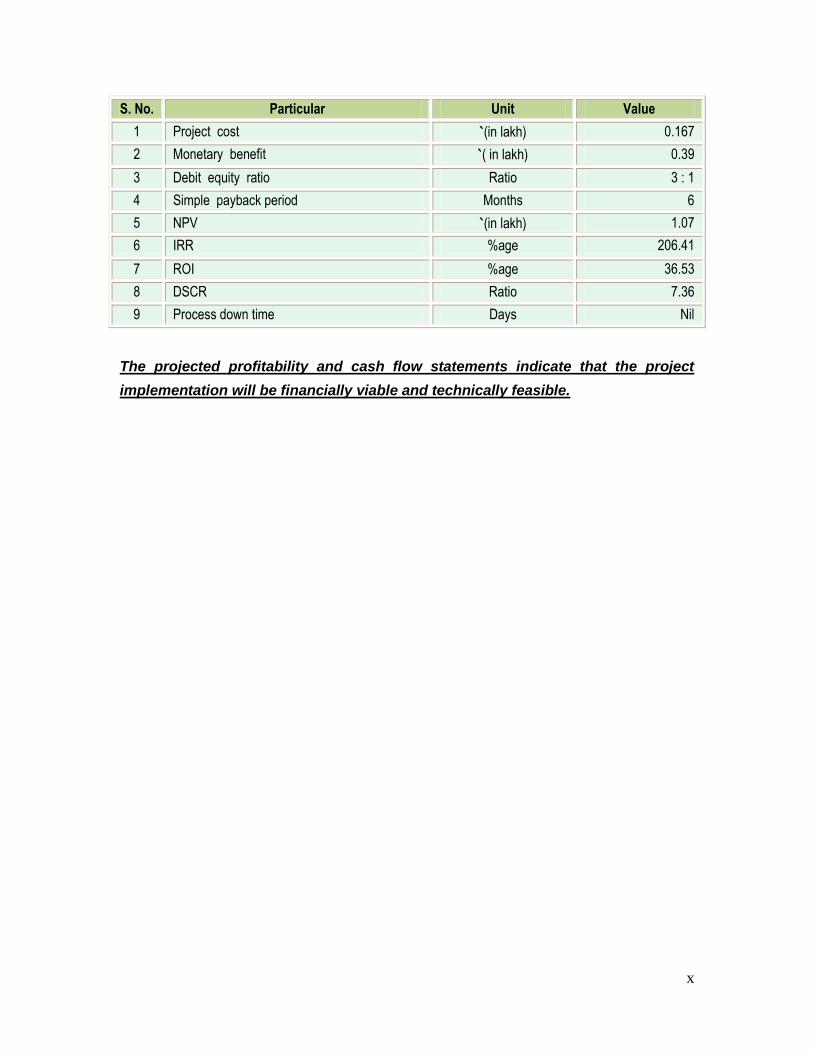
“National Manufacturing and Competitiveness Programme”. The key indicators of the
DPR including the Project cost, debt equity ratio, monetary benefit and other necessary
parameters are given in table.
x
S. No. Particular Unit Value
1 Project cost `(in lakh) 0.167
2 Monetary benefit `( in lakh) 0.39
3 Debit equity ratio Ratio 3 : 1
4 Simple payback period Months 6
5 NPV `(in lakh) 1.07
6 IRR %age 206.41
7 ROI %age 36.53
8 DSCR Ratio 7.36
9 Process down time Days Nil
The projected profitability and cash flow statements indicate that the project
implementation will be financially viable and technically feasible.
xi
ABOUT BEE’S SME PROGRAM Bureau of Energy Efficiency (BEE) is implementing a BEE-SME Programme to improve
energy performance in 29 selected SMEs clusters. Batala, Jalandhar and Ludhiana
Foundry Cluster is one of them. The BEE‟s SME Programme intends to enhance energy
efficiency awareness by funding/subsidizing need based studies in SME clusters and
giving energy conservation recommendations. For addressing the specific problems of
these SMEs and enhancing energy efficiency in the clusters, BEE will be focusing on
energy efficiency, energy conservation and technology up gradation through studies and
pilot projects in these SMEs clusters.
Major Activities in the BEE - SME Program are furnished below:
Activity 1: Energy Use and Technology Audit
The energy use technology studies would provide information on technology status, best
operating practices, gaps in skills and knowledge on energy conservation opportunities,
energy saving potential and new energy efficient technologies, etc for each of the sub
sector in SMEs.
Activity 2: Capacity Building of Stake Holders in Cluster on Energy Efficiency
In most of the cases SME entrepreneurs are dependent on the locally available
technologies, service providers for various reasons. To address this issue BEE has also
undertaken capacity building of local service providers and entrepreneurs/ managers of
SMEs on energy efficiency improvement in their units as well as clusters. The local
service providers will be trained in order to be able to provide the local services in setting
of energy efficiency projects in the clusters.
Activity 3: Implementation of Energy Efficiency Measures
To implement the technology up gradation projects in clusters, BEE has proposed to
prepare the technology based detailed project reports (DPRs) for a minimum of five
technologies in three capacities for each technology.
Activity 4: Facilitation of Innovative Financing Mechanisms for Implementation of
Energy Efficiency Projects
The objective of this activity is to facilitate the uptake of energy efficiency measures
through innovative financing mechanisms without creating market distortion.

Power Factor Improvement by Installation of Capacitor Bank
1
1 INTRODUCTION
1.1 Brief Introduction about the Cluster
Indian foundry industry is very energy intensive. The energy input to the furnaces and the
cost of energy play an important role in determining the cost of production of castings.
Major energy consumption in medium and large scale foundry industry is the electrical
energy for induction and Arc furnaces. Furnace oil is used in rotary furnaces. In Small
foundry industry, coal is used for metal melting in Cupola furnaces. The energy costs
contribute about 25 - 30% of the manufacturing cost in Indian foundry industry.
There are approximately 450 units, engaged in Foundry Cluster (automobile parts,
agricultural implements, machine tools, diesel engine components, manhole covers,
sewing machine stands, pump-sets, decorative gates and valves) production. The major
locations wherein the units are spread are G.T. Road, Industrial area, Focal Point in Batala.
In Jalandhar Dada Colony Industrial Area, Focal point, Focal Point Extn, Udyog Nagar,
I.D.C, Kapurthala Road & Preet Nagar. In Ludhiana Focal Point Phase 5 to 8, Janta Nagar,
Bhagwan Chowk Area & Industrial area – A/B. .
Availability of Electricity in Batala – across Dhir Road, GT Road is an issue; power is
available from the grid for maximum 12/14 hours a day. There are some units in Jalandhar
and Ludhiana having induction furnace in the range of 500 kg to 1 ton capacity whereas
other units which are using local scrap as well as have high melting temperatures are
having cupola and rotary furnace and has a capacity of minimum 5 ton per day.
The foundry produces a wide variety of castings such as manhole covers, pipe and pipe
fittings, sanitary items, tube well body, metric weights, automobile components, railway
parts, electric motor, fan body etc. 90% of the castings produced are from the SSI sector.
Energy Usage Pattern
Major energy sources being used in foundry cluster are electricity and fuels such as Coal,
Furnace Oil, and Diesel. Electrical energy is being used in melting of iron in induction
furnaces, operation of electrical utilities and thermal energy is being used in cupola
furnaces operation.
Classification of Units
Broadly units are classified with respect to production capacity;
Large Scale Units
Medium Scale Units
Small Scale Units

Power Factor Improvement by Installation of Capacitor Bank
2
Production wise unit breakup
Foundry cluster at Batala, Jalandhar and Ludhiana can be broken into three categories
viz. small, medium and large size unit. Table 1.1 shows that production wise breakup of
Foundry cluster.
Table 1.1 production wise unit breakups
S. No. Type of Unit Production Capacity
1 Large scale unit More than 1500 MT
2 Medium scale unit 250 to 1500 MT
3 Small scale unit Less than 250 MT
Products Manufactured Foundry SME cluster at Batala, Jalandhar and Ludhiana produces a wide variety of
castings such as manhole covers, pipe and pipe fittings, sanitary items, tube well body,
metric weights, automobile components, railway parts, electric motor, fan body etc. A general process flow diagram of foundry cluster is shown in figure below:
Figure 1.1: Process Flow diagram of a Foundry Cluster

Power Factor Improvement by Installation of Capacitor Bank
3
The manufacturing process is described as below;
Melting Section:
The raw material is melted in melting furnace. The melting furnace can be an induction
furnace or rotary or arc furnace or cupola furnace. Molten metal from the melting furnace
is tapped in Ladles and then transferred to the holding furnaces. Typically the holding
furnaces are induction furnaces. The holding furnace is used to maintain the required
molten metal temperature and also acts as a buffer for storing molten metal for casting
process. The molten metal is tapped from the holding furnace whenever it is required for
casting process.
Sand Plant:
Green sand preparation is done in the sand plant. Return sand from the molding section
is also utilized again after the reclamation process. Sand Millers are used for green sand
preparation. In the sand millers, green sand, additives and water are mixed in appropriate
proportion. Then the prepared sand is stored in bunkers for making moulds.
Pattern Making:
Patterns are the exact facsimile of the final product produces. Generally these master
patterns are made of aluminum or wood. Using the patterns the sand moulds are
prepared.
Mould Preparation:
In small-scale industries still the moulds are handmade. Modern plants are utilizing
pneumatic or hydraulically operated automatic molding machines for preparing the
moulds. After the molding process if required the cores are placed at the appropriate
position in the moulds. Then the moulds are kept ready for pouring the molten metal.
Casting:
The molten metal tapped from the holding furnace is poured into the moulds. The molten
metal is allowed to cool in the moulds for the required period of time and the castings are
produced. The moulds are then broken in the shake out for removing the sand and the
used sand is sent back to the sand plant for reclamation and reuse. The castings
produced are sent to fettling section for further operations such as shot blasting, heat
treatment etc. depending upon the customer requirements.
1.2 Energy performance in existing situation
Major energy sources being used in foundry cluster are electricity and fuels such as Coal,
Furnace Oil, and Diesel. Electrical energy is being used in melting of iron in induction

Power Factor Improvement by Installation of Capacitor Bank
4
furnaces, operation of electrical utilities and thermal energy is being used in cupola
furnaces operation.
1.2.1 Average Production
The Average Production of the Foundry Units is represented in figure 1.2 below during
Year 2009-10 are as follows;
Figure 1.2: Production Capacity BJL Foundry cluster
1.2.2 Energy Consumption
Energy consumption (electrical) in a typical Foundry plant for different types of products is
given in Table 1.2 below:
Table 1.2: Annual Energy Consumption
Electricity Consumption Pattern Unit Consumed in kWh Total Unit Consumption
kWh
Blower Motor for Cupola 962100
26.92 Lakhs Rotary Motor for Rotary Furnace 330000
Melting material in Induction Furnace 1400000
Table 1.3: Annual Thermal Energy Consumption
Thermal Energy Consumption Pattern Consumption per Year
Coal for Cupola 5000 Metric Tonnes
Furnace Oil for Rotary Furnace 17.8 Lakh Litter
11%
33% 56%
Production Capacity in BJL Cluster
Above 1500 Metric Tonnes 250 -1500 Metric Tonnes
Up to 250 Metric Tonnes

Power Factor Improvement by Installation of Capacitor Bank
5
1.2.3 Specific Energy Consumption
Specific energy consumption of Foundry units depends upon the production capacity &
their corresponding power consumption. Specific energy consumption also depends on
type of furnace. A brief summary of specific energy consumption depending upon type of
furnace is shown in below table;
Table 1.3: Annual Thermal Energy Consumption
Sl. No Types of Furnace Types of Fuel Specific Fuel
Consumption / One kg Molten Material
In Terms of Rupees
1 Cupola Coal 0.2 kg ` 3.00
2 Rotary Furnace Furnace Oil 0.15 Lt ` 4.20
3 Induction Furnace Electricity 0.6 kWh ` 3.60
*Assuming Coal rate ` 15.0 /kg *Assuming F.O rate ` 28.0 /Lt.
*Assuming electricity rate ` 5.0/kWh
1.3 Proposed Technology/Equipment
1.3.1 Description about the existing technology
Foundry Industry had taken the electricity connection from the Punjab State Electricity
Board. The electricity supply coming to the industries is of High Tension (HT) category
where Induction furnaces are installed and Low Tension (LT) where Cupola or Rotary
furnaces are used for casting. In HT connection, electricity bill is to be paid on the basis
of two part tariff. This means that the industries have to pay the charges for the maximum
demand and the electricity consumption (units) for that month. Other taxes are paid as
applicable. State electricity board is providing incentive on improvement of power factor.
Electricity is supplied from the generating station in the form of kVA. Power factor is the
ratio of active power (kW) to apparent power (kVA). If the power factor is near the unity,
this means that consumers are utilizing the power receiving from the state electricity
board as the active power. Punjab State Electricity Board provides the incentives on the
demand and energy charges to the consumers for maintaining the power factor above
0.90. The percentage of incentive increases with every increase in power factor above
0.90. If the power factor falls less than 0.80 then consumer has to pay the penalty
according to the applicable tariff.
1.4 Establishing the Baseline for the Proposed Technology
Presently almost all the Foundry plants at Batala, Jalandhar and Ludhiana are operating at
power factor 0.96. They are not getting the full benefit of incentive at this power factor from
the PSEB. If the power factor falls less than 0.80 then they have to pay the penalty

Power Factor Improvement by Installation of Capacitor Bank
6
according to the applicable tariff.
Table 1.4: Base line for proposed technology
S.No Parameters Details
1 Total Electrical load 550 kW
2 Existing power factor 0.96
3 Operating hours in a day 10 hrs
4 Annual Operating days 300
5 Monthly Electricity Bill (Shiv Forgings) ` 4.3 Lakh
1.5 Barriers in adoption of propose technology
1.5.1 Technological Barrier
Lack of awareness and information of the available benefits in terms of incentives
on the total electricity bill as per the tariff provided by PSEB
Due to lack of technical knowledge and expertise, power factor is not properly
monitored in the Foundry plants even after the installation of the required number of
capacitors.
In this cluster, like many others, there is lack of leadership to take up the energy
efficiency projects in the plant.
1.5.2 Financial Barrier
Implementation of the proposed project activity requires an investment of ` 0.17 Lakh,
which is a significant investment for small industries and not commonly seen in the cluster
for the implementation of energy efficiency projects. Also implementation of proposed
technology requires regular maintenance and checkups which requires technically skilled
and competent workman.
1.5.3 Skilled Manpower
In Foundry cluster at Batala, Jalandhar and Ludhiana, the availability of skilled manpower
is one of the limitations; this issue gets further aggravated due to more number of foundry
units as compared to the availability of skilled manpower.

Power Factor Improvement by Installation of Capacitor Bank
7
2 PROPOSED TECHNOLOGY
2.1 Detailed Description of Technology
2.1.1 Description of Technology
Existing scenario of power factor in Foundry units of Batala, Jalandhar and Ludhiana is not
poor but units are not getting the full benefit of incentive at this power factor from the
PSEB. Even they have installed some capacitors for the improvement of power factor but
maintenance and monitoring of the capacitors is not good. In this cluster unit various
process working under different load condition so that it is not easier to maintain power
factor with the help of those installed capacitor. In different type of loading condition,
improvement in power factor to unity can be achieved with the installation of some
additional capacitors if required and the installation of APFC panel which will helps in
reducing the electricity bill amount by availing the benefit of incentive on improving the
power factor. In the foundry units, presently some capacitors are already installed during
the plant setup, but with the rise in load to increase the production capacity, the plant
owner has not installed the additional required capacitors. It is difficult for the technicians to
maintain the power factor at unity in absence of required number of capacitor and APFC
panel. If the reactive power is provided in excess than the requirement, then the plant has
to pay penalty for that to state electricity board. Therefore, it is very important to provide the
reactive power to the unit according to the load conditions of the plant. For that the
implementation of capacitors with APFC panel is very important. APFC panel switches ON
and OFF the capacitors according to the requirement and maintain the power factor to
unity. So that by installing APFC panel, plant can maintain the power factor for respective
lagging load. It will not require manual operation as it automatically select capacitor bank
as per requirement.
In a purely resistive AC circuit, voltage and current waveforms are in step (or in phase),
changing polarity at the same instant in each cycle. All the power entering the loads is
consumed where reactive loads are present, such as with capacitors or inductors, energy
storage in the loads result in a time difference between the current and voltage waveforms.
During each cycle of the AC voltage, extra energy, in addition to any energy consumed in
the load, is temporarily stored in the load in electric or magnetic fields, and then returned to
the power grid a fraction of a second later in the cycle. The "ebb and flow" of this
nonproductive power increases the current in the line. Thus, a circuit with a low power
factor will use higher currents to transfer a given quantity of real power than a circuit with a
high power factor. A linear load does not change the shape of the waveform of the current,
but may change the relative timing (phase) between voltage and current.

Power Factor Improvement by Installation of Capacitor Bank
8
Circuits containing inductive or capacitive elements (electric motors, solenoid valves, lamp
ballasts, and others) often have a power factor below unity.
Power factor is the ratio of actual power (kW) to the apparent power (kVA). The apparent
power (kVA) is defined by the following formula,
Apparent power = Sqrt (kW2 + kVAR2)
kVAR is the reactive power; from the above formula if less power factor indicates that
supply of the reactive power is high compared to active power, which contributes useful
work of the system. High reactive power indicates that higher reactive current and
increases the I2R losses of the network. Capacitor is a device that generates reactive
current and consumes very less power. Installing capacitor will improve the power factor
and will also reduce the KVA demand of the system and will increase the capacity of the
network that is the network cables can be loaded further. Reduction in reactive current will
result in reduction of I2R losses and efficiency of the system will improve.
As per electricity board, with increase in Power factor above 0.90 gives incentives of 0.25%
on monthly electricity bill on every 1% increase of power factor. Since power factor
proposed to be improving from 0.96 to 0.99 hence, total incentive would be 0.75% in
electricity bill.
Since unit have already installed some capacitor and APFC panel which is not sufficient to
maintain the power factor near to unit. Hence, only some additional capacitor would be
required because unit have already installed sufficient capacity of APFC panel. Required
capacity of capacitor is calculated by following formula;
Required KVAR = Load (kW) x [{tan (cos-1 PFi)} – {tan (cos-1 PFf)}]
Where,
PFi is initial power factor maintained by the unit
PFf is final power factor proposed for the unit
Table 2.1: Capacity of proposed technology
S.No Parameters Details
1 Total Electrical load 550 kW
2 Existing power factor 0.96
3 Proposed power factor 0.99
4 Required additional kVAR 83 kVAR

Power Factor Improvement by Installation of Capacitor Bank
9
2.1.2 Technology Specification
For implementation of the proposed project, additional capacitors only have to be put.
APFC panel is already installed in the foundry plant.
2.1.3 Suitability or Integration with Existing Process and Reasons for Selection
This is the simplest and widely accepted measure for energy cost reduction in all the
industries.
Punjab State Electricity Board provides incentives for good power factor (PF>0.90) and
penalty for bad PF (PF<0.80). For units with Induction Furnaces the power factor has to be
maintained above 0.95. Most of the plants have scope for improving power factor. Power
factor is improved by the installation of capacitors and replacement of the existing de-rated
capacitors. This technology is;
simple in monitoring
requires less maintenance
requires no additional manpower
easy to installed
2.1.4 Availability of Technology
Suppliers of the capacitors along with APFC panel are easily available at the Punjab. Local
service providers are also available at Punjab. More details of service provider are given in
annexure 5.
2.1.5 Source of Technology
The main source which has taken the initiative to create the awareness for implementation
of this project by providing the benefit to the consumers in terms of rupees is the State
Electricity Distribution Board. By providing incentive on improving the power factor to the
consumers the State Electricity Distribution Board is promoting the awareness on
importance of power factor improvement.
2.1.6 Terms and Conditions after Sale
Warranty period of one year will be provided from the date of invoice against any
manufacturing defects.
2.1.7 Process down Time during Implementation
Technology provider will bring the complete setup for the proposed project from their site
and make all the arrangements for implementation at the client‟s site. During the final

Power Factor Improvement by Installation of Capacitor Bank
10
connection with the main supply of the foundry plant, breakdown period of 2 to 3 hours will
be required.
2.2 Life Cycle Assessment
Life of the proposed capacitors will be around 1,00,000 hours which depends on the
operating conditions and maintenance at client‟s side.
2.3 Suitable Unit for Implementation of the Identified Technology
Proposed technology can be implemented in any units where power factor is less than
unity. For estimation of the saving potential on implementation of this project, here the
Foundry plant engaged in producing castings having present power factor of about 0.96 is
considered.

Power Factor Improvement by Installation of Capacitor Bank
11
3 ECONOMIC BENEFITS FROM PROPOSED TECHNOLOGY
3.1 Technical Benefits
3.1.1 Electricity savings per year
Improvement in power factor to unity will not result in savings in electricity consumption
in foundry plant. But it helps to get the savings in the electricity bill as a rebate of about
0.75% on total electricity bill by improving the power factor to from 0.96 to 0.99.
3.1.2 Improvement in product quality
This project is not contributing to any improvement in product quality.
3.1.3 Increase in production
This project is not contributing for increasing in production in Foundry plant.
3.1.4 Reduction in raw material consumption
Raw material consumption will be the same after the implementation of the proposed
project.
3.1.5 Reduction in other losses
This project does not contribute to any reduction in any loss.
3.2 Monetary Benefits per year
Monetary benefit after implementation of this technology is shown in Table 3.1 below.
Table 3.1: Energy cost saving
S. No. Particular Details
1 Existing power factor 0.96
2 Proposed power factor 0.99
3 Total percentage rebate 0.75%
4 Present monthly electricity monthly bill ` 4.3 lakh
5 Average annual electricity bill ` 51.6 lakh
5 Annual saving in electricity bill after project implementation ` 38700

Power Factor Improvement by Installation of Capacitor Bank
12
3.3 Social Benefits
3.3.1 Improvement in Working Environment in the Plant
There is no significant impact of this project in the working environment in the plant.
3.3.2 Improvement in Skill Set of Workers
The technical skills of operator will definitely improve. Training on the regular
maintenance and checking of the capacitors to maintain the unity power factor helps in
improving the technical understanding of the workers.
3.4 Environmental Benefits
If PF is improved it reduces KVA consumption of the plant (due to reduced KVAR
consumption) which is provided by the capacitor banks and hence reduced kVA
generation by the power plant, leading to reduced fuel consumption and hence leading
to overall GHG reduction.

Power Factor Improvement by Installation of Capacitor Bank
13
4 INSTALLATION OF THE PROPOSED TECHNOLOGY
4.1 Cost of Technology Implementation
4.1.1 Technology Cost
Cost of the equipment is about ` 10375 (@ ` 125/kVAR) which includes the cost of the
capacitors only as per the quotation provided by the vendors at Annexure 6.
4.1.2 Other Cost
Other costs required will be ` 2300 Lakh which includes taxes, commissioning,
manpower cost, transportation etc. Details breakups are provided in the Table 4.1 below:
Table 4.1 Details of Proposed Technology Installation Cost
S. No. Particular Cost ( `)
1 Equipment cost 10375
2 All applicable taxes 1300
3 Misc 5000
4 Total Cost 16675
4.2 Arrangements of Funds
4.2.1 Entrepreneur’s Contribution
Entrepreneur will contribute 25% of the total project cost which is ` 0.04 Lakh.
4.2.2 Loan Amount
Remaining 75% cost of the proposed project will be borrowed from bank which is ` 0.13
Lakh.
4.2.3 Terms & Conditions of Loan
The interest rate is considered at 10% which is normal rate of interest for energy
efficiency projects. The loan tenure is 5 years excluding initial moratorium period is 6
months from the date of first disbursement of loan.
4.3 Financial Indicators
4.3.1 Cash Flow Analysis
Profitability and cash flow statements have been worked out for a period of 6 years. The
financials have been worked out on the basis of certain reasonable assumptions, which

Power Factor Improvement by Installation of Capacitor Bank
14
are outlined below.
The Operation and Maintenance cost is estimated at 2 % of cost of total project
with 5 % increase in every year as escalations.
• Interest on term loan is estimated at 10 %.
• Depreciation is provided as per the rates provided in the companies Act.
Based on the above assumptions, profitability and cash flow statements have been
prepared and calculated in Annexure-3.
4.3.2 Simple Payback Period
The total project cost of the proposed technology is ` 0.167 Lakh and monetary savings
due to reduction in electricity consumption is ` 0.39 Lakh hence, the simple payback
period works out to be 6 months.
4.3.3 Net Present Value (NPV)
The Net present value of the investment at 10% works out to be ` 1.07 Lakh.
4.3.4 Internal Rate of Return (IRR)
The after tax Internal Rate of Return of the project works out to be 206.41%. Thus the
project is financially viable.
4.3.5 Return on Investment (ROI)
The average return on investment of the project activity works out at 36.53%.
Table 4.2 Financial Indicators of Proposed Technology
S No Particular Unit Value
1 Simple Payback Months 6
2 NPV ` In Lakh 1.07
3 IRR %age 206.41
4 ROI %age 36.53
4.4 Sensitivity analysis in realistic, pessimistic and optimistic scenarios
A sensitivity analysis has been carried out to ascertain how the project financials would
behave in different situations like when there is an increase in rupees savings or
decrease in rupees savings. For the purpose of sensitive analysis, two following

Power Factor Improvement by Installation of Capacitor Bank
15
scenarios have been considered.
Optimistic scenario (Increase in monetary savings by 5%)
Pessimistic scenario (Decrease in monetary savings by 5%)
In each scenario, other inputs are assumed as a constant. The financial indicators in
each of the above situation are indicated along with standard indicators.
Table 4.3 Sensitivity Analysis in Different Scenarios
4.5 Procurement and Implementation Schedule
Procurement and implementation schedule required for implementation of this
technology is about 7 weeks and 2 to 3 hours required as a process break
down. Further detail breakups of procurement and implementation schedules are
shown in Annexure 4.
Scenario IRR (%) NPV(in Lakh) ROI (%) DSCR
Pessimistic 195.14 1.01 36.47 6.99
Base 206.41 1.07 36.53 7.36
Optimistic 217.70 1.13 36.58 7.73
Power Factor Improvement by Installation of Capacitor Bank
16
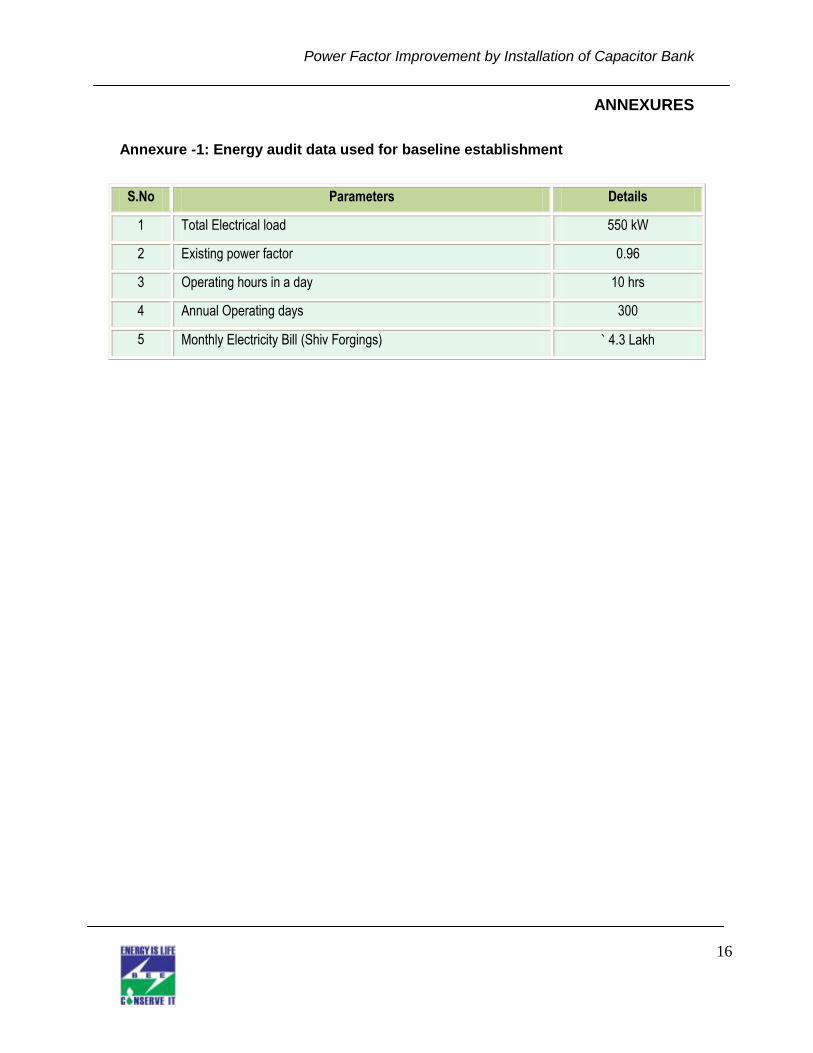
ANNEXURES
Annexure -1: Energy audit data used for baseline establishment
S.No Parameters Details
1 Total Electrical load 550 kW
2 Existing power factor 0.96
3 Operating hours in a day 10 hrs
4 Annual Operating days 300
5 Monthly Electricity Bill (Shiv Forgings) ` 4.3 Lakh

Power Factor Improvement by Installation of Capacitor Bank
17
Annexure -2: Detailed Technology Assessment Report
S. No. Particular Details
1 Existing power factor 0.96
2 Proposed power factor 0.99
3 Total percentage rebate 0.75%
4 Present monthly electricity monthly bill ` 4.3 lakh
5 Average annual electricity bill ` 51.6 lakh
6 Annual saving in electricity bill after project implementation ` 38700
7 Total investment required ` 16675
8 Simple payback period 6 months

Power Factor Improvement by Installation of Capacitor Bank
18
Annexure -3: Detailed Financial Calculations
Assumptions
Name of the Technology Power factor Improvement Rated Capacity 83 kVAR
Details Unit Value Basis
Installed Capacity kVAR 83
No of working days Days 300 Proposed Investment
Equipment cost ` (in lakh) 0.104
Taxes ` (in lakh) 0.013
Other cost ` (in lakh) 0.05
Total Investment ` (in lakh) 0.167 Financing pattern Own Funds (Equity) ` (in lakh) 0.04 Feasibility Study Loan Funds (Term Loan) ` (in lakh) 0.13 Feasibility Study Loan Tenure Years 3.00 Assumed Moratorium Period Months 3.00 Assumed Repayment Period Months 39.00 Assumed Interest Rate %age 10.00%
Estimation of Costs O & M Costs % on Plant & Equip 2.00 Feasibility Study Annual Escalation %age 5.00 Feasibility Study Estimation of Revenue
Rebate in electricity bill ` (in lakh) 0.387 St. line Depn. %age 5.28 Indian Companies Act IT Depreciation %age 80.00 Income Tax Rules Income Tax %age 33.99 Income Tax
Estimation of Interest on Term Loan ` (in lakh)
Years Opening Balance Repayment Closing Balance Interest
1 0.13 0.02 0.10 0.01
2 0.10 0.05 0.05 0.01 3 0.05 0.05 0.01 0.00
4 0.01 0.01 -0.01 0.00
0.13 WDV Depreciation ` (in lakh)
Particulars / years 1 2
Plant and Machinery Cost 0.05 0.01 Depreciation 0.04 0.01 WDV 0.01 0.00

Power Factor Improvement by Installation of Capacitor Bank
19
Projected Profitability ` (in lakh)
Particulars / Years 1 2 3 4 5 6 Fuel savings 0.39 0.39 0.39 0.39 0.39 0.39 Total Revenue (A) 0.39 0.39 0.39 0.39 0.39 0.39 Expenses O & M Expenses 0.001 0.001 0.001 0.001 0.001 0.001 Total Expenses (B) 0.001 0.001 0.001 0.001 0.001 0.001 PBDIT (A)-(B) 0.386 0.386 0.386 0.386 0.386 0.386 Interest 0.014 0.008 0.003 0.000 0.000 0.000 PBDT 0.372 0.378 0.383 0.386 0.386 0.386 Depreciation 0.003 0.003 0.003 0.003 0.003 0.003 PBT 0.369 0.375 0.380 0.383 0.383 0.383 Income tax 0.000 0.126 0.130 0.131 0.131 0.131 Profit after tax (PAT) 0.369 0.250 0.250 0.252 0.252 0.252 Computation of Tax ` (in lakh)
Particulars / Years 1 2 3 4 5 6 Profit before tax 0.37 0.38 0.38 0.38 0.38 0.38 Add: Book depreciation 0.00 0.00 0.00 0.00 0.00 0.00 Less: WDV depreciation 0.04 0.01 - - - - Taxable profit 0.33 0.37 0.38 0.39 0.39 0.39 Income Tax - 0.13 0.13 0.13 0.13 0.13 Projected Balance Sheet ` (in lakh)
Particulars / Years 1 2 3 4 5 6
Share Capital (D) 0.04 0.04 0.04 0.04 0.04 0.04 Reserves & Surplus (E) 0.37 0.62 0.87 1.12 1.37 1.62 Term Loans (F) 0.10 0.05 0.01 -0.01 -0.01 -0.01 Total Liabilities (D)+(E)+(F) 0.51 0.71 0.92 1.16 1.41 1.66
Assets 1 2 3 4 5 6 Gross Fixed Assets 0.05 0.05 0.05 0.05 0.05 0.05 Less Accm. Depreciation 0.00 0.01 0.01 0.01 0.01 0.02 Net Fixed Assets 0.05 0.04 0.04 0.04 0.04 0.03 Cash & Bank Balance 0.46 0.67 0.87 1.12 1.37 1.63 TOTAL ASSETS 0.51 0.71 0.92 1.16 1.41 1.66 Net Worth 0.41 0.66 0.91 1.16 1.41 1.67 Debt Equity Ratio 2.42 1.27 0.12 -0.17 -0.17 -0.17

Power Factor Improvement by Installation of Capacitor Bank
20
Projected Cash Flow ` (in lakh)
Particulars / Years 0 1 2 3 4 5 6 Sources
Share Capital 0.04 - - - - - - Term Loan 0.13 Profit After tax 0.37 0.25 0.25 0.25 0.25 0.25 Depreciation 0.00 0.00 0.00 0.00 0.00 0.00 Total Sources 0.17 0.37 0.25 0.25 0.25 0.25 0.25
Application
Capital Expenditure 0.05 Repayment Of Loan - 0.02 0.05 0.05 0.01 0.00 0.00 Total Application 0.05 0.02 0.05 0.05 0.01 0.00 0.00 Net Surplus 0.12 0.35 0.20 0.20 0.24 0.25 0.25 Add: Opening Balance - 0.12 0.46 0.67 0.87 1.12 1.37 Closing Balance 0.12 0.46 0.67 0.87 1.12 1.37 1.63 IRR ` (in lakh)
Particulars / months 0 1 2 3 4 5 6 Profit after Tax
0.37 0.25 0.25 0.25 0.25 0.25 Depreciation 0.00 0.00 0.00 0.00 0.00 0.00 Interest on Term Loan 0.01 0.01 0.00 0.00 - - Cash outflow (0.17) - - - - - - Net Cash flow (0.17) 0.39 0.26 0.26 0.25 0.25 0.25 IRR 206.41% NPV 1.07 Break Even Point ` (in lakh)
Particulars / Years 1 2 3 4 5 6
Variable Expenses
Oper. & Maintenance Exp (75%) 0.001 0.001 0.001 0.001 0.001 0.001 Sub Total(G) 0.001 0.001 0.001 0.001 0.001 0.001 Fixed Expenses
Oper. & Maintenance Exp (25%) 0.000 0.000 0.000 0.000 0.000 0.000 Interest on Term Loan 0.014 0.008 0.003 0.000 0.000 0.000 Depreciation (H) 0.003 0.003 0.003 0.003 0.003 0.003 Sub Total (I) 0.017 0.011 0.006 0.003 0.003 0.003 Sales (J) 0.387 0.387 0.387 0.387 0.387 0.387 Contribution (K) 0.386 0.386 0.386 0.386 0.386 0.386 Break Even Point (L= G/I) 4.41% 2.80% 1.56% 0.77% 0.76% 0.77% Cash Break Even {(I)-(H)} 3.72% 2.12% 0.88% 0.08% 0.08% 0.08% Break Even Sales (J)*(L) 0.017 0.011 0.006 0.003 0.003 0.003

Power Factor Improvement by Installation of Capacitor Bank
21
Return on Investment ` (in lakh)
Particulars / Years 1 2 3 4 5 6 Total Net Profit Before Taxes 0.37 0.38 0.38 0.38 0.38 0.38 2.27 Net Worth 0.41 0.66 0.91 1.16 1.41 1.67 6.23
36.53% Debt Service Coverage Ratio ` (in lakh)
Particulars / Years 1 2 3 4 5 6 Total
Cash Inflow Profit after Tax 0.37 0.25 0.25 0.25 0.25 0.25 1.12 Depreciation 0.00 0.00 0.00 0.00 0.00 0.00 0.01 Interest on Term Loan 0.01 0.01 0.00 0.00 0.00 0.00 0.03 Total (M) 0.39 0.26 0.26 0.25 0.25 0.25 1.16 DEBT
Interest on Term Loan 0.01 0.01 0.00 0.00 0.00 0.00 0.03 Repayment of Term Loan 0.02 0.05 0.05 0.01 0.00 0.00 0.13 Total (N) 0.04 0.06 0.05 0.01 0.00 0.00 0.16 10.12 4.65 5.00 21.18 0.00 0.00 7.36 Average DSCR (M/N) 7.36

Power Factor Improvement by Installation of Capacitor Bank
22
Annexure:-4 Procurement and implementation schedule
Procurement and Implementation Schedule
S. No.
Activities Weeks
1 2 3 4 5 6 7
1 Identification of faulty or less capacitors
2 Planning and material order
3 Procurement
4 Commissioning

Power Factor Improvement by Installation of Capacitor Bank
23
Annexure -5: Details of technology service providers
Energy Conservation measure
Source of product Details of Local vendor / service
provider
Capacitor Banks ABB Ltd
Mr. Neeraj Verma
Contact No: 09878613484
Capacitor Banks Naac Energy Control (p) Ltd
Mr. Chander M. Kapoor
Contact No:09811199085
Capacitor Banks Havells India
Mr. Chandar Subhash
Mall Mandi, Batala
Contact No: 01871243110
Capacitor Banks Dhamija Trading Co Mr. Manmeet Singh
Bhagwan Chowk, Jalandhar

Power Factor Improvement by Installation of Capacitor Bank
24
Annexure–6: Quotations/Techno-commercial bids for new technology/equipment

Power Factor Improvement by Installation of Capacitor Bank
25

Bureau of Energy Efficiency (BEE) (Ministry of Power, Government of India) 4th Floor, Sewa Bhawan, R. K. Puram, New Delhi – 110066 Ph.: +91 – 11 – 26179699 (5 Lines), Fax: +91 – 11 – 26178352
Websites: www.bee-india.nic.in, www.energymanagertraining.com
India SME Technology Services Ltd
DFC Building, Plot No.37-38, D-Block, Pankha Road, Institutional Area, Janakpuri, New Delhi-110058 Tel: +91-11-28525534, Fax: +91-11-28525535 Website: www.techsmall.com
Confederation of Indian Industry
CII – AVANTHA Centre for Competitiveness Block No.3, Dakshin Marg Sector 31-A, Chandigarh - 160030 Tel: 0172-5080784 (D) / 2666517-19 Fax: 0172-2606259 / 2614974 E-mail: [email protected] Website: www.ciicfc.org
Top Related
Copyright © 2022 FDOKUMEN

